Embed Size (px)
Citation preview
FEBRUARY 2016
Manuel Orozco
Laura Porras
Julia Yansura Inter-American Dialogue
The Continued Growth of
Family Remittances to Latin
America and the Caribbean
in 2015
The Continued Growth of Family Remittances to Latin America and the Caribbean.............. 3
Remittances to Latin America and the Caribbean in 2015 ........................................................ 3
Remittances to Mexico and Central America .............................................................................. 6
Growth in Mexico........................................................................................................................ 6
The Role of the Exchange Rate and Unemployment ........................................................... 8
Migration trends ..................................................................................................................... 9
Central American Remittances ............................................................................................... 11
Other Corridors and Remittance Growth................................................................................ 14
Colombia ................................................................................................................................14
Ecuador...................................................................................................................................16
Haiti......................................................................................................................................... 17
Cuba ........................................................................................................................................18
TABLE OF CONTENTS

© 2016 Inter-American Dialogue 3
The Continued Growth of Family Remittances
to Latin America and the Caribbean
This memo offers an overview of family remittances to Latin America and the Caribbean, which grew
6% in 2015. The growth in remittances is taking place in countries that are experiencing violence,
conflict and/or poor governance, as well as those with increases in international migration.
The memo explores trends with regards to migration, remittances and determining factors of
remittances. It also touches on country-specific trends for Mexico, Guatemala, Colombia, Haiti,
Ecuador, and Cuba. These findings point to conflict and lagging economic development as some of
the primary drivers of international migration. Moreover, in the context of the slowdown in 2016, it is
important to monitor continued migration as well as mechanisms that can bolster economic
performance by leveraging remittances for development.
Remittances to Latin America and the
Caribbean in 2015
Family remittances to Latin America and the Caribbean surpassed $65 billion in 2015, registering 6%
growth over the previous year. Among those countries with the highest levels of year-to-year growth
are Colombia, Guatemala and Haiti. Mexico grew 4.8%, which also drives overall regional growth.
Some other countries registered negative remittance growth, including Panama, Costa Rica, Uruguay
and Guyana. The following table provides more detail on a country by country basis.

© 2016 Inter-American Dialogue 4
Table 1: Remittances to Latin America and the Caribbean, 2015 – US$ Millions
Country Annual Remittances
US$ millions1
Growth % Remittances
as % of GDP2
2013 2014 2015 2013-2014 2014-2015
Guatemala 5,379 5,456 6,285 1.40% 15.20% 9.9
Colombia 4,450 4,093 4,639 -8.00% 13.30% 1.1
Haiti 1,781 1,980 2,198 11.20% 11.00% 22.7
Honduras 3,098 3,353 3,719 8.20% 10.90% 17.4
Paraguay 623 422 458 -32.30% 8.50% 1.6
Dominican Republic 4,485 4,571 4,952 1.90% 8.30% 7.5
Cuba 1,200 1,260 1,323 5.00% 5.00% -
Mexico 23,432 23,646 24,771 0.90% 4.80% 1.9
Nicaragua 1,081 1,136 1,190 5.10% 4.80% 9.7
Peru 2,707 2,639 2,739 -2.50% 3.80% 1.3
El Salvador 3,971 4,154 4,280 4.60% 3.00% 16.8
Bolivia 1,201 1,163 1,195 -3.20% 2.80% 3.6
Jamaica 2,172 2,159 2,217 -0.60% 2.70% 16.3
Argentina** 534 502 502 -6.00% - 0.1
Belize - 156 156 0.00% 4.7
Brazil** 2,537 2,645 2,645 4.30% - 0.1
Suriname** 113 150 150 32.70% - 0.2
Trinidad & Tobago** 129 138 138 7.00% - -
Venezuela** 803 803 803 0.00% - 0.0
Panama 452 652 645 44.20% -1.10% 1.6
Guyana 328 330 317 0.60% -3.90% 10.6
Ecuador 2,459 2,462 2,358 0.10% -4.20% 2.4
Costa Rica 596 558 527 -6.40% -5.60% 1.2
Uruguay 123 113 106 -8.10% -6.20% 0.2
64,541 68,313 5.80%
** No 2015 data available; Included for totaling purposes using 2014 data.
1 Sources: For 2014 and 2015 remittances, sources are Central Bank remittance volumes for El Salvador, Mexico, and Nicaragua. Haiti is
Central Bank data on year over year growth (11%). Suriname and Cuba are authors’ estimates. Brazil is World Bank data. All others are Central Bank Data and Fourth quarter estimates by Authors. For 2013 remittances, the source is World Bank data, included for reference purposes for most countries. 2 Based on World Bank Data; Most recent value (2014 for all countries except Venezuela, which is 2012).

© 2016 Inter-American Dialogue 5
At first glance, these increases are predominantly taking place in countries that display conflict,
violence or poor governance, accompanied by slow economic growth in some cases. In fact, the
2015 remittance growth rate correlates with state fragility.3 What comes across is that growing state
fragility seems to be a factor driving migration and in turn increasing remittances. The next sections
examine the remittance trends in some of these countries in greater detail.
Graphic 1: Remittance Growth and State Fragility
Source: Central Bank data and authors’ estimates for remittance growth; the 2015 Fragile States Index by the Fund for
Peace for state fragility.
Source: Central Bank data and authors’ estimates for remittance growth; the 2015 Fragile States Index by the Fund for
Peace for human flight.
3 As measured by the 2015 Fragile States Index, a project of the Fund for Peace. For more information, see http://fsi.fundforpeace.org/
-10.00%
-5.00%
0.00%
5.00%
10.00%
15.00%
20.00%
0 20 40 60 80 100 120
Index of State Fragility and Growth in Remittances, 2015
Haiti
Colombia
Haiti Honduras
Guatemala
Uruguay
-10.00%
-5.00%
0.00%
5.00%
10.00%
15.00%
20.00%
0 2 4 6 8 10
Gro
wth
in
re
mit
tan
ces
Index of Human Flight
Human Flight and Growth in Remittances, 2015
© 2016 Inter-American Dialogue 6
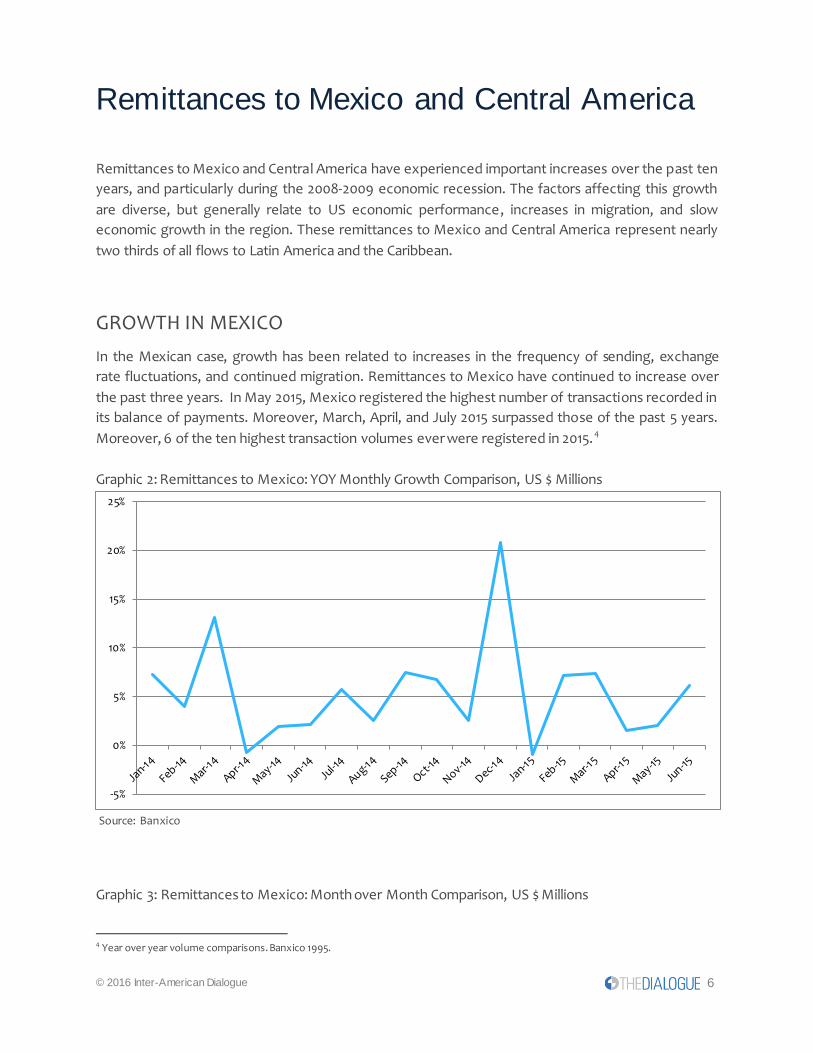
Remittances to Mexico and Central America
Remittances to Mexico and Central America have experienced important increases over the past ten
years, and particularly during the 2008-2009 economic recession. The factors affecting this growth
are diverse, but generally relate to US economic performance, increases in migration, and slow
economic growth in the region. These remittances to Mexico and Central America represent nearly
two thirds of all flows to Latin America and the Caribbean.
GROWTH IN MEXICO
In the Mexican case, growth has been related to increases in the frequency of sending, exchange
rate fluctuations, and continued migration. Remittances to Mexico have continued to increase over
the past three years. In May 2015, Mexico registered the highest number of transactions recorded in
its balance of payments. Moreover, March, April, and July 2015 surpassed those of the past 5 years.
Moreover, 6 of the ten highest transaction volumes ever were registered in 2015.4
Graphic 2: Remittances to Mexico: YOY Monthly Growth Comparison, US $ Millions
Source: Banxico
Graphic 3: Remittances to Mexico: Month over Month Comparison, US $ Millions
4 Year over year volume comparisons. Banxico 1995.
-5%
0%
5%
10%
15%
20%
25%

© 2016 Inter-American Dialogue 7
Source: Banxico
This growth can occur through increases in transactions and/or increases in the average amount
remitted. Our statistical analysis of monthly flows between 2010 and July 2015 shows that the
increase is predominantly explained by changes in the number of transactions, rather than the
average amount remitted.5 The average amount remitted is not statistically significant, whereas the
number of monthly transactions is positively correlated to the volume.
Overall, the average remittance transaction amount (principal sent) does not change over time. The
standard deviation for average amounts sent to Mexico is under US$35 for industry data and even
lower using Banxico’s numbers. Previous research, in fact, has shown that when more money is
available, people tend to send more often, instead of increasing the amounts sent.6
Graphic 4: Average Amounts Sent to Mexico – Industry Data
Source: Industry data.
5 The model used observations of the total remittance volumes, the increase of transactions and industry data regarding the ave rage
amount sent over a period of 66 months, ending July 2015. 6 See Orozco and Jewers, 2014. Some literature points to people being more concerned with amounts that will meet the needs of their
relatives back home, rather than remitting a percentage of their income or “either as much or as little” as they can.
1,300
1,400
1,500
1,600
1,700
1,800
1,900
2,000
2,100
2,200
2,300
2,400
Jan Feb Mar Apr May Jun Jul Aug Sep Oct Nov Dec
2011
2012
2013
2014
2015
$0.00
$100.00
$200.00
$300.00
$400.00
$500.00
Jan,2014
Feb,2015
Mar,2014
Apr,2014
May,2014
Jun,2014
Jul,2014
Aug,2014
Sep,2014
Oct,2014
Nov,2014
Dec,2014
Jan,2015
Feb,2015
Mar,2015
Apr,2015
May,2015
Jun,2015
Jul,2015

© 2016 Inter-American Dialogue 8
THE ROLE OF THE EXCH ANGE RATE AND UNEMPLOYMENT
These increases in transactions can also be explained by factors such as depreciation of a local
currency or more migrants sending money (due to increased migration or an increased percentage
of migrants sending more money). In order to measure if more migrants are sending money, the
unemployment rates of Hispanic and Latino populations might serve as a proxy. This proxy would
account for more migrants working in the US and more of them sending money (both because they
arrived to do so7 or were already here and started sending.)
The unemployment rate among Latinos in the U.S. and the Mexican peso exchange rate were used
to analyze changes in remittances. In the first case, a decline in the unemployment rate among
Latinos (of which Mexicans are a majority) would signal an increase in remittances. Moreover, a
depreciation of the peso would invite more transactions.
Using a regression model, which checks the impact of the exchange rate and the unemployment rate
upon transfers, we are able to shed more light on the relationship. The statistical results show that
both the exchange rate and unemployment are statistically significant and negatively correlated to
the total number of transfers. Specifically, a depreciation of 1% of the peso entails a transfer increase
of 0.39%, and a decline in unemployment is only slightly, but positively, correlated to an increase in
transfers.
Graphic 5: Correlation between Total Number of Transactions and Changes in the Exchange Rate -
Mexico
Source: Banxico, 1995 to mid-2015
7 Previous research by the Inter-American Dialogue’s Remittance Industry Observatory has found that the number of migrants from
Mexico and Central America to the United States is most likely still growing. The impact this has on remittance volumes is not as easily
measured due to lack of reliable data, thus this approach.
-.04
-.02
0
.02
.04
.06
Fxgro
wth
4000 5000 6000 7000 8000Transactions
© 2016 Inter-American Dialogue 9
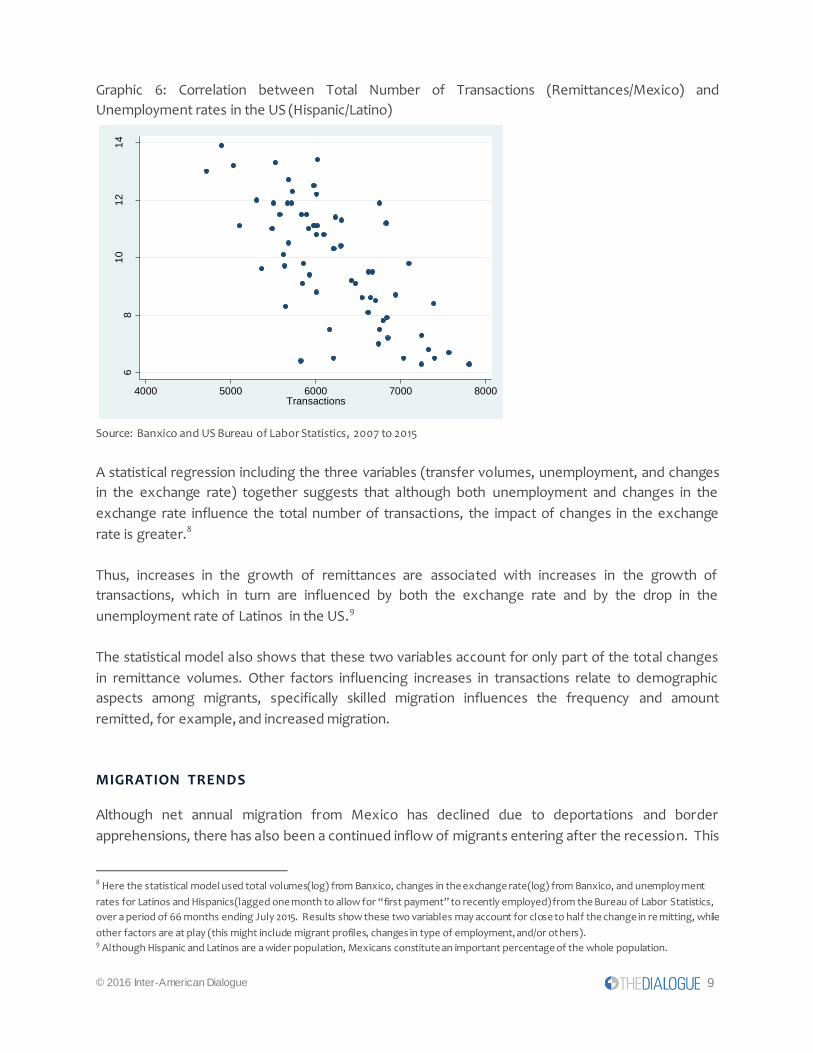
Graphic 6: Correlation between Total Number of Transactions (Remittances/Mexico) and
Unemployment rates in the US (Hispanic/Latino)
Source: Banxico and US Bureau of Labor Statistics, 2007 to 2015
A statistical regression including the three variables (transfer volumes, unemployment, and changes
in the exchange rate) together suggests that although both unemployment and changes in the
exchange rate influence the total number of transactions, the impact of changes in the exchange
rate is greater.8
Thus, increases in the growth of remittances are associated with increases in the growth of
transactions, which in turn are influenced by both the exchange rate and by the drop in the
unemployment rate of Latinos in the US.9
The statistical model also shows that these two variables account for only part of the total changes
in remittance volumes. Other factors influencing increases in transactions relate to demographic
aspects among migrants, specifically skilled migration influences the frequency and amount
remitted, for example, and increased migration.
MIGRATION TRENDS
Although net annual migration from Mexico has declined due to deportations and border
apprehensions, there has also been a continued inflow of migrants entering after the recession. This
8 Here the statistical model used total volumes(log) from Banxico, changes in the exchange rate(log) from Banxico, and unemployment
rates for Latinos and Hispanics(lagged one month to allow for “first payment” to recently employed) from the Bureau of Labor Statistics,
over a period of 66 months ending July 2015. Results show these two variables may account for close to half the change in re mitting, while
other factors are at play (this might include migrant profiles, changes in type of employment, and/or others). 9 Although Hispanic and Latinos are a wider population, Mexicans constitute an important percentage of the whole population.
68
10
12
14
Hla
tino
Un
em
pR
ate
lag
4000 5000 6000 7000 8000Transactions

© 2016 Inter-American Dialogue 10
increase is associated with small and controlled temporary work visas mostly in agriculture (H2
visas), as well as with undocumented migration (see also our 2014 report). New remitters in 2013 may
have amounted to 120,000, considering estimates of between 117,000 and 106,000 in 2012. This
increase is mostly linked to temporary work, fewer undocumented border crossers and fewer visa
overstayers. However, transaction growth in 2014 and 2015 grew sharply to an average of more than
400,000 net transactions. These increases point to greater migration, some of which may be related
to more Mexican immigrants sending than before (above the 60% reported in previous research),
and more Mexican immigrants entering the country but not accounted for by official statistics.
Table 2: Migration from Mexico to US, 2012
Source of entry of Mexican immigrants 2012 2013(*)
H2 visas 237,790 244,790
Visa over-stayers (7% of all tourist and BCC visas) 75,250 77,507
Cross border entry 425,208 437,964
Apprehensions (265,755) (273,728)
Deportations (366,292) (377,281)
Estimated total Mexican annual migration (*) 106,200 109,386
Number of new P2P transactions (*) 117,000 120,000
Sources: US Department of State, US Immigration and Custom’s Enforcement Agency, Border Patrol and (*) estimates by
the author.
Moreover, a look at remittances by Mexican state shows that the increase in transactions was
correlated with security-related factors. Two indicators, the index of peace and homicides, were
positively correlated with increases in the number of remittance transactions. As violence increases,
so do remittances.
Graphic 7: Index of Peace in Mexico and Increases in Remittance Transactions by State, 2015
Source: Mexico Peace Index by the Institute for Economics and Peace, 2015.
-10000
0
10000
20000
30000
40000
50000
60000
1.0000 1.5000 2.0000 2.5000 3.0000 3.5000 4.0000
Tra
nsa
ctio
ns
incr
eas
e
2015
Peacefulness Index (Lowest, Peaceful)

© 2016 Inter-American Dialogue 11
CENTRAL AMERICAN REMITTANCES
Central American countries are among those that have the highest continual remittance flows in
Latin America and the Caribbean, and Guatemala was the country with the largest remittance growth
from 2014 to 2015 at 15%. In fact, their share from the entire Latin American region increased from 17
to 25% in 15 years. Most growth is related to Central American flows, specifically Guatemala, El
Salvador, Honduras and Nicaragua.
Graphic 8: Remittances to Central America as % of Total Remittances to Latin America and the
Caribbean
Source: Authors’ Estimates using Central Bank Data.
These flows reflect sustained growth since the decade of the 2000s. Aside from statistical
improvements in measuring flows, these countries have experienced annual growth over 7% and only
in one year (2009) they were negative. In total, these flows amount to nearly US$17 billion annually.
5.0%
10.0%
15.0%
20.0%
25.0%
30.0%
2001 2002 2003 2004 2005 2006 2007 2008 2009 2010 2011 2012 2013 2014 2015
© 2016 Inter-American Dialogue 12
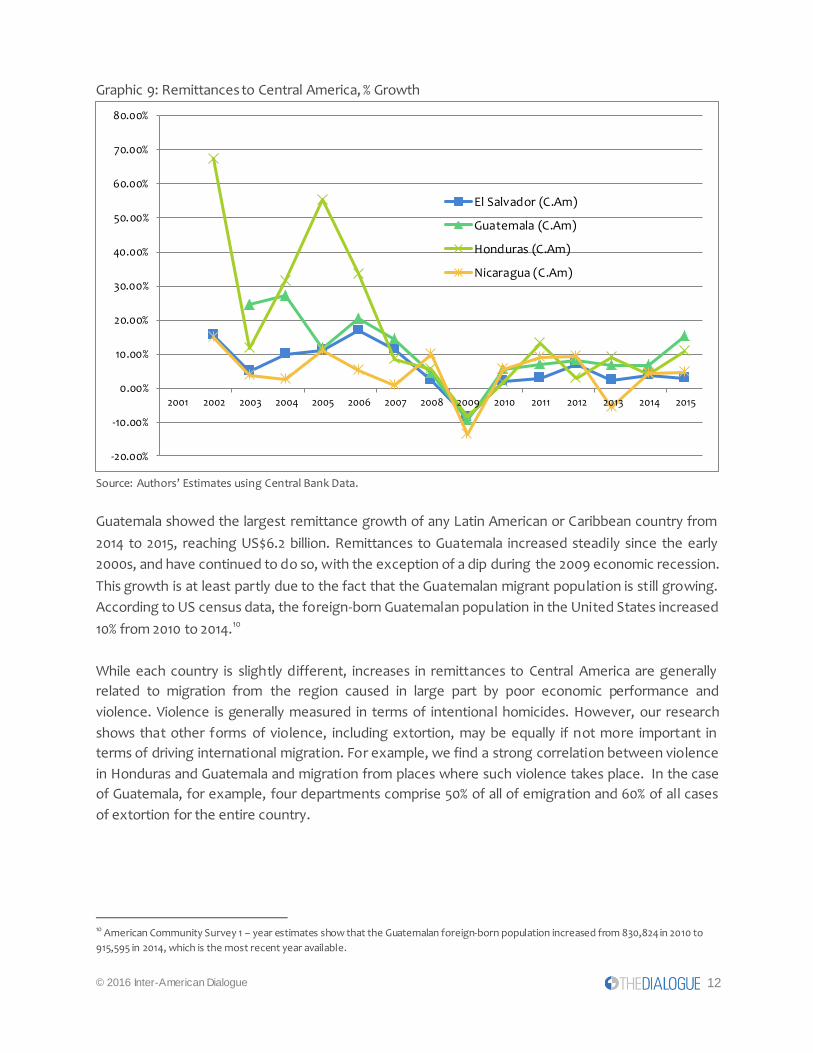
Graphic 9: Remittances to Central America, % Growth
Source: Authors’ Estimates using Central Bank Data.
Guatemala showed the largest remittance growth of any Latin American or Caribbean country from
2014 to 2015, reaching US$6.2 billion. Remittances to Guatemala increased steadily since the early
2000s, and have continued to do so, with the exception of a dip during the 2009 economic recession.
This growth is at least partly due to the fact that the Guatemalan migrant population is still growing.
According to US census data, the foreign-born Guatemalan population in the United States increased
10% from 2010 to 2014.10
While each country is slightly different, increases in remittances to Central America are generally
related to migration from the region caused in large part by poor economic performance and
violence. Violence is generally measured in terms of intentional homicides. However, our research
shows that other forms of violence, including extortion, may be equally if not more important in
terms of driving international migration. For example, we find a strong correlation between violence
in Honduras and Guatemala and migration from places where such violence takes place. In the case
of Guatemala, for example, four departments comprise 50% of all of emigration and 60% of all cases
of extortion for the entire country.
10 American Community Survey 1 – year estimates show that the Guatemalan foreign-born population increased from 830,824 in 2010 to
915,595 in 2014, which is the most recent year available.
-20.00%
-10.00%
0.00%
10.00%
20.00%
30.00%
40.00%
50.00%
60.00%
70.00%
80.00%
2001 2002 2003 2004 2005 2006 2007 2008 2009 2010 2011 2012 2013 2014 2015
El Salvador (C.Am)
Guatemala (C.Am)
Honduras (C.Am)
Nicaragua (C.Am)

© 2016 Inter-American Dialogue 13
Graphic 10:
Source: Orozco and Yansura, 2014 and Memoria de Labores 2014 – Ministerio Público de Guatemala.
These trends help explain why the number of Central Americans migrating out of the region steadily
increased from one hundred thousand to one hundred and thirty thousand in five years. Of those, at
least one third started sending money the same year they arrived in the United States.
Table 3: Central American Migrants Entering US via Border Crossing
Country of Origin 2010 2011 2012 2013 2014
Honduras 27,733 31,385 32,350 35,311 38,480
Nicaragua 4,662 5,082 4,895 5,253 5,502
Guatemala 36,772 39,377 42,614 38,759 42,264
El Salvador 34,619 35,694 38,247 42,435 44,676
Sub-region 103,786 111,539 118,106 121,758 130,922
Source: Authors’ estimates.
0.00%
5.00%
10.00%
15.00%
20.00%
25.00%
30.00%
35.00%
40.00%
0.00% 5.00% 10.00% 15.00% 20.00% 25.00% 30.00% 35.00% 40.00% 45.00% 50.00%
Mig
ran
ts a
s sh
are
fro
m a
ll d
epar
tmen
ts
Department share of extortion
Guatemala: Origin of Migration and Extortion 2015
Guatemala
city

© 2016 Inter-American Dialogue 14
OTHER CORRIDORS AND REMITTANCE GROWTH
COLOMBIA
Unusually large remittance growth in 2015 put Colombia in second place for the fastest-growing
remittance recipient in the region. At least two factors are driving this trend: a larger migrant
population in the US and the impact of exchange rates.
In the first nine months of 2015, remittances from Spain to Colombia remained almost unchanged
(1.3% growth over the previous year) while remittances from the US to Colombia increased
substantially (26.7% growth).
Graphic 11: Remittances to Colombia by Corridor, 2014-2015 Comparison (US$ millions)
Source: Central Bank of Colombia. Data accessed February, 2016.
Other remittance corridors, although smaller, also reflect changes. Remittances from Venezuela to
Colombia have all but disappeared, amounting to just US$2.2 million (from US$492 million in 2013).
Other neighboring countries saw increases, including Panama (35.3%), Chile (14.3), and Ecuador
(71.6%). Remittances from Costa Rica to Colombia, on the other hand, dropped 44.6%. 11
Remittances from the United States to Colombia are clearly driving the overall growth trend. In the
United States, this growth appears to be connected to growth in the foreign-born Colombian
population as well as improvements in employment and income. Specifically, the foreign-born
Colombian population in the United States grew 4.4% from 2013 to 2014, according to US Census
data.
11 Also a year-to-year comparison for Jan-Sep 2014 to 2015.
0
200
400
600
800
1000
1200
1400
1600
1800
Spain US
Jan-Sept 2014
Jan-Sept 2015
© 2016 Inter-American Dialogue 15
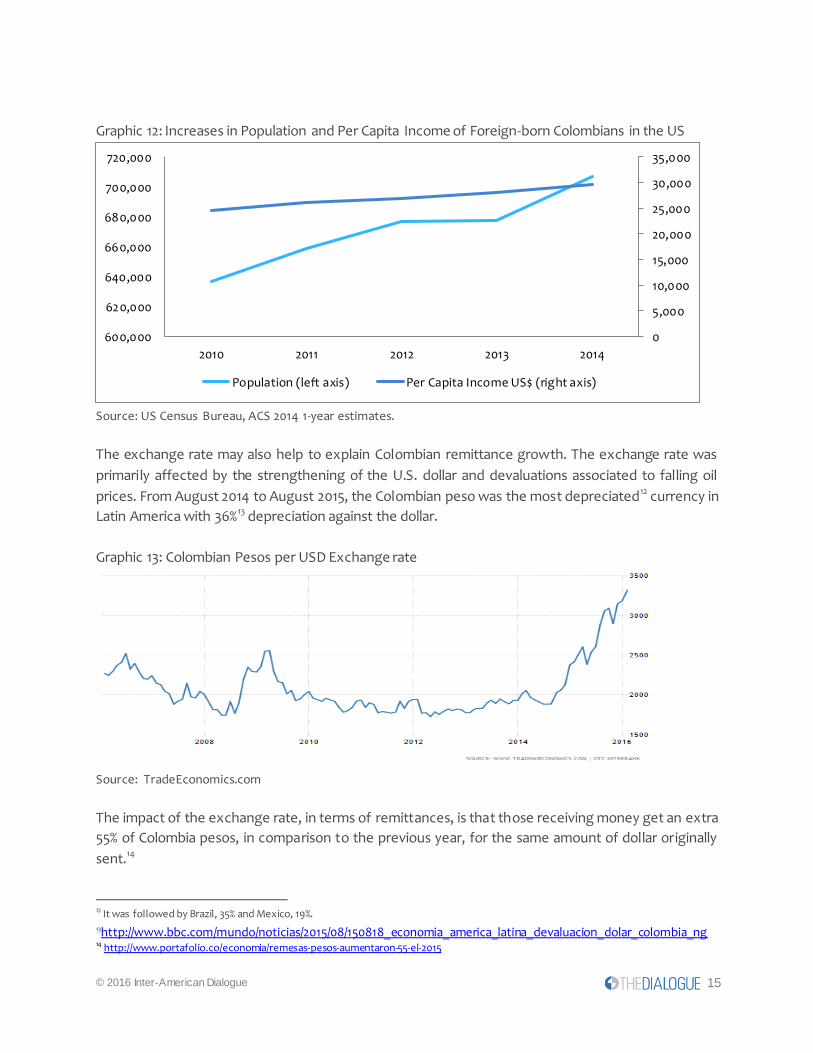
Graphic 12: Increases in Population and Per Capita Income of Foreign-born Colombians in the US
Source: US Census Bureau, ACS 2014 1-year estimates.
The exchange rate may also help to explain Colombian remittance growth. The exchange rate was
primarily affected by the strengthening of the U.S. dollar and devaluations associated to falling oil
prices. From August 2014 to August 2015, the Colombian peso was the most depreciated12 currency in
Latin America with 36%13 depreciation against the dollar.
Graphic 13: Colombian Pesos per USD Exchange rate
Source: TradeEconomics.com
The impact of the exchange rate, in terms of remittances, is that those receiving money get an extra
55% of Colombia pesos, in comparison to the previous year, for the same amount of dollar originally
sent.14
12 It was followed by Brazil, 35% and Mexico, 19%.
13http://www.bbc.com/mundo/noticias/2015/08/150818_economia_america_latina_devaluacion_dolar_colombia_ng 14 http://www.portafolio.co/economia/remesas-pesos-aumentaron-55-el-2015
0
5,000
10,000
15,000
20,000
25,000
30,000
35,000
600,000
620,000
640,000
660,000
680,000
700,000
720,000
2010 2011 2012 2013 2014
Population (left axis) Per Capita Income US$ (right axis)

© 2016 Inter-American Dialogue 16
ECUADOR
Ecuador experienced negative remittance growth, the product of a decline in remittances from
Spain, which is only partially balanced out by growth in remittances from the US.
Graphic 14: Total Remittances to Ecuador by Country of Origination
Source: Central Bank of Ecuador
While remittances from Spain were 40% of total remittances received by Ecuador in 2007, they
decreased to around 30% in 2014. For the first nine months of 2015, remittances from Spain to
Ecuador amounted to only 25% of total incoming remittances. Foreign born Ecuadorians in both
Spain and the US have decreased in the past years, and especially so in Spain.
Table 4: Foreign born Ecuadorians in the US and Spain
Foreign Born Ecuadorians in the
US
Foreign Born Ecuadorians in
Spain
2012 420,910 462,437
2013 427,906 440,549
2014 423,576 422,238
2015 - 411,997
2012 to 2014 Change -2,666 -40,199
Source: US Census Bureau, ACS 1-Year estimates, 2014 for US populations. INE Household Survey, 2015 provisional data for Spanish populations.
0.00
100.00
200.00
300.00
400.00
500.00
600.00
700.00
800.00
0%
10%
20%
30%
40%
50%
60%
70%
80%
90%
100%
United States (% of total) Spain (% of total) Italy (% of total)
Rest of the World (% of total) Total (US$ Millions) United States (US$ Millions)
Spain (US$ Millions)
© 2016 Inter-American Dialogue 17
HAITI
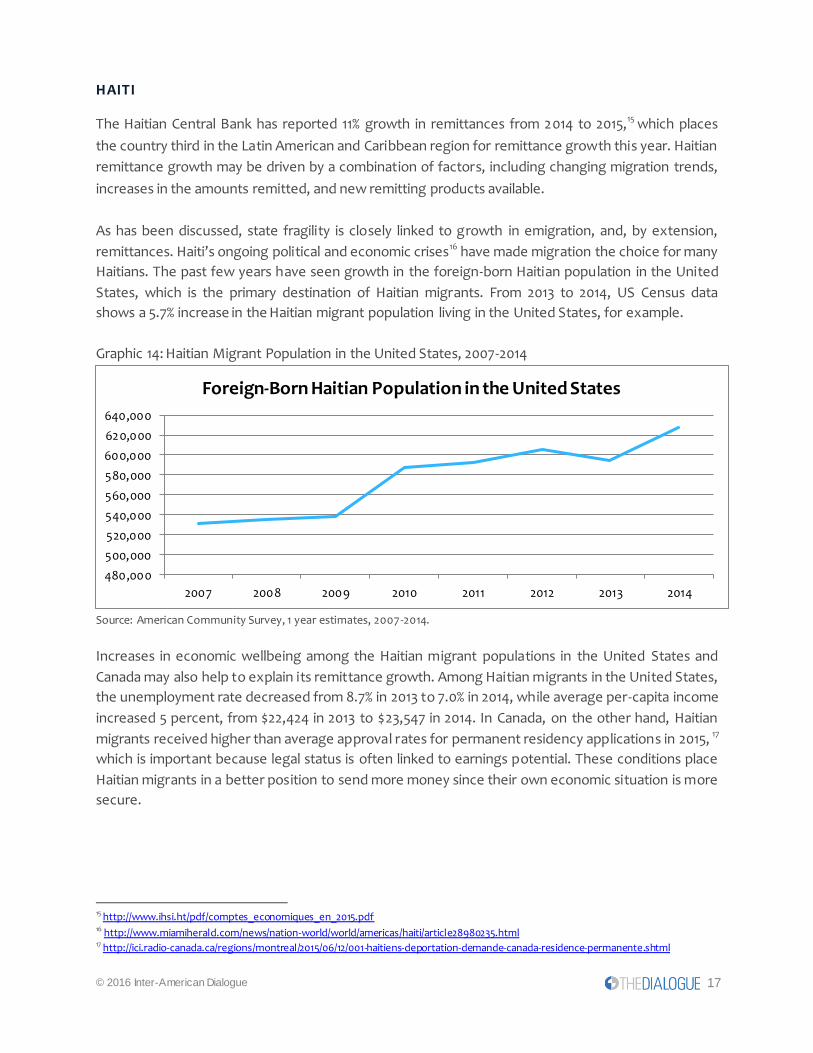
The Haitian Central Bank has reported 11% growth in remittances from 2014 to 2015,15 which places
the country third in the Latin American and Caribbean region for remittance growth this year. Haitian
remittance growth may be driven by a combination of factors, including changing migration trends,
increases in the amounts remitted, and new remitting products available.
As has been discussed, state fragility is closely linked to growth in emigration, and, by extension,
remittances. Haiti’s ongoing political and economic crises16 have made migration the choice for many
Haitians. The past few years have seen growth in the foreign-born Haitian population in the United
States, which is the primary destination of Haitian migrants. From 2013 to 2014, US Census data
shows a 5.7% increase in the Haitian migrant population living in the United States, for example.
Graphic 14: Haitian Migrant Population in the United States, 2007-2014
Source: American Community Survey, 1 year estimates, 2007-2014.
Increases in economic wellbeing among the Haitian migrant populations in the United States and
Canada may also help to explain its remittance growth. Among Haitian migrants in the United States,
the unemployment rate decreased from 8.7% in 2013 to 7.0% in 2014, while average per-capita income
increased 5 percent, from $22,424 in 2013 to $23,547 in 2014. In Canada, on the other hand, Haitian
migrants received higher than average approval rates for permanent residency applications in 2015, 17
which is important because legal status is often linked to earnings potential. These conditions place
Haitian migrants in a better position to send more money since their own economic situation is more
secure.
15 http://www.ihsi.ht/pdf/comptes_economiques_en_2015.pdf 16 http://www.miamiherald.com/news/nation-world/world/americas/haiti/article28980235.html 17 http://ici.radio-canada.ca/regions/montreal/2015/06/12/001-haitiens-deportation-demande-canada-residence-permanente.shtml
480,000
500,000
520,000
540,000
560,000
580,000
600,000
620,000
640,000
2007 2008 2009 2010 2011 2012 2013 2014
Foreign-Born Haitian Population in the United States

© 2016 Inter-American Dialogue 18
Indeed, surveys suggest that the average Haitian remitter may be sending slightly more. A 2013 study
found that, on average, Haitians remit $97/month18 whereas a 2014 study showed a slight increase,
with 57% of women and 72% of men remitting more than $100 a month for an overall average of
US$120.19
Finally, innovations in mobile money,20 energy services21 and bill payment22 to Haiti may also play a
role by expanding the products available to senders and recipients.
CUBA
Cuban migration abroad, and to the United States specifically, has increasingly followed a trend of
traveling by land from Havana to Quito, Ecuador then Mexico via Central America.
What has changed in recent years is migration from Cuba to the United States using third countries.
This movement is not new, but reflects the fact that Cubans are using the same migratory networks
as other nationalities to reach their destination. This is a journey that costs at very minimum
US$7,000 and in some cases more than US$12,000.
Table 5: Cuban Emigration, 2010-2015
Emigration by Destination Emigration by Method
Year Total
Emigration
Emigration to the
United States
Emigration Via
Mexico
Emigration via residency
visa from Havana
2010 58,439 53,890 - 3,236
2011 59,128 46,036 5,316 2,934
2012 62,235 41,535 10,315 4,584
2013 57,464 41,487 11,932 4,827
2014 - 45,000 (est) 17,459 5,992
2015 - 60,000 (est) 45,000+ 6,000 (est)
Source: Demographic Yearbook of Cuba, 2014; US Department of Homeland Security;
http://www.elnuevoherald.com/noticias/mundo/america-latina/cuba-es/article42109152.html#storylink=cpy; US Department of State, Visa Statistics, 2015.
The magnitude is quite significant. To put things into perspective, Cubans leaving their country may
amount to 60,000 this year alone, one of the highest of outflows in recent history. With 45,000
18 The survey showed that the average remittance size was $106 and that the average frequency of sending was 11 times per year. For more
detail, See Orozco with Jewers, “Economic Status and Remittance Behaviors among Latin American and Caribbean Migrants in the Post-
Recession Period,” Multilateral Investment Fund, 2014. Available at: http://www.thedialogue.org/wp-
content/uploads/2015/04/EconomicStatusRemittanceBehaviorFINAL_Eng.pdf 19 For more detail, see “Haitian Diaspora Engagement and Investment in Haiti: New Findings and Recommendations,” Haitian Hometown
Associations Resource Group, 2015. 20 https://www.telegeography.com/products/commsupdate/articles/2015/08/18/digicel-haiti-revamps-mobile-money-as-mon-cash/ 21 http://ir.westernunion.com/News/Press-Releases/Press-Release-Details/2015/Western-Union-and-Sogexpress-Innovate-Remittances-to-
Fund-Renewable-Energy-in-Haiti/default.aspx 22 http://www.metropolehaiti.com/metropole/full_poli_fr.php?id=26731

© 2016 Inter-American Dialogue 19
entering through Mexico, and over 10,000 apprehended at sea plus those entering legally, the
outflow is quite large for a population of 10 million people: 0.5% of Cubans left the country in 2015.
Many Cubans are clear about the reasons they are leaving: the worsening economic situation in Cuba
and the loss of legal access to the US once diplomatic relations are fully established.
Within that context, and given the urgency to help their relatives back home, sending money is a
priority as soon as they are employed. All else equal, and only considering the new entry of Cuban
migrants in 2014 and 2015, remittances from the U.S. may have increased by more than US$50 million
in 2015.
Table 6: US-Cuba Remittances: Current Context and Estimated 2015 Growth
2014 2015
Scenario 1
2015
Scenario 2
2015
Estimate
Cuban remitters 594,000 650,000 702,000 702,000
Migrant adults remitting (%) 55% 55% 65% -
Annual average $1,250 $1,300 $2,400 [66% send
US$2400;
33% US$1250]
Annual volume from the U.S. $750,000,000 $845,000,000 $1,747,200,000 $ 1,401,543,000
Source: Orozco, Manuel. Based on surveys carried out in 2005, 2010 and 2013.