Embed Size (px)
Citation preview

NBER WORKING PAPER SERIES
FAMILY RUPTURES, STRESS, AND THE MENTAL HEALTH OF THE NEXT GENERATION
Petra PerssonMaya Rossin-Slater
Working Paper 22229http://www.nber.org/papers/w22229
NATIONAL BUREAU OF ECONOMIC RESEARCH1050 Massachusetts Avenue
Cambridge, MA 02138May 2016
This paper was previously circulated under the title “Family Ruptures and Intergenerational Transmission of Stress”. This project has been evaluated for ethical compliance by the Swedish Central Ethical Review Board (Approval # 2011:1297/31). We are grateful to Malin Olsson-Talläs for excellent research assistance. We thank Anna Aizer, Doug Almond, Marcella Alsan, Prashant Bharadwaj, Lorenzo Casaburi, Pierre-André Chiappori, Rebecca Diamond, Pascaline Dupas, Mikael Elinder, Oscar Erixon, Sebastian Escobar, Johannes Haushofer, Caroline Hoxby, Shelly Lundberg, Melissa Kearney, Peter Kuhn, Ilyana Kuziemko, Magne Mogstad, Henry Ohlsson, Torsten Persson, Heather Royer, Kjell Salvanes, Heidi Williams, four anonymous referees, and participants at the Berkeley Haas Oliver Williamson seminar, the NBER Children’s Group Spring Meeting, the NBER Summer Institute Health Economics Meeting, the Institute for International Economic Studies, the Bergen-Stavanger Workshop in Labor Economics, the Economic Demography Workshop at the PAA Meetings, the Stanford Institute for Economic Policy Research Bi- Weekly Discussion Group, the UCSB Broom Center for Demography, and Uppsala University for helpful comments. Data acquisition was financed by Grant # 2011-FOA11H-146 from The Royal Swedish Academy of Sciences. Persson gratefully acknowledges funding from the Jan Wallander and Tom Hedelius Foundation. All remaining errors are our own. The authors declare that they have no relevant or material financial interests that relate to the research described in this paper. The views expressed herein are those of the authors and do not necessarily reflect the views of the National Bureau of Economic Research.
NBER working papers are circulated for discussion and comment purposes. They have not been peer-reviewed or been subject to the review by the NBER Board of Directors that accompanies official NBER publications.
© 2016 by Petra Persson and Maya Rossin-Slater. All rights reserved. Short sections of text, not to exceed two paragraphs, may be quoted without explicit permission provided that full credit, including © notice, is given to the source.

Family Ruptures, Stress, and the Mental Health of the Next Generation Petra Persson and Maya Rossin-SlaterNBER Working Paper No. 22229May 2016, Revised June 2016JEL No. I10,I31,J13
ABSTRACT
This paper studies how in utero exposure to maternal stress from family ruptures affects later mental health. We find that prenatal exposure to the death of a maternal relative increases take-up of ADHD medications during childhood and anti-anxiety and depression medications in adulthood. Further, family ruptures during pregnancy depress birth outcomes and raise the risk of perinatal complications necessitating hospitalization. Our results suggest large welfare gains from preventing fetal stress from family ruptures and possibly from economically induced stressors such as unemployment. They further suggest that greater stress exposure among the poor may partially explain the intergenerational persistence of poverty.
Petra PerssonDepartment of EconomicsStanford University579 Serra MallStanford, CA 94305and [email protected]
Maya Rossin-SlaterDepartment of EconomicsUniversity of California, Santa Barbara2127 North HallSanta Barbara, CA 93106and [email protected]
1 Introduction
Mental illness generates vast private and social costs. In 2008, the market for prescription drugstreating depression totaled $9.6 billion in the United States, a sales volume exceeded only bycholesterol regulators and pain medications (Dickstein, 2014). In 2013, one in seven school-ageboys were treated with prescription drugs for Attention Deficit Hyperactivity Disorder (ADHD),fueling a $9 billion market, which is more than five times larger than the $1.7 billion market justa decade earlier (Visser, 2014). Estimates also suggest that mental illness accounts for over halfof the rise in disability receipt among men in the last two decades (Duggan and Imberman, 2009).Moreover, in Sweden (the setting for this paper), mental illness accounts for a larger share of healthexpenditures on prescription drugs than any other therapeutic class.1
The high and rapidly increasing incidence of mental conditions such as depression, anxiety,ADHD, and autism-spectrum disorders has prompted fervent debates regarding their causes andcorrelates both in popular media and across scientific disciplines. While this question is undeniablycomplex—a variety of factors are likely important—the understanding of specific causes is neces-sary for prevention and cost-effective policy design. Existing research has documented correlationsbetween different mental conditions and a range of socioeconomic, hereditary, and environmentalfactors. Yet, as discussed further in Section 2, the evidence on causal drivers is limited and mis-perceptions abound. For example, a widely popularized (yet repeatedly refuted) claim that theMeasles, Mumps, and Rubella (MMR) vaccine causes autism-spectrum disorders has contributedto a substantial decline in vaccination rates, causing measles to re-emerge in Europe and the U.S.after having been effectively eliminated (see, e.g., McIntyre and Leask, 2008).
In this paper, we focus on one possible causal factor at a critical stage of human development:in utero exposure to maternal stress. Specifically, we use Swedish administrative data to analyzehow a mother’s stress resulting from a death in the family during pregnancy affects her unbornchild’s well-being from birth to adulthood, with a particular emphasis on the child’s mental health.
Our focus on the fetal stage is consonant with two recent studies in economics that trace adultmental illness to malnutrition during the fetal stage, using data from Uganda and Iraq (Almondand Mazumder, 2011), as well as Ghana (Adhvaryu et al., 2014).2 Our study offers complementaryevidence linking early-life circumstance to adult mental health, but breaks new ground by focusingon stress—which may be more pertinent than malnutrition in modern developed countries such asthe U.S. and Sweden—and by tracing health outcomes throughout the time period between thefetal shock and adulthood.
1See Table 11 in Socialstyrelsen (2013) for Sweden’s health expenditures by therapeutic class.2Consistent with this evidence, epidemiological studies have documented a correlation between in utero exposure
to the Dutch famine of 1944 and the onset of mental disease in adulthood (Susser and Lin, 1992; Susser et al., 1996;Neugebauer et al., 1999; McClellan et al., 2006). Further, recent neuroscientific evidence shows that mental illnessis related to brain abnormalities that likely arise before birth, which further emphasizes the importance of the fetalenvironment. See, for example, Liu et al. (2012) for depression and Berquin et al. (1998) and Stoner et al. (2014) forADHD and other autism-spectrum diseases.
1
Our emphasis on stress is influenced by a growing literature documenting persistent intergener-ational transmission of socioeconomic status (see, e.g., Solon, 2001; Chetty et al., Forthcoming forevidence from the U.S. and Boserup et al., 2013 for evidence from Scandinavia). As low socioeco-nomic status women experience higher levels of stress than their more advantaged counterparts,3
a causal link between fetal stress exposure and mental disease later in life could shed light on onechannel through which disadvantage is transmitted across generations.
Our focus on stress is also motivated by prior evidence of a correlation between mothers’ preg-nancy levels of the stress hormone cortisol and their children’s mental health.4 Yet, to the bestof our knowledge, no existing study establishes credible evidence of a causal link between antena-tal exposure to maternal stress—from family bereavement or from other stressors—and later lifemental health.
To investigate whether the uterine environment propagates the impact of stress to the unbornchild, we leverage administrative data from Sweden. As we detail in Section 3, we start from theuniverse of children born in Sweden between 1973 and 2011, and use multigenerational populationregisters to construct family trees that span four generations, from the child to his/her maternalgreat-grandparents. Our sample includes all children whose mother loses a family member—a sib-ling, a parent, a maternal grandparent, the child’s father, or an own (older) child—in the ninemonths after the child’s date of conception or in the year after the child’s date of birth. By con-sidering the deaths of different relatives, our approach presents a new measure of the intensity ofstress exposure—the strength of the family tie that is severed.5 We then merge these data withinformation about the children’s health throughout childhood and into adulthood stemming frombirth and inpatient records. We also merge our data to novel, unique data from Sweden’s prescrip-tion drug registry, which contain the universe of prescription drug purchases with information onthe exact substance and dose prescribed.
For identification, we take advantage of quasi-random variation in the exact timing of be-reavement relative to the child’s expected date of delivery at full-term, as described in Section 4.Intuitively, we exploit the fact that some mothers experience the death of a relative during preg-nancy, while others experience such a death shortly after giving birth. While all these childrenare exposed to the post-natal consequences of the relative’s passing (e.g., the associated incomeshocks), only the former group is exposed to the mother’s experience of the death through theuterine environment. By comparing the outcomes of these two groups, we isolate any additionaleffects of fetal exposure to maternal stress from family bereavement, relative to the consequences of
3See the recent discussion in Thompson, 2014 for evidence on self-reported stress levels. Additionally, estimatedlevels of the stress hormone cortisol have been shown to be negatively correlated with socioeconomic status (Kunz-Ebrecht et al., 2004; Cohen et al., 2006).
4A multitude of epidemiological papers have documented a correlation between antenatal stress and ADHD; seeOnline Appendix F for details.
5This measure is motivated by a psychological literature, which documents that losses of closer family membersinduce greater levels of self-reported grief and produce stronger cortisol responses (see, e.g.: Segal and Bouchard,1993; O’Connor et al., 2012).
2
such exposure shortly after birth. Our analysis relies on the assumption that the precise timing ofdeath within a narrow time frame of the estimated expected birth date, which is pre-determined atconception, is uncorrelated with other determinants of child well-being, and we provide evidencethat there is no significant association between the timing of death and a variety of observablefamily characteristics.
This paper makes two primary contributions. First, to the best of our knowledge, our study isthe first to document a causal link between fetal stress exposure and mental health in later life.6 Aspresented in Section 5, we find that in utero exposure to the death of a mother’s close relative hassubstantial effects on the consumption of prescription drugs treating mental health conditions bothduring childhood (around age 10) and in adulthood (around age 35). For children, these effectsare driven by a 25 percent rise in the likelihood of purchasing a drug used to treat ADHD anda 24 percent increase in the average daily dose of ADHD medications. For adults, we see 13 and8 percent increases in the likelihood of consuming prescription drugs for anxiety and depression,respectively, as well as 19 and 12 percent increases in the average daily doses of these medications.The estimated effects are stronger when the deceased is a close relative of the mother, suggestingthat the severity of stress exposure is important for its mental health consequences.
Second, by following the same children from birth to adulthood, we can trace the onset of adverseeffects of exposure to maternal bereavement in utero. We document that important physical healthconsequences are already evident at birth and in early childhood. In particular, we see 12, 24, and12 percent increases in the likelihoods of low-birth-weight (less than 2,500 grams), very-low-birth-weight (less than 1,500 grams), and pre-term (less than 37 weeks gestation) births, respectively.Further, after birth, we find that in utero exposure to stress due to the death of a relative increasesa child’s likelihood of being hospitalized for a condition originating in the perinatal period duringthe first year of life.
Our analysis is most closely related to recent work by Black, Devereux and Salvanes (2016) inNorway, who study the impacts of deaths of maternal parents during pregnancy using a sibling fixedeffects methodology. They find small adverse effects on birth outcomes, but no effects on adult bodymass index (BMI), educational attainment, or labor market outcomes. Our paper is complementaryas we show that—despite the limited impacts on physical health or adult economic outcomes—thereare important consequences of in utero exposure to maternal bereavement for childhood and adultmental health. Additionally, by including relatives other than maternal parents in our empiricaldesign, we are able to create a novel measure of the severity of antenatal stress exposure, which wefind to be especially relevant for the mental health analysis. Finally, our methodology is slightlydifferent from the main strategy employed by Black, Devereux and Salvanes (2016): we do notuse a sibling fixed effects design, as, in our particular context, we provide some evidence that the
6Here, we reference the existing literature on humans, which we discuss further in Section 2. Animal studies haveprovided credible causal evidence of a link between in utero exposure to stress and adverse offspring outcomes. See,e.g., the experimental work on rats of Welberg et al. (2001).
3
presence of younger siblings is endogenous due to maternal fertility responses.In sum, our results show that the death of a relative up to three generations apart during
pregnancy has far-reaching consequences for physical health at birth and in the first year of life, aswell as for mental health during childhood and adulthood. A number of medical studies show thatthe loss of a loved one is associated with a physiological response in the human body characterizedby an increase in the level of the stress hormone cortisol (Irwin et al., 1988; Pfeffer et al., 2007;Dietz et al., 2013; Holland et al., 2014). While it is impossible to rule out all other mechanismsaside from in utero exposure to maternal grief-induced stress, we provide evidence against keyalternative explanations such as changes in maternal behaviors (e.g., smoking and weight gain)or physical health conditions (e.g., hypertension) or adverse income effects that might produceseparate insults to child health. Our findings suggest large general welfare gains of preventing fetalexposure to severe stress: for example, based on the 2008 figure for the U.S. market, the 8 percentdecrease in the consumption of prescription drugs treating depression alone can be valued at around$800 million annually.
While we recognize that stress from grief is in some ways different from stress induced by eco-nomic hardship (e.g., as a result of unemployment or poverty), we believe that our findings maynevertheless be applicable to understanding how economic sources of stress could have intergen-erational impacts on mental health. In Section 6, we conduct a back-of-the-envelope calculationto understand how exposure to maternal economically-induced stress during the fetal stage mightaffect the mental well-being of the next generation by relying on past research estimating cortisolresponses to grief (Irwin et al., 1988; Pfeffer et al., 2007; Dietz et al., 2013; Holland et al., 2014) andto economic shocks like unemployment and poverty (Arnetz et al., 1991; Haushofer and Shapiro,2013). Our calculation suggests that in utero exposure to stress from unemployment may lead toa 17.3 percent increase in the likelihood of ever purchasing a drug to treat ADHD in middle child-hood, and 9 and 5.5 percent increases in the likelihoods of ever purchasing drugs to treat anxietyand depression in adulthood, respectively.
The causal link between antenatal stress and mental disease that we establish points to onepotential reason for why so few children born into disadvantage are able to escape it in adulthood.Indeed, a growing literature has highlighted how early-life health disparities may perpetuate eco-nomic inequality in adulthood (Currie, 2011; Aizer and Currie, 2014). Our results, combined withprior research documenting a strong socioeconomic gradient in stress exposure (see Thompson,2014 for an overview), contribute to this literature by providing novel evidence on how disparitiesin early-life health may also translate into lasting disparities in adult mental illness.
2 Hypotheses
The primary contribution of this paper is to shed light on the mental health effects of fetal exposureto maternal stress. In this section, we discuss our hypotheses regarding the expected effects on
4
mental health outcomes, as well as the expected timing of the onset of these effects. Our analysisalso considers the impacts on physical health at birth and later in life, and analyzes differentialeffects across gestational age at exposure and with respect to the severity of stress. We providea brief description of our hypotheses regarding these other impacts; for a longer discussion, seeOnline Appendix B.
Mental Health Outcomes The existing evidence on the mental health effects of fetal stressexposure is extremely limited. We are only aware of two recent studies in economics that showthat malnutrition in utero may lead to mental and learning disabilities later in life (Almond andMazumder, 2011; Adhvaryu et al., 2014). Both papers focus on adult measures of mental healthand neither investigates more precisely where in the life cycle these effects appear.
Further, to the best of our knowledge, no existing study in economics analyzes the impactof stress during the fetal stage—or, more generally, of any in utero shock—on mental health inchildhood. Our focus on stress is most closely related to the work of Aizer, Stroud and Buka(Forthcoming), who implement a sibling fixed effects estimation and show that exposure to elevatedcortisol in-utero adversely affects cognition at age seven and educational attainment later in life.7
Some of these effects on cognition could potentially be driven by mental health issues, consistentwith psychiatric studies showing a correlation between cognitive impairment and the use of ADHDprescription drugs (Simon et al., 2000).
Outside of economics, there is more direct evidence on correlations between mental illness inchildhood and adverse conditions during the fetal stage. For instance, recent neuroscientific researchtraces the origins of depression and autism-spectrum diseases such as ADHD to the fetal period(Liu et al., 2012; Berquin et al., 1998; Stoner et al., 2014). Other epidemiological studies have alsoestablished a correlation between mothers’ cortisol levels during pregnancy and their children’smental health.8 Related, Malaspina et al. (2008) provide evidence that exposure to the Six-DayArab-Israeli War in utero increased the likelihood of developing schizophrenia by age 30.9
Thus, taken together, while credible causal evidence on the impact of early-life shocks on mentalhealth is scant, existing evidence does suggest that we may expect mental health effects both inchildhood and adulthood. Our analysis specifically focuses on three conditions: ADHD, anxiety,and depression. We focus on ADHD in childhood because it is the most prevalent mental healthcondition among children in Sweden that can be measured by drug consumption (as well as in manyother developed countries like the United States) (Socialstyrelsen, 2015), and since medical researchhas determined that environmental influences—including fetal stress exposure—are important forits etiology (Berquin et al., 1998; Van den Bergh BRH, 2004, 2005). For adults, we study depression
7Though this design controls for time-invariant differences between mothers that might be correlated with stress,it cannot fully control for time-varying factors that might lead to variation in cortisol levels across pregnancies withinthe same mother.
8See Online Appendix F for details.9An important limitation of this empirical design is that it precludes the isolation of fetal exposure to stress from
the other consequences of the war, such as its economic repercussions.
5
and anxiety, which are also some of the most common mental illnesses in Sweden (Socialstyrelsen,2013), and which have been shown to be related to ADHD diagnosis in childhood.10
Timing of the Onset of Mental Health Effects Importantly, our data allow us to try topin down when in the life cycle mental health effects appear. Since our analysis uses Swedishprescription registry data to measure these effects, we discuss here the specific institutional contextthat informs the pattern of results we may expect.
When it comes to ADHD, prescription drugs have only been readily available since 2002 in Swe-den, when the first prescription drug with the active substance Methylphenidate was permitted fortreatment of ADHD in children below age 18.11 Though treatment rates were low during the firstcouple of years, Sweden’s National Board of Health and Welfare (NBHW) has documented a contin-uous and substantial increase in the prescription rate of this substance since 2005 (Socialstyrelsen,2012), which is the year when our prescription drug data begins.
The NBHW has also documented that both prevalence (share treated) and incidence (shareinitiating treatment) are highest among individuals aged 10-17 years old during the time periodcovered by our prescription drug data (Socialstyrelsen, 2015).12 These ages coincide with the endof primary school and the entirety of middle school in Sweden.
The fact that initiation of prescription drugs treating ADHD is most common at these schoolages may be explained by the structure of the Swedish school health care system (Skolhälsovården).All children attending primary and middle school in Sweden go through free annual health check-ups. Further, according to the most recent guidelines issued by the NBHW in 2002 (Socialstyrelsen,2002), there is a particularly detailed health check-up in grade 4—at age 10—at which each child’sconcentration skills and mental health are evaluated. The guidelines also state that all studentshave the right to further evaluations, and to get help with any mental or concentration issues thatare detected at the age of 10.
Additionally, there is reason to believe that Sweden’s school financing rules give schools a directeconomic incentive to help detect and initiate treatment of children’s mental health problems.13
For example, Hjörne (2012) argues that most evaluations of whether a child has ADHD are initiatedby teachers or schools, who alert parents of problems and suggest further evaluation. In sum, giventhat all children are screened for mental health issues at age 10 and the schools’ direct incentives
10Tables 7, 8 and 12 in Socialstyrelsen (2013) show that depression and anxiety are the most prevalent conditionstreated by pharmaceuticals for neurological conditions, after painkillers and sleeping pills. See http://www.adaa.org/understanding-anxiety/related-illnesses/other-related-conditions/adult-adhd for more information on therelationship between ADHD and anxiety and depression.
11In Sweden, Methylphenidate is consumed by 89 percent of all individuals using any prescription drug treatingADHD, with trade names in the U.S. such as Concerta, Methylin, Ritalin, and Equasym XL.
12The considered age groups are: 5-9; 10-17; 18-24; 25-34; 45-54; and 55-64.13In Sweden, schools are financed at the municipal level—direct school fees imposed on parents are prohibited by
law—and municipalities often offer schools extra transfers for pupils with special needs. Hence, these rules imposedirect financial incentives on school principals and teachers to help parents detect, and commence treatment of,ADHD in their children.
6
in promoting ADHD treatment, it is plausible that the detection of any consequences of in uterostress on ADHD may appear around that age in our data.
With regard to anxiety and depression—the other mental health conditions we focus on—thereare fewer specific institutional factors that might guide our expectations. In general, according tothe NBHW, nationwide prevalence of prescription drugs treating anxiety and depression in Swedenis higher in older age groups (Socialstyrelsen, 2013).14 This pattern may suggest that detection ofany consequences of in utero stress on anxiety and depression may appear at relatively old ages inour sample.
Other Hypotheses When it comes to the expected impacts of fetal stress exposure on birthoutcomes and physical health in later life, we draw on the large existing literature that points toadverse short- and long-term effects of exposure to physical insults during the fetal period (seeAlmond and Currie, 2011 for a review).15 The evidence on the consequences of purely psychologicalstressors is more scarce, as studies that exploit variation from extreme and rare events like naturaldisasters and terrorist attacks are limited in their ability to separate the effects of in utero stressexposure from any post-natal responses, as well as from the physical health and economic insultsassociated with these events.16 Our empirical methodology (described in detail in Section 4 below)and focus on a nearly universal stressor are designed to overcome these limitations.
An important caveat to the analysis of long-run physical health is that our cohorts—whom wecan only follow into their thirties—may be too young to detect any effects on conditions such asobesity and diabetes. Indeed, evidence in support of David J. Barker’s “fetal origins hypothesis”(Barker, 1990), which argues that poor conditions in-utero can lead to latent effects on diseasemuch later in life, comes from studies of adults who are much older than the individuals in oursample.17
Additionally, throughout the paper, we explore whether there are any differential effects of ex-posure to maternal stress across different months or trimesters of pregnancy. The existing literaturedoes not provide a clear picture of whether we should expect in utero exposure to maternal stressto have differential effects across gestational age at the time of shock. While some studies find dif-ferential effects with respect to gestational age, other studies—including some that are most closelyrelated to ours (Almond and Mazumder, 2011; Mansour and Rees, 2012; Currie and Rossin-Slater,
14See table 72 for anxiety and table 74 for depression.15See, also, e.g.,Van den Berg, Lindeboom and Portrait (2006); Almond, Edlund, Li and Zhang (2010); Hoynes, Page
and Stevens (2011); Almond, Hoynes and Schanzenbach (2011); Almond and Mazumder (2012); Hoynes, Schanzenbachand Almond (Forthcoming); Scholte, Van Den Berg and Lindeboom (2015); Rossin-Slater (2013) on malnutrition;Almond (2006); Barreca (2010) on disease outbreaks; Almond, Edlund and Palme (2009); Black, Butikofer, Devereuxand Salvanes (2013) on radiation; and Sanders (2012); Isen, Rossin-Slater and Walker (Forthcoming) on air pollution.
16See, for example, evidence on hurricanes (Simeonova, 2011; Currie and Rossin-Slater, 2013), earthquakes (Tanet al., 2009; Glynn et al., 2001; Torche, 2011), and the terrorist attacks of September 11 (Berkowitz et al., 2003;Lederman et al., 2004; Lauderdale, 2006; Eskenazi et al., 2007). Another recent paper uses in utero exposure to theSuperbowl to identify the effects of prenatal stress on birth outcomes (Duncan et al., 2015).
17See, e.g.: Susser and Lin (1992); Almond (2006); Hoynes et al. (Forthcoming).
7
2013; Black, Devereux and Salvanes, 2016)—fail to find such heterogeneity.Finally, in contrast with the abundance of studies estimating differential effects across gesta-
tional age at the time of shock, the existing literature provides relatively little guidance on whetherwe might expect to see heterogeneous effects with respect to the intensity of stress exposure. Mostclosely related to our paper, Aizer et al. (Forthcoming) explore potential non-linearities in theeffect of stress by separately analyzing different quartile ranges of the maternal cortisol distribu-tion. Interestingly, the effects on birth outcomes do not vary with the severity of stress exposure.By contrast, the adverse impacts on cognition—captured by child IQ at age 7 and educationalattainment—are the largest for the most severe stress; in fact, the effects on cognitive outcomes arenot statistically significant in the linear specifications, but are instead driven entirely by the high-est quartile of the maternal cortisol distribution. This evidence suggests that mental health andcognition outcomes may be more sensitive to the severity of stress exposure than birth outcomes.
3 Data
Our analysis uses administrative population-level data from Sweden. We have data on the universeof children born in Sweden from 1973 to 2011, who experienced the death of a relative (other thanthe mother) in the 40 weeks after their date of conception or in the one year after their date of birth.Put differently, our baseline sample includes all children whose mother loses a family member—asibling, a parent, a maternal grandparent, the child’s father, or an own (older) child—either duringher pregnancy or in the year after childbirth. Our data include both live births and stillbirths (at22 weeks gestation or later), allowing us to examine changes to the composition of live births. Foreach relative who died, we have information on the cause and exact date of death. We also haveinformation about the mothers’ and fathers’ educational attainment, labor market income, andmarital status measured around the time of conception.
For each child in our sample, we have data on the exact date of birth, birth weight, birth length,head circumference, gestation (in days), and a variety of diagnosis codes at birth. We also havevariables related to the mother’s pregnancy and delivery: tobacco use during pregnancy, pregnancyrisk factors (diabetes, kidney disease, epilepsy, asthma, hypertension, or urinary infection), thefirst date of prenatal care and the number of prenatal visits, caesarean section (c-section) delivery,induction of labor, and any complications at delivery.
To trace health outcomes after birth and throughout life, we add information from inpatientrecords and the prescription drug registry. For all of these, we have the universe of records associatedwith pre-specified health conditions described below. Inpatient records exist from 1964 to 2012,while the prescription drug data exist for the years 2005 to 2014. For each occasion when aprescription drug was bought, the data contain detailed information about the drug name, activesubstance, average daily dose, and the drug’s exact ATC code.18 The ATC classification allows us
18The Anatomical Therapeutic Chemical (ATC) Classification System is controlled by the World Health Organi-
8
to link the drugs to the conditions they are most commonly used to treat.To select the inpatient and prescription drug records, we pre-specified certain health conditions
before undertaking any analysis.19 First, we include all mental illnesses. We further pre-specifiedthe eight sub-categories of mental disorders that were recently selected by the NBHW to trackprevalence and prescription drug use (Socialstyrelsen, 2012): ADHD, anxiety, depression, bipolardisorder, psychotic disorders, sleeping disorders, addiction, and Parkinson’s disease. While wepre-specified all eight subcategories for completeness, our analysis focuses on ADHD, anxiety, anddepression, as we discussed in Section 2.
Second, although our primary focus is mental health, we pre-specified a small set of physicalhealth conditions that have been linked to stress in utero or after birth in the epidemiological andmedical literature: type II diabetes, heart disease, Cushing’s syndrome, hypo- and hyperthyroidism,cholesterol, neoplasms, and conditions originating in the perinatal period.20 We include all of thesefor completeness, although our cohorts may be too young to detect any effects on physical healthother than conditions originating in the perinatal period.21
4 Empirical Methodology
Our goal is to examine the causal link between antenatal exposure to the death of a family memberand children’s physical and mental well-being at birth and later in life. The loss of a relative isa traumatic event that induces acute and immediate stress in the expectant mother (Irwin et al.,1988; Pfeffer et al., 2007; Dietz et al., 2013; Holland et al., 2014). However, the occurrence of deathis likely correlated with unobserved family characteristics. For example, some types of accidentaldeaths are negatively associated with socioeconomic status (Adda, Björklund and Holmlund, 2011).Additionally, this loss may have many consequences for families aside from stress. For instance, arelative’s passing may constitute either a financial burden or a source of income through bequestsor insurance payouts. A death in the family may lead to a decline in household productivity andnecessitate time away from work for the survivors. If a relative’s death is due to a hereditarycondition, then it may also provide other family members with information about their own geneticmakeup, life expectancy, and expected health costs. All of these factors can also affect the child
zation Collaborating Centre for Drug Statistics Methodology (WHOCC), and was first published in 1976.19We have access only to the subset of the inpatient and prescription drug records described here; not to the entire
universe of inpatient and prescription drug records for all possible conditions. We are therefore unable to explorehealth effects beyond the pre-specified ones in our analysis.
20We are grateful to Johannes Haushofer for help in compiling this list. See Online Appendix E for exact ICD codesfor these conditions, as well as ATC codes for prescription drugs that can be linked to their treatment. Cushing’ssyndrome is a condition that occurs when the body is exposed to high levels of the hormone cortisol for a long time.Online Appendix F has details and references relating to the biological mechanisms through which stress affectshuman health.
21As outlined in Online Appendix E, the inpatient records also include visits related to health outcomes that mightbe impacted through a behavioral channel: sexually transmitted disease, injury, suicide, and lifestyle issues. Thesewe do not capture through prescription drugs, either because no prescription drug is used, or because no drug canuniquely be linked to their treatment.
9

after birth.To identify the impact of antenatal exposure to a family rupture, we must therefore address
two challenges: (i) separation of impacts that operate through the uterine environment from otherimpacts that also operate through the post-natal environment, and (ii) non-random selection intodeath. We do this by exploiting variation in the exact timing of family rupture relative to theexpected date of delivery (at full term). Our analysis essentially compares individuals who expe-rience the death of a relative during gestation with individuals who experience such a death inthe year after birth. Thus, while all children included in this analysis are exposed to the post-natal consequences of the relative’s passing, only the former group is exposed through the uterineenvironment.
Isolation of Antenatal Effects More concretely, to see how we address (i), let the causalrelationship between an outcome of interest, yi, and the occurrence of a family rupture be givenby:
yi = γRelativeDeathi + x′iκ+ ui, (1)
where xi is a vector of all other relevant determinants of yi, and ui is a random vector of prede-termined and unobservable characteristics. Here, γ captures the combined impact of all pre- andpost-natal consequences of the relative’s passing.
Now instead consider a sample of children who either experience the death of a relative duringgestation, or shortly after birth:
S = {i : 1[c ≤ RelativeDeath < b]i = 1 |1[b ≤ RelativeDeath < b+ w]i = 1} ,
where c denotes the child’s date of conception, b denotes the child’s date of birth, and w denotesa time window after birth (in days), so that 1[c ≤ RelativeDeath < b]i = 1 indicates that thefamily rupture occurred during pregnancy, and 1[b ≤ RelativeDeath < b + w]i = 1 indicates thatit occurred within w days of the child’s birth, respectively.
For all i ∈ {S}, suppose we estimate:
yi = σ1[c ≤ RelativeDeath < b]i + x′iη + εi, (2)
where all of the variables are defined as above. Here, σ captures the effect of bereavement inutero relative to the effect of bereavement immediately after birth, and not the entire effect ofbereavement. Comparing individuals who experience a stressful shock during gestation with thosewho experience such a shock shortly after birth effectively addresses issue (i) above, and has adistinct advantage over the existing studies in this literature that rely on exposure to war or otherdisasters. These studies cannot rule out that the documented effects on adult outcomes arise frompost-natal differences that were induced by the events that occurred during pregnancy, rather than
10
by the differences in the uterine environments. A compelling feature of our methodology is that ourestimates are not contaminated by such post-natal effects—these effects are borne by all childrenin our sample, while only the treatment group is exposed to maternal trauma in utero.
By separating antenatal effects from post-natal consequences, our estimate captures the impactof the unborn child’s physiological exposure to maternal stress through the uterine environment.The extent to which σ isolates only the effect of this stress exposure depends on whether otherconsequences of the family rupture—e.g. positive or negative income effects or changes in householdproductivity—are the same across the pre- and post-natal periods, or whether some of them havedifferential impacts during the pre-natal period. To be more precise, two different assumptions onthe separability of the effects of a relative’s passing translate into two different interpretations ofσ:
A1: Strong additive separability. First, interpreting σ in (2) as the impact of intrauterine stressexposure alone is equivalent to coupling model (1) with the following assumption, which we referto as “strong additive separability”:
RelativeDeathi = α1UteroStress∗i 1[c ≤ RelativeDeath < b]i + α2Otheri + εi, (3)
where UteroStressi represents intrauterine exposure to the physiological stress experienced bythe mother, and Otheri captures all other consequences and correlates of family bereavement,including shocks to family income, changes to the mother’s work schedule, changes to the mother’sinformation regarding her own health status, and any family characteristics that make death morelikely. Given (1) and (3), children whose mothers experience a death shortly after giving birth facethe same income shocks and other consequences as the children whose mothers experience a deathduring pregnancy. But unlike the children who are in utero when the death occurs, the formergroup does not have intrauterine exposure to the physiological stress experienced by the mother.Consequently, if A1 holds, σ obtained from estimation of (2) on sample S isolates the impact ofintrauterine stress caused by the family rupture.
A2: Weak additive separability. Second, if instead income shocks associated with the death of afamily member affect the child differently depending on whether the loss occurs during pregnancyor if it happens shortly after childbirth, then we would interpret σ in (2) as capturing both theeffect of physiological exposure to maternal stress and the differential impact of income duringpregnancy relative to post-partum (which may interact with the stress exposure). This is equivalentto coupling model (1) with the following, less restrictive assumption, which we refer to as “weakadditive separability”:
RelativeDeathi = α1UteroStress∗i 1[c ≤ RelativeDeath < b]i+
α2UteroStress∗i 1[c ≤ RelativeDeath < b]∗i Incomei+α3Otheri + εi, (4)
11
and assuming that the new term is additively separable from any other income effects.In Section 5, we examine whether there are any additional income effects stemming from the pre-
natal period—that is, income effects that do not only operate through the post-natal environment—and find little evidence of their presence. We also examine a range of mechanisms other thanmaternal stress. As we discuss further in Section 5, all these tests support the interpretation of σin (2) as largely capturing the impact of intrauterine stress exposure (though we, of course, cannotrule out all other mechanisms with certainty).
Causality Model (2) represents a causal relationship between in utero exposure to bereavementand child outcomes if, for all i ∈ {S}, E(1[c ≤ RelativeDeath < b]iεi) = 0. However, as discussedfurther below, we find that exposure to the death of a relative in utero reduces gestational age.Since the key treatment variable in equation (2), 1[c ≤ RelativeDeath < b]i, is defined based onthe child’s actual birth date, b, we face a violation of the excludability restriction. Moreover, thereis a mechanical correlation between the length of the pregnancy and the likelihood that the deathoccurs during it.22
To address these issues, we adjust our treatment variable by defining it relative to the expecteddate of birth at full term instead of the actual date of birth. More precisely, we define a child’sestimated date of birth as eb = c + 280, that is, 280 days (40 weeks) after the date of conception,c. Unlike the actual date of birth, this expected date of birth is pre-determined at the relative’sdeath date.
Consequently, instead of estimating equation (2), we estimate the following equation on thesample with i ∈ {S}:
yiymp = β0 + β11[c ≤ RelativeDeath < eb]iymp + ψy + φm + ρp + x′iβ2 + νiymp, (5)
where 1[c ≤ RelativeDeath < eb]iymp captures “treatment”: a discontinuous variable that takesthe value of 1 if the relative’s death occurs before the child’s estimated date of birth at full term,and 0 otherwise. Intuitively, our empirical strategy exploits a discontinuity around the threshold of280 days after conception, and assigns a child to intrauterine stress exposure if the relative’s deathoccurred before this date.23
In model (5), yiymp is an outcome of individual i, conceived in year and month (y,m), with amother residing in municipality p in the year before conception. ψy and φm are year and month ofconception fixed effects, respectively, and ρp are pre-conception municipality fixed effects. Further,xi is a vector of variables capturing mother- and child-specific characteristics, including indicator
22See Currie and Rossin-Slater (2013) and Black, Devereux and Salvanes (2016) for more discussion of these issues.23We also can estimate models where we use 1[c ≤ RelativeDeath < eb]iymp to instrument for exposure to death
before the child’s actual date of birth. As the instrument (relative death before expected birth date) is different fromthe actual exposure variable (relative death before actual birth date) for only about 1 percent of the individuals inour data, the first stage is very strong with a coefficient of around 0.97. The 2SLS results (presented in Appendix Dare very similar to those from our main specifications.
12
variables for the mother’s age at conception (five categories: < 20, 20 − 24, 25 − 34, > 35),the mother’s education in the year prior to conception (four categories: <HS, HS diploma, somecollege, college+), indicators for the mother being born outside of Sweden and being married inthe year prior to conception, and dummies for parity (three categories: 1, 2, 3+). Additionally,xi includes the relative’s age and age squared at the time of death. Standard errors are clusteredon the mother’s municipality of residence in the year prior to conception. Under the identifyingassumption discussed below, the estimate of interest, β̂1, captures the causal impact of exposure tomaternal stress due to family rupture through the uterine environment.24
In parts of our analysis, we also analyze pregnancy trimester- and month-specific impacts,replacing 1[c ≤ RelativeDeath < eb]iymp with indicator variables capturing whether the deathoccurred in the expected first, second, or third trimester or the expected first through ninth monthsof pregnancy, respectively.
Identifying Assumption This methodology yields an estimate of the causal effect of antenatalmaternal stress under the identifying assumption that the exact timing of death within a shorttimeframe around the expected date of birth is uncorrelated with unobserved characteristics ofthe child or family. Put differently, we assume that there is no selection on unobservables intotreatment, where treatment is defined as experiencing death during the first 40 weeks (280 days)after conception.
While less restrictive than assuming no selection into death per se, the assumption is nonethelessnot innocuous. We therefore subject it to several “plausibility tests,” since the exact assumptionis inherently untestable. First, we test whether selection into treatment is correlated with a rangeof parental characteristics that are observed prior to conception: each parent’s age, first paritybirth, each parent’s marital status, each parent’s educational attainment (indicators for below highschool, high school degree, some college; with college degree or higher as the omitted category), eachparent’s wage income, and an indicator for the mother being born outside Sweden.25 As shownin Appendix Tables A1 and A2 for maternal and paternal characteristics, respectively, we findlittle evidence for a systematic relationship between parental characteristics and the occurrenceof death during pregnancy.26 Out of the 16 coefficients reported in these tables, only two are
24Equation (5) represents a reduced-form relationship between a relative’s death during the mother’s expected lengthof the pregnancy and child outcomes. We also present some results from two-stage least squares (2SLS) specificationswhere we use 1[c ≤ RelativeDeath < eb] to instrument for exposure to death during the mother’s actual length ofpregnancy. In these specifications, the first stage takes the form of:
1[c ≤ RelativeDeath < b]iymp = γ0 + γ11[c ≤ RelativeDeath < eb]iymp + ηy + εm + θp + x′iγ2 + ζiymp, (6)
with the 2SLS estimate given by β̂1/γ̂1.25Information on child parity and whether the mother is born outside Sweden comes from the medical birth register;
we do not have information on child parity or nativity for fathers. We do not include father characteristics as controlsin our main analysis as they are missing for some children in our sample and we want to maximize our sample size.However, results that include father characteristics as controls are generally very similar to those reported here.
26Since our analyses compare individuals who experience a relative death in utero to those who experience a relative
13
statistically significant—we find a positive correlation between treatment and first parity births anda negative correlation between treatment and the likelihood of the mother being foreign-born—andthe magnitudes are relatively small when compared to sample means.
We explored the correlation between treatment and first parity births in detail, and concludethat it is mechanically driven by differential seasonality in conceptions by parity that coincideswith a seasonal pattern in relative deaths. We discuss this issue at length in Online Appendix C.For this reason, all of our analyses include month of conception and parity fixed effects, and weshow that our results are also robust to the inclusion of parity×month of conception interactionsin Online Appendix D.27
A second, and related, concern for our identification assumption is that the death of a relativeduring pregnancy may cause an increase in miscarriages or fetal or infant deaths, leading to selectionin our sample of surviving children. Moreover, there may be differential selection by parity, whichcould introduce the correlation between treatment and first parity that we see in Appendix TableA1. While we do not have data on miscarriages, we explore the impacts of treatment on stillbirths(at 22 weeks gestation or more), perinatal deaths (stillbirths or deaths in the first 28 days oflife), and the sex ratio at birth separately by parity in Appendix Table A3, finding no statisticallysignificant effects.28
As a third test of the identification assumption, we link our sample of children to their oldersiblings (if they exist), and test whether a younger child’s in utero exposure to the death of arelative has any spurious impacts on his/her older sibling’s outcomes.29 In Appendix Table A4we present results from these specifications where the older sibling’s outcomes considered are: anindicator for a low-birth-weight birth (less than 2,500 grams), an indicator for a pre-term birth (lessthan 37 weeks gestation), an indicator for ever being hospitalized before age one for a conditionoriginating in the perinatal period, an indicator for ever consuming drugs treating ADHD betweenages 9 and 11, and indicators for ever consuming drugs treating anxiety and depression betwen ages34 and 36.30 These are the main outcomes for which we find effects in Section 5, and we thereforeuse them as “placebo outcomes” in this analysis. Just as in the main analysis, we focus the placebo
death after birth while controlling for year-of-conception fixed effects, there is a mechanical correlation between thetreatment variable and age of the relative—those who die during the mother’s pregnancy are mechanically slightlyyounger than those who die in the year after childbirth. Thus, all of the regressions in Appendix Tables A1 and A2control for the relative’s age and age squared.
27The correlation between treatment and the likelihood of the mother being born outside Sweden is driven by ahighly skewed distribution of relative deaths in the sample of children of foreign-born mothers that exhibits extramass of relative deaths around 400-500 days post-conception (i.e., after birth). In Online Appendix D, we show thatour results are robust to dropping children of foreign-born mothers from our sample.
28We follow several papers in this literature by examining the sex ratio as a signal of changes to miscarriage rates(e.g., Sanders and Stoecker, 2015; Halla and Zweimüller, 2013). Since male fetuses are more likely to miscarry, areduction in male births may indicate an increase in miscarriages.
29Siblings data are only available to us for children born in selected years: 1973, 1977, 1983, 1988, 1995, 1999,2001, and 2005.
30When we analyze the indicator for being hospitalized for a condition originating in the perinatal period asan outcome, we limit the sample to siblings born in 1987 or later (as the definition of perinatal conditions is notcomparable with earlier years).
14
analysis of mental health outcomes on a sub-sample limited to mothers who experience a parentalor sibling death. Appendix Table A4 shows that there is no statistically significant relationshipbetween a younger child’s prenatal exposure to a relative’s death and the older child’s outcomes.31
These results are reassuring as they suggest that the timing of a family member’s death inrelation to the child’s expected date of birth is uncorrelated with a variety of family characteristics.Nevertheless, we also examine the robustness of our results to limitations in types of death causesthat have been shown to be more exogenous and less anticipated than others; see Section 5 andOnline Appendix D for details.
Sample and Summary Statistics Table 1 presents summary statistics. As described above,we define the set of treated individuals as those experiencing the death of a relative during the40 weeks after conception (i.e., in days, the time interval of [c, c + 280]). Our comparison groupincludes all children who experience a relative death at any point between the estimated date ofbirth and one year after their actual birth date.32 Column one displays statistics for our full sample,while the second and third columns consider the treatment and comparison groups separately. Inour sample, mean maternal age at childbirth is about 28 years, and about 31 percent of mothersare married in the year prior to conception. The modal mother has a high school degree in theyear before conception. Average birth weight is 3, 544 grams, with 3 percent of children born low-birth-weight and 5 percent of children born pre-term. Notably, the maternal characteristics arequite similar across the treatment and comparison groups. However, even this simple unadjustedcomparison shows that treatment children tend to have slightly worse birth outcomes relative tothe comparison group. In the subsequent section, we explore the differences between the outcomesof the two groups more rigorously using the methods described above.
Column four displays related statistics for the universe of all births in Sweden during the sametime period. Relative to the universe of births, average birth weight in our sample is slightly higher,while the likelihoods of pre-term and low-birth-weight births are slightly lower.33 Additionally,mothers in our sample are slightly less likely to have a high school degree than all mothers givingbirth in Sweden, but this difference is at least partially driven by differences in how educational
31We should note that the interpretation of these placebo results is less clear in light of the correlation betweentreatment and child parity. As discussed above, the correlation between treatment and child parity is mostly mechan-ical and does not affect our main results. Another concern with this placebo analysis is that we have less power todetect statistically significant effects due to the smaller sample size of cohorts that can be linked to siblings. However,we have replicated our main analysis only using children in the “sibling sample” cohorts (i.e., those who were born in1973, 1977, 1983, 1988, 1995, 1999, 2001, and 2005). In contrast to the results for older siblings, we find statisticallysignificant deleterious effects of exposure to a relative’s death during pregnancy on our main outcomes of interest forchildren born in these years (results available upon request).
32To estimate the date of conception, c, we subtract the number of gestation days from the date of birth, b.33We believe that these differences arise as a result of the fact that our sample—which is conditional on being
linked to a relative death—has a slightly smaller share of all births from the earlier years than the later years.The multigenerational register has lower quality data further back in time, and we therefore observe fewer great-grandparent deaths for children born in the 1970s than for those born in the later years. Since birth outcomes havebeen improving over time, our sample has slightly better infant health measures than the overall population of births.
15
attainment is measured between the two sources of data.34
5 Results
We present results in chronological order. We start with the analysis of birth outcomes, and thenstudy physical and mental health throughout childhood and into adulthood. We also present someadditional results that examine the possibility of alternative explanations besides stress in ouranalyses, and that test the robustness of our main findings.
5.1 Birth Outcomes
Table 2 presents the results on the effects of exposure to a relative death in utero on average birthweight, and indicators for low-birth-weight, very-low-birth-weight, and high-birth-weight (morethan 4,000 grams) and pre-term births. In Appendix Table A5, we report results for additionaloutcomes: indicators for small-for-gestational-age (SGA) and large-for-gestational-age (LGA), birthlength and head circumference (in centimeters), and indicators for procedures at delivery (c-section,induction of labor). All of our analyses include the vector xi described above, as well as fixed effectsfor the year and month of conception and the mother’s municipality of residence in the year priorto conception.
To examine whether the effects are different depending on the severity of the stressful event,these tables are split into three panels. Panel A presents results for our entire analysis sample.Panel B limits the sample to children whose mothers lose close relatives, who are defined as thosewithin one generation from the mother—a mother’s sibling, a mother’s parent, the child’s father, ora mother’s own older child (i.e., we drop grandparent deaths). Finally, Panel C further limits thesample to children whose mothers experience the death of a parent or a sibling (i.e., a sub-sampleof the “close relative” group). The death of a maternal parent or sibling likely generates severestress for the mother, but leads to fewer other changes to household resources and immediate familystructure than the death of the child’s father or the mother’s own older child would.
Our estimates suggest that in utero stress due to family bereavement leads to a small negativeeffect on average birth weight of 11 grams. However, much of this effect is driven by impacts at thelower end of the birth weight distribution. Prenatally exposed infants are 12 percent more likely tobe born low-birth-weight, and 24 percent more likely to be born very-low-birth-weight. In contrast,
34Specifically, in Table 1, the variables marked by an asterisk are measured slightly differently in the sample that weuse (columns (1)-(3)) than in the universe of births (column (4)). In particular, in our sample, all variables indicatedby ∗ are measured at conception. In the universe of births, these variables are instead measured at the first prenatalvisit. In addition, the three educational attainment categories would not be directly comparable even if they weremeasured at the same point in time. For our sample, our dataset contains the official educational attainment variable,matched from records from Statistics Sweden. For the universe of births, we use the variable from The Swedish Boardof Health and Welfare, where the educational categories are defined slightly differently. Most importantly, high schoolattainment includes a broader range of programs than regular three-year high school programs (e.g., various two-yearprograms). We do not have information about marital status for the universe of births.
16
there is only a 3 percent decline in the likelihood of a high-birth-weight birth.35 These childrenare also 12 percent more likely to be born pre-term, are 0.18 percent shorter, and have 0.1 percentsmaller head circumference. The mothers are 3 percent more likely to have a c-section delivery.Additionally, comparing the results across panels suggests that the effects of in utero exposureto the death of a relative are similar across different relative types. The lack of heterogeneoustreatment effects with respect to our measure of the intensity of stress exposure for birth outcomesis consistent with other studies of maternal cortisol (Aizer et al., Forthcoming) and stressful shockslike hurricanes (Currie and Rossin-Slater, 2013).
In Figure 1 and Appendix Figure A1, we examine whether our estimated impacts are differentacross the nine months of pregnancy for low-birth-weight and pre-term births, respectively. Thegraphs present the coefficients (and 95% confidence intervals) from a single regression that includesindicators for exposure to the death of a relative in each of the 9 (expected) months of pregnancy,with the omitted category being exposure after 280 days (40 weeks) of gestation.
Both figures show positive coefficients on exposure to stress during most months of the preg-nancy relative to post-partum, with slightly higher effects during the fourth month. In AppendixTables A6 and A7 we also display trimester-specific effects on all of the birth outcomes. In general,however, the coefficients tend to be quite similar throughout the pregnancy, and with overlappingconfidence intervals. As discussed in more detail in Section 2, the lack of significant differencesacross the gestational age at exposure is consistent with other recent studies on the effects of inutero shocks on birth outcomes (e.g.: Almond and Mazumder, 2011; Mansour and Rees, 2012;Currie and Rossin-Slater, 2013; Black, Devereux and Salvanes, 2016).
5.2 Physical Health Outcomes Beyond Birth
Having documented that exposure to family bereavement in utero adversely impacts health atbirth, we turn to the analysis of physical health measures later in life. First, we examine the effectson the occurrence of hospitalizations by different ages. Our inpatient data exist for years 1964 to2012 and thus allow us to study cumulative hospitalizations into adulthood.
Table 3 presents results on the effects of in utero exposure to a relative death on child hos-pitalizations by age one. We find that in utero stress is associated with a 3 percent increase inthe likelihood that a child is ever hospitalized by age one (column 1).36 We explored in detail thediagnoses codes to try to understand which causes are driving these results and found that they are
35High birth weight (defined as more than 4,000 grams) is typically seen as a negative health outcome, which iscorrelated with a greater incidence of obesity and other adverse conditions like diabetes in later life (see, e.g.: Cnat-tingius et al., 2012). Thus, the decline in the likelihood of a high-birth-weight birth can be seen as a small beneficialeffect of in utero stress exposure. However, the magnitude of this decline is much smaller than the correspondingmagnitudes of the increases in low-birth-weight and very-low-birth-weight births.
36We also examined outpatient visits, and found suggestive evidence of similar increases in outpatient visits occur-ring by age one, although we have less power due to smaller sample sizes in these analyses (outpatient data is onlyavailable for years 2001 to 2012). These results, as well as a description of the outpatient data, are available uponrequest.
17
entirely driven by treatments for conditions originating in the perinatal period, as seen in columns2 and 4 of Table 3.37 As with the results on birth outcomes, we do not see substantial differences ineffects across relative types (Panels A to C). In Appendix Figure A2 and Appendix Table A8, wealso present the results by month and trimester of pregnancy, respectively. The estimates suggestthat the health effects may be stronger when exposure occurs during the first trimester, althoughwe again cannot reject the null hypothesis that the coefficients are the same across different monthsof exposure.
On the whole, our physical health results suggest that the adverse consequences of fetal stressexposure last beyond birth and impact child health through age one. However, the impacts seemto fade after early childhood—we find no effects on hospitalizations at later ages (see AppendixTable A9).38 Though, as we pointed out in Section 2, our results do not rule out the possibilityof latent physical health consequences for individuals at older ages (Barker, 1990); our cohorts aretoo young to detect such effects.
5.3 Mental Health Outcomes
We next use the prescription drug registry data to analyze effects on mental health. As describedin Section 3, these data contain information about prescription drugs bought during 2005-2014.We create variables capturing the incidence of prescription drug consumption at different agesthroughout childhood and adulthood. Specifically, we focus on drugs consumed around ages 5, 10,15, 20, 25, 30, and 35. To reduce measurement error and maximize sample size, we focus on theconsumption of prescription drugs in three-year age ranges centered around these multiples of five(e.g., ages 4 to 6, 9 to 11, etc.). While some individuals appear in the drug registry data at all threeof the ages in a given range (e.g., children born in 2001 appear at ages 4, 5, and 6), others onlyappear at one or two of the ages (e.g., children born in 1999 appear at age 6 only). To calculateour outcomes, we include everyone who appears in the data at least at one of the ages in any givenrange.
Figure 2 graphs the coefficients (and associated 95% confidence intervals in dashed vertical lines)from separate regressions where the outcomes are indicators for individuals consuming prescription
37The analysis of perinatal conditions is limited to cohorts born in 1987 or later as the definition is not directlycomparable to earlier years. For these years, we use the entire set of perinatal conditions, which include all conditionswith ICD-10 codes in the range P00-P96. These include the following categories of conditions: 1) Fetus and newbornaffected by maternal factors and by complications of pregnancy, labour and delivery, 2) Disorders related to lengthof gestation and fetal growth, 3) Birth trauma, 4) Respiratory and cardiovascular disorders specific to the perinatalperiod, 5) Infections specific to the perinatal period, 6) Haemorrhagic and haematological disorders of fetus andnewborn, 7) Transitory endocrine and metabolic disorders specific to fetus and newborn, 8) Digestive system disordersof fetus and newborn, 9) Conditions involving the integument and temperature regulation of fetus and newborn, 10)Other disorders originating in the perinatal period.
38Additionally, we have used our prescription drug registry data to explore effects on the consumption of drugs usedto treat any of the following health conditions at ages 4 through 36: obesity, diabetes, Cushing’s Syndrome, hypo-and hyperthyroidism, cholesterol, and heart conditions (i.e., beta blockers). We find little evidence that exposure toa relative death during pregnancy increases the consumption of these prescription drugs at any of our observable ages(see Appendix Table A10).
18
drugs used to treat any of the mental health conditions described in Section 3 at 5-year age intervals.In Figure 2a, which plots the estimates for our entire sample, none of the coefficients is statisticallysignificant. However, a pattern begins to emerge—mental health impacts seem more likely to arisein middle childhood (ages 9 to 11) and adulthood (ages 34 to 36). When we limit the sample toindividuals whose mothers experience close relative deaths in Figure 2b, the pattern becomes morepronounced, with the coefficient for consuming mental health drugs at ages 9 to 11 now statisticallysignificant. The pattern remains strong in Figure 2c when the sample is further limited to maternalparent and sibling deaths.
The above figures capture the incidence of purchasing any mental health drugs; we explore thespecific conditions driving these results further in Table 4. In the close relative sample (Panel B),we find that the mental health effects in middle childhood are driven primarily by increases in theconsumption of ADHD medications—a 25 percent increase in the likelihood of ever purchasing adrug to treat ADHD and a 24 percent increase in the average daily dose. Among adults in their30s, the effects are concentrated among anti-anxiety and depression medications—we see 13 and 8percent increases in the likelihood of ever purchasing drugs to treat anxiety and depression, respec-tively; and 19 and 12 percent increases in the average daily doses of anti-anxiety and depressionmedications, respectively. Panel C shows that these effects still remain in the sub-sample furtherlimited to individuals whose mothers lose a parent or a sibling. As with the impacts on the physi-cal health outcomes, we fail to detect statistically significant differences in effects across pregnancymonths of exposure (see Figure 3 for ADHD drug consumption among 9 to 11 year-olds and Figure4 for anxiety and depression drug consumption among 34 to 36 year-olds).
As we discussed in Section 2, the age pattern of mental health effects that we find is consistentwith certain features of our prescription registry data and the institutional context in Sweden. Tointerpret our results, it is important to keep in mind that we do not observe whether drugs wereever consumed by certain ages; instead, we observe the prescription drug purchases of some cohorts(i.e., those born in the late 1990s and 2000s) during early and middle childhood, of other cohorts(i.e., those born in the late 1980s and early 1990s) during high school, and of still others (i.e.,those born in the 1970s and early 1980s) during adulthood.39 As we have pointed out, ADHDprescription drugs have only been available in Sweden since 2002, and the prescription rate hasbeen steadily increasing since 2005. Thus, intuitively, the x-axes in Figure 2 indicate the age rangesof different cohorts during this “ADHD revolution.” The fact that we see the strongest effects onADHD prescription drug use among cohorts who were aged 9 to 11 during the “ADHD revolution”is also very consistent with Sweden’s guidelines that require mental health screenings of childrenat age 10, and with the direct economic incentives for schools to detect and treat ADHD amongstudents, described in detail in Section 2.
39In supplementary analyses, we explored whether there are any heterogeneous effects on birth outcomes acrossthese cohorts. We find that these cohorts experience similar adverse impacts on birth outcomes (results availableupon request).
19
In Appendix Table A11, we attempt to shed more light on this explanation. We split thesample according to the age at which different cohorts would have been at most 11 years old in2002. Specifically, the first three columns consider the consumption of any mental health drugs,any ADHD drugs, and the ADHD average dose observed at any age betwen 4 and 14 in our data,while the last three columns consider these outcomes at ages 15 to 36 in our data. Individuals whoare at most 14 years old in our data were born in 2005− 14 = 1991 or later, and were thus at most11 years old in 2002. Consequently, only individuals who are represented in the first three columnswere likely exposed to a mandated mental health screening and had access to ADHD drugs at thetime of the screening. The results demonstrate that, despite the fact that the sample size in theyounger age group is only about half that of the size of the older age group, the effects on ADHDdrug purchases are much stronger for cohorts who are observed at ages 4 to 14 in our prescriptiondata. In other words, we find positive treatment effects on the consumption of ADHD drugs onlyfor cohorts that were in elementary and middle school during the time period when ADHD drugswere available and mental health screenings were mandated in the transition between elementaryand middle school.
An alternative interpretation of the fact that we only observe impacts on ADHD among school-aged children is that symptoms of ADHD vanish over time. This story is inconsistent, however,with evidence that treatment often continues for many years once it is commenced, indicating thatsymptoms may not disappear at the end of school age, even among individuals who are treatedwith the medications.40 Thus, the absence of effects beyond school age may instead suggest thatADHD is more readily detected while children are in school, which is again consistent with schoolfinancing rules that offer schools extra transfers for pupils with special needs. Indeed, when weinteract our treatment variable with the share of municipal resources allocated based on specialeducation needs, we obtain a positive (albeit insignificant) coefficient, providing suggestive evidenceof this mechanism.41
For individuals who were already out of school when the “ADHD revolution” took place, detec-tion of mental health issues may take a longer time. In fact, it may take a “precipitating event,”such as marriage or childbirth, for one to seek mental health treatment. Consistent with this idea,in Appendix Table A12, we show that the effects on the consumption of anti-anxiety and anti-depression drugs at ages 34-36 are driven entirely by individuals who are married during thoseages.42
Overall, our results suggest that experiencing a very stressful event in utero is more deleterious40Among individuals in Sweden who begun treatment with an ADHD prescription drug in 2006, at the age of 18
to 24, approximately 50 percent remained on these drugs five years later. The figure is similar in all older age groupswhere treatment is begun before the age of 55 (Socialstyrelsen, 2012).
41We use a 2012 cross-section of municipal shares devoted to special needs education. The results are available onrequest.
42There is no effect of treatment on the likelihood of being married (results available upon request). We do nothave information on the fertility of the cohorts in our sample, and thus cannot study the effects separately by whetheror not they have children.
20
for mental health than experiencing such an event shortly post-birth. Our estimates also imply thatthe adverse mental health impacts of exposure to stress in utero are larger when the stress is moresevere, as captured by the mother losing a closer relative. The finding that adverse mental healthimpacts seem to be sensitive to the intensity of the stressor is consistent with Aizer et al. (Forth-coming)’s evidence that only the highest levels of maternal cortisol in utero impair children’s latercognitive outcomes. In contrast, we showed above that the physical health impacts are less sensitiveto the severity of stress exposure (again, consistent with evidence from Aizer et al. (Forthcoming)on birth outcomes).
5.4 Magnitudes
To gauge the plausibility of our estimates, we compare the magnitudes of our effect sizes to thosereported in the existing literature. First, our 11 gram decrease in birth weight is within theconfidence interval of Black, Devereux and Salvanes (2016)’s 23 gram decrease associated with thedeath of a maternal parent in Norway. However, we show relatively large effects on the incidence oflow-birth-weight and very-low-birth-weight births (12 percent and 24 percent, respectively), whileBlack, Devereux and Salvanes (2016) find statistically insignificant impacts on these outcomes.Additionally, Black, Devereux and Salvanes (2016) report a 12 percent increase in the likelihoodof a c-section delivery, while we only find a 3 percent increase for this outcome. The differencesbetween our estimates and those in Black, Devereux and Salvanes (2016) likely reflect differentinstitutional settings (Sweden vs. Norway), and the fact that Black, Devereux and Salvanes (2016)use a sample of siblings, while we focus on all individuals who experience a relative death in uteroor in the year after birth.
It is also informative to compare our estimates for birth outcomes to those found in studies onthe effects of natural disasters and terrorist attacks. For example, our 12 percent increase in low-birth-weight births is substantially smaller than the corresponding 40 percent increase in Torche(2011) resulting from exposure to a Chilean earthquake in a “high-intensity” region. Similarly,Eskenazi et al. (2007) find that exposure to the September 11th attacks in New York City wasassociated with a 44 percent increase in very-low-birth-weight births, a magnitude much higherthan our estimated 24 percent increase. The fact that the impacts we find are smaller than thosereported in these studies suggests that analyses of disasters and attacks may be bundling the effectsof multiple “treatments” (i.e., combining stress with the economic and physical health consequencesof these events), whereas our research design is more precisely able to isolate in utero exposure tomaternal stress.
With regard to mental health, we can compare our estimates to the two existing studies ineconomics that have examined the impacts of in utero exposure to malnutrition. Almond andMazumder (2011) find that exposure to Ramadan in utero doubles the likelihood of having amental disability in adulthood in data from Uganda and Iraq, while Adhvaryu et al. (2014) showthat a one standard deviation increase in cocoa prices (which improves nutrition during pregnancy)
21
leads to a 50 percent decrease in the likelihood of suffering from severe mental distress in adulthoodin Ghana. Our 25 percent, 13 percent, and 8 percent impacts on the take-up of ADHD, anxiety, anddepression medications, respectively, are considerably smaller. These differences in effect sizes couldarise for a number of reasons, including that we are (a) studying different institutional contexts(a high-income country with a large social safety net vs. developing countries), (b) estimatingeffects of different types of shocks (in utero exposure to maternal stress from bereavement vs.malnutrition), and (c) measuring mental health in different ways (prescription drug take-up vs.survey responses). Nevertheless, it is reassuring that our estimates are within the bounds of therecent limited literature in economics on this question.
5.5 Alternative Channels
Thus far, we have argued that the adverse physical and mental health consequences of familybereavement in utero are driven by physiological exposure to maternal stress. In particular, asdiscussed in detail in Section 4, we posit that the other consequences of a death in the family arenetted out when our comparison group consists of children who experience such a death in the yearafter birth. Additionally, we argue that the severity of stress exposure is important for affectingchild mental health. However, our method leaves room for some alternative explanations, whichwe discuss here.
Maternal Behaviors and Physical Conditions First, it is possible that a fetus is not affectedby the stress on its own, but rather by a maternal behavior or physical health condition duringpregnancy that is induced by stress. For example, if a woman responds to a stressful event by takingup smoking, developing hypertension, changing her eating habits, or adjusting her labor supply,then this may adversely affect the child. Additionally, if the mother has to travel to anotherlocation as a result of the relative’s death (e.g., to attend the funeral), and if she therefore mustgive birth in a different hospital than where she had planned to, then the child may be impacted bythis sudden hospital change. In Appendix Table A13, we examine these potential mechanisms inmore detail. We study whether the death of a relative during pregnancy is associated with changesin prenatal care, the presence of “high-risk” factors (diabetes, kidney disease, epilepsy, asthma,hypertension, or urinary infection), initiation of smoking during pregnancy, pregnancy weight gain(in kilograms), an indicator for the child’s hospital of birth being in a different municipality thanthe mother’s municipality of residence (our proxy for unplanned travel), and an indicator for themother having any positive wage income during the year of conception or the year after.43
In the overall sample, we find no effects on any of these outcomes. When we limit to theclose relative and maternal parent/sibling sub-samples, we see statistically significant reductions
43We measure any wage income in the year of conception and the year after to try to capture labor supply duringpregnancy. Unfortunately, we cannot look at a more precise measure of labor supply since our wage income data isat an annual level.
22
in the adequacy of prenatal care, as measured by the Kotelchuk Index (Kotelchuck, 1994).44 Themagnitudes of these estimates are quite small, however—for example, there is a 1 percentagepoint decline in the likelihood of the mother having adequate prenatal care in the close relativesample, relative to a sample mean of 81 percent. In practice, this effect likely translates into onemissed prenatal visit within a small fraction of the treated population (e.g., to attend the relative’sfuneral).45 Given that the number of prenatal visits has been shown to have very little effect onchildren’s health at birth (Sikorski et al., 1996; Fiscella, 1995; Evans and Lien, 2005), we do notthink that our main results could be plausibly explained by such a small reduction in prenatal care.
In sum, we believe that changes in pregnancy behaviors and conditions that we can observe areunlikely to drive our estimated effects on birth outcomes, hospitalizations during the first year oflife, and mental health in later childhood and adulthood.
Differences in Maternal Reactions to Stress Second, the mother’s own mental health mayrespond differently to a stressful event that occurs during pregnancy than to an event occurringafter giving birth. For example, relative to pregnant women, mothers of infants may, on the onehand, be less vulnerable as they can divert their attention toward childrearing; on the other hand,mothers of newborns may be prone to post-partum depression, or generally be more sensitive toadditional stressors. In Appendix Table A14, we try to examine the plausibility of this mechanismby studying maternal mental health outcomes as measured by our prescription variables. We findno evidence that experiencing a parent’s or sibling’s death during pregnancy has a differentialeffect on maternal mental health relative to experiencing such a death post-childbirth.46 Thus, ourresults suggest that the adverse effects of in utero exposure to family bereavement are not drivenby differences in maternal experiences of the event between pregnancy and post-childbirth, butrather signify the critical nature of the fetal period in propagating the effects of stress, through abiological channel, from mother to fetus.
Differential Income Shocks Third, it may be the case that any income shocks associated withthe death of a family member affect the child differently depending on whether the loss occurs duringpregnancy or if it happens shortly after childbirth. In the notation of our framework presented inSection 4, this possibility would entail that the less restrictive assumption, that of weak additiveseparability, is appropriate. Then, our estimates would capture both the effect of physiological
44The Kotelchuk Index compares the number of prenatal visits received to the number of expected visits, adjustingfor gestational age when care began and gestational age at delivery. Adequate prenatal care means that the ratio ofobserved to expected visits is at least 80%. Intermediate prenatal care means that the ratio of observed to expectedvisits is 50-79%.
45The death of a relative does not affect the likelihood that a woman is eligible for prenatal care due to the existenceof universal health insurance coverage.
46In these specifications, we study the incidence of consuming mental health medications at any point between2005 and 2014 when our drug registry data are available (i.e., we do not limit to specific age ranges of the mother).We also examined all other mental health conditions and found no effects.
23
exposure to maternal stress and the differential impact of income during pregnancy relative topost-partum.
This issue is most relevant for income shocks that affect families immediately following thedeath of a relative—for example, funeral expenses. However, in Sweden, 90 percent of all estatescan fully cover the funeral expenses, and then also leave some inheritance to the surviving relatives(Erixson and Ohlsson, 2014). Moreover, immediate income shocks may arise if, for example, when amaternal parent dies, the other maternal parent moves in with her child (the [expectant] mother). InSweden, however, co-residence between adult children and their parents or other extended familymembers is very uncommon, largely due to cultural reasons and the fact that the governmentprovides assistance for the care and financial support of the elderly. Therefore, this channel islikely not very relevant in our context.
Moreover, relative to other countries such as the U.S., income shocks—and hence their precisetiming—likely matter less in Sweden due to the extensive social security and benefits system. InAppendix Table A15, we present some indirect evidence that differential income effects are likelyunimportant in our context. In particular, if income effects were to matter in utero, then we wouldexpect them to matter more for lower-income families, which would translate into heterogeneoustreatment effects with respect to the socioeconomic status of the mother. Appendix Table A15shows the results from regressions that interact our treatment variable with an indicator for themother having a high school degree or less at the time of conception. We find no evidence thatthe impacts of in utero exposure to family bereavement are stronger for children of less-educatedmothers.
In sum, while we of course cannot rule out all potential alternative mechanisms, the evidencein this section is suggestive of maternal stress as the primary driver of our main results.
5.6 Additional Results
This section presents two sets of results that test the robustness of our main findings and explorean important maternal behavioral response. In addition, in Online Appendix D, we: presentresults from two-stage least squares specifications for our main outcomes of interest; explore thesensitivity of our findings to sample limitations based on causes of death that are determined tobe more exogenous than others; explore the heterogeneity in effects by the physical proximity ofthe mother to the deceased relative; assess an alternative interpretation of our measure of intensityof emotional stress related to the size of inheritances; and perform various additional robustnesschecks addressing the correlation between treatment, parity, and foreign-born mothers.
Adjusting for Multiple Hypothesis Testing First, an important concern for our analysis isthat we may find spurious effects due to the number of outcomes we consider. To address thisissue, we follow Kling, Liebman and Katz (2007) and create two outcome indices: one for physicalhealth and one for mental health. The physical health index consists of the 28 outcomes analyzed
24
in Tables 2, 3, A3, A5, A9, and A10, described in the notes to Table 5. The mental health indexconsists of 49 outcomes: 7 indicators for ever purchasing a mental health drug at any of the mainage categories we consider in Figure 2 (4-6, 9-11, 14-16, 19-21, 24-26, 29-31, 34-36), as well as2×3×7 = 42 other outcomes comprised of our two measures—an indicator for ever purchasing thedrug and the average daily dose—per condition (ADHD, anxiety, depression) and per age group(4-6, 9-11, 14-16, 19-21, 24-26, 29-31, 34-36).
To create the indices, we first orient each outcome such that a higher value represents a betteroutcome (e.g., the indicator for low-birth-weight is inversed such that we instead consider an indi-cator for not being low-birth-weight). Then, we standardize each oriented outcome by subtractingthe comparison group mean and dividing by the comparison group standard deviation. Finally, wetake an equally weighted average of the standardized outcomes.
Table 5 presents the results from our main specifications using the two indices as outcomes.Just like our main results, these estimates suggest that physical health is adversely affected byexposure to any relative death in utero. Mental health is also impacted, but only in the case ofsevere stress, as measured by the death of the mother’s close relative, and specifically, parent orsibling.47
Maternal Responses to In Utero Shocks: Effects on Subsequent Fertility Second, westudy whether our in utero shock of interest is correlated with an important maternal behavioralresponse: fertility. This analysis is motivated by recent work studying parental responses to fetalshocks. For example, Halla and Zweimüller (2013) find that low-education Austrian mothers whowere exposed to radiation fallout from the Chernobyl accident during pregnancy reduced theirsubsequent fertility. The authors interpret this response as a form of compensating behavior as themothers were able to allocate more resources to the affected children by reducing the quantity ofchildren that they had.
We examine maternal fertility in Appendix Table A16, which shows that women who experiencea relative death during pregnancy are more likely to have a subsequent child in our data. Sincesome women in our sample have not yet completed their childbearing years, this effect could bedriven by a retiming of births rather than an increase in lifetime fertility. Nevertheless, our findingssuggest that, unlike Austrian mothers in the context of Chernobyl, the mothers in our data do notreduce their fertility after an adverse shock during pregnancy, but instead are more likely to haveadditional children.
While our data do not allow us to better understand the mechanism behind this fertility effect,this analysis suggests caution in the interpretation of estimates from sibling fixed effects designs.The possibility of endogenous subsequent fertility suggests that comparisons of treated childrenwith younger siblings could be biased. This problem is not entirely alleviated by comparing treated
47The magnitudes of the effect sizes for the two indices are small. This is not unexpected as there are effects foronly some parts of the indices, but not others.
25
children to only their older siblings, as the older siblings are likely to be affected by the endogenouschange in family size, and they may be differentially affected than the treated children.
6 Implications for the Costs of Economically Induced Stress
Throughout this paper, we have analyzed the internal validity of our estimates by conducting avariety of robustness checks and indirect tests of mechanisms. However, it is also worth discussingwhether our results on the effects of in utero exposure to maternal stress from the death of a relativehave any external validity. In particular, in light of evidence on the intergenerational persistenceof socioeconomic status in the U.S. and other developed countries (Solon, 2001; Chetty et al.,Forthcoming; Boserup et al., 2013), and the strong socioeconomic gradient in reported stress levels(Kunz-Ebrecht et al., 2004; Cohen et al., 2006; Thompson, 2014), the question of how economicallyinduced stress can affect individual well-being across generations is of interest to both academicsand policy-makers.
Although grief-induced stress resulting from the death of a family member and stress stemmingfrom adverse economic shocks are in many ways not the same, both types of stress produce aphysiological response in the human body characterized by an increase in the level of the cortisolhormone (which controls the “fight-or-flight” response in the human body). Thus, we conduct anexploratory back-of-the-envelope calculation to “translate” our estimates into the costs of econom-ically induced stress. Specifically, we proceed in three steps. First, we use existing studies thatquantify the effect of the death of a relative on cortisol levels. Second, we use studies that quantifythe impact of adverse economic conditions on cortisol. These two steps together allow us to trans-late the impact of economic hardship on cortisol into our “relative death scale”. In the final step,we use our results to speak to how in utero exposure to maternal stress from economic hardshipmay affect long-term mental health.
The Impact of a Relative Death on Cortisol Several recent studies show that the death ofa loved one is associated with increased cortisol levels. Cortisol levels can be measured in blood(plasma) and in saliva. Because levels estimated in blood are higher than levels estimated incortisol, we distinguish between studies that use these two types of measurements.48
Irwin et al. (1988) compare morning plasma cortisol levels of women who experienced the deathof a spouse six months earlier with women in a non-bereaved control group. They find that themean plasma cortisol level is 99.3 nmol/l higher in the bereaved group.
Similarly, Pfeffer et al. (2007) compare the salivary cortisol levels of individuals who lost aparent with individuals in a non-bereaved control group. They find that the mean salivary cortisollevel is 2.75 nmol/l higher in the bereaved group, measured four months after bereavement.49
48Different studies also measure cortisol levels using different units. For the purpose of comparison, we here convertall results that we discuss to nmol/l. (Conversion rate: 1 µg/dl = 27.59 nmol/l.)
49In addition, several studies show evidence on the impact of bereavement on diurnal cortisol regulation, i.e., the
26
The Impact of Economically Induced Stress on Cortisol A number of studies presentcorrelational evidence documenting a strong socioeconomic gradient in cortisol. Individuals withlower levels of education, income, and lifetime economic status tend to have elevated cortisol whencompared to their more educated, higher income, and higher economic status counterparts (see,e.g., Cohen et al., 2006; Li et al., 2007).
There are also several studies that present more rigorous quasi-experimental and experimentalevidence on this question. In Sweden, Arnetz et al. (1991) find that individuals who were laid offin a mass layoff had blood plasma cortisol levels that were 68 nmol/l higher than individuals whowere securely employed, measured one year after the layoff. Comparing to the results in Irwinet al. (1988) discussed above, this study suggests that the impact of economically induced stressthrough unemployment on cortisol is about 69 (= 68/99) percent of the impact of the death of aclose relative.
Similarly, in a developing country context, Haushofer and Shapiro (2013) conduct a random-ized controlled trial that investigates the impact of poverty on stress by randomly allocating cashtransfers to households. They find that cortisol levels are 2.03 nmol/l lower in households thatreceived large transfers ($1525) than in households that received small transfers ($404). The dif-ference corresponds to a substantial income effect, given that Kenya’s GDP per capita was $1184in 2012, at the time of the intervention.50 Comparing to the results in Pfeffer et al. (2007), thisestimate suggests that the effect of economically induced stress through lower income on cortisol isabout 74 (= 2.03/2.75) percent of the impact of the death of a close relative.
Economically Induced Stress In Utero and Later Mental Health Using the above esti-mate that the impact on cortisol from a layoff is approximately 69 percent of the impact of thedeath of a close relative, we can calculate how in utero exposure to maternal economically inducedstress (resulting from unemployment) might affect the future mental health of the unborn child.This calculation implies that in utero exposure to stress from maternal unemployment induces a17.3 (= 0.69 ∗ 25) percent increase in the likelihood of ever purchasing a drug to treat ADHD inmiddle childhood, and a 16.6 (= 0.69 ∗ 24) percent increase in the average daily dose. Further,among adults in their 30s, the calculations suggest that in utero exposure to stress from maternalunemployment leads to 9 (= 0.69 ∗ 13) and 5.5 (= 0.69 ∗ 8) percent increases in the likelihoodsof ever purchasing drugs to treat anxiety and depression, respectively; and in 13.1 (= 0.69 ∗ 19)and 8.3 (= 0.69 ∗ 12) percent increases in the average daily doses of anti-anxiety and depression
ability of cortisol to be broken down over the course over the day. The evidence suggests that, recently bereavedindividuals not only have higher morning cortisol levels, but also experience a flatter slope during the course of theday (meaning that cortisol falls less during the day). See Dietz et al. (2013) on the impact on cortisol regulation ofthe loss of a parent and Holland et al. (2014) on the impact of the loss of a spouse. Further, O’Connor et al. (2012)examine diurnal cortisol production patterns in women who have experienced the death of different relatives, andfind that more intense grieving is associated with a flatter slope across the day.
50GDP Per Capita in current US $ is available at: http://data.worldbank.org/indicator/NY.GDP.PCAP.CD
27
medications.51
Of course, these back-of-the-envelope calculations rely on a strong assumption of linearity inthe effect of cortisol. Nevertheless, this exercise implies that the effects of economically inducedstress on the mental health of the next generation could be quite large.
7 Conclusion
This paper analyzes whether the uterine environment propagates the impact of stress across gen-erations. We exploit multigenerational registers in Sweden to create family trees that span fourgenerations, and study how deaths of family members during pregnancy affect the unborn child.Unlike other studies of shocks to the prenatal environment, our empirical strategy isolates the effectof physiological fetal exposure to stress by comparing the outcomes of children whose relatives diewhile they are in utero to those whose relatives die in the year after birth.
We find that in utero exposure to the death of a relative up to three generations apart negativelyaffects physical health at birth and in the first year of life. We also provide novel evidence that severeantenatal stress—as measured by bereavement of closer family members—has causal impacts on theonset of psychological conditions, including ADHD during childhood and anxiety and depression inadulthood. Our findings suggest large general welfare gains of preventing fetal exposure to severestress: for example, based on the 2008 figure for the U.S. market, the 8 percent decrease in theconsumption of prescription drugs treating depression alone can be valued at $800 million per year.
While our findings may not generalize to all other possible sources of stress, we believe thatwe make some important headway toward understanding the potentially far-reaching consequencesof stress during pregnancy. This is pertinent in light of the fact that stress is a growing healthproblem around the world. For example, according to recent survey evidence from the U.S. usinga 10-item Perceived Stress Scale, women’s average stress levels have increased by about 18 percentbetween 1983 and 2009 (Cohen and Janicki-Deverts, 2012). Concurrently, over these last fewdecades, mental health diagnoses and prescription drug use among both children and adults haverisen substantially. For instance, a recent study by the Centers for Disease Control and Preventionshows that antidepressant consumption among individuals aged 12 years or older has increased by400 percent from 1988 to 2008.52 Certainly, it is likely that some of the growth in antidepressantuse is driven by increases in diagnoses and in the availability of prescription drugs. Nevertheless,our results present some of the first evidence on a causal link between these two trends in thepopulation—the prevalence of stress and the incidence of mental health issues—perpetuated by thefetal environment.
The presence of such a causal link may point to novel avenues for curbing the high and rapidly51If we instead use the estimated relationship between household income and cortisol in the context of Kenya, we
obtain very similar impacts of in utero exposure to maternal stress due to poverty.52See http://www.cdc.gov/nchs/data/databriefs/db76.htm for more details.
28
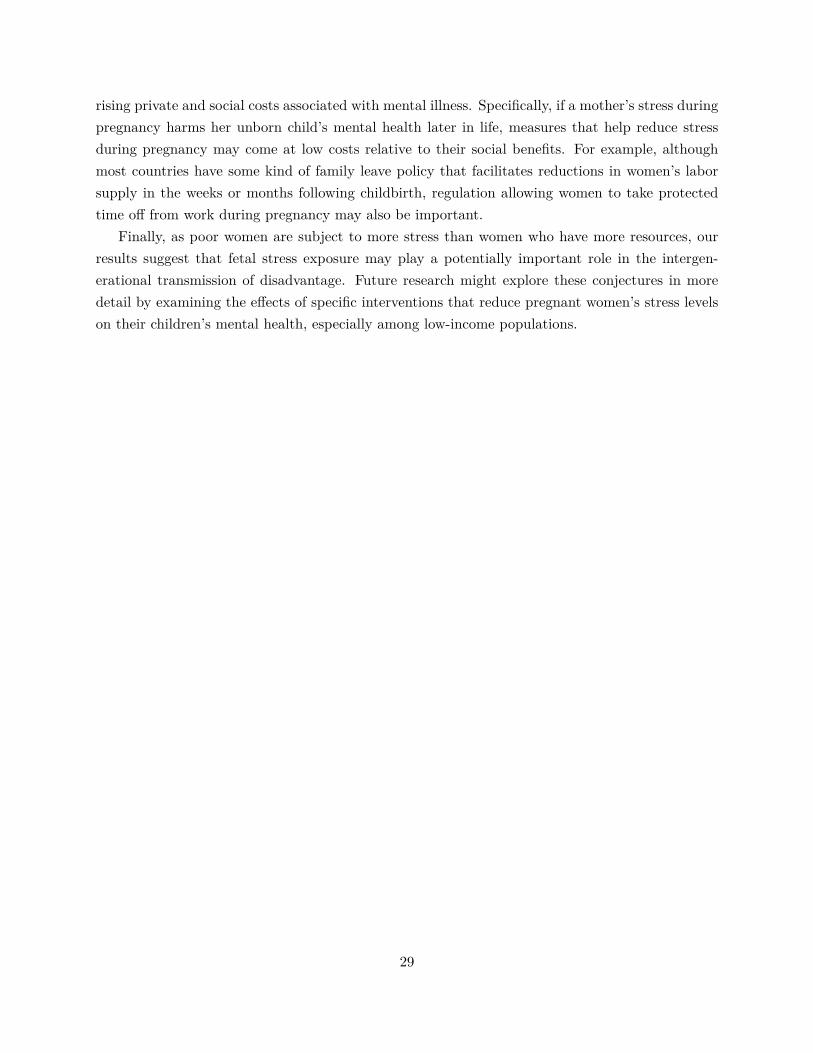
rising private and social costs associated with mental illness. Specifically, if a mother’s stress duringpregnancy harms her unborn child’s mental health later in life, measures that help reduce stressduring pregnancy may come at low costs relative to their social benefits. For example, althoughmost countries have some kind of family leave policy that facilitates reductions in women’s laborsupply in the weeks or months following childbirth, regulation allowing women to take protectedtime off from work during pregnancy may also be important.
Finally, as poor women are subject to more stress than women who have more resources, ourresults suggest that fetal stress exposure may play a potentially important role in the intergen-erational transmission of disadvantage. Future research might explore these conjectures in moredetail by examining the effects of specific interventions that reduce pregnant women’s stress levelson their children’s mental health, especially among low-income populations.
29

ReferencesAdda, Jérôme, Anders Björklund, and Helena Holmlund, “The Role of Mothers and Fathers in
Providing Skills: Evidence from Parental Deaths,” Discussion Paper 5425, Institute for the Study ofLabor (IZA) 2011.
Adhvaryu, Achyuta, James Fenske, and Anant Nyshadham, “Early Life Circumstance and AdultMental Health,” 2014. University of Michigan, Working Paper.
Aizer, Anna and Janet Currie, “The intergenerational transmission of inequality: Maternal disadvantageand health at birth,” Science, 2014, 344 (6186), 856–861.
, Laura Stroud, and Stephen Buka, “Maternal stress and child well-being: Evidence from siblings,”Journal of Human Resources, Forthcoming.
Almond, D., “Is the 1918 Influenza pandemic over? Long-term e�ects of in utero Influenza exposure in thepost-1940 US population,” Journal of Political Economy, 2006, 114 (4), 672–712.
and B. Mazumder, “Health Capital and the Prenatal Environment: The E�ect of Ramadan Observanceduring Pregnancy,” American Economic Journal: Applied Economics, 2011, 3 (4), 56–85.
and J. Currie, “Human Capital Development before Age Five,” in O. Ashenfleter and D. Card, eds.,Handbook of Labor Economics, Vol. 4, Elsevier, 2011, pp. 1315–1486.
Almond, Douglas and Bhashkar Mazumder, “Fetal origins and Parental Responses,” Working Paper2012-14, Federal Reserve Board of Chicago 2012.
, Hilary W Hoynes, and Diane Whitmore Schanzenbach, “Inside the war on poverty: The impactof food stamps on birth outcomes,” The Review of Economics and Statistics, 2011, 93 (2), 387–403.
, Lena Edlund, and Mårten Palme, “Chernobyl’s Subclinical Legacy: Prenatal Exposure to Radioac-tive Fallout and School Outcomes in Sweden,” The Quarterly Journal of Economics, November 2009, 124(4), 1729–1772.
, , Hongbin Li, and Junsen Zhang, “Long-Term E�ects of Early-Life Development: Evidence fromthe 1959 to 1961 China Famine,” in “The Economic Consequences of Demographic Change in East Asia,NBER-EASE Volume 19,” University of Chicago Press, 2010, pp. 321–345.
Arnetz, B. B., S. O. Brenner, L. Levi, R. Hjelm, I. L. Petterson, J. Wasserman, B. Petrini,P. Eneroth, A. Kallner, and R. Kvetnansky, “Neuroendocrine and immunologic e�ects of unem-ployment and job insecurity,” Psychother Psychosom, 1991, 55 (2-4), 76–80.
Barker, David J, “The fetal and infant origins of adult disease,” BMJ: British Medical Journal, 1990, 301(6761), 1111.
Barreca, Alan I, “The long-term economic impact of in utero and postnatal exposure to malaria,” Journalof Human Resources, 2010, 45 (4), 865–892.
Berkowitz, Gertrud S, Mary S Wol�, Teresa M Janevic, Ian R Holzman, Rachel Yehuda, andPhilip J Landrigan, “The World Trade Center disaster and intrauterine growth restriction,” Jama,2003, 290 (5), 595–596.
Berquin, P. C., J. N. Giedd, L. K. Jacobsen, S. D. Hamburger, A. L. Krain, J. L. Rapoport,and F. X. Castellanos, “Cerebellum in attention-deficit hyperactivity disorder: A morphometric MRIstudy,” Neurology, 1998, 50 (4), 1087–1093.
Black, Sandra E, Aline Butikofer, Paul J Devereux, and Kjell G Salvanes, “This Is Only a Test?Long-Run Impacts of Prenatal Exposure to Radioactive Downfall,” NBER Working Paper 18987, 2013.
, Paul J Devereux, and Kjell G. Salvanes, “Does Grief Transfer across Generations? Bereavementsduring Pregnancy and Child Outcomes,” American Economic Journal: Applied Economics, 2016, 8 (1).
Boserup, Simon, Claus Kreiner, and Wojciech Kopczuk, “Intergenerational Wealth Mobility: Evi-dence from Danish Wealth Records of Three Generations,” 2013. Columbia University, Working Paper.
30

Chetty, Raj, Nathaniel Hendren, Patrick Kline, and Emmanuel Saez, “Where is the Land ofOpportunity? The Geography of Intergenerational Mobility in the United States,” Quarterly Journal ofEconomics, Forthcoming.
Cnattingius, Sven, E Villamor, YT Lagerros, Anna-Karin Wikström, and Fredrik Granath,“High birth weight and obesity—a vicious circle across generations,” International Journal of Obesity,2012, 36 (10), 1320–1324.
Cogill, SR, HL Caplan, Heather Alexandra, Kay Mordecai Robson, and R Kumar, “Impactof maternal postnatal depression on cognitive development of young children.,” BMJ, 1986, 292 (6529),1165–1167.
Cohen, S., W. J. Doyle, and A. Baum, “Socioeconomic status is associated with stress hormones,”Psychosom Med, 2006, 68 (3), 414–420.
Cohen, Sheldon and Denise Janicki-Deverts, “Who’s stressed? Distributions of psychological stress inthe United States in probability samples from 1983, 2006, and 2009,” Journal of Applied Social Psychology,2012, 42 (6), 1320–1334.
Currie, Janet, “Inequality at Birth: Some Causes and Consequences,” The American Economic Review,2011, 101 (3), 1–22.
and Maya Rossin-Slater, “Weathering the storm: Hurricanes and birth outcomes,” Journal of HealthEconomics, 2013, 32 (3), 487 – 503.
den Bergh BRH, Marcoen A. Van, “High antenatal maternal anxiety is related to ADHD symptoms,externalizing problems and anxiety in 8/9-year-olds,” Child Development, 2004, 75 (4), 1085:1097.
den Bergh BRH Mennes M, Oosterlaan J Stevens V Stiers P Marcoen A Lagae L. Van, “Highantenatal maternal anxiety is related to impulsivity during performance on cognitive tasks in 14- and15-year-olds,” Neuroscience and biobehavioral reviews, 2005, 29 (2), 259:269.
Dickstein, Michael J., “E�cient Provision of Experience Goods: Evidence from Antidepressant Choice,”2014. Stanford University, Working Paper.
Dietz, L. J., S. Stoyak, N. Melhem, G. Porta, K. A. Matthews, M. Walker Payne, and D. A.Brent, “Cortisol response to social stress in parentally bereaved youth,” Biol. Psychiatry, Feb 2013, 73(4), 379–387.
Duggan, Mark and Scott A. Imberman, Why Are the Disability Rolls Skyrocketing? The Contribution ofPopulation Characteristics, Economic Conditions, and Program Generosity, University of Chicago Press,January
Duncan, Brian, Hani Mansour, and Daniel I Rees, “Prenatal Stress and Low Birth Weight: Evidencefrom the Super Bowl,” Discussion Paper 9053, Institute for the Study of Labor (IZA) 2015.
Erixson, Oscar and Henry Ohlsson, “Estate division: Equal sharing as choice, social norm, and legalrequirement,” Uppsala University Department of Economics Working Paper, 2014.
Eskenazi, Brenda, Amy R Marks, Ralph Catalano, Tim Bruckner, and Paolo G Toniolo, “Lowbirthweight in New York City and upstate New York following the events of September 11th,” HumanReproduction, 2007, 22 (11), 3013–3020.
Evans, William N and Diana S Lien, “The benefits of prenatal care: evidence from the PAT bus strike,”Journal of Econometrics, 2005, 125 (1), 207–239.
Field, Ti�any, “Maternal depression e�ects on infants and early interventions,” Preventive medicine, 1998,27 (2), 200–203.
Fiscella, Kevin, “Does prenatal care improve birth outcomes? A critical review,” Obstetrics & Gynecology,1995, 85 (3), 468–479.
Försäkringskassan, “Föräldrapenning: Analys av användandet 1974 - 2011,” Socialförsäkringsrapport,2012, (9), 1 – 64.
31

Glynn, Laura M, Pathik D Wadhwa, Christine Dunkel-Schetter, Aleksandra Chicz-DeMet, andCurt A Sandman, “When stress happens matters: e�ects of earthquake timing on stress responsivityin pregnancy,” American journal of obstetrics and gynecology, 2001, 184 (4), 637–642.
Halla, Martin and Martina Zweimüller, “Parental Response to Early Human Capital Shocks: Evidencefrom the Chernobyl Accident,” Discussion Paper 7968, Institute for the Study of Labor (IZA) 2013.
Haushofer, Johannes and Jeremy Shapiro, “Household response to income changes: Evidence from anunconditional cash transfer program in Kenya.,” Mimeo, MIT, 2013.
Hjörne, Eva, “Det har skett en stor förändring hemma,” Elevidentitet, föräldrars motstånd och ADHD iden svenska skolan. Utbildning & demokrati, 2012, pp. 91–96.
Holland, J. M., V. Rozalski, K. L. Thompson, R. J. Tiongson, A. F. Schatzberg, R. O’Hara,and D. Gallagher-Thompson, “The unique impact of late-life bereavement and prolonged grief ondiurnal cortisol,” J Gerontol B Psychol Sci Soc Sci, Jan 2014, 69 (1), 4–11.
Hoynes, Hilary, Marianne Page, and Ann Hu� Stevens, “Can targeted transfers improve birthoutcomes?: Evidence from the introduction of the WIC program,” Journal of Public Economics, 2011, 95(7), 813–827.
Hoynes, H.W., D.W. Schanzenbach, and D. Almond, “Long Run Impacts of Childhood Access tothe Safety Net,” Technical Report, National Bureau of Economic Research 2012.
Irwin, Michael, Marcia Daniels, S. Craig Risch, Eda Bloom, and Herbert Weiner, “Plasmacortisol and natural killer cell activity during bereavement,” Biological Psychiatry, 1988, 24 (2), 173 –178.
Isen, Adam, Maya Rossin-Slater, and Reed Walker, “Every Breath You Take — Every Dollar You’llMake: The Long-Term Consequences of the Clean Air Act of 1970,” Journal of Political Economy, Forth-coming.
Kling, Je�rey R, Je�rey B Liebman, and Lawrence F Katz, “Experimental analysis of neighborhoode�ects,” Econometrica, 2007, 75 (1), 83–119.
Kotelchuck, Milton, “An evaluation of the Kessner Adequacy of Prenatal Care Index and a proposedAdequacy of Prenatal Care Utilization Index.,” American journal of public health, 1994, 84 (9), 1414–1420.
Kunz-Ebrecht, Sabine, Clemens Kirschbaum, and Andrew Steptoe, “Work Stress, SocioeconomicStatus and Neuroendocrine Activation Over the Working Day,” Social Science and Medicine, 2004, 58,1523–1530.
Lauderdale, Diane S, “Birth outcomes for Arabic-named women in California before and after September11,” Demography, 2006, 43 (1), 185–201.
Lederman, Sally Ann, Virginia Rauh, Lisa Weiss, Janet L Stein, Lori A Hoepner, Mark Becker,and Frederica P Perera, “The e�ects of the World Trade Center event on birth outcomes among termdeliveries at three lower Manhattan hospitals,” Environmental Health Perspectives, 2004, pp. 1772–1778.
Li, L., C. Power, S. Kelly, C. Kirschbaum, and C. Hertzman, “Life-time socio-economic positionand cortisol patterns in mid-life,” Psychoneuroendocrinology, Aug 2007, 32 (7), 824–833.
Liu, Li, Ling-Li Zeng, Yaming Li, Qiongmin Ma, Baojuan Li, Hui Shen, and Dewen Hu, “AlteredCerebellar Functional Connectivity with Intrinsic Connectivity Networks in Adults with Major DepressiveDisorder,” PLoS ONE, 06 2012, 7, e39516.
Malaspina, D, C Corcoran, KR Kleinhaus, MC Perrin, S Fennig, D Nahon, Y Freidlander,and S Harlap, “Acute maternal stress in pregnancy and schizophrenia in o�spring: A cohort prospectivestudy,” BMC Psychiatry, 2008, 8 (71), 1473–1491.
Mansour, Hani and Daniel I Rees, “Armed conflict and birth weight: Evidence from the al-AqsaIntifada,” Journal of Development Economics, 2012, 99 (1), 190–199.
Martins, Carla and Elizabeth A Ga�an, “E�ects of early maternal depression on patterns of infant–mother attachment: A meta-analytic investigation,” Journal of Child Psychology and Psychiatry, 2000,41 (06), 737–746.
32
McClellan, Jack M, Ezra Susser, and Mary-Claire King, “Maternal famine, de novo mutations, andschizophrenia,” JAMA, 2006, 296 (5), 582–584.
McIntyre, Peter and Julie Leask, “Improving uptake of MMR vaccine,” British Medical Journal, 4 2008,336 (7647), 729–730.
N., Melissa L. Danielson Rebecca H. Bitsko Joseph R. Holbrook Michael D. Kogan Reem M.Ghandour Ruth Perou Stephen J. Blumberg Visser Susanna, “Trends in the Parent-Report ofHealth Care Provider-Diagnosed and Medicated Attention-Deficit/Hyperactivity Disorder: United States,2003-2011,” Journal of The American Academy of Child & Adolescent Psychiatry, 2014.
Neugebauer, Richard, Hans Wijbrand Hoek, and Ezra Susser, “Prenatal exposure to wartimefamine and development of antisocial personality disorder in early adulthood,” JAMA, 1999, 282 (5),455–462.
O’Connor, M. F., D. K. Wellisch, A. L. Stanton, R. Olmstead, and M. R. Irwin, “Diurnal cortisolin Complicated and Non-Complicated Grief: slope di�erences across the day,” Psychoneuroendocrinology,May 2012, 37 (5), 725–728.
Pfe�er, Cynthia R., Margaret Altemus, Moonseong Heo, and Hong Jiang, “Salivary Cortisol andPsychopathology in Children Bereaved by the September 11, 2001 Terror Attacks,” Biological Psychiatry,2007, 61 (8), 957 – 965.
Rossin-Slater, Maya, “WIC in your neighborhood: New evidence on the impacts of geographic access toclinics,” Journal of Public Economics, 2013, 102 (0), 51 – 69.
Sanders, Nicholas J and Charles Stoecker, “Where Have All the Young Men Gone? Using GenderRatios to Measure Fetal Death Rates,” Working Paper 17434, National Bureau of Economic Research2011.
Sanders, N.J., “What Doesn’t Kill You Makes You Weaker: Prenatal Pollution Exposure and EducationalOutcomes,” Journal of Human Resources, 2012, 47 (3), 826–850.
Scholte, Robert S., Gerard J. van den Berg, and Maarten Lindeboom, “The Long-Run E�ectsof Gestation During the Dutch Hunger Winter Famine on Labor Market and Hospitalization Outcomes,”Discussion Paper 6307, Institute for the Study of Labor (IZA) 2012.
Segal, Nancy L. and Thomas J. Bouchard, “Grief Intensity Following the Loss of a Twin and OtherRelatives: Test of Kinship Genetic Hypotheses,” Human Biology, 1993, 65 (1), 111187 – 105.
Sikorski, Jim, Jennifer Wilson, Sarah Clement, Sarah Das, and Nigel Smeeton, “A randomisedcontrolled trial comparing two schedules of antenatal visits: the antenatal care project,” BMJ, 3 1996,312 (7030), 546–553.
Simeonova, Emilia, “Out of Sight, Out of Mind? Natural Disasters and Pregnancy Outcomes in the USA,”CESifo Economic Studies, 2011, 57 (3), 403:431.
Simon, Sara L, Catherine Domier, Jennifer Carnell, Paul Brethen, Richard Rawson, andWalter Ling, “Cognitive impairment in individuals currently using methamphetamine,” The AmericanJournal on Addictions, 2000, 9 (3), 222–231.
Socialstyrelsen, “Socialstyrelsens riktlinjer för skolhälsovården,” Socialstyrelsens Rapporter, 2002.
, “Användning av centralstimulantia vid adhd,” Socialstyrelsens Rapporter, 2012.
, “Läkemedel – statistik fö år 2012,” Socialstyrelsens Rapporter, 2013.
, “Förskrivning av centralstimulerande läkemedel vid adhd,” Socialstyrelsens Rapporter, 2015.
Solon, Gary, “Intergenerational Mobility in the Labor Market,” in O. Ashenfleter and D. Card, eds.,Handbook of Labor Economics, Vol. 3, Elsevier, 2001, pp. 71–79.
Stoner, Rich, Maggie L. Chow, Maureen P. Boyle, Susan M. Sunkin, Peter R. Mouton, Subho-jit Roy, Anthony Wynshaw-Boris, Sophia A. Colamarino, Ed S. Lein, and Eric Courchesne,“Patches of Disorganization in the Neocortex of Children with Autism,” New England Journal of Medicine,2014, 370 (13), 1209–1219. PMID: 24670167.
33

Susser, Ezra, Richard Neugebauer, Hans W Hoek, Alan S Brown, Shang Lin, Daniel Labovitz,and Jack M Gorman, “Schizophrenia after prenatal famine: further evidence,” Archives of generalpsychiatry, 1996, 53 (1), 25.
Susser, Ezra S and Shang P Lin, “Schizophrenia after prenatal exposure to the Dutch Hunger Winterof 1944-1945,” Archives of general psychiatry, 1992, 49 (12), 983.
Tan, Cong E, Hong Jun Li, Xian Geng Zhang, Hui Zhang, Pei Yu Han, Qu An, Wei Jun Ding,and Mi Qu Wang, “The impact of the Wenchuan earthquake on birth outcomes,” PLoS One, 2009, 4(12), e8200.
Thompson, Ross, “Stress and Child Development,” The Future of Children, 2014, 24 (1), 41–59.
Torche, Florencia, “The e�ect of maternal stress on birth outcomes: exploiting a natural experiment,”Demography, 2011, 48 (4), 1473–1491.
Van den Berg, G. J., M. Lindeboom, and F. Portrait, “Economic Conditions Early in Life andIndividual Mortality,” American Economic Review, 2006, 96, 290–302.
Welberg, Lam, Jonathan Sekl, and Megan Homes, “Prenatal Glucocorticoid Programming of BrianCorticosteroid Receptors and Corticotrophin-Releasing Hormone: Possible Implications for Behaviour,”Neuroscience, 2001, 104, 71–79.
34
8 Figures
Figure 1: Effect of Relative Death on the Incidence of the Child Being Born Low-Birth-Weight
Notes: The sample includes all children whose mother loses a family member—a sibling, a parent, a grandparent, thechild’s father, or an own (older) child—within 280 days of the child’s estimated date of conception or in the year afterbirth. To assign exposure to treatment, we first calculate each child’s estimated date of conception by subtractingthe number of gestation days from the date of birth. This figure plots the coefficients (and 95% confidence intervalsin dashed blue lines) on the effects of the death of a relative during the 1st-9th months of pregnancy. The omittedcategory is an indicator for the relative death occurring after 280 days (40 weeks) of gestation (i.e., post-childbirthin most cases). The outcome is an indicator for the child being born low-birth-weight.
35
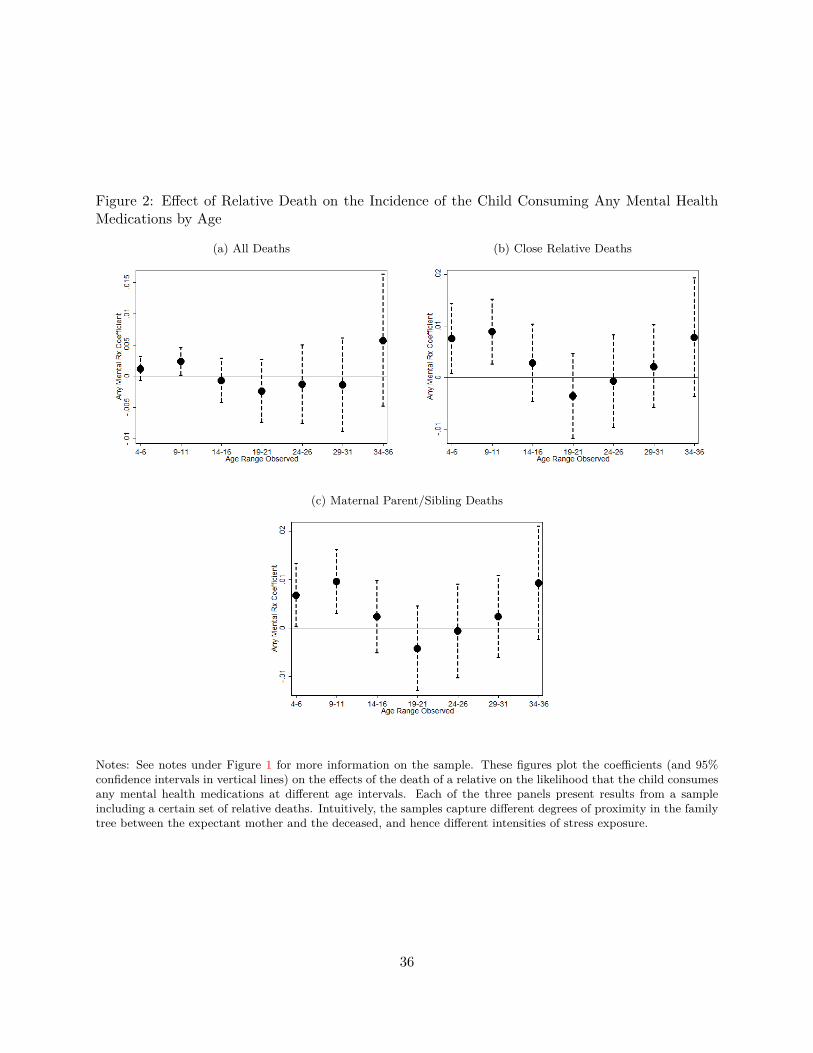
Figure 2: Effect of Relative Death on the Incidence of the Child Consuming Any Mental HealthMedications by Age
(a) All Deaths (b) Close Relative Deaths
(c) Maternal Parent/Sibling Deaths
Notes: See notes under Figure 1 for more information on the sample. These figures plot the coefficients (and 95%confidence intervals in vertical lines) on the effects of the death of a relative on the likelihood that the child consumesany mental health medications at different age intervals. Each of the three panels present results from a sampleincluding a certain set of relative deaths. Intuitively, the samples capture different degrees of proximity in the familytree between the expectant mother and the deceased, and hence different intensities of stress exposure.
36
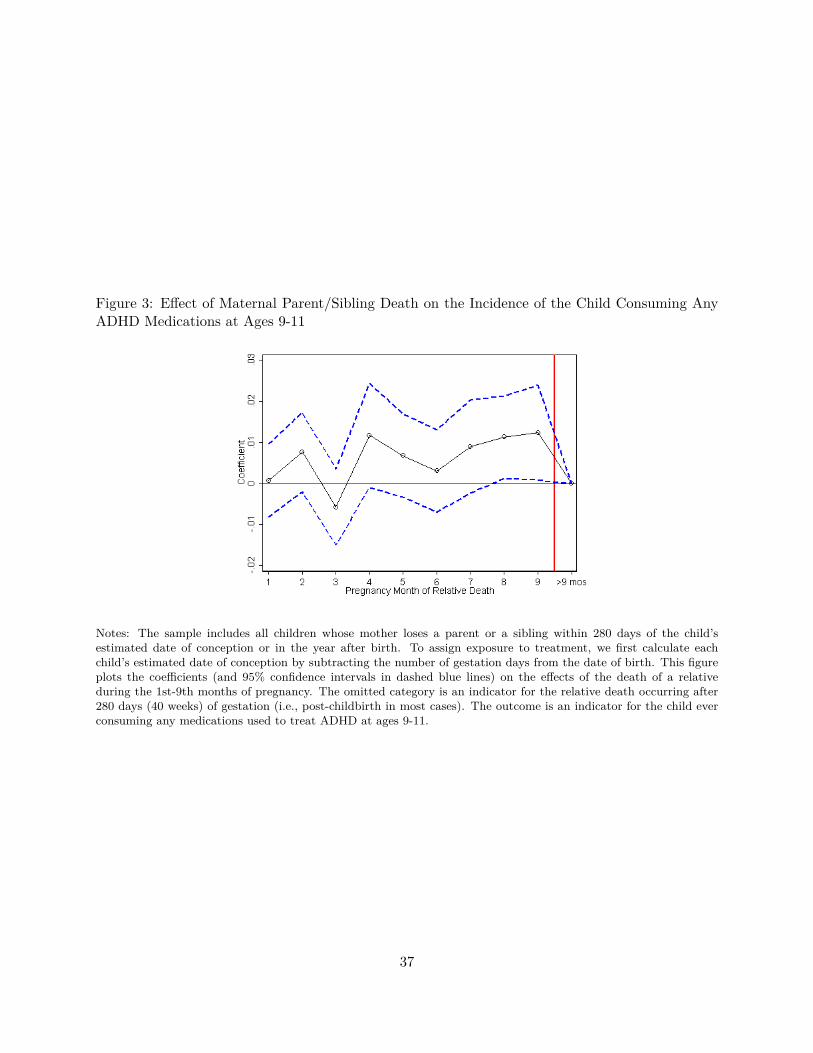
Figure 3: Effect of Maternal Parent/Sibling Death on the Incidence of the Child Consuming AnyADHD Medications at Ages 9-11
Notes: The sample includes all children whose mother loses a parent or a sibling within 280 days of the child’sestimated date of conception or in the year after birth. To assign exposure to treatment, we first calculate eachchild’s estimated date of conception by subtracting the number of gestation days from the date of birth. This figureplots the coefficients (and 95% confidence intervals in dashed blue lines) on the effects of the death of a relativeduring the 1st-9th months of pregnancy. The omitted category is an indicator for the relative death occurring after280 days (40 weeks) of gestation (i.e., post-childbirth in most cases). The outcome is an indicator for the child everconsuming any medications used to treat ADHD at ages 9-11.
37
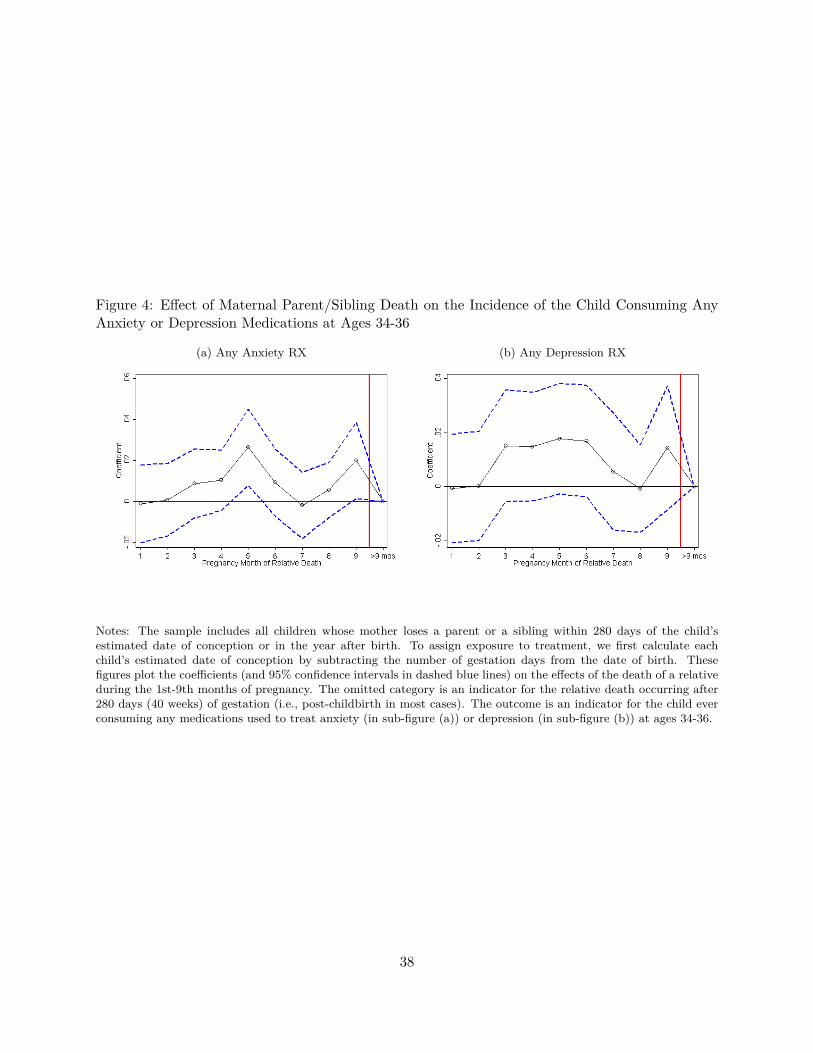
Figure 4: Effect of Maternal Parent/Sibling Death on the Incidence of the Child Consuming AnyAnxiety or Depression Medications at Ages 34-36
(a) Any Anxiety RX (b) Any Depression RX
Notes: The sample includes all children whose mother loses a parent or a sibling within 280 days of the child’sestimated date of conception or in the year after birth. To assign exposure to treatment, we first calculate eachchild’s estimated date of conception by subtracting the number of gestation days from the date of birth. Thesefigures plot the coefficients (and 95% confidence intervals in dashed blue lines) on the effects of the death of a relativeduring the 1st-9th months of pregnancy. The omitted category is an indicator for the relative death occurring after280 days (40 weeks) of gestation (i.e., post-childbirth in most cases). The outcome is an indicator for the child everconsuming any medications used to treat anxiety (in sub-figure (a)) or depression (in sub-figure (b)) at ages 34-36.
38
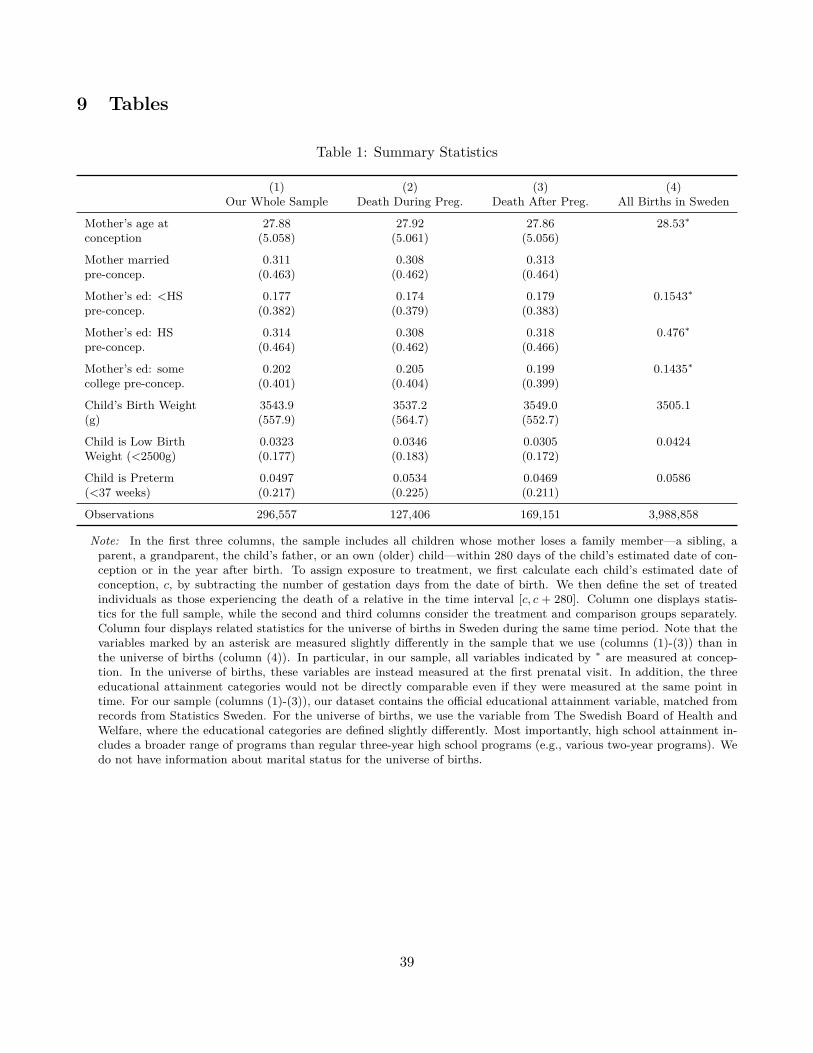
9 Tables
Table 1: Summary Statistics
(1) (2) (3) (4)Our Whole Sample Death During Preg. Death After Preg. All Births in Sweden
Mother’s age at 27.88 27.92 27.86 28.53∗conception (5.058) (5.061) (5.056)
Mother married 0.311 0.308 0.313pre-concep. (0.463) (0.462) (0.464)
Mother’s ed: <HS 0.177 0.174 0.179 0.1543∗pre-concep. (0.382) (0.379) (0.383)
Mother’s ed: HS 0.314 0.308 0.318 0.476∗pre-concep. (0.464) (0.462) (0.466)
Mother’s ed: some 0.202 0.205 0.199 0.1435∗college pre-concep. (0.401) (0.404) (0.399)
Child’s Birth Weight 3543.9 3537.2 3549.0 3505.1(g) (557.9) (564.7) (552.7)
Child is Low Birth 0.0323 0.0346 0.0305 0.0424Weight (<2500g) (0.177) (0.183) (0.172)
Child is Preterm 0.0497 0.0534 0.0469 0.0586(<37 weeks) (0.217) (0.225) (0.211)
Observations 296,557 127,406 169,151 3,988,858
Note: In the first three columns, the sample includes all children whose mother loses a family member—a sibling, aparent, a grandparent, the child’s father, or an own (older) child—within 280 days of the child’s estimated date of con-ception or in the year after birth. To assign exposure to treatment, we first calculate each child’s estimated date ofconception, c, by subtracting the number of gestation days from the date of birth. We then define the set of treatedindividuals as those experiencing the death of a relative in the time interval [c, c + 280]. Column one displays statis-tics for the full sample, while the second and third columns consider the treatment and comparison groups separately.Column four displays related statistics for the universe of births in Sweden during the same time period. Note that thevariables marked by an asterisk are measured slightly differently in the sample that we use (columns (1)-(3)) than inthe universe of births (column (4)). In particular, in our sample, all variables indicated by ∗ are measured at concep-tion. In the universe of births, these variables are instead measured at the first prenatal visit. In addition, the threeeducational attainment categories would not be directly comparable even if they were measured at the same point intime. For our sample (columns (1)-(3)), our dataset contains the official educational attainment variable, matched fromrecords from Statistics Sweden. For the universe of births, we use the variable from The Swedish Board of Health andWelfare, where the educational categories are defined slightly differently. Most importantly, high school attainment in-cludes a broader range of programs than regular three-year high school programs (e.g., various two-year programs). Wedo not have information about marital status for the universe of births.
39
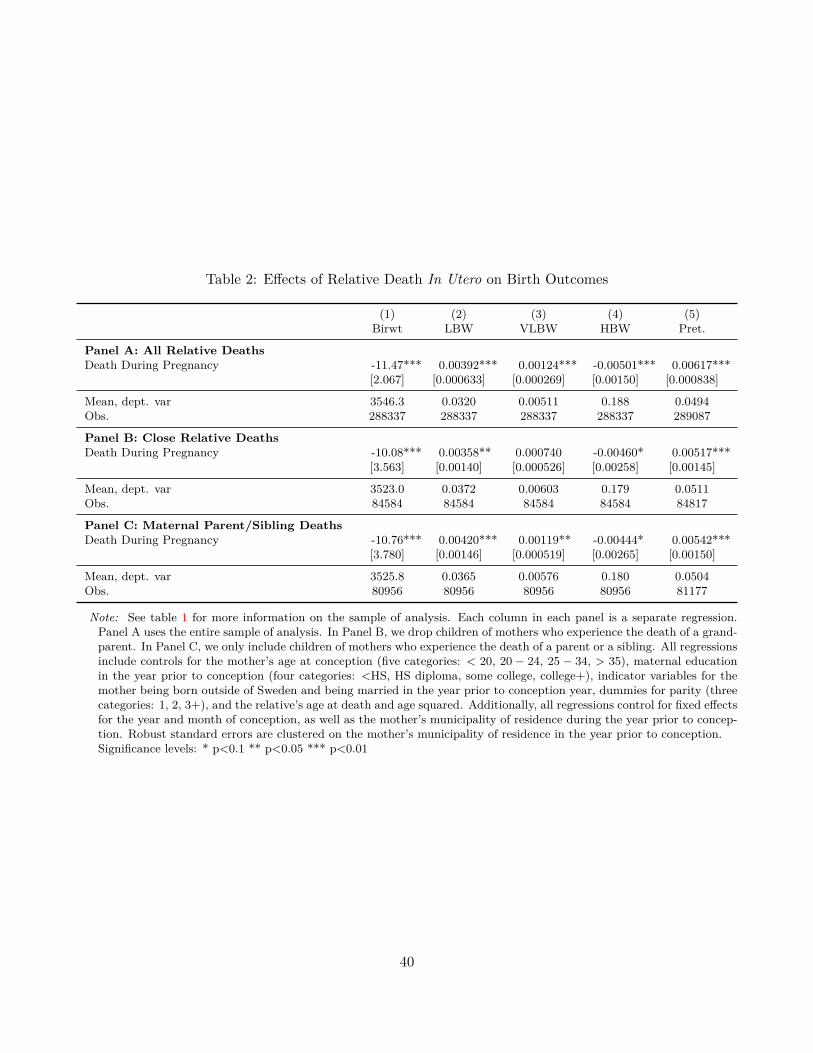
Table 2: Effects of Relative Death In Utero on Birth Outcomes
(1) (2) (3) (4) (5)Birwt LBW VLBW HBW Pret.
Panel A: All Relative DeathsDeath During Pregnancy -11.47*** 0.00392*** 0.00124*** -0.00501*** 0.00617***
[2.067] [0.000633] [0.000269] [0.00150] [0.000838]
Mean, dept. var 3546.3 0.0320 0.00511 0.188 0.0494Obs. 288337 288337 288337 288337 289087
Panel B: Close Relative DeathsDeath During Pregnancy -10.08*** 0.00358** 0.000740 -0.00460* 0.00517***
[3.563] [0.00140] [0.000526] [0.00258] [0.00145]
Mean, dept. var 3523.0 0.0372 0.00603 0.179 0.0511Obs. 84584 84584 84584 84584 84817
Panel C: Maternal Parent/Sibling DeathsDeath During Pregnancy -10.76*** 0.00420*** 0.00119** -0.00444* 0.00542***
[3.780] [0.00146] [0.000519] [0.00265] [0.00150]
Mean, dept. var 3525.8 0.0365 0.00576 0.180 0.0504Obs. 80956 80956 80956 80956 81177
Note: See table 1 for more information on the sample of analysis. Each column in each panel is a separate regression.Panel A uses the entire sample of analysis. In Panel B, we drop children of mothers who experience the death of a grand-parent. In Panel C, we only include children of mothers who experience the death of a parent or a sibling. All regressionsinclude controls for the mother’s age at conception (five categories: < 20, 20 − 24, 25 − 34, > 35), maternal educationin the year prior to conception (four categories: <HS, HS diploma, some college, college+), indicator variables for themother being born outside of Sweden and being married in the year prior to conception year, dummies for parity (threecategories: 1, 2, 3+), and the relative’s age at death and age squared. Additionally, all regressions control for fixed effectsfor the year and month of conception, as well as the mother’s municipality of residence during the year prior to concep-tion. Robust standard errors are clustered on the mother’s municipality of residence in the year prior to conception.Significance levels: * p<0.1 ** p<0.05 *** p<0.01
40

Table 3: Effects of Relative Death In Utero on Hospitalizations by Age 1
(1) (2) (3) (4)Any Hosp Tot Hosp Any Hosp-Peri. Tot Hosp-Peri.
Panel A: All Relative DeathsDeath During Pregnancy 0.00192** 0.00148 0.00351*** 0.00294***
[0.000924] [0.00176] [0.000892] [0.00107]
Mean, dept. var 0.0737 0.102 0.0575 0.0646Obs. 288606 288606 231398 231398
Panel B: Close Relative DeathsDeath During Pregnancy 0.00107 -0.000250 0.00402** 0.00335
[0.00174] [0.00291] [0.00192] [0.00249]
Mean, dept. var 0.0660 0.0914 0.0595 0.0681Obs. 84676 84676 46500 46500
Panel C: Maternal Parent/Sibling DeathsDeath During Pregnancy 0.00140 -0.0000993 0.00396** 0.00326
[0.00183] [0.00299] [0.00197] [0.00257]
Mean, dept. var 0.0659 0.0908 0.0595 0.0680Obs. 81036 81036 44634 44634
Note: See tables 1 and 2 for more information on the sample and controls. “Any Hosp-Peri.” refers to an indicator forever being hospitalized for a condition originating in the perinatal period. “Tot Hosp-Peri.” refers to the total numberof hospitalizations for conditions originating in the perinatal period. The sample in columns (3) and (4) is limited tocohorts born in 1987 or later (as the definition of perinatal conditions is not comparable with earlier years). Robuststandard errors are clustered on the mother’s municipality of residence in the year prior to conception.Significance levels: * p<0.1 ** p<0.05 *** p<0.01
41

Table 4: Effects of Relative Death In Utero on Prescription Use for Mental Health Conditions at Ages 9-11and 34-36
ADHD,9-11 Anx,34-36 Dep,34-36
(1) (2) (3) (4) (5) (6)Any RX Avg. dose Any RX Avg. dose Any RX Avg. dose
Panel A: All Relative DeathsDeath During Pregnancy 0.000973 0.0373 0.00499 0.0202 0.00517 0.404*
[0.000933] [0.0337] [0.00306] [0.0195] [0.00373] [0.235]
Mean, dept. var 0.0228 0.667 0.0685 0.217 0.114 4.664Obs. 114906 114906 27641 27641 27641 27641
Panel B: Close Relative DeathsDeath During Pregnancy 0.00620*** 0.172** 0.00719** 0.0304 0.00736* 0.472*
[0.00205] [0.0774] [0.00358] [0.0210] [0.00436] [0.246]
Mean, dept. var 0.0244 0.713 0.0674 0.205 0.112 4.559Obs. 20380 20380 22907 22907 22907 22907
Panel C: Maternal Parent/Sibling DeathsDeath During Pregnancy 0.00648*** 0.169** 0.00864** 0.0390* 0.00915** 0.553**
[0.00210] [0.0811] [0.00367] [0.0223] [0.00441] [0.259]
Mean, dept. var 0.0238 0.702 0.0666 0.204 0.111 4.546Obs. 19605 19605 21763 21763 21763 21763
Note: See tables 1 and 2 for more information on the sample and controls. Robust standard errors are clustered on themother’s municipality of residence in the year prior to conception. Exact definitions of the prescription drug categories aregiven in Online Appendix E.Significance levels: * p<0.1 ** p<0.05 *** p<0.01
42
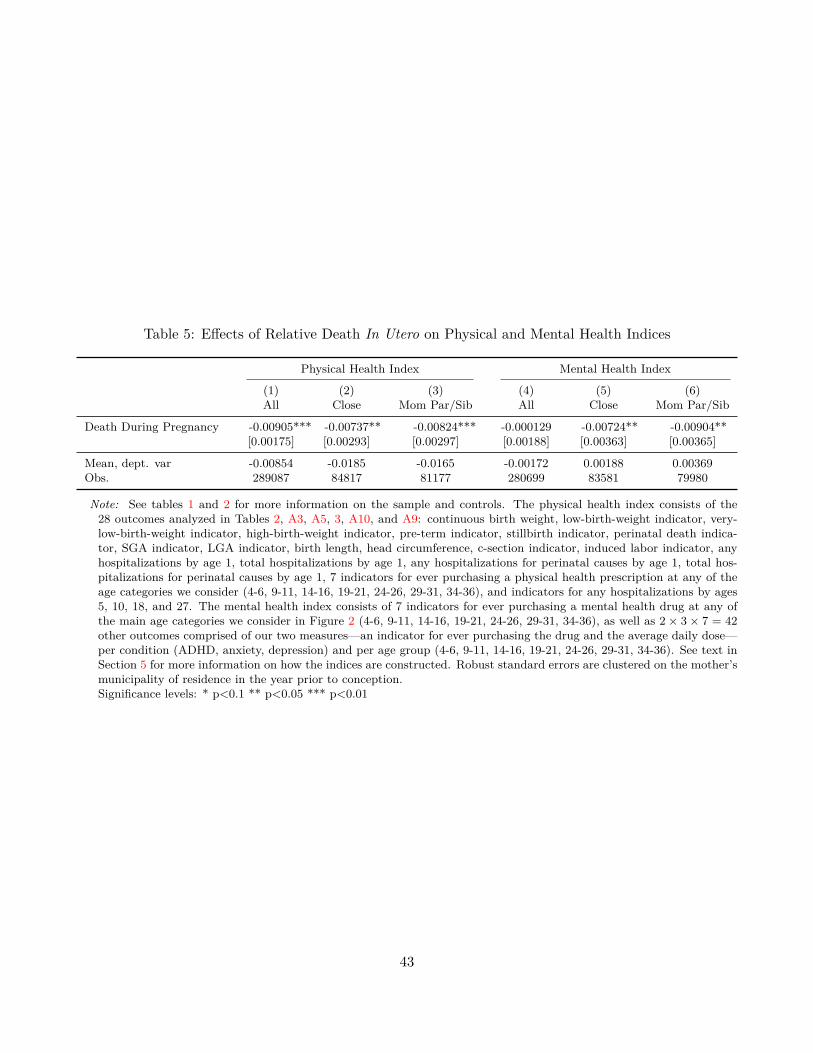
Table 5: Effects of Relative Death In Utero on Physical and Mental Health Indices
Physical Health Index Mental Health Index
(1) (2) (3) (4) (5) (6)All Close Mom Par/Sib All Close Mom Par/Sib
Death During Pregnancy -0.00905*** -0.00737** -0.00824*** -0.000129 -0.00724** -0.00904**[0.00175] [0.00293] [0.00297] [0.00188] [0.00363] [0.00365]
Mean, dept. var -0.00854 -0.0185 -0.0165 -0.00172 0.00188 0.00369Obs. 289087 84817 81177 280699 83581 79980
Note: See tables 1 and 2 for more information on the sample and controls. The physical health index consists of the28 outcomes analyzed in Tables 2, A3, A5, 3, A10, and A9: continuous birth weight, low-birth-weight indicator, very-low-birth-weight indicator, high-birth-weight indicator, pre-term indicator, stillbirth indicator, perinatal death indica-tor, SGA indicator, LGA indicator, birth length, head circumference, c-section indicator, induced labor indicator, anyhospitalizations by age 1, total hospitalizations by age 1, any hospitalizations for perinatal causes by age 1, total hos-pitalizations for perinatal causes by age 1, 7 indicators for ever purchasing a physical health prescription at any of theage categories we consider (4-6, 9-11, 14-16, 19-21, 24-26, 29-31, 34-36), and indicators for any hospitalizations by ages5, 10, 18, and 27. The mental health index consists of 7 indicators for ever purchasing a mental health drug at any ofthe main age categories we consider in Figure 2 (4-6, 9-11, 14-16, 19-21, 24-26, 29-31, 34-36), as well as 2× 3× 7 = 42other outcomes comprised of our two measures—an indicator for ever purchasing the drug and the average daily dose—per condition (ADHD, anxiety, depression) and per age group (4-6, 9-11, 14-16, 19-21, 24-26, 29-31, 34-36). See text inSection 5 for more information on how the indices are constructed. Robust standard errors are clustered on the mother’smunicipality of residence in the year prior to conception.Significance levels: * p<0.1 ** p<0.05 *** p<0.01
43
10 Note [added post-acceptance]
Since acceptance of this article, it was brought to our attention that there are other related studieson this topic. This note describes the relation of our work to these studies and adds the missingreferences at the end.
Class et al. (2011) and Class et al. (2014) use Swedish register data to document associationsbetween maternal bereavement in utero and adverse birth outcomes and hospitalizations for mentalhealth conditions, respectively.1 Similarly, Khashan et al. (2008, 2011) use Danish register data todocument an association between uterine exposure to maternal bereavement and hospitalizationsfor mental health conditions. These studies compare the outcomes of children whose mothersexperienced a close relative death during pregnancy (or in the surrounding years) to the outcomesof children whose mothers did not. They also examine the timing of exposure, by comparing childrenexposed to maternal bereavement during different stages (e.g., specific months of pregnancy or inthe first or second year of life) to children who have no exposure to maternal bereavement.
By contrast, our empirical design compares the outcomes of children whose mothers experienceda relative death within 280 days post-conception to the outcomes of children whose maternal rel-atives died in the year after their expected date of birth. Further, we explore the heterogeneity ofeffects across different months of pregnancy, using the group exposed to maternal bereavement inthe year after their expected date of birth as the control group (as opposed to a control group thatis unexposed, as in the studies referenced above). As we write in Section 4, this approach helps usto: (i) separate the impacts of maternal stress that operate through the uterine environment fromother impacts (such as income effects) that also operate through the post-natal environment, and(ii) address the concern that the occurrence of death is not a random event and has been shownto be correlated with other family characteristics such as socio-economic status. Intuitively, allchildren included in our analysis are exposed to the relative’s passing—and hence to the post-natalconsequences and correlates of this event—but only the treatment group is exposed to the eventthrough the uterine environment. Our paper also differs from the above referenced studies in thatwe measure mental health outcomes using prescription drug data, which enables detection not onlyof the occurrence of a condition, but also of its severity (as captured by the prescribed dose).
Our approach is similar to that of a much earlier study by Huttunen and Niskanen (1978),who used data from Helsinki, Finland, and studied a sample of 335 individuals whose fathers diedbefore age 35 either before their birth or in the year after their birth. They conducted analysesusing Student’s t tests and χ2 tests, finding that, relative to the control group, the treatment grouphad higher rates of diagnosed schizophrenics treated in psychiatric hospitals and higher rates ofindividuals committing crimes. They did not find any statistically significant differences betweenthe groups for ten other outcomes that they considered, such as childhood behavior disorders and
1Abel et al. (2014) also use Swedish register data to examine a potential association between maternal bereavementin utero and hospitalizations for mental health conditions, but find no evidence of such an association.
44
minor depressive and neurotic disorders. Huttunen and Niskanen (1978) further comment:
“The number in our total sample and the number of psychiatric cases in the two groupsare so small that the present results cannot be considered as conclusive evidence forthe proposed hypothesis of the etiological role of maternal stress during pregnancy inpsychiatric and behavioral disorders.” (Huttunen and Niskanen, 1978, p. 431)
We view our work as building on the earlier Huttunen and Niskanen (1978) paper in the followingways: (i) we assign treatment based on the expected date of birth rather than the actual date ofbirth, in light of the evidence that in utero exposure to the death of a relative affects gestationlength (and hence, the date of birth); (ii) we document impacts of antenatal stress on conditionsother than schizophrenia; (iii) we use more recent population-level Scandinavian registry data thatprovides us with a sample size that is nearly 1,000 times larger than that in Huttunen and Niskanen(1978) and thus lends us much more statistical power; (iv) we use novel prescription registry datato measure mental health outcomes; (v) we study deaths of relatives other than children’s fathers,which allows us to test for heterogeneity in effects by the severity of antenatal stress exposure; and(vi) we use regression models that allow us to control for maternal, child, and relative characteristics,and conduct a variety of additional analyses to test for alternative channels (other than stress) andaddress issues of multiple hypothesis testing.
ReferencesAbel, KM, HP Heuvelman, L Jörgensen, C Magnusson, S Wicks, E Susser, J Hallkvist, and
C Dalman, “Severe bereavement stress during the prenatal and childhood periods and risk of psychosisin later life: population based cohort study,” British Medical Journal, 2014, 348, f7679.
Class, Q. A., K. M. Abel, A. S. Khashan, M. E. Rickert, C. Dalman, H. Larsson, C. M.Hultman, N. Langstrom, P. Lichtenstein, and B. M. D’Onofrio, “Offspring psychopathologyfollowing preconception, prenatal and postnatal maternal bereavement stress,” Psychologial Medicine,Jan 2014, 44 (1), 71–84.
Class, Quetzal A, Paul Lichtenstein, Niklas Långström, and Brian M D’Onofrio, “Timing ofprenatal maternal exposure to severe life events and adverse pregnancy outcomes: a population study of2.6 million pregnancies,” Psychosomatic medicine, 2011, 73 (3), 234.
Huttunen, Matti O and Pekka Niskanen, “Prenatal loss of father and psychiatric disorders,” Archivesof general psychiatry, 1978, 35 (4), 429–431.
Khashan, Ali S, Kathryn M Abel, Roseanne McNamee, Marianne G Pedersen, Roger T Webb,Philip N Baker, Louise C Kenny, and Preben Bo Mortensen, “Higher risk of offspring schizophre-nia following antenatal maternal exposure to severe adverse life events,” Archives of general psychiatry,2008, 65 (2), 146–152.
, Roseanne McNamee, Tine B Henriksen, Marianne G Pedersen, Louise C Kenny,Kathryn M Abel, and Preben B Mortensen, “Risk of affective disorders following prenatal ex-posure to severe life events: a Danish population-based cohort study,” Journal of psychiatric research,2011, 45 (7), 879–885.
45
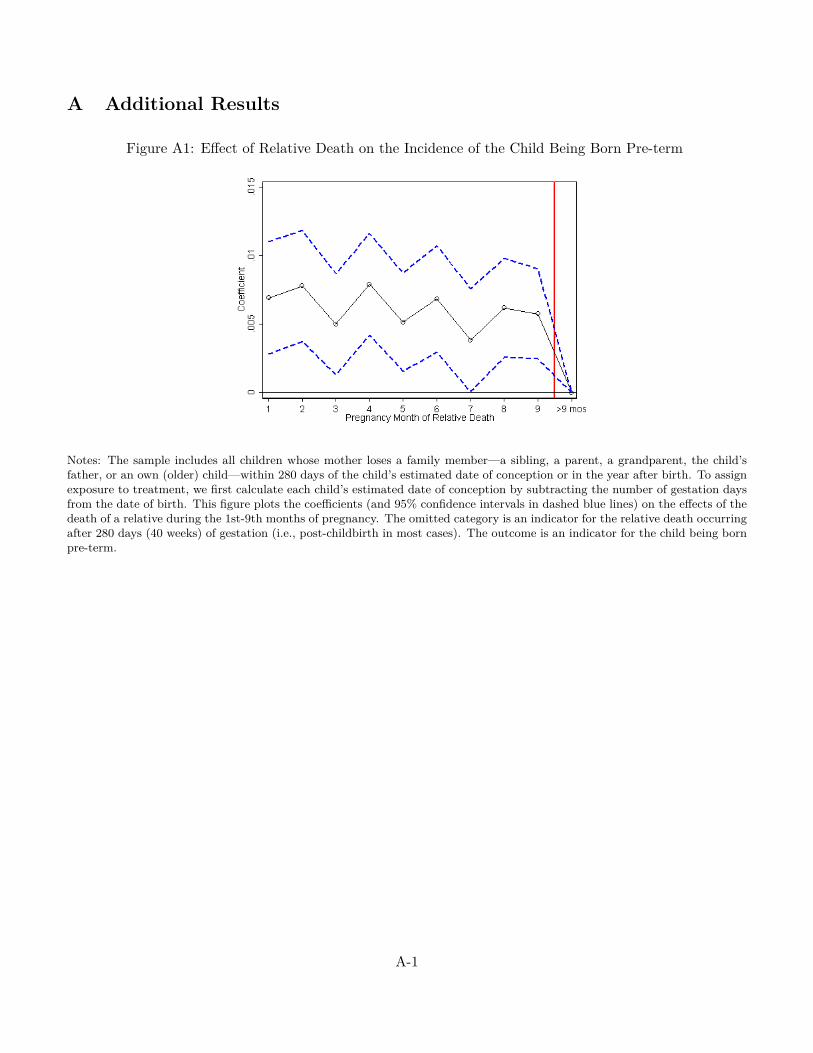
A Additional Results
Figure A1: Effect of Relative Death on the Incidence of the Child Being Born Pre-term
Notes: The sample includes all children whose mother loses a family member—a sibling, a parent, a grandparent, the child’sfather, or an own (older) child—within 280 days of the child’s estimated date of conception or in the year after birth. To assignexposure to treatment, we first calculate each child’s estimated date of conception by subtracting the number of gestation daysfrom the date of birth. This figure plots the coefficients (and 95% confidence intervals in dashed blue lines) on the effects of thedeath of a relative during the 1st-9th months of pregnancy. The omitted category is an indicator for the relative death occurringafter 280 days (40 weeks) of gestation (i.e., post-childbirth in most cases). The outcome is an indicator for the child being bornpre-term.
A-1
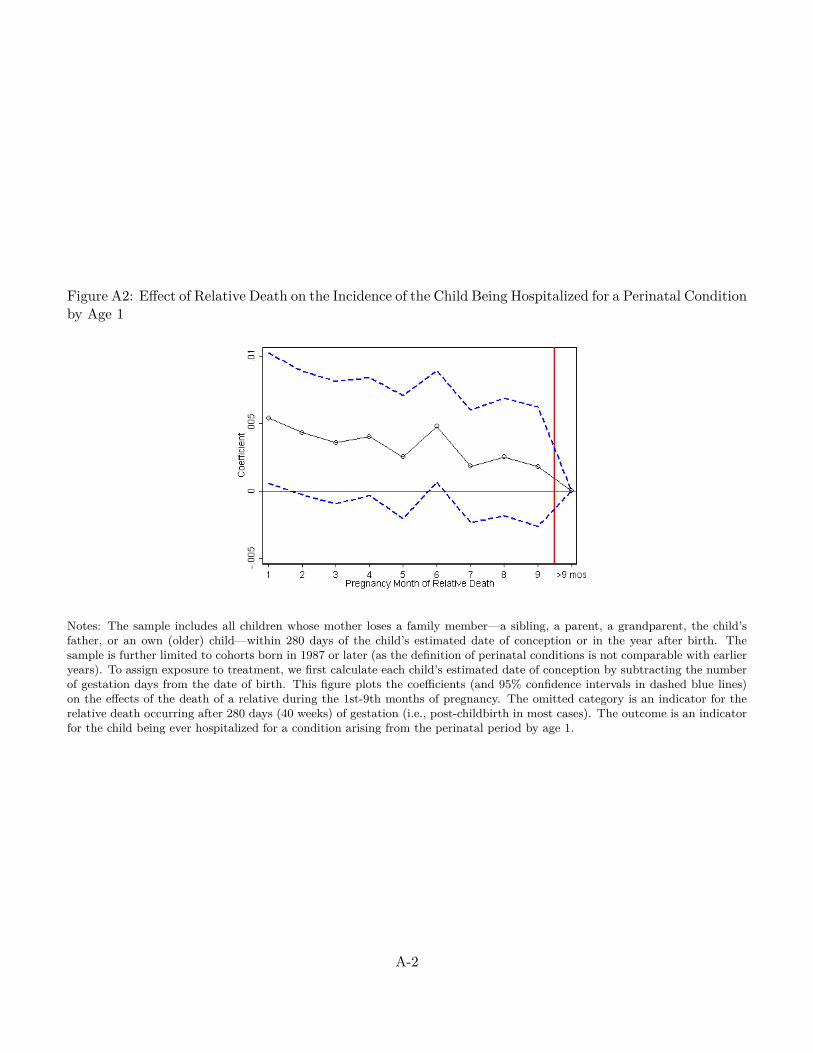
Figure A2: Effect of Relative Death on the Incidence of the Child Being Hospitalized for a Perinatal Conditionby Age 1
Notes: The sample includes all children whose mother loses a family member—a sibling, a parent, a grandparent, the child’sfather, or an own (older) child—within 280 days of the child’s estimated date of conception or in the year after birth. Thesample is further limited to cohorts born in 1987 or later (as the definition of perinatal conditions is not comparable with earlieryears). To assign exposure to treatment, we first calculate each child’s estimated date of conception by subtracting the numberof gestation days from the date of birth. This figure plots the coefficients (and 95% confidence intervals in dashed blue lines)on the effects of the death of a relative during the 1st-9th months of pregnancy. The omitted category is an indicator for therelative death occurring after 280 days (40 weeks) of gestation (i.e., post-childbirth in most cases). The outcome is an indicatorfor the child being ever hospitalized for a condition arising from the perinatal period by age 1.
A-2
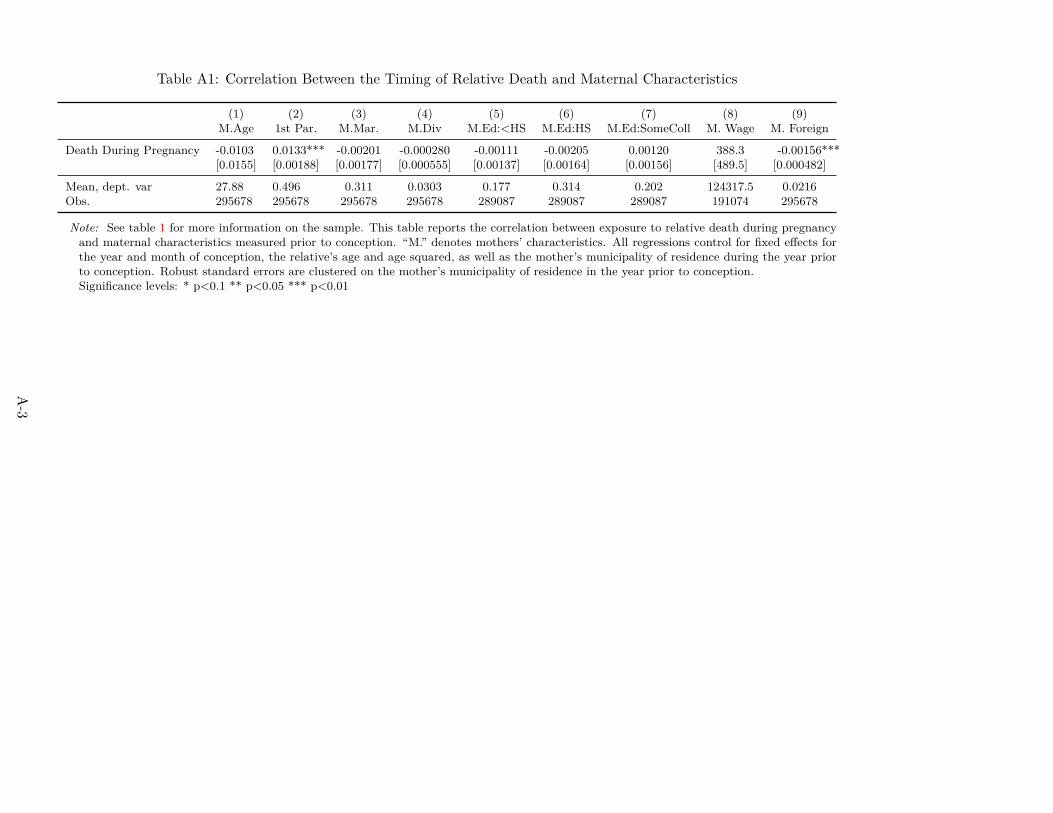
Table A1: Correlation Between the Timing of Relative Death and Maternal Characteristics
(1) (2) (3) (4) (5) (6) (7) (8) (9)M.Age 1st Par. M.Mar. M.Div M.Ed:<HS M.Ed:HS M.Ed:SomeColl M. Wage M. Foreign
Death During Pregnancy -0.0103 0.0133*** -0.00201 -0.000280 -0.00111 -0.00205 0.00120 388.3 -0.00156***[0.0155] [0.00188] [0.00177] [0.000555] [0.00137] [0.00164] [0.00156] [489.5] [0.000482]
Mean, dept. var 27.88 0.496 0.311 0.0303 0.177 0.314 0.202 124317.5 0.0216Obs. 295678 295678 295678 295678 289087 289087 289087 191074 295678
Note: See table 1 for more information on the sample. This table reports the correlation between exposure to relative death during pregnancyand maternal characteristics measured prior to conception. “M.” denotes mothers’ characteristics. All regressions control for fixed effects forthe year and month of conception, the relative’s age and age squared, as well as the mother’s municipality of residence during the year priorto conception. Robust standard errors are clustered on the mother’s municipality of residence in the year prior to conception.Significance levels: * p<0.1 ** p<0.05 *** p<0.01
A-3
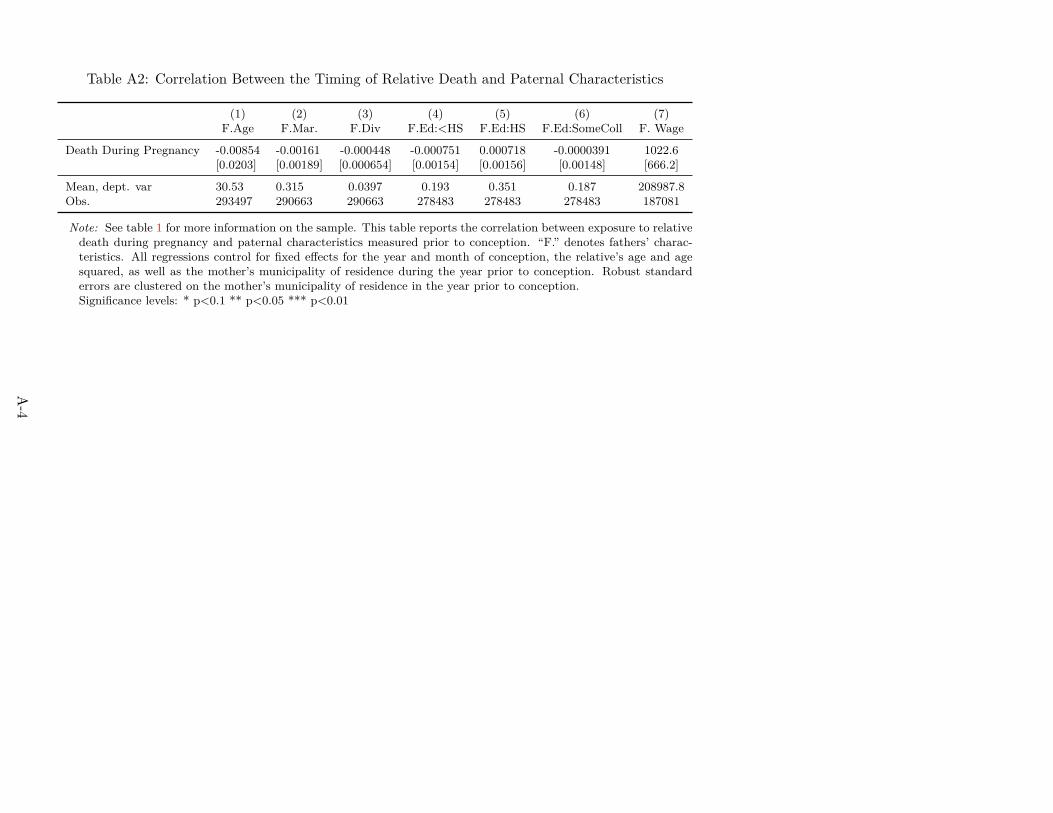
Table A2: Correlation Between the Timing of Relative Death and Paternal Characteristics
(1) (2) (3) (4) (5) (6) (7)F.Age F.Mar. F.Div F.Ed:<HS F.Ed:HS F.Ed:SomeColl F. Wage
Death During Pregnancy -0.00854 -0.00161 -0.000448 -0.000751 0.000718 -0.0000391 1022.6[0.0203] [0.00189] [0.000654] [0.00154] [0.00156] [0.00148] [666.2]
Mean, dept. var 30.53 0.315 0.0397 0.193 0.351 0.187 208987.8Obs. 293497 290663 290663 278483 278483 278483 187081
Note: See table 1 for more information on the sample. This table reports the correlation between exposure to relativedeath during pregnancy and paternal characteristics measured prior to conception. “F.” denotes fathers’ charac-teristics. All regressions control for fixed effects for the year and month of conception, the relative’s age and agesquared, as well as the mother’s municipality of residence during the year prior to conception. Robust standarderrors are clustered on the mother’s municipality of residence in the year prior to conception.Significance levels: * p<0.1 ** p<0.05 *** p<0.01
A-4
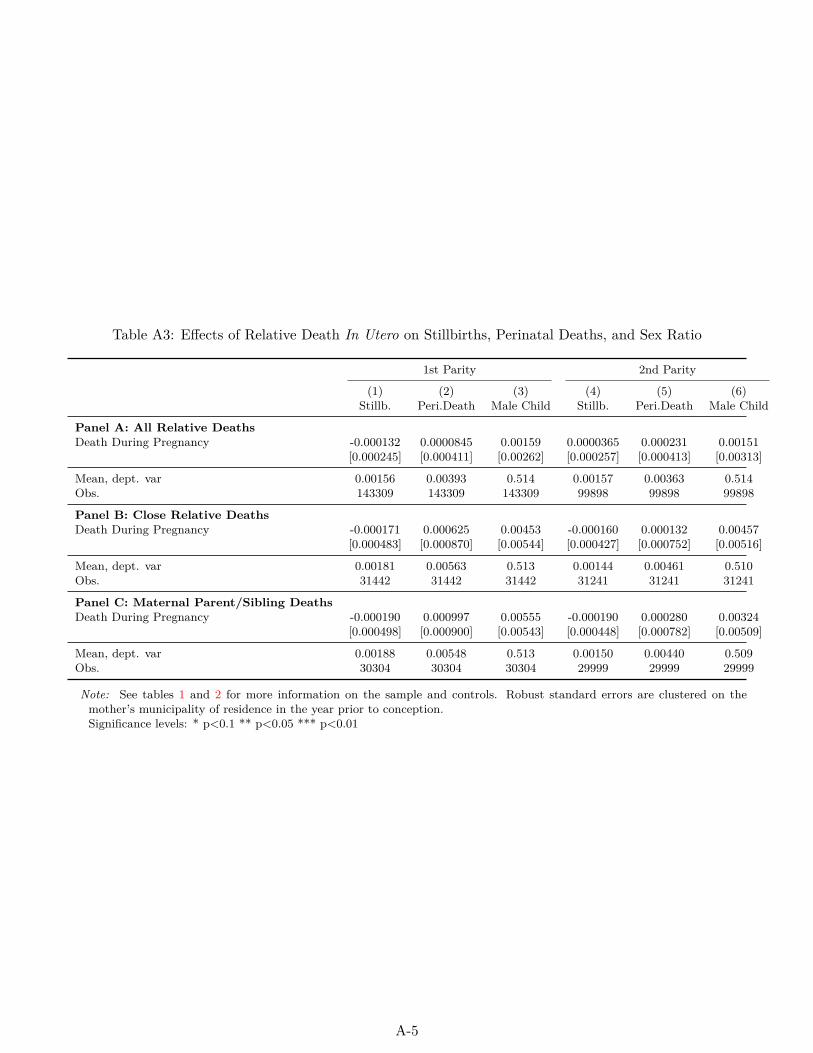
Table A3: Effects of Relative Death In Utero on Stillbirths, Perinatal Deaths, and Sex Ratio
1st Parity 2nd Parity
(1) (2) (3) (4) (5) (6)Stillb. Peri.Death Male Child Stillb. Peri.Death Male Child
Panel A: All Relative DeathsDeath During Pregnancy -0.000132 0.0000845 0.00159 0.0000365 0.000231 0.00151
[0.000245] [0.000411] [0.00262] [0.000257] [0.000413] [0.00313]
Mean, dept. var 0.00156 0.00393 0.514 0.00157 0.00363 0.514Obs. 143309 143309 143309 99898 99898 99898
Panel B: Close Relative DeathsDeath During Pregnancy -0.000171 0.000625 0.00453 -0.000160 0.000132 0.00457
[0.000483] [0.000870] [0.00544] [0.000427] [0.000752] [0.00516]
Mean, dept. var 0.00181 0.00563 0.513 0.00144 0.00461 0.510Obs. 31442 31442 31442 31241 31241 31241
Panel C: Maternal Parent/Sibling DeathsDeath During Pregnancy -0.000190 0.000997 0.00555 -0.000190 0.000280 0.00324
[0.000498] [0.000900] [0.00543] [0.000448] [0.000782] [0.00509]
Mean, dept. var 0.00188 0.00548 0.513 0.00150 0.00440 0.509Obs. 30304 30304 30304 29999 29999 29999
Note: See tables 1 and 2 for more information on the sample and controls. Robust standard errors are clustered on themother’s municipality of residence in the year prior to conception.Significance levels: * p<0.1 ** p<0.05 *** p<0.01
A-5
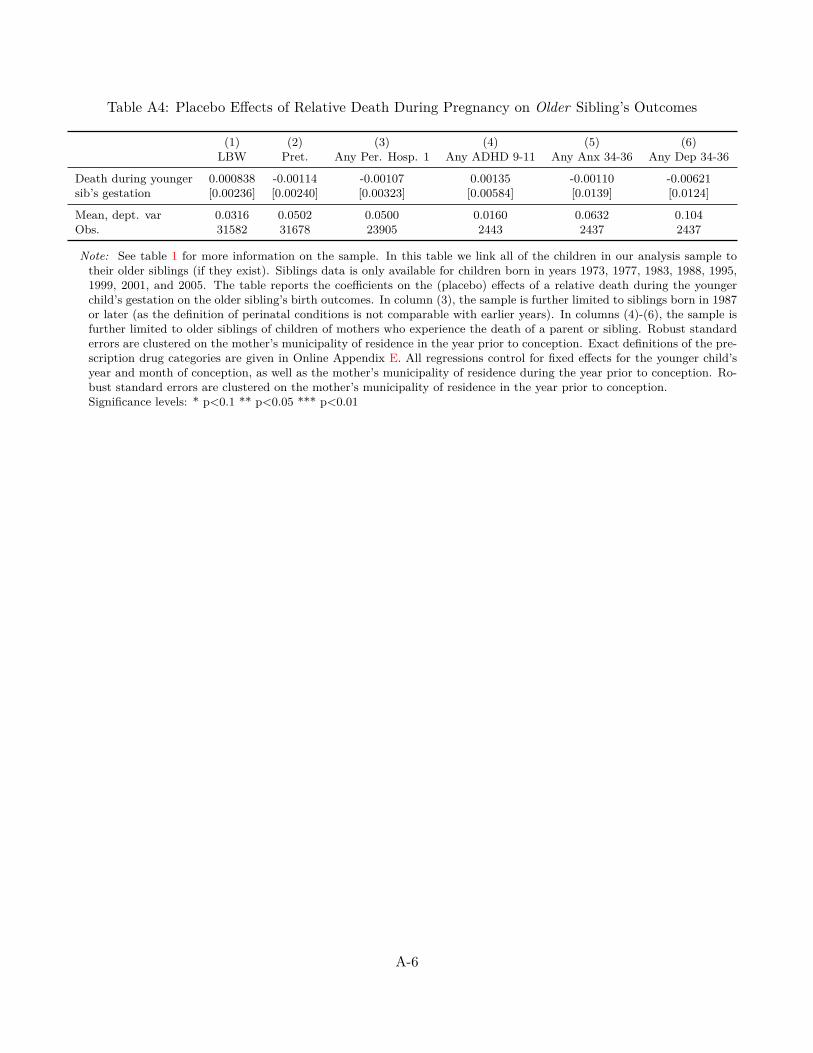
Table A4: Placebo Effects of Relative Death During Pregnancy on Older Sibling’s Outcomes
(1) (2) (3) (4) (5) (6)LBW Pret. Any Per. Hosp. 1 Any ADHD 9-11 Any Anx 34-36 Any Dep 34-36
Death during younger 0.000838 -0.00114 -0.00107 0.00135 -0.00110 -0.00621sib’s gestation [0.00236] [0.00240] [0.00323] [0.00584] [0.0139] [0.0124]
Mean, dept. var 0.0316 0.0502 0.0500 0.0160 0.0632 0.104Obs. 31582 31678 23905 2443 2437 2437
Note: See table 1 for more information on the sample. In this table we link all of the children in our analysis sample totheir older siblings (if they exist). Siblings data is only available for children born in years 1973, 1977, 1983, 1988, 1995,1999, 2001, and 2005. The table reports the coefficients on the (placebo) effects of a relative death during the youngerchild’s gestation on the older sibling’s birth outcomes. In column (3), the sample is further limited to siblings born in 1987or later (as the definition of perinatal conditions is not comparable with earlier years). In columns (4)-(6), the sample isfurther limited to older siblings of children of mothers who experience the death of a parent or sibling. Robust standarderrors are clustered on the mother’s municipality of residence in the year prior to conception. Exact definitions of the pre-scription drug categories are given in Online Appendix E. All regressions control for fixed effects for the younger child’syear and month of conception, as well as the mother’s municipality of residence during the year prior to conception. Ro-bust standard errors are clustered on the mother’s municipality of residence in the year prior to conception.Significance levels: * p<0.1 ** p<0.05 *** p<0.01
A-6
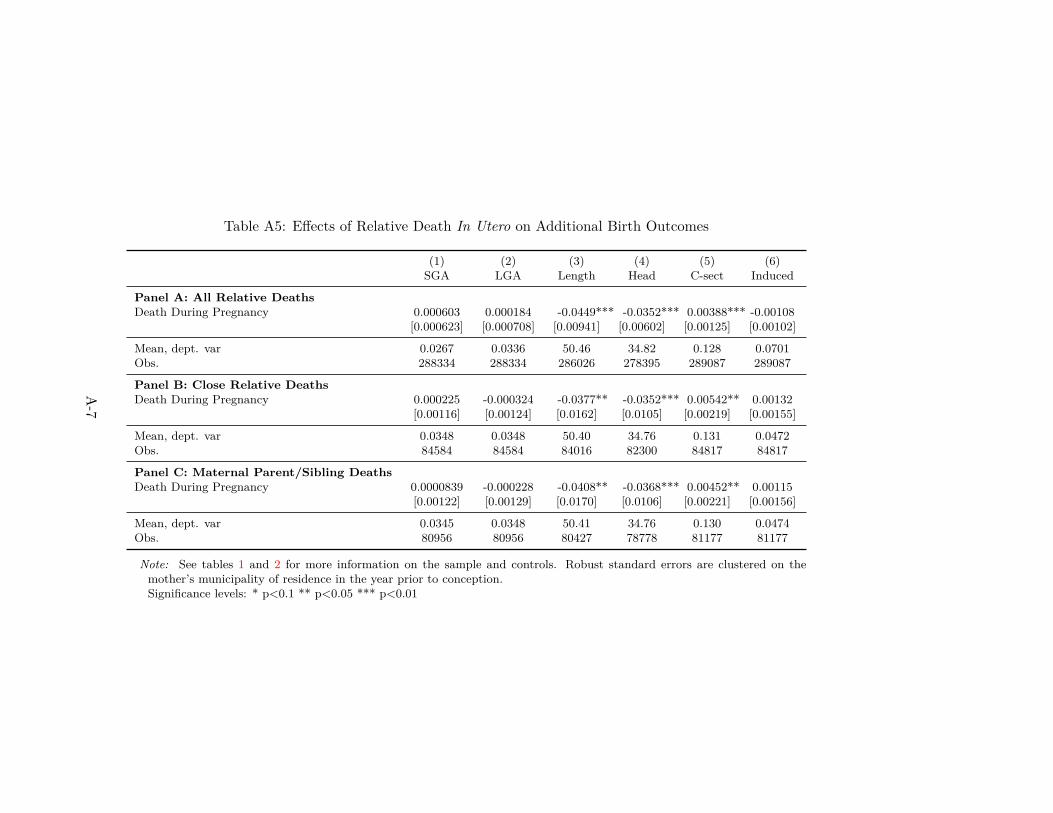
Table A5: Effects of Relative Death In Utero on Additional Birth Outcomes
(1) (2) (3) (4) (5) (6)SGA LGA Length Head C-sect Induced
Panel A: All Relative DeathsDeath During Pregnancy 0.000603 0.000184 -0.0449*** -0.0352*** 0.00388*** -0.00108
[0.000623] [0.000708] [0.00941] [0.00602] [0.00125] [0.00102]
Mean, dept. var 0.0267 0.0336 50.46 34.82 0.128 0.0701Obs. 288334 288334 286026 278395 289087 289087
Panel B: Close Relative DeathsDeath During Pregnancy 0.000225 -0.000324 -0.0377** -0.0352*** 0.00542** 0.00132
[0.00116] [0.00124] [0.0162] [0.0105] [0.00219] [0.00155]
Mean, dept. var 0.0348 0.0348 50.40 34.76 0.131 0.0472Obs. 84584 84584 84016 82300 84817 84817
Panel C: Maternal Parent/Sibling DeathsDeath During Pregnancy 0.0000839 -0.000228 -0.0408** -0.0368*** 0.00452** 0.00115
[0.00122] [0.00129] [0.0170] [0.0106] [0.00221] [0.00156]
Mean, dept. var 0.0345 0.0348 50.41 34.76 0.130 0.0474Obs. 80956 80956 80427 78778 81177 81177
Note: See tables 1 and 2 for more information on the sample and controls. Robust standard errors are clustered on themother’s municipality of residence in the year prior to conception.Significance levels: * p<0.1 ** p<0.05 *** p<0.01
A-7
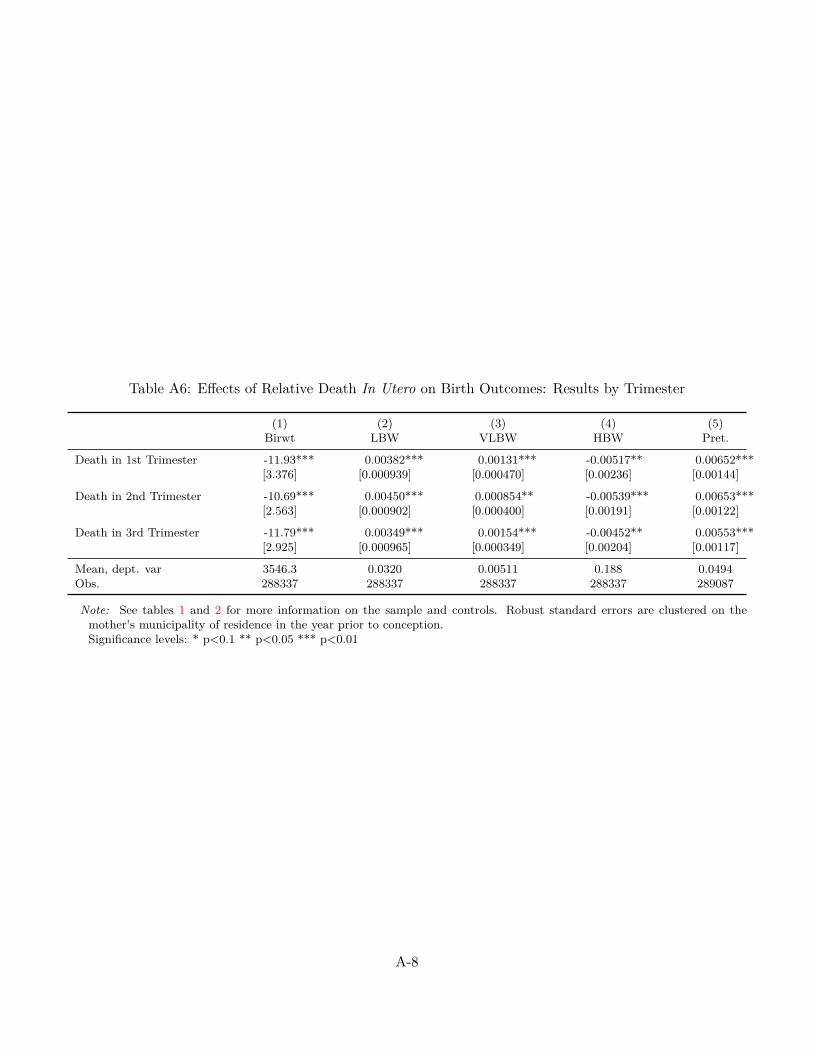
Table A6: Effects of Relative Death In Utero on Birth Outcomes: Results by Trimester
(1) (2) (3) (4) (5)Birwt LBW VLBW HBW Pret.
Death in 1st Trimester -11.93*** 0.00382*** 0.00131*** -0.00517** 0.00652***[3.376] [0.000939] [0.000470] [0.00236] [0.00144]
Death in 2nd Trimester -10.69*** 0.00450*** 0.000854** -0.00539*** 0.00653***[2.563] [0.000902] [0.000400] [0.00191] [0.00122]
Death in 3rd Trimester -11.79*** 0.00349*** 0.00154*** -0.00452** 0.00553***[2.925] [0.000965] [0.000349] [0.00204] [0.00117]
Mean, dept. var 3546.3 0.0320 0.00511 0.188 0.0494Obs. 288337 288337 288337 288337 289087
Note: See tables 1 and 2 for more information on the sample and controls. Robust standard errors are clustered on themother’s municipality of residence in the year prior to conception.Significance levels: * p<0.1 ** p<0.05 *** p<0.01
A-8

Table A7: Effects of Relative Death In Utero on Additional Birth Outcomes: Results by Trimester
(1) (2) (3) (4) (5) (6)SGA LGA Length Head C-sect Induced
Death in 1st Trimester 0.000846 0.00134 -0.0382*** -0.0409*** 0.00212 -0.00309**[0.000929] [0.000964] [0.0142] [0.0101] [0.00200] [0.00143]
Death in 2nd Trimester 0.000675 -0.000291 -0.0325*** -0.0253*** 0.00493*** -0.00189[0.000930] [0.000978] [0.0116] [0.00845] [0.00177] [0.00134]
Death in 3rd Trimester 0.000325 -0.000396 -0.0622*** -0.0394*** 0.00445** 0.00143[0.000758] [0.00108] [0.0131] [0.00818] [0.00178] [0.00162]
Mean, dept. var 0.0267 0.0336 50.46 34.82 0.128 0.0701Obs. 288334 288334 286026 278395 289087 289087
Note: See tables 1 and 2 for more information on the sample and controls. Robust standard errors are clustered on themother’s municipality of residence in the year prior to conception.Significance levels: * p<0.1 ** p<0.05 *** p<0.01
A-9
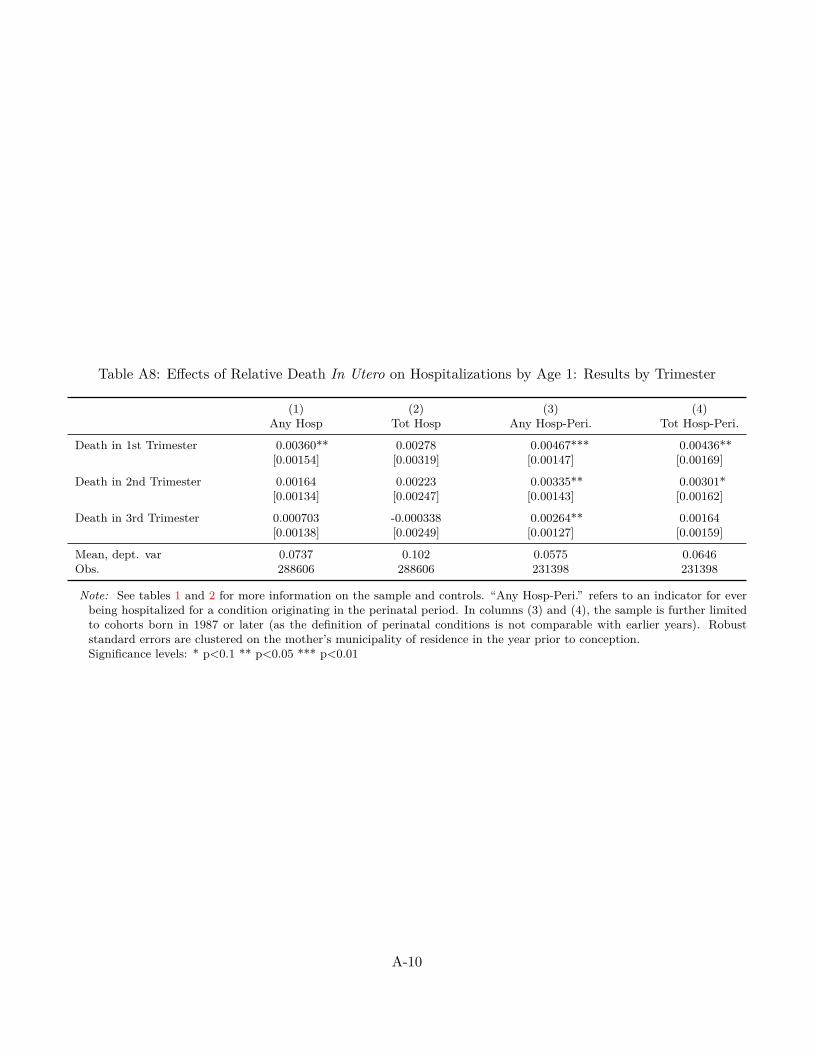
Table A8: Effects of Relative Death In Utero on Hospitalizations by Age 1: Results by Trimester
(1) (2) (3) (4)Any Hosp Tot Hosp Any Hosp-Peri. Tot Hosp-Peri.
Death in 1st Trimester 0.00360** 0.00278 0.00467*** 0.00436**[0.00154] [0.00319] [0.00147] [0.00169]
Death in 2nd Trimester 0.00164 0.00223 0.00335** 0.00301*[0.00134] [0.00247] [0.00143] [0.00162]
Death in 3rd Trimester 0.000703 -0.000338 0.00264** 0.00164[0.00138] [0.00249] [0.00127] [0.00159]
Mean, dept. var 0.0737 0.102 0.0575 0.0646Obs. 288606 288606 231398 231398
Note: See tables 1 and 2 for more information on the sample and controls. “Any Hosp-Peri.” refers to an indicator for everbeing hospitalized for a condition originating in the perinatal period. In columns (3) and (4), the sample is further limitedto cohorts born in 1987 or later (as the definition of perinatal conditions is not comparable with earlier years). Robuststandard errors are clustered on the mother’s municipality of residence in the year prior to conception.Significance levels: * p<0.1 ** p<0.05 *** p<0.01
A-10
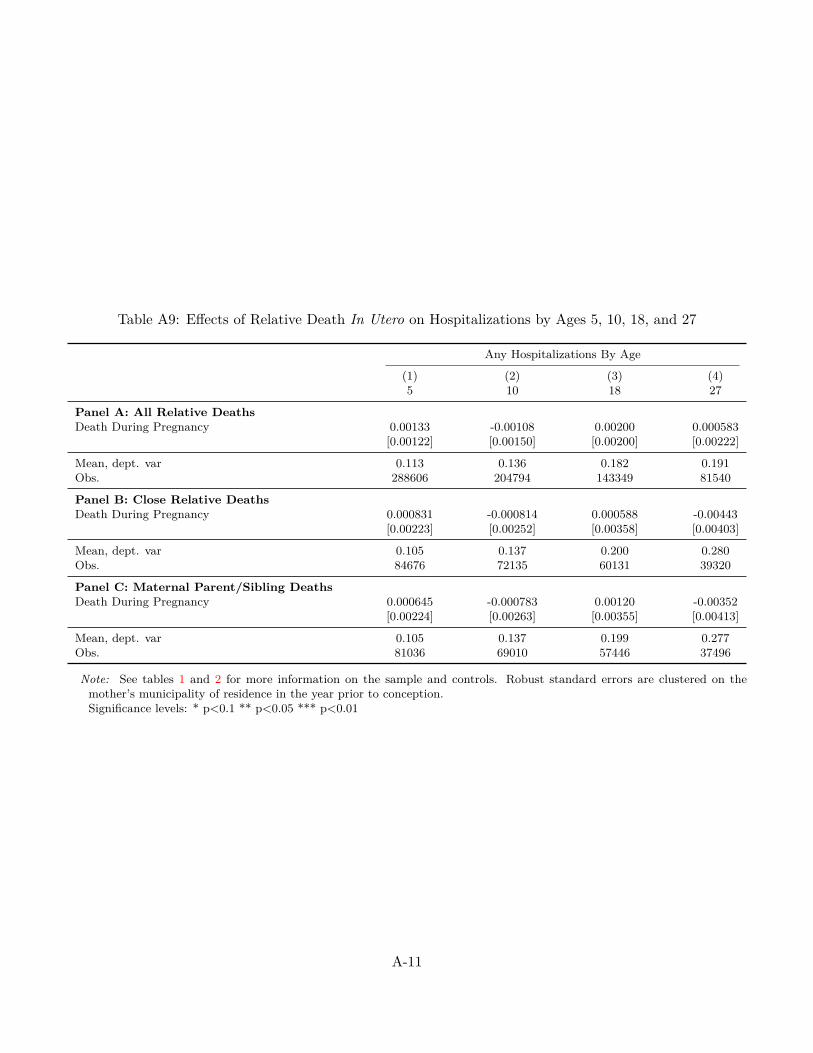
Table A9: Effects of Relative Death In Utero on Hospitalizations by Ages 5, 10, 18, and 27
Any Hospitalizations By Age
(1) (2) (3) (4)5 10 18 27
Panel A: All Relative DeathsDeath During Pregnancy 0.00133 -0.00108 0.00200 0.000583
[0.00122] [0.00150] [0.00200] [0.00222]
Mean, dept. var 0.113 0.136 0.182 0.191Obs. 288606 204794 143349 81540
Panel B: Close Relative DeathsDeath During Pregnancy 0.000831 -0.000814 0.000588 -0.00443
[0.00223] [0.00252] [0.00358] [0.00403]
Mean, dept. var 0.105 0.137 0.200 0.280Obs. 84676 72135 60131 39320
Panel C: Maternal Parent/Sibling DeathsDeath During Pregnancy 0.000645 -0.000783 0.00120 -0.00352
[0.00224] [0.00263] [0.00355] [0.00413]
Mean, dept. var 0.105 0.137 0.199 0.277Obs. 81036 69010 57446 37496
Note: See tables 1 and 2 for more information on the sample and controls. Robust standard errors are clustered on themother’s municipality of residence in the year prior to conception.Significance levels: * p<0.1 ** p<0.05 *** p<0.01
A-11
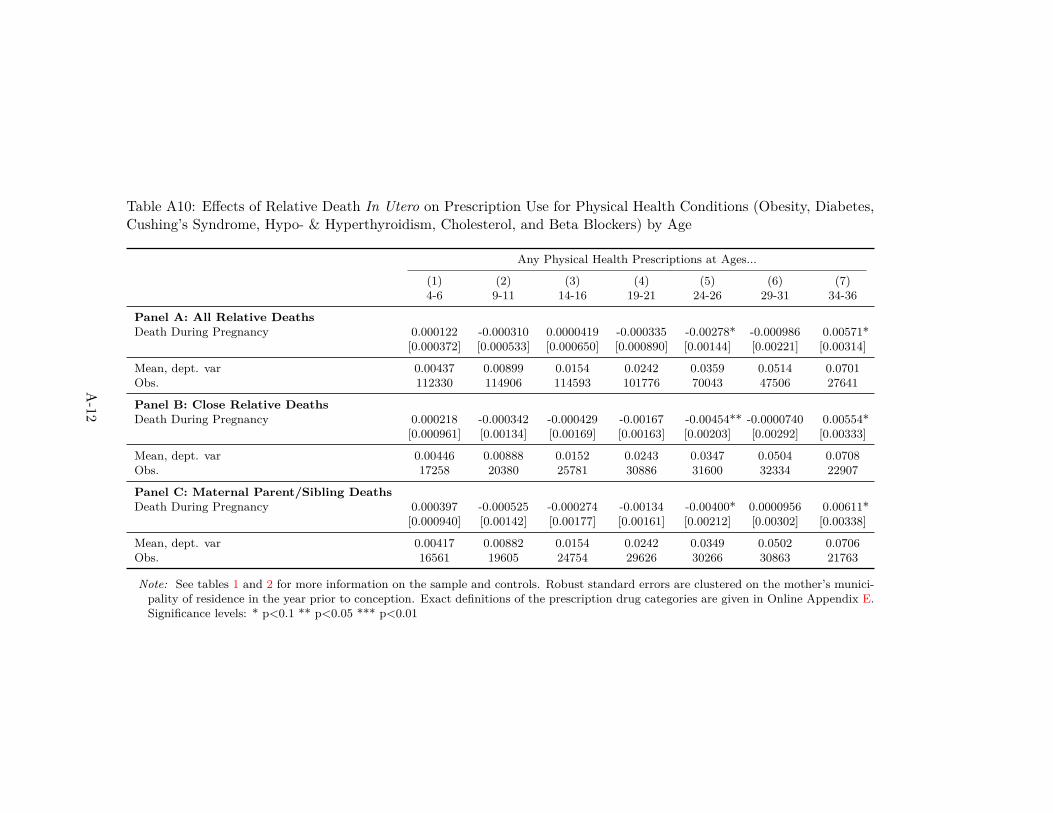
Table A10: Effects of Relative Death In Utero on Prescription Use for Physical Health Conditions (Obesity, Diabetes,Cushing’s Syndrome, Hypo- & Hyperthyroidism, Cholesterol, and Beta Blockers) by Age
Any Physical Health Prescriptions at Ages...
(1) (2) (3) (4) (5) (6) (7)4-6 9-11 14-16 19-21 24-26 29-31 34-36
Panel A: All Relative DeathsDeath During Pregnancy 0.000122 -0.000310 0.0000419 -0.000335 -0.00278* -0.000986 0.00571*
[0.000372] [0.000533] [0.000650] [0.000890] [0.00144] [0.00221] [0.00314]
Mean, dept. var 0.00437 0.00899 0.0154 0.0242 0.0359 0.0514 0.0701Obs. 112330 114906 114593 101776 70043 47506 27641
Panel B: Close Relative DeathsDeath During Pregnancy 0.000218 -0.000342 -0.000429 -0.00167 -0.00454** -0.0000740 0.00554*
[0.000961] [0.00134] [0.00169] [0.00163] [0.00203] [0.00292] [0.00333]
Mean, dept. var 0.00446 0.00888 0.0152 0.0243 0.0347 0.0504 0.0708Obs. 17258 20380 25781 30886 31600 32334 22907
Panel C: Maternal Parent/Sibling DeathsDeath During Pregnancy 0.000397 -0.000525 -0.000274 -0.00134 -0.00400* 0.0000956 0.00611*
[0.000940] [0.00142] [0.00177] [0.00161] [0.00212] [0.00302] [0.00338]
Mean, dept. var 0.00417 0.00882 0.0154 0.0242 0.0349 0.0502 0.0706Obs. 16561 19605 24754 29626 30266 30863 21763
Note: See tables 1 and 2 for more information on the sample and controls. Robust standard errors are clustered on the mother’s munici-pality of residence in the year prior to conception. Exact definitions of the prescription drug categories are given in Online Appendix E.Significance levels: * p<0.1 ** p<0.05 *** p<0.01
A-12
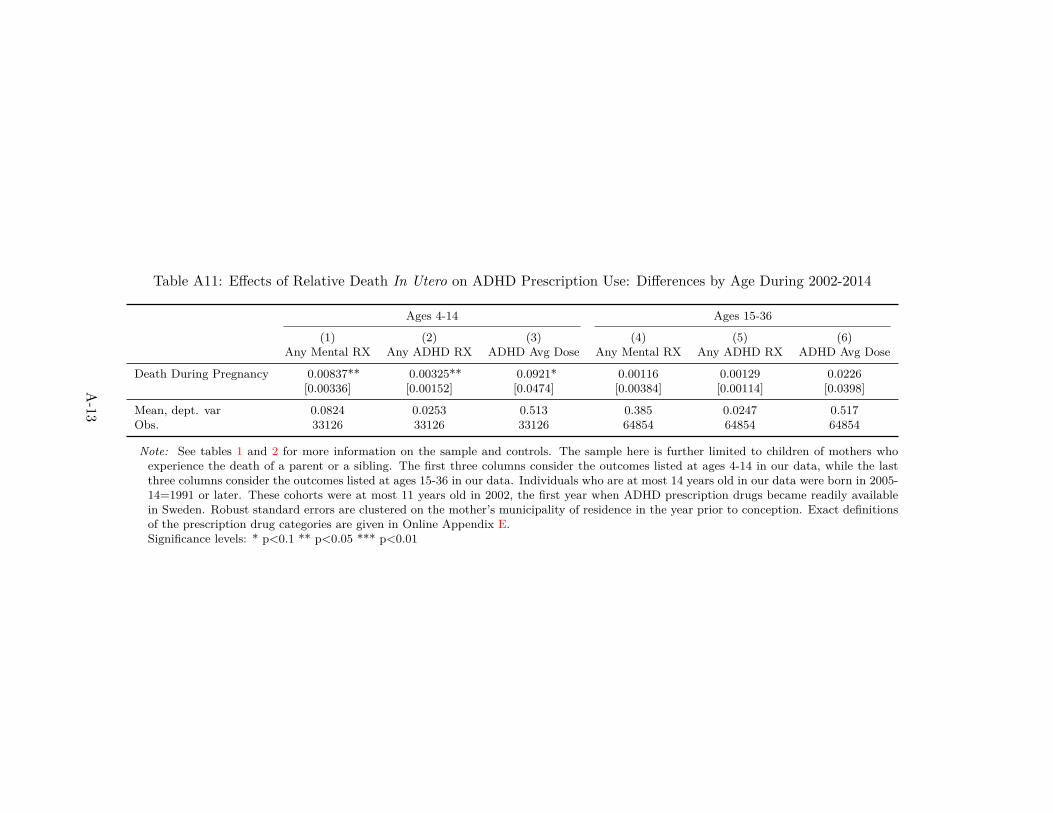
Table A11: Effects of Relative Death In Utero on ADHD Prescription Use: Differences by Age During 2002-2014
Ages 4-14 Ages 15-36
(1) (2) (3) (4) (5) (6)Any Mental RX Any ADHD RX ADHD Avg Dose Any Mental RX Any ADHD RX ADHD Avg Dose
Death During Pregnancy 0.00837** 0.00325** 0.0921* 0.00116 0.00129 0.0226[0.00336] [0.00152] [0.0474] [0.00384] [0.00114] [0.0398]
Mean, dept. var 0.0824 0.0253 0.513 0.385 0.0247 0.517Obs. 33126 33126 33126 64854 64854 64854
Note: See tables 1 and 2 for more information on the sample and controls. The sample here is further limited to children of mothers whoexperience the death of a parent or a sibling. The first three columns consider the outcomes listed at ages 4-14 in our data, while the lastthree columns consider the outcomes listed at ages 15-36 in our data. Individuals who are at most 14 years old in our data were born in 2005-14=1991 or later. These cohorts were at most 11 years old in 2002, the first year when ADHD prescription drugs became readily availablein Sweden. Robust standard errors are clustered on the mother’s municipality of residence in the year prior to conception. Exact definitionsof the prescription drug categories are given in Online Appendix E.Significance levels: * p<0.1 ** p<0.05 *** p<0.01
A-13
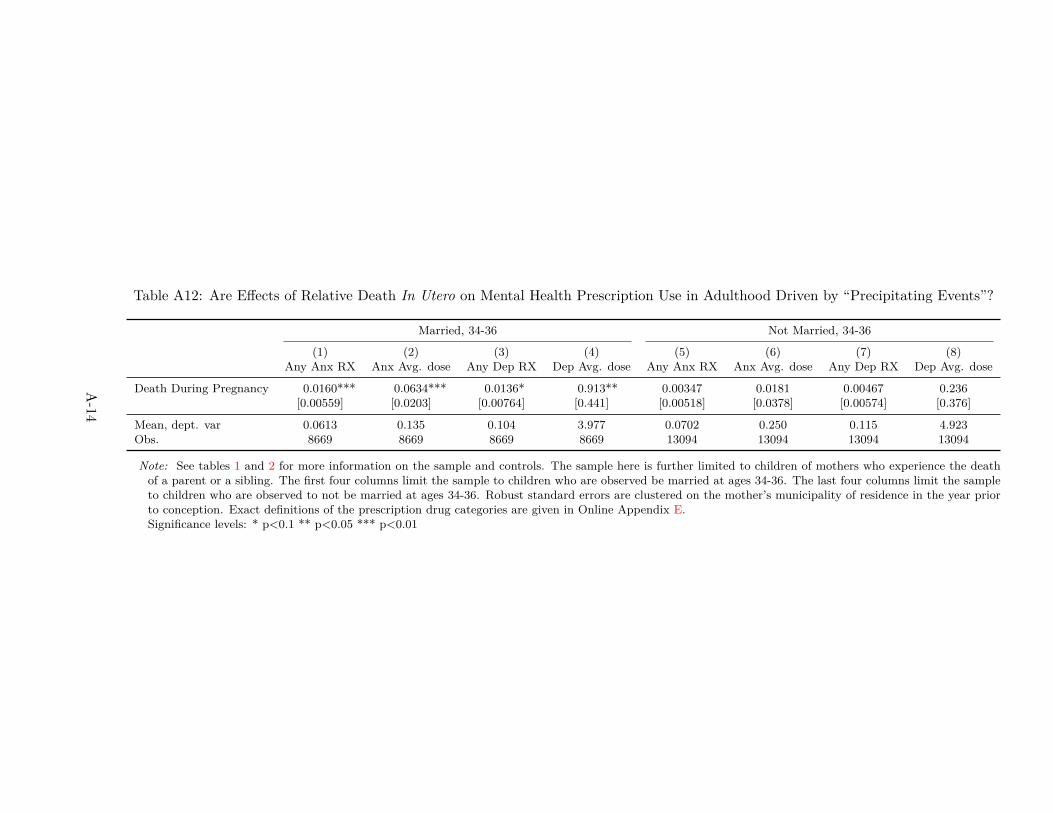
Table A12: Are Effects of Relative Death In Utero on Mental Health Prescription Use in Adulthood Driven by “Precipitating Events”?
Married, 34-36 Not Married, 34-36
(1) (2) (3) (4) (5) (6) (7) (8)Any Anx RX Anx Avg. dose Any Dep RX Dep Avg. dose Any Anx RX Anx Avg. dose Any Dep RX Dep Avg. dose
Death During Pregnancy 0.0160*** 0.0634*** 0.0136* 0.913** 0.00347 0.0181 0.00467 0.236[0.00559] [0.0203] [0.00764] [0.441] [0.00518] [0.0378] [0.00574] [0.376]
Mean, dept. var 0.0613 0.135 0.104 3.977 0.0702 0.250 0.115 4.923Obs. 8669 8669 8669 8669 13094 13094 13094 13094
Note: See tables 1 and 2 for more information on the sample and controls. The sample here is further limited to children of mothers who experience the deathof a parent or a sibling. The first four columns limit the sample to children who are observed be married at ages 34-36. The last four columns limit the sampleto children who are observed to not be married at ages 34-36. Robust standard errors are clustered on the mother’s municipality of residence in the year priorto conception. Exact definitions of the prescription drug categories are given in Online Appendix E.Significance levels: * p<0.1 ** p<0.05 *** p<0.01
A-14
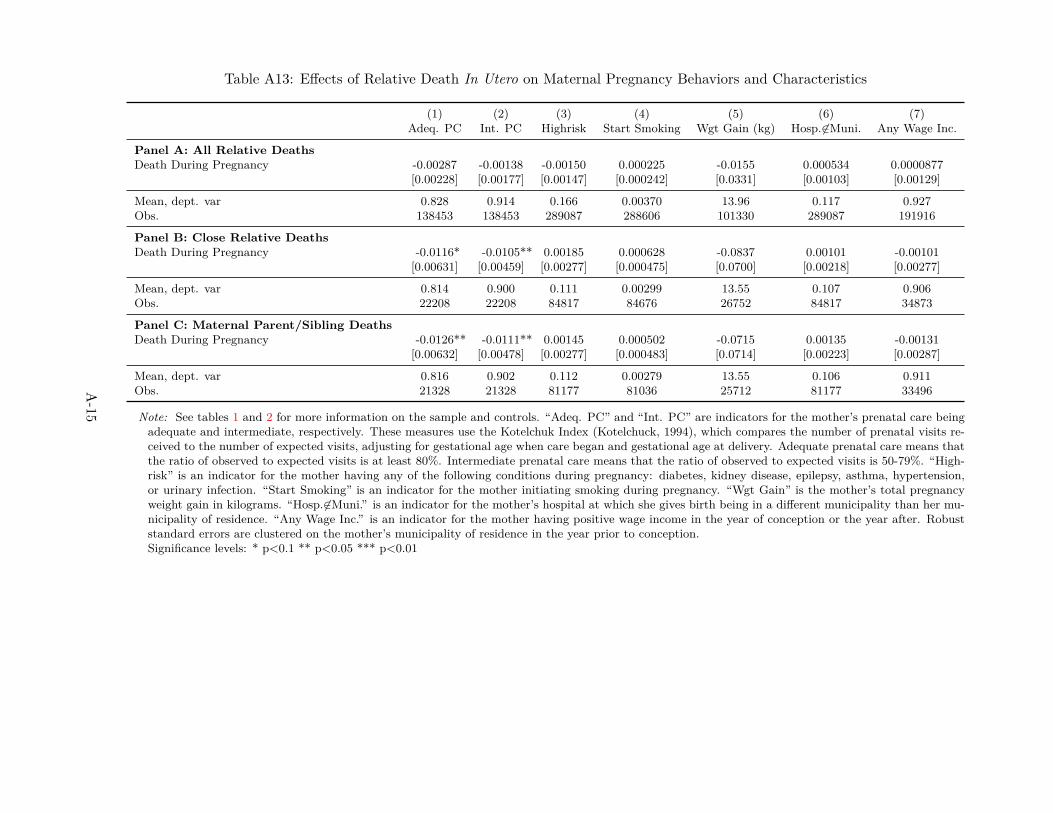
Table A13: Effects of Relative Death In Utero on Maternal Pregnancy Behaviors and Characteristics
(1) (2) (3) (4) (5) (6) (7)Adeq. PC Int. PC Highrisk Start Smoking Wgt Gain (kg) Hosp. 6∈Muni. Any Wage Inc.
Panel A: All Relative DeathsDeath During Pregnancy -0.00287 -0.00138 -0.00150 0.000225 -0.0155 0.000534 0.0000877
[0.00228] [0.00177] [0.00147] [0.000242] [0.0331] [0.00103] [0.00129]
Mean, dept. var 0.828 0.914 0.166 0.00370 13.96 0.117 0.927Obs. 138453 138453 289087 288606 101330 289087 191916
Panel B: Close Relative DeathsDeath During Pregnancy -0.0116* -0.0105** 0.00185 0.000628 -0.0837 0.00101 -0.00101
[0.00631] [0.00459] [0.00277] [0.000475] [0.0700] [0.00218] [0.00277]
Mean, dept. var 0.814 0.900 0.111 0.00299 13.55 0.107 0.906Obs. 22208 22208 84817 84676 26752 84817 34873
Panel C: Maternal Parent/Sibling DeathsDeath During Pregnancy -0.0126** -0.0111** 0.00145 0.000502 -0.0715 0.00135 -0.00131
[0.00632] [0.00478] [0.00277] [0.000483] [0.0714] [0.00223] [0.00287]
Mean, dept. var 0.816 0.902 0.112 0.00279 13.55 0.106 0.911Obs. 21328 21328 81177 81036 25712 81177 33496
Note: See tables 1 and 2 for more information on the sample and controls. “Adeq. PC” and “Int. PC” are indicators for the mother’s prenatal care beingadequate and intermediate, respectively. These measures use the Kotelchuk Index (Kotelchuck, 1994), which compares the number of prenatal visits re-ceived to the number of expected visits, adjusting for gestational age when care began and gestational age at delivery. Adequate prenatal care means thatthe ratio of observed to expected visits is at least 80%. Intermediate prenatal care means that the ratio of observed to expected visits is 50-79%. “High-risk” is an indicator for the mother having any of the following conditions during pregnancy: diabetes, kidney disease, epilepsy, asthma, hypertension,or urinary infection. “Start Smoking” is an indicator for the mother initiating smoking during pregnancy. “Wgt Gain” is the mother’s total pregnancyweight gain in kilograms. “Hosp.6∈Muni.” is an indicator for the mother’s hospital at which she gives birth being in a different municipality than her mu-nicipality of residence. “Any Wage Inc.” is an indicator for the mother having positive wage income in the year of conception or the year after. Robuststandard errors are clustered on the mother’s municipality of residence in the year prior to conception.Significance levels: * p<0.1 ** p<0.05 *** p<0.01
A-15
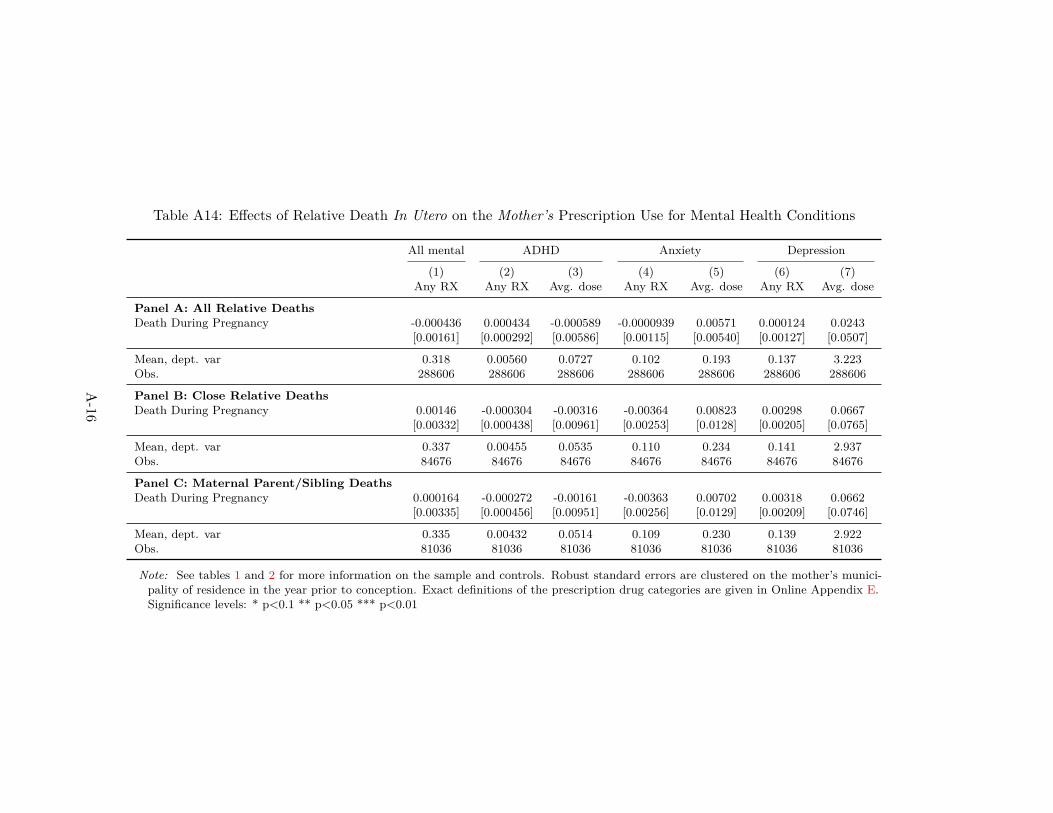
Table A14: Effects of Relative Death In Utero on the Mother’s Prescription Use for Mental Health Conditions
All mental ADHD Anxiety Depression
(1) (2) (3) (4) (5) (6) (7)Any RX Any RX Avg. dose Any RX Avg. dose Any RX Avg. dose
Panel A: All Relative DeathsDeath During Pregnancy -0.000436 0.000434 -0.000589 -0.0000939 0.00571 0.000124 0.0243
[0.00161] [0.000292] [0.00586] [0.00115] [0.00540] [0.00127] [0.0507]
Mean, dept. var 0.318 0.00560 0.0727 0.102 0.193 0.137 3.223Obs. 288606 288606 288606 288606 288606 288606 288606
Panel B: Close Relative DeathsDeath During Pregnancy 0.00146 -0.000304 -0.00316 -0.00364 0.00823 0.00298 0.0667
[0.00332] [0.000438] [0.00961] [0.00253] [0.0128] [0.00205] [0.0765]
Mean, dept. var 0.337 0.00455 0.0535 0.110 0.234 0.141 2.937Obs. 84676 84676 84676 84676 84676 84676 84676
Panel C: Maternal Parent/Sibling DeathsDeath During Pregnancy 0.000164 -0.000272 -0.00161 -0.00363 0.00702 0.00318 0.0662
[0.00335] [0.000456] [0.00951] [0.00256] [0.0129] [0.00209] [0.0746]
Mean, dept. var 0.335 0.00432 0.0514 0.109 0.230 0.139 2.922Obs. 81036 81036 81036 81036 81036 81036 81036
Note: See tables 1 and 2 for more information on the sample and controls. Robust standard errors are clustered on the mother’s munici-pality of residence in the year prior to conception. Exact definitions of the prescription drug categories are given in Online Appendix E.Significance levels: * p<0.1 ** p<0.05 *** p<0.01
A-16

Table A15: Effects of Relative Death In Utero on Main Outcomes: Heterogeneity by Maternal Education
(1) (2) (3) (4) (5) (6)LBW Pret. Any Per. Hosp. 1 Any ADHD 9-11 Any Anx 34-36 Any Dep 34-36
Death During Pregnancy 0.00372*** 0.00536*** 0.00341*** 0.00481 0.00779 0.0103[0.000817] [0.00109] [0.00120] [0.00293] [0.00535] [0.00827]
Mom Low Ed (HS or 0.00853*** 0.00759*** 0.0114*** 0.0101*** 0.0152*** 0.0138*less) [0.000929] [0.00118] [0.00147] [0.00383] [0.00432] [0.00752]
Mom Low Ed*Death -0.000135 0.00160 -0.0000795 0.00244 -0.00122 -0.00230During Preg [0.00126] [0.00165] [0.00190] [0.00505] [0.00697] [0.0102]
Mean, dept. var 0.0307 0.0483 0.0577 0.0235 0.0658 0.110Obs. 272907 273597 221999 18852 20387 20387
Note: See tables 1 and 2 for more information on the sample and controls. In column (3), the sample is further limited to co-horts born in 1987 or later (as the definition of perinatal conditions is not comparable with earlier years). In columns (4)-(6),the sample is further limited to children of mothers who experience the death of a parent or sibling. Robust standard errorsare clustered on the mother’s municipality of residence in the year prior to conception. Exact definitions of the prescriptiondrug categories are given in Online Appendix E.Significance levels: * p<0.1 ** p<0.05 *** p<0.01
A-17

Table A16: Effects of Relative Death In Utero on the Mother’s Subsequent Fertility
Dep. Var: Mother Has Subsequent Children
(1) (2) (3)All Deaths Close Relative Deaths Maternal Parent/Sib Deaths
Death During Pregnancy 0.0149*** 0.0133* 0.00636[0.00356] [0.00679] [0.00663]
Mean, dept. var 0.488 0.407 0.408Obs. 50802 16454 15724
Note: See tables 1 and 2 for more information on the sample and controls. In this table we link all of the children in ouranalysis sample to their older siblings (if they exist). Siblings data is only available for children born in years 1973, 1977,1983, 1988, 1995, 1999, 2001, and 2005. Robust standard errors are clustered on the mother’s municipality of residence inthe year prior to conception.Significance levels: * p<0.1 ** p<0.05 *** p<0.01
A-18
Online Appendix — Not for Publication
B Hypotheses and Related Literature: An Extended Discussion
In Section 2, we provide a short description of our hypotheses regarding the impact of exposure to stresson physical health at birth and later in life, differential effects across gestational age at exposure, as well asdifferential effects with respect to the severity of stress. Here we provide a more extensive discussion of eachof these hypotheses, by drawing on the burgeoning literature on early-life shocks (see Almond and Currie,2011 for a review).
Implications from Evidence on Physical In Utero Shocks First, a large number of existing studiespoint to adverse effects of exposure to physical insults during the fetal period on both birth outcomes andlater life physical health and economic well-being.53 The evidence on the consequences of purely psychologicalstressors is more limited, as studies that exploit variation from extreme and rare events like natural disastersand terrorist attacks are limited in their ability to separate the effects of in utero stress exposure from anypost-natal responses, as well as from the physical health and economic insults associated with these events.54
Our empirical methodology (described in detail in Section 4) and focus on a nearly universal stressor aredesigned to overcome these limitations.
Despite the scarce direct evidence on psychological stressors, the medical and epidemiological literaturethat tries to identify the mechanisms through which the effects of physical insults operate suggests thatmaternal stress during pregnancy plays a key role. For example, one hypothesis for why malnutrition duringpregnancy harms the unborn child is that nutritional restrictions in the mother inhibit the development ofa placental enzyme that is required to convert the stress hormone cortisol into inactive cortisone. Thus,as a consequence of maternal malnutrition, the fetus is exposed to excessive amounts of cortisol in utero.Overexposure to cortisol, in turn, is believed to lead to a reprogramming of the hypothalamic-pituitary-adrenal axis (HPA), which could lead to impaired fetal development and worse health in adult age.55 Ifstress in fact drives the adverse effects of physical insults such as malnutrition, then a rigorous analysis ofthe causal effects of in utero exposure to stress can provide new insights on the determinants of health andhuman capital formation more broadly. As such, we expect that exposure to maternal stress due to thedeath of a relative during the fetal period may have damaging effects on outcomes at birth and in later life.
53See, e.g.,Van den Berg, Lindeboom and Portrait (2006); Almond, Edlund, Li and Zhang (2010); Hoynes, Page and Stevens(2011); Almond, Hoynes and Schanzenbach (2011); Almond and Mazumder (2012); Hoynes, Schanzenbach and Almond (2012);Scholte, van den Berg and Lindeboom (2012); Rossin-Slater (2013) on malnutrition; Almond (2006); Barreca (2010) on diseaseoutbreaks; Almond, Edlund and Palme (2009); Black, Butikofer, Devereux and Salvanes (2013) on radiation; and Sanders(2012); Isen, Rossin-Slater and Walker (Forthcoming) on air pollution.
54See, for example, evidence on hurricanes (Simeonova, 2011; Currie and Rossin-Slater, 2013), earthquakes (Tan et al., 2009;Glynn et al., 2001; Torche, 2011), and the terrorist attacks of September 11 (Berkowitz et al., 2003; Lederman et al., 2004;Lauderdale, 2006; Eskenazi et al., 2007). Another recent paper uses in utero exposure to the Superbowl to identify the effectsof prenatal stress on birth outcomes (Duncan et al., 2015).
55See Dunkel Schetter (2011) as well as a review of the literature in Jaddoe (2006). Also see Online Appendix F for a moredetailed discussion.
B-19
Long-Term Effects on Physical Health Second, when it comes to physical health outcomes specifically,the “fetal origins hypothesis,” originally put forth by epidemiologist David J. Barker, argues that poorconditions in-utero can lead to latent effects on disease much later in life (Barker, 1990). However, whilethere is ample evidence both from economics and epidemiology supporting Barker’s hypothesis, this evidencecomes from studies of adults who are older than the individuals in our sample. For example, Almond (2006)documents that individuals exposed to the 1918 influenza pandemic in utero are more likely to be disabled intheir 50s and 60s, and Hoynes et al. (2012) show that access to food stamps early in life leads to a significantreduction in the incidence of “metabolic syndrome” in a sample that includes individuals up to age 55.56
This evidence suggests that—even if in utero exposure to psychological stress from family ruptures has alatent effect on physical health that appears in older ages—the time horizon over which we track our samplemay not be sufficient for us to measure it, as the oldest individuals that we observe are in their thirties.
Moreover, Black, Devereux and Salvanes (2016)’s analysis of deaths of maternal parents during pregnancyin Norway shows small detrimental impacts on birth outcomes, but no effects on adult BMI. Evidencefrom this closely related paper also suggests that we may not detect any adverse physical health effects inadulthood.57
Differential Effects Across Gestational Age at Time of Shock Third, the existing literature providessome guidance on why we might expect to see differential effects across gestational age due to physicalshocks such as infections. For example, Robinson (2013) argues that infections in early pregnancy increasethe likelihood of symmetric growth restriction of the fetus (proportional growth restriction in the brain andbody), while infections in later pregnancy may affect the likelihood of asymmetric growth restriction (braingrowth not restricted; only body). While both types exhibit physical health impairments in later life, onlythe symmetric type shows long-term brain or cognitive impairments. Empirical evidence on the effects ofdisease outbreaks supports this hypothesis to some extent—for example, Almond (2006)’s seminal study onthe 1918 influenza pandemic in the U.S. finds the strongest long-term economic effects for cohorts exposedduring their first trimester. On the other hand, follow-up work on in utero exposure to the flu in Taiwandoes not find differential impacts across the three trimesters (Lin and Liu, 2014). Moreover, studies on theimpacts of nutritional and environmental shocks in utero offer mixed evidence—some find differential effectsacross gestational age while others do not.58
56The “metabolic syndrome” in Hoynes et al. (2012) is a composite index measure that includes obesity, high blood pressure,and diabetes. Consistent with this evidence, epidemiological studies have documented a correlation between in utero exposureto the Dutch famine of 1944 and a higher incidence of obesity and heart disease when the individuals reached middle age (Susserand Lin, 1992).
57Another related paper is Li Jiong and Sorensen (2010), who use Danish data to compare the Body Mass Index (BMI)of children of mothers who experienced a death during pregnancy to children of those who did not. However, an importantlimitation is that this study does not fully account for non-random exposure to death.
58For example, Almond et al. (2011) demonstrate that the effects of access to Food Stamps on birth weight are most apparentin the third trimester. By contrast, Almond and Mazumder (2011)’s study of Ramadan fasting finds that the effects on birthweight are not statistically different across different months of pregnancy, and the coefficients are individually significant forexposure in months 1, 2, 5, and 7. Unfortunately, Hoynes et al. (2012)’s work on the long-term effects of early-life access to FoodStamps does not explore differences in effects across gestational age. When it comes to the literature on environmental shocks,studies on the impacts of radiation exposure consistently find the largest damaging effects on cognitive ability in months 3 and 4
B-20
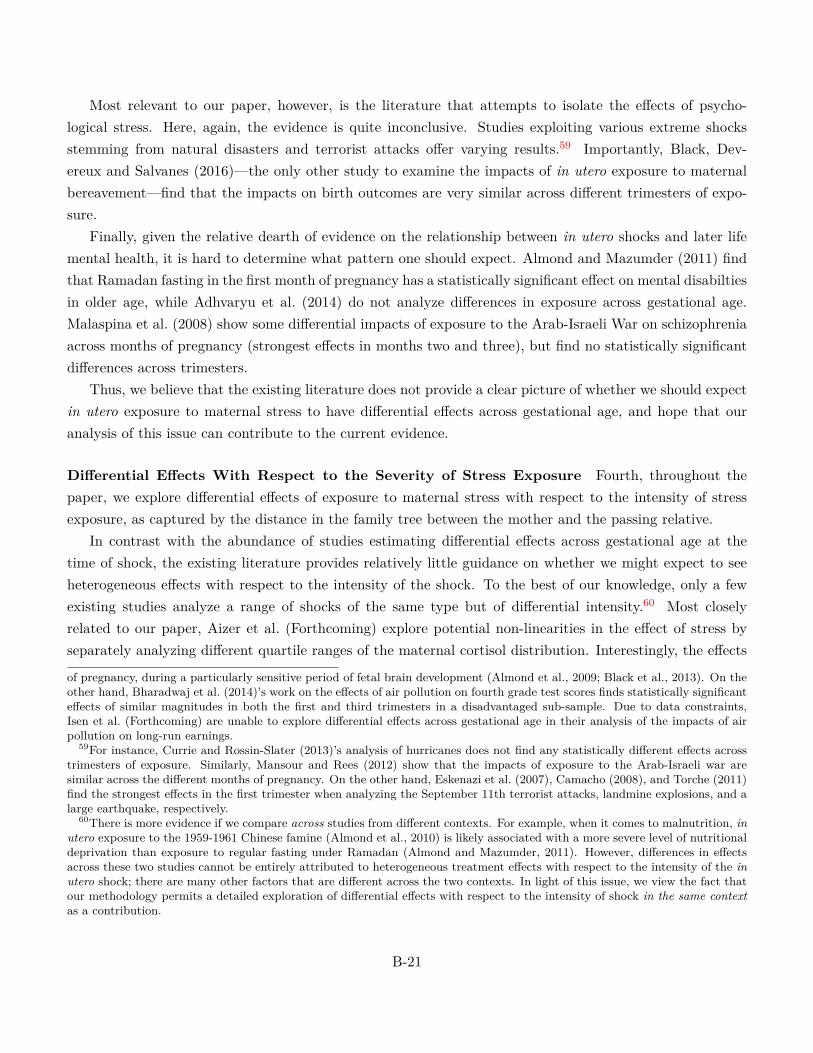
Most relevant to our paper, however, is the literature that attempts to isolate the effects of psycho-logical stress. Here, again, the evidence is quite inconclusive. Studies exploiting various extreme shocksstemming from natural disasters and terrorist attacks offer varying results.59 Importantly, Black, Dev-ereux and Salvanes (2016)—the only other study to examine the impacts of in utero exposure to maternalbereavement—find that the impacts on birth outcomes are very similar across different trimesters of expo-sure.
Finally, given the relative dearth of evidence on the relationship between in utero shocks and later lifemental health, it is hard to determine what pattern one should expect. Almond and Mazumder (2011) findthat Ramadan fasting in the first month of pregnancy has a statistically significant effect on mental disabiltiesin older age, while Adhvaryu et al. (2014) do not analyze differences in exposure across gestational age.Malaspina et al. (2008) show some differential impacts of exposure to the Arab-Israeli War on schizophreniaacross months of pregnancy (strongest effects in months two and three), but find no statistically significantdifferences across trimesters.
Thus, we believe that the existing literature does not provide a clear picture of whether we should expectin utero exposure to maternal stress to have differential effects across gestational age, and hope that ouranalysis of this issue can contribute to the current evidence.
Differential Effects With Respect to the Severity of Stress Exposure Fourth, throughout thepaper, we explore differential effects of exposure to maternal stress with respect to the intensity of stressexposure, as captured by the distance in the family tree between the mother and the passing relative.
In contrast with the abundance of studies estimating differential effects across gestational age at thetime of shock, the existing literature provides relatively little guidance on whether we might expect to seeheterogeneous effects with respect to the intensity of the shock. To the best of our knowledge, only a fewexisting studies analyze a range of shocks of the same type but of differential intensity.60 Most closelyrelated to our paper, Aizer et al. (Forthcoming) explore potential non-linearities in the effect of stress byseparately analyzing different quartile ranges of the maternal cortisol distribution. Interestingly, the effects
of pregnancy, during a particularly sensitive period of fetal brain development (Almond et al., 2009; Black et al., 2013). On theother hand, Bharadwaj et al. (2014)’s work on the effects of air pollution on fourth grade test scores finds statistically significanteffects of similar magnitudes in both the first and third trimesters in a disadvantaged sub-sample. Due to data constraints,Isen et al. (Forthcoming) are unable to explore differential effects across gestational age in their analysis of the impacts of airpollution on long-run earnings.
59For instance, Currie and Rossin-Slater (2013)’s analysis of hurricanes does not find any statistically different effects acrosstrimesters of exposure. Similarly, Mansour and Rees (2012) show that the impacts of exposure to the Arab-Israeli war aresimilar across the different months of pregnancy. On the other hand, Eskenazi et al. (2007), Camacho (2008), and Torche (2011)find the strongest effects in the first trimester when analyzing the September 11th terrorist attacks, landmine explosions, and alarge earthquake, respectively.
60There is more evidence if we compare across studies from different contexts. For example, when it comes to malnutrition, inutero exposure to the 1959-1961 Chinese famine (Almond et al., 2010) is likely associated with a more severe level of nutritionaldeprivation than exposure to regular fasting under Ramadan (Almond and Mazumder, 2011). However, differences in effectsacross these two studies cannot be entirely attributed to heterogeneous treatment effects with respect to the intensity of the inutero shock; there are many other factors that are different across the two contexts. In light of this issue, we view the fact thatour methodology permits a detailed exploration of differential effects with respect to the intensity of shock in the same contextas a contribution.
B-21
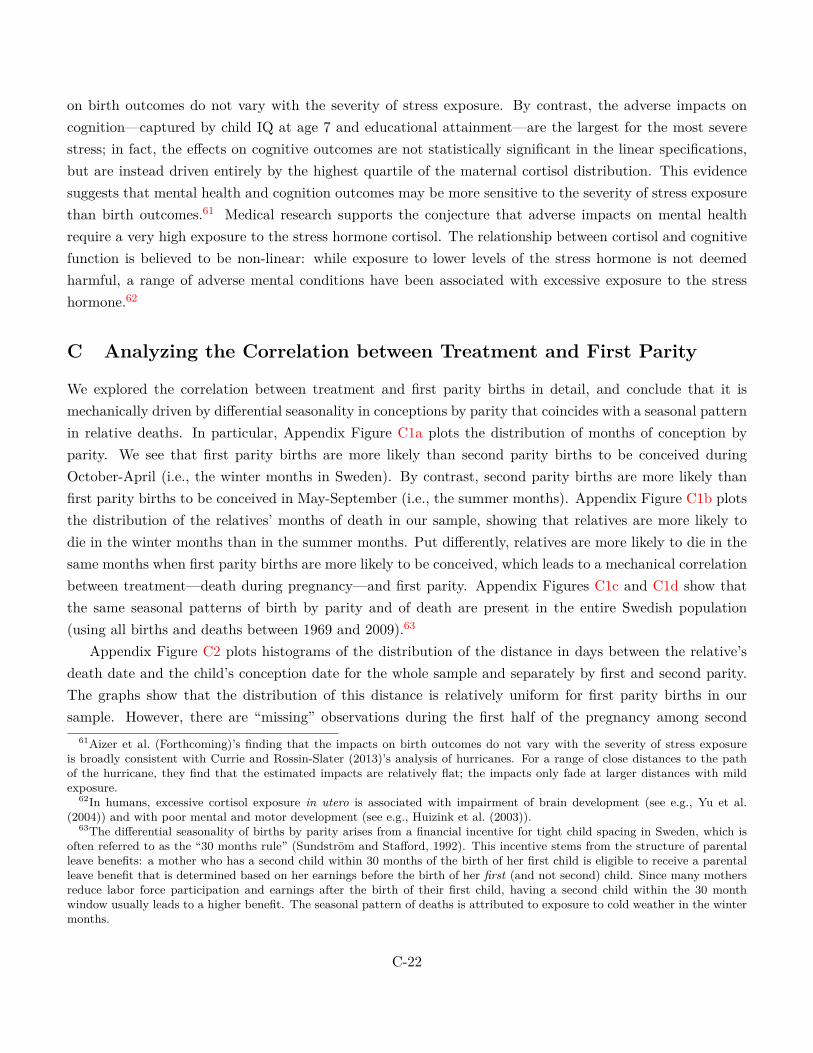
on birth outcomes do not vary with the severity of stress exposure. By contrast, the adverse impacts oncognition—captured by child IQ at age 7 and educational attainment—are the largest for the most severestress; in fact, the effects on cognitive outcomes are not statistically significant in the linear specifications,but are instead driven entirely by the highest quartile of the maternal cortisol distribution. This evidencesuggests that mental health and cognition outcomes may be more sensitive to the severity of stress exposurethan birth outcomes.61 Medical research supports the conjecture that adverse impacts on mental healthrequire a very high exposure to the stress hormone cortisol. The relationship between cortisol and cognitivefunction is believed to be non-linear: while exposure to lower levels of the stress hormone is not deemedharmful, a range of adverse mental conditions have been associated with excessive exposure to the stresshormone.62
C Analyzing the Correlation between Treatment and First Parity
We explored the correlation between treatment and first parity births in detail, and conclude that it ismechanically driven by differential seasonality in conceptions by parity that coincides with a seasonal patternin relative deaths. In particular, Appendix Figure C1a plots the distribution of months of conception byparity. We see that first parity births are more likely than second parity births to be conceived duringOctober-April (i.e., the winter months in Sweden). By contrast, second parity births are more likely thanfirst parity births to be conceived in May-September (i.e., the summer months). Appendix Figure C1b plotsthe distribution of the relatives’ months of death in our sample, showing that relatives are more likely todie in the winter months than in the summer months. Put differently, relatives are more likely to die in thesame months when first parity births are more likely to be conceived, which leads to a mechanical correlationbetween treatment—death during pregnancy—and first parity. Appendix Figures C1c and C1d show thatthe same seasonal patterns of birth by parity and of death are present in the entire Swedish population(using all births and deaths between 1969 and 2009).63
Appendix Figure C2 plots histograms of the distribution of the distance in days between the relative’sdeath date and the child’s conception date for the whole sample and separately by first and second parity.The graphs show that the distribution of this distance is relatively uniform for first parity births in oursample. However, there are “missing” observations during the first half of the pregnancy among second
61Aizer et al. (Forthcoming)’s finding that the impacts on birth outcomes do not vary with the severity of stress exposureis broadly consistent with Currie and Rossin-Slater (2013)’s analysis of hurricanes. For a range of close distances to the pathof the hurricane, they find that the estimated impacts are relatively flat; the impacts only fade at larger distances with mildexposure.
62In humans, excessive cortisol exposure in utero is associated with impairment of brain development (see e.g., Yu et al.(2004)) and with poor mental and motor development (see e.g., Huizink et al. (2003)).
63The differential seasonality of births by parity arises from a financial incentive for tight child spacing in Sweden, which isoften referred to as the “30 months rule” (Sundström and Stafford, 1992). This incentive stems from the structure of parentalleave benefits: a mother who has a second child within 30 months of the birth of her first child is eligible to receive a parentalleave benefit that is determined based on her earnings before the birth of her first (and not second) child. Since many mothersreduce labor force participation and earnings after the birth of their first child, having a second child within the 30 monthwindow usually leads to a higher benefit. The seasonal pattern of deaths is attributed to exposure to cold weather in the wintermonths.
C-22

parity births, consistent with the fact that second parity births are less likely to experience the death of arelative during early pregnancy due to the seasonal patterns discussed above.64 To address this issue, allof our analyses include month of conception and parity fixed effects, and we show that our results are alsorobust to the inclusion of parity×month of conception interactions in Online Appendix D. Moreover, wedemonstrate that our results remain strong when we limit our sample to first parity births only, which, asnoted above, exhibit a relatively uniform distribution of the distance between the relative death date andthe child’s date of conception.
64Distributions for third and higher parity births are similar to the distribution for first parity births. Only second paritybirths exhibit the “missing observations” pattern.
C-23
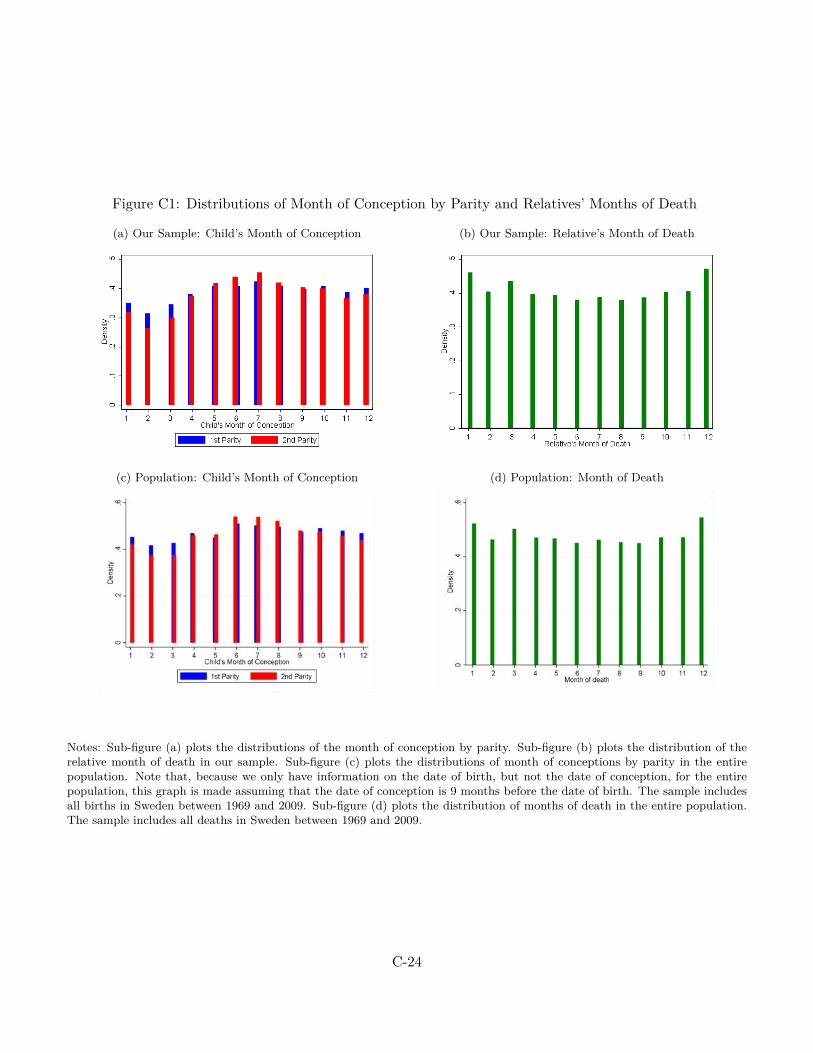
Figure C1: Distributions of Month of Conception by Parity and Relatives’ Months of Death
(a) Our Sample: Child’s Month of Conception (b) Our Sample: Relative’s Month of Death
(c) Population: Child’s Month of Conception (d) Population: Month of Death
Notes: Sub-figure (a) plots the distributions of the month of conception by parity. Sub-figure (b) plots the distribution of therelative month of death in our sample. Sub-figure (c) plots the distributions of month of conceptions by parity in the entirepopulation. Note that, because we only have information on the date of birth, but not the date of conception, for the entirepopulation, this graph is made assuming that the date of conception is 9 months before the date of birth. The sample includesall births in Sweden between 1969 and 2009. Sub-figure (d) plots the distribution of months of death in the entire population.The sample includes all deaths in Sweden between 1969 and 2009.
C-24
Figure C2: Distribution of Relative Death Dates Around Child’s Expected Birth Date
(a) All Observations (b) 1st Parity
(c) 2nd Parity
Notes: The sample includes all children whose mother loses a family member—a sibling, a parent, a grandparent, the child’sfather, or an own (older) child—within 280 days of the child’s estimated date of conception or in the year after birth. Thegraphs plot histograms of the distribution of the distance in days between the relative death date and the child’s conceptiondate. The vertical red line in each graph depicts the expected birth date at 280 days post-conception.
C-25
D Supplemental Results
Two-Stage Least Squares Models As described in Section 4, our key treatment variable is an indicatorfor a relative’s death occurring between the child’s date of conception and the expected date of birth at 280days after conception. However, we can also use this variable to instrument for exposure to death beforethe child’s actual date of birth. Appendix Table D1 presents results from two-stage least squares (2SLS)specifications for our main outcomes of interest. As the instrument (relative death before expected birthdate) is different from the actual exposure variable (relative death before actual birth date) for only about1 percent of the individuals in our data, the first stage is very strong with a coefficient of around 0.97. The2SLS results are quite similar to the main ones we present above.
“Exogenous” and Unexpected Deaths The reliability of our results rests on the assumption that thetiming of relative death within a narrow time frame surrounding the expected date of birth is uncorrelatedwith other factors that may affect child outcomes. We have already shown that this timing is generallyuncorrelated with a variety of observable parental characteristics, and that there are no placebo effects onolder siblings’ birth outcomes. Now, we also explore the sensitivity of our findings to sample limitationsbased on causes of death that are determined to be more exogenous than others.
More specifically, we turn to the work of Adda, Björklund and Holmlund (2011), who study the effectof parental death around age 18 on children’s educational and labor market outcomes in Sweden. To findplausibly exogenous causes of deaths, Adda, Björklund and Holmlund (2011) test for a placebo correlationbetween a death occurring after an outcome is determined. So, for example, a death occurring shortly afterage 18 cannot affect scores on a cognitive test taken at a younger age. They determine that the followingcauses of death pass this exogeneity test: endocrine and metabolic diseases, accidents, and other causes.65
Appendix Table D2 presents results for our main outcomes where we limit the sample to only these threecauses of death. Although we lose some power with the sample size reductions, the results are qualitativelysimilar to the main ones presented above.66
We also study plausibly unexpected causes of death by focusing on relative deaths from cardiovascularconditions (i.e., heart attacks) and instantaneous deaths from accidents in Appendix Table D3. Again, resultsremain qualitatively similar to our main ones (although both the point estimate and the standard errors arelarger), suggesting that anticipation of relative deaths is unlikely to substantially bias our estimates.
Heterogeneity by Proximity of Mother to the Relative So far, we have used the closeness of thedeceased relative to the mother on the family tree as a proxy for the severity of stress. Alternatively, onecould imagine using the geographical distance between the relative’s home and the mother’s home to measure
65Other causes are all causes except infectious and parasitic disease, neoplasms, endocrine and metabolic diseases, mental andbehavioral disorders, circulatory system, respiratory system, digestive system, accidents, suicides and homicides.
66We unfortunately cannot replicate the method used by Adda et al. (2011) to determine which causes of death are exogenousin our sample. To do this, we would need to have a comparison group of children who do not experience a relative deathsurrounding the time of their birth. However, our sample contains only individuals who experience a relative death within alimited time frame of childbirth.
D-26

“closeness”. However, physical proximity to a relative may not only capture the closeness between the motherand the relative, but also the closeness of the child’s relationship with the relative. As a consequence, post-natal stress from bereavement experienced by the child may be greater when the relative lives nearby (e.g.,the death of a frequently-visiting grandmother who lived close to the child may be a bigger shock if ithappens after birth than before). In this case, comparing in utero with post-natal deaths would lead to anunderestimate of the effect of pre-natal stress. Consistent with this story, when we explore the heterogeneityin effects by the physical proximity of the mother to the deceased relative in Appendix Table D4, we seesomewhat stronger effects for deaths of relatives who lived in different municipalities than the mothers.
Inheritances and the Severity of Stress We find that some of the adverse mental health effects arisewhen the deceased is a close relative of the expectant mother (such as her parent or sibling), but not whenwe consider deaths of other more distant relatives (namely, grandparents). As discussed above, we interpretthis difference as resulting from varying degrees of emotional stress associated with the relative’s passing.An alternative interpretation is that the adverse effects are equal, but that a grandparent’s death entails alarger income transfer to the family than the death of other closer relatives. Such an income effect couldassuage any adverse effects of stress associated with the passing of a grandparent.
To shed light on this alternative interpretation, three sources of income are relevant: bequests, generation-skipping transfers, and life insurance payouts. Appendix Table D5 displays these three sources of incomefollowing the death of a parent and grandparent, respectively, for the universe of deaths in Sweden occurringfrom 2002 to 2005.67 The three leftmost columns display the average amount in SEK in each class ofrecipients, i.e., not the average amount conditional on the amount received being greater than zero. Therightmost column displays the sum of the three income classes.
Column 1 shows the average amount received as inheritance following the death of a relative: SEK 30, 000($4, 560) from a parent and SEK 7, 000 ($1, 064) from a grandparent.68 The second relevant possibility toreceive income in conjunction with a grandparent’s passing is through a generation-skipping transfer. Column2 shows that the unconditional mean of the generation-skipping transfer to grandchildren is SEK 32, 000($4, 864), an amount roughly similar to the unconditional average inheritance from a parent. While thesenumbers are averages based on the entire population rather than our sample alone, and while inheritancesand generation-skipping transfers only occur for a strict subset of all deaths, these statistics indicate thatinheritances and generation-skipping transfers together are likely not much larger when a grandparent diesthan when a parent dies. Finally, column 3 shows that insurance payouts are small and uncommon. Together
67We display average amounts for the universe of deaths in Sweden—and not only for our sample—because the bequest dataare not linked to our dataset. Moreover, bequests data exist for the years 2002 to 2005 only. We do not observe bequests or lifeinsurance payouts from sibling deaths.
68Inheritance from a parent is far more common than inheritance from a grandparent. This is understandable in light of thefact that, in the absence of a will, an individual only inherits from her grandparent if her own parents are deceased. Moreover,less than 20 percent of all deceased in Sweden write a will; further, writing a will only enables transfer of 50% of the assets, whilethe remainder must be allocated according to the above-mentioned inheritance rules. These amounts presented in the table,however, represent averages across all spouses, children, or grandchildren of all deceased individuals, i.e., the table displays theunconditional amounts.
D-27
these facts suggest that losing a grandparent does not entail a larger positive income effect than losing other(closer) relatives.
Addressing the Correlation Between Treatment, Parity, and Foreign-Born Mothers As dis-cussed in Section 4 and in detail in Online Appendix C, we find that our treatment variable—death duringpregnancy—is statistically significantly correlated with two characteristics, child parity and the mother’splace of origin. We conduct several analyses to show that these correlations are not driving our main results.
First, Appendix Table D6 presents the results for our main outcomes of interest separately by first andsecond parity births. Given that second parity births exhibit “missing” observations in the distributionof the distance between the relative’s death date and the child’s conception date, it is reassuring that ourresults remain strong when we only focus on first parity births in Panel A.
Second, to account for the differential seasonality in births by parity, we estimate specifications thatcontrol for parity×month-of-conception fixed effects in Appendix Table D7, with results similar to the mainones presented above.
Third, in Appendix Table D8, we drop foreign-born mothers as this group exhibits a highly skeweddistribution of the distance between the relative’s death date and the child’s conception date. Our resultsremain largely unchanged.
D-28
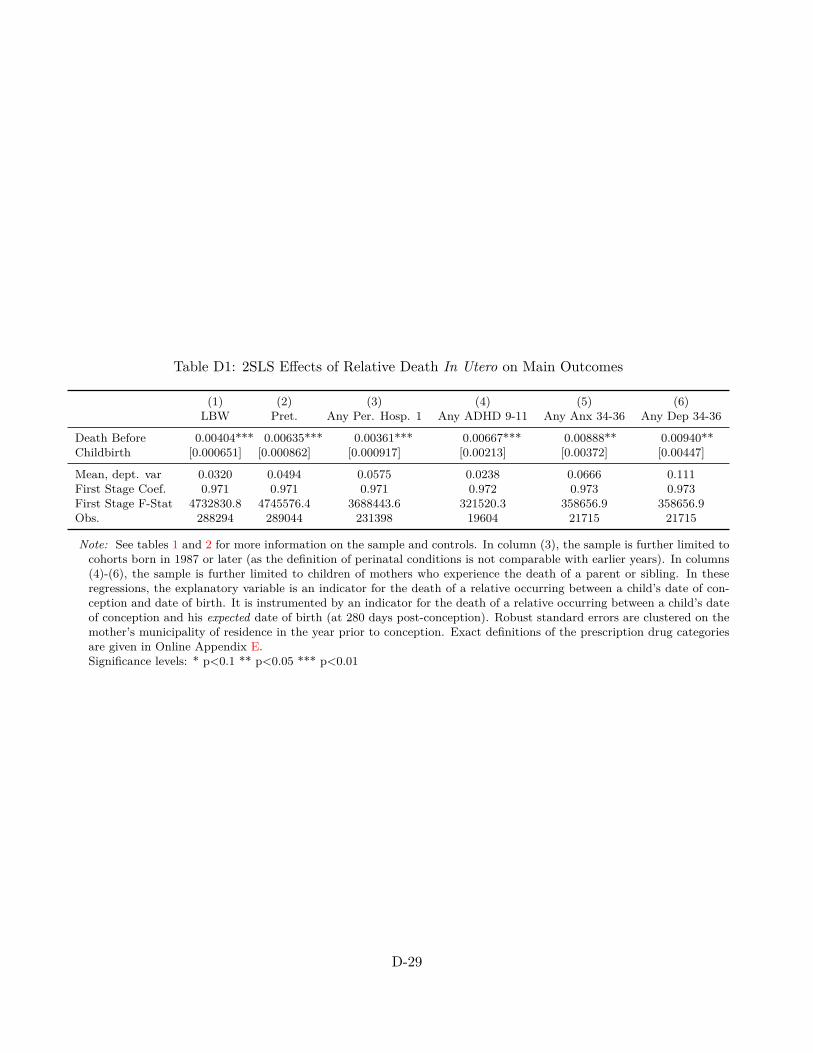
Table D1: 2SLS Effects of Relative Death In Utero on Main Outcomes
(1) (2) (3) (4) (5) (6)LBW Pret. Any Per. Hosp. 1 Any ADHD 9-11 Any Anx 34-36 Any Dep 34-36
Death Before 0.00404*** 0.00635*** 0.00361*** 0.00667*** 0.00888** 0.00940**Childbirth [0.000651] [0.000862] [0.000917] [0.00213] [0.00372] [0.00447]
Mean, dept. var 0.0320 0.0494 0.0575 0.0238 0.0666 0.111First Stage Coef. 0.971 0.971 0.971 0.972 0.973 0.973First Stage F-Stat 4732830.8 4745576.4 3688443.6 321520.3 358656.9 358656.9Obs. 288294 289044 231398 19604 21715 21715
Note: See tables 1 and 2 for more information on the sample and controls. In column (3), the sample is further limited tocohorts born in 1987 or later (as the definition of perinatal conditions is not comparable with earlier years). In columns(4)-(6), the sample is further limited to children of mothers who experience the death of a parent or sibling. In theseregressions, the explanatory variable is an indicator for the death of a relative occurring between a child’s date of con-ception and date of birth. It is instrumented by an indicator for the death of a relative occurring between a child’s dateof conception and his expected date of birth (at 280 days post-conception). Robust standard errors are clustered on themother’s municipality of residence in the year prior to conception. Exact definitions of the prescription drug categoriesare given in Online Appendix E.Significance levels: * p<0.1 ** p<0.05 *** p<0.01
D-29
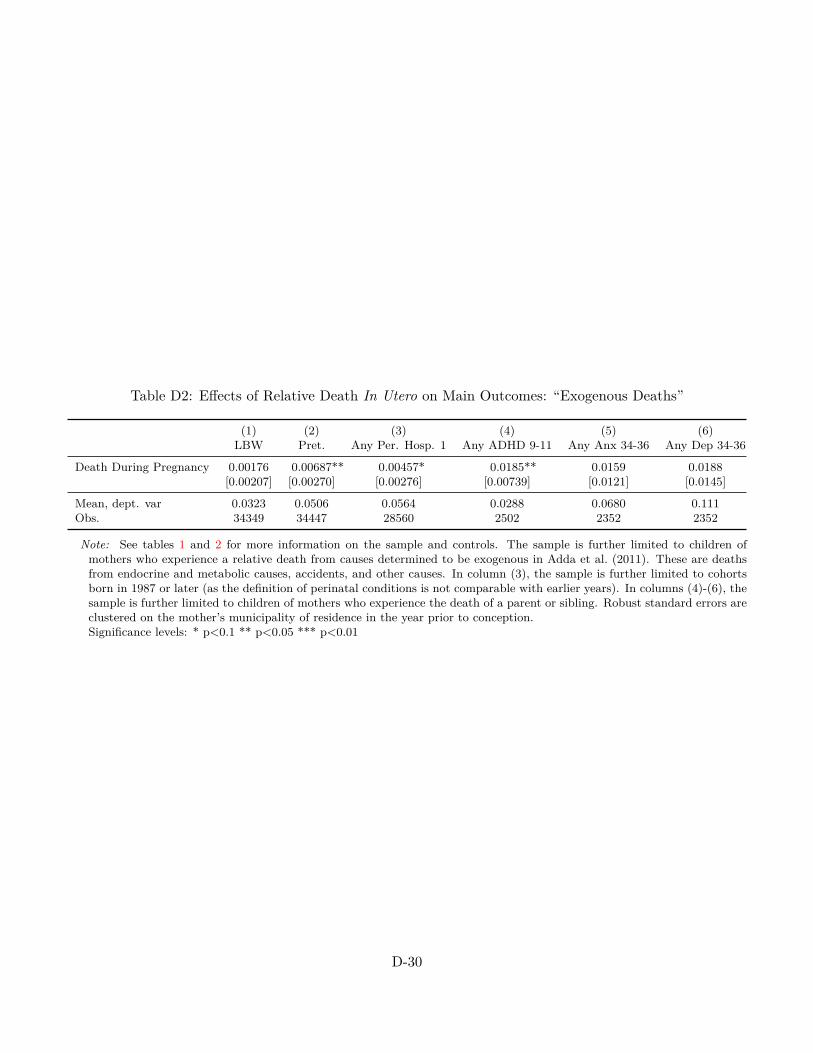
Table D2: Effects of Relative Death In Utero on Main Outcomes: “Exogenous Deaths”
(1) (2) (3) (4) (5) (6)LBW Pret. Any Per. Hosp. 1 Any ADHD 9-11 Any Anx 34-36 Any Dep 34-36
Death During Pregnancy 0.00176 0.00687** 0.00457* 0.0185** 0.0159 0.0188[0.00207] [0.00270] [0.00276] [0.00739] [0.0121] [0.0145]
Mean, dept. var 0.0323 0.0506 0.0564 0.0288 0.0680 0.111Obs. 34349 34447 28560 2502 2352 2352
Note: See tables 1 and 2 for more information on the sample and controls. The sample is further limited to children ofmothers who experience a relative death from causes determined to be exogenous in Adda et al. (2011). These are deathsfrom endocrine and metabolic causes, accidents, and other causes. In column (3), the sample is further limited to cohortsborn in 1987 or later (as the definition of perinatal conditions is not comparable with earlier years). In columns (4)-(6), thesample is further limited to children of mothers who experience the death of a parent or sibling. Robust standard errors areclustered on the mother’s municipality of residence in the year prior to conception.Significance levels: * p<0.1 ** p<0.05 *** p<0.01
D-30

Table D3: Effects of Relative Death In Utero on Main Outcomes: “Sudden Deaths”
(1) (2) (3) (4) (5) (6)LBW Pret. Any Per. Hosp. 1 Any ADHD 9-11 Any Anx 34-36 Any Dep 34-36
Death During Pregnancy 0.00341*** 0.00692*** 0.00362*** 0.0117*** 0.00898* 0.00779[0.000881] [0.00131] [0.00132] [0.00359] [0.00514] [0.00679]
Mean, dept. var 0.0328 0.0502 0.0580 0.0247 0.0685 0.111Obs. 148477 148836 117919 7419 10791 10791
Note: See tables 1 and 2 for more information on the sample and controls. The sample is further limited to children motherswho experience a relative death from “sudden” causes—cardiovascular causes (i.e., heart attacks) and instantaneous deathsfrom accidents. In column (3), the sample is further limited to cohorts born in 1987 or later (as the definition of perinatalconditions is not comparable with earlier years). In columns (4)-(6), the sample is further limited to children of motherswho experience the death of a parent or sibling. Robust standard errors are clustered on the mother’s municipality of resi-dence in the year prior to conception.Significance levels: * p<0.1 ** p<0.05 *** p<0.01
D-31
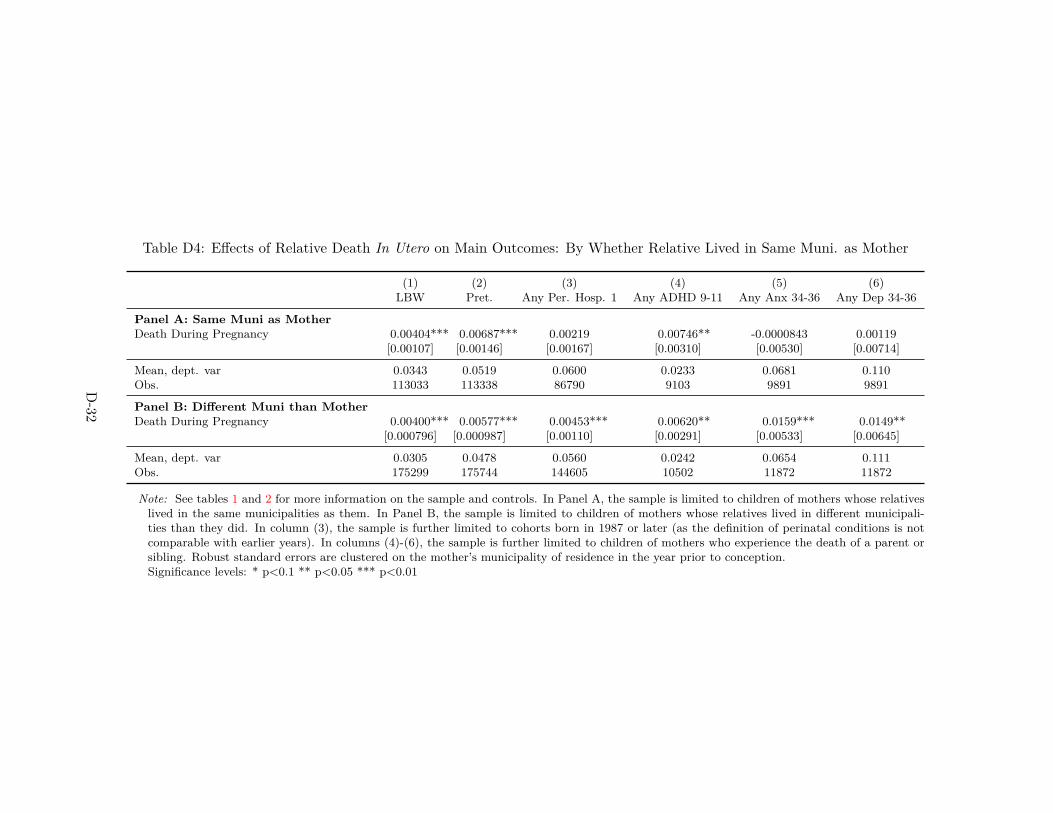
Table D4: Effects of Relative Death In Utero on Main Outcomes: By Whether Relative Lived in Same Muni. as Mother
(1) (2) (3) (4) (5) (6)LBW Pret. Any Per. Hosp. 1 Any ADHD 9-11 Any Anx 34-36 Any Dep 34-36
Panel A: Same Muni as MotherDeath During Pregnancy 0.00404*** 0.00687*** 0.00219 0.00746** -0.0000843 0.00119
[0.00107] [0.00146] [0.00167] [0.00310] [0.00530] [0.00714]
Mean, dept. var 0.0343 0.0519 0.0600 0.0233 0.0681 0.110Obs. 113033 113338 86790 9103 9891 9891
Panel B: Different Muni than MotherDeath During Pregnancy 0.00400*** 0.00577*** 0.00453*** 0.00620** 0.0159*** 0.0149**
[0.000796] [0.000987] [0.00110] [0.00291] [0.00533] [0.00645]
Mean, dept. var 0.0305 0.0478 0.0560 0.0242 0.0654 0.111Obs. 175299 175744 144605 10502 11872 11872
Note: See tables 1 and 2 for more information on the sample and controls. In Panel A, the sample is limited to children of mothers whose relativeslived in the same municipalities as them. In Panel B, the sample is limited to children of mothers whose relatives lived in different municipali-ties than they did. In column (3), the sample is further limited to cohorts born in 1987 or later (as the definition of perinatal conditions is notcomparable with earlier years). In columns (4)-(6), the sample is further limited to children of mothers who experience the death of a parent orsibling. Robust standard errors are clustered on the mother’s municipality of residence in the year prior to conception.Significance levels: * p<0.1 ** p<0.05 *** p<0.01
D-32
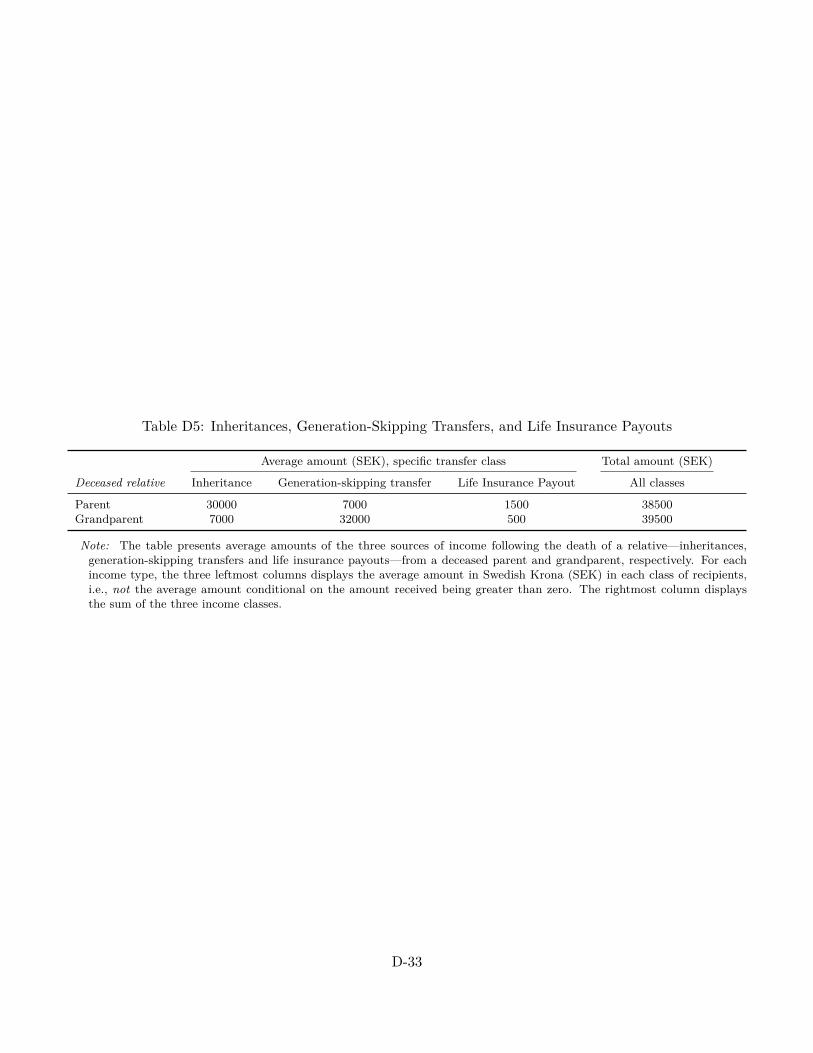
Table D5: Inheritances, Generation-Skipping Transfers, and Life Insurance Payouts
Average amount (SEK), specific transfer class Total amount (SEK)
Deceased relative Inheritance Generation-skipping transfer Life Insurance Payout All classes
Parent 30000 7000 1500 38500Grandparent 7000 32000 500 39500
Note: The table presents average amounts of the three sources of income following the death of a relative—inheritances,generation-skipping transfers and life insurance payouts—from a deceased parent and grandparent, respectively. For eachincome type, the three leftmost columns displays the average amount in Swedish Krona (SEK) in each class of recipients,i.e., not the average amount conditional on the amount received being greater than zero. The rightmost column displaysthe sum of the three income classes.
D-33

Table D6: Effects of Relative Death In Utero on Main Outcomes: By Parity
(1) (2) (3) (4) (5) (6)LBW Pret. Any Per. Hosp. 1 Any ADHD 9-11 Any Anx 34-36 Any Dep 34-36
Panel A: 1st ParityDeath During Pregnancy 0.00504*** 0.00753*** 0.00488*** 0.0101*** 0.00982 0.0123*
[0.000993] [0.00131] [0.00144] [0.00351] [0.00697] [0.00739]
Mean, dept. var 0.0396 0.0585 0.0713 0.0259 0.0702 0.112Obs. 142902 143309 117411 7910 7651 7651
Panel B: 2nd ParityDeath During Pregnancy 0.00191** 0.00474*** 0.00120 -0.00125 0.00787 0.0128*
[0.000912] [0.00115] [0.00137] [0.00356] [0.00557] [0.00750]
Mean, dept. var 0.0224 0.0373 0.0417 0.0205 0.0622 0.105Obs. 99669 99898 79834 7020 8667 8667
Note: See tables 1 and 2 for more information on the sample and controls. In Panel A, the sample is limited to 1st paritychildren. In Panel B, the sample is limited to 2nd parity children. In column (3), the sample is further limited to cohortsborn in 1987 or later (as the definition of perinatal conditions is not comparable with earlier years). In columns (4)-(6), thesample is further limited to children of mothers who experience the death of a parent or sibling. Robust standard errors areclustered on the mother’s municipality of residence in the year prior to conception.Significance levels: * p<0.1 ** p<0.05 *** p<0.01
D-34
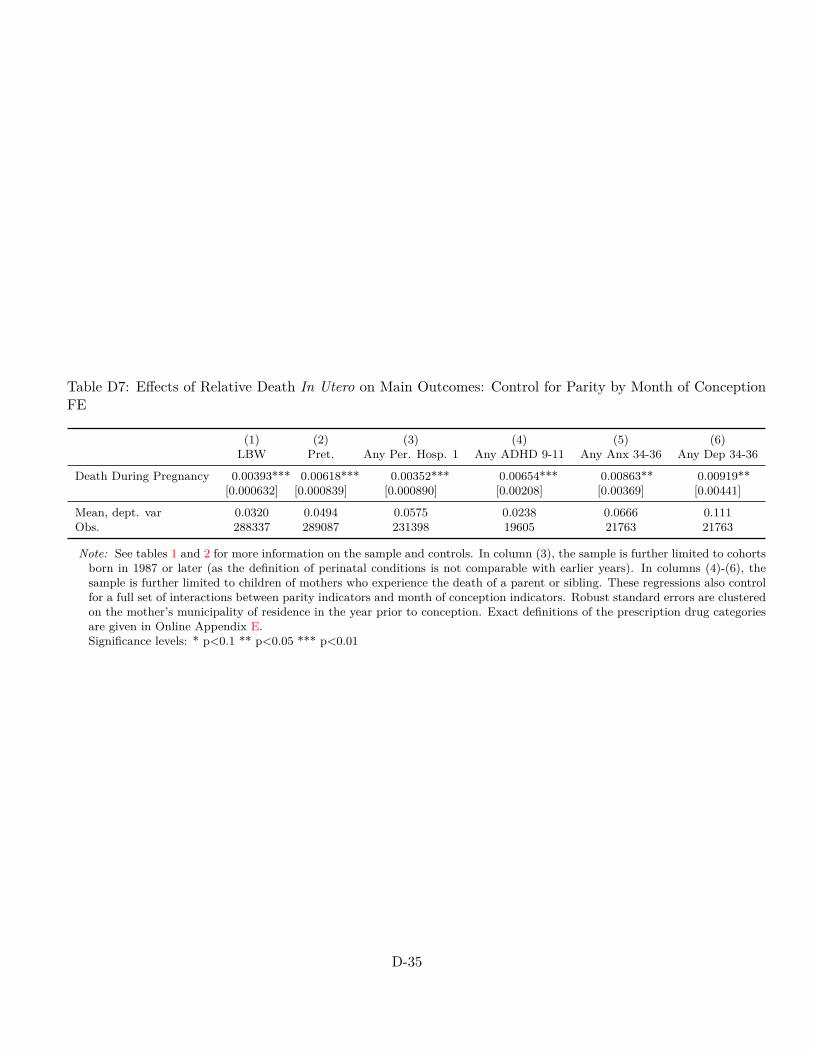
Table D7: Effects of Relative Death In Utero on Main Outcomes: Control for Parity by Month of ConceptionFE
(1) (2) (3) (4) (5) (6)LBW Pret. Any Per. Hosp. 1 Any ADHD 9-11 Any Anx 34-36 Any Dep 34-36
Death During Pregnancy 0.00393*** 0.00618*** 0.00352*** 0.00654*** 0.00863** 0.00919**[0.000632] [0.000839] [0.000890] [0.00208] [0.00369] [0.00441]
Mean, dept. var 0.0320 0.0494 0.0575 0.0238 0.0666 0.111Obs. 288337 289087 231398 19605 21763 21763
Note: See tables 1 and 2 for more information on the sample and controls. In column (3), the sample is further limited to cohortsborn in 1987 or later (as the definition of perinatal conditions is not comparable with earlier years). In columns (4)-(6), thesample is further limited to children of mothers who experience the death of a parent or sibling. These regressions also controlfor a full set of interactions between parity indicators and month of conception indicators. Robust standard errors are clusteredon the mother’s municipality of residence in the year prior to conception. Exact definitions of the prescription drug categoriesare given in Online Appendix E.Significance levels: * p<0.1 ** p<0.05 *** p<0.01
D-35
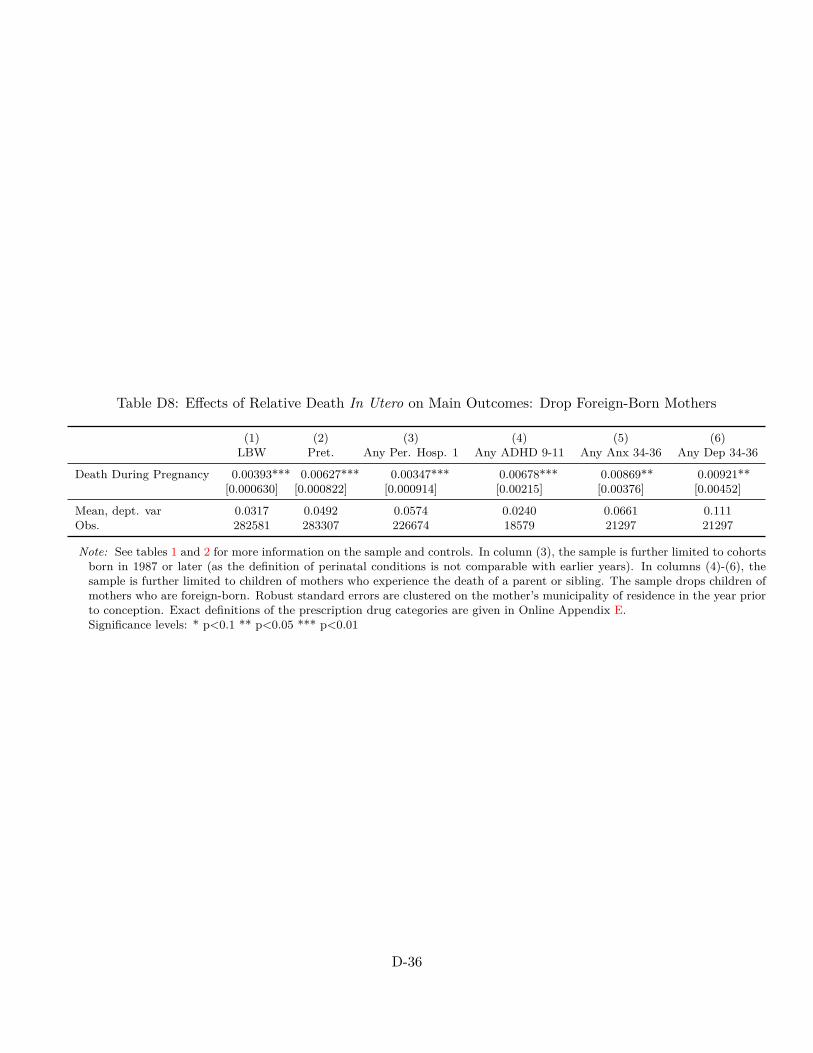
Table D8: Effects of Relative Death In Utero on Main Outcomes: Drop Foreign-Born Mothers
(1) (2) (3) (4) (5) (6)LBW Pret. Any Per. Hosp. 1 Any ADHD 9-11 Any Anx 34-36 Any Dep 34-36
Death During Pregnancy 0.00393*** 0.00627*** 0.00347*** 0.00678*** 0.00869** 0.00921**[0.000630] [0.000822] [0.000914] [0.00215] [0.00376] [0.00452]
Mean, dept. var 0.0317 0.0492 0.0574 0.0240 0.0661 0.111Obs. 282581 283307 226674 18579 21297 21297
Note: See tables 1 and 2 for more information on the sample and controls. In column (3), the sample is further limited to cohortsborn in 1987 or later (as the definition of perinatal conditions is not comparable with earlier years). In columns (4)-(6), thesample is further limited to children of mothers who experience the death of a parent or sibling. The sample drops children ofmothers who are foreign-born. Robust standard errors are clustered on the mother’s municipality of residence in the year priorto conception. Exact definitions of the prescription drug categories are given in Online Appendix E.Significance levels: * p<0.1 ** p<0.05 *** p<0.01
D-36
E Definitions of Health-Related Outcomes
Diagnosis (ICD) codes For all children and siblings, we get obtain comprehensive inpatient medicalrecords for all visits associated with the following diagnosis codes (ICD-10):
• Psychological disease (F00-F99)
• Suicide (X60-X84)
• Type II diabetes (E10-E14)
• Obesity (E65-E68)
• Heart disease (I20-I25, I30-I52)
• Neoplasms (C00-D48)
• Cushing’s syndrome (E24)
• Perinatal (P00-P96)
• Deformations at birth (Q00-Q99)
• Drug and alcohol abuse (Z72)
• Thyroid-related issues (E00-E07)
• External cause (S00-T98, V01-Y98)
• Sexually transmitted disease (A50-A64)
• Stroke (I61-I64)
For earlier years, the analogous ICD-9 and ICD-8 codes are applied.
Prescription drug (ATC) codes Prescription drugs are classified according to the Anatomical Ther-apeutic Chemical Classification System (ATC). To associate certain prescription drugs to mental healthdiagnoses, we use the classification system below, employed by the National Board of Health and Welfare inSweden (Socialstyrelsen, 2012):
• Mental health (all): ATC-code begins by “N.”
• ADHD: ATC-code begins by “N06BA”
• Bipolar disease: ATC-code begins by “N05AN01”
• Psychotic conditions: ATC-code begins by “N05A," but excluding "N05AN01”
E-37
• Depression: ATC-code begins by “N06A”
• Anxiety: ATC-code begins by “N05B”
• Sleeping disorders: ATC-code begins by “N05C”
• Addiction: ATC-code begins by “N07”
• Parkinson: ATC-code begins by “N04”
• Diabetes: ATC-code begins by “A10.”
• Obesity: ATC-code begins by “A08AB01" or "A08AA10.”
• Cushing’s syndrome: ATC-code begins by “J02AB0.”
• Neoplasm: ATC-code begins by “L01.”
• Thyroid: ATC-code begins by “L01.”
F Stress In Utero: More References
While it is well established that malnutrition in pregnant women affects the unborn child, the mechanismthrough which maternal adversity impacts the child is not well understood. One prominent theory proposes aneuro-scientific mechanism in which stress plays a key role (Jaddoe, 2006). It is hypothesized that nutritionalrestrictions inhibit the development of a placental enzyme that is required to convert the stress hormonecortisol into inactive cortisone. As a consequence of maternal malnutrition, the fetus is thus exposed toexcessive amounts of cortisol in utero. Overexposure to cortisol, in turn, is believed to lead to a reprogram-ming of the hypothalamic-pituitary-adrenal axis (HPA), which could lead to impaired fetal development andworse health in adult age (Jaddoe, 2006).
Substantial evidence from preclinical laboratory studies show that the offspring of prenatally stressedanimals displays over activity and impaired negative feedback regulation of the HPA, alternations which havebeen linked to a diverse spectrum of psychopathology, including schizophrenia and depression (M., 2001;Huizink AC, 2004; Kofman, 2002). Nevertheless, in humans, evidence of an explicit link between maternalstress and long-term disturbance in the HPA is scarce (Kapoor A and Matthews, 2006). A significantassociation between measures of prenatal anxiety and individual differences in salivary cortisol has beenestablished in a sample of 10-year-old children from the Avon Longitudinal Study of Parents and Children(ALSPAC)(O’Connor TG, 2005). In another sample, young children whose mothers exhibited higher levelsof morning cortisol during pregnancy were found to show higher levels of salivary cortisol (Gutteling BM,2004, 2005). These results suggest that prenatal anxiety can have lasting effects on HPA functioning in thechild, and are consistent with the hypothesis that that prenatal anxiety might constitute a mechanism foran increased vulnerability to psychopathology in children and adolescents.
F-38

In humans, researchers have also documented an association between antenatal maternal stress and anincreased risk of obstetric complications such as preterm birth, low birth weight, and fetal distress (Crandon,1979; Lou HC, 1994; Wadhwa PD, 1993), negative reactivity to novelty (Davis EP, 2004), an increase inneonatal crying (Rieger M, 2004), behavioral and/or emotional abnormalities at young ages (O’Connor TG,2002), a depressed Apgar score (Crandon, 1979; Ponirakis A, 1998), and a higher incidence of ADHD duringchildhood (Van den Bergh BRH, 2004, 2005). Moreover, in a rare study of the association between maternalstress and non-health related outcomes, researchers established that maternal depression at mid-gestationwas associated with a small but significant increase in violent crime in Finland (MakiP, 2003). While thesestudies establish correlations between antenatal maternal stress and outcomes later in life, the causal linkis not clear. The studies assess the level of maternal anxiety and stress using the mother’s own rating ofsymptoms, and some studies also included cortisol measures or an appraisal of recently experienced adverselife events such as divorce, job loss, or marital discord. Because these measures may not be independent ofunobserved factors that affect child outcomes, maternal stress may be endogenous.
F-39

ReferencesAdda, Jérôme, Anders Björklund, and Helena Holmlund, “The Role of Mothers and Fathers in Providing
Skills: Evidence from Parental Deaths,” Discussion Paper 5425, Institute for the Study of Labor (IZA) 2011.
Adhvaryu, Achyuta, James Fenske, and Anant Nyshadham, “Early Life Circumstance and Adult MentalHealth,” 2014. University of Michigan, Working Paper.
Aizer, Anna, Laura Stroud, and Stephen Buka, “Maternal stress and child well-being: Evidence from siblings,”Journal of Human Resources, Forthcoming.
Almond, D., “Is the 1918 Influenza pandemic over? Long-term e�ects of in utero Influenza exposure in the post-1940US population,” Journal of Political Economy, 2006, 114 (4), 672–712.
and B. Mazumder, “Health Capital and the Prenatal Environment: The E�ect of Ramadan Observance duringPregnancy,” American Economic Journal: Applied Economics, 2011, 3 (4), 56–85.
and J. Currie, “Human Capital Development before Age Five,” in O. Ashenfleter and D. Card, eds., Handbookof Labor Economics, Vol. 4, Elsevier, 2011, pp. 1315–1486.
Almond, Douglas and Bhashkar Mazumder, “Fetal origins and Parental Responses,” Working Paper 2012-14,Federal Reserve Board of Chicago 2012.
, Hilary W Hoynes, and Diane Whitmore Schanzenbach, “Inside the war on poverty: The impact of foodstamps on birth outcomes,” The Review of Economics and Statistics, 2011, 93 (2), 387–403.
, Lena Edlund, and Mårten Palme, “Chernobyl’s Subclinical Legacy: Prenatal Exposure to Radioactive Falloutand School Outcomes in Sweden,” The Quarterly Journal of Economics, November 2009, 124 (4), 1729–1772.
, , Hongbin Li, and Junsen Zhang, “Long-Term E�ects of Early-Life Development: Evidence from the 1959 to1961 China Famine,” in “The Economic Consequences of Demographic Change in East Asia, NBER-EASE Volume19,” University of Chicago Press, 2010, pp. 321–345.
Barker, David J, “The fetal and infant origins of adult disease,” BMJ: British Medical Journal, 1990, 301 (6761),1111.
Barreca, Alan I, “The long-term economic impact of in utero and postnatal exposure to malaria,” Journal of HumanResources, 2010, 45 (4), 865–892.
Berkowitz, Gertrud S, Mary S Wol�, Teresa M Janevic, Ian R Holzman, Rachel Yehuda, and Philip JLandrigan, “The World Trade Center disaster and intrauterine growth restriction,” Jama, 2003, 290 (5), 595–596.
Bharadwaj, Prashant, Matthew Gibson, Joshua Gra� Zivin, and Christopher A Neilson, “Gray Matters:Fetal Pollution Exposure and Human Capital Formation,” Technical Report 20662, National Bureau of EconomicResearch 2014.
Black, Sandra E, Aline Butikofer, Paul J Devereux, and Kjell G Salvanes, “This Is Only a Test? Long-RunImpacts of Prenatal Exposure to Radioactive Downfall,” NBER Working Paper 18987, 2013.
, Paul J Devereux, and Kjell G. Salvanes, “Does Grief Transfer across Generations? Bereavements duringPregnancy and Child Outcomes,” American Economic Journal: Applied Economics, 2016, 8 (1).
CA, Porto M Dunkel-Schetter C Garite TJ Wadhwa PD Sandman, “The association between prenatal stressand infant birth weight and gestational age at birth: a prospective investigation,” American journal of obstetricsand gynecology, 1993, 169 (4), 858:865.
Camacho, Adriana, “Stress and birth weight: evidence from terrorist attacks,” The American Economic Review,2008, pp. 511–515.
Crandon, AJ, “Maternal anxiety and obstetric complications.,” Journal of Psychosomatic Research, 1979, 23 (2),109:111.
Currie, Janet and Maya Rossin-Slater, “Weathering the storm: Hurricanes and birth outcomes,” Journal ofHealth Economics, 2013, 32 (3), 487 – 503.
D, Nordentoft M Pryds O Jensen F Nim J Hemmingsen R Lou HC Hansen, “Developmental medicine andchild neurology„” Journal of Psychosomatic Research, 1994, 36 (9), 826:832.
F-39

de Weerth C, Buitelaar JK Gutteling BM, “Maternal prenatal stress and 4-6 year old children’s salivary cortisolconcentrations pre- and post-vaccination,” Stress, 2004, 7 (4), 257:260.
, “Prenatal stress and children’s cortisol reaction to the first day of school,” Psychoneuroendocrinology, 2005, 30 (6),541:549.
den Bergh BRH, Marcoen A. Van, “High antenatal maternal anxiety is related to ADHD symptoms, externalizingproblems and anxiety in 8/9-year-olds,” Child Development, 2004, 75 (4), 1085:1097.
den Bergh BRH Mennes M, Oosterlaan J Stevens V Stiers P Marcoen A Lagae L. Van, “High ante-natal maternal anxiety is related to impulsivity during performance on cognitive tasks in 14- and 15-year-olds,”Neuroscience and biobehavioral reviews, 2005, 29 (2), 259:269.
Duncan, Brian, Hani Mansour, and Daniel I Rees, “Prenatal Stress and Low Birth Weight: Evidence from theSuper Bowl,” Discussion Paper 9053, Institute for the Study of Labor (IZA) 2015.
E, Kostaki A Andrews MH Kapoor A Dunn and Stephen G Matthews, “Fetal programming of hypothalamo-pituitary-adrenal function: prenatal stress and glucocorticoids,” Journal of Physiology, 2006, 572 (1), 31:44.
E, Stifter C. Ponirakis A Susamn, “Negative emotionality and cortisol during adolescent pregnancy and its e�ectson infant health and autonomic nervous system reactivity,” Developmental Psychobiology, 1998, 33 (2), 163:174.
EJ, Buitelaar JK Huizink AC Mulder, “Prenatal stress and risk for psychopathology: specific e�ects or inductionof general susceptibility?,” Psychological Bulletin, 2004, 130 (1), 115:142.
Eskenazi, Brenda, Amy R Marks, Ralph Catalano, Tim Bruckner, and Paolo G Toniolo, “Low birthweightin New York City and upstate New York following the events of September 11th,” Human Reproduction, 2007, 22(11), 3013–3020.
Glynn, Laura M, Pathik D Wadhwa, Christine Dunkel-Schetter, Aleksandra Chicz-DeMet, and Curt ASandman, “When stress happens matters: e�ects of earthquake timing on stress responsivity in pregnancy,”American journal of obstetrics and gynecology, 2001, 184 (4), 637–642.
Hoynes, Hilary, Marianne Page, and Ann Hu� Stevens, “Can targeted transfers improve birth outcomes?:Evidence from the introduction of the WIC program,” Journal of Public Economics, 2011, 95 (7), 813–827.
Hoynes, H.W., D.W. Schanzenbach, and D. Almond, “Long Run Impacts of Childhood Access to the SafetyNet,” Technical Report, National Bureau of Economic Research 2012.
Huizink, Anja, Pascale Robles de Medina, Eduard Mulder, Gerard Visser, and Jan Buitelaar, “StressDuring Pregnancy is Associated with Developmental Outcome in Infancy,” Journal of Child Psychology and Psy-chiatry, 2003, 44 (6), 810–818.
Isen, Adam, Maya Rossin-Slater, and Reed Walker, “Every Breath You Take — Every Dollar You’ll Make:The Long-Term Consequences of the Clean Air Act of 1970,” Journal of Political Economy, Forthcoming.
J, Golding J Beveridge M Glover V. O’Connor TG Heron, “Maternal antenatal anxiety and children’s be-havioural/emotional problems at 4 years. Report from the Avon Longitudinal Study of Parents and Children.,” TheBritish journal of psychiatry : the journal of mental science, 2002, 180 (1), 502:508.
J, Rasanen P Joukamaa M Valonen P Jokelainen J Isohanni M. MakiP Veijola, “Criminality in the o�springof antenatally depressed mothers: a 33-year follow-up of the Northern Finland 1966 Birth Cohort,” Journal ofA�ective Disorders, 2003, 74 (3), 273:278.
Jaddoe, Witteman, “Hypotheses on the fetal origins of adult diseases: contributions of epidemiological studies,”Eur J Epidemiol, 2006, 21 (2), 91:102.
K-M, Buske-Kirschbaum A Wurmser H Papousek M Hellhammer DA Rieger M Pirke, “Influence ofstress during pregnancy on neonatal behavior,” Annals of the New York Academy of Science, 2004, 1032 (1), 1–3.
Kofman, O., “The role of prenatal stress in the etiology of developmental behavioural disorders,” Neuroscience andbiobehavioral review, 2002, 26 (4), 457:470.
Kotelchuck, Milton, “An evaluation of the Kessner Adequacy of Prenatal Care Index and a proposed Adequacy ofPrenatal Care Utilization Index.,” American journal of public health, 1994, 84 (9), 1414–1420.
F-40
Lauderdale, Diane S, “Birth outcomes for Arabic-named women in California before and after September 11,”Demography, 2006, 43 (1), 185–201.
Lederman, Sally Ann, Virginia Rauh, Lisa Weiss, Janet L Stein, Lori A Hoepner, Mark Becker, andFrederica P Perera, “The e�ects of the World Trade Center event on birth outcomes among term deliveries atthree lower Manhattan hospitals,” Environmental Health Perspectives, 2004, pp. 1772–1778.
Lin, Ming-Jen and Elaine M Liu, “Does in utero exposure to Illness matter? The 1918 influenza epidemic inTaiwan as a natural experiment,” Journal of health economics, 2014, 37, 152–163.
M., Weinstock, “Alterations induced by gestational stress in brain morphology and behaviour of the o�spring,”Progress in Neurobiology, 2001, 65 (5), 427:451.
Malaspina, D, C Corcoran, KR Kleinhaus, MC Perrin, S Fennig, D Nahon, Y Freidlander, and S Harlap,“Acute maternal stress in pregnancy and schizophrenia in o�spring: A cohort prospective study,” BMC Psychiatry,2008, 8 (71), 1473–1491.
Mansour, Hani and Daniel I Rees, “Armed conflict and birth weight: Evidence from the al-Aqsa Intifada,” Journalof Development Economics, 2012, 99 (1), 190–199.
N, Wadhwa PD-Dunkel Schetter C Glynn L Sandman CA Davis EP Snidman, “Prenatal maternal anxietyand depression predict negative behavioral reactivity in infancy,” Infancy, 2004, 6 (3), 319:331.
Olsen, Mogens Vestergaard Carsten Olsen Jennifer L. Baker Li Jiong Jorn and Thorkild I. A. Sorensen,“Prenatal stress exposure related to maternal bereavement and risk of childhood overweight,” PLoS ONE, 2010, 5(7), e11896.
Robinson, Joshua J, “Sound body, sound mind? Asymmetric and symmetric fetal growth restriction and humancapital development,” 2013. University of Alabama at Birmingham, unpublished manuscript.
Rossin-Slater, Maya, “WIC in your neighborhood: New evidence on the impacts of geographic access to clinics,”Journal of Public Economics, 2013, 102 (0), 51 – 69.
Sanders, N.J., “What Doesn’t Kill You Makes You Weaker: Prenatal Pollution Exposure and Educational Out-comes,” Journal of Human Resources, 2012, 47 (3), 826–850.
Schetter, Christine Dunkel, “Psychological science on pregnancy: stress processes, biopsychosocial models, andemerging research issues,” Annual review of psychology, 2011, 62, 531–558.
Scholte, Robert S., Gerard J. van den Berg, and Maarten Lindeboom, “The Long-Run E�ects of GestationDuring the Dutch Hunger Winter Famine on Labor Market and Hospitalization Outcomes,” Discussion Paper 6307,Institute for the Study of Labor (IZA) 2012.
Simeonova, Emilia, “Out of Sight, Out of Mind? Natural Disasters and Pregnancy Outcomes in the USA,” CESifoEconomic Studies, 2011, 57 (3), 403:431.
Socialstyrelsen, “Användning av centralstimulantia vid adhd,” Socialstyrelsens Rapporter, 2012.Sundström, Marianne and Frank P. Sta�ord, “Female labour force participation, fertility and public policy in
Sweden,” European Journal of Population, 1992, 8, 199 – 215.Susser, Ezra S and Shang P Lin, “Schizophrenia after prenatal exposure to the Dutch Hunger Winter of 1944-
1945,” Archives of general psychiatry, 1992, 49 (12), 983.Tan, Cong E, Hong Jun Li, Xian Geng Zhang, Hui Zhang, Pei Yu Han, Qu An, Wei Jun Ding, and
Mi Qu Wang, “The impact of the Wenchuan earthquake on birth outcomes,” PLoS One, 2009, 4 (12), e8200.Torche, Florencia, “The e�ect of maternal stress on birth outcomes: exploiting a natural experiment,” Demography,
2011, 48 (4), 1473–1491.Van den Berg, G. J., M. Lindeboom, and F. Portrait, “Economic Conditions Early in Life and Individual
Mortality,” American Economic Review, 2006, 96, 290–302.Y, Heron J Golding J Adams D Glover V O’Connor TG Ben-Shlomo, “Prenatal anxiety predicts individual
di�erences in cortisol in pre-adolescent children,” Biological Psychiatry, 2005, 58 (3), 211:217.Yu, In Tag, Sang-Hun Lee, Yong-Sung Lee, and Hyeon Son, “Di�erential e�ects of corticosterone and dexam-
ethasone on hippocampal neurogenesis in vitro,” Biochemical and biophysical research communications, 2004, 317(2), 484–90.
F-41