Embed Size (px)
Citation preview
Famous Brands Limited Incorporated in the Republic of South AfricaRegistration number: 1969/004875/06JSE share code: FBRISIN: ZAE000053328
UNAUDITED CONDENSED CONSOLIDATED INTERIM FINANCIAL RESULTS FOR THE SIX MONTHS ENDED 31 AUGUST 2018
GROUP FINANCIAL INDICATORSBrands‐ Strong organic growth reported in SA and AME by Leading brands‐ GBK’s continued underperformance mitigated with CVA restructure strategy
Logistics‐ Commenced 10‐year capacity‐building programme
Manufacturing ‐ Launched plant‐wide efficiencies programme with rewarding initial results
REVENUE up 5.4%
OPERATING PROFIT BEFORE NON‐OPERATIONAL ITEMS up 3.9%
OPERATING MARGIN 11.8%
HEADLINE EARNINGS PER SHARE up 10.6%
COMMENTARYOPERATING ENVIRONMENT
‐ SOUTH AFRICA AND THE REST OF AFRICA AND MIDDLE EAST (AME) REGION While the influx of new international operators has slowed, the competitive landscape remained intense, with industry participants under pressure to innovate on menu offerings and price ladders to retain market share and generate viable margins in the current price‐sensitive environment.
Country‐specific risks in SA also continued to shape the operating context, with consumers facing sustained financial hardship and socio‐political uncertainty. Businesses across the economy were adversely affected by service delivery protests, industrial action and civil unrest, while the provision of basic services deteriorated further, exacerbated by local administration inefficiencies and disruptions caused by water shortages and cable theft. Despite this context, segments of the South African consumer base showed early indications of optimism and improved confidence in the wake of recent positive developments in government leadership. ‐ UNITED KINGDOM (UK) The trading environment was characterised by intensified competition, declining footfall in malls, and rising input costs of labour and property rates. The slow pace of progress on Brexit negotiations also continued to subdue consumer sentiment.
‐ GENERAL Across all our markets, delivery and online ordering remained key drivers of growth in the industry. Notably, Fast Casual and Quick Service offerings continued to outperform Casual Dining establishments, largely due to their perceived appeal as convenient and less expensive, in a constrained disposable income environment. In SA and the AME, the Quick Service segment of the industry continued to benefit from upward social mobility of the population, the relatively young demographic profile of consumers and growing
urbanisation.
GROUP PERFORMANCEIn line with the information provided in the voluntary performance update issued on 16 August 2018, the Group’s SA and AME operations (with the exception of Coega Concentrate) delivered good growth and a solid improvement in operating profit for the six months ended 31 August 2018. As forecast, the GBK operation continued to underperform the Board and management’s expectations, recording a larger operating loss than the prior comparable period.
Remedial measures regarding the two underperforming entities, Coega Concentrate and GBK, are discussed in the "Subsequent events" commentary in this document.
At the start of the review period, management reiterated our strategic focus on the key pillars and core competencies of this business, being our Brands, Logistics and Manufacturing operations. We noted that our priorities are: to promote sustainable growth through increasing capability and capacity across the divisions; judicious capital allocation; and to sweat our investments and ensure the projects we expend the most resources on deliver a proportional return on investment.
As reflected by the Group's results for the period, good progress was achieved in delivering against the following strategies:
SOUTH AFRICABrands‐ We prioritised our Leading mainstream brands, upweighting resource support.‐ Expanded the home delivery offering across all our brands.‐ Grew capability in the digital and social media arenas; and‐ Entrenched our presence in key AME markets.‐ We are currently rolling out ground‐breaking campaigns to entrench market leadership of our Leading brands.‐ Our plans to expand tashas footprint in the UAE are on track.‐ The pipeline of new and relevant branded offers is well advanced.
Logistics‐ We commenced implementation of a 10‐year programme, Project Decade, aimed at steadily building capacity and catering for planned longer term growth.
Manufacturing‐ We launched our plant‐wide efficiencies programme, Manufacturing Way, with rewarding initial results.‐ We have established new partnerships in our general foodservice supply and fruit juice businesses, namely FoodConnect and TruBev (formerly TruFruit), and expect them to deliver good results.‐ The Lamberts Bay Foods business, acquired in 2016, has delivered satisfying results.
AME ‐ We continued to grow the footprint and contribution of our Leading brands in the region.‐ We commenced trialling an improved delivery offering, with pleasing initial results.‐ Solid progress was made in strengthening our marketing capability and aligning social media platforms with the SA operation.‐ We continued to leverage remedial improvements in the Mr Bigg's business in Nigeria.
UKNotwithstanding the effect of the difficult macroeconomic climate on the GBK business, management identified the following areas at the end of the prior financial year as requiring urgent attention: operational benchmarks which no longer met gold standards; the need for improved customer engagement across the offering; sub‐optimal management capacity; and lack of traction in key growth areas, including the delivery component. In this regard, a range of key strategic imperatives and corrective measures were outlined, and good progress has been achieved regarding the following:‐ The core leadership team has been strengthened and management oversight improved.
‐ We have re‐established and leveraged GBK's brand assets.‐ A targeted refurbishment and high‐street brand facelift programme has commenced.‐ We have simplified menu design and entry and exit pricing.‐ The supply chain has been simplified and streamlined.‐ The targeted closure programme for distressed sites has progressed, with the closure of six stores.
The narrative under "Subsequent events" elaborates on the restructuring programme to be implemented in the business.
GROUP FINANCIAL RESULTS Six months Six months ended ended 31 August 31 August % 2018 2017 change Statement of profit or loss and other comprehensive income Revenue Rm 3 583.6 3 401.2 5.4 Operating profit before non‐operational items Rm 421.8 406.1 3.9 Operating profit margin % 11.8 11.9 Impairment Rm (873.9) ‐ EBITDA before impairment losses Rm 526.4 502.0 4.8 Basic (loss)/earnings per share Cents (572) 171 (434.5) Headline earnings per share (HEPS) Cents 188 170 10.6 Statement of cash flows Cash generated from operations Rm 540.4 463.0 16.6 Net cash outflow utilised in investing activities Rm (47.6) (133.3) Net cash outflow from financing activities Rm (102.1) (0.4) Cash realisation rate* % 102.7 92.2 Statement of financial position Cash and cash equivalents Rm 924.7 477.8 Net debt^ Rm 1 840.4 2 422.8 Net debt/equity % 133.9 145.3 Total equity Rm 1 375 1 667 * Cash generated by operations as a percentage of EBITDA. ^ Total interest‐bearing borrowings less cash.
The Group continues to comply with its financial covenants and comfortably meet its debt repayment obligations, in line with agreed financing commitments. The level of gearing has been reduced relative to the prior comparable period. In light of robust cash reserves, management is in discussions with financiers to further decrease gearing, aimed at reducing the Group's gross debt:EBITDA ratio to two times.
As noted at the end of the prior year, the reallocation of corporate costs and administration fees to the pertinent business units in the Group has been prioritised and finetuned. These segmental reallocations have an impact on the margins of the individual business units, but not on the Group's overall margin. The effect of this restructuring is evident in the additional disclosures provided in the Segment report under "Corporate".
OPERATIONAL REVIEWSBRANDSThe Group's Brands portfolio comprises 25 restaurant brands, represented by a network of 2 874 (2017: 2 797)restaurants across South Africa, the rest of Africa, the Middle East and the United Kingdom.
The portfolio is segmented into Leading (mainstream) brands and Signature (niche) brands, strategically positioned to appeal to a wide range of consumers across the income and demographic spectrum and across meal preferences and value propositions. The Leading brands are further categorised as Quick Service, Fast Casual and Casual Dining. Our brand network consists of both franchised and company‐owned restaurants.
This division reported revenue of R432.2 million (2017: R415.0 million), an improvement of 4.1%, with Leading brandscontributing R366.5 million, up 4.6%, and Signature brands R65.7 million, an increase of 1.6%.
Operating profit grew by 9.9% to R222.5 million (2017: R202.5 million), of which Leading brands contributed R218.6 million and Signature brands the balance.
The division's operating margin rose to 51.5% (2017: 48.8%).
Across our Leading and Signature brands, system‐wide sales (including all restaurants opened during the period)increased by 7.3% (2017: 7.1%), while like‐for‐like sales (excluding restaurants opened or closed in the period) grew by 3.4% (2017: 1.4%). Independently, Leading brands' system‐wide sales rose 7.1%, with like‐for‐like sales 4.1% higher. Signature brands' system‐wide sales increased 8.6%, while like‐for‐like sales declined by 2.3%. The discrepancy between Leading brands' revenue and system‐wide growth is attributable to the reallocation of designfees for five months of the review period relative to one month in the comparable prior period. As illustrated in theSegment report, these costs are now reflected under "Corporate" following the establishment of a joint‐venture partnership, Design HQ. The discrepancy is in the order of R10 million.
The Brands division's results are particularly creditable given the significant challenges faced throughout theperiod, as restaurants and distribution routes throughout SA were frequently temporarily disrupted due to widespread civil unrest.
During the period, the Group opened 79 restaurants (2017: 77), comprising 59 Leading brands restaurants, 16 Signaturebrands restaurants and four Mr Bigg's stores in Nigeria.
Ensuring that the brand footprint is optimally aligned with our target markets is key to the health and viability ofthe entire business. This is particularly germane in our emerging economy, which features fluid market demographics. Inthe absence of any alternative, closing non‐performing restaurants and rationalising brands which have no potential forgrowth under our stewardship, despite our best remedial efforts, is a long‐standing Group policy. In light of theprevailing weak economy, this will continue.
‐ LEADING BRANDS PORTFOLIO Consumer disposable income remained under pressure in this category, evidenced by a decline in customer transaction spend and stagnant frequency of visits during the period.
Notwithstanding this environment, amongst our major Leading brands, Debonairs Pizza continued to gain share in existing and new markets, while Wimpy, Steers, Mugg & Bean and Fishaways retained market share. Solid system‐wide and positive like‐for‐like growth was reported by all of these brands, albeit partly supported by below‐inflation menu price increases.
Fego Caffe and Milky Lane both recorded like‐for‐like turnover growth, although Fego's system‐wide turnover declined marginally due to the closure of five stores.
Strong promotions focusing on our brands' great value proposition and high‐quality meals drove top‐line growth across the portfolio. Particularly pleasing results were achieved from our investment in upweighting our online, digital and social media capability, and expanding our delivery offering across our brands. ‐ SIGNATURE BRANDS PORTFOLIO Spend in the premium segment of the Casual Dining consumer market remained constrained, and in this weak demand environment the portfolio's growth was largely underpinned by new restaurant openings, with Salsa Mexican Grill, Lupa Osteria and Turn 'n Tender each opening three new restaurants. These offerings are clearly differentiated, have strong consumer appeal and offer upside growth potential.
Our tashas restaurants in the UAE continued to deliver robust results, and a further three new restaurants are scheduled to open in the balance of the financial year.
In 2014, Total and Famous Brands announced the launch of a pilot project in which Famous Brands would introduce the premium retail offering, Thrupps, to a selection of Total's upper‐end service station forecourts. While the five stores opened to date have been well received by customers, Total has elected to terminate the offering in line with its revised long‐term global strategy. In this regard, Famous Brands will withdraw the stores with effect from November 2018, and conclude the relationship with Thrupps. The Group's strong, long‐standing strategic partnership with Total remains in place.
The reallocation of a higher proportion of central costs not previously allocated to this business unit has fundamentally changed the margin model. While the new margin reported for the period has disappointed management, the division is under intensified scrutiny, with the clear goal of driving higher margins and adding value to the Group.
‐ AME The Group is represented in 15 countries in this region. We stated in the year‐end results announcement published in May that we are optimistic our AME operations will derive good returns from investments made over recent years. It is therefore pleasing to report that revenue and profit grew in both local currency and Rand terms. Revenue for the combined region increased by 9.9% to R135.2 million (2017: R123.0 million). Operating profit rose 27.2% to R24.3 million (2017: R19.1 million), while the operating margin improved to 18.0% (2017: 15.5%).
System‐wide sales increased by 12.8% (2017: 1.0%). The region contributed 10.8% (2017: 9.2%) to the Group's total system‐wide Brands' division sales.
Our 'deep and narrow' approach remains our core strategy in the region, with in‐country resources having been increased in Zambia, Mauritius, Malawi and Kenya. Our continued focus during the review period was on growing the contribution of our four Leading brands in the region (Debonairs Pizza, Steers, Wimpy and Mugg & Bean), which accounted for 91% of revenue. The Group's joint venture with Retail Group in Botswana reported substantially stronger results compared with the same period in the prior year. The business comprises 36 restaurants, 24 of which are company‐owned. In the context of the unfavourable Pula:Rand conversion rate, the good results are attributable to the improved local economy, relatively stable inflation, and management and operational enhancements in the business.
A total of 16 restaurants (2017: six) were opened and four were revamped (2017: four). While restaurant openings exceeded budget, the revamp programme was behind target, primarily due to franchisees' constrained access to capital and cash flow challenges.
‐ UNITED KINGDOM Overview Our UK operation comprises Wimpy UK and GBK. The businesses are managed and report independently of each other. During the review period, the average GBP:ZAR exchange rate was GBP1:ZAR17.29 versus GBP1:ZAR16.78 in the prior comparable period. Macroeconomic trading conditions remained unchanged in the six months under review, featuring intense competition in a price‐ sensitive environment, and subdued consumer sentiment and spend, exacerbated by socio‐political uncertainty in the Brexit context. Dine‐in sales continued to lose market share as foot traffic in malls declined and online and delivery sales gained traction. ‐ Wimpy UK The business reported a 13.6% increase in Sterling revenue for the review period, while revenue in Rand terms improved 18.2% to R57.4 million (2017: R48.6 million), primarily as a function of foreign currency translation. Operating profit rose by 2.1% to R8.5 million (2017: R8.4 million), while the operating margin declined to 14.9% (2017: 17.2%) Wimpy's collaboration with GBK to leverage commodity purchase volumes continued to deliver lower prices for core products, enabling the business to contain price
increases.
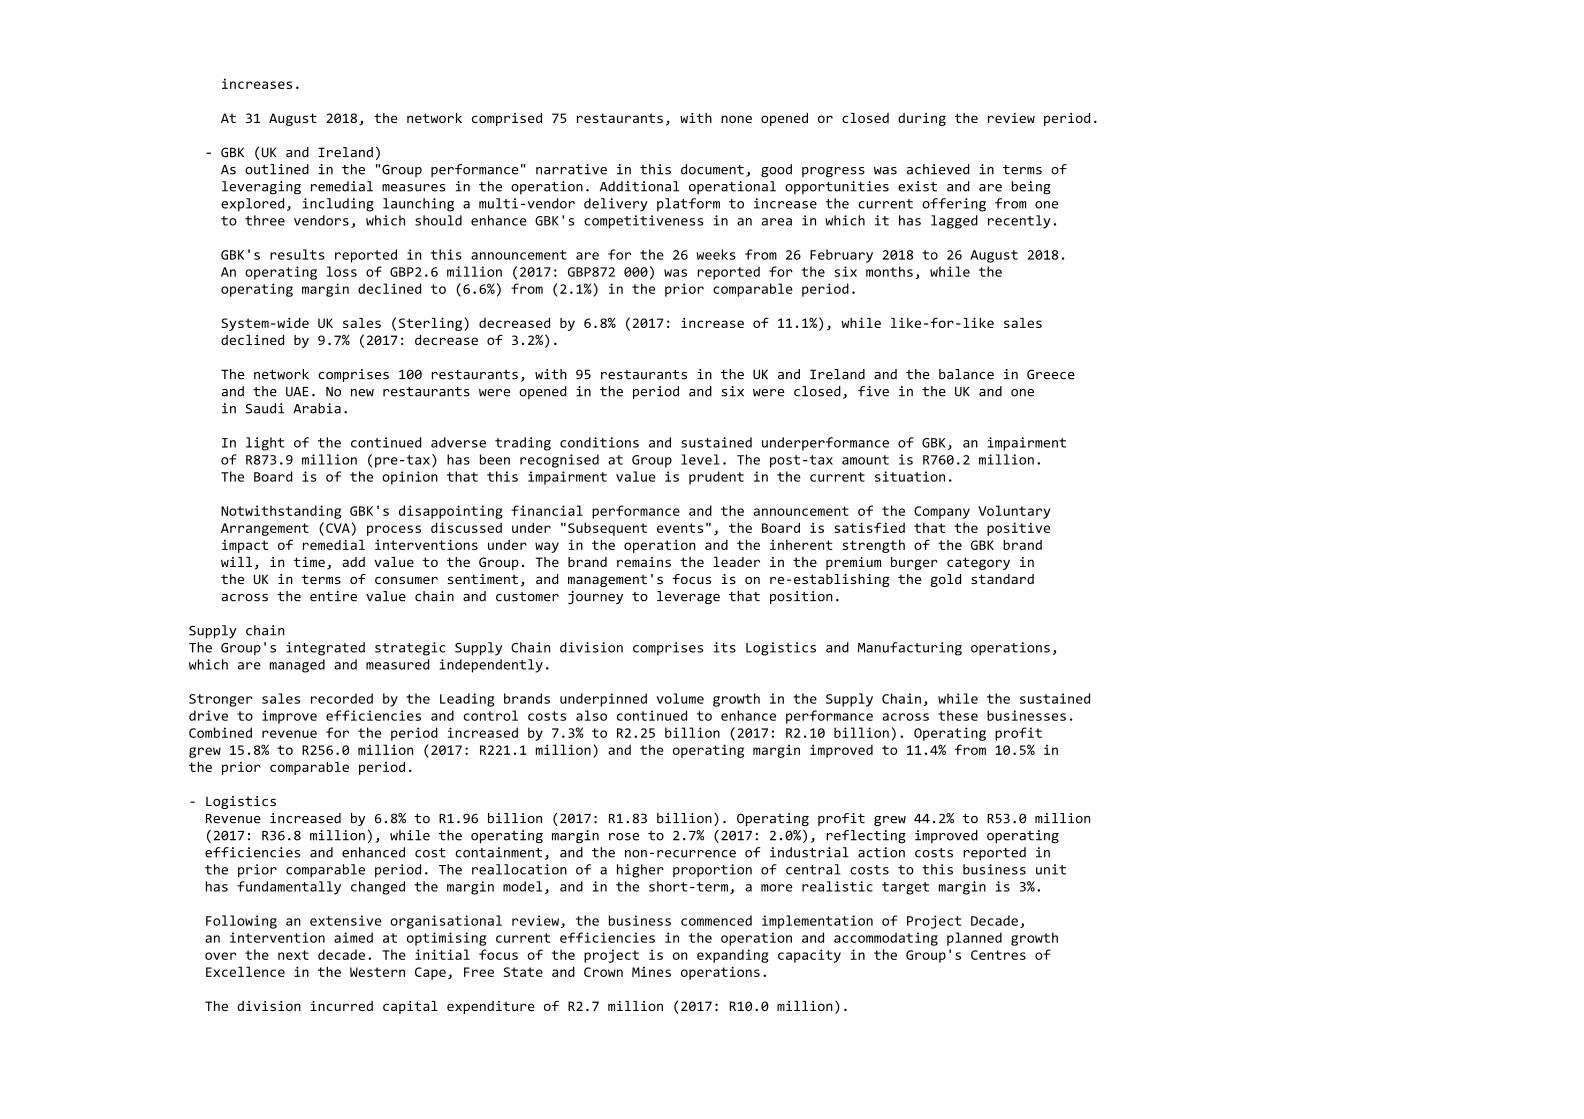
At 31 August 2018, the network comprised 75 restaurants, with none opened or closed during the review period. ‐ GBK (UK and Ireland) As outlined in the "Group performance" narrative in this document, good progress was achieved in terms of leveraging remedial measures in the operation. Additional operational opportunities exist and are being explored, including launching a multi‐vendor delivery platform to increase the current offering from one to three vendors, which should enhance GBK's competitiveness in an area in which it has lagged recently.
GBK's results reported in this announcement are for the 26 weeks from 26 February 2018 to 26 August 2018. An operating loss of GBP2.6 million (2017: GBP872 000) was reported for the six months, while the operating margin declined to (6.6%) from (2.1%) in the prior comparable period.
System‐wide UK sales (Sterling) decreased by 6.8% (2017: increase of 11.1%), while like‐for‐like sales declined by 9.7% (2017: decrease of 3.2%). The network comprises 100 restaurants, with 95 restaurants in the UK and Ireland and the balance in Greece and the UAE. No new restaurants were opened in the period and six were closed, five in the UK and one in Saudi Arabia.
In light of the continued adverse trading conditions and sustained underperformance of GBK, an impairment of R873.9 million (pre‐tax) has been recognised at Group level. The post‐tax amount is R760.2 million. The Board is of the opinion that this impairment value is prudent in the current situation.
Notwithstanding GBK's disappointing financial performance and the announcement of the Company Voluntary Arrangement (CVA) process discussed under "Subsequent events", the Board is satisfied that the positive impact of remedial interventions under way in the operation and the inherent strength of the GBK brand will, in time, add value to the Group. The brand remains the leader in the premium burger category in the UK in terms of consumer sentiment, and management's focus is on re‐establishing the gold standard across the entire value chain and customer journey to leverage that position. Supply chainThe Group's integrated strategic Supply Chain division comprises its Logistics and Manufacturing operations, which are managed and measured independently.
Stronger sales recorded by the Leading brands underpinned volume growth in the Supply Chain, while the sustained drive to improve efficiencies and control costs also continued to enhance performance across these businesses. Combined revenue for the period increased by 7.3% to R2.25 billion (2017: R2.10 billion). Operating profit grew 15.8% to R256.0 million (2017: R221.1 million) and the operating margin improved to 11.4% from 10.5% in the prior comparable period.
‐ Logistics Revenue increased by 6.8% to R1.96 billion (2017: R1.83 billion). Operating profit grew 44.2% to R53.0 million (2017: R36.8 million), while the operating margin rose to 2.7% (2017: 2.0%), reflecting improved operating efficiencies and enhanced cost containment, and the non‐recurrence of industrial action costs reported in the prior comparable period. The reallocation of a higher proportion of central costs to this business unit has fundamentally changed the margin model, and in the short‐term, a more realistic target margin is 3%.
Following an extensive organisational review, the business commenced implementation of Project Decade, an intervention aimed at optimising current efficiencies in the operation and accommodating planned growth over the next decade. The initial focus of the project is on expanding capacity in the Group's Centres of Excellence in the Western Cape, Free State and Crown Mines operations.
The division incurred capital expenditure of R2.7 million (2017: R10.0 million).
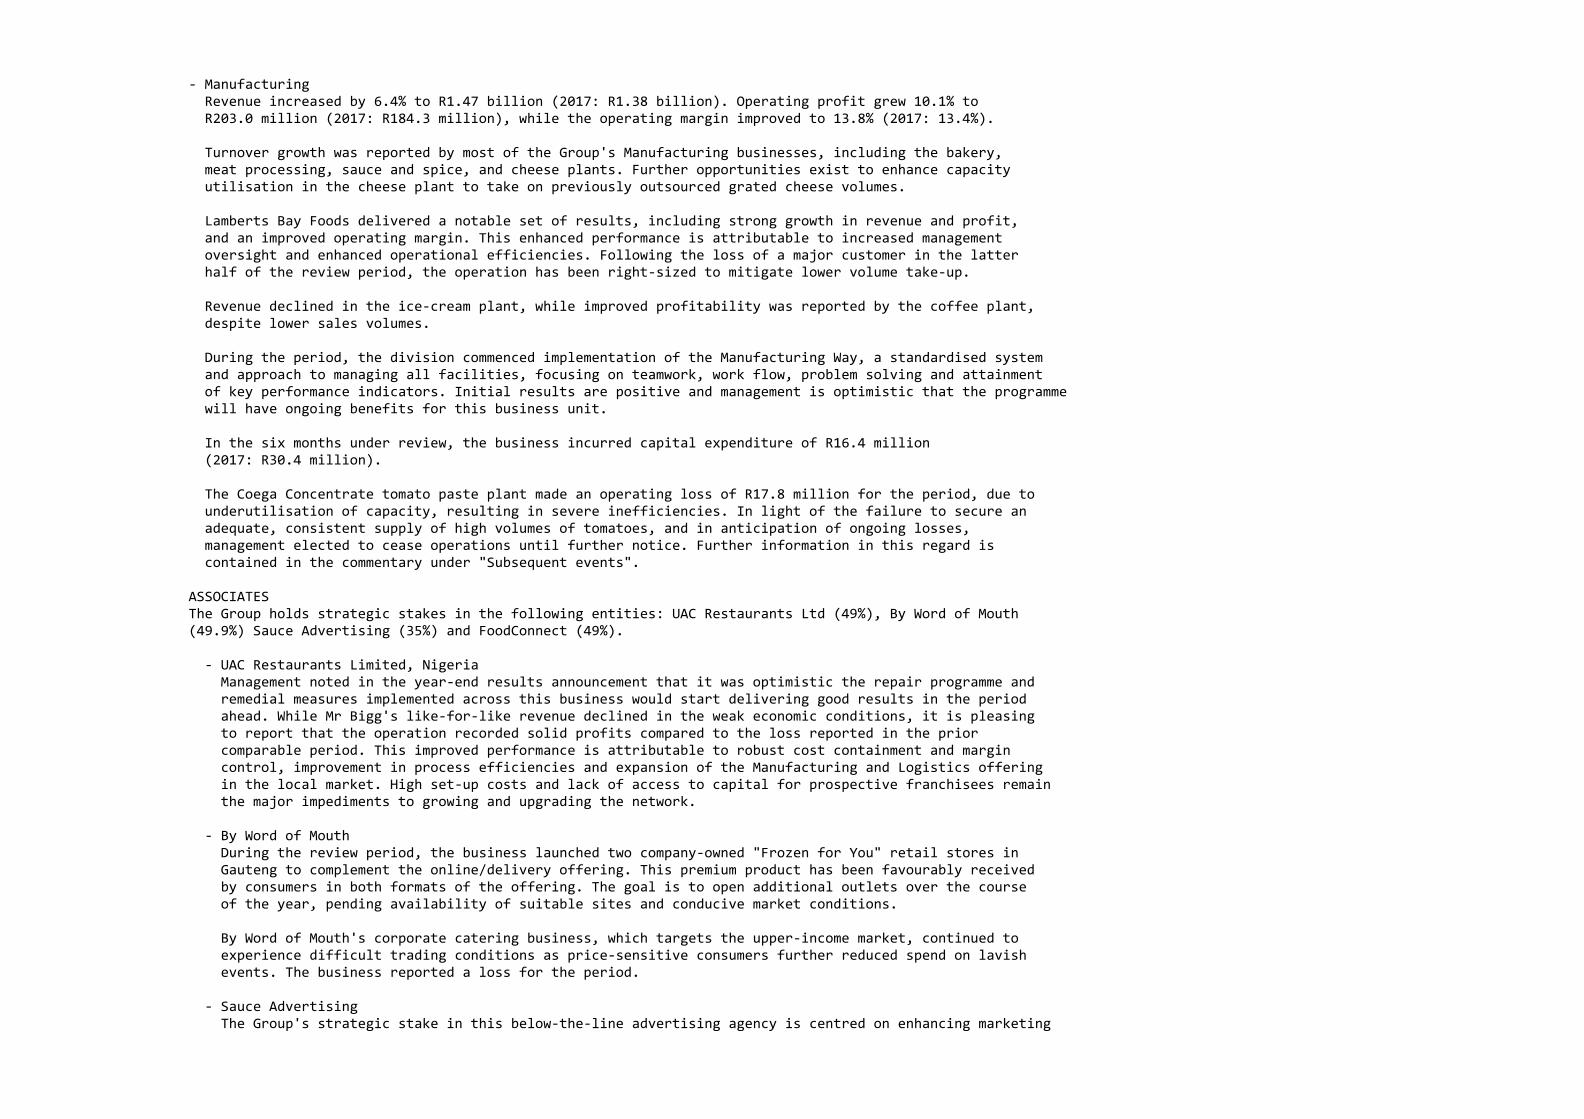
‐ Manufacturing Revenue increased by 6.4% to R1.47 billion (2017: R1.38 billion). Operating profit grew 10.1% to R203.0 million (2017: R184.3 million), while the operating margin improved to 13.8% (2017: 13.4%).
Turnover growth was reported by most of the Group's Manufacturing businesses, including the bakery, meat processing, sauce and spice, and cheese plants. Further opportunities exist to enhance capacity utilisation in the cheese plant to take on previously outsourced grated cheese volumes.
Lamberts Bay Foods delivered a notable set of results, including strong growth in revenue and profit, and an improved operating margin. This enhanced performance is attributable to increased management oversight and enhanced operational efficiencies. Following the loss of a major customer in the latter half of the review period, the operation has been right‐sized to mitigate lower volume take‐up.
Revenue declined in the ice‐cream plant, while improved profitability was reported by the coffee plant, despite lower sales volumes.
During the period, the division commenced implementation of the Manufacturing Way, a standardised system and approach to managing all facilities, focusing on teamwork, work flow, problem solving and attainment of key performance indicators. Initial results are positive and management is optimistic that the programme will have ongoing benefits for this business unit.
In the six months under review, the business incurred capital expenditure of R16.4 million (2017: R30.4 million).
The Coega Concentrate tomato paste plant made an operating loss of R17.8 million for the period, due to underutilisation of capacity, resulting in severe inefficiencies. In light of the failure to secure an adequate, consistent supply of high volumes of tomatoes, and in anticipation of ongoing losses, management elected to cease operations until further notice. Further information in this regard is contained in the commentary under "Subsequent events".
ASSOCIATESThe Group holds strategic stakes in the following entities: UAC Restaurants Ltd (49%), By Word of Mouth (49.9%) Sauce Advertising (35%) and FoodConnect (49%).
‐ UAC Restaurants Limited, Nigeria Management noted in the year‐end results announcement that it was optimistic the repair programme and remedial measures implemented across this business would start delivering good results in the period ahead. While Mr Bigg's like‐for‐like revenue declined in the weak economic conditions, it is pleasing to report that the operation recorded solid profits compared to the loss reported in the prior comparable period. This improved performance is attributable to robust cost containment and margin control, improvement in process efficiencies and expansion of the Manufacturing and Logistics offering in the local market. High set‐up costs and lack of access to capital for prospective franchisees remain the major impediments to growing and upgrading the network.
‐ By Word of Mouth During the review period, the business launched two company‐owned "Frozen for You" retail stores in Gauteng to complement the online/delivery offering. This premium product has been favourably received by consumers in both formats of the offering. The goal is to open additional outlets over the course of the year, pending availability of suitable sites and conducive market conditions.
By Word of Mouth's corporate catering business, which targets the upper‐income market, continued to experience difficult trading conditions as price‐sensitive consumers further reduced spend on lavish events. The business reported a loss for the period.
‐ Sauce Advertising The Group's strategic stake in this below‐the‐line advertising agency is centred on enhancing marketing
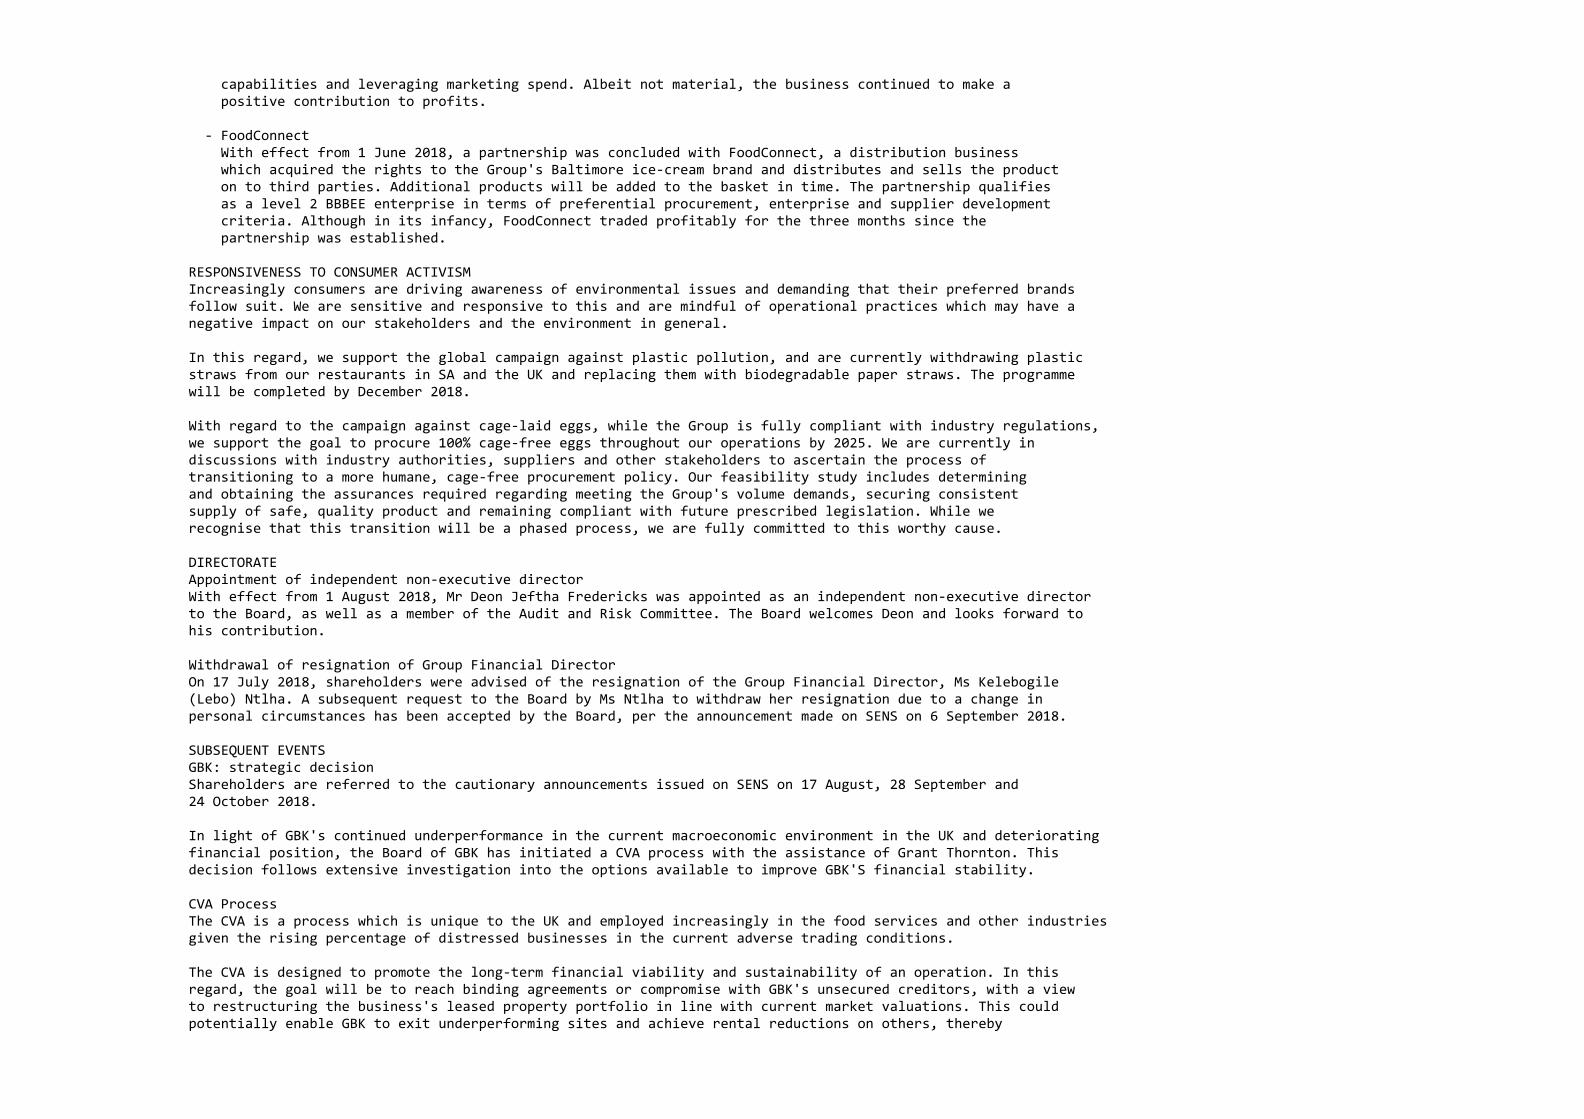
capabilities and leveraging marketing spend. Albeit not material, the business continued to make a positive contribution to profits.
‐ FoodConnect With effect from 1 June 2018, a partnership was concluded with FoodConnect, a distribution business which acquired the rights to the Group's Baltimore ice‐cream brand and distributes and sells the product on to third parties. Additional products will be added to the basket in time. The partnership qualifies as a level 2 BBBEE enterprise in terms of preferential procurement, enterprise and supplier development criteria. Although in its infancy, FoodConnect traded profitably for the three months since the partnership was established.
RESPONSIVENESS TO CONSUMER ACTIVISMIncreasingly consumers are driving awareness of environmental issues and demanding that their preferred brands follow suit. We are sensitive and responsive to this and are mindful of operational practices which may have a negative impact on our stakeholders and the environment in general.
In this regard, we support the global campaign against plastic pollution, and are currently withdrawing plastic straws from our restaurants in SA and the UK and replacing them with biodegradable paper straws. The programme will be completed by December 2018.
With regard to the campaign against cage‐laid eggs, while the Group is fully compliant with industry regulations, we support the goal to procure 100% cage‐free eggs throughout our operations by 2025. We are currently in discussions with industry authorities, suppliers and other stakeholders to ascertain the process of transitioning to a more humane, cage‐free procurement policy. Our feasibility study includes determining and obtaining the assurances required regarding meeting the Group's volume demands, securing consistent supply of safe, quality product and remaining compliant with future prescribed legislation. While we recognise that this transition will be a phased process, we are fully committed to this worthy cause.
DIRECTORATEAppointment of independent non‐executive directorWith effect from 1 August 2018, Mr Deon Jeftha Fredericks was appointed as an independent non‐executive director to the Board, as well as a member of the Audit and Risk Committee. The Board welcomes Deon and looks forward to his contribution.
Withdrawal of resignation of Group Financial DirectorOn 17 July 2018, shareholders were advised of the resignation of the Group Financial Director, Ms Kelebogile (Lebo) Ntlha. A subsequent request to the Board by Ms Ntlha to withdraw her resignation due to a change in personal circumstances has been accepted by the Board, per the announcement made on SENS on 6 September 2018.
SUBSEQUENT EVENTSGBK: strategic decisionShareholders are referred to the cautionary announcements issued on SENS on 17 August, 28 September and 24 October 2018.
In light of GBK's continued underperformance in the current macroeconomic environment in the UK and deterioratingfinancial position, the Board of GBK has initiated a CVA process with the assistance of Grant Thornton. This decision follows extensive investigation into the options available to improve GBK'S financial stability.
CVA ProcessThe CVA is a process which is unique to the UK and employed increasingly in the food services and other industriesgiven the rising percentage of distressed businesses in the current adverse trading conditions.
The CVA is designed to promote the long‐term financial viability and sustainability of an operation. In this regard, the goal will be to reach binding agreements or compromise with GBK's unsecured creditors, with a view to restructuring the business's leased property portfolio in line with current market valuations. This could potentially enable GBK to exit underperforming sites and achieve rental reductions on others, thereby
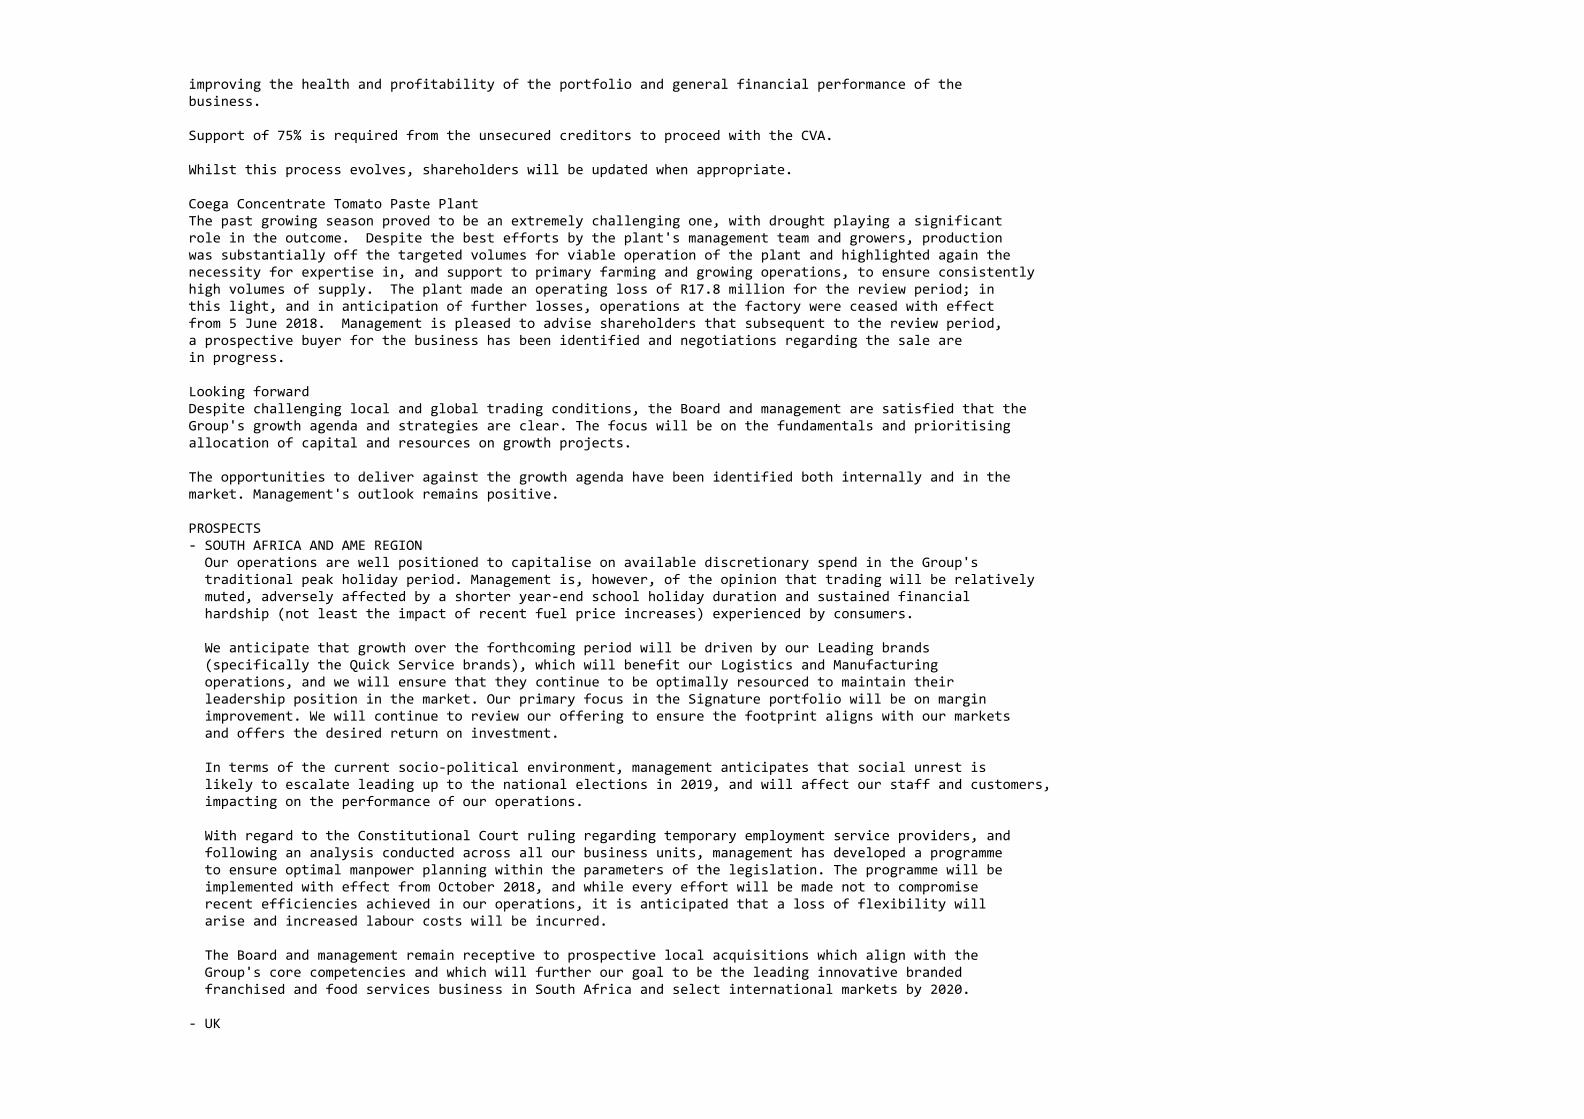
improving the health and profitability of the portfolio and general financial performance of the business.
Support of 75% is required from the unsecured creditors to proceed with the CVA.
Whilst this process evolves, shareholders will be updated when appropriate.
Coega Concentrate Tomato Paste PlantThe past growing season proved to be an extremely challenging one, with drought playing a significant role in the outcome. Despite the best efforts by the plant's management team and growers, production was substantially off the targeted volumes for viable operation of the plant and highlighted again the necessity for expertise in, and support to primary farming and growing operations, to ensure consistently high volumes of supply. The plant made an operating loss of R17.8 million for the review period; in this light, and in anticipation of further losses, operations at the factory were ceased with effect from 5 June 2018. Management is pleased to advise shareholders that subsequent to the review period, a prospective buyer for the business has been identified and negotiations regarding the sale are in progress.
Looking forwardDespite challenging local and global trading conditions, the Board and management are satisfied that the Group's growth agenda and strategies are clear. The focus will be on the fundamentals and prioritising allocation of capital and resources on growth projects.
The opportunities to deliver against the growth agenda have been identified both internally and in the market. Management's outlook remains positive.
PROSPECTS‐ SOUTH AFRICA AND AME REGION Our operations are well positioned to capitalise on available discretionary spend in the Group's traditional peak holiday period. Management is, however, of the opinion that trading will be relatively muted, adversely affected by a shorter year‐end school holiday duration and sustained financial hardship (not least the impact of recent fuel price increases) experienced by consumers.
We anticipate that growth over the forthcoming period will be driven by our Leading brands (specifically the Quick Service brands), which will benefit our Logistics and Manufacturing operations, and we will ensure that they continue to be optimally resourced to maintain their leadership position in the market. Our primary focus in the Signature portfolio will be on margin improvement. We will continue to review our offering to ensure the footprint aligns with our markets and offers the desired return on investment.
In terms of the current socio‐political environment, management anticipates that social unrest is likely to escalate leading up to the national elections in 2019, and will affect our staff and customers, impacting on the performance of our operations.
With regard to the Constitutional Court ruling regarding temporary employment service providers, and following an analysis conducted across all our business units, management has developed a programme to ensure optimal manpower planning within the parameters of the legislation. The programme will be implemented with effect from October 2018, and while every effort will be made not to compromise recent efficiencies achieved in our operations, it is anticipated that a loss of flexibility will arise and increased labour costs will be incurred.
The Board and management remain receptive to prospective local acquisitions which align with the Group's core competencies and which will further our goal to be the leading innovative branded franchised and food services business in South Africa and select international markets by 2020.
‐ UK
The market will continue to be defined by uncertainty as the Brexit process unfolds, which will weigh on both sentiment and spend. Our primary challenge in the UK will be to re‐establish GBK's gold standard across the entire value chain and customer journey and ensure the business is optimally structured to manage ongoing trading challenges.
DIVIDEND AND ALLOCATION OF CAPITALNo dividend is declared for the period under review.
Following a capital structure review to ensure appropriate levels of debt and prudent capital allocation practices, the Board has resolved that, subject to operational requirements and potential acquisitions, future dividends will be triggered when the short‐ to medium‐term gross debt:EBITDA ratio reaches two times. The ratio as at 31 August 2018 was 2.49 times (2017: 2.66 times).
Shareholders are reminded that the company is trading under a cautionary announcement as released on 17 August 2018, 28 September 2018 and 24 October 2018.
AUDIO WEBCAST A live audio webcast of the Group's results will be held at 10:00 (SAST) on 29 October 2018.
To pre‐register link to: https://ccwebcast.eu/links/famousbrands181029/
On behalf of the Board
SL Botha DP HeleIndependent Chairman Chief Executive Officer
Midrand29 October 2018
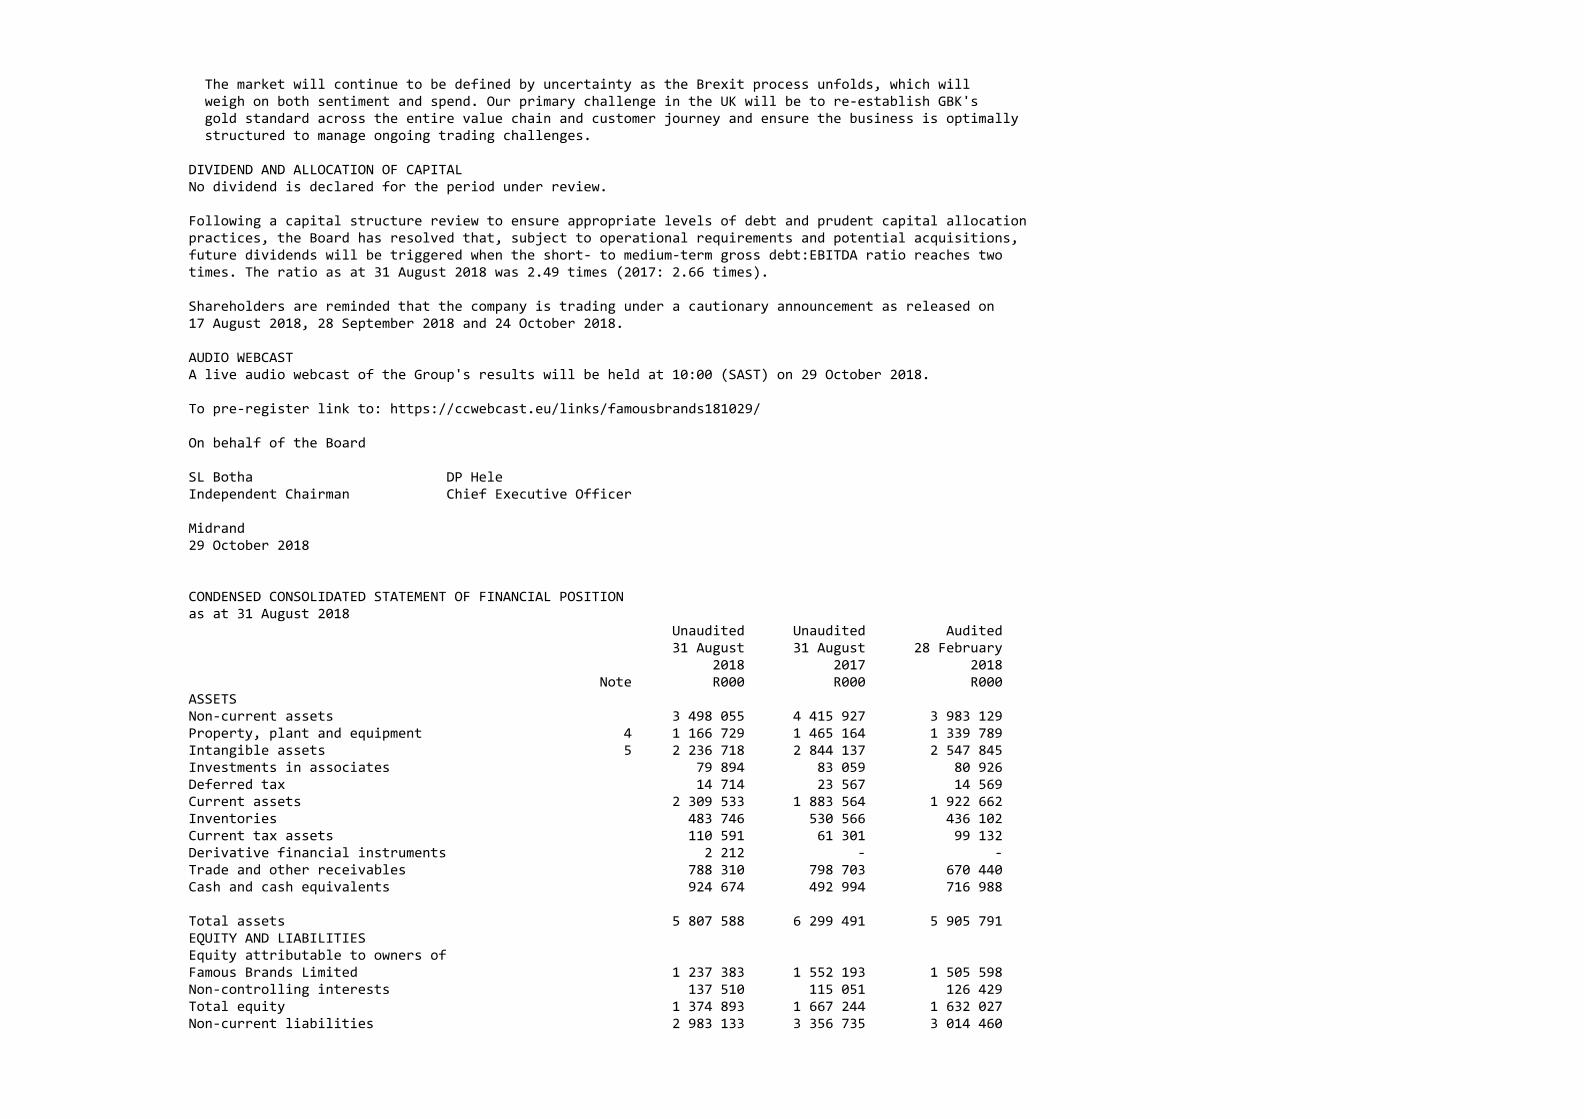
CONDENSED CONSOLIDATED STATEMENT OF FINANCIAL POSITIONas at 31 August 2018 Unaudited Unaudited Audited 31 August 31 August 28 February 2018 2017 2018 Note R000 R000 R000 ASSETS Non‐current assets 3 498 055 4 415 927 3 983 129 Property, plant and equipment 4 1 166 729 1 465 164 1 339 789 Intangible assets 5 2 236 718 2 844 137 2 547 845 Investments in associates 79 894 83 059 80 926 Deferred tax 14 714 23 567 14 569 Current assets 2 309 533 1 883 564 1 922 662 Inventories 483 746 530 566 436 102 Current tax assets 110 591 61 301 99 132 Derivative financial instruments 2 212 ‐ ‐ Trade and other receivables 788 310 798 703 670 440 Cash and cash equivalents 924 674 492 994 716 988 Total assets 5 807 588 6 299 491 5 905 791 EQUITY AND LIABILITIES Equity attributable to owners of Famous Brands Limited 1 237 383 1 552 193 1 505 598 Non‐controlling interests 137 510 115 051 126 429 Total equity 1 374 893 1 667 244 1 632 027 Non‐current liabilities 2 983 133 3 356 735 3 014 460
Borrowings 14 2 533 354 2 663 473 2 513 489 Derivative financial instruments 18 396 220 362 32 370 Lease liabilities 99 317 84 869 86 355 Deferred tax 332 066 388 031 382 246 Current liabilities 1 449 562 1 275 512 1 259 304 Non‐controlling shareholder loans 7 500 22 253 7 500 Derivative financial instruments 165 367 24 306 159 555 Lease liabilities 13 018 11 962 11 125 Trade and other payables 970 923 943 492 770 720 Provisions 6 32 464 ‐ 32 851 Shareholders for dividends 3 215 2 221 2 221 Current tax liabilities 25 329 18 948 8 068 Borrowings 14 231 746 237 092 267 071 Bank overdrafts ‐ 15 238 193 Total liabilities 4 432 695 4 632 247 4 273 764 Total equity and liabilities 5 807 588 6 299 491 5 905 791
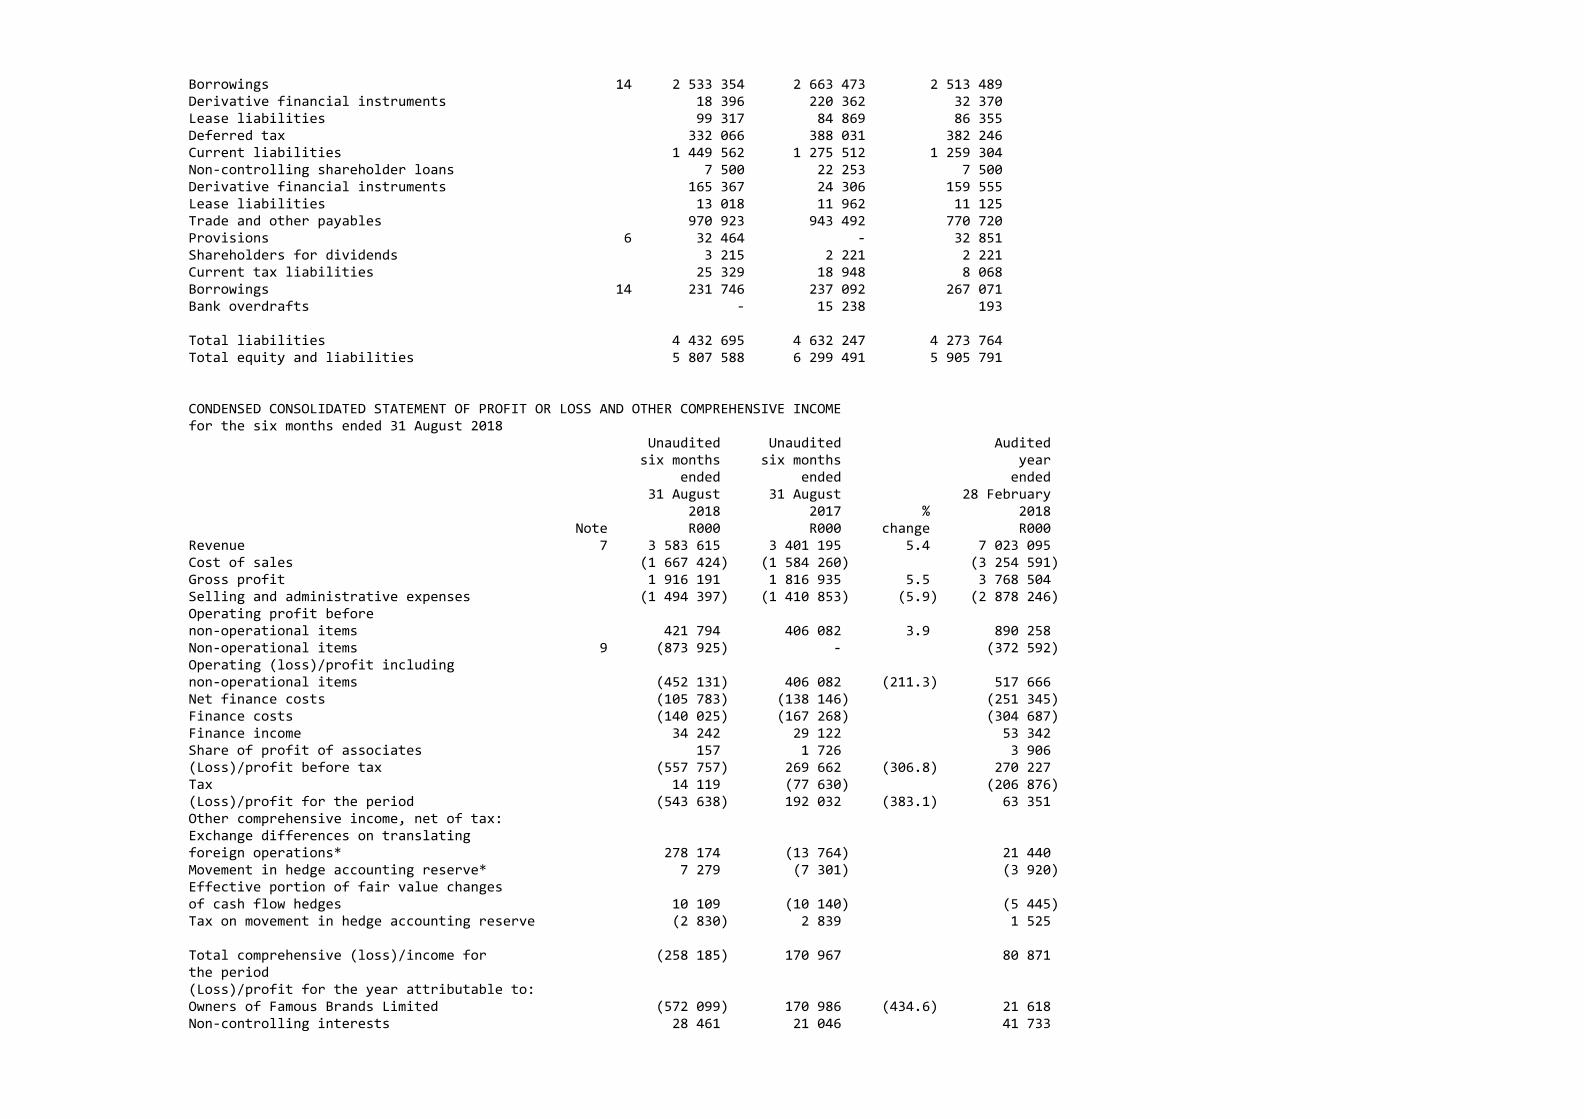
CONDENSED CONSOLIDATED STATEMENT OF PROFIT OR LOSS AND OTHER COMPREHENSIVE INCOMEfor the six months ended 31 August 2018 Unaudited Unaudited Audited six months six months year ended ended ended 31 August 31 August 28 February 2018 2017 % 2018 Note R000 R000 change R000 Revenue 7 3 583 615 3 401 195 5.4 7 023 095 Cost of sales (1 667 424) (1 584 260) (3 254 591) Gross profit 1 916 191 1 816 935 5.5 3 768 504 Selling and administrative expenses (1 494 397) (1 410 853) (5.9) (2 878 246) Operating profit before non‐operational items 421 794 406 082 3.9 890 258 Non‐operational items 9 (873 925) ‐ (372 592) Operating (loss)/profit including non‐operational items (452 131) 406 082 (211.3) 517 666 Net finance costs (105 783) (138 146) (251 345) Finance costs (140 025) (167 268) (304 687) Finance income 34 242 29 122 53 342 Share of profit of associates 157 1 726 3 906 (Loss)/profit before tax (557 757) 269 662 (306.8) 270 227 Tax 14 119 (77 630) (206 876) (Loss)/profit for the period (543 638) 192 032 (383.1) 63 351 Other comprehensive income, net of tax: Exchange differences on translating foreign operations* 278 174 (13 764) 21 440 Movement in hedge accounting reserve* 7 279 (7 301) (3 920) Effective portion of fair value changes of cash flow hedges 10 109 (10 140) (5 445) Tax on movement in hedge accounting reserve (2 830) 2 839 1 525 Total comprehensive (loss)/income for (258 185) 170 967 80 871 the period (Loss)/profit for the year attributable to: Owners of Famous Brands Limited (572 099) 170 986 (434.6) 21 618 Non‐controlling interests 28 461 21 046 41 733
(543 638) 192 032 63 351 Total comprehensive (loss)/income attributable to: Owners of Famous Brands Limited (286 646) 149 921 39 138 Non‐controlling interests 28 461 21 046 41 733 (258 185) 170 967 80 871 Basic (loss)/earnings per share (cents) Basic 8.1 (572) 171 (434.5) 22 Diluted 8.1 (570) 171 (433.5) 22 * This item may be reclassified subsequently to profit or loss.
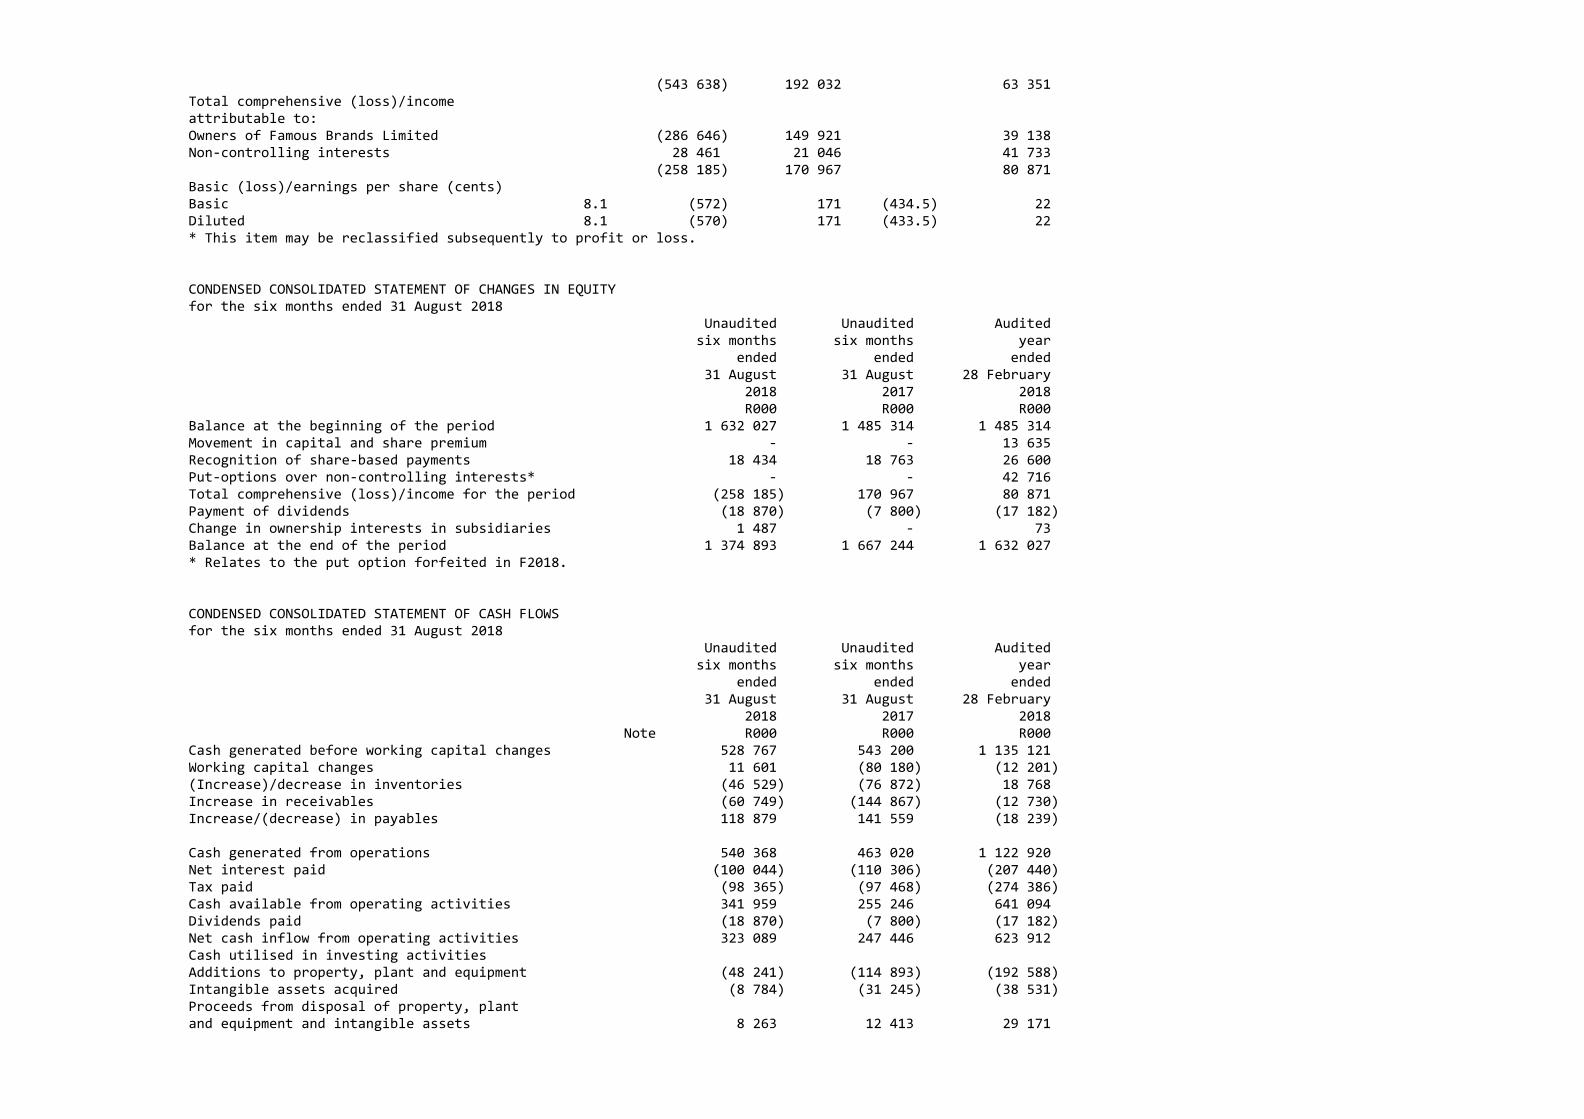
CONDENSED CONSOLIDATED STATEMENT OF CHANGES IN EQUITYfor the six months ended 31 August 2018 Unaudited Unaudited Audited six months six months year ended ended ended 31 August 31 August 28 February 2018 2017 2018 R000 R000 R000 Balance at the beginning of the period 1 632 027 1 485 314 1 485 314 Movement in capital and share premium ‐ ‐ 13 635 Recognition of share‐based payments 18 434 18 763 26 600 Put‐options over non‐controlling interests* ‐ ‐ 42 716 Total comprehensive (loss)/income for the period (258 185) 170 967 80 871 Payment of dividends (18 870) (7 800) (17 182) Change in ownership interests in subsidiaries 1 487 ‐ 73 Balance at the end of the period 1 374 893 1 667 244 1 632 027 * Relates to the put option forfeited in F2018.
CONDENSED CONSOLIDATED STATEMENT OF CASH FLOWSfor the six months ended 31 August 2018 Unaudited Unaudited Audited six months six months year ended ended ended 31 August 31 August 28 February 2018 2017 2018 Note R000 R000 R000 Cash generated before working capital changes 528 767 543 200 1 135 121 Working capital changes 11 601 (80 180) (12 201) (Increase)/decrease in inventories (46 529) (76 872) 18 768 Increase in receivables (60 749) (144 867) (12 730) Increase/(decrease) in payables 118 879 141 559 (18 239) Cash generated from operations 540 368 463 020 1 122 920 Net interest paid (100 044) (110 306) (207 440) Tax paid (98 365) (97 468) (274 386) Cash available from operating activities 341 959 255 246 641 094 Dividends paid (18 870) (7 800) (17 182) Net cash inflow from operating activities 323 089 247 446 623 912 Cash utilised in investing activities Additions to property, plant and equipment (48 241) (114 893) (192 588) Intangible assets acquired (8 784) (31 245) (38 531) Proceeds from disposal of property, plant and equipment and intangible assets 8 263 12 413 29 171
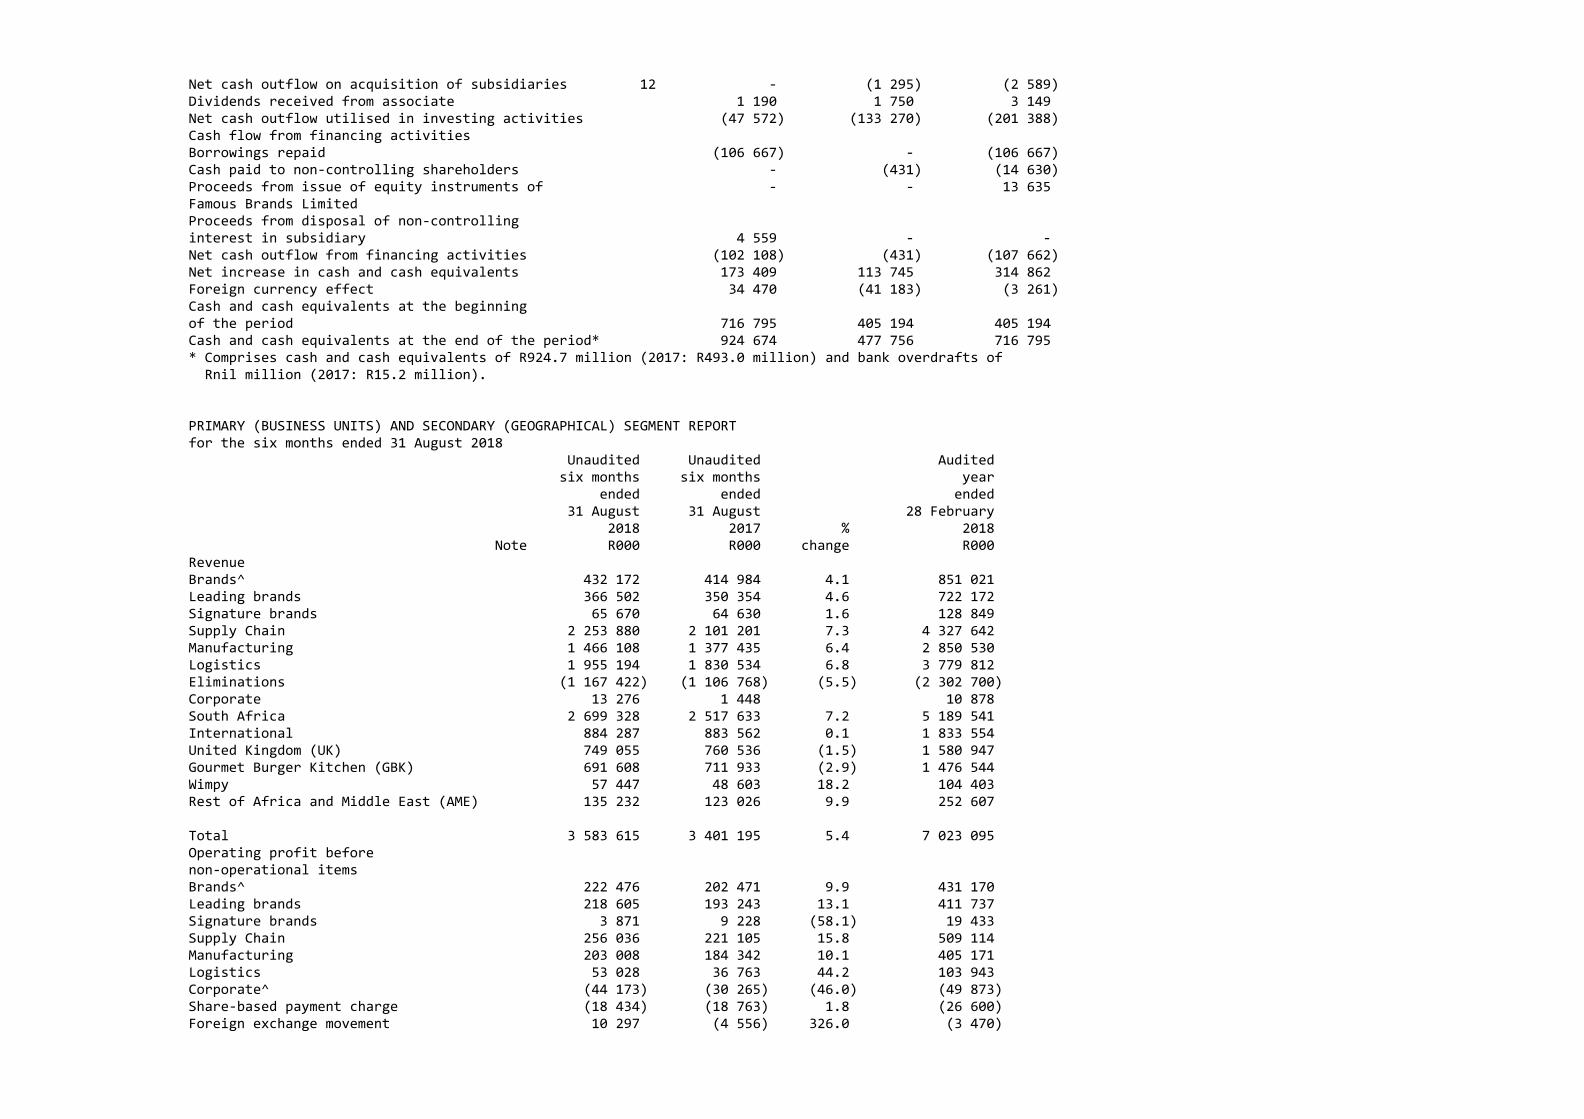
Net cash outflow on acquisition of subsidiaries 12 ‐ (1 295) (2 589) Dividends received from associate 1 190 1 750 3 149 Net cash outflow utilised in investing activities (47 572) (133 270) (201 388) Cash flow from financing activities Borrowings repaid (106 667) ‐ (106 667) Cash paid to non‐controlling shareholders ‐ (431) (14 630) Proceeds from issue of equity instruments of ‐ ‐ 13 635 Famous Brands Limited Proceeds from disposal of non‐controlling interest in subsidiary 4 559 ‐ ‐ Net cash outflow from financing activities (102 108) (431) (107 662) Net increase in cash and cash equivalents 173 409 113 745 314 862 Foreign currency effect 34 470 (41 183) (3 261) Cash and cash equivalents at the beginning of the period 716 795 405 194 405 194 Cash and cash equivalents at the end of the period* 924 674 477 756 716 795 * Comprises cash and cash equivalents of R924.7 million (2017: R493.0 million) and bank overdrafts of Rnil million (2017: R15.2 million).
PRIMARY (BUSINESS UNITS) AND SECONDARY (GEOGRAPHICAL) SEGMENT REPORTfor the six months ended 31 August 2018 Unaudited Unaudited Audited six months six months year ended ended ended 31 August 31 August 28 February 2018 2017 % 2018 Note R000 R000 change R000 Revenue Brands^ 432 172 414 984 4.1 851 021 Leading brands 366 502 350 354 4.6 722 172 Signature brands 65 670 64 630 1.6 128 849 Supply Chain 2 253 880 2 101 201 7.3 4 327 642 Manufacturing 1 466 108 1 377 435 6.4 2 850 530 Logistics 1 955 194 1 830 534 6.8 3 779 812 Eliminations (1 167 422) (1 106 768) (5.5) (2 302 700) Corporate 13 276 1 448 10 878 South Africa 2 699 328 2 517 633 7.2 5 189 541 International 884 287 883 562 0.1 1 833 554 United Kingdom (UK) 749 055 760 536 (1.5) 1 580 947 Gourmet Burger Kitchen (GBK) 691 608 711 933 (2.9) 1 476 544 Wimpy 57 447 48 603 18.2 104 403 Rest of Africa and Middle East (AME) 135 232 123 026 9.9 252 607 Total 3 583 615 3 401 195 5.4 7 023 095 Operating profit before non‐operational items Brands^ 222 476 202 471 9.9 431 170 Leading brands 218 605 193 243 13.1 411 737 Signature brands 3 871 9 228 (58.1) 19 433 Supply Chain 256 036 221 105 15.8 509 114 Manufacturing 203 008 184 342 10.1 405 171 Logistics 53 028 36 763 44.2 103 943 Corporate^ (44 173) (30 265) (46.0) (49 873) Share‐based payment charge (18 434) (18 763) 1.8 (26 600) Foreign exchange movement 10 297 (4 556) 326.0 (3 470)
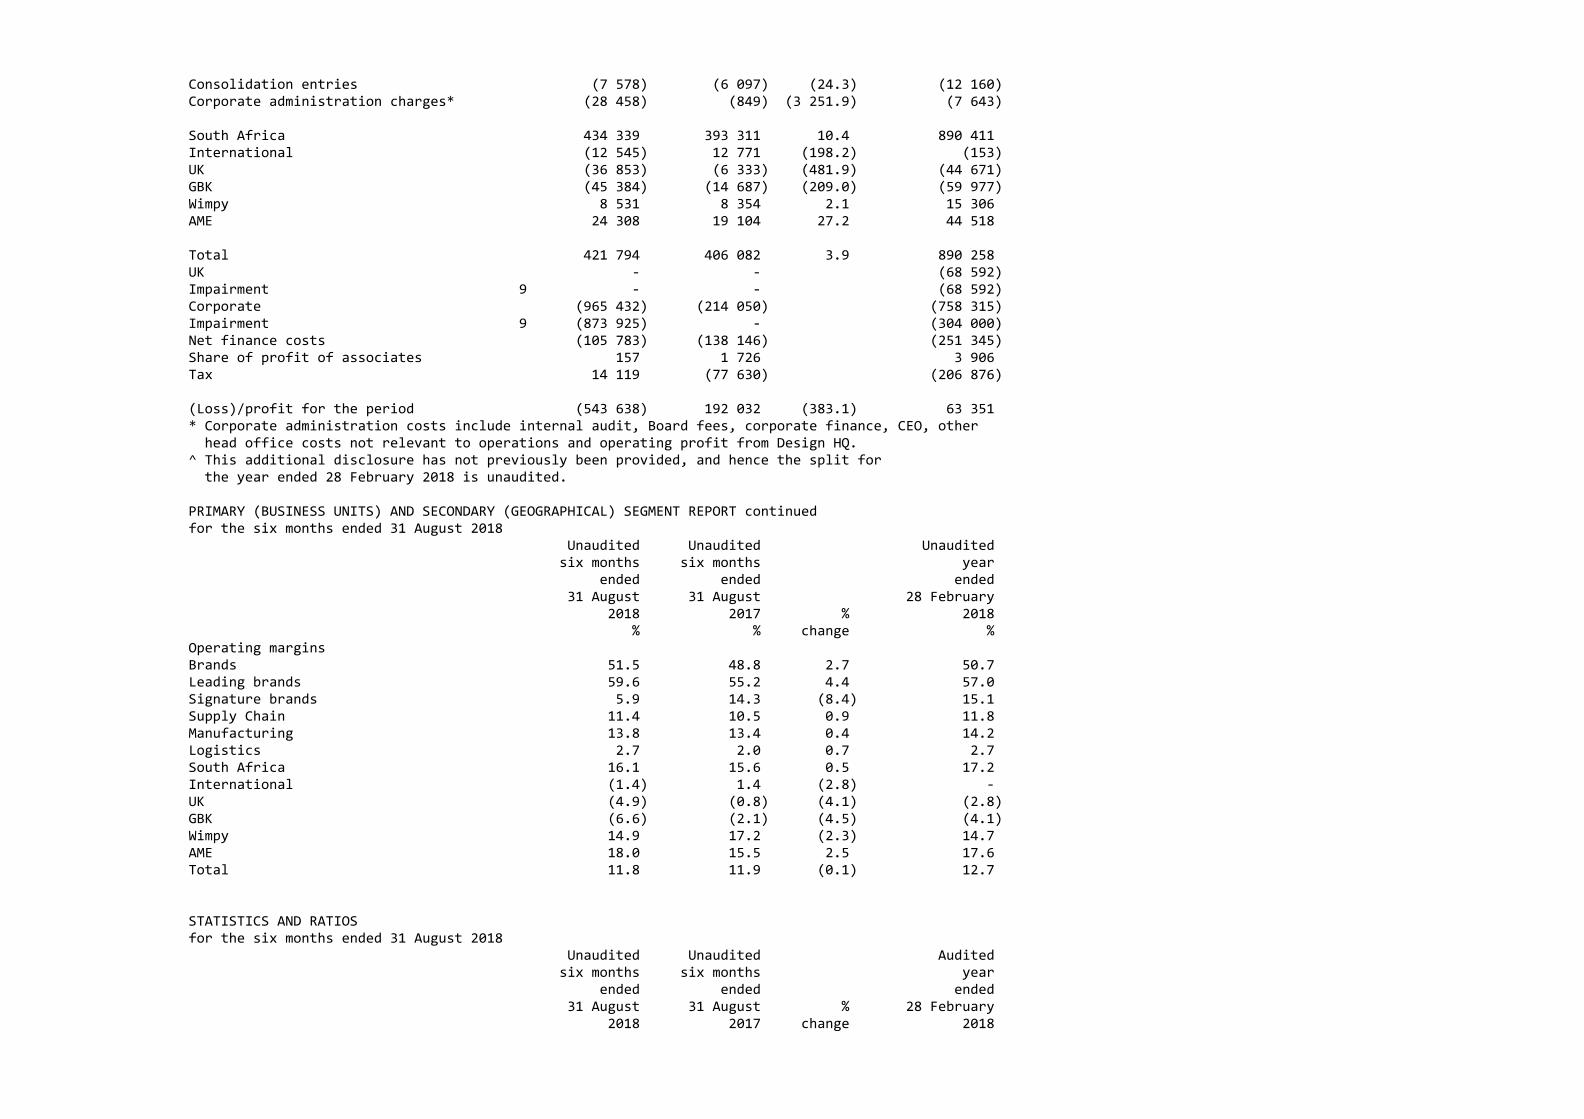
Consolidation entries (7 578) (6 097) (24.3) (12 160) Corporate administration charges* (28 458) (849) (3 251.9) (7 643) South Africa 434 339 393 311 10.4 890 411 International (12 545) 12 771 (198.2) (153) UK (36 853) (6 333) (481.9) (44 671) GBK (45 384) (14 687) (209.0) (59 977) Wimpy 8 531 8 354 2.1 15 306 AME 24 308 19 104 27.2 44 518 Total 421 794 406 082 3.9 890 258 UK ‐ ‐ (68 592) Impairment 9 ‐ ‐ (68 592) Corporate (965 432) (214 050) (758 315) Impairment 9 (873 925) ‐ (304 000) Net finance costs (105 783) (138 146) (251 345) Share of profit of associates 157 1 726 3 906 Tax 14 119 (77 630) (206 876) (Loss)/profit for the period (543 638) 192 032 (383.1) 63 351 * Corporate administration costs include internal audit, Board fees, corporate finance, CEO, other head office costs not relevant to operations and operating profit from Design HQ.^ This additional disclosure has not previously been provided, and hence the split for the year ended 28 February 2018 is unaudited.
PRIMARY (BUSINESS UNITS) AND SECONDARY (GEOGRAPHICAL) SEGMENT REPORT continuedfor the six months ended 31 August 2018 Unaudited Unaudited Unaudited six months six months year ended ended ended 31 August 31 August 28 February 2018 2017 % 2018 % % change % Operating margins Brands 51.5 48.8 2.7 50.7 Leading brands 59.6 55.2 4.4 57.0 Signature brands 5.9 14.3 (8.4) 15.1 Supply Chain 11.4 10.5 0.9 11.8 Manufacturing 13.8 13.4 0.4 14.2 Logistics 2.7 2.0 0.7 2.7 South Africa 16.1 15.6 0.5 17.2 International (1.4) 1.4 (2.8) ‐ UK (4.9) (0.8) (4.1) (2.8) GBK (6.6) (2.1) (4.5) (4.1) Wimpy 14.9 17.2 (2.3) 14.7 AME 18.0 15.5 2.5 17.6 Total 11.8 11.9 (0.1) 12.7
STATISTICS AND RATIOSfor the six months ended 31 August 2018 Unaudited Unaudited Audited six months six months year ended ended ended 31 August 31 August % 28 February 2018 2017 change 2018
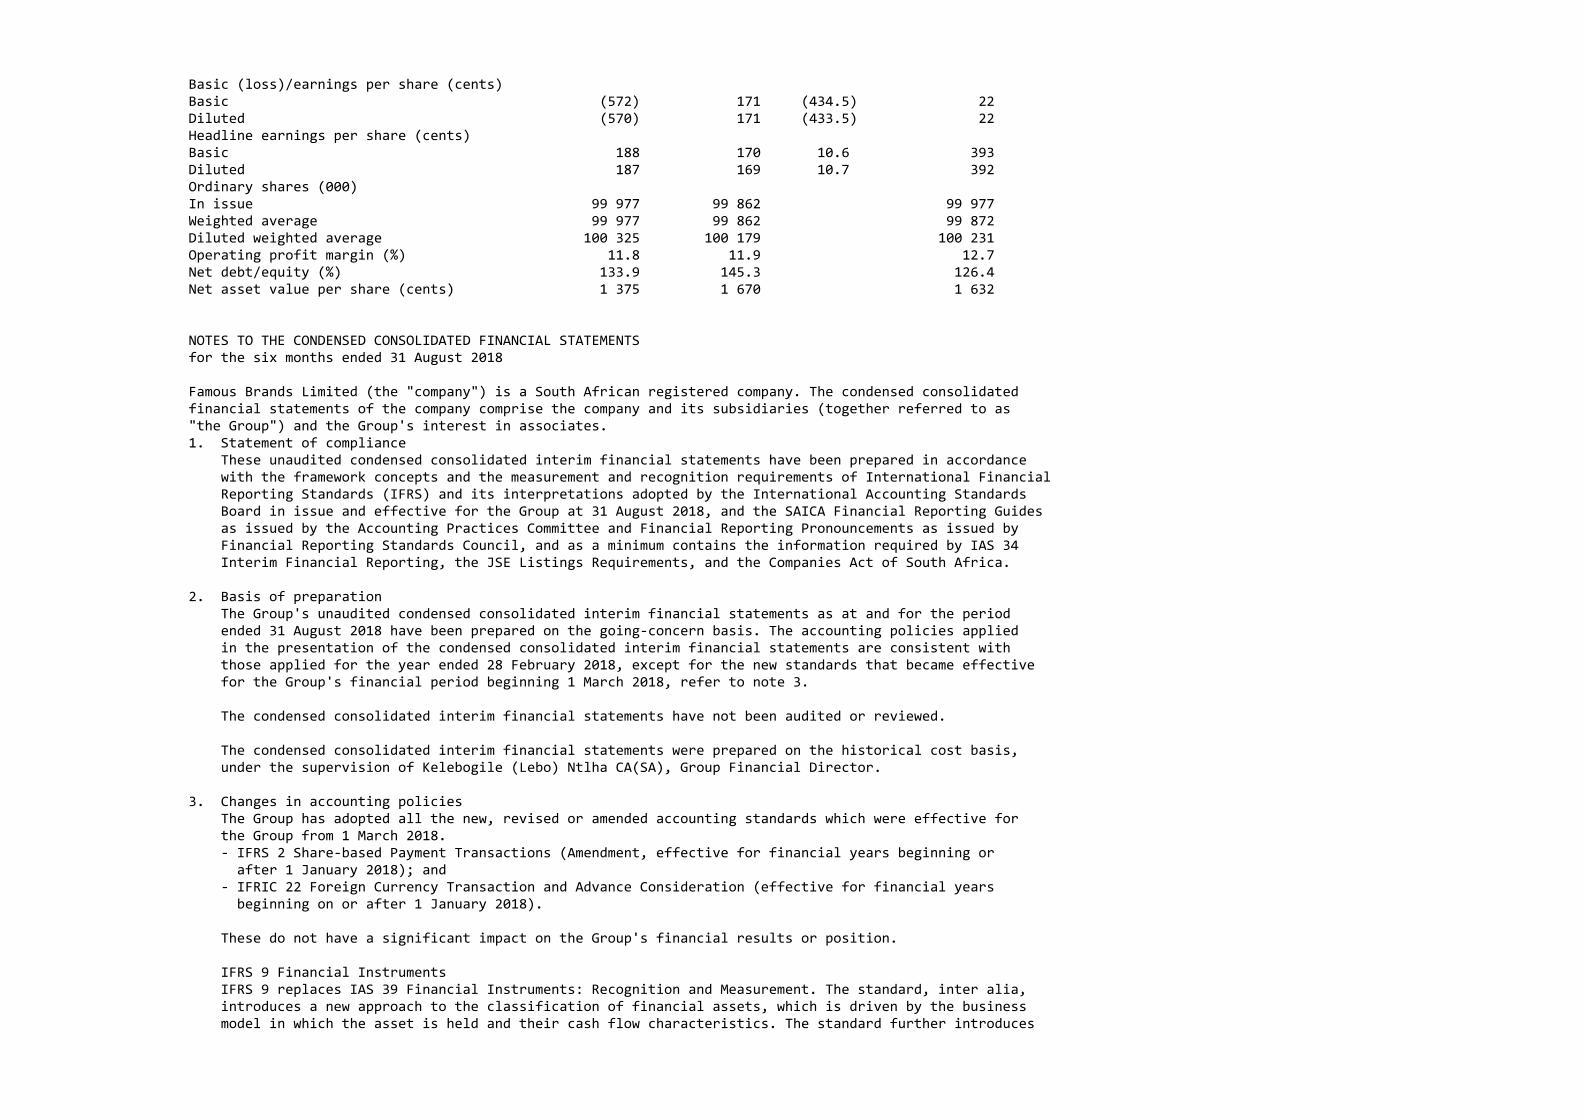
Basic (loss)/earnings per share (cents) Basic (572) 171 (434.5) 22 Diluted (570) 171 (433.5) 22 Headline earnings per share (cents) Basic 188 170 10.6 393 Diluted 187 169 10.7 392 Ordinary shares (000) In issue 99 977 99 862 99 977 Weighted average 99 977 99 862 99 872 Diluted weighted average 100 325 100 179 100 231 Operating profit margin (%) 11.8 11.9 12.7 Net debt/equity (%) 133.9 145.3 126.4 Net asset value per share (cents) 1 375 1 670 1 632
NOTES TO THE CONDENSED CONSOLIDATED FINANCIAL STATEMENTSfor the six months ended 31 August 2018
Famous Brands Limited (the "company") is a South African registered company. The condensed consolidated financial statements of the company comprise the company and its subsidiaries (together referred to as "the Group") and the Group's interest in associates.1. Statement of compliance These unaudited condensed consolidated interim financial statements have been prepared in accordance with the framework concepts and the measurement and recognition requirements of International Financial Reporting Standards (IFRS) and its interpretations adopted by the International Accounting Standards Board in issue and effective for the Group at 31 August 2018, and the SAICA Financial Reporting Guides as issued by the Accounting Practices Committee and Financial Reporting Pronouncements as issued by Financial Reporting Standards Council, and as a minimum contains the information required by IAS 34 Interim Financial Reporting, the JSE Listings Requirements, and the Companies Act of South Africa.
2. Basis of preparation The Group's unaudited condensed consolidated interim financial statements as at and for the period ended 31 August 2018 have been prepared on the going‐concern basis. The accounting policies applied in the presentation of the condensed consolidated interim financial statements are consistent with those applied for the year ended 28 February 2018, except for the new standards that became effective for the Group's financial period beginning 1 March 2018, refer to note 3.
The condensed consolidated interim financial statements have not been audited or reviewed.
The condensed consolidated interim financial statements were prepared on the historical cost basis, under the supervision of Kelebogile (Lebo) Ntlha CA(SA), Group Financial Director.
3. Changes in accounting policies The Group has adopted all the new, revised or amended accounting standards which were effective for the Group from 1 March 2018. ‐ IFRS 2 Share‐based Payment Transactions (Amendment, effective for financial years beginning or after 1 January 2018); and ‐ IFRIC 22 Foreign Currency Transaction and Advance Consideration (effective for financial years beginning on or after 1 January 2018).
These do not have a significant impact on the Group's financial results or position.
IFRS 9 Financial Instruments IFRS 9 replaces IAS 39 Financial Instruments: Recognition and Measurement. The standard, inter alia, introduces a new approach to the classification of financial assets, which is driven by the business model in which the asset is held and their cash flow characteristics. The standard further introduces
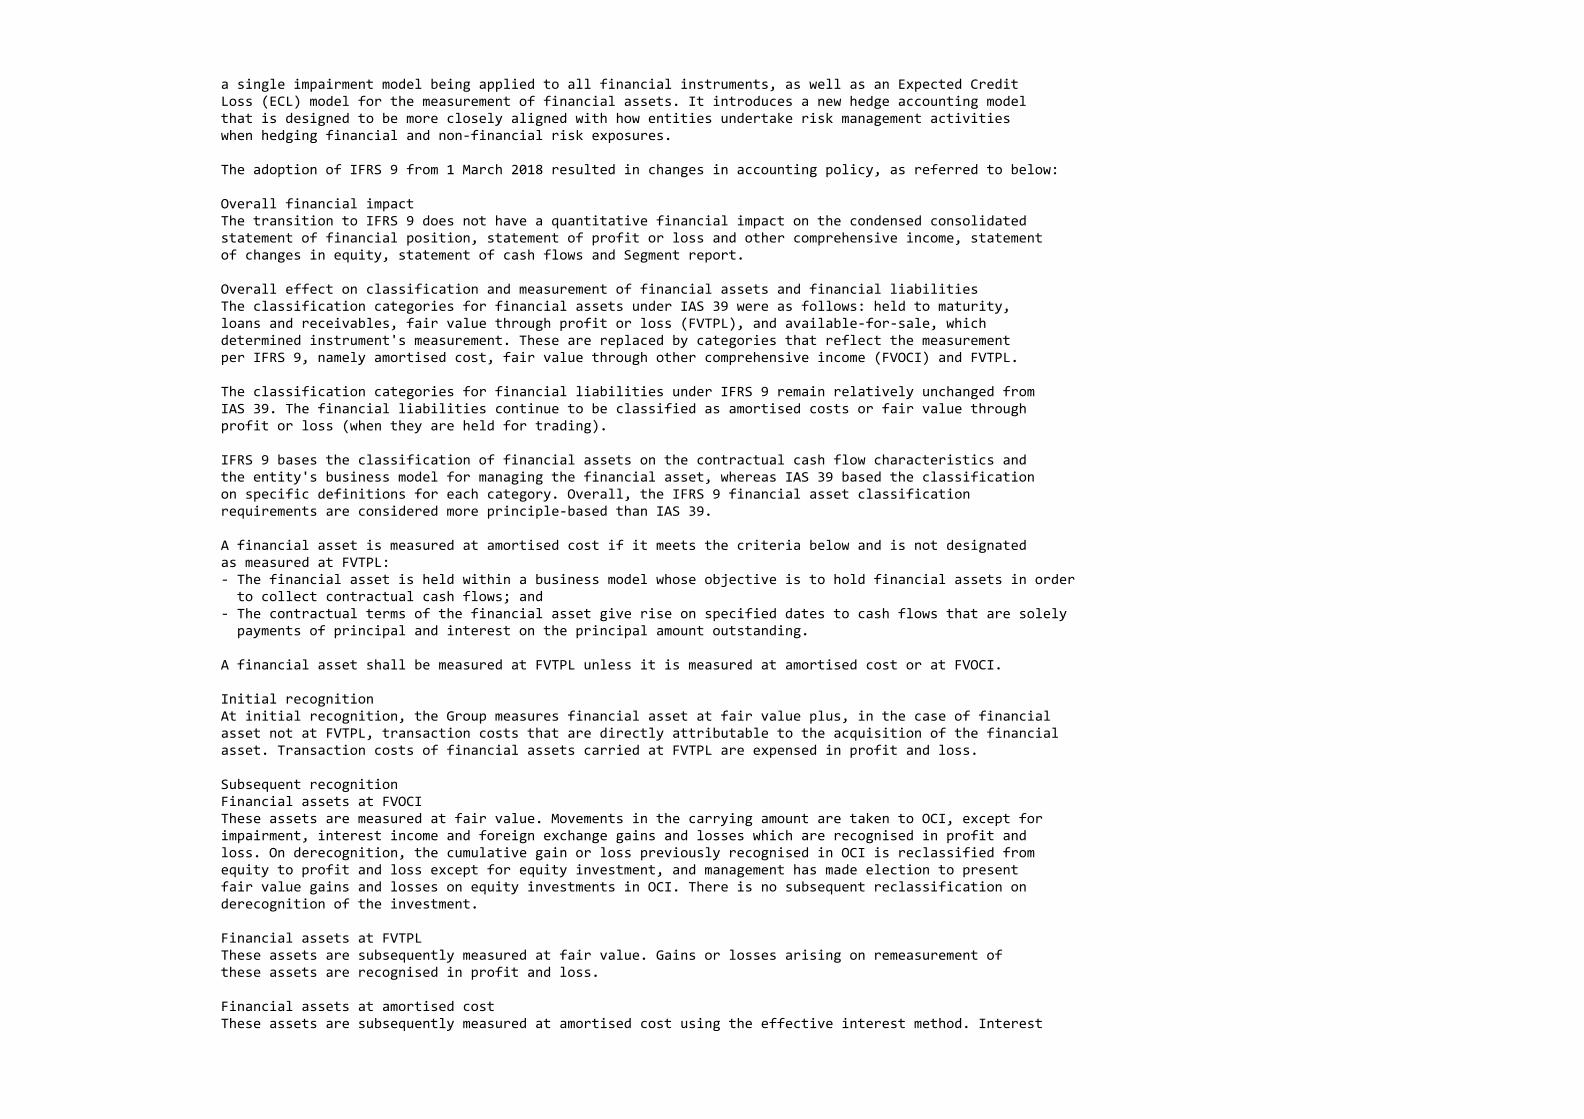
a single impairment model being applied to all financial instruments, as well as an Expected Credit Loss (ECL) model for the measurement of financial assets. It introduces a new hedge accounting model that is designed to be more closely aligned with how entities undertake risk management activities when hedging financial and non‐financial risk exposures.
The adoption of IFRS 9 from 1 March 2018 resulted in changes in accounting policy, as referred to below:
Overall financial impact The transition to IFRS 9 does not have a quantitative financial impact on the condensed consolidated statement of financial position, statement of profit or loss and other comprehensive income, statement of changes in equity, statement of cash flows and Segment report.
Overall effect on classification and measurement of financial assets and financial liabilities The classification categories for financial assets under IAS 39 were as follows: held to maturity, loans and receivables, fair value through profit or loss (FVTPL), and available‐for‐sale, which determined instrument's measurement. These are replaced by categories that reflect the measurement per IFRS 9, namely amortised cost, fair value through other comprehensive income (FVOCI) and FVTPL.
The classification categories for financial liabilities under IFRS 9 remain relatively unchanged from IAS 39. The financial liabilities continue to be classified as amortised costs or fair value through profit or loss (when they are held for trading).
IFRS 9 bases the classification of financial assets on the contractual cash flow characteristics and the entity's business model for managing the financial asset, whereas IAS 39 based the classification on specific definitions for each category. Overall, the IFRS 9 financial asset classification requirements are considered more principle‐based than IAS 39.
A financial asset is measured at amortised cost if it meets the criteria below and is not designated as measured at FVTPL: ‐ The financial asset is held within a business model whose objective is to hold financial assets in order to collect contractual cash flows; and ‐ The contractual terms of the financial asset give rise on specified dates to cash flows that are solely payments of principal and interest on the principal amount outstanding.
A financial asset shall be measured at FVTPL unless it is measured at amortised cost or at FVOCI.
Initial recognition At initial recognition, the Group measures financial asset at fair value plus, in the case of financial asset not at FVTPL, transaction costs that are directly attributable to the acquisition of the financial asset. Transaction costs of financial assets carried at FVTPL are expensed in profit and loss.
Subsequent recognition Financial assets at FVOCI These assets are measured at fair value. Movements in the carrying amount are taken to OCI, except for impairment, interest income and foreign exchange gains and losses which are recognised in profit and loss. On derecognition, the cumulative gain or loss previously recognised in OCI is reclassified from equity to profit and loss except for equity investment, and management has made election to present fair value gains and losses on equity investments in OCI. There is no subsequent reclassification on derecognition of the investment.
Financial assets at FVTPL These assets are subsequently measured at fair value. Gains or losses arising on remeasurement of these assets are recognised in profit and loss.
Financial assets at amortised cost These assets are subsequently measured at amortised cost using the effective interest method. Interest
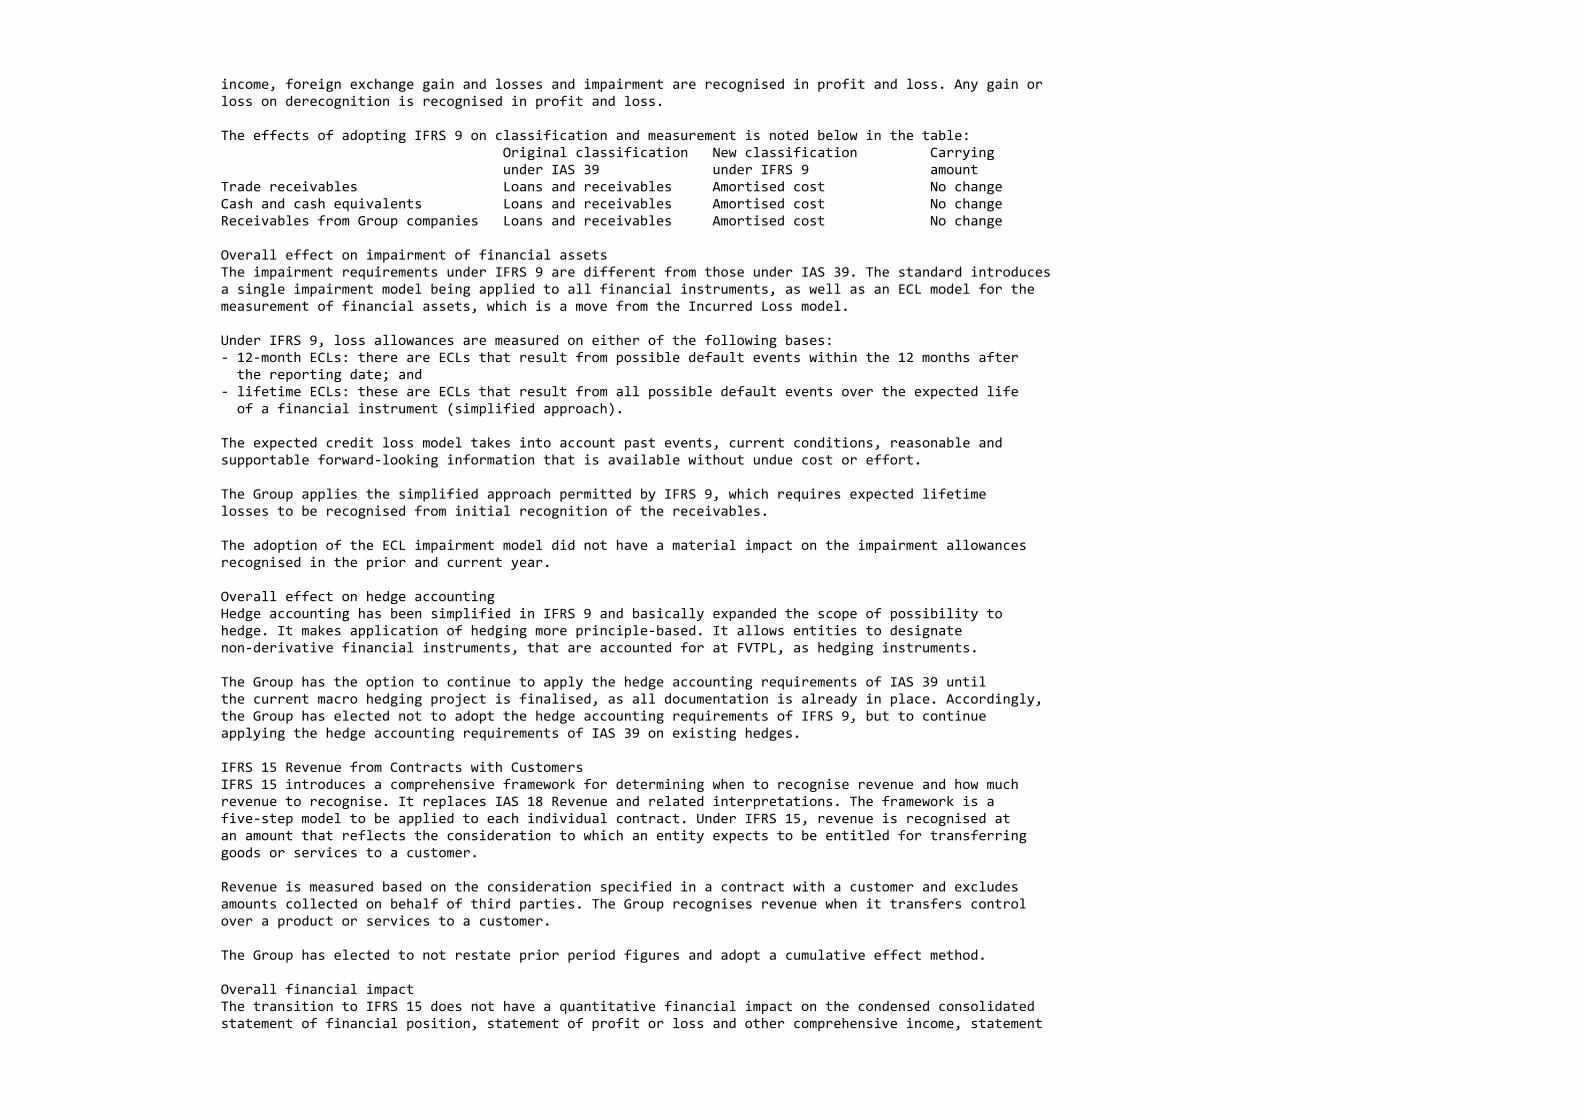
income, foreign exchange gain and losses and impairment are recognised in profit and loss. Any gain or loss on derecognition is recognised in profit and loss.
The effects of adopting IFRS 9 on classification and measurement is noted below in the table: Original classification New classification Carrying under IAS 39 under IFRS 9 amount Trade receivables Loans and receivables Amortised cost No change Cash and cash equivalents Loans and receivables Amortised cost No change Receivables from Group companies Loans and receivables Amortised cost No change Overall effect on impairment of financial assets The impairment requirements under IFRS 9 are different from those under IAS 39. The standard introduces a single impairment model being applied to all financial instruments, as well as an ECL model for the measurement of financial assets, which is a move from the Incurred Loss model.
Under IFRS 9, loss allowances are measured on either of the following bases: ‐ 12‐month ECLs: there are ECLs that result from possible default events within the 12 months after the reporting date; and ‐ lifetime ECLs: these are ECLs that result from all possible default events over the expected life of a financial instrument (simplified approach).
The expected credit loss model takes into account past events, current conditions, reasonable and supportable forward‐looking information that is available without undue cost or effort.
The Group applies the simplified approach permitted by IFRS 9, which requires expected lifetime losses to be recognised from initial recognition of the receivables.
The adoption of the ECL impairment model did not have a material impact on the impairment allowances recognised in the prior and current year.
Overall effect on hedge accounting Hedge accounting has been simplified in IFRS 9 and basically expanded the scope of possibility to hedge. It makes application of hedging more principle‐based. It allows entities to designate non‐derivative financial instruments, that are accounted for at FVTPL, as hedging instruments. The Group has the option to continue to apply the hedge accounting requirements of IAS 39 until the current macro hedging project is finalised, as all documentation is already in place. Accordingly, the Group has elected not to adopt the hedge accounting requirements of IFRS 9, but to continue applying the hedge accounting requirements of IAS 39 on existing hedges.
IFRS 15 Revenue from Contracts with Customers IFRS 15 introduces a comprehensive framework for determining when to recognise revenue and how much revenue to recognise. It replaces IAS 18 Revenue and related interpretations. The framework is a five‐step model to be applied to each individual contract. Under IFRS 15, revenue is recognised at an amount that reflects the consideration to which an entity expects to be entitled for transferring goods or services to a customer.
Revenue is measured based on the consideration specified in a contract with a customer and excludes amounts collected on behalf of third parties. The Group recognises revenue when it transfers control over a product or services to a customer.
The Group has elected to not restate prior period figures and adopt a cumulative effect method.
Overall financial impact The transition to IFRS 15 does not have a quantitative financial impact on the condensed consolidated statement of financial position, statement of profit or loss and other comprehensive income, statement
of changes in equity, statement of cash flows and Segment report.
Overall effect on disclosures IFRS 15 requires the Group to disclose the disaggregated revenue by categories that depict the nature, amount, timing or uncertainty of revenue. This information is disclosed in note 7.
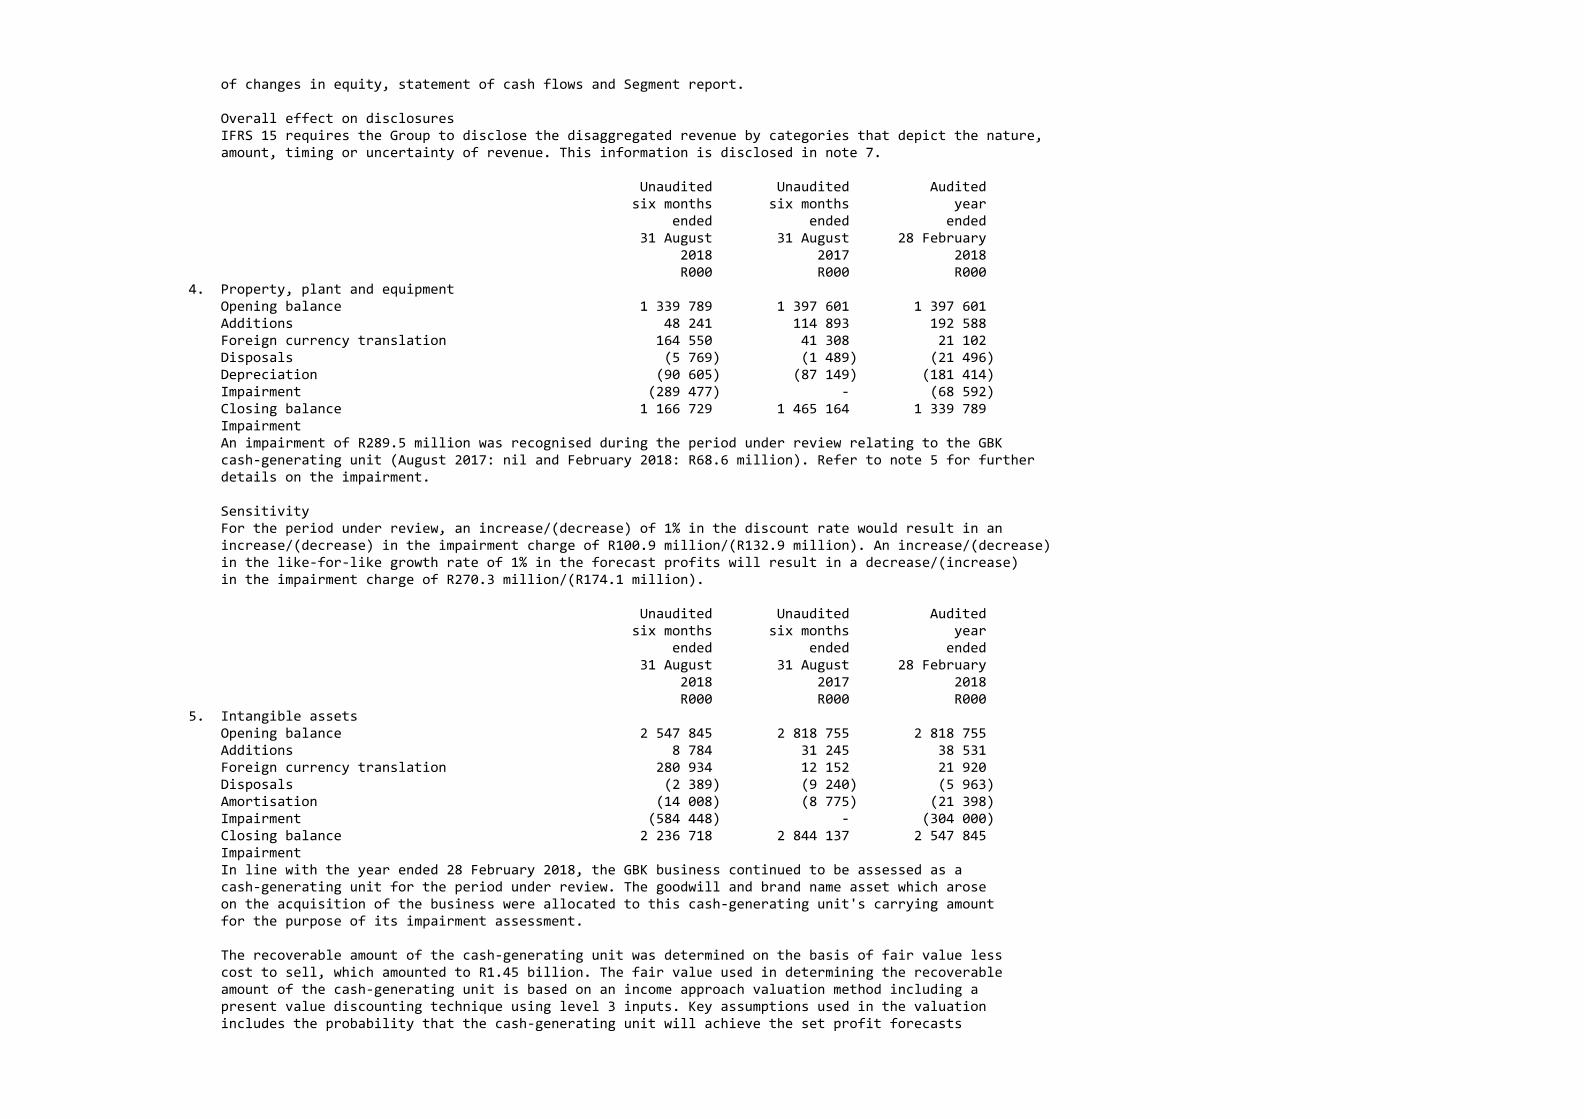
Unaudited Unaudited Audited six months six months year ended ended ended 31 August 31 August 28 February 2018 2017 2018 R000 R000 R000 4. Property, plant and equipment Opening balance 1 339 789 1 397 601 1 397 601 Additions 48 241 114 893 192 588 Foreign currency translation 164 550 41 308 21 102 Disposals (5 769) (1 489) (21 496) Depreciation (90 605) (87 149) (181 414) Impairment (289 477) ‐ (68 592) Closing balance 1 166 729 1 465 164 1 339 789 Impairment An impairment of R289.5 million was recognised during the period under review relating to the GBK cash‐generating unit (August 2017: nil and February 2018: R68.6 million). Refer to note 5 for further details on the impairment. Sensitivity For the period under review, an increase/(decrease) of 1% in the discount rate would result in an increase/(decrease) in the impairment charge of R100.9 million/(R132.9 million). An increase/(decrease) in the like‐for‐like growth rate of 1% in the forecast profits will result in a decrease/(increase) in the impairment charge of R270.3 million/(R174.1 million).
Unaudited Unaudited Audited six months six months year ended ended ended 31 August 31 August 28 February 2018 2017 2018 R000 R000 R000 5. Intangible assets Opening balance 2 547 845 2 818 755 2 818 755 Additions 8 784 31 245 38 531 Foreign currency translation 280 934 12 152 21 920 Disposals (2 389) (9 240) (5 963) Amortisation (14 008) (8 775) (21 398) Impairment (584 448) ‐ (304 000) Closing balance 2 236 718 2 844 137 2 547 845 Impairment In line with the year ended 28 February 2018, the GBK business continued to be assessed as a cash‐generating unit for the period under review. The goodwill and brand name asset which arose on the acquisition of the business were allocated to this cash‐generating unit's carrying amount for the purpose of its impairment assessment.
The recoverable amount of the cash‐generating unit was determined on the basis of fair value less cost to sell, which amounted to R1.45 billion. The fair value used in determining the recoverable amount of the cash‐generating unit is based on an income approach valuation method including a present value discounting technique using level 3 inputs. Key assumptions used in the valuation includes the probability that the cash‐generating unit will achieve the set profit forecasts
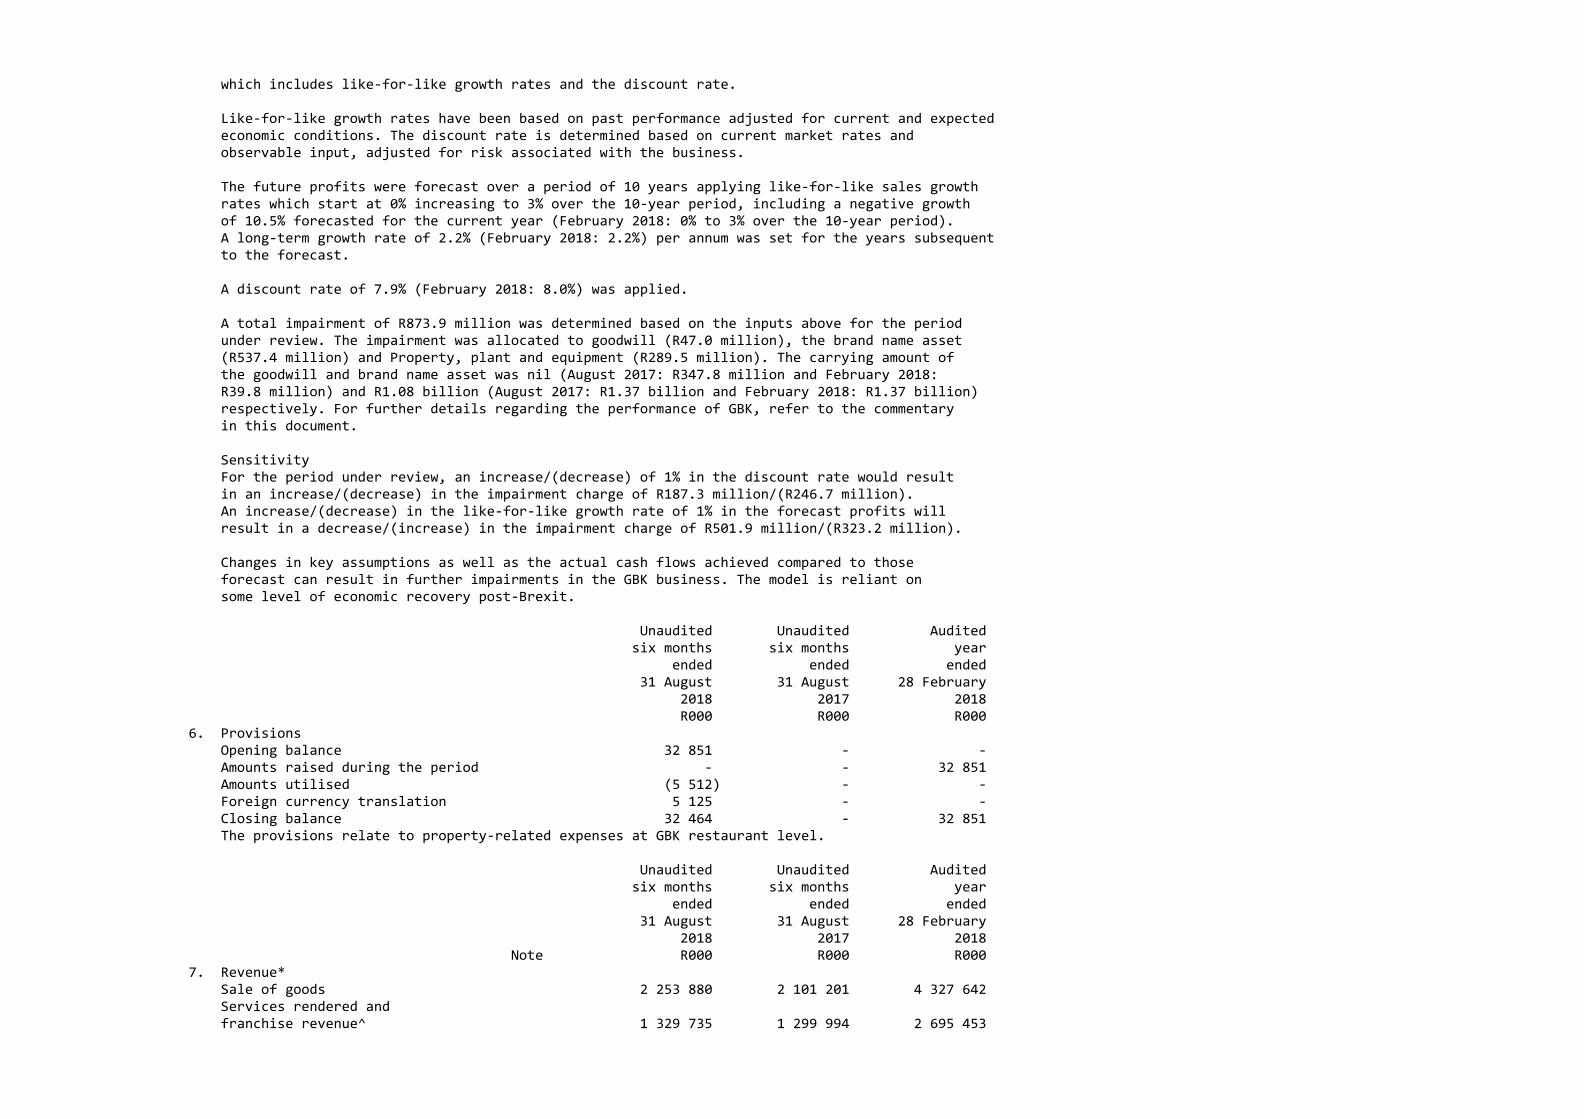
which includes like‐for‐like growth rates and the discount rate.
Like‐for‐like growth rates have been based on past performance adjusted for current and expected economic conditions. The discount rate is determined based on current market rates and observable input, adjusted for risk associated with the business.
The future profits were forecast over a period of 10 years applying like‐for‐like sales growth rates which start at 0% increasing to 3% over the 10‐year period, including a negative growth of 10.5% forecasted for the current year (February 2018: 0% to 3% over the 10‐year period). A long‐term growth rate of 2.2% (February 2018: 2.2%) per annum was set for the years subsequent to the forecast.
A discount rate of 7.9% (February 2018: 8.0%) was applied.
A total impairment of R873.9 million was determined based on the inputs above for the period under review. The impairment was allocated to goodwill (R47.0 million), the brand name asset (R537.4 million) and Property, plant and equipment (R289.5 million). The carrying amount of the goodwill and brand name asset was nil (August 2017: R347.8 million and February 2018: R39.8 million) and R1.08 billion (August 2017: R1.37 billion and February 2018: R1.37 billion) respectively. For further details regarding the performance of GBK, refer to the commentary in this document.
Sensitivity For the period under review, an increase/(decrease) of 1% in the discount rate would result in an increase/(decrease) in the impairment charge of R187.3 million/(R246.7 million). An increase/(decrease) in the like‐for‐like growth rate of 1% in the forecast profits will result in a decrease/(increase) in the impairment charge of R501.9 million/(R323.2 million).
Changes in key assumptions as well as the actual cash flows achieved compared to those forecast can result in further impairments in the GBK business. The model is reliant on some level of economic recovery post‐Brexit.
Unaudited Unaudited Audited six months six months year ended ended ended 31 August 31 August 28 February 2018 2017 2018 R000 R000 R000 6. Provisions Opening balance 32 851 ‐ ‐ Amounts raised during the period ‐ ‐ 32 851 Amounts utilised (5 512) ‐ ‐ Foreign currency translation 5 125 ‐ ‐ Closing balance 32 464 ‐ 32 851 The provisions relate to property‐related expenses at GBK restaurant level.
Unaudited Unaudited Audited six months six months year ended ended ended 31 August 31 August 28 February 2018 2017 2018 Note R000 R000 R000 7. Revenue* Sale of goods 2 253 880 2 101 201 4 327 642 Services rendered and franchise revenue^ 1 329 735 1 299 994 2 695 453
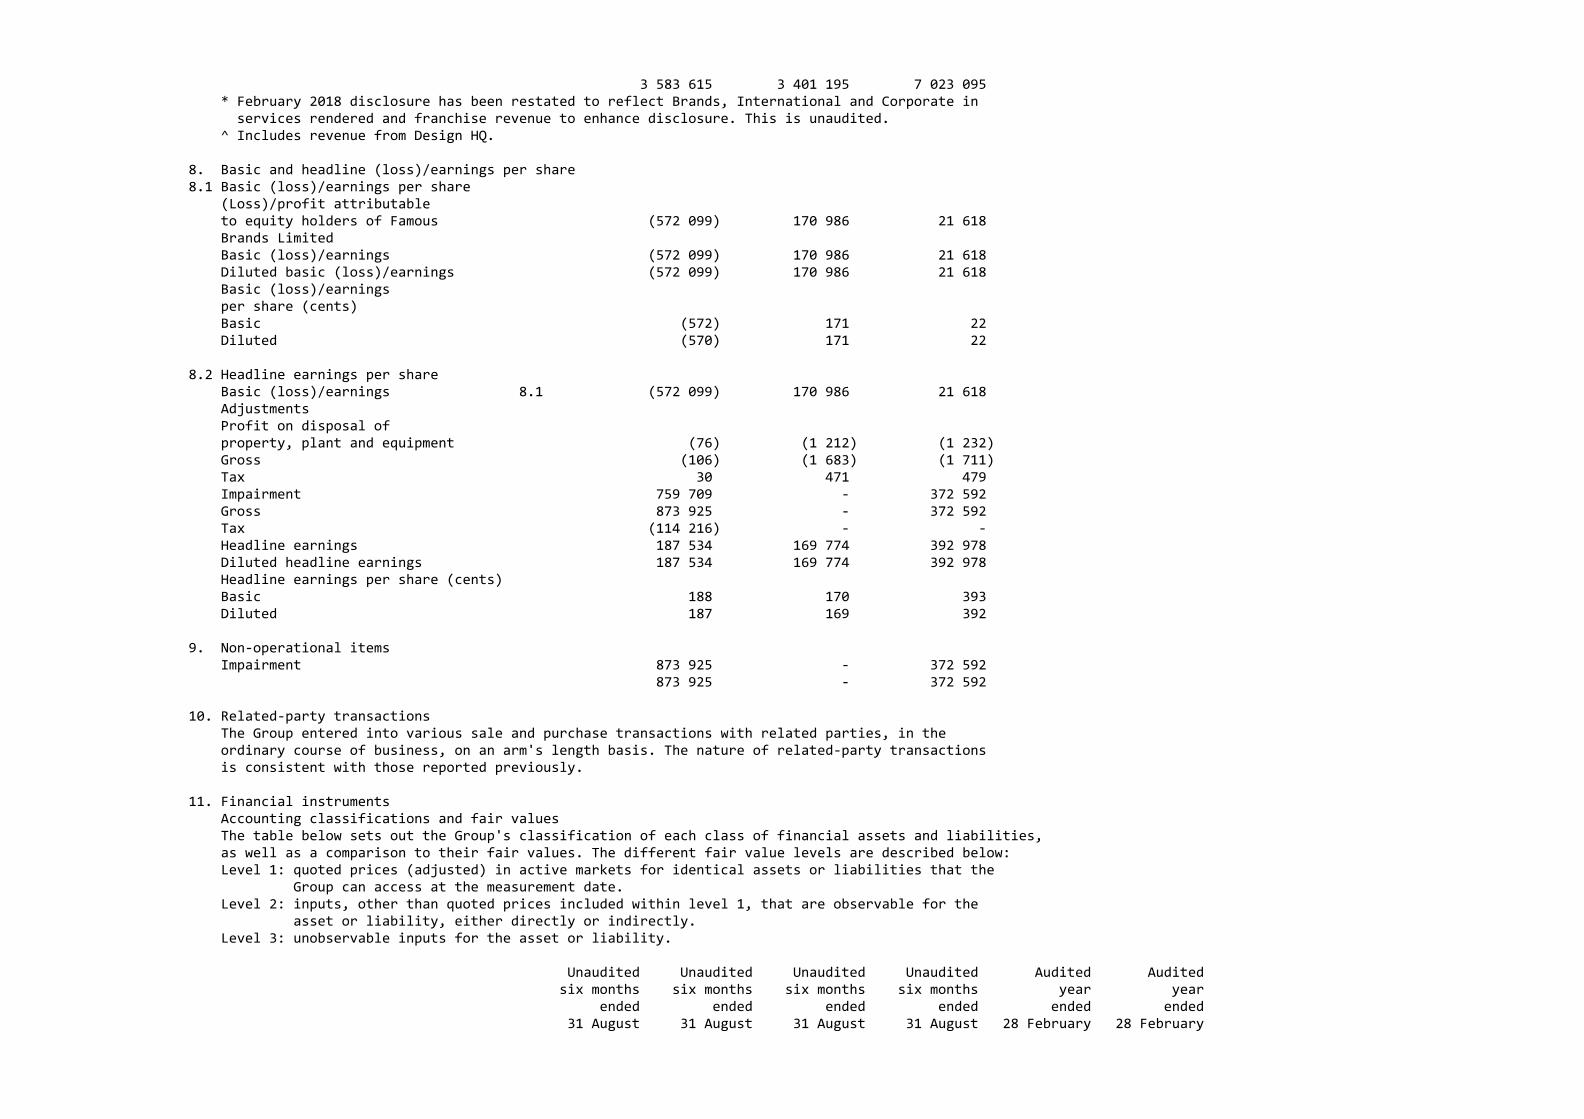
3 583 615 3 401 195 7 023 095 * February 2018 disclosure has been restated to reflect Brands, International and Corporate in services rendered and franchise revenue to enhance disclosure. This is unaudited. ^ Includes revenue from Design HQ.
8. Basic and headline (loss)/earnings per share8.1 Basic (loss)/earnings per share (Loss)/profit attributable to equity holders of Famous (572 099) 170 986 21 618 Brands Limited Basic (loss)/earnings (572 099) 170 986 21 618 Diluted basic (loss)/earnings (572 099) 170 986 21 618 Basic (loss)/earnings per share (cents) Basic (572) 171 22 Diluted (570) 171 22
8.2 Headline earnings per share Basic (loss)/earnings 8.1 (572 099) 170 986 21 618 Adjustments Profit on disposal of property, plant and equipment (76) (1 212) (1 232) Gross (106) (1 683) (1 711) Tax 30 471 479 Impairment 759 709 ‐ 372 592 Gross 873 925 ‐ 372 592 Tax (114 216) ‐ ‐ Headline earnings 187 534 169 774 392 978 Diluted headline earnings 187 534 169 774 392 978 Headline earnings per share (cents) Basic 188 170 393 Diluted 187 169 392
9. Non‐operational items Impairment 873 925 ‐ 372 592 873 925 ‐ 372 592
10. Related‐party transactions The Group entered into various sale and purchase transactions with related parties, in the ordinary course of business, on an arm's length basis. The nature of related‐party transactions is consistent with those reported previously.
11. Financial instruments Accounting classifications and fair values The table below sets out the Group's classification of each class of financial assets and liabilities, as well as a comparison to their fair values. The different fair value levels are described below: Level 1: quoted prices (adjusted) in active markets for identical assets or liabilities that the Group can access at the measurement date. Level 2: inputs, other than quoted prices included within level 1, that are observable for the asset or liability, either directly or indirectly. Level 3: unobservable inputs for the asset or liability.
Unaudited Unaudited Unaudited Unaudited Audited Audited six months six months six months six months year year ended ended ended ended ended ended 31 August 31 August 31 August 31 August 28 February 28 February
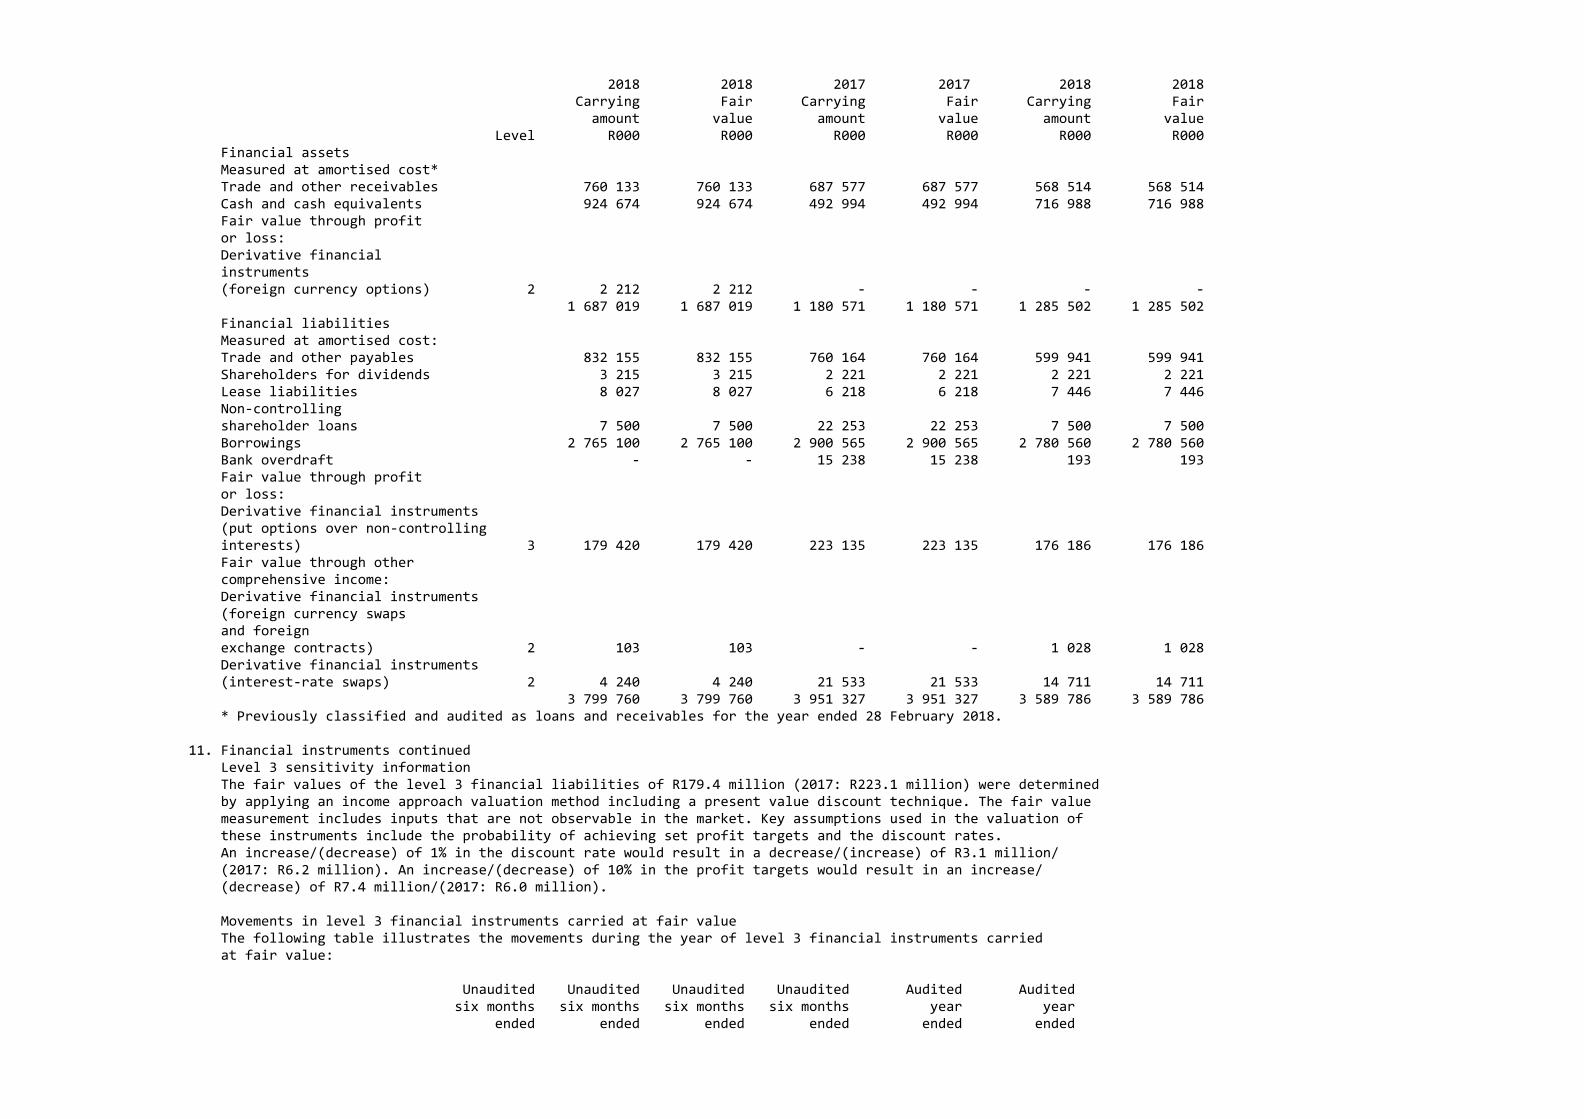
2018 2018 2017 2017 2018 2018 Carrying Fair Carrying Fair Carrying Fair amount value amount value amount value Level R000 R000 R000 R000 R000 R000 Financial assets Measured at amortised cost* Trade and other receivables 760 133 760 133 687 577 687 577 568 514 568 514 Cash and cash equivalents 924 674 924 674 492 994 492 994 716 988 716 988 Fair value through profit or loss: Derivative financial instruments (foreign currency options) 2 2 212 2 212 ‐ ‐ ‐ ‐ 1 687 019 1 687 019 1 180 571 1 180 571 1 285 502 1 285 502 Financial liabilities Measured at amortised cost: Trade and other payables 832 155 832 155 760 164 760 164 599 941 599 941 Shareholders for dividends 3 215 3 215 2 221 2 221 2 221 2 221 Lease liabilities 8 027 8 027 6 218 6 218 7 446 7 446 Non‐controlling shareholder loans 7 500 7 500 22 253 22 253 7 500 7 500 Borrowings 2 765 100 2 765 100 2 900 565 2 900 565 2 780 560 2 780 560 Bank overdraft ‐ ‐ 15 238 15 238 193 193 Fair value through profit or loss: Derivative financial instruments (put options over non‐controlling interests) 3 179 420 179 420 223 135 223 135 176 186 176 186 Fair value through other comprehensive income: Derivative financial instruments (foreign currency swaps and foreign exchange contracts) 2 103 103 ‐ ‐ 1 028 1 028 Derivative financial instruments (interest‐rate swaps) 2 4 240 4 240 21 533 21 533 14 711 14 711 3 799 760 3 799 760 3 951 327 3 951 327 3 589 786 3 589 786 * Previously classified and audited as loans and receivables for the year ended 28 February 2018.
11. Financial instruments continued Level 3 sensitivity information The fair values of the level 3 financial liabilities of R179.4 million (2017: R223.1 million) were determined by applying an income approach valuation method including a present value discount technique. The fair value measurement includes inputs that are not observable in the market. Key assumptions used in the valuation of these instruments include the probability of achieving set profit targets and the discount rates. An increase/(decrease) of 1% in the discount rate would result in a decrease/(increase) of R3.1 million/ (2017: R6.2 million). An increase/(decrease) of 10% in the profit targets would result in an increase/ (decrease) of R7.4 million/(2017: R6.0 million).
Movements in level 3 financial instruments carried at fair value The following table illustrates the movements during the year of level 3 financial instruments carried at fair value:
Unaudited Unaudited Unaudited Unaudited Audited Audited six months six months six months six months year year ended ended ended ended ended ended
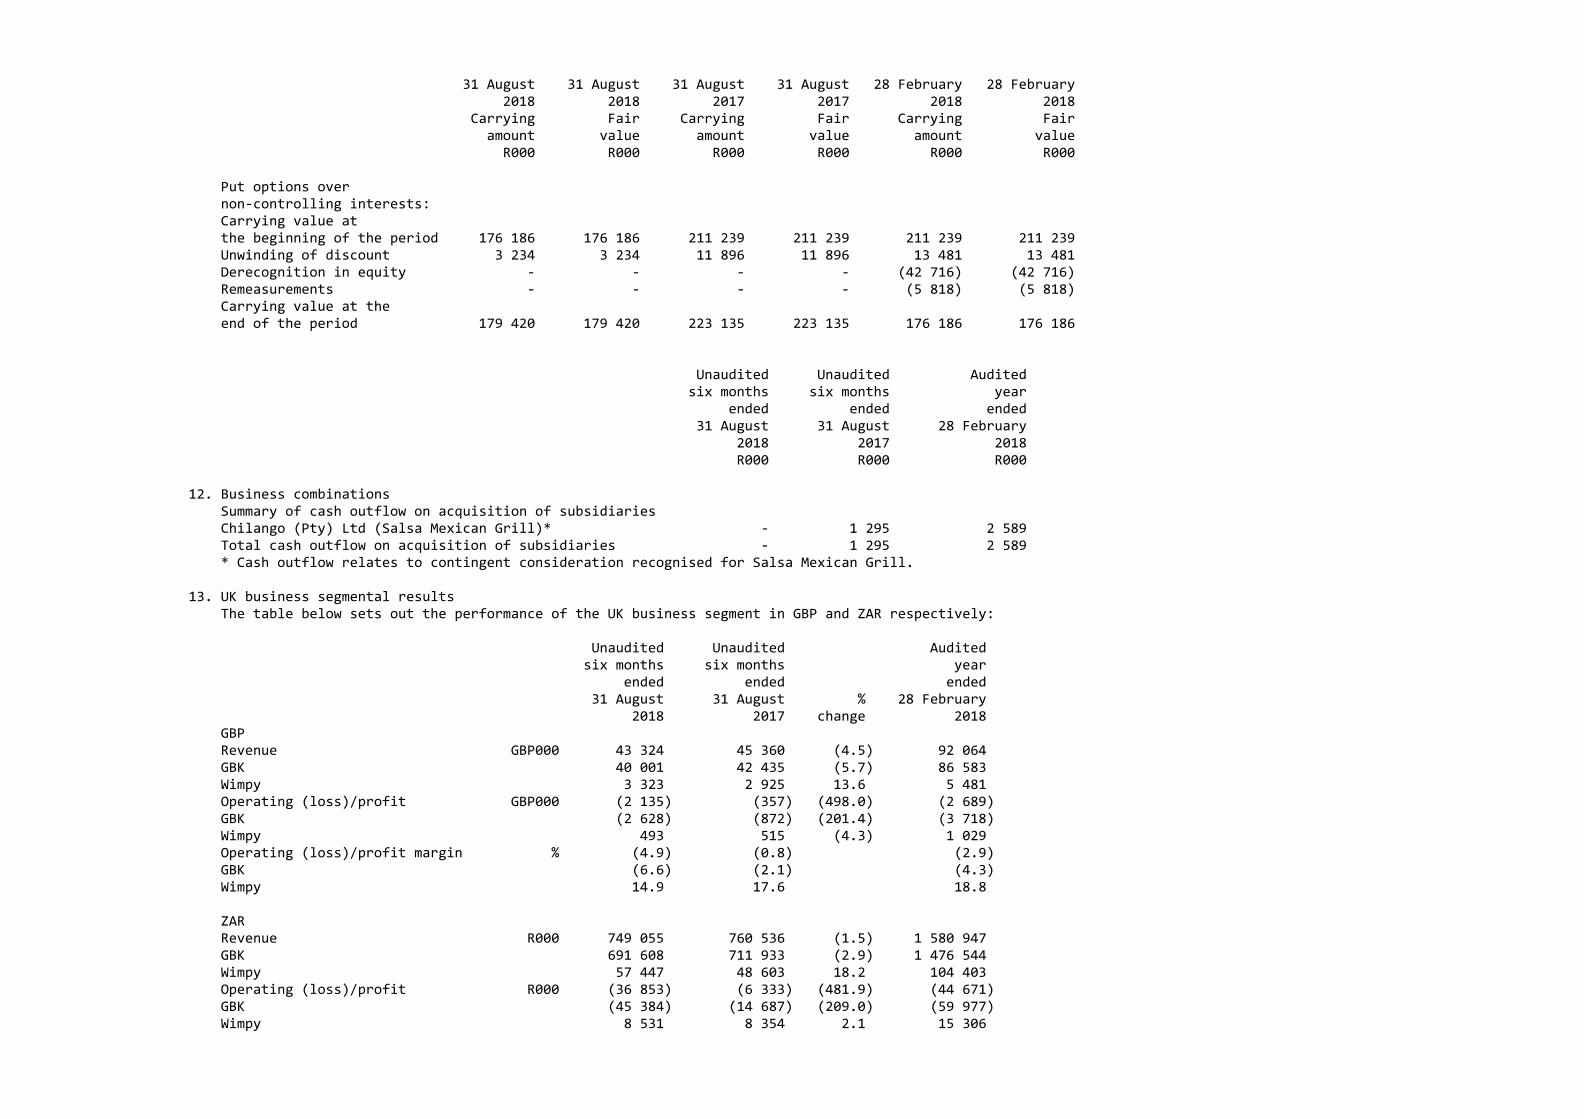
31 August 31 August 31 August 31 August 28 February 28 February 2018 2018 2017 2017 2018 2018 Carrying Fair Carrying Fair Carrying Fair amount value amount value amount value R000 R000 R000 R000 R000 R000 Put options over non‐controlling interests: Carrying value at the beginning of the period 176 186 176 186 211 239 211 239 211 239 211 239 Unwinding of discount 3 234 3 234 11 896 11 896 13 481 13 481 Derecognition in equity ‐ ‐ ‐ ‐ (42 716) (42 716) Remeasurements ‐ ‐ ‐ ‐ (5 818) (5 818) Carrying value at the end of the period 179 420 179 420 223 135 223 135 176 186 176 186
Unaudited Unaudited Audited six months six months year ended ended ended 31 August 31 August 28 February 2018 2017 2018 R000 R000 R000 12. Business combinations Summary of cash outflow on acquisition of subsidiaries Chilango (Pty) Ltd (Salsa Mexican Grill)* ‐ 1 295 2 589 Total cash outflow on acquisition of subsidiaries ‐ 1 295 2 589 * Cash outflow relates to contingent consideration recognised for Salsa Mexican Grill.
13. UK business segmental results The table below sets out the performance of the UK business segment in GBP and ZAR respectively: Unaudited Unaudited Audited six months six months year ended ended ended 31 August 31 August % 28 February 2018 2017 change 2018 GBP Revenue GBP000 43 324 45 360 (4.5) 92 064 GBK 40 001 42 435 (5.7) 86 583 Wimpy 3 323 2 925 13.6 5 481 Operating (loss)/profit GBP000 (2 135) (357) (498.0) (2 689) GBK (2 628) (872) (201.4) (3 718) Wimpy 493 515 (4.3) 1 029 Operating (loss)/profit margin % (4.9) (0.8) (2.9) GBK (6.6) (2.1) (4.3) Wimpy 14.9 17.6 18.8 ZAR Revenue R000 749 055 760 536 (1.5) 1 580 947 GBK 691 608 711 933 (2.9) 1 476 544 Wimpy 57 447 48 603 18.2 104 403 Operating (loss)/profit R000 (36 853) (6 333) (481.9) (44 671) GBK (45 384) (14 687) (209.0) (59 977) Wimpy 8 531 8 354 2.1 15 306
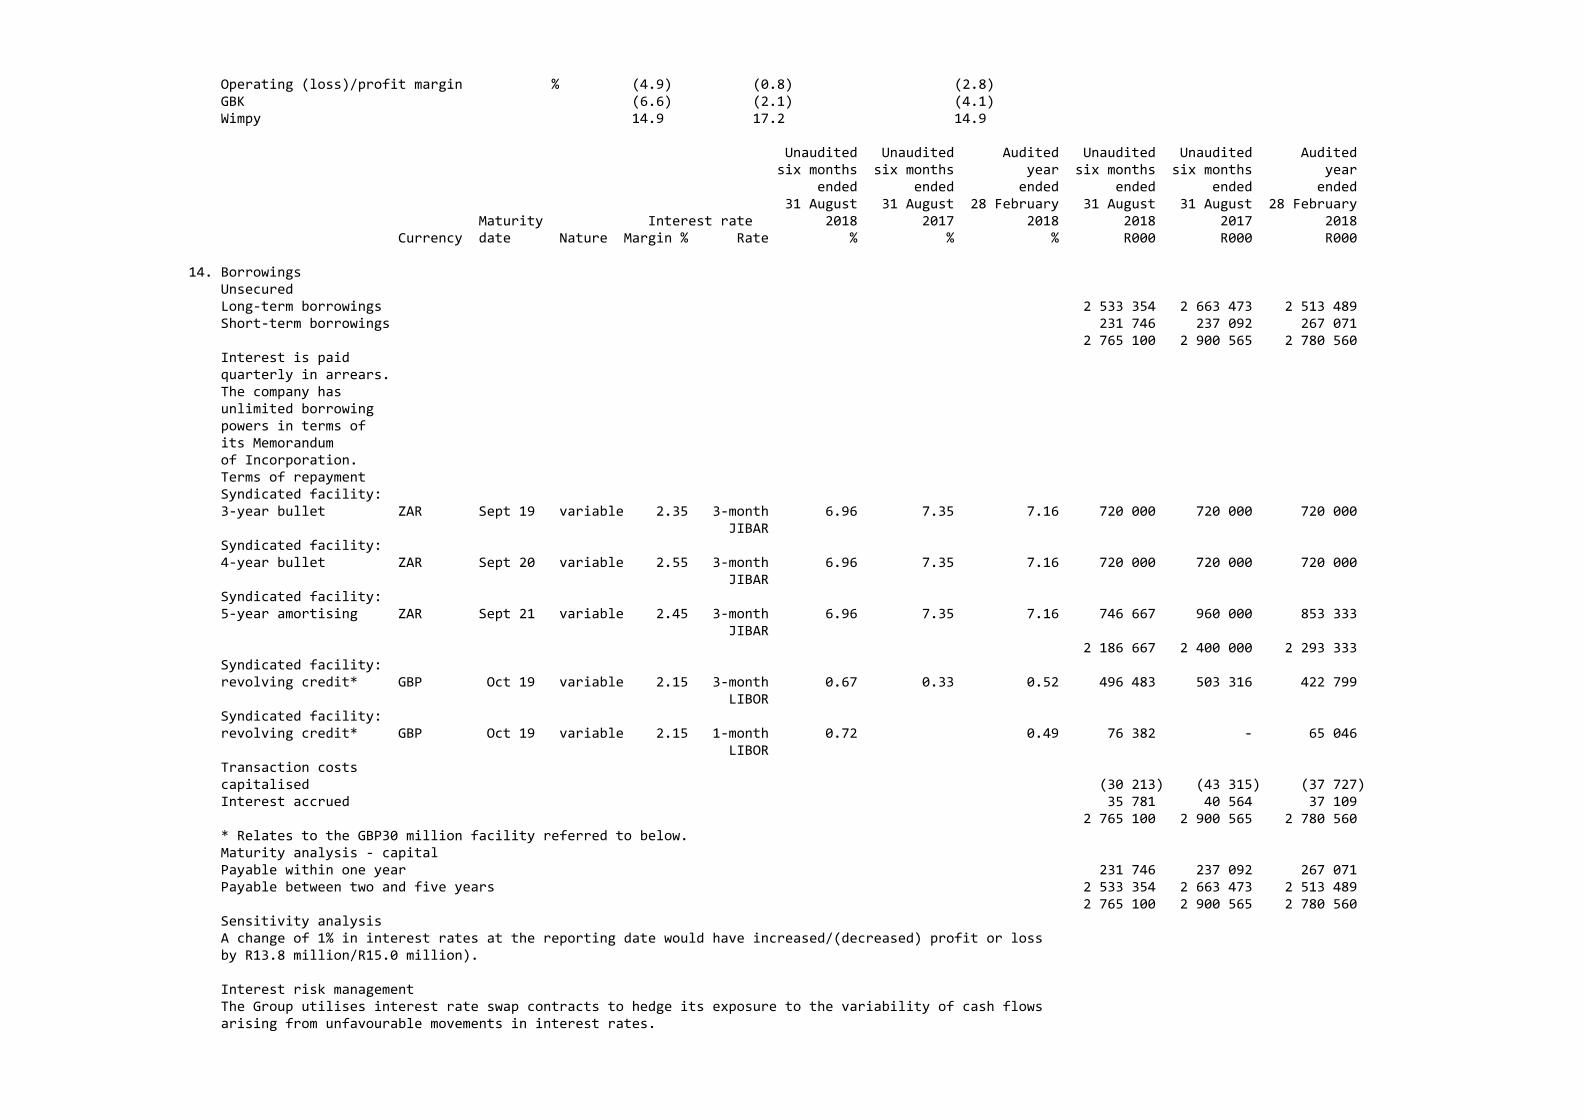
Operating (loss)/profit margin % (4.9) (0.8) (2.8) GBK (6.6) (2.1) (4.1) Wimpy 14.9 17.2 14.9
Unaudited Unaudited Audited Unaudited Unaudited Audited six months six months year six months six months year ended ended ended ended ended ended 31 August 31 August 28 February 31 August 31 August 28 February Maturity Interest rate 2018 2017 2018 2018 2017 2018 Currency date Nature Margin % Rate % % % R000 R000 R000 14. Borrowings Unsecured Long‐term borrowings 2 533 354 2 663 473 2 513 489 Short‐term borrowings 231 746 237 092 267 071 2 765 100 2 900 565 2 780 560 Interest is paid quarterly in arrears. The company has unlimited borrowing powers in terms of its Memorandum of Incorporation. Terms of repayment Syndicated facility: 3‐year bullet ZAR Sept 19 variable 2.35 3‐month 6.96 7.35 7.16 720 000 720 000 720 000 JIBAR Syndicated facility: 4‐year bullet ZAR Sept 20 variable 2.55 3‐month 6.96 7.35 7.16 720 000 720 000 720 000 JIBAR Syndicated facility: 5‐year amortising ZAR Sept 21 variable 2.45 3‐month 6.96 7.35 7.16 746 667 960 000 853 333 JIBAR 2 186 667 2 400 000 2 293 333 Syndicated facility: revolving credit* GBP Oct 19 variable 2.15 3‐month 0.67 0.33 0.52 496 483 503 316 422 799 LIBOR Syndicated facility: revolving credit* GBP Oct 19 variable 2.15 1‐month 0.72 0.49 76 382 ‐ 65 046 LIBOR Transaction costs capitalised (30 213) (43 315) (37 727) Interest accrued 35 781 40 564 37 109 2 765 100 2 900 565 2 780 560 * Relates to the GBP30 million facility referred to below. Maturity analysis ‐ capital Payable within one year 231 746 237 092 267 071 Payable between two and five years 2 533 354 2 663 473 2 513 489 2 765 100 2 900 565 2 780 560 Sensitivity analysis A change of 1% in interest rates at the reporting date would have increased/(decreased) profit or loss by R13.8 million/R15.0 million).
Interest risk management The Group utilises interest rate swap contracts to hedge its exposure to the variability of cash flows arising from unfavourable movements in interest rates.
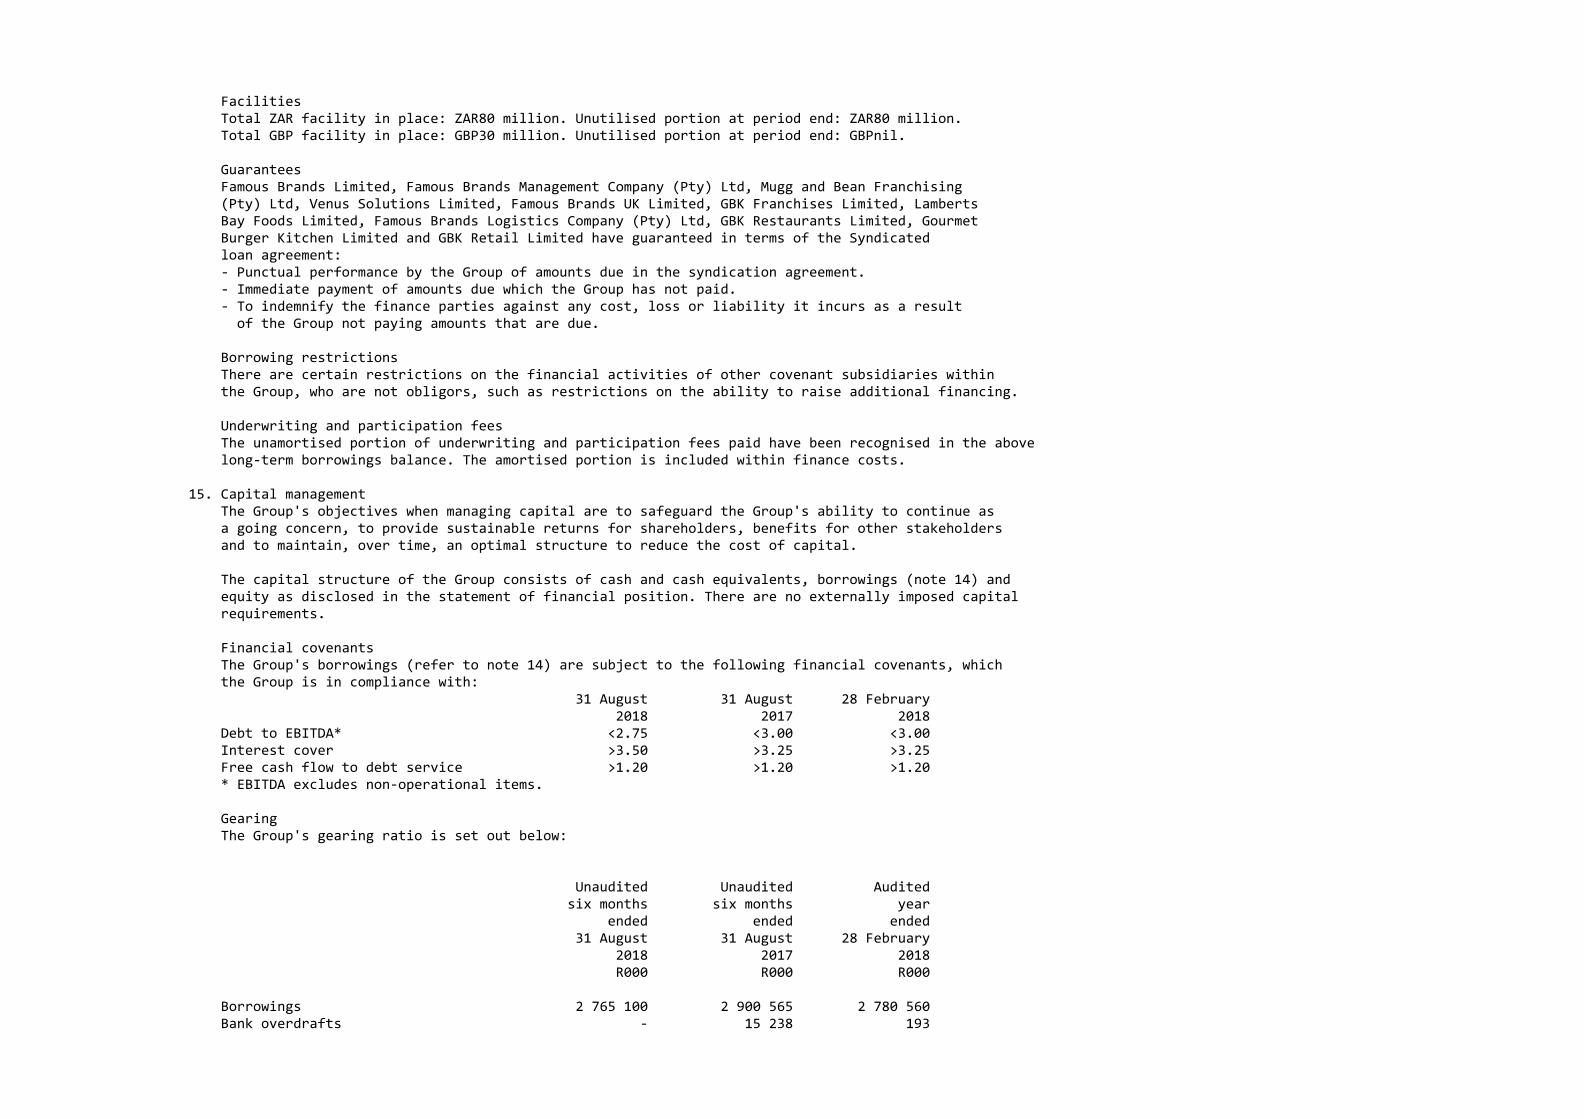
Facilities Total ZAR facility in place: ZAR80 million. Unutilised portion at period end: ZAR80 million. Total GBP facility in place: GBP30 million. Unutilised portion at period end: GBPnil.
Guarantees Famous Brands Limited, Famous Brands Management Company (Pty) Ltd, Mugg and Bean Franchising (Pty) Ltd, Venus Solutions Limited, Famous Brands UK Limited, GBK Franchises Limited, Lamberts Bay Foods Limited, Famous Brands Logistics Company (Pty) Ltd, GBK Restaurants Limited, Gourmet Burger Kitchen Limited and GBK Retail Limited have guaranteed in terms of the Syndicated loan agreement: ‐ Punctual performance by the Group of amounts due in the syndication agreement. ‐ Immediate payment of amounts due which the Group has not paid. ‐ To indemnify the finance parties against any cost, loss or liability it incurs as a result of the Group not paying amounts that are due.
Borrowing restrictions There are certain restrictions on the financial activities of other covenant subsidiaries within the Group, who are not obligors, such as restrictions on the ability to raise additional financing.
Underwriting and participation fees The unamortised portion of underwriting and participation fees paid have been recognised in the above long‐term borrowings balance. The amortised portion is included within finance costs. 15. Capital management The Group's objectives when managing capital are to safeguard the Group's ability to continue as a going concern, to provide sustainable returns for shareholders, benefits for other stakeholders and to maintain, over time, an optimal structure to reduce the cost of capital.
The capital structure of the Group consists of cash and cash equivalents, borrowings (note 14) and equity as disclosed in the statement of financial position. There are no externally imposed capital requirements.
Financial covenants The Group's borrowings (refer to note 14) are subject to the following financial covenants, which the Group is in compliance with: 31 August 31 August 28 February 2018 2017 2018 Debt to EBITDA* <2.75 <3.00 <3.00 Interest cover >3.50 >3.25 >3.25 Free cash flow to debt service >1.20 >1.20 >1.20 * EBITDA excludes non‐operational items. Gearing The Group's gearing ratio is set out below: Unaudited Unaudited Audited six months six months year ended ended ended 31 August 31 August 28 February 2018 2017 2018 R000 R000 R000 Borrowings 2 765 100 2 900 565 2 780 560 Bank overdrafts ‐ 15 238 193
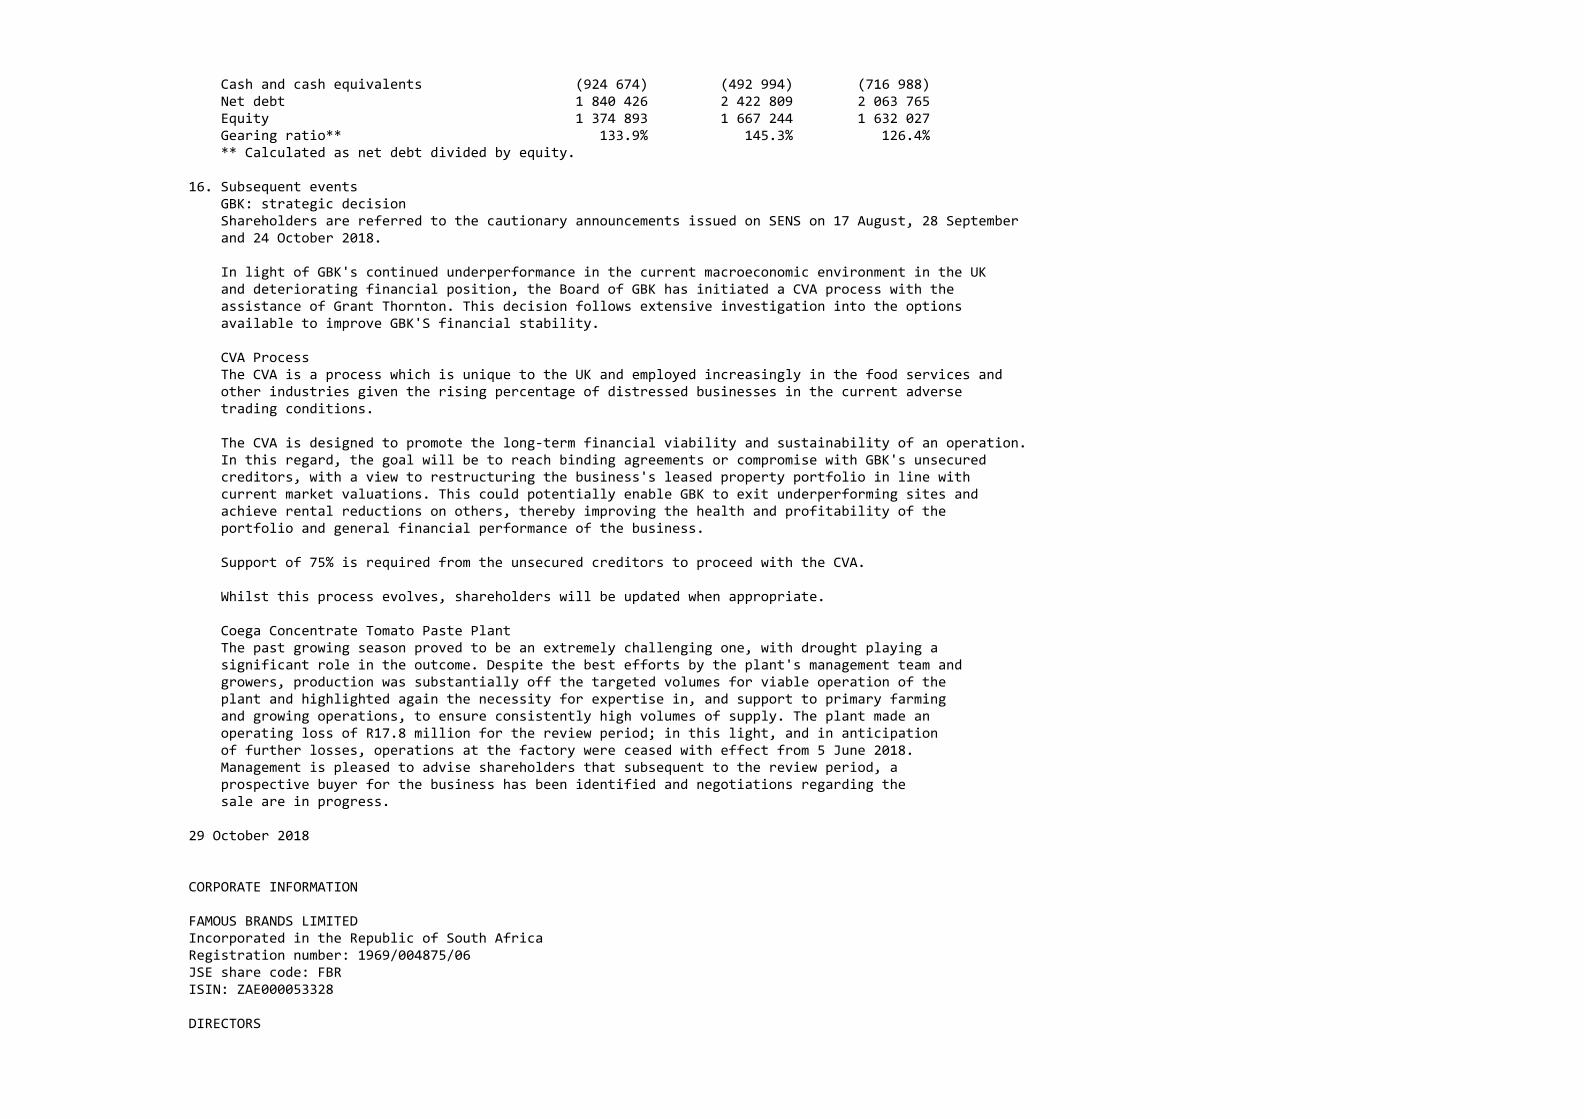
Cash and cash equivalents (924 674) (492 994) (716 988) Net debt 1 840 426 2 422 809 2 063 765 Equity 1 374 893 1 667 244 1 632 027 Gearing ratio** 133.9% 145.3% 126.4% ** Calculated as net debt divided by equity. 16. Subsequent events GBK: strategic decision Shareholders are referred to the cautionary announcements issued on SENS on 17 August, 28 September and 24 October 2018.
In light of GBK's continued underperformance in the current macroeconomic environment in the UK and deteriorating financial position, the Board of GBK has initiated a CVA process with the assistance of Grant Thornton. This decision follows extensive investigation into the options available to improve GBK'S financial stability.
CVA Process The CVA is a process which is unique to the UK and employed increasingly in the food services and other industries given the rising percentage of distressed businesses in the current adverse trading conditions.
The CVA is designed to promote the long‐term financial viability and sustainability of an operation. In this regard, the goal will be to reach binding agreements or compromise with GBK's unsecured creditors, with a view to restructuring the business's leased property portfolio in line with current market valuations. This could potentially enable GBK to exit underperforming sites and achieve rental reductions on others, thereby improving the health and profitability of the portfolio and general financial performance of the business.
Support of 75% is required from the unsecured creditors to proceed with the CVA.
Whilst this process evolves, shareholders will be updated when appropriate.
Coega Concentrate Tomato Paste Plant The past growing season proved to be an extremely challenging one, with drought playing a significant role in the outcome. Despite the best efforts by the plant's management team and growers, production was substantially off the targeted volumes for viable operation of the plant and highlighted again the necessity for expertise in, and support to primary farming and growing operations, to ensure consistently high volumes of supply. The plant made an operating loss of R17.8 million for the review period; in this light, and in anticipation of further losses, operations at the factory were ceased with effect from 5 June 2018. Management is pleased to advise shareholders that subsequent to the review period, a prospective buyer for the business has been identified and negotiations regarding the sale are in progress.
29 October 2018
CORPORATE INFORMATION
FAMOUS BRANDS LIMITED Incorporated in the Republic of South AfricaRegistration number: 1969/004875/06JSE share code: FBRISIN: ZAE000053328
DIRECTORS
NJ Adami, SL Botha (Independent Chairman), CH Boulle, DJ Fredericks, N Halamandaris, JL Halamandres, DP Hele (Chief Executive Officer)*, ET Mashilwane, K Ntlha (Group Financial Director)*, BL Sibiya and T Skweyiya.* Executive
COMPANY SECRETARYIWM Isdale
REGISTERED OFFICE478 James Crescent, Halfway House, Midrand, 1685PO Box 2884, Halfway House, 1685Telephone: +27 11 315 3000Email: [email protected] address: www.famousbrands.co.za
TRANSFER SECRETARIESComputershare Investor Services Proprietary LimitedRegistration number: 2004/003647/07Rosebank Towers, 15 Biermann AvenueRosebank, 2196, South AfricaPO Box 61051, Marshalltown, 2107
SPONSORThe Standard Bank of South Africa LimitedRegistration number: 1969/017128/0630 Baker Street, Rosebank, 2196
AUDITORSDeloitte & Touche20 Woodlands DriveThe WoodlandsWoodmead2052
Contact informationTel: +27 11 315 [email protected]@famousbrands.co.za
478 James CrescentHalfway House, South Africa, 1685