Embed Size (px)
Citation preview
March 2020 ARC/20/INF/10
This document may be printed on demand following an FAO initiative to minimize its environmental impact and
promote greener communications. This and other documents can be consulted at www.fao.org
NC707/e
E
FAO REGIONAL CONFERENCE FOR
AFRICA
Thirty-first Session
Victoria Falls, Zimbabwe, 23-27 March 2020
Intra-Africa Trade in Food and Agriculture: Issues, Challenges and
Prospects in the Context of the African Continental Free Trade Area
(AfCFTA)
Executive Summary
Despite its vast agricultural potential, Africa is a net importer of agricultural products, and
increasingly so. While exports have been growing at a compound annual growth rate of 4 percent
over the last two decades (1996 – 2016), imports have been increasing by 6 percent per year over the
same period. The increase in agricultural and food imports has been particularly striking for basic
foodstuffs.
Significant scope for intra-African trade in the key food groups is possible. Food demand is projected
to increase fuelled by high population growth, rapid urbanization and income growth. Moreover,
Africa’s urban food markets are estimated to expand exponentially. The launch of the African
Continental Free Trade Area (AfCFTA) is an opportunity to increase investment and trade in
agricultural products, given the importance of the agricultural sector to African economies.
Experiences from previous efforts such as the formulation and implementation of the Tripartite Free
Trade Area (TFTA) provide both examples of the challenges of continent-wide integration and the
regional tools and frameworks that can facilitate this process. Challenges include different Rules of
Origin (ROO) requirements, multiple overlapping Regional Economic Communities (RECs)
memberships of many African countries, and the significant diversity of countries in the AfCFTA
region. Tools and frameworks exist that can help promote and facilitate intra-African trade, which
member countries could beneficially employ.
Matters to be brought to the attention of the Regional Conference
The conference is invited to consider the following:
Note the large and growing dependence of Africa on imports to meet food requirements. Encourage member countries to take advantage of the opportunity created by AfCFTA to
boost intra-African trade in agri-food products, and transform the food and agriculture

2 ARC/20/INF/10
systems towards a productive and competitive economic undertaking benefiting the
majority of the population, including youth and women. Encourage RECs and the African Union Commission (AUC) to strengthen partnerships
with FAO and other partners to design and implement capacity development programmes to
support member countries for them to benefit from the opportunities of AfCFTA.
Strengthen collaboration and partnership with relevant organizations such as the African
Union (AU) and the RECs.
Queries on the content of this document may be addressed to:
ARC/20/INF/10 3
I. Introduction
1. The Comprehensive Africa Agriculture Development Programme (CAADP) aims at transforming
African agriculture, harnessing the sector’s job and wealth creation potential, and thereby
contributing to eradicating poverty, hunger and malnutrition. Notwithstanding growth
opportunities from the global market, this transformation shall be driven primarily by African
markets, where food demand, fuelled by high population growth, rapid urbanization and income
growth, is projected to increase by 178 percent by 2050. The World Bank estimates that Africa’s
urban food markets will exceed a total value of USD 400 billion by 2030, while the food system
business will reach that of USD 1 trillion during the same period.
2. Even so, despite the improvement in economic performance in recent years and more than a
decade after the adoption of CAADP, Sub-Saharan African countries remain marginal global
agricultural trade players, accounting for only 2.8 percent of world trade in goods and 18 percent
in intra-African trade. The continent’s demand for food continues to outstrip domestic supply by
some 20 percent, with a total average import bill of USD 80 billion growing annually at 6 percent.
To take advantage of the fast-growing intra-African market opportunities, African agriculture
must undergo a structural transformation that entails shifting from subsistence-oriented
production systems toward more market-oriented ones. This structural transformation must also
benefit the most vulnerable segments of the population – smallholder farmers, rural women and
youth—as it links farmers to regional and global value chains.
3. Regional integration, including through greater trade in goods and services, is one of the key
aspirations of the African Union’s Agenda 2063, as expressed in the Ten-Year Implementation
Plan (2014–2023) adopted as the Malabo Declaration in 2014. Within this context, the launch of
the African Continental Free Trade Area (AfCFTA), a flagship programme of the Agenda, is
expected to significantly accelerate growth and sustainable development through doubling intra-
African trade by 2022, and tripling trade in agricultural goods by 2023.1
4. This document presents a summary of the key issues and challenges to improving food security
through enhancing intra-African trade and suggests approaches to tackle them in the context of
the AfCFTA. It builds on ongoing work in FAO by reviewing the status of intra-African trade
around a broad set of commodity groups. The analysis focuses on Regional Economic
Communities (RECs).2
II. The African Continental Free Trade Area
5. According to the 2019 edition of the Regional Integration Index (the African Union [AU], United
Nations [UN] Economic Commission for Africa [ECA] and the African Development Bank
[AfDB]), regional integration in Africa remains low across the five dimensions, including trade
integration, regional infrastructure, productive integration, free movement of people and
macroeconomic integration. South Africa emerges as the most integrated country, particularly
with regard to trade integration, regional infrastructure and productive integration; whereas South
1 AU (African Union). 2015. Agenda 2063. The Africa We Want. A Shared Strategic Framework for Inclusive
Growth and Sustainable Development. First Ten-Year Implementation Plan 2014-2023. Addis Ababa 2The analysis of trade trends, particularly intraregional trade, is limited by the availability and completeness of
the data reported by countries. As such, it is important to be mindful, that intraregional trade in Africa, may be
underestimated due to under-reporting of trade data among the countries within the region, and the prevalence of
informal cross-border trade.
4 ARC/20/INF/10
Sudan as the least integrated mainly owing to its modest performance in regional infrastructure
and financial integration. As for RECs, the East African Community (EAC) performs the highest
on trade integration.
6. The agreement establishing the AfCFTA was reached in March 2018 and entered into force on
30 May 2019. The AfCFTA would create a single market of up to 1.2 billion people and a GDP
of nearly USD 3 trillion, which could generate substantial economic gains. Agenda 2063 calls for
countries to take progressive steps towards greater levels of integration, through the establishment
of an African Customs Union and an African Common Market. In support of these goals, the
Assembly of Heads of State and Government of the African Union also endorsed an Action Plan
for Boosting Intra-African Trade (BIAT).
7. The AfCFTA agreement establishes the protocol of the free trade area (trade in goods, trade in
services, investment and dispute settlement) that includes disciplines inter alia on tariffs, rules of
origin, the movement of persons, trade facilitation, non-tariff barriers (NTBs), trade remedies,
technical assistance, special export zones and capacity building and cooperation. Negotiations are
ongoing to address market access offers and exclusion lists, competition, intellectual property
rights and e-commerce. African countries have undertaken commitments to remove tariffs (with
a current trade-weighted average of 5.67 percent) on 90 percent of over 5 000 goods with the
remaining 10 percent for “sensitive or excluded items”, and to liberalize service sectors such as
transport, communication, tourism, financial services and business services. The agreement
includes the mutual recognition of standards and licences and the harmonization of sanitary and
phytosanitary (SPS) measures to reduce NTBs and facilitate trade.
8. The AfCFTA has the potential to boost intra-African agricultural trade and thus support
diversification, economic transformation and commodity-based industrialization with a focus on
strategic commodities including rice, legumes, maize, cotton, palm oil, beef, dairy, poultry and
fishery products, cassava, sorghum and millet.3 This boost in intra-Africa trade needs to be
balanced with the fact that many countries in Africa do not produce enough to meet domestic
demand, and complementary policies aimed at promoting agricultural productivity, improving the
enabling and regulatory environment for business to flourish, and upgrading workers’ skills are
necessary.
III. Situation and Trends in Intra-regional Trade in Food and
Agriculture
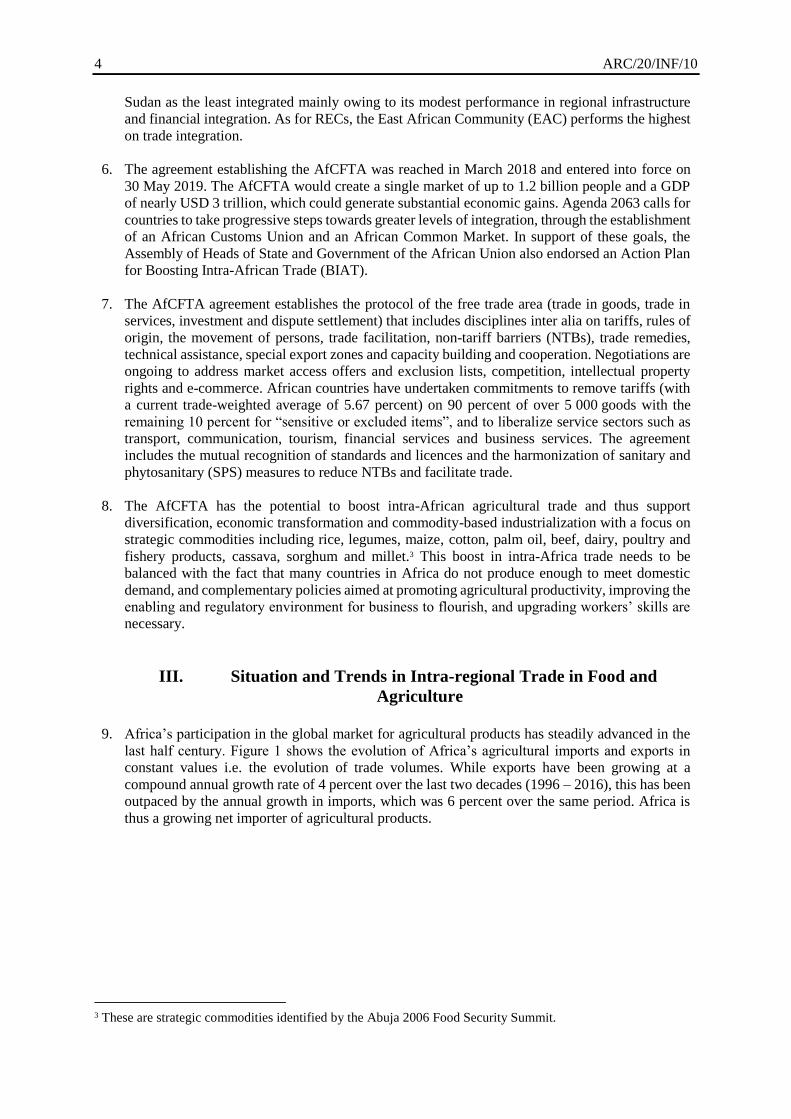
9. Africa’s participation in the global market for agricultural products has steadily advanced in the
last half century. Figure 1 shows the evolution of Africa’s agricultural imports and exports in
constant values i.e. the evolution of trade volumes. While exports have been growing at a
compound annual growth rate of 4 percent over the last two decades (1996 – 2016), this has been
outpaced by the annual growth in imports, which was 6 percent over the same period. Africa is
thus a growing net importer of agricultural products.
3 These are strategic commodities identified by the Abuja 2006 Food Security Summit.
ARC/20/INF/10 5
Figure 1. Africa's Agricultural Imports and Exports, Constant Unit Values (USD, year 2000)
Note: Export and import volumes, including intra-African trade, measured at constant prices (USD, year 2000)
Source: Calculated based on data from FAOSTAT
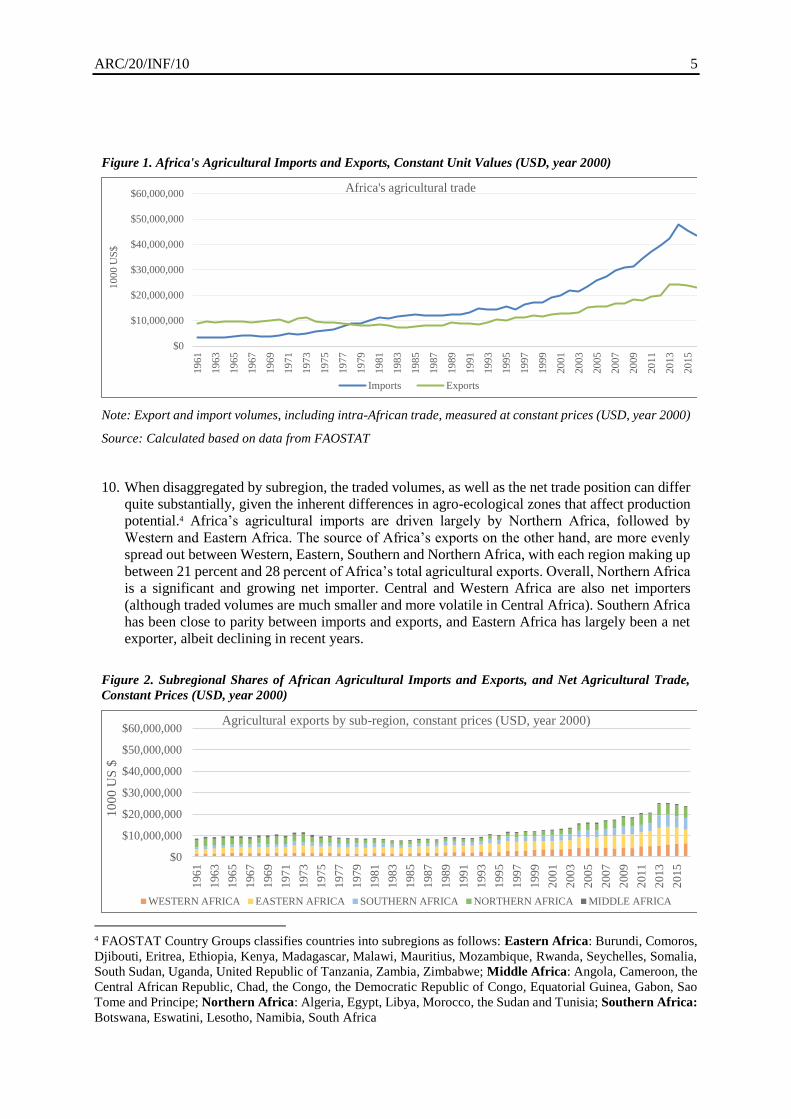
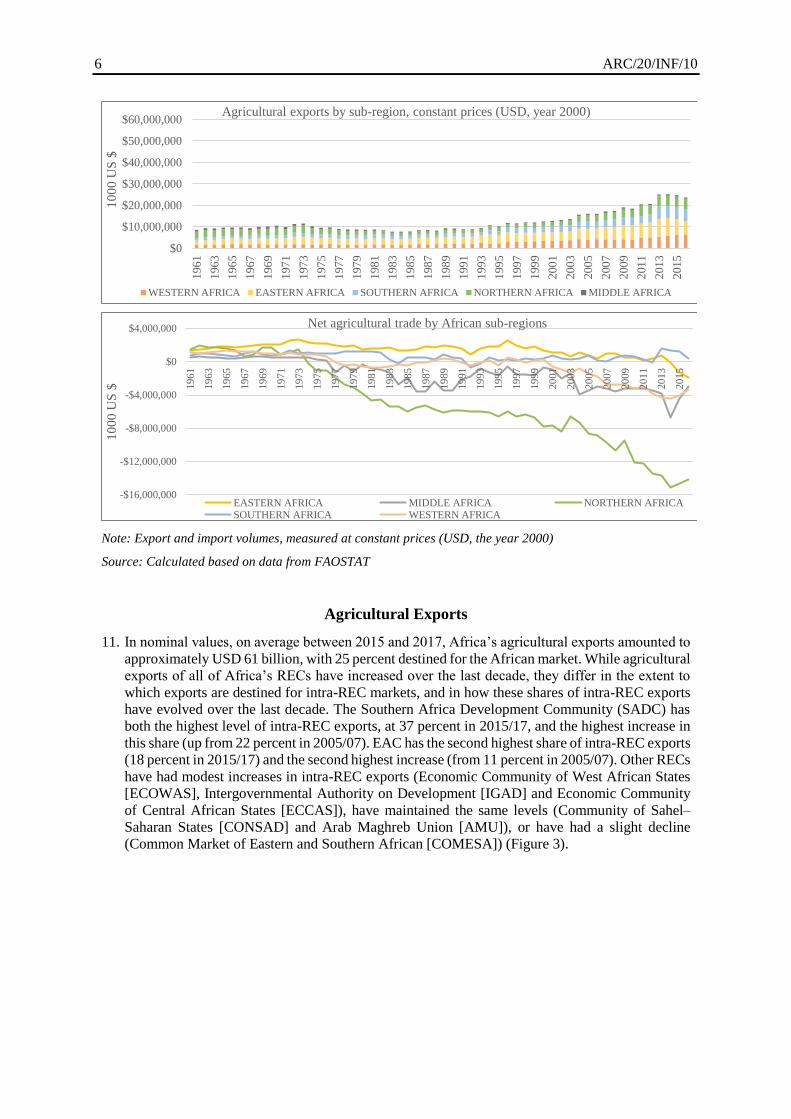
10. When disaggregated by subregion, the traded volumes, as well as the net trade position can differ
quite substantially, given the inherent differences in agro-ecological zones that affect production
potential.4 Africa’s agricultural imports are driven largely by Northern Africa, followed by
Western and Eastern Africa. The source of Africa’s exports on the other hand, are more evenly
spread out between Western, Eastern, Southern and Northern Africa, with each region making up
between 21 percent and 28 percent of Africa’s total agricultural exports. Overall, Northern Africa
is a significant and growing net importer. Central and Western Africa are also net importers
(although traded volumes are much smaller and more volatile in Central Africa). Southern Africa
has been close to parity between imports and exports, and Eastern Africa has largely been a net
exporter, albeit declining in recent years.
Figure 2. Subregional Shares of African Agricultural Imports and Exports, and Net Agricultural Trade,
Constant Prices (USD, year 2000)
4 FAOSTAT Country Groups classifies countries into subregions as follows: Eastern Africa: Burundi, Comoros,
Djibouti, Eritrea, Ethiopia, Kenya, Madagascar, Malawi, Mauritius, Mozambique, Rwanda, Seychelles, Somalia,
South Sudan, Uganda, United Republic of Tanzania, Zambia, Zimbabwe; Middle Africa: Angola, Cameroon, the
Central African Republic, Chad, the Congo, the Democratic Republic of Congo, Equatorial Guinea, Gabon, Sao
Tome and Principe; Northern Africa: Algeria, Egypt, Libya, Morocco, the Sudan and Tunisia; Southern Africa:
Botswana, Eswatini, Lesotho, Namibia, South Africa
$0
$10,000,000
$20,000,000
$30,000,000
$40,000,000
$50,000,000
$60,000,00019
61
19
63
19
65
19
67
19
69
19
71
19
73
19
75
19
77
19
79
19
81
19
83
19
85
19
87
19
89
19
91
19
93
19
95
19
97
19
99
20
01
20
03
20
05
20
07
20
09
20
11
20
13
20
15
10
00
US
$
Africa's agricultural trade
Imports Exports
$0
$10,000,000
$20,000,000
$30,000,000
$40,000,000
$50,000,000
$60,000,000
196
1
196
3
196
5
196
7
196
9
197
1
197
3
197
5
197
7
197
9
198
1
198
3
198
5
198
7
198
9
199
1
199
3
199
5
199
7
199
9
200
1
200
3
200
5
200
7
200
9
201
1
201
3
201
5
10
00
US
$
Agricultural exports by sub-region, constant prices (USD, year 2000)
WESTERN AFRICA EASTERN AFRICA SOUTHERN AFRICA NORTHERN AFRICA MIDDLE AFRICA
6 ARC/20/INF/10
Note: Export and import volumes, measured at constant prices (USD, the year 2000)
Source: Calculated based on data from FAOSTAT
Agricultural Exports
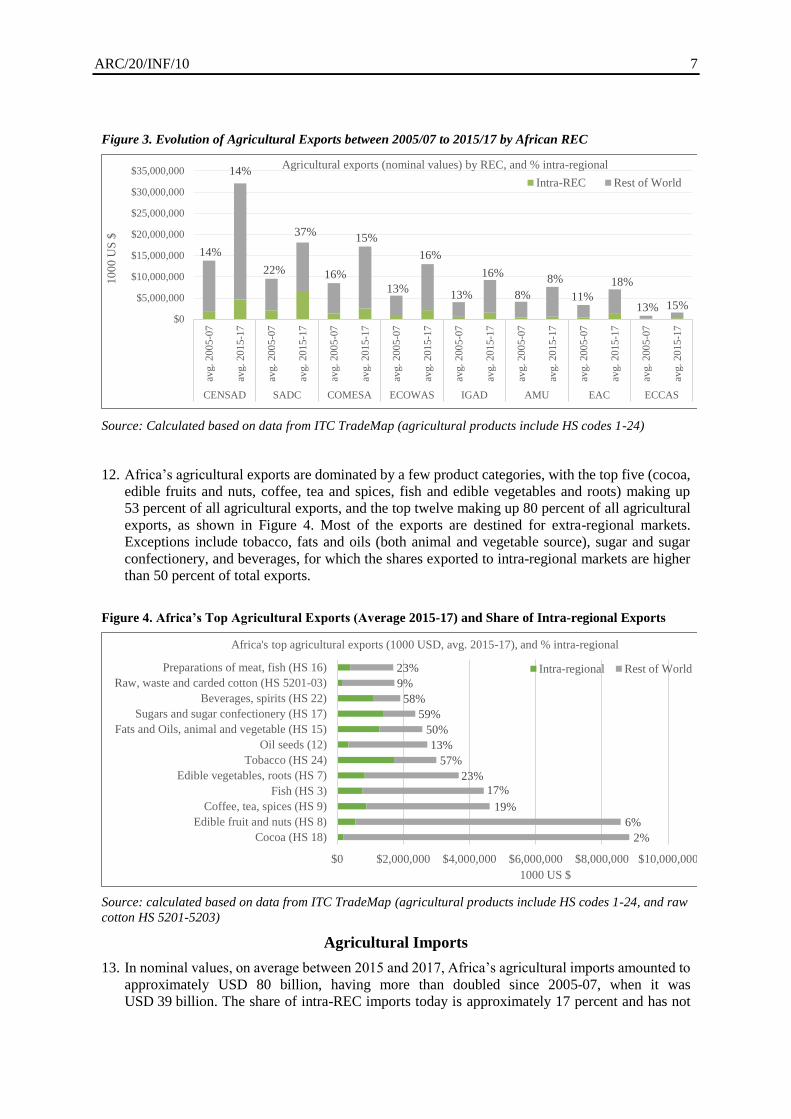
11. In nominal values, on average between 2015 and 2017, Africa’s agricultural exports amounted to
approximately USD 61 billion, with 25 percent destined for the African market. While agricultural
exports of all of Africa’s RECs have increased over the last decade, they differ in the extent to
which exports are destined for intra-REC markets, and in how these shares of intra-REC exports
have evolved over the last decade. The Southern Africa Development Community (SADC) has
both the highest level of intra-REC exports, at 37 percent in 2015/17, and the highest increase in
this share (up from 22 percent in 2005/07). EAC has the second highest share of intra-REC exports
(18 percent in 2015/17) and the second highest increase (from 11 percent in 2005/07). Other RECs
have had modest increases in intra-REC exports (Economic Community of West African States
[ECOWAS], Intergovernmental Authority on Development [IGAD] and Economic Community
of Central African States [ECCAS]), have maintained the same levels (Community of Sahel–
Saharan States [CONSAD] and Arab Maghreb Union [AMU]), or have had a slight decline
(Common Market of Eastern and Southern African [COMESA]) (Figure 3).
$0
$10,000,000
$20,000,000
$30,000,000
$40,000,000
$50,000,000
$60,000,000
196
1
196
3
196
5
196
7
196
9
197
1
197
3
197
5
197
7
197
9
198
1
198
3
198
5
198
7
198
9
199
1
199
3
199
5
199
7
199
9
200
1
200
3
200
5
200
7
200
9
201
1
201
3
201
5
10
00
US
$Agricultural exports by sub-region, constant prices (USD, year 2000)
WESTERN AFRICA EASTERN AFRICA SOUTHERN AFRICA NORTHERN AFRICA MIDDLE AFRICA
-$16,000,000
-$12,000,000
-$8,000,000
-$4,000,000
$0
$4,000,000
19
61
19
63
19
65
19
67
19
69
19
71
19
73
19
75
19
77
19
79
19
81
19
83
19
85
19
87
19
89
19
91
19
93
19
95
19
97
19
99
20
01
20
03
20
05
20
07
20
09
20
11
20
13
20
15
10
00
US
$
Net agricultural trade by African sub-regions
EASTERN AFRICA MIDDLE AFRICA NORTHERN AFRICASOUTHERN AFRICA WESTERN AFRICA
ARC/20/INF/10 7
Figure 3. Evolution of Agricultural Exports between 2005/07 to 2015/17 by African REC
Source: Calculated based on data from ITC TradeMap (agricultural products include HS codes 1-24)
12. Africa’s agricultural exports are dominated by a few product categories, with the top five (cocoa,
edible fruits and nuts, coffee, tea and spices, fish and edible vegetables and roots) making up
53 percent of all agricultural exports, and the top twelve making up 80 percent of all agricultural
exports, as shown in Figure 4. Most of the exports are destined for extra-regional markets.
Exceptions include tobacco, fats and oils (both animal and vegetable source), sugar and sugar
confectionery, and beverages, for which the shares exported to intra-regional markets are higher
than 50 percent of total exports.
Figure 4. Africa’s Top Agricultural Exports (Average 2015-17) and Share of Intra-regional Exports
Source: calculated based on data from ITC TradeMap (agricultural products include HS codes 1-24, and raw
cotton HS 5201-5203)
Agricultural Imports
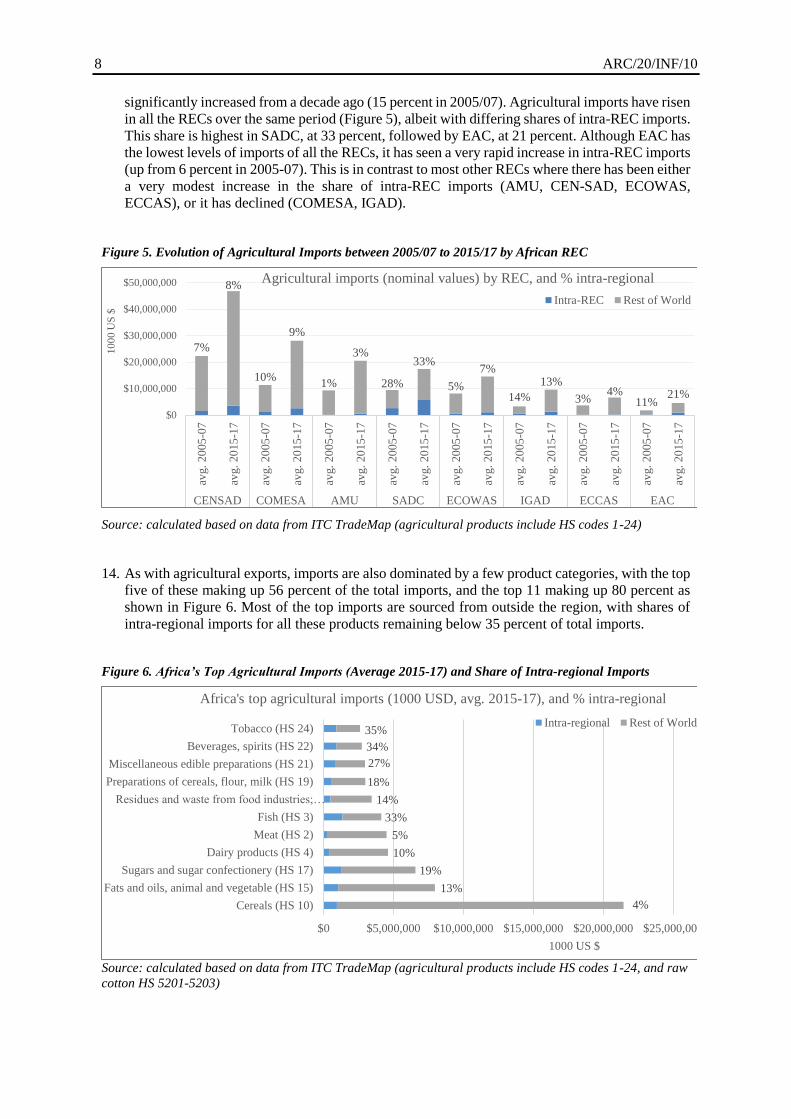
13. In nominal values, on average between 2015 and 2017, Africa’s agricultural imports amounted to
approximately USD 80 billion, having more than doubled since 2005-07, when it was
USD 39 billion. The share of intra-REC imports today is approximately 17 percent and has not
14%
14%
22%
37%
16%
15%
13%
16%
13%
16%
8%
8%
11%
18%
13% 15%$0
$5,000,000
$10,000,000
$15,000,000
$20,000,000
$25,000,000
$30,000,000
$35,000,000
avg.
200
5-0
7
avg.
201
5-1
7
avg.
200
5-0
7
avg.
201
5-1
7
avg.
200
5-0
7
avg.
201
5-1
7
avg.
200
5-0
7
avg.
201
5-1
7
avg.
200
5-0
7
avg.
201
5-1
7
avg.
200
5-0
7
avg.
201
5-1
7
avg.
200
5-0
7
avg.
201
5-1
7
avg.
200
5-0
7
avg.
201
5-1
7
CENSAD SADC COMESA ECOWAS IGAD AMU EAC ECCAS
10
00
US
$
Agricultural exports (nominal values) by REC, and % intra-regional
Intra-REC Rest of World
2%
6%
19%
17%
23%
57%
13%
50%
59%
58%
9%
23%
$0 $2,000,000 $4,000,000 $6,000,000 $8,000,000 $10,000,000
Cocoa (HS 18)
Edible fruit and nuts (HS 8)
Coffee, tea, spices (HS 9)
Fish (HS 3)
Edible vegetables, roots (HS 7)
Tobacco (HS 24)
Oil seeds (12)
Fats and Oils, animal and vegetable (HS 15)
Sugars and sugar confectionery (HS 17)
Beverages, spirits (HS 22)
Raw, waste and carded cotton (HS 5201-03)
Preparations of meat, fish (HS 16)
1000 US $
Africa's top agricultural exports (1000 USD, avg. 2015-17), and % intra-regional
Intra-regional Rest of World
8 ARC/20/INF/10
significantly increased from a decade ago (15 percent in 2005/07). Agricultural imports have risen
in all the RECs over the same period (Figure 5), albeit with differing shares of intra-REC imports.
This share is highest in SADC, at 33 percent, followed by EAC, at 21 percent. Although EAC has
the lowest levels of imports of all the RECs, it has seen a very rapid increase in intra-REC imports
(up from 6 percent in 2005-07). This is in contrast to most other RECs where there has been either
a very modest increase in the share of intra-REC imports (AMU, CEN-SAD, ECOWAS,
ECCAS), or it has declined (COMESA, IGAD).
Figure 5. Evolution of Agricultural Imports between 2005/07 to 2015/17 by African REC
Source: calculated based on data from ITC TradeMap (agricultural products include HS codes 1-24)
14. As with agricultural exports, imports are also dominated by a few product categories, with the top
five of these making up 56 percent of the total imports, and the top 11 making up 80 percent as
shown in Figure 6. Most of the top imports are sourced from outside the region, with shares of
intra-regional imports for all these products remaining below 35 percent of total imports.
Figure 6. Africa’s Top Agricultural Imports (Average 2015-17) and Share of Intra-regional Imports
Source: calculated based on data from ITC TradeMap (agricultural products include HS codes 1-24, and raw
cotton HS 5201-5203)
7%
8%
10%
9%
1%
3%
28%
33%
5%
7%
14%
13%
3%4%
11%21%
$0
$10,000,000
$20,000,000
$30,000,000
$40,000,000
$50,000,000
avg.
20
05
-07
avg.
20
15
-17
avg.
20
05
-07
avg.
20
15
-17
avg.
20
05
-07
avg.
20
15
-17
avg.
20
05
-07
avg.
20
15
-17
avg.
20
05
-07
avg.
20
15
-17
avg.
20
05
-07
avg.
20
15
-17
avg.
20
05
-07
avg.
20
15
-17
avg.
20
05
-07
avg.
20
15
-17
CENSAD COMESA AMU SADC ECOWAS IGAD ECCAS EAC
10
00
US
$
Agricultural imports (nominal values) by REC, and % intra-regional
Intra-REC Rest of World
4%
13%
19%
10%
5%
33%
14%
18%
27%
34%
35%
$0 $5,000,000 $10,000,000 $15,000,000 $20,000,000 $25,000,000
Cereals (HS 10)
Fats and oils, animal and vegetable (HS 15)
Sugars and sugar confectionery (HS 17)
Dairy products (HS 4)
Meat (HS 2)
Fish (HS 3)
Residues and waste from food industries;…
Preparations of cereals, flour, milk (HS 19)
Miscellaneous edible preparations (HS 21)
Beverages, spirits (HS 22)
Tobacco (HS 24)
1000 US $
Africa's top agricultural imports (1000 USD, avg. 2015-17), and % intra-regional
Intra-regional Rest of World
ARC/20/INF/10 9
15. The analyses above have demonstrated that there is significant scope for intra-trade in the key
food groups among African countries, notably cereals, meats, dairy products, fats and oils (animal
or vegetable) and sugar and sugar products. Tariffs and, more importantly, non-tariff bottlenecks
are currently limiting intra-regional trade integration. The experience of the RECs suggests that
reducing tariffs alone is not sufficient to boost intraregional trade. Poor trade logistics and, to a
lesser extent, infrastructure are major obstacles to further trade integration in the region. These
bottlenecks are particularly important for landlocked and low-income countries5.
IV. Addressing the Challenges and Constraints to Intra-African trade in the
Context of the AfCFTA
A. Trade and Food Security
16. The food and nutrition security situation in Africa remains a major concern. Sub-Saharan Africa
now stands out as the only region of the world where the number of the extreme poor increased,
from 276 million in 1990 to 413 million in 2015. The links between trade and food security and
nutrition are inherently complex, with several channels of interaction simultaneously affecting
the different dimensions of food security: availability, access, utilization and stability. Trade
affects a number of economic and social variables such as market structures, infrastructure
development, the productivity and composition of agricultural output, the variety, quality and
safety of food products, and the composition of diets. Changes in these variables under the
AfCFTA can affect, to different degrees, all four dimensions of food security, in the short,
medium and long term.
17. A number of underlying factors affect the way in which trade interacts with food security
outcomes, ultimately determining the nature of the impact, especially in terms of food prices.
These factors include the functioning of domestic food markets; the ability of producers to
respond to changing incentives; and the participation of smallholders in markets. Trade policy
interventions need to take into consideration the various underlying factors that influence the
linkages between trade and food security. The complexity of the channels of interaction between
trade and food security could result in a wide range of different impacts and country experiences,
making the overall impact largely context-specific. This complexity needs to be taken into
consideration in the context of the AfCFTA.
18. Trade policies are only one of the many categories of policies that can affect the flow of trade,
markets and food security. Producer- and consumer-oriented measures can be equally important
because of their direct effects on national production levels, and the indirect effects that changes
in national production can have on trade flows and global markets. Price policies (that introduce
a gap between domestic prices of inputs and outputs and those that would prevail in the absence
of such measures) can be particularly important, but as they can be designed and implemented in
different ways, can have quite different impacts and also result in significant fiscal costs.
19. Trade and related policies affect different dimensions of food security and nutrition; the effects
differ across countries, and also evolve over time. There is no single most “appropriate” policy
instrument. The objectives of policy interventions should be paramount in determining the
appropriateness and in informing the design of trade-related policy.
5 IMF, 2019. Regional Economic Outlook, Sub-Saharan Africa, recovery amid elevated uncertainty
10 ARC/20/INF/10
20. Often, debates related to trade and food security focus on the short-term impacts of market shocks,
and the resulting changes in trade flows and prices that consumers and producers face. In the
context of the AfCFTA, it is important to look beyond the possible short-term consequences of
policy interventions when assessing their effectiveness in achieving food security objectives.
Policies need also to address the more transformational aspects of the food and agriculture
systems.
21. FAO continues to provide direct support to African countries for regional and bilateral trade
negotiations, to enable their effective participation in these negotiations, with special focus on the
linkages between agriculture, food security and rural development. As part of this effort, FAO
has facilitated e-learning courses on “Trade, Food Security and Nutrition”, and “Agriculture in
International Trade Agreements” to participants from various subregions, notably in Eastern,
Southern and West Africa.
B. Structural Reform and Regional Value Chains to Strengthen the Impact
of the AfCFTA
22. A key feature of intra-regional exports in Africa is that they are more diversified than Africa’s
exports to the rest of the world, as countries with more diversified economies tend to trade
relatively more within region. This observation is also made with regard to intra-REC trade.
Therefore, for agriculture-based and less diversified countries to reap the benefits of trade
integration, trade policies should be aligned with other sectoral policies, such as agriculture and
industry that could boost agricultural productivity to better leverage existing comparative
advantage. Moreover, there is a need to develop and link farmers to regional and global value
chains.
23. In many African countries, agriculture and trade-related objectives and strategies are identified
through separate prioritization, negotiation and coordination processes, associated with
agriculture and trade ministries respectively. This situation often results in different perceptions
of the national priorities for agricultural trade, which can lead to gaps in the country’s capacity to
design and implement appropriate trade strategies and policies supportive of agriculture sector
development and associated food security improvements. Moreover, by articulating incoherent or
even conflicting priorities, the “sectoral divide” also contributes to inefficient allocation of
resources.
24. FAO has developed an approach for improving coherence between agriculture and trade policies
and institutional mechanisms at the country level. This approach was already piloted in a number
of African countries including Mozambique, Rwanda, the United Republic of Tanzania, and
Zambia.
C. Reduction and Elimination of Tariffs
25. Average applied tariffs in Sub-Saharan Africa are already relatively low. The effectively applied
tariff weighted average (customs duty) for Sub-Saharan Africa is 5.67 percent while the most
favoured nation (MFN) weighted average tariff is 7.85 percent. AfCFTA Member States have
undertaken commitments to liberalize substantially all trade by eliminating tariffs on 90 percent
of goods. The remaining 10 percent is divided between sensitive products (7 percent) and the
ARC/20/INF/10 11
exclusion list, namely products on which no reduction in tariffs would be proposed (3 percent).
The time frame for implementation for non-sensitive products is five years for developing
countries and ten years for the least developed countries, while for sensitive products it is ten and
13 years respectively. Trade within RECs will continue according to the trading regimes they
have in place and new tariff liberalization under AfCFTA will only occur among Member States
that do not have an existing agreement with one another.
D. Reduction and Elimination of Non-tariff Barriers
26. As mentioned above, the reduction of NTBs and the harmonization of complementary policies
that facilitate trade are critical to boost intra-African trade. Although there is political will at the
highest level, implementation hurdles remain adding costs to crossing borders in Africa. Domestic
transportation costs are also high, accounting for between 50–60 percent of marketing costs in the
region while roadblocks very often add to the cost of transport.
27. Specific to agriculture, SPS measures, have become relatively more important compared to tariffs.
SPS measures have the legitimate and critical function to protect public health and animal and
plant life and health. However, weak capacities to comply with SPS requirements can result in a
country’s exclusion from key markets, and poorly applied procedures can increase the cost of
trade. Estimates show that SPS measures raise domestic food prices by about 13 percent in Sub-
Saharan Africa.
28. Promoting intra-regional trade will require reduction of such barriers to trade, which today often
push traders towards using informal channels, thus avoiding compliance with SPS measures
entirely and defeating the intended purpose of the SPS measures.
29. Governments can facilitate cross-border trade by investing in physical infrastructure, simplifying
procedures, harmonizing standards, streamlining licensing procedures and certificates of origin
requirements, improving market information and finance, and improving professionalism of
customs officers.
30. FAO has been developing the capacity of African countries and RECs on SPS measures, including
strengthening capacity and reinforcing collaboration and partnership between the focal points of
the FAO/WHO Codex Alimentarius Commission, the International Plant Protection Convention
(IPPC) and the World Organisation for Animal Health (OIE) in member countries. FAO is also
supporting countries to mainstream SPS measures into national food control systems.
E. Rules of Origin (ROO)
31. The AfCFTA contains provisions for the application of ROO in the protocol on trade in goods to
distinguish imported goods qualifying for preferential treatment from goods that do not. Due to
differing levels of economic development, member countries have agreed on a hybrid approach
to the ROO that includes a general rule, such as a requirement for 40 percent local content,
together with number of product-specific rules that address the specific concerns of the states.
Bigger economies with larger industries push for product-specific rules to prevent countries from
importing goods from outside Africa and making cosmetic changes before re-exporting them as
goods that qualify for preferential treatment, while smaller countries lack appropriate risk
management systems and the administrative capacity to enforce product-specific rules and can
therefore revert to the simpler 40 percent rule of the hybrid approach.
12 ARC/20/INF/10
32. Additionally, the agreement includes a trade remedy regime or trade defence measures to address
unfair trade practices by one country on another country. Trade remedies include anti-dumping
measures to offset dumping, countervailing measures to counter illegal subsidies and safeguard
measures to defend against import surges, particularly if they aggravate balance of payments
problems. A dispute settlement mechanism will also be in place to handle trade disputes. Again,
the main issues with regard to the rules of origin and trade remedies are the low capacity of
countries to handle complaints and enforce rules against corruption, smuggling, counterfeiting,
dumping and other unfair trade practices.
F. Market Information Systems and Reliable Statistics on Trade
33. Owing to Africa’s weak market infrastructure, regional markets are often localized with weak
transmission of prices between markets and hence sharp fluctuations in prices. Thus, acute food
shortages in one subregion can coincide with surpluses elsewhere, within the country or region.
One response to addressing such market information problems has been the setting-up of Market
Information Systems. While they are operational in many African countries, they continue to
suffer from lack of knowledge about them, inconsistency in the information provided and the
general low access by poor farmers and other value chain actors who lack the necessary network
connectivity.
34. As the process of trade integration accelerates in Africa, reliable trade statistics will become
essential for the formulation of appropriate policies and for addressing hindrances to trade. In
recognition of the need for information resources, the AU is establishing the African Trade
Observatory (ATO) as a key component of the implementation of the AfCFTA. FAO is supporting
the operationalization of the ATO in the agricultural and food sector.
V. Conclusion
35. The growth of intra-African trade has gradually increased over the last decade as regional
integration progressively deepens. However, there are still many challenges and trade barriers
standing in the way of the African single market including policy inconsistencies, NTBs and
underinvestment in productive capacity, especially regional value chains and market information
systems.
36. To enhance intra-African trade, countries need to pursue change on several fronts including
improving physical infrastructure and trade logistics and creating opportunities for market access.
The focus should be on tackling supply-side constraints and responding to shifting regional and
global demand. Concerted efforts are needed to simplify the rules of origin, reduce NTBs,
especially SPSs and the roadblocks and checkpoints that impede cross-border trade and address
red tape at the borders.
37. Aid-for-Trade (A4T) should be increased and targeted to help Africa reduce trade bottlenecks
(including regional ones). A4T in the form of technical assistance, project finance, and adjustment
support for trade reforms will allow African countries to respond swiftly to the opportunities
created by trade reforms in the framework of the AfCFTA.
ARC/20/INF/10 13
38. FAO will continue to support implementation of the AfCFTA in the agricultural and food sector,
notably by ensuring that the agreement contributes to food security and nutrition objectives. This
includes strengthening of the capacities of member countries in trade policy analysis and
participation in trade negotiation, strengthening market information and analysis to guide the
implementation of appropriate trade and market policies and facilitating the work of standard-
setting bodies for food safety and plant health. FAO will also continue to work with member
countries to enhance policies, institutions and support services that enable the development of
regional agro-industry and agrifood chains. FAO’s ongoing support to the AUC to develop the
Continental Framework for Boosting Intra-African Trade in Agricultural Commodities and
Services is an integral component. FAO is also supporting the plan of action of the African Union
Continental Strategy for Geographical Indications6 approved by member states in 2017 and which
foster inter-regional trade for traditional food products with quality linked to their geographical
origin. It aims to develop a multi-sectoral implementation strategy that responds to new market
opportunities in Africa created by the establishment of the AfCFTA. The objective is to create an
enabling environment through appropriate policies, governance systems and institutional
arrangements to respond to the challenges of intra-African trade in agricultural commodities and
services.
Annex: Trends in Intra-regional Trade by Commodity Groups
Agricultural exports
39. Africa’s agricultural exports are mostly concentrated in cash crops. That being said, on average
in 2015-17, Africa was a net exporter of four key food product groups as well: fruits and nuts;
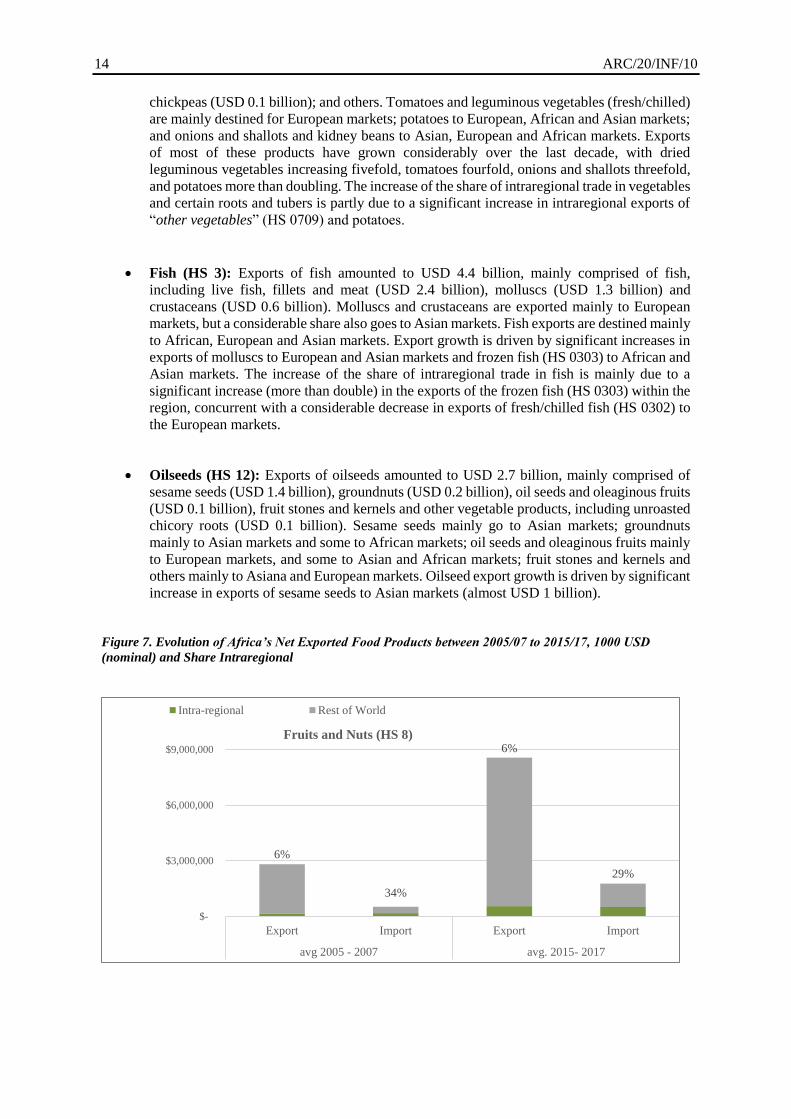
vegetables and certain roots and tubers; fish; and oilseeds (Figure 7).
Fruits and Nuts (HS 8): Exports of fruits and nuts amounted to USD 8.5 billion, mainly
comprised of cashew nuts in shell (USD 2.2 billion), oranges (USD 1.4 billion), grapes
(USD 0.8 billion), dates (USD 0.3 billion), avocados (USD 0.2 billion), mangoes
(USD 0.2 billion), and berries, other nuts, bananas, applies, melons and others making up the
remainder. Cashew nuts are mainly destined for Asian markets, while Europe is a key
destination of most other fruits7.. The overall growth is driven in part by a significant increase
in exports of cashew nuts to Asian markets and a doubling of exports of other products. The
increase of the share of intraregional trade in fruits and nuts is mainly due to a greater increase
in intraregional exports of dates, mangoes, apples and bananas.
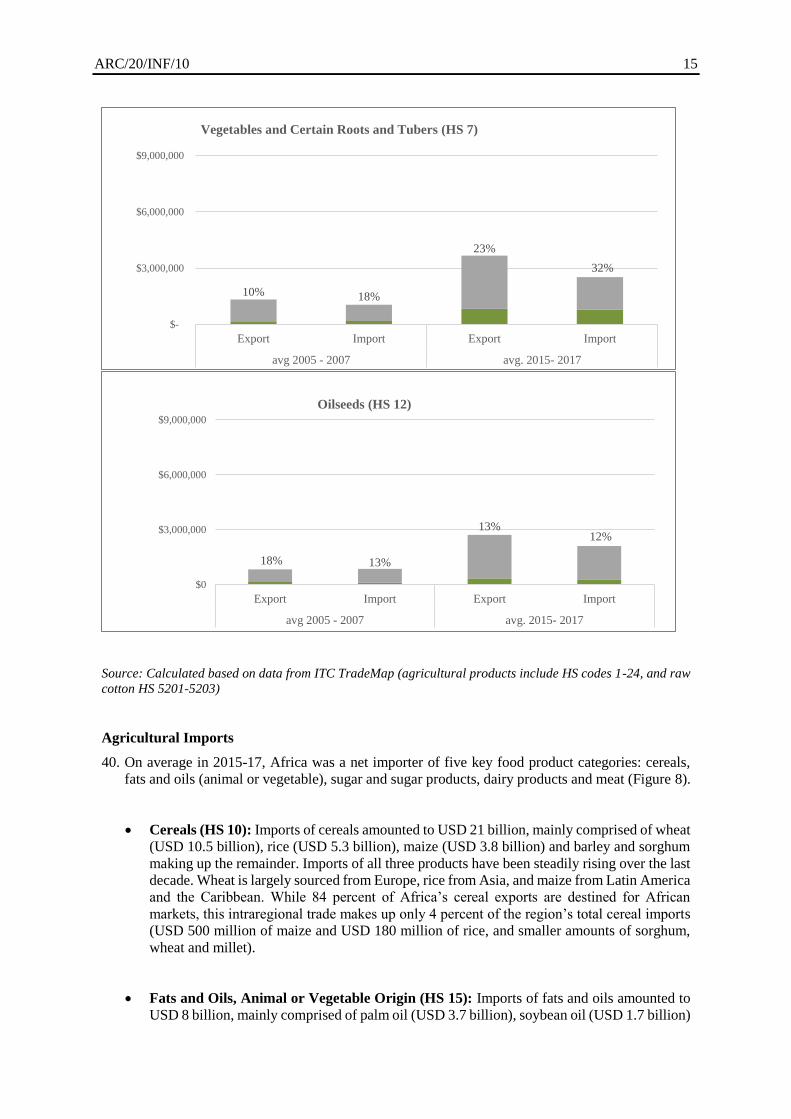
Vegetables and Certain Roots and Tubers (HS 7): Exports of vegetables and certain roots
and tubers amounted to USD 3.7 billion, comprised of a diverse set of products, including
tomatoes (USD 0.6 billion); leguminous vegetables (USD 0.3 billion); potatoes
(USD 0.3 billion); onions and shallots (USD 0.3 billion); kidney beans (USD 0.2 billion);
6 See AU Continental Strategy for GI in Africa : https://au.int/sites/default/files/documents/36127-
doc-au_gis_continental_strategy_enng_with-cover-1.pdf 7 Ghana reported a significant increase in exports of cashew nuts to India in 2011, with fluctuating or missing
values since then, which affects the export values.
14 ARC/20/INF/10
chickpeas (USD 0.1 billion); and others. Tomatoes and leguminous vegetables (fresh/chilled)
are mainly destined for European markets; potatoes to European, African and Asian markets;
and onions and shallots and kidney beans to Asian, European and African markets. Exports
of most of these products have grown considerably over the last decade, with dried
leguminous vegetables increasing fivefold, tomatoes fourfold, onions and shallots threefold,
and potatoes more than doubling. The increase of the share of intraregional trade in vegetables
and certain roots and tubers is partly due to a significant increase in intraregional exports of
“other vegetables” (HS 0709) and potatoes.
Fish (HS 3): Exports of fish amounted to USD 4.4 billion, mainly comprised of fish,
including live fish, fillets and meat (USD 2.4 billion), molluscs (USD 1.3 billion) and
crustaceans (USD 0.6 billion). Molluscs and crustaceans are exported mainly to European
markets, but a considerable share also goes to Asian markets. Fish exports are destined mainly
to African, European and Asian markets. Export growth is driven by significant increases in
exports of molluscs to European and Asian markets and frozen fish (HS 0303) to African and
Asian markets. The increase of the share of intraregional trade in fish is mainly due to a
significant increase (more than double) in the exports of the frozen fish (HS 0303) within the
region, concurrent with a considerable decrease in exports of fresh/chilled fish (HS 0302) to
the European markets.
Oilseeds (HS 12): Exports of oilseeds amounted to USD 2.7 billion, mainly comprised of
sesame seeds (USD 1.4 billion), groundnuts (USD 0.2 billion), oil seeds and oleaginous fruits
(USD 0.1 billion), fruit stones and kernels and other vegetable products, including unroasted
chicory roots (USD 0.1 billion). Sesame seeds mainly go to Asian markets; groundnuts
mainly to Asian markets and some to African markets; oil seeds and oleaginous fruits mainly
to European markets, and some to Asian and African markets; fruit stones and kernels and
others mainly to Asiana and European markets. Oilseed export growth is driven by significant
increase in exports of sesame seeds to Asian markets (almost USD 1 billion).
Figure 7. Evolution of Africa’s Net Exported Food Products between 2005/07 to 2015/17, 1000 USD
(nominal) and Share Intraregional
6%
34%
6%
29%
$-
$3,000,000
$6,000,000
$9,000,000
Export Import Export Import
avg 2005 - 2007 avg. 2015- 2017
Fruits and Nuts (HS 8)
Intra-regional Rest of World
ARC/20/INF/10 15
Source: Calculated based on data from ITC TradeMap (agricultural products include HS codes 1-24, and raw
cotton HS 5201-5203)
Agricultural Imports
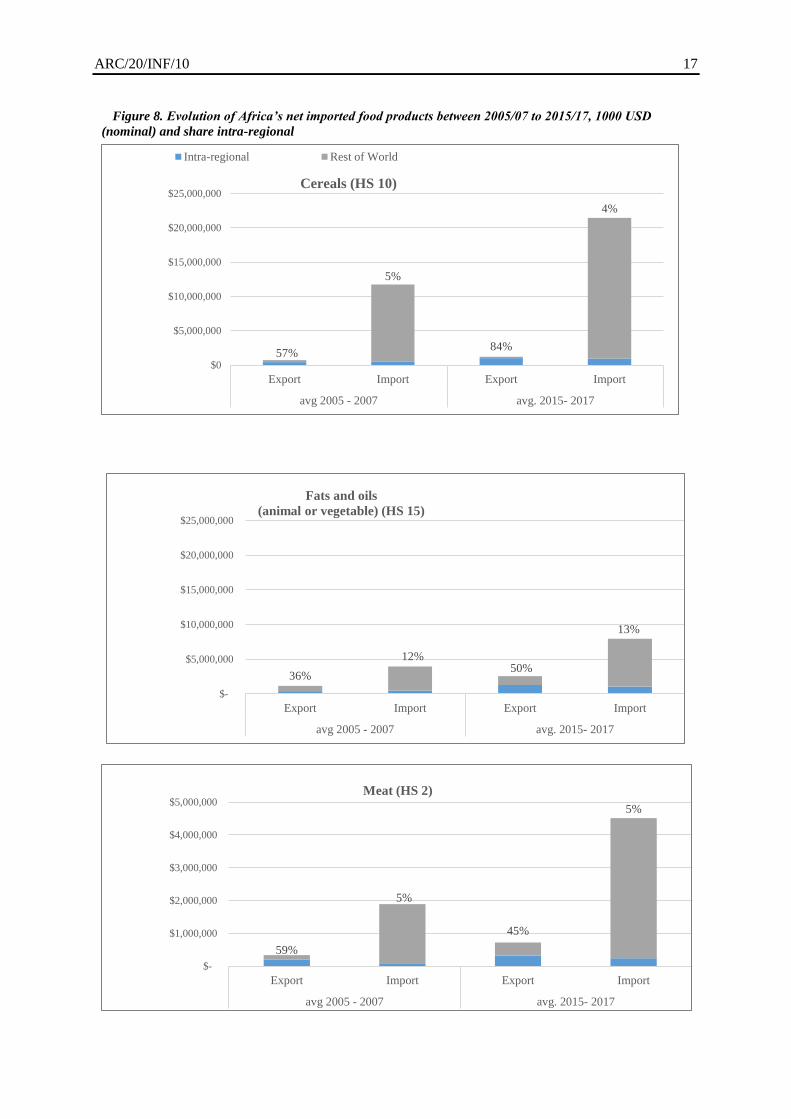
40. On average in 2015-17, Africa was a net importer of five key food product categories: cereals,
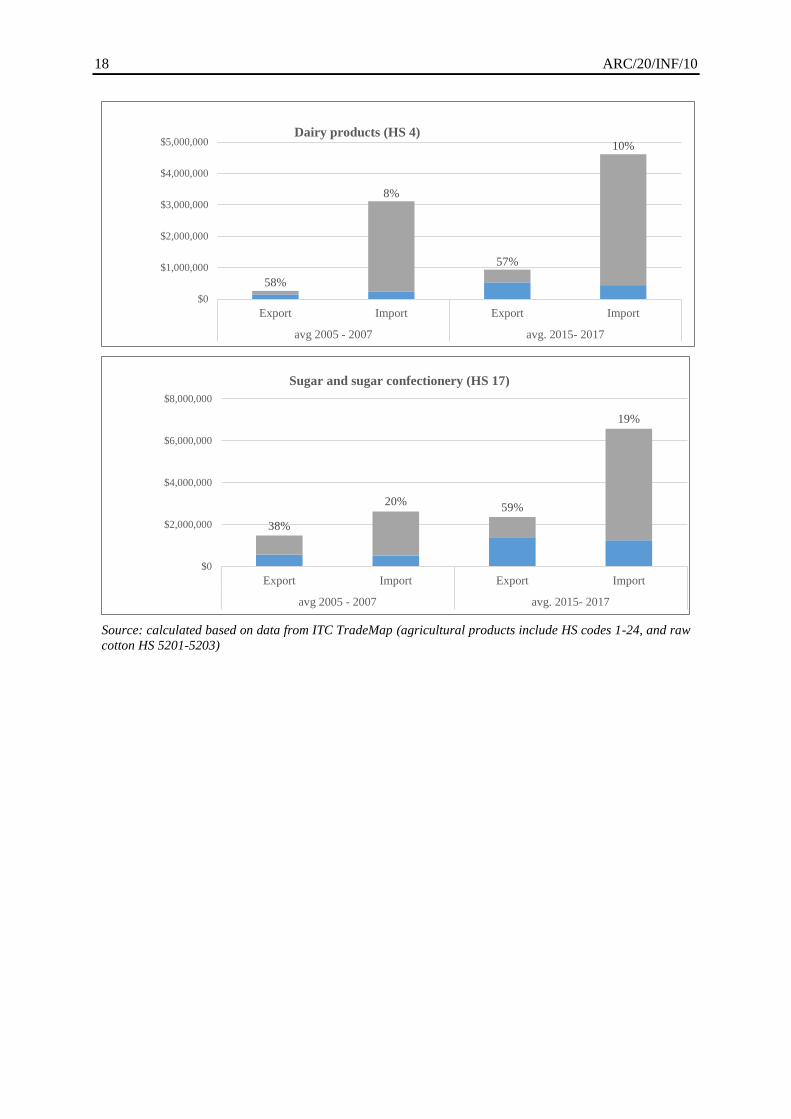
fats and oils (animal or vegetable), sugar and sugar products, dairy products and meat (Figure 8).
Cereals (HS 10): Imports of cereals amounted to USD 21 billion, mainly comprised of wheat
(USD 10.5 billion), rice (USD 5.3 billion), maize (USD 3.8 billion) and barley and sorghum
making up the remainder. Imports of all three products have been steadily rising over the last
decade. Wheat is largely sourced from Europe, rice from Asia, and maize from Latin America
and the Caribbean. While 84 percent of Africa’s cereal exports are destined for African
markets, this intraregional trade makes up only 4 percent of the region’s total cereal imports
(USD 500 million of maize and USD 180 million of rice, and smaller amounts of sorghum,
wheat and millet).
Fats and Oils, Animal or Vegetable Origin (HS 15): Imports of fats and oils amounted to
USD 8 billion, mainly comprised of palm oil (USD 3.7 billion), soybean oil (USD 1.7 billion)
10% 18%
23%
32%
$-
$3,000,000
$6,000,000
$9,000,000
Export Import Export Import
avg 2005 - 2007 avg. 2015- 2017
Vegetables and Certain Roots and Tubers (HS 7)
18% 13%
13%12%
$0
$3,000,000
$6,000,000
$9,000,000
Export Import Export Import
avg 2005 - 2007 avg. 2015- 2017
Oilseeds (HS 12)
16 ARC/20/INF/10
and sunflower- safflower- or cotton-seed oil (USD 0.7 billion). Palm oil imports have roughly
doubled over the last decade, with a steady growth in imports of soybean and sunflower-seed
oils. Palm oil is largely sourced from Asia and sunflower-seed oil from Europe, whereas the
sources of soybean oil are more diverse (Europe, Latin America and the Caribbean).
Approximately 50 percent of Africa’s exports of vegetable oils are destined for African
markets, but this makes up only 13 percent of the region’s imports of the product
(USD 400 million of palm oil, USD 200 million of soybean oil, and USD 100 million of
sunflower oil).
Meat (HS 2): Imports of meat products amounted to USD 4.5 billion, mainly comprising of
poultry (USD 1.7 billion) and beef (USD 1.5 billion). Imports of both poultry and beef have
nearly doubled in the last decade. Latin America and the Caribbean is an important source of
meat products, making up over half of Africa’s beef imports, and a third of its poultry imports.
Europe is another important source of poultry products, making up another third of Africa’s
imports. While 45 percent of Africa’s exports of meat products are destined for African
markets, intraregional imports make up only 5 percent of total meat imports in Africa (in
other words, 95 percent of Africa’s total meat imports come from outside the continent).
Dairy products (HS 4): Imports of dairy products amounted to USD 4.6 billion, mainly
comprising of milk and cream (USD 3 billion), cheese and curd (USD 600 million) and butter
(USD 400 million), with whey, buttermilk and eggs making up the remainder. Imports of
milk and cream have remained largely stable over the last decade, while those of cheese and
curd and butter have roughly doubled. Europe is a key source of these imports, making up
approximately half of Africa’s imports of milk and cream, a third for cheese and curd, and a
quarter for butter. While 57 percent of Africa’s exports of dairy products are destined for
African markets, they nevertheless make up only 10 percent of Africa’s total dairy imports
(USD 0.2 billion of milk and cream, USD 0.1 billion of cheese and curd).
Sugar and sugar products (HS 17): Imports of sugar and sugar confectionery amounted to
USD 6.6 billion, comprising mainly of cane or beet sugar (USD 4.8 billion). Africa’s sugar
imports have approximately doubled over the last decade. Most of this is sourced from Latin
America and the Caribbean, although countries within Africa are also an important source,
comprising 19 percent of total sugar imports.
ARC/20/INF/10 17
Figure 8. Evolution of Africa’s net imported food products between 2005/07 to 2015/17, 1000 USD
(nominal) and share intra-regional
36%
12%50%
13%
$-
$5,000,000
$10,000,000
$15,000,000
$20,000,000
$25,000,000
Export Import Export Import
avg 2005 - 2007 avg. 2015- 2017
Fats and oils
(animal or vegetable) (HS 15)
59%
5%
45%
5%
$-
$1,000,000
$2,000,000
$3,000,000
$4,000,000
$5,000,000
Export Import Export Import
avg 2005 - 2007 avg. 2015- 2017
Meat (HS 2)
57%
5%
84%
4%
$0
$5,000,000
$10,000,000
$15,000,000
$20,000,000
$25,000,000
Export Import Export Import
avg 2005 - 2007 avg. 2015- 2017
Cereals (HS 10)
Intra-regional Rest of World
18 ARC/20/INF/10
Source: calculated based on data from ITC TradeMap (agricultural products include HS codes 1-24, and raw
cotton HS 5201-5203)
58%
8%
57%
10%
$0
$1,000,000
$2,000,000
$3,000,000
$4,000,000
$5,000,000
Export Import Export Import
avg 2005 - 2007 avg. 2015- 2017
Dairy products (HS 4)
38%
20%59%
19%
$0
$2,000,000
$4,000,000
$6,000,000
$8,000,000
Export Import Export Import
avg 2005 - 2007 avg. 2015- 2017
Sugar and sugar confectionery (HS 17)


![FAO Presentation 19 July.ppt [Read-Only]httpAssets)/1DF81CFC0F663… · FAO Headquarters in Rome 187 members plus European Union Decentralised FAO Five Regional Offices for Africa,](https://img.pdfslide.net/doc/110x75/5b6e2c4e7f8b9a3b388deac2/fao-presentation-19-julyppt-read-only-httpassets1df81cfc0f663-fao-headquarters.jpg)