Embed Size (px)
Citation preview

FAO Statistics Working Paper Series
Issue 21/25
THE RELATIONSHIP BETWEEN FOOD INSECURITY AND DIETARY
OUTCOMES
AN ANALYSIS CONDUCTED WITH NATIONALLY REPRESENTATIVE DATA FROM
KENYA, MEXICO, SAMOA, AND THE SUDAN

FAO Statistics Working Paper Series / 21-25
THE RELATIONSHIP BETWEEN FOOD INSECURITY AND DIETARY
OUTCOMES
AN ANALYSIS CONDUCTED WITH NATIONALLY REPRESENTATIVE DATA
FROM KENYA, MEXICO, SAMOA, AND THE SUDAN
Cristina Alvarez-Sanchez, Ana Moltedo, Nathalie Troubat, Talent Manyani, Firas Yassin,
Anne Kepple and Carlo Cafiero
Food and Agriculture Organization of the United Nations
Rome, 2021
Required citation: Alvarez-Sanchez, C., Moltedo, A., Troubat, N., Manyani, T., Yassin, F., Kepple, A.
and Cafiero, C. 2021. The relationship between food insecurity and dietary outcomes – An analysis
conducted with nationally representative data from Kenya, Mexico, Samoa, and the Sudan. FAO
Statistics Working Paper 21-25. Rome, FAO. https://doi.org/10.4060/cb6217en
The designations employed and the presentation of material in this information product do not imply the expression of any opinion
whatsoever on the part of the Food and Agriculture Organization of the United Nations (FAO) concerning the legal or development
status of any country, territory, city or area or of its authorities, or concerning the delimitation of its frontiers or boundaries. The
mention of specific companies or products of manufacturers, whether or not these have been patented, does not imply that these
have been endorsed or recommended by FAO in preference to others of a similar nature that are not mentioned.
The views expressed in this information product are those of the author(s) and do not necessarily reflect the views or policies of
FAO.
ISBN 978-92-5-134819-2
© FAO, 2021
Some rights reserved. This work is made available under the Creative Commons Attribution-NonCommercial-ShareAlike 3.0 IGO
licence (CC BY-NC-SA 3.0 IGO; https://creativecommons.org/licenses/by-nc-sa/3.0/igo/legalcode/legalcode).
Under the terms of this licence, this work may be copied, redistributed and adapted for non-commercial purposes, provided that the
work is appropriately cited. In any use of this work, there should be no suggestion that FAO endorses any specific organization,
products or services. The use of the FAO logo is not permitted. If the work is adapted, then it must be licensed under the same or
equivalent Creative Commons licence. If a translation of this work is created, it must include the following disclaimer along with the
required citation: “This translation was not created by the Food and Agriculture Organization of the United Nations (FAO). FAO is
not responsible for the content or accuracy of this translation. The original [Language] edition shall be the authoritative edition.”
Disputes arising under the licence that cannot be settled amicably will be resolved by mediation and arbitration as described in
Article 8 of the licence except as otherwise provided herein. The applicable mediation rules will be the mediation rules of the World
Intellectual Property Organization http://www.wipo.int/amc/en/mediation/rules and any arbitration will be conducted in accordance
with the Arbitration Rules of the United Nations Commission on International Trade Law (UNCITRAL).
Third-party materials. Users wishing to reuse material from this work that is attributed to a third party, such as tables, figures or
images, are responsible for determining whether permission is needed for that reuse and for obtaining permission from the copyright
holder. The risk of claims resulting from infringement of any third-party-owned component in the work rests solely with the user.
Sales, rights and licensing. FAO information products are available on the FAO website (www.fao.org/publications) and can be
purchased through [email protected]. Requests for commercial use should be submitted via: www.fao.org/contact-
us/licence-request. Queries regarding rights and licensing should be submitted to: [email protected]

iii
Abstract
Households and individuals that experience moderate or severe food insecurity may have poorer diets, in
quantity or in quality, than their food secure counterparts. Much of the evidence highlighting the
associations between food insecurity and diet comes from North America. However, far less research has
been conducted on the association of food insecurity, particularly at the moderate level, and dietary
consumption in low- and middle-income countries. This study expands on previous work by considering
cross-country comparable measures of food insecurity that are calibrated against the global Food
Insecurity Experience Scale (FIES). We use three household consumption and expenditure surveys, two
from lower-middle-income countries (Kenya and the Sudan), and one from an upper-middle-income
country (Samoa); as well as an individual dietary intake survey from Mexico (upper-middle-income
country). The four surveys are nationally representative and include the FIES (Kenya, Samoa and the
Sudan) or a similar experience-based food insecurity measure (Mexico). Estimates of the average usual
consumption of foods from ten food groups, dietary energy, and macronutrients are computed by food
insecurity class. Overall, the analysis reveals that people who experience moderate or severe food
insecurity consume less meat and dairy products (in all four countries) and less fruits and vegetables
(Kenya and the Sudan) than those who are food secure or mildly food insecure. Consumption of cereals,
roots, tubers and plantains, and pulses, seeds and nuts either decreases slightly, remains similar, or
increases, resulting in a higher proportional contribution of these food groups to the total diet.
Consequently, the more food insecure people are, the larger the share of staples in their diet. This holds
true even if food insecure people in Kenya and the Sudan reduce their consumption of staples, because
they reduce consumption of other food groups even more.
Keywords
ELCSA, food insecurity, FIES, Food Insecurity Experience Scale, food consumption, diet quality, Kenya,
Mexico, Samoa, Sudan.

v
Contents
Abstract .............................................................................................................................................. iii
Figures ................................................................................................................................................ vi
Tables ................................................................................................................................................. vi
Acknowledgements ........................................................................................................................... vii
Introduction ......................................................................................................................................... 1
Methods .............................................................................................................................................. 3
Datasets .................................................................................................................................................... 3
Food insecurity data analysis .................................................................................................................... 5
Food consumption data analysis .............................................................................................................. 6
Dietary statistics according to food insecurity class ................................................................................. 8
Analysis with HCES food consumption data ........................................................................................... 10
Analysis with individual-level dietary intake data .................................................................................. 10
Results ............................................................................................................................................... 11
Discussion .......................................................................................................................................... 25
Limitations and strengths ....................................................................................................................... 26
Conclusion ......................................................................................................................................... 27
References ......................................................................................................................................... 28
Annex A1: Food Insecurity Experience Scale (FIES) survey module included in the Kenya Integrated
Household Budget Survey, Samoa Household Income and Expenditure Survey, and the Sudan
Consumption Patterns and Nutrition Study ........................................................................................ 31
Annex A2: Latin American and Caribbean Scale (ELCSA) module included in Mexico’s National Health
and Nutrition Survey (ENSANUT) 2012 ............................................................................................... 33
Annex A3: Food group classification used .......................................................................................... 35
vi
Figures
Figure 1. Daily per capita consumption of selected food groups in each food insecurity class. Kenya and the Sudan. ................................................................................................................................................... 12
Figure 2. Daily per capita dietary energy (kcal) at-home (excluding FCAH) and total (including FCAH), by food insecurity class. Kenya and the Sudan. ............................................................................................... 13
Figure 3. Daily per capita carbohydrates (available), fats, protein, and total fibre (grams) by food insecurity class. Kenya and the Sudan. ........................................................................................................................ 15
Figure 4. Proportion of total macronutrients to total dietary energy consumption by food insecurity class. Kenya and the Sudan. ................................................................................................................................. 16
Figure 5. Daily per capita consumption of selected food groups in each food insecurity class. Mexico and Samoa. ........................................................................................................................................................ 19
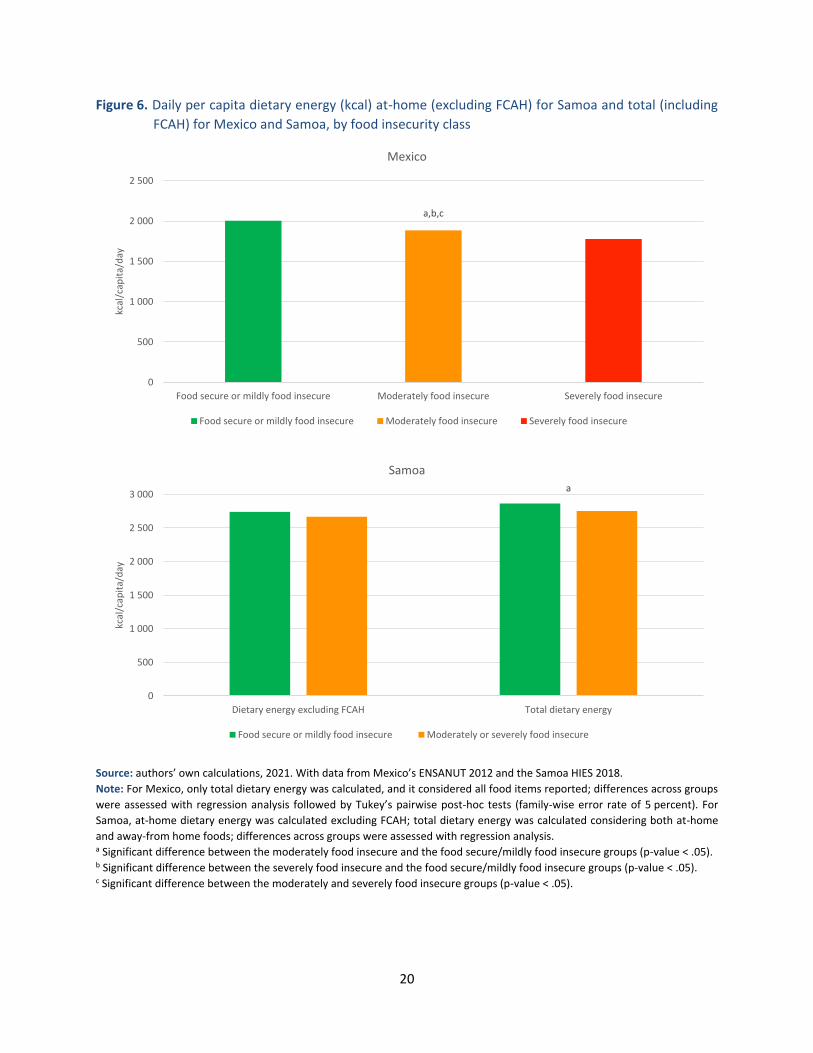
Figure 6. Daily per capita dietary energy (kcal) at-home (excluding FCAH) for Samoa and total (including FCAH) for Mexico and Samoa, by food insecurity class. ............................................................................. 20
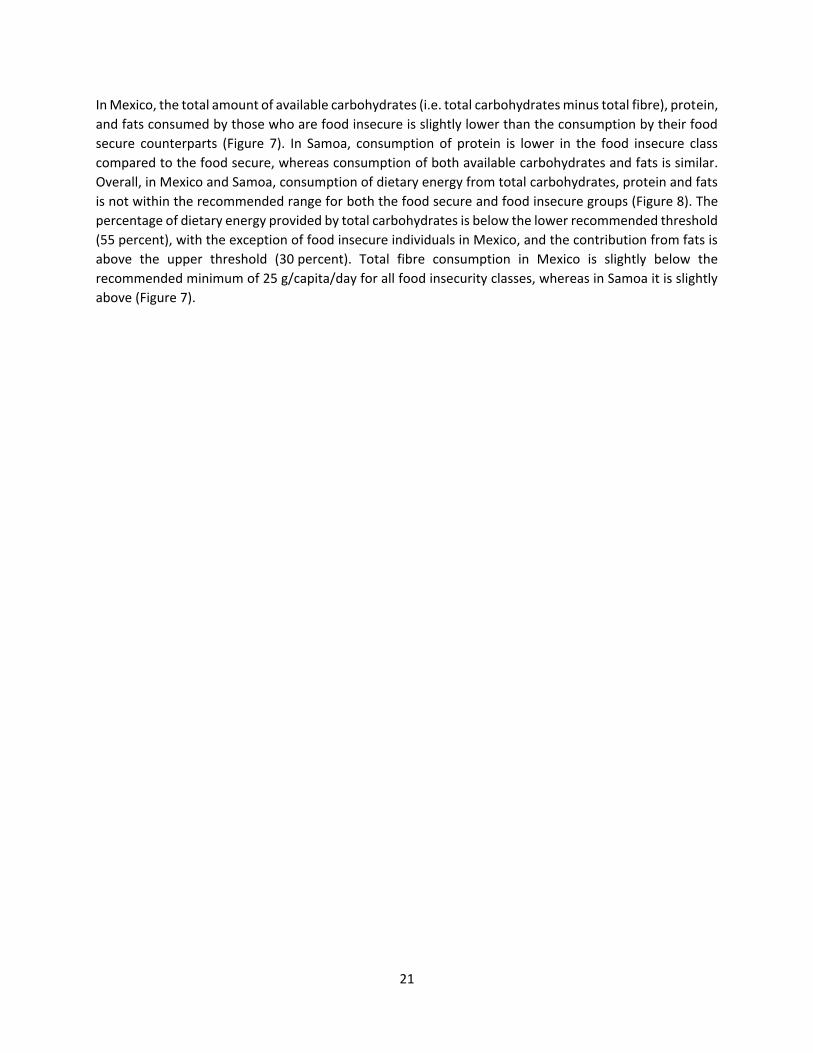
Figure 7. Daily per capita carbohydrates (available), fats, protein, and total fibre (grams) by food insecurity class. Mexico and Samoa. ........................................................................................................................... 22
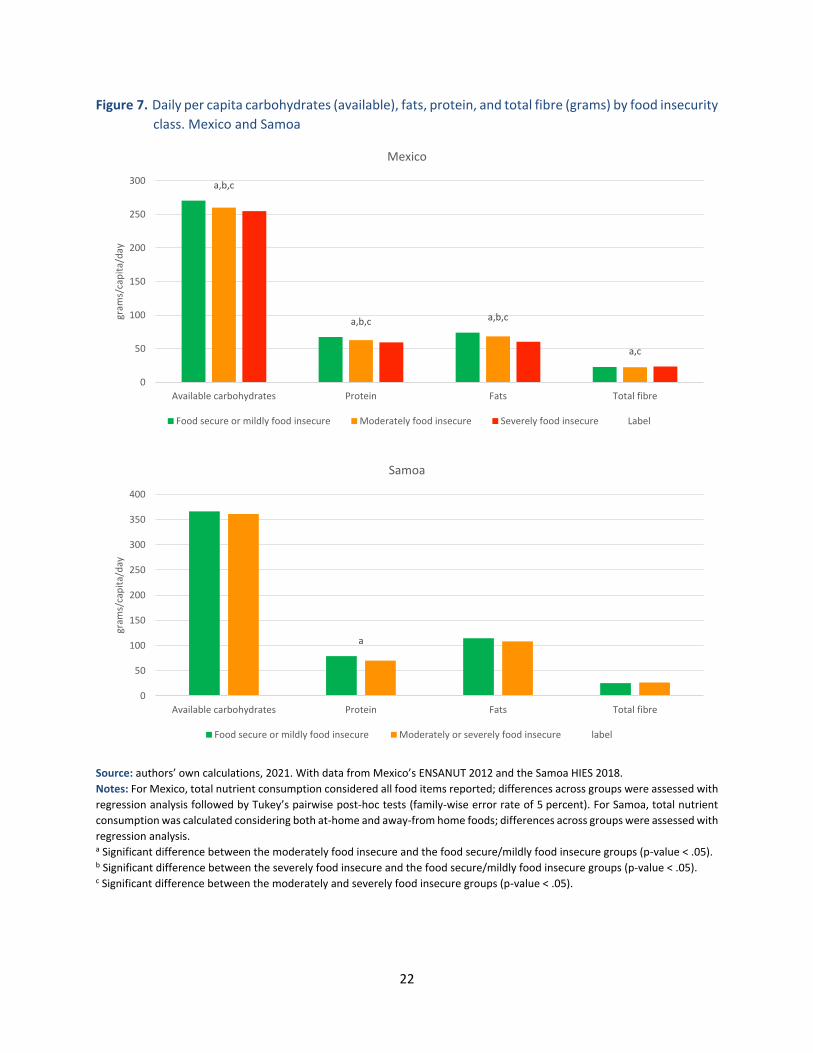
Figure 8. Proportion of total macronutrients to total dietary energy consumption by food insecurity
class. Mexico and Samoa……………………………………………………………………………………………………………………….23
Tables
Table 1. Survey description........................................................................................................................... 4
Table 2. Descriptive statistics of the analytical samples analysed ............................................................... 5
Table 3. Percentage of the survey foods (in total foods matched with FCTs/FCDBs) by Food Composition
Tables/Databases used for the three HCES. ................................................................................................. 7
Table 4. Dietary statistics produced by data source ..................................................................................... 8
Table 5. Percentage of individuals living in households reporting consumption of food groups during the
reference period, by food insecurity class. Kenya and the Sudan. ............................................................. 17
Table 6. Percentage of individuals reporting (Mexico) or living in households reporting (Samoa)
consumption of food groups during the reference period, by food insecurity class. ................................ 24

vii
Acknowledgements
This working paper is authored by Cristina Alvarez-Sanchez, Ana Moltedo, Nathalie Troubat, Talent
Manyani, Firas Yassin, Anne Kepple and Carlo Cafiero. The authors gratefully acknowledge: Dr. Teresa
Shama and her team, from Mexico’s National Public Health Institute, for sharing processed microdata and
for their expert advice; Mr. Josiah Waithaka Kaara and his team, from the Kenya National Bureau of
Statistics, for giving access to the microdata and their expert advice, and the Poverty Analysis Unit at the
Kenya National Bureau of Statistics for their expert advice on county level statistics; Mr. Hamza Abdalla
Siror Osman, from the Food Security Technical Secretariat at the Ministry of Agriculture and Forests of the
Sudan, for sharing microdata and for his expert advice; and Dr. Aliimuamua Maleafono Taua-T. Faasalaina,
Government Statistician at the Samoa Bureau of Statistics, for providing data and staff needed to perform
the analysis for Samoa and Ms. Edith Faaola, Assistant Chief Executive Officer, of the Samoa Bureau of
Statistics, for assisting with the analysis.

1
Introduction
Worldwide, 26.4 percent, or 2 billion people, are food insecure at moderate or severe levels (FAO et al.,
2019). Food insecurity means not having access to enough nutritionally adequate and safe foods on a
continuous basis for an active and healthy life (FAO et al., 2019). Households and individuals that
experience moderate or severe food insecurity may have difficulties in physically accessing enough safe
and nutritious food on a continuous basis if food markets are far or hard to reach, or if food is not available
– particularly nutritious foods. They may also experience economic constrains such that the quality,
diversity or quantity of the food they are able to purchase is compromised. As a consequence, they may
have poorer diets, in quantity or in quality, than their food secure counterparts.
Studies have found that exposure to food insecurity may contribute to micronutrient deficiencies in
children (Mundo-Rosas et al., 2014), anaemia in women of reproductive age, child stunting and adult
obesity (FAO et al., 2019). In high-income countries, the experience of food insecurity has also been
associated with cardiovascular disease, stroke, diabetes, cancer and depression (Gundersen and Ziliak,
2015; Martin et al., 2016; Maynard et al., 2018)
Much of the evidence highlighting the association between food insecurity and diet comes from North
America, where household food insecurity has been routinely monitored for decades (Nord, 2014). A large
number of studies in adults from the United States of America and Canada, using validated experience-
based food insecurity measures,1 have found that, in general, food insecurity leads to the “substitution”
of higher-quality food (such as fruits, vegetables and dairy) with highly processed energy-dense foods that
are cheaper on a per-calorie basis (Hanson and Connor, 2014; Johnson et al., 2018; Leung et al., 2014).
However, in spite of the substitution effect, in those studies total energy consumption did not vary largely
across levels of severity of food insecurity. Studies have also found evidence of lower fruit consumption
in food insecure children compared to food secure children (Hanson and Connor, 2014).
Far less research has been conducted on the association between food insecurity, particularly at the
moderate level, and dietary intake in low- and middle-income countries, with the exception of Mexico2
and Brazil,3 where household food security has also been monitored for a long time. In Mexico, dietary
diversity has been found to be inversely related to the severity of food insecurity in children, adolescents,
and adults (FAO, 2012; Mundo-Rosas et al., 2014; Vega-Macedo et al., 2014). A study by Rodríguez and
colleagues showed that dietary quality (as assessed with the Healthy Eating Index-2010) among Mexican
children and adolescents deteriorated as food insecurity became more severe, compared to their
counterparts living in food secure households (Rodríguez et al., 2017). In particular, food insecure children
and adolescents ate less fruits, protein foods,4 and dairy. Pinheiro de Toledo-Vianna and colleagues (2012)
found that in the Brazilian State of Paraíba, household food insecurity was positively associated with daily
sugar consumption and inversely associated with daily consumption of fruits, vegetables, dairy and bread.
1 Such as the Household Food Security Survey Module (HFSSM) and, to a lesser extent, its predecessor, the Radimel/Cornell questionnaire. 2 Food insecurity was assessed with the Latin American and Caribbean Food Security Scale (ELCSA - Escala Latinoamerica y Caribeña de Seguridad Alimentaria). 3 Food insecurity was assessed with the Brazilian Food Insecurity Scale (EBIA - Escala Brasileira de Insegurança Alimentar). 4 In the Healthy Eating Index, the “total protein foods” includes animal-source foods, nuts, seeds, soy products (other than beverages), and legumes (beans and peas).

2
In Ethiopia, Bangladesh, and Viet Nam, researchers found that the more food insecure households were,5
the less likely children achieved minimum dietary diversity (Ali et al., 2013).
The FAO Statistics Division has been publishing estimates of the prevalence of food insecurity, based on
the FIES, since 2017 (FAO et al., 2019). The FIES is the first standardized measure of people's direct
experiences of food insecurity, appropriate for application on a global scale. The prevalence of moderate
or severe food insecurity based on the FIES is one of the official Sustainable Development Goals indicators
(2.1.2). No studies in the literature examine the nexus between dietary intake and food insecurity based
on the FIES or a similar experience-based food insecurity measure calibrated to the FIES global reference
scale developed by FAO (FAO, 2016).
The objective of this study was to explore the relationship between the severity of food insecurity, as
measured with the FIES (or an analogous experience-based food insecurity scale calibrated to the global
reference scale), and dietary intake using microdata from four middle-income countries from different
world regions: Kenya, Mexico, Samoa and the Sudan.
Household Consumption and Expenditure Surveys (HCES) typically collect information on food acquired
or consumed at the household level. The three HCES used in this analysis (from Kenya, Samoa and the
Sudan) collected information on food consumed at the household level (i.e. apparently consumed). This
is in contrast to the individual dietary intake survey from Mexico that collected information on individuals’
food intake (i.e. food ingested). However, for simplicity, herein, we use the term “consumption” to refer
to both household and individual-level food consumption/intake data. This is different to the use of the
same term by economists in welfare analyses, who refer to “consumption” as food and non-food
expenditures (World Bank, 2019).
Due to differences in survey design, particularly between the three HCES and the individual-level survey,
and between the food consumption modules in the three HCES, the average food/nutrient consumption
statistics, for a given food insecurity class, should be compared with caution. Comparison should be
focused across food insecurity classes within a given country.
5 Food security was assessed with the Household Food Insecurity Access Scale (HFIAS).

3
Methods
Datasets We used microdata from surveys that included both data collected with an experience-based food
insecurity scale and either household or individual food consumption data.
Kenya Integrated Household Budget Survey (KIHBS) 2015/16. This survey was implemented by the Kenya
National Bureau of Statistics. It was conducted over a 12-month period to obtain data on a range of
socioeconomic indicators used to monitor the implementation of national development initiatives. The
survey is representative at the national and county levels, as well as place of residence (rural and urban).
The analytical sample includes 92 825 individuals in 21 756 households.
Mexico National Health and Nutrition Survey (ENSANUT, by its acronym in Spanish) 2012. The ENSANUT
is a survey designed to assess the health and nutritional status of adults and children in Mexico. It is
implemented by the National Institute of Public Health. Food consumption data was collected using two
rounds of 24-hour recalls: in the first round, 13 percent of the individuals surveyed in the ENSANUT were
interviewed; the second round was administered to a subsample of 8 percent of individuals who had
completed the first round. Data collection was performed between October 2011 and May 2012. The
analytical sample consisted of 9 908 individuals one year of age or older. The data are representative at
the national level, urban-rural location, and four geographic regions.
Samoa Household Income and Expenditure Survey (HIES) 2018. This survey was designed to assess the
hardship and incidence of poverty throughout Samoa, obtain expenditure weights to rebase Samoa’s
Consumer Price Index, and to assist in compiling official estimates of household accounts in the system of
National Accounts. It was implemented in four rounds, from March to November, by the Samoa Bureau
of Statistics. The data are representative at the national level, urban-rural location, and four geographic
regions. The analytic sample covers 20 741 individuals in 2 997 households.
The Sudan Consumption Patterns and Nutrition Study (CPNS) 2018. This survey was the third national
household survey implemented in the Sudan covering 18 Sudanese states. It was conducted in 2018 by
the Food Security Technical Secretariat of the Ministry of Agriculture and Forestry between April and May.
The analytical sample includes 114 039 individuals in 16 311 households.
4
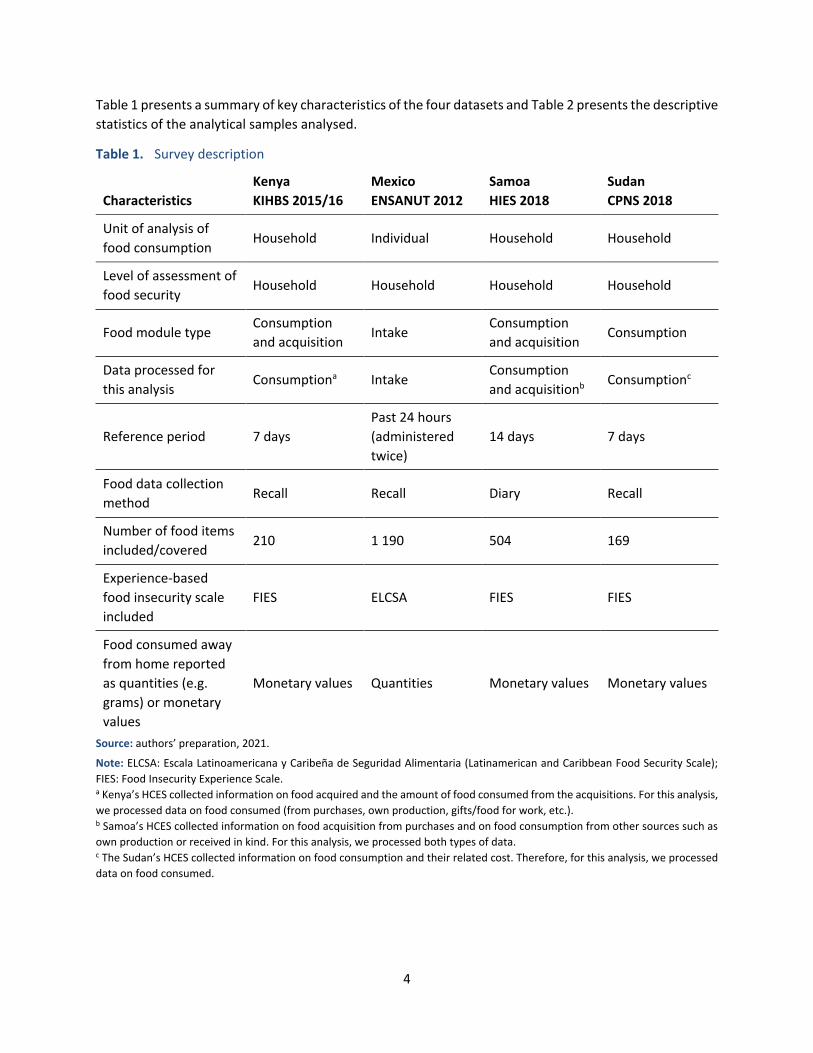
Table 1 presents a summary of key characteristics of the four datasets and Table 2 presents the descriptive
statistics of the analytical samples analysed.
Table 1. Survey description
Characteristics
Kenya
KIHBS 2015/16
Mexico
ENSANUT 2012
Samoa
HIES 2018
Sudan
CPNS 2018
Unit of analysis of
food consumption Household Individual Household Household
Level of assessment of
food security Household Household Household Household
Food module type Consumption
and acquisition Intake
Consumption
and acquisition Consumption
Data processed for
this analysis Consumptiona Intake
Consumption
and acquisitionb Consumptionc
Reference period 7 days
Past 24 hours
(administered
twice)
14 days 7 days
Food data collection
method Recall Recall Diary Recall
Number of food items
included/covered 210 1 190 504 169
Experience-based
food insecurity scale
included
FIES ELCSA FIES FIES
Food consumed away
from home reported
as quantities (e.g.
grams) or monetary
values
Monetary values Quantities Monetary values Monetary values
Source: authors’ preparation, 2021.
Note: ELCSA: Escala Latinoamericana y Caribeña de Seguridad Alimentaria (Latinamerican and Caribbean Food Security Scale);
FIES: Food Insecurity Experience Scale. a Kenya’s HCES collected information on food acquired and the amount of food consumed from the acquisitions. For this analysis,
we processed data on food consumed (from purchases, own production, gifts/food for work, etc.). b Samoa’s HCES collected information on food acquisition from purchases and on food consumption from other sources such as
own production or received in kind. For this analysis, we processed both types of data. c The Sudan’s HCES collected information on food consumption and their related cost. Therefore, for this analysis, we processed
data on food consumed.

5
Table 2. Descriptive statistics of the analytical samples analysed
Kenya
KIHBS 2015/16
Mexico
ENSANUT 2012a
Samoa
HIES 2018
Sudan
CPNS 2018
Sample size households, n 21 756 N/A 2 997 16 311
Sample size individuals, n 92 825 9 908 20 741 114 039
Sex, n (percent)
Male 45 899 (49) 4 792 (48) 10 602 (51) 58 334 (51)
Female 46 926 (51) 5 116 (52) 10 139 (49) 55 705 (49)
Age group, n (percent)
Pre-school children (0–4.9 y) 12 685 (14) 2 066 (21) 2 837 (14) 27 516 (32)
School childrena (5–11.9 y) 19 580 (21) 2 704 (27) 3 687 (18) 23 247 (27)
Adolescents (12–19.9 y) 18 493 (20) 2 021 (20) 3 625 (17) 22 882 (26)
Adults (20 y and over) 42 067 (45) 3 117 (31) 10 592 (51) 40 394 (47)
Source: authors’ own calculations, 2021. With data from the KIHBS 2015, Mexico’s ENSANUT 2012, the Samoa HIES 2018 and the
Sudan CPNS 2018.
Note: N/A: not applicable.
a The ENSANUT 2012 excludes children less than 1 year of age.
Food insecurity data analysis
Analysis of food insecurity data with the Rasch Model
The Rasch model is based on the Item Response Theory, a branch of statistics that permits the
measurement of unobservable traits through analysis of responses to surveys and tests. The Rasch model
provides a theoretical base and a set of statistical tools to assess the suitability of a set of survey questions
(“items”) for constructing a measurement scale and to compare a scale’s performance across different
populations and survey contexts. The analysis involves the following steps (FAO, 2017): (1) Parameter
estimation. Calculation of the severity of food insecurity associated to each survey item and each
respondent.6 (2) Statistical validation. Assessment of the quality of the data collected by testing their
consistency with the assumptions of the Rasch model. This analysis involves the interpretation of several
statistics that reveal: a) items that do not perform well in a given context, b) respondents with highly
erratic response patterns, c) pairs of items that may be redundant, and d) the proportion of total variance
in the population that is accounted for by the measurement model. 3) Calculation of measures of food
insecurity (respondents’ probabilities). For each sampled household (each case in the data), the
probability of the household experiencing food insecurity above a given level of severity was calculated,
based on their responses to the questions.
6 In the four surveys food insecurity was assessed at the household level. Thus, each respondent represents a household.
6
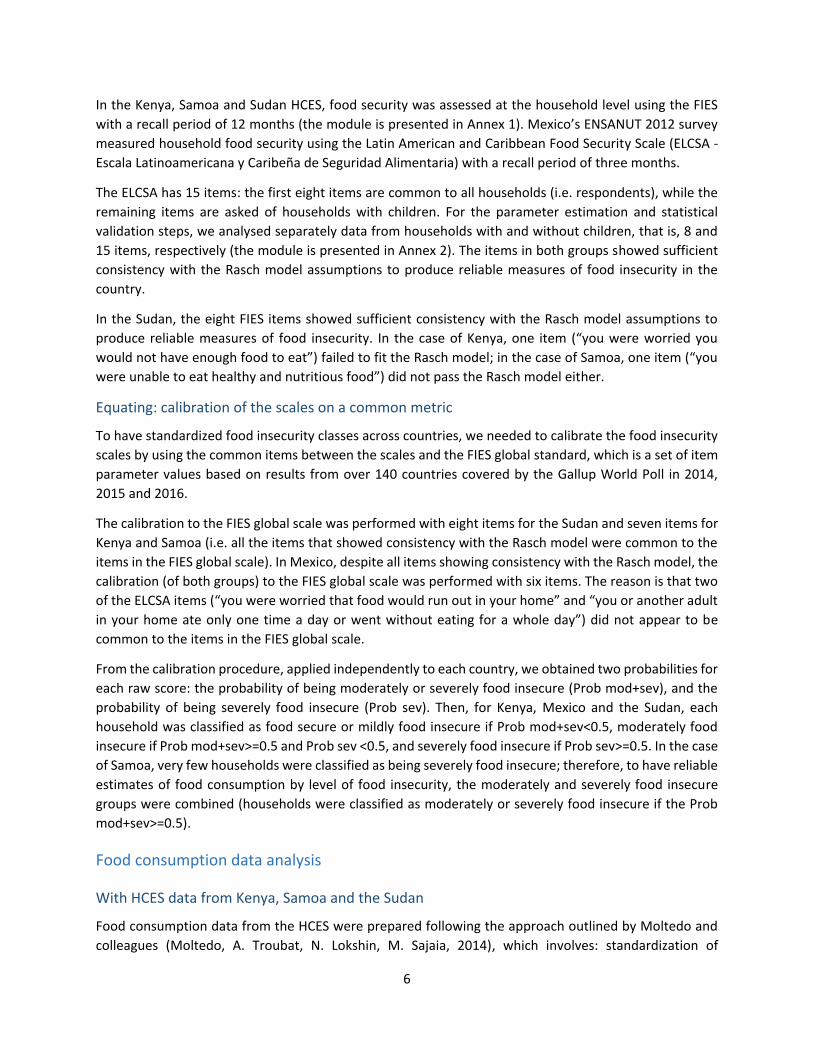
In the Kenya, Samoa and Sudan HCES, food security was assessed at the household level using the FIES
with a recall period of 12 months (the module is presented in Annex 1). Mexico’s ENSANUT 2012 survey
measured household food security using the Latin American and Caribbean Food Security Scale (ELCSA -
Escala Latinoamericana y Caribeña de Seguridad Alimentaria) with a recall period of three months.
The ELCSA has 15 items: the first eight items are common to all households (i.e. respondents), while the
remaining items are asked of households with children. For the parameter estimation and statistical
validation steps, we analysed separately data from households with and without children, that is, 8 and
15 items, respectively (the module is presented in Annex 2). The items in both groups showed sufficient
consistency with the Rasch model assumptions to produce reliable measures of food insecurity in the
country.
In the Sudan, the eight FIES items showed sufficient consistency with the Rasch model assumptions to
produce reliable measures of food insecurity. In the case of Kenya, one item (“you were worried you
would not have enough food to eat”) failed to fit the Rasch model; in the case of Samoa, one item (“you
were unable to eat healthy and nutritious food”) did not pass the Rasch model either.
Equating: calibration of the scales on a common metric
To have standardized food insecurity classes across countries, we needed to calibrate the food insecurity
scales by using the common items between the scales and the FIES global standard, which is a set of item
parameter values based on results from over 140 countries covered by the Gallup World Poll in 2014,
2015 and 2016.
The calibration to the FIES global scale was performed with eight items for the Sudan and seven items for
Kenya and Samoa (i.e. all the items that showed consistency with the Rasch model were common to the
items in the FIES global scale). In Mexico, despite all items showing consistency with the Rasch model, the
calibration (of both groups) to the FIES global scale was performed with six items. The reason is that two
of the ELCSA items (“you were worried that food would run out in your home” and “you or another adult
in your home ate only one time a day or went without eating for a whole day”) did not appear to be
common to the items in the FIES global scale.
From the calibration procedure, applied independently to each country, we obtained two probabilities for
each raw score: the probability of being moderately or severely food insecure (Prob mod+sev), and the
probability of being severely food insecure (Prob sev). Then, for Kenya, Mexico and the Sudan, each
household was classified as food secure or mildly food insecure if Prob mod+sev<0.5, moderately food
insecure if Prob mod+sev>=0.5 and Prob sev <0.5, and severely food insecure if Prob sev>=0.5. In the case
of Samoa, very few households were classified as being severely food insecure; therefore, to have reliable
estimates of food consumption by level of food insecurity, the moderately and severely food insecure
groups were combined (households were classified as moderately or severely food insecure if the Prob
mod+sev>=0.5).
Food consumption data analysis
With HCES data from Kenya, Samoa and the Sudan
Food consumption data from the HCES were prepared following the approach outlined by Moltedo and
colleagues (Moltedo, A. Troubat, N. Lokshin, M. Sajaia, 2014), which involves: standardization of

7
quantities into gram equivalents (when quantities were reported in non-standard units they were
converted into grams using the regional median cost of one gram of product); detection and imputation
of food quantity missing values and outliers; and adjustment of food quantities for non-edible portions.
Food items were matched to available food composition data from several Food Composition Tables (FCT)
and Databases (FCDB) (see Table 3), following FAO and INFOODS food matching guidelines (FAO and
INFOODS, 2012). Matching was conducted considering foods as purchased (i.e. considering, in most cases,
the content of nutrients in the raw form of the food).
Table 3. Percentage of the survey foods (in total foods matched with FCTs/FCDBs) by food composition
tables/databases used for the three HCES
Country Kenya
FCT
United
States of
America
FCDB
West African
FCT
Pacific
Nutrient
Database
Other
FCT/FCDB
Kenya 72 16 5 0 7
Samoa 0 0 0 100 0
Sudan 11 26 62 0 1
Source: authors’ preparation, 2021.
Note: This applies only to foods reported in terms of quantities. Food items with only expenditures attached were not matched
with foods in FCTs/FCDBs. Food Composition Tables and Databases Sources: Kenya (FAO & Government of Kenya, 2018), United
States of America (U.S. Department of Agriculture, 2019), West Africa (FAO, INFOODS, The West African Health Organization and
Bioversity International, 2012), Pacific (Pacific Community, FAO and University of Wollongong, 2020).
Lastly, the at-home and away from home dietary energy and nutrient consumption was estimated. Some
foods consumed away from home (FCAH) only had a monetary value attached (i.e. no quantity), for those
particular food items (2 percent in Kenya, 0.8 percent in Samoa, and 3 percent in the Sudan), the
calculation of amounts of dietary energy and nutrients provided by these foods was performed using
median at-home calorie and nutrient unit values, respectively (Moltedo, Álvarez-Sánchez, Troubat,
Cafiero, et al., 2018). The at-home median values were obtained at the regional income quintile
urban/rural level.
With individual-level data from Mexico
Data on individuals’ food quantities consumed (net edible portions in grams), dietary energy and nutrient
intake derived from the ENSANUT 2012 were prepared at Mexico’s National Public Health Institute and
shared with us. A description of the processing of the dietary data from the ENSANUT 2012 is provided by
López-Olmedo et al. (2016). In contrast to the HCES food consumption data, these data are all based on
quantities (e.g. grams, millilitres) reported.

8
Dietary statistics according to food insecurity class
The dietary statistics produced using each of the data sources are presented in Table 4. All statistics were
produced by food insecurity class.
Table 4. Dietary statistics produced by data source
Dietary statistic
Kenya
KIHBS
2015/16
Mexico
ENSANUT
2012
Samoa
HIES 2018
Sudan
CPNS 2018
Food group consumption
(g/capita/day)a ✓ ✓ ✓ ✓
Percentage of individuals or
individuals living in households with
access to different food groups
✓ ✓ ✓ ✓
Total dietary energy
(kcal/capita/day) consumption ✓b ✓ ✓b ✓b
At-home dietary energy
(kcal/capita/day) consumption ✓ ✓ ✓
Total fats, protein and carbohydrates
(available)c consumption
(g/capita/day)
✓b ✓ ✓b ✓b
Total dietary fibre consumption
(g/capita/day) ✓b ✓ ✓b ✓b
Contribution of total carbohydrates,
fats and protein to dietary energy
(percent)
✓b ✓ ✓b ✓b
Source: authors’ preparation, 2021. a Food group consumption estimates presented for 11 selected food groups. b The energy and nutrient content of FCAH was estimated using at-home median calorie and nutrient, respectively, unit values at
the regional-income quintile-urban/rural level. c Carbohydrates here refers to “available carbohydrates”, calculated as total carbohydrates minus total fibre.
Details about each of the statistics produced are presented below.
Food group consumption
Foods were classified into 19 groups on the basis of their nutritional relevance following the criteria used
in the FAO/WHO Global Individual Food consumption data (GIFT) Tool (FAO and WHO, 2020). Annex A1
presents the food groups and subgroups. For this analysis, we considered 11 out of the 19 groups: cereals
and their products; roots, tubers, plantains and their products; pulses, seeds and nuts and their products;
dairy products; eggs and their products; fish, shellfish and their products; meat and their products;
vegetables and their products; fruits and their products; fats and oils; and sweets and sugars. The average
consumption (g/capita/day) of each food group was estimated for each food insecurity class.
Eight food groups from the GIFT classification were not considered – insects, grubs and their products;
foods for particular nutritional uses; food supplements and similar; food additives; composite dishes;
9
savoury snacks; beverages; and spices and condiments – due to the very low/zero consumption or
negligible contribution to usual energy and nutrient consumption, or because they were not well captured
by HCES.
Percentage of individuals (or individuals living in households) that reported consumption from
different food groups
In the case of the three HCES, we estimated the percentage of individuals living in households that
reported consumption of at least one item from the food group during the reference period. In the case
of Mexico’s individual dietary intake survey, the statistic is based on the number of individuals who
reported consumption of an item, in the food group, during the reference period (previous 24 hours).
Dietary energy consumption
From the at-home consumption
This statistic was only computed from HCES food consumption data. All foods consumed at home were
reported in terms of quantities; therefore, estimates of the at-home dietary energy consumption were
based on the caloric content in foods (calculated using macronutrient values from food composition tables
and databases and applying the Atwater extensive general factor system of coefficients).
Total dietary energy consumption
In the case of the three HCES, the energy provided by FCAH was estimated using median at-home calorie
unit values (see description in section 2.3). This was added to the energy provided by food consumed at
home. In the case of Mexico’s dietary intake survey, the dietary energy contribution from all foods was
calculated from the reported quantities (Lopez-Olmedo et al., 2016).
Carbohydrates, fats, protein, and total fibre consumption
As for total energy, the available carbohydrates (i.e. total carbohydrates - total fibre), fats, protein, and
total fibre consumed away from home were estimated using the corresponding median at-home nutrient
unit value and then added to the at-home nutrient consumption estimate. In the case of Mexico’s dietary
intake survey, the nutrient contribution from all foods was calculated from the reported quantities (Lopez-
Olmedo et al., 2016).
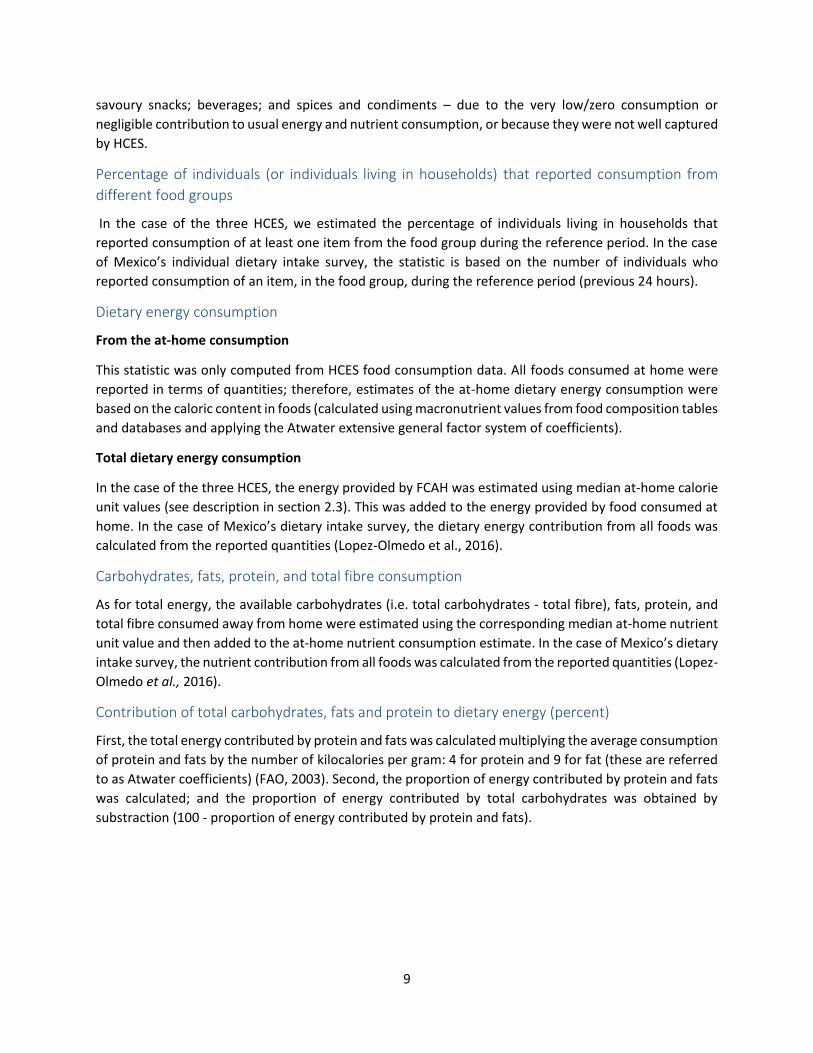
Contribution of total carbohydrates, fats and protein to dietary energy (percent)
First, the total energy contributed by protein and fats was calculated multiplying the average consumption
of protein and fats by the number of kilocalories per gram: 4 for protein and 9 for fat (these are referred
to as Atwater coefficients) (FAO, 2003). Second, the proportion of energy contributed by protein and fats
was calculated; and the proportion of energy contributed by total carbohydrates was obtained by
substraction (100 - proportion of energy contributed by protein and fats).
10
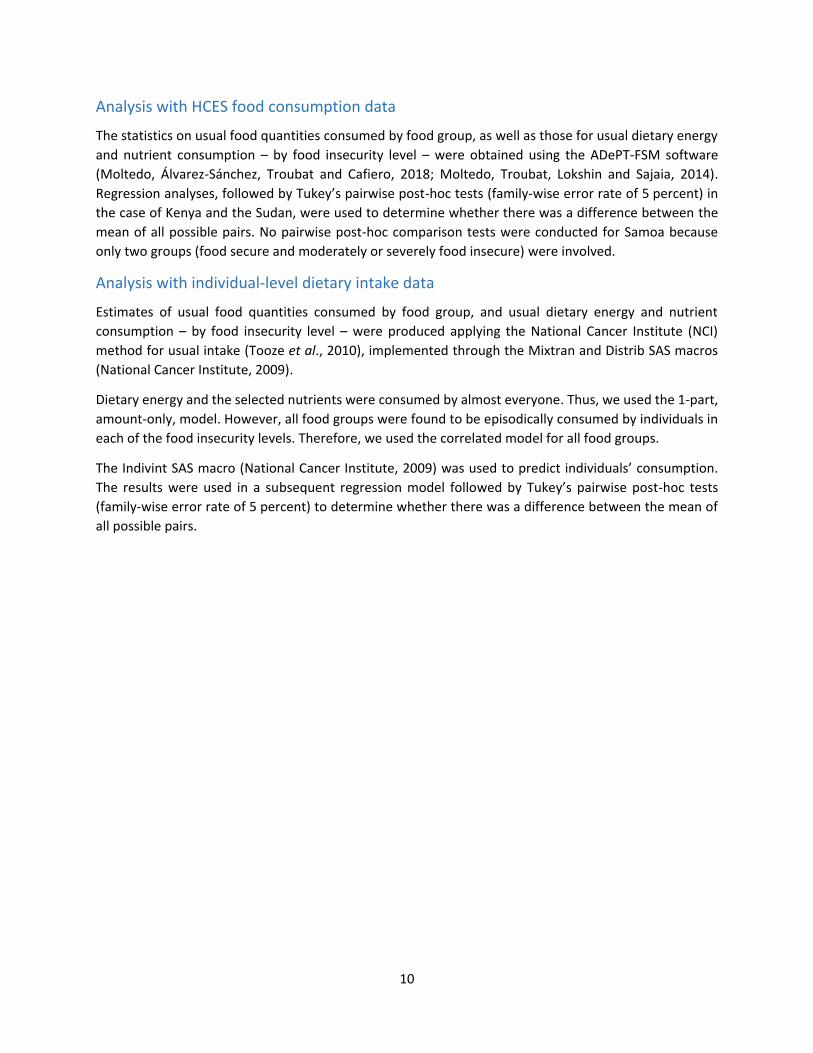
Analysis with HCES food consumption data
The statistics on usual food quantities consumed by food group, as well as those for usual dietary energy
and nutrient consumption – by food insecurity level – were obtained using the ADePT-FSM software
(Moltedo, Álvarez-Sánchez, Troubat and Cafiero, 2018; Moltedo, Troubat, Lokshin and Sajaia, 2014).
Regression analyses, followed by Tukey’s pairwise post-hoc tests (family-wise error rate of 5 percent) in
the case of Kenya and the Sudan, were used to determine whether there was a difference between the
mean of all possible pairs. No pairwise post-hoc comparison tests were conducted for Samoa because
only two groups (food secure and moderately or severely food insecure) were involved.
Analysis with individual-level dietary intake data
Estimates of usual food quantities consumed by food group, and usual dietary energy and nutrient
consumption – by food insecurity level – were produced applying the National Cancer Institute (NCI)
method for usual intake (Tooze et al., 2010), implemented through the Mixtran and Distrib SAS macros
(National Cancer Institute, 2009).
Dietary energy and the selected nutrients were consumed by almost everyone. Thus, we used the 1-part,
amount-only, model. However, all food groups were found to be episodically consumed by individuals in
each of the food insecurity levels. Therefore, we used the correlated model for all food groups.
The Indivint SAS macro (National Cancer Institute, 2009) was used to predict individuals’ consumption.
The results were used in a subsequent regression model followed by Tukey’s pairwise post-hoc tests
(family-wise error rate of 5 percent) to determine whether there was a difference between the mean of
all possible pairs.

11
Results
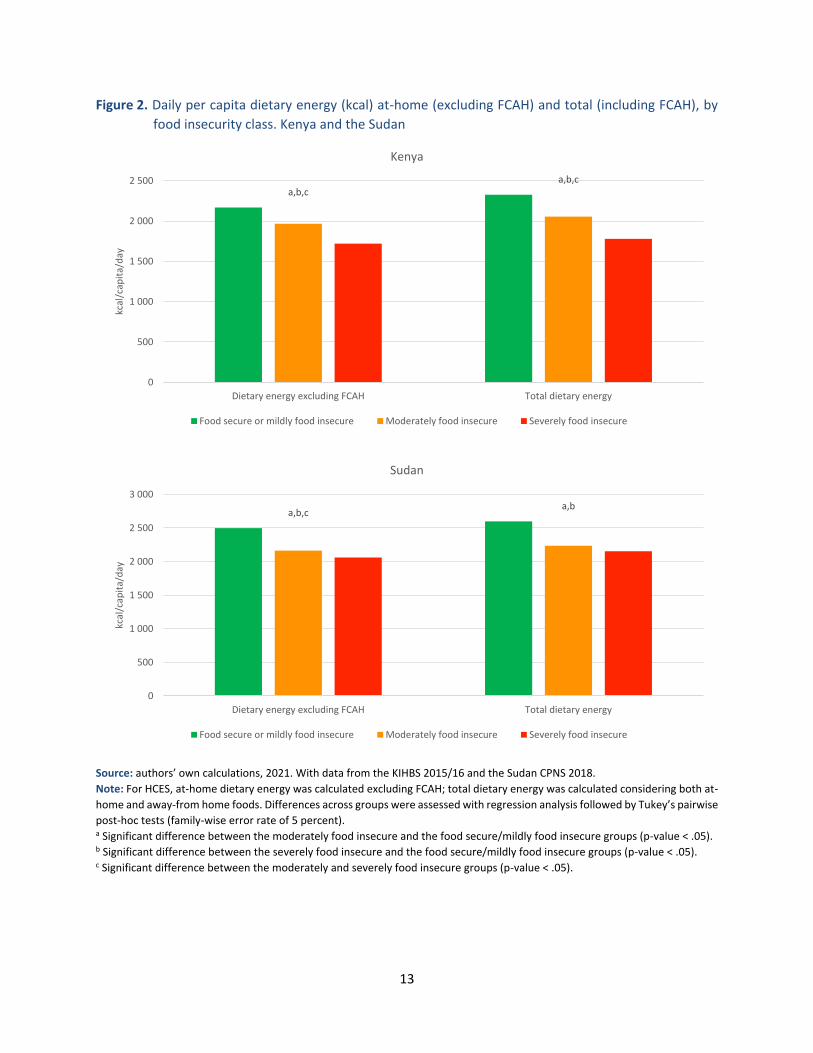
In Kenya and the Sudan, those who experience moderate food insecurity have a lower food consumption
of all food groups (with the exception of cereals in both countries) and a lower dietary energy intake than
those who are food secure or mildly food insecure (from here on, referred to as “food secure”) (Figure 1
and Figure 2). The diets of people experiencing severe food insecurity contain even lower quantities of
roots, tubers and plantains, dairy, vegetables, fats and oils, and sweets and sugars (Kenya and the Sudan),
and cereals, fruits, eggs and fish (Kenya), compared to those in the moderately food insecure class. In
Kenya, severely food insecure people consume more fish than those who are food secure.

12
Figure 1. Daily per capita consumption of selected food groups in each food insecurity class. Kenya and
the Sudan
Source: authors’ own calculations, 2021. With data from the KIHBS 2015/16 and the Sudan CPNS 2018.
Note: Food consumption estimates shown for selected food groups only. Differences across groups were assessed with regression
analysis followed by Tukey’s pairwise post-hoc tests (family-wise error rate of 5 percent). a Significant difference between the moderately food insecure and the food secure/mildly food insecure groups (p-value < .05). b Significant difference between the severely food insecure and the food secure/mildly food insecure groups (p-value < .05). c Significant difference between the moderately and severely food insecure groups (p-value < .05).
b,c
a,b,c
a,b
a,b,c
a,b,c a,b,ca,b
a,b,c
a,b,c
a,b,ca,b,c
0
50
100
150
200
250
300
350
400
Cerealsand theirproducts
Roots,tubers,
plantainsand theirproducts
Pulses,seeds andnuts and
theirproducts
Dairyproducts
Eggs andtheir
products
Fish,shellfishand theirproducts
Meat andmeat
products
Vegetablesand theirproducts
Fruits andtheir
products
Fats andoils
Sweets andsugars
gram
s/ca
pit
a/d
ay
Kenya
Food secure or mildly food insecure Moderately food insecure Severely food insecure
a,b,c
a,ba,b,c
a,b aa,b
a,b,ca,b
a,b,c
a,b,c
0
50
100
150
200
250
300
350
400
Cerealsand theirproducts
Roots,tubers,
plantainsand theirproducts
Pulses,seeds andnuts and
theirproducts
Dairyproducts
Eggs andtheir
products
Fish,shellfishand theirproducts
Meat andmeat
products
Vegetablesand theirproducts
Fruits andtheir
products
Fats andoils
Sweets andsugars
gram
s/ca
pit
a/d
ay
Sudan
Food secure or mildly food insecure Moderately food insecure Severely food insecure
13
Figure 2. Daily per capita dietary energy (kcal) at-home (excluding FCAH) and total (including FCAH), by
food insecurity class. Kenya and the Sudan
Source: authors’ own calculations, 2021. With data from the KIHBS 2015/16 and the Sudan CPNS 2018.
Note: For HCES, at-home dietary energy was calculated excluding FCAH; total dietary energy was calculated considering both at-
home and away-from home foods. Differences across groups were assessed with regression analysis followed by Tukey’s pairwise
post-hoc tests (family-wise error rate of 5 percent). a Significant difference between the moderately food insecure and the food secure/mildly food insecure groups (p-value < .05). b Significant difference between the severely food insecure and the food secure/mildly food insecure groups (p-value < .05). c Significant difference between the moderately and severely food insecure groups (p-value < .05).
a,b,ca,b,c
0
500
1 000
1 500
2 000
2 500
Dietary energy excluding FCAH Total dietary energy
kcal
/cap
ita/
day
Kenya
Food secure or mildly food insecure Moderately food insecure Severely food insecure
a,b,ca,b
0
500
1 000
1 500
2 000
2 500
3 000
Dietary energy excluding FCAH Total dietary energy
kcal
/cap
ita/
day
Sudan
Food secure or mildly food insecure Moderately food insecure Severely food insecure

14
As a consequence of the reduction in food consumption, the amount of available carbohydrates (i.e. total
carbohydrates minus total fibre), protein and fats consumed by the moderately and severely food
insecure groups is lower compared to that of their food secure counterparts (Figure 3). Nevertheless, all
food insecurity classes (both in Kenya and the Sudan) meet the acceptable macronutrient distribution
ranges (55–75 percent of daily calories from carbohydrates, 15–30 percent from fats and 10–15 percent
from protein) (Figure 4).
In both countries, total fibre consumption across the three food insecure classes is much higher (close to
or above 50 g/capita/day) than the recommended minimum of 25 grams/capita/day (WHO and FAO,
2003), nevertheless, it decreases with the severity of food insecurity (Figure 3).

15
Figure 3. Daily per capita carbohydrates (available), fats, protein, and total fibre (grams) by food insecurity
class. Kenya and the Sudan
Source: authors’ own calculations, 2021. With data from the KIHBS 2015/16 and the Sudan CPNS 2018.
Note: For HCES, total nutrient consumption was calculated considering both at-home and away-from home foods. Differences
across groups were assessed with regression analysis followed by Tukey’s pairwise post-hoc tests (family-wise error rate of
5 percent). a Significant difference between the moderately food insecure and the food secure/mildly food insecure groups (p-value < .05). b Significant difference between the severely food insecure and the food secure/mildly food insecure groups (p-value < .05). c Significant difference between the moderately and severely food insecure groups (p-value < .05).
a,b,c
a,b,ca,b,c a,b,c
0
50
100
150
200
250
300
350
400
Available carbohydrates Protein Fats Total fibre
gram
s/ca
pit
a/d
ay
Kenya
Food secure or mildly food insecure Moderately food insecure Severely food insecure
a,b
a,ba,b,c a,b
0
50
100
150
200
250
300
350
400
450
Available carbohydrates Protein Fats Total fibre
gram
s/ca
pit
a/d
ay
Sudan
Food secure or mildly food insecure Moderately food insecure Severely food insecure

16
Figure 4. Proportion of total macronutrients to total dietary energy consumption by food insecurity class.
Kenya and the Sudan
Source: authors’ own calculations, 2021. With data from the KIHBS 2015/16 and the Sudan CPNS 2018.
In both countries, most households across all food insecurity classes report consuming cereals, fats and
oils, and sweets and sugars (Table 5). For all food groups, the proportion of households reporting their
consumption decreases with the severity of food insecurity, the exception being fish consumption in
Kenya. In both Kenya and the Sudan, the number of food insecure households reporting consumption of
eggs and fruits is much lower than for food secure households. In Kenya, the number of households
reporting meat consumption is much lower than for food secure households.
0
10
20
30
40
50
60
70
80
Carbohydrates Protein Fats
Shar
e o
f d
ieta
ry e
ner
gy c
on
trib
ute
d
Kenya
Minimum recommended Food secure or mildly food insecure Moderately food insecure Severely food insecure Maximum recommended
0
10
20
30
40
50
60
70
80
Carbohydrates Protein Fats
Shar
e o
f d
ieta
ry e
ner
gy c
on
trib
ute
d
Sudan
Minimum recommended Food secure or mildly food insecure Moderately food insecure Severely food insecure Maximum recommended

17
Table 5. Percentage of individuals living in households reporting consumption of food groups during the
reference period, by food insecurity class. Kenya and the Sudan
Item group Food insecurity class Kenya Sudan
Cereals and their
products
Food secure or mildly food insecure 99 99
Moderately food insecure 99 99
Severely food insecure 99 98
Roots, tubers,
plantains and their
products
Food secure or mildly food insecure 78 45
Moderately food insecure 69 36
Severely food insecure 57 25
Pulses, seeds and
nuts and their
products
Food secure or mildly food insecure 83 56
Moderately food insecure 80 52
Severely food insecure 76 44
Dairy products
Food secure or mildly food insecure 95 82
Moderately food insecure 87 72
Severely food insecure 80 65
Eggs and their
products
Food secure or mildly food insecure 49 33
Moderately food insecure 37 16
Severely food insecure 23 13
Fish, shellfish and
their products
Food secure or mildly food insecure 28 20
Moderately food insecure 46 16
Severely food insecure 35 21
Meat and their
products
Food secure or mildly food insecure 70 91
Moderately food insecure 51 87
Severely food insecure 39 85
Vegetables and their
products
Food secure or mildly food insecure 97 69
Moderately food insecure 97 69
Severely food insecure 88 64
Fruits and their
products
Food secure or mildly food insecure 84 77
Moderately food insecure 76 65
Severely food insecure 59 60
Fats and oils
Food secure or mildly food insecure 97 94
Moderately food insecure 97 94
Severely food insecure 93 93
Sweets and sugars
Food secure or mildly food insecure 97 96
Moderately food insecure 97 95
Severely food insecure 95 95
Value between 25–50 percent Value ≤ 25 percent
Source: authors’ own calculations, 2021. With data from the KIHBS 2015/16 and the Sudan CPNS 2018.
Note: The reference period was 7 days for both Kenya and the Sudan.

18
In Mexico and Samoa (both of which are upper-middle-income countries), notable differences in the diet
are also observed between the food secure and the food insecure groups,7 but they follow a different
pattern compared to Kenya and the Sudan (Figure 5 and Figure 6). As food insecurity becomes more
severe, dietary energy intake remains similar in Samoa, and declines less markedly in Mexico, in
comparison to the Sudan and Kenya. There is a reduction in the consumption of some animal-source foods
(such as dairy and meat), but minimal change (or even an increase) in the consumption of some plant-
based foods (such as cereals, roots, tubers and plantains, pulses, seeds and nuts, and vegetables) and
sweets and sugars. In Mexico, fruit consumption decreases as food security worsens, whereas in Samoa
it increases. Conversely, consumption of eggs in Mexico is higher in food insecure classes than in the food
secure.
7 In Samoa, the number of cases with severe food insecurity was extremely low, therefore, these cases were combined with those presenting moderate food insecurity, so as to provide reliable estimates of food consumption by class of food insecurity. This combined group is then referred as “moderately or severely food insecure”.

19
Figure 5. Daily per capita consumption of selected food groups in each food insecurity class. Mexico and
Samoa
Source: authors’ own calculations, 2021. With data from Mexico’s ENSANUT 2012 and the Samoa HIES 2018.
Note: Food consumption estimates shown for selected food groups only. For Mexico, differences across groups were assessed
with regression analysis followed by Tukey’s pairwise post-hoc tests (family-wise error rate of 5 percent). For Samoa, differences
across groups were assessed with regression analysis. a Significant difference between the moderately food insecure and the food secure/mildly food insecure groups (p-value < .05). b Significant difference between the severely food insecure and the food secure/mildly food insecure groups (p-value < .05). c Significant difference between the moderately and severely food insecure groups (p-value < .05).
a,b,c
a,b,c
a,b,c
a,b,c
a,b,c
a,b,c
a,b,ca,b,c
a,b,c
a,b
0
50
100
150
200
250
Cerealsand theirproducts
Roots,tubers,
plantainsand theirproducts
Pulses,seeds andnuts and
theirproducts
Dairyproducts
Eggs andtheir
products
Fish,shellfishand theirproducts
Meat andmeat
products
Vegetablesand theirproducts
Fruits andtheir
products
Fats andoils
Sweets andsugars
gram
s/ca
pit
a/d
ay
Mexico
Food secure or mildly food insecure Moderately food insecure Severely food insecure
a
a
aa
aa
a
0
50
100
150
200
250
300
350
400
450
500
Cerealsand theirproducts
Roots,tubers,
plantainsand theirproducts
Pulses,seeds andnuts and
theirproducts
Dairyproducts
Eggs andtheir
products
Fish,shellfishand theirproducts
Meat andmeat
products
Vegetablesand theirproducts
Fruits andtheir
products
Fats andoils
Sweets andsugars
gram
s/ca
pit
a/d
ay
Samoa
Food secure or mildly food insecure Moderately or severely food insecure
20
Figure 6. Daily per capita dietary energy (kcal) at-home (excluding FCAH) for Samoa and total (including
FCAH) for Mexico and Samoa, by food insecurity class
Source: authors’ own calculations, 2021. With data from Mexico’s ENSANUT 2012 and the Samoa HIES 2018.
Note: For Mexico, only total dietary energy was calculated, and it considered all food items reported; differences across groups
were assessed with regression analysis followed by Tukey’s pairwise post-hoc tests (family-wise error rate of 5 percent). For
Samoa, at-home dietary energy was calculated excluding FCAH; total dietary energy was calculated considering both at-home
and away-from home foods; differences across groups were assessed with regression analysis. a Significant difference between the moderately food insecure and the food secure/mildly food insecure groups (p-value < .05). b Significant difference between the severely food insecure and the food secure/mildly food insecure groups (p-value < .05). c Significant difference between the moderately and severely food insecure groups (p-value < .05).
a,b,c
0
500
1 000
1 500
2 000
2 500
Food secure or mildly food insecure Moderately food insecure Severely food insecure
kcal
/cap
ita/
day
Mexico
Food secure or mildly food insecure Moderately food insecure Severely food insecure
a
0
500
1 000
1 500
2 000
2 500
3 000
Dietary energy excluding FCAH Total dietary energy
kcal
/cap
ita/
day
Samoa
Food secure or mildly food insecure Moderately or severely food insecure
21
In Mexico, the total amount of available carbohydrates (i.e. total carbohydrates minus total fibre), protein,
and fats consumed by those who are food insecure is slightly lower than the consumption by their food
secure counterparts (Figure 7). In Samoa, consumption of protein is lower in the food insecure class
compared to the food secure, whereas consumption of both available carbohydrates and fats is similar.
Overall, in Mexico and Samoa, consumption of dietary energy from total carbohydrates, protein and fats
is not within the recommended range for both the food secure and food insecure groups (Figure 8). The
percentage of dietary energy provided by total carbohydrates is below the lower recommended threshold
(55 percent), with the exception of food insecure individuals in Mexico, and the contribution from fats is
above the upper threshold (30 percent). Total fibre consumption in Mexico is slightly below the
recommended minimum of 25 g/capita/day for all food insecurity classes, whereas in Samoa it is slightly
above (Figure 7).
22
Figure 7. Daily per capita carbohydrates (available), fats, protein, and total fibre (grams) by food insecurity
class. Mexico and Samoa
Source: authors’ own calculations, 2021. With data from Mexico’s ENSANUT 2012 and the Samoa HIES 2018.
Notes: For Mexico, total nutrient consumption considered all food items reported; differences across groups were assessed with
regression analysis followed by Tukey’s pairwise post-hoc tests (family-wise error rate of 5 percent). For Samoa, total nutrient
consumption was calculated considering both at-home and away-from home foods; differences across groups were assessed with
regression analysis. a Significant difference between the moderately food insecure and the food secure/mildly food insecure groups (p-value < .05). b Significant difference between the severely food insecure and the food secure/mildly food insecure groups (p-value < .05). c Significant difference between the moderately and severely food insecure groups (p-value < .05).
a,b,c
a,b,c a,b,c
a,c
0
50
100
150
200
250
300
Available carbohydrates Protein Fats Total fibre
gram
s/ca
pit
a/d
ay
Mexico
Food secure or mildly food insecure Moderately food insecure Severely food insecure Label
a
0
50
100
150
200
250
300
350
400
Available carbohydrates Protein Fats Total fibre
gram
s/ca
pit
a/d
ay
Samoa
Food secure or mildly food insecure Moderately or severely food insecure label
23
Figure 8. Proportion of total macronutrients to total dietary energy consumption by food insecurity class.
Mexico and Samoa
Source: authors’ own calculations, 2021. With data from Mexico’s ENSANUT 2012 and the Samoa HIES 2018.
In Samoa, a majority of households in the two food insecurity classes report consuming cereals, fats and
oils, sweets and sugars, roots, tubers and plantains, fish, meat, and vegetables (Table 6). In Mexico, only
cereals are reported by a majority of individuals. The fact that in Mexico the percentages of individuals
reporting consumption of food groups is lower compared to the other three countries may be related to
differences in the design of the food consumption module; additionally, the statistics for Mexico reflect
individuals’ consumption based on the first 24-hour recall, while for the other countries, they reflect
households’ usual consumption.
0
10
20
30
40
50
60
70
80
Carbohydrates Protein Fats
Shar
e o
f d
ieta
ry e
ner
gy c
on
trib
ute
d
Mexico
Minimum recommended Food secure or mildly food insecure Moderately food insecure Severely food insecure Maximum recommended
0
10
20
30
40
50
60
70
80
Carbohydrates Protein Fats
Shar
e o
f d
ieta
ry e
ner
gy c
on
trib
ute
d
Samoa
Minimum recommended Food secure or mildly food insecure Moderately or severely food insecure Maximum recommended

24
Table 6. Percentage of individuals reporting (Mexico) or living in households reporting (Samoa)
consumption of food groups during the reference period, by food insecurity class
Item group Food insecurity class Mexicoa Samoa
Cereals and their
products
Food secure or mildly food insecure 89 100
Moderately food insecure 92 100
Severely food insecure 93
Roots, tubers,
plantains and their
products
Food secure or mildly food insecure 10 93
Moderately food insecure 11 94
Severely food insecure 12
Pulses, seeds and
nuts and their
products
Food secure or mildly food insecure 38 65
Moderately food insecure 43 70
Severely food insecure 44
Dairy products
Food secure or mildly food insecure 66 61
Moderately food insecure 61 50
Severely food insecure 52
Eggs and their
products
Food secure or mildly food insecure 27 26
Moderately food insecure 30 16
Severely food insecure 31
Fish, shellfish and
their products
Food secure or mildly food insecure 4 93
Moderately food insecure 4 95
Severely food insecure 3
Meat and meat
products
Food secure or mildly food insecure 41 99
Moderately food insecure 40 99
Severely food insecure 34
Vegetables and their
products
Food secure or mildly food insecure 43 95
Moderately food insecure 46 97
Severely food insecure 49
Fruits and their
products
Food secure or mildly food insecure 47 62
Moderately food insecure 43 64
Severely food insecure 36
Fats and oils
Food secure or mildly food insecure 41 87
Moderately food insecure 45 83
Severely food insecure 48
Sweets and sugars
Food secure or mildly food insecure 66 98
Moderately food insecure 67 100
Severely food insecure 66
Value between 25–50 percent Value ≤ 25 percent
Source: authors’ own calculations, 2021. With data from Mexico’s ENSANUT 2012 and the Samoa HIES 2018.
Notes: The reference period was: 24 hours for Mexico and 14 days for Samoa. a On the first 24-hour recall.

25
Discussion
The analysis reveals that people who experience moderate or severe food insecurity consume less meat,
dairy products, vegetables (for Kenya and the Sudan) and fruits (except for Samoa) and a higher
proportion of other plant-based foods (such as cereals, roots, tubers and plantains, and pulses, seeds and
nuts) that are typically cheaper on a per-calorie basis. Overall, the more food insecure people are, the
larger the share of staples in their diet. Moreover, the reduction in nutritious food groups becomes more
pronounced as the severity of food insecurity increases.
These findings are consistent with the underlying theoretical constructs of food insecurity: people
experiencing moderate food insecurity face uncertainties about their ability to obtain food and have been
forced to compromise on the nutritional quality or quantity of the food they consume, whereas people
experiencing severe food insecurity have typically run out of food and, at worst, gone one or more days
without eating (Ballard, 2013), thereby markedly reducing the quantities of food they consume.
One reason for food insecure households in Kenya having a higher increased fish consumption compared
to food secure households could be that subsistence fishing is practiced by some of the poorest and most
food insecure local communities in the country (Abila, 2003).
Another important finding of this analysis is that the ways moderately food insecure people modify their
diets vary according to the income level of the country. In the two lower-middle-income countries studied
(Kenya and the Sudan), there is a marked decrease in the consumption of most food groups with an
increase in the share of staples in the diet. On the other hand, in Mexico and Samoa, which are upper-
middle-income countries, the consumption of cheaper foods increases with more expensive foods being
consumed in lesser amounts. Mexico particularly shows a decrease in fruit and dairy consumption. This is
in line with Muhammad et al. (2017), who found that purchases of fruits and milk are vulnerable to
changes in income and prices. In the case of Samoa, the increase in fruit consumption with an increase in
food insecurity is explained by the fact that a high proportion of the total fruit consumed is not purchased,
but rather comes from own production (58 percent and 77 percent for food secure, and moderate or
severe food insecure, respectively; results not shown): as a result, consumption is less susceptible to
prices.
There are several plausible reasons why food insecurity, as measured by experience-based scales like the
FIES, may contribute to different dietary outcomes in lower-middle- and upper-middle-income countries,
to the extent that these countries may be exemplary of other countries in the same income level groups.
First, healthy diets may generally be less affordable in lower-middle-income countries than in upper-
middle-income countries (Hirvonen et al., 2020). Second, social protection programmes may receive less
funding in lower-middle-income countries (World Bank, 2018). Lastly, vulnerable people’s access to food,
especially perishable nutritious foods, may be more compromised in lower-middle-income countries than
in upper-middle-income countries, due to a lack of physical infrastructure and food processing and storage
technology, as well as food safety issues (Burlingame and Dernini, 2019; Jaffee et al., 2019).
This study also found that in Mexico and Samoa, the decrease in dietary energy consumption among
people who are moderately food insecure, compared to those who are food secure, is less marked than
in Kenya and the Sudan. A related finding is that, in Samoa and Mexico, no group met the recommended
ranges of energy intake from macronutrients (the share of dietary energy provided by fats is too high and

26
the share from carbohydrates is too low); whereas in Kenya and the Sudan all classes met the
recommendations for macronutrient distribution. This may be because both Mexico and Samoa are well
into the nutrition transition, which is characterized by a rapid shift in diet composition towards a higher
consumption of energy-dense foods high in fat, sugar or salt that are low-cost and widely available
(Popkin, Adair and Ng, 2012).
Limitations and strengths
As with every study, our analysis has limitations that should be considered when interpreting results. First,
we used two different sources of food consumption data, which hampers comparability of results across
data sources. While individual-level dietary food consumption surveys provide detailed quantitative
information at the individual level, a small number of recent nationally representative surveys are
available, and an even smaller number of surveys including an assessment of food security with an
experience-based food insecurity scale. For this reason, we relied on an additional data source, i.e. HCES.
Second, HCES are not purposefully designed to capture food consumption, therefore derived estimates
of food and nutrient consumption may be biased and not even comparable across different HCES due to
different survey designs. In addition, they do not provide information about the food and nutrient intake
of household members. However, we attempted to make food consumption statistics comparable across
countries to the extent possible.
In spite of these limitations, we found coherent trends in changes in consumption across food insecurity
classes within countries, according to what had been hypothesized. Furthermore, this is the first study of
the relationship of food insecurity and diet with multiple datasets where all food insecurity measures
were calibrated to the global reference scale following the FIES methodology. This allowed us to obtain
cross-country comparable classes of food insecurity.

27
Conclusion
Overall, the analysis revealed that the more food insecure people are, the larger the share of staples in
their diet. In the two lower-middle-income countries studied (Kenya and the Sudan), there is a marked
decrease in consumption of most food groups, except for staple foods. In the two upper-middle-income
countries examined (Mexico and Samoa), people who are moderately food insecure consume more foods
that are typically cheaper on a per-calorie basis (cereals, roots, tubers and plantains), and consume lesser
amounts of expensive foods (such as meat), compared with those who are food secure. All four countries
show a decrease in dairy consumption with the increase of food insecurity.

28
References
Abila, R. 2003. Fish trade and food security: are they reconcilable in lake Victoria? Rome: FAO.
http://www.fao.org/3/Y4961E/y4961e0d.htm
Ali, D., Saha, K. K., Nguyen, P. H., Diressie, M. T., Ruel, M. T., Menon, P., & Rawat, R. 2013. Household Food
Insecurity Is Associated with Higher Child Undernutrition in Bangladesh, Ethiopia, and Vietnam, but the
Effect Is Not Mediated by Child Dietary Diversity. The Journal of Nutrition, 143(12), 2015–2021.
https://doi.org/10.3945/jn.113.175182
Ballard, T.J., Kepple, A.W. & Cafiero, C. 2013. The Food Insecurity Experience Scale. Development of a
Global Standard for Monitoring Hunger Worldwide. FAO. http://www.fao.org/3/a-as583e.pdf
Burlingame, B. & Dernini, S. (Eds.). 2019. Sustainable diets: linking nutrition and food systems.
https://doi.org/10.1079/9781786392848.0000
FAO. 2003. Food Energy: Methods of Analysis and Conversion Factors. FAO Food and Nutrition Paper 77.
Rome: FAO. http://www.fao.org/uploads/media/FAO_2003_Food_Energy_02.pdf
FAO. 2012. Panorama de la seguridad alimentaria y la nutrición. Mexico City. http://www.fao.org/3/a-
i3269s.pdf
FAO. 2016. Methods for estimating comparable rates of food insecurity experienced by adults throughout
the world. Rome, FAO. http://www.fao.org/3/c-i4830e.pdf
FAO. 2017. The Food Insecurity Experience Scale: Measuring food insecurity through people’s experiences.
Rome, FAO. https://doi.org/I7835EN/1/09.17
FAO & Government of Kenya. 2018. Kenya Food Composition Tables. Nairobi. http://www.fao.org/
3/I8897EN/i8897en.pdf
FAO, IFAD, UNICEF, WFP & WHO. 2019. The State of Food Security and Nutrition in the World 2019.
Safeguarding against economic slowdowns and downturns. http://www.fao.org/3/ca5162en/
ca5162en.pdf
FAO & INFOODS. 2012. Guidelines for Food Matching: Version 1.2. Rome. http://www.fao.org/docrep/
017/ap805e/ap805e.pdf
FAO, INFOODS, The West African Health Organization, & Bioversity International. 2012. West African Food
Composition Table. Rome. http://www.fao.org/3/a-i2698b.pdf
FAO & WHO. 2020. FAO/WHO Global Individual Food consumption data (GIFT) Tool. http://www.fao.org/
gift-individual-food-consumption/en/
Gundersen, C., & Ziliak, J. P. 2015. Food insecurity and health outcomes. Health Affairs, 34(11), 1830–
1839. https://doi.org/10.1377/hlthaff.2015.0645
Hanson, K. L., & Connor, L. M. 2014. Food insecurity and dietary quality in US adults and children: a
systematic review. The American Journal of Clinical Nutrition, 100(2), 684–692.
https://doi.org/10.3945/ajcn.114.084525

29
Hirvonen, K., Bai, Y., Headey, D., & Masters, W. A. 2020. Affordability of the EAT–Lancet reference diet: a
global analysis. The Lancet Global Health, 8(1), e59–e66. https://doi.org/10.1016/S2214-109X(19)30447-
4
Jaffee, S., Henson, S., Unnevehr, L., Grace, D., & Cassou, E. 2019. The Safe Food Imperative: Accelerating
Progress in Low- and Middle-Income Countries. Washington, DC: World Bank.
https://openknowledge.worldbank.org/handle/10986/30568
Johnson, C. M., Sharkey, J. R., Lackey, M. J., Adair, L. S., Aiello, A. E., Bowen, S. K., Fang W., Flax V.L. &
Ammerman, A. S. 2018. Relationship of food insecurity to women’s dietary outcomes: a systematic review.
Nutrition Reviews, 76(12), 910–928. https://doi.org/10.1093/nutrit/nuy042
Leung, C. W., Epel, E. S., Ritchie, L. D., Crawford, P. B., & Laraia, B. A. 2014. Food Insecurity Is Inversely
Associated with Diet Quality of Lower-Income Adults. Journal of the Academy of Nutrition and Dietetics,
114(12), 1943-1953.e2. https://doi.org/10.1016/j.jand.2014.06.353
López-Olmedo, N., Carriquiry, A. L., Rodríguez-Ramírez, S., Ramírez-Silva, I., Espinosa-Montero, J.,
Hernández-Barrera, L., Campirano F., Martínez-Tapia B. & Rivera, J. A. 2016. Usual Intake of Added Sugars
and Saturated Fats Is High while Dietary Fiber Is Low in the Mexican Population. The Journal of Nutrition,
146(9), 1856S-1865S. https://doi.org/10.3945/jn.115.218214
Martin, M. S., Maddocks, E., Chen, Y., Gilman, S. E., & Colman, I. 2016. Food insecurity and mental illness:
Disproportionate impacts in the context of perceived stress and social isolation. Public Health, 132, 86–
91. https://doi.org/10.1016/j.puhe.2015.11.014
Maynard, M., Andrade, L., Packull-McCormick, S., Perlman, C. M., Leos-Toro, C., & Kirkpatrick, S. I. 2018.
Food insecurity and mental health among females in high-income countries. International Journal of
Environmental Research and Public Health. MDPI AG. https://doi.org/10.3390/ijerph15071424
Moltedo, A., Álvarez-Sánchez, C., Troubat, N., & Cafiero, C. 2018. Optimizing the use of ADePT-Food
Security Module for Nutrient Analysis: ADePT-FSM Version 3. (S. D. FAO, Ed.). Rome.
http://www.fao.org/fileadmin/templates/ess/foodsecurity/Optimizing_the_use_of_ADePT_FSM_for_nu
trient_analysis.pdf
Moltedo, A., Troubat, N., Lokshin, M., & Sajaia, Z. 2014. Analyzing Food Security Using Household Survey
Data: Streamlined Analysis with ADePT Software. Washington, DC: World Bank.
https://openknowledge.worldbank.org/handle/10986/18091
Muhammad, A., D’Souza, A., Meade, B., Micha, R., & Mozaffarian, D. 2017. How income and food prices
influence global dietary intakes by age and sex: Evidence from 164 countries. BMJ Global Health, 2(3),
e000184. https://doi.org/10.1136/bmjgh-2016-000184
Mundo-Rosas, V., De La Cruz-Góngora, V., Jiménez-Aguilar, A., & Shamah-Levy, T. 2014. [Dietary diversity
and nutrient intake in children 24-59 months old and their association with food insecurity]. Salud Publica
Mex, 56 (supplement 1). http://www.scielo.org.mx/pdf/spm/v56s1/v56s1a7.pdf
National Cancer Institute. 2009. Usual dietary intakes: SAS macros for the NCI method. National Cancer
Institute. [online] [cited 20 March 2020] https://epi.grants.cancer.gov/diet/usualintakes/macros.html
Nord, M. 2014. What have we learned from two decades of research on household food security? Public

30
Health Nutrition. Cambridge University Press. https://doi.org/10.1017/S1368980013003091
Pacific Community, FAO & University of Wollongong. 2020. Pacific Nutrient database Version 2 - A tool to
facilitate poverty, nutrition and food security analysis in the Pacific region.
Pinheiro de Toledo-Vianna, R., Hromi-Fiedler, A., Segall-Correa, A., & Pérez-Escamilla, R. 2012. Household
food insecurity in small municipalities in Northeastern Brazil. In International Scientific Symposium on
Food and Nutrition Security information: from Valid Measurement to Effective Decision Making. Rome.
Popkin, B. M., Adair, L. S., & Ng, S. W. 2012. Global nutrition transition and the pandemic of obesity in
developing countries. Nutr Rev, 70(1), 3–21. https://doi.org/10.1111/j.1753-4887.2011.00456.x
Rodríguez, L. A., Mundo-Rosas, V., Méndez-Gómez-Humarán, I., Pérez-Escamilla, R., & Shamah-Levy, T.
2017. Dietary quality and household food insecurity among Mexican children and adolescents. Maternal
& Child Nutrition, 13(4), e12372. https://doi.org/10.1111/mcn.12372
Tooze, J., Kipnis, V., Buckman, D., Carroll, R., Freedman, L., Guenther, P., Krebs-Smith S.M., Subar A.F. &
Dodd, K. 2010. A mixed-effects model approach for estimating the distribution of usual intake of nutrients:
the NCI method. Statistics in Medicine, 29(27), 2857–2868. https://doi.org/10.1002/sim.4063
U.S. Department of Agriculture, Agricultural Research Service. 2019. FoodData Central.
https://fdc.nal.usda.gov/
Vega-Macedo, M., Shamah-Levy, T., Peinador-Roldan, R., Mendez-Gomez, I., & Melgar-Quiñonez, H. 2014.
[Food insecurity and dietary diversity in Mexican households with children less than five years of age].
Salud Publica Mex, 56 (supplement 1), 1:S21-S30. http://www.scielo.org.mx/pdf/spm/v56s1/v56s1a5.pdf
WHO & FAO. 2003. Diet, nutrition and the prevention of chronic diseases: report of a joint WHO/FAO
expert consultation. World Health Organization technical report series (Vol. 916). Geneva.
https://apps.who.int/iris/bitstream/handle/10665/42665/WHO_TRS_916.pdf?sequence=1
World Bank. 2018. The State of Social Safety Nets 2018. Washington, DC: World Bank.
https://openknowledge.worldbank.org/handle/10986/29115
World Bank. 2019. Global Consumption Database. [online] http://datatopics.worldbank.org/
consumption/

31
Annex A1: Food Insecurity Experience Scale (FIES) survey module
included in the Kenya Integrated Household Budget Survey, Samoa
Household Income and Expenditure Survey, and the Sudan
Consumption Patterns and Nutrition Study
The Food Insecurity Experience Scale Survey Module (FIES-SM) is composed of eight questions (i.e. items)
with dichotomous yes/no responses. Together, the FIES-SM items compose a statistical scale designed to
cover a range of severity of food insecurity and should be analysed together as a scale, not as separate
items.
GLOBAL FOOD INSECURITY EXPERIENCE SCALE Household Referenced
Now I would like to ask you some questions about food. During the last 12 MONTHS, was there a time when: Q1. You or others in your household worried about not having enough food to eat because of a lack of money or other resources?
0 No 1 Yes 98 Don’t know 99 Refused
Q2. Still thinking about the last 12 MONTHS, was there a time when you or others in your household were unable to eat healthy and nutritious food because of a lack of money or other resources?
0 No 1 Yes 98 Don’t know 99 Refuse
Q3. Was there a time when you or others in your household ate only a few kinds of foods because of a lack of money or other resources?
0 No 1 Yes 98 Don’t know 99 Refused
Q4. Was there a time when you or others in your household had to skip a meal because there was not enough money or other resources to get food?
0 No 1 Yes 98 Don’t know 99 Refused
Q5. Still thinking about the last 12 MONTHS, was there a time when you or others in your household ate less than you thought you should because of a lack of money or other resources?
0 No 1 Yes 98 Don’t know 99 Refused
Q6. Was there a time when your household ran out of food because of a lack of money or other resources?
0 No 1 Yes 98 Don’t know 99 Refused
Q7. Was there a time when you or others in your household were hungry but did not eat because there was not enough money or other resources for food?
0 No 1 Yes 98 Don’t know 99 Refused

32
Q8. Was there a time when you or others in your household went without eating for a whole day because of a lack of money or other resources?
0 No 1 Yes 98 Don’t know 99 Refused

33
Annex A2: Latin American and Caribbean Scale (ELCSA) module
included in Mexico’s National Health and Nutrition Survey
(ENSANUT) 2012
Latin American and Caribbean Scale
Household Referenced
1. En los últimos 3 meses, por falta de dinero u otros recursos, alguna vez ¿Usted se preocupó de que los alimentos se acabaran en su hogar?
1 SI 2 NO 99 No Sabe 88 No Responde
2. En los ultimos 3 meses, por falta de dinero u otros recursos, alguna vez ¿En su hogar se quedaron sin alimentos?
1 SI 2 NO 99 No Sabe 88 No Responde
3. En los ultimos 3 meses, por falta de dinero u otros recursos, alguna vez ¿En su hogar dejaron de tener una alimentacion (saludable, nutritiva, balanceada, equilibrada)?
1 SI 2 NO 99 No Sabe 88 No Responde
4. En los ultimos 3 meses, por falta de dinero u otros recursos, alguna vez ¿Usted o algun adulto en su hogar tuvo una alimentacion basada en poca variedad de alimentos?
1 SI 2 NO 99 No Sabe 88 No Responde
5. En los ultimos 3 meses, por falta de dinero u otros recursos, alguna vez ¿Usted o algun adulto en su hogar dejo de desayunar, (comer, almorzar) o cenar?
1 SI 2 NO 99 No Sabe 88 No Responde
6. En los ultimos 3 meses, por falta de dinero u otros recursos, alguna vez ¿Usted o algun adulto en su hogar comio menos de lo que debia comer?
1 SI 2 NO 99 No Sabe 88 No Responde
7. En los ultimos 3 meses, por falta de dinero u otros recursos, alguna vez ¿Usted o algun adulto en su hogar sintio hambre pero no comio?
1 SI 2 NO 99 No Sabe 88 No Responde
8. En los ultimos 3 meses, por falta de dinero u otros recursos, alguna vez ¿Usted o algun adulto en su hogar solo comio una vez al dia o dejo de comer todo un dia?
1 SI 2 NO 99 No Sabe 88 No Responde
¿En su hogar viven personas menores de 18 años? (Si, pasa a la pregunta 9; No, fin de la sección)
SI NO
9. En los últimos 3 meses, por falta de dinero u otros recursos, alguna vez ¿Algún menor de 18 años en su hogar dejó de tener una alimentación (saludable, nutritiva, balanceada, equilibrada)?
1 SI 2 NO 99 No Sabe 88 No Responde

34
10. En los últimos 3 meses, por falta de dinero u otros recursos, alguna vez ¿Algún menor de 18 años en su hogar tuvo una alimentación basada en poca variedad de alimentos?
1 SI 2 NO 99 No Sabe 88 No Responde
11. En los últimos 3 meses, por falta de dinero u otros recursos, alguna vez ¿Algún menor de 18 años en su hogar dejó de desayunar, (comer, almorzar) o cenar?
1 SI 2 NO 99 No Sabe 88 No Responde
12. En los últimos 3 meses, por falta de dinero u otros recursos, alguna vez ¿Algún menor de 18 años en su hogar comió menos de lo que debía?
1 SI 2 NO 99 No Sabe 88 No Responde
13. En los últimos 3 meses, por falta de dinero u otros recursos, alguna vez ¿Tuvieron que disminuir la cantidad servida en las comidas a algún menor de 18 años en su hogar?
1 SI 2 NO 99 No Sabe 88 No Responde
14. En los últimos 3 meses, por falta de dinero u otros recursos, alguna vez ¿Algún menor de 18 años en su hogar sintió hambre pero no comió?
1 SI 2 NO 99 No Sabe 88 No Responde
15. En los últimos 3 meses, por falta de dinero u otros recursos, alguna vez ¿Algún menor de 18 años en su hogar solo comió una vez al día o dejó de comer todo un día?
1 SI 2 NO 99 No Sabe 88 No Responde
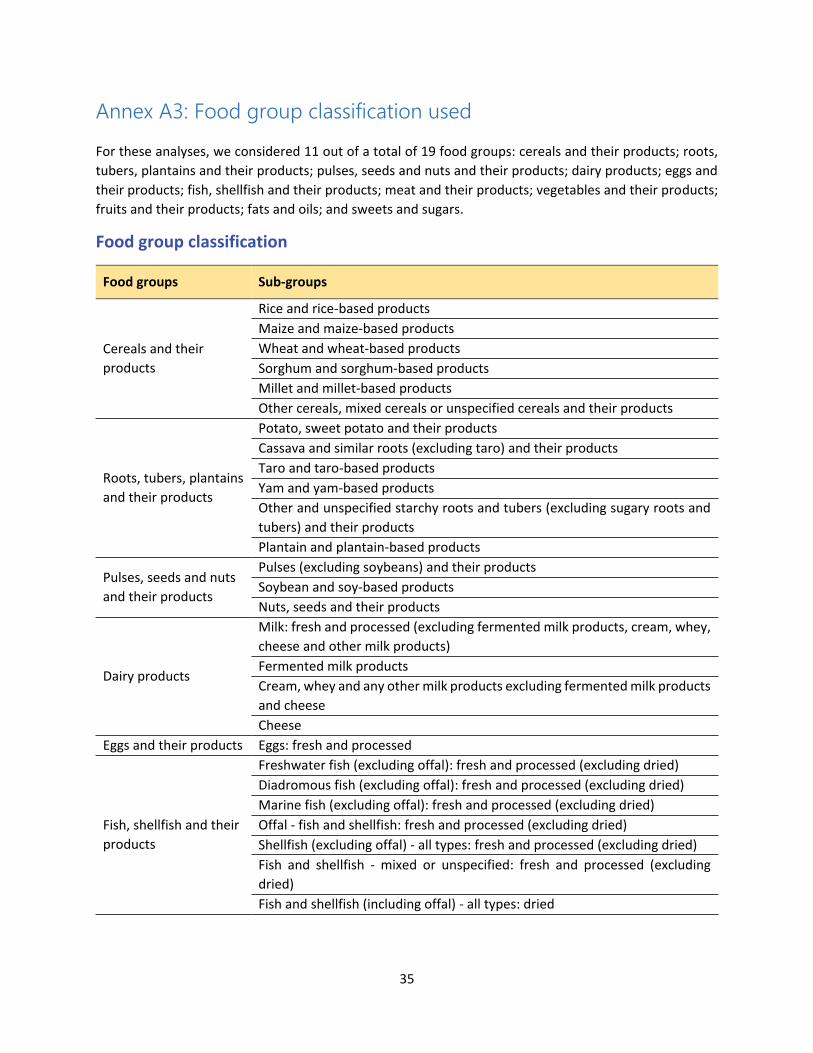
35
Annex A3: Food group classification used
For these analyses, we considered 11 out of a total of 19 food groups: cereals and their products; roots,
tubers, plantains and their products; pulses, seeds and nuts and their products; dairy products; eggs and
their products; fish, shellfish and their products; meat and their products; vegetables and their products;
fruits and their products; fats and oils; and sweets and sugars.
Food group classification
Food groups Sub-groups
Cereals and their
products
Rice and rice-based products
Maize and maize-based products
Wheat and wheat-based products
Sorghum and sorghum-based products
Millet and millet-based products
Other cereals, mixed cereals or unspecified cereals and their products
Roots, tubers, plantains
and their products
Potato, sweet potato and their products
Cassava and similar roots (excluding taro) and their products
Taro and taro-based products
Yam and yam-based products
Other and unspecified starchy roots and tubers (excluding sugary roots and
tubers) and their products
Plantain and plantain-based products
Pulses, seeds and nuts
and their products
Pulses (excluding soybeans) and their products
Soybean and soy-based products
Nuts, seeds and their products
Dairy products
Milk: fresh and processed (excluding fermented milk products, cream, whey,
cheese and other milk products)
Fermented milk products
Cream, whey and any other milk products excluding fermented milk products
and cheese
Cheese
Eggs and their products Eggs: fresh and processed
Fish, shellfish and their
products
Freshwater fish (excluding offal): fresh and processed (excluding dried)
Diadromous fish (excluding offal): fresh and processed (excluding dried)
Marine fish (excluding offal): fresh and processed (excluding dried)
Offal - fish and shellfish: fresh and processed (excluding dried)
Shellfish (excluding offal) - all types: fresh and processed (excluding dried)
Fish and shellfish - mixed or unspecified: fresh and processed (excluding
dried)
Fish and shellfish (including offal) - all types: dried

36
Food groups Sub-groups
Meat and their
products
Offal - all types: fresh and processed (excluding dried)
Mammals, reptiles and amphibians (excluding offal): fresh and processed
(excluding dried)
Birds (excluding offal): fresh and processed (excluding dried)
Meat - mixed or unspecified: fresh and processed (excluding dried)
Meat - all types: dried
Vegetables and their
products
Leafy vegetables: fresh
Yellow and orange vegetables: fresh
Vegetables (excluding leafy vegetables and including fresh legumes): fresh
Vegetables - all types: dried
Vegetables - all types, mixed and unspecified: processed (excluding dried)
Vegetables - mixed and unspecified: fresh
Fruits and their
products
Yellow and orange fruits: fresh
Fruits: fresh
Fruits: dried
Fruits: processed (excluding dried and candied)
Fats and oils
Vegetable fat and oil (excluding red palm oil)
Red palm oil
Animal fat and oil
Sweets and sugars
Dough-based sweets
Chocolate-based sweets
Fruit and nut-based sweets
Other sweets
Sugars
Dairy- or dairy imitate-based sweets
Eight food groups were not considered (insects, grubs and their products; foods for particular nutritional
uses; food supplements and similar; food additives; composite dishes; savoury snacks; and spices and
condiments) due to the very low/zero consumption or negligible contribution to usual energy and nutrient
consumption, or because they were not well captured by HCES.
Contact:
Statistics Division – Economic and Social Development
www.fao.org/food-agriculture-statistics/resources/publications/working-papers/en/
Food and Agriculture Organization of the United Nations
Rome, Italy