Embed Size (px)
Citation preview

1
Farmer Mac Reports First Quarter 2017 Financial Results
Record Outstanding Business Volume of $17.8 Billion
WASHINGTON, May 10, 2017— The Federal Agricultural Mortgage Corporation (Farmer Mac;
NYSE: AGM and AGM.A) today announced its results for the fiscal quarter ended March 31, 2017, which
included $445 million in net new business volume growth that brought total outstanding business volume
to $17.8 billion as of March 31, 2017. Farmer Mac's net income attributable to common stockholders for
first quarter 2017 was $18.6 million ($1.73 per diluted common share), compared to $25.5 million ($2.38 per
diluted common share) in fourth quarter 2016 and $10.3 million ($0.94 per diluted common share) in first
quarter 2016. Farmer Mac's first quarter 2017 core earnings, a non-GAAP measure, were $15.6 million
($1.45 per diluted common share), compared to $13.9 million ($1.30 per diluted common share) in fourth
quarter 2016 and $12.4 million ($1.12 per diluted common share) in first quarter 2016.
"Our first quarter 2017 results reflect a continuation of the favorable trends that developed over the
course of last year," said President and Chief Executive Officer Tim Buzby. "The strength of our business
model can be seen in our financial results for first quarter 2017, as we grew outstanding business volume
by $445 million and core earnings per share by 29 percent year-over-year. Our credit quality remains
favorable and within our expectations despite showing signs of the expected normalization related to the
current agricultural credit cycle. Our capital base is strong and growing, even with the significant dividend
increases of the last two years and our continued growth in business volume. We are also proud of the other
ways we have positioned Farmer Mac for continued success in the future, such as expanding our human and

2
technology resources. These initiatives, coupled with our healthy capital base, will allow us to better grow
our business and deliver upon our mission throughout agricultural economic cycles, especially in today's
more challenging environment."
Earnings
Farmer Mac's net income attributable to common stockholders for first quarter 2017 was
$18.6 million ($1.73 per diluted common share), compared to $10.3 million ($0.94 per diluted common
share) for first quarter 2016. The $8.3 million increase compared to first quarter 2016 was driven by the
effects of fair value changes on financial derivatives and hedged assets, which was a $3.1 million after-tax
gain in first quarter 2017 compared to a $1.9 million after-tax loss in first quarter 2016. Also contributing
to the year-over-year increase was an increase in net interest income of $2.2 million, after tax, and $0.7
million of tax benefits from the vesting of restricted stock and the exercise of stock appreciation rights
("SARs"), both of which were accounted for under new accounting guidance that became effective in first
quarter 2017.
Core earnings in first quarter 2017 were $15.6 million ($1.45 per diluted common share), compared
to $13.9 million ($1.30 per diluted common share) in fourth quarter 2016 and $12.4 million ($1.12 per
diluted common share) in first quarter 2016.
The $1.7 million sequential increase in core earnings was primarily attributable to (1) higher total
revenues, which included a $0.6 million after-tax increase in net effective spread and a $0.1 million after-
tax increase in guarantee and commitment fee income, partially offset by a $0.1 million after-tax decrease
in other income; and (2) $0.7 million of the aforementioned tax benefits from stock-based awards. Also
contributing to the sequential increase in core earnings was a decrease in operating expenses of $0.1 million,

3
after tax, as an increase in compensation and employee benefits expense was more than offset by the
decrease in general and administrative ("G&A") expenses.
The $3.2 million year-over-year increase in core earnings was primarily attributable to higher total
revenues, which included (1) a $1.9 million after-tax increase in net effective spread; (2) a $0.4 million
after-tax increase in guarantee and commitment fee income; (3) a $0.6 million after-tax increase in fees
received upon the inception of swaps cleared through the Chicago Mercantile Exchange ("CME"); and (4) a
$0.3 million after-tax decrease in hedging losses. Also contributing to the increase was $0.7 million of the
aforementioned tax benefits from stock-based awards. Offsetting the year-over-year core earnings increase
in part was a $0.5 million after-tax increase in operating expenses compared to first quarter 2016, driven by
higher G&A expenses and higher compensation and employee benefits expenses. The year-over-year $0.2
million after-tax increase in G&A expenses was attributable primarily to higher expenses related to
continued technology and business infrastructure investments and expenses related to business development
efforts. The year-over-year $0.3 million after-tax increase in compensation and benefits expenses was due
primarily to an increase in staffing, related employee health insurance costs and benefits, and higher variable
incentive compensation driven by exceeding certain performance targets. Year-over-year credit-related
expenses also increased by $0.2 million, after tax, resulting from net provisions to the allowance for losses
of $0.3 million, after tax, in first quarter 2017, compared to net provisions of $0.1 million, after tax, in first
quarter 2016.
See "Use of Non-GAAP Measures" below for more information about core earnings, core earnings
per share, and net effective spread and for a reconciliation of the comparable GAAP measures to these non-
GAAP measures.

4
Business Volume Highlights
During first quarter 2017, Farmer Mac added $1.1 billion of new business volume, with purchases
of AgVantage securities and Farm & Ranch loans and loans placed under long-term standby purchase
commitments ("LTSPCs") driving the volume growth. Specifically, Farmer Mac:
• purchased $561.4 million of AgVantage securities, including $32.2 million in Farm Equity
AgVantage securities;
• purchased $314.1 million of newly originated Farm & Ranch loans;
• added $113.3 million of Farm & Ranch loans under LTSPCs;
• purchased $92.6 million of USDA Securities;
• issued $38.5 million of Farmer Mac Guaranteed USDA Securities; and
• purchased $27.3 million of Rural Utilities loans.
After $702.2 million of maturities and principal paydowns on existing business during first quarter
2017, Farmer Mac's outstanding business volume increased by $445.1 million from December 31, 2016 to
$17.8 billion as of March 31, 2017. The increase in Farmer Mac's outstanding business volume was driven
by net portfolio growth in AgVantage securities with one of Farmer Mac's long-standing issuers, National
Rural Utilities Cooperative Finance Corporation ("CFC"), which increased its outstanding AgVantage
business volume with Farmer Mac by $240.3 million in first quarter 2017. Farmer Mac also experienced
net portfolio growth of $32.2 million within its Farm Equity AgVantage product line in first quarter 2017.
Additionally, Farmer Mac grew its Farm & Ranch portfolio by $128.9 million notwithstanding the seasonal
large amounts of repayments during first quarter resulting from the January 1 payment date on almost all
loans in the portfolio.
Subsequent to the end of first quarter 2017, Farmer Mac purchased and retained $1.0 billion of
AgVantage securities issued by Metropolitan Life Insurance Company ("MetLife"). MetLife used the

5
proceeds from Farmer Mac's purchase of $1.0 billion in AgVantage securities to refinance an AgVantage
security of the same amount that matured in April 2017. Previously, Farmer Mac held $30.0 million of the
$1.0 billion AgVantage security that matured in April 2017 on-balance sheet and earned a spread between
the interest income earned on that portion of the security and the related funding costs. The remaining
$970.0 million of the $1.0 billion AgVantage security that matured in April 2017 had previously been sold
to third parties and reported as an off-balance sheet program asset on which Farmer Mac earned a guarantee
fee of approximately 0.15 percent on an annual basis. For the newly purchased $1.0 billion in AgVantage
securities, which are now held entirely on-balance sheet, Farmer Mac will earn weighted average net
effective spread income of approximately 0.42 percent on an annual basis. The newly purchased AgVantage
securities are comprised of three maturities – $500.0 million of a one-year security, which is callable in six
months, $250.0 million of a two-year security, and $250.0 million of a three-year security.
Spreads
Net interest income was $37.1 million in first quarter 2017, compared to $33.6 million in first quarter
2016. In percentage terms, net interest income for first quarter 2017 was 0.96 percent, compared to 0.88
percent in first quarter 2016. The $3.5 million year-over-year increase in net interest income was driven by
net growth in Farm & Ranch loans, USDA Securities, and AgVantage Securities. Another factor
contributing to the increase was the full quarter effect of an increase in short-term interest rates on assets
and liabilities indexed to LIBOR due to the Federal Reserve's decision to raise the target range for the federal
funds rate in December 2016, as well as the incremental effect of the Federal Reserve's decision to raise this
target range again in March 2017. Also contributing to the increase was an increase in the net effect of
consolidated trusts from an increase in securitization of Farm & Ranch loans throughout 2016 and the first
three months of 2017. Farmer Mac earns the difference between the interest income recognized on loans in

6
consolidated trusts and the related interest expense recognized on debt securities of consolidated trusts held
by third parties. This increase was offset in part by one less day of interest in first quarter 2017 compared to
first quarter 2016 and an increase in funding costs due to greater application of hedge accounting as funding
expense from financial derivatives related to assets designated in hedge accounting relationships is recorded
through net interest income. The 0.08 percent increase in net interest yield for first quarter 2017 compared
to the same period in 2016 was driven by (1) a reduction in the average balance of lower-earning cash and
cash equivalents; (2) a full quarter effect from the Federal Reserve's decision to raise the short-term target
range for the federal funds interest rate in December 2016; and (3) the incremental effect of the additional
increase in the target range in March 2017. This increase was offset in part by one less day of interest in
first quarter 2017 compared to first quarter 2016.
Farmer Mac's net effective spread, a non-GAAP measure, was $32.9 million in first quarter 2017,
compared to $31.9 million in fourth quarter 2016, and $29.9 million in first quarter 2016. In percentage
terms, net effective spread for first quarter 2017 was 0.91 percent, compared to 0.89 percent in fourth quarter
2016, and 0.82 percent in first quarter 2016. Farmer Mac uses net effective spread as an alternative measure
to net interest income because management believes it is a useful metric that accurately reflects the
economics of the net spread between all the assets owned by Farmer Mac and all related funding, including
any associated derivatives, some of which may not be reflected in net interest income under GAAP.
The sequential increase in quarterly net effective spread in dollar terms was primarily attributable to
(1) growth in AgVantage securities, Farm & Ranch loans, and other business volume, which increased net
effective spread by approximately $0.8 million; and (2) changes in Farmer Mac's funding strategies and
continued improvements in LIBOR-based short-term funding costs for floating rate assets indexed to
LIBOR, which added approximately $0.4 million. This increase was offset in part by two fewer days of
7
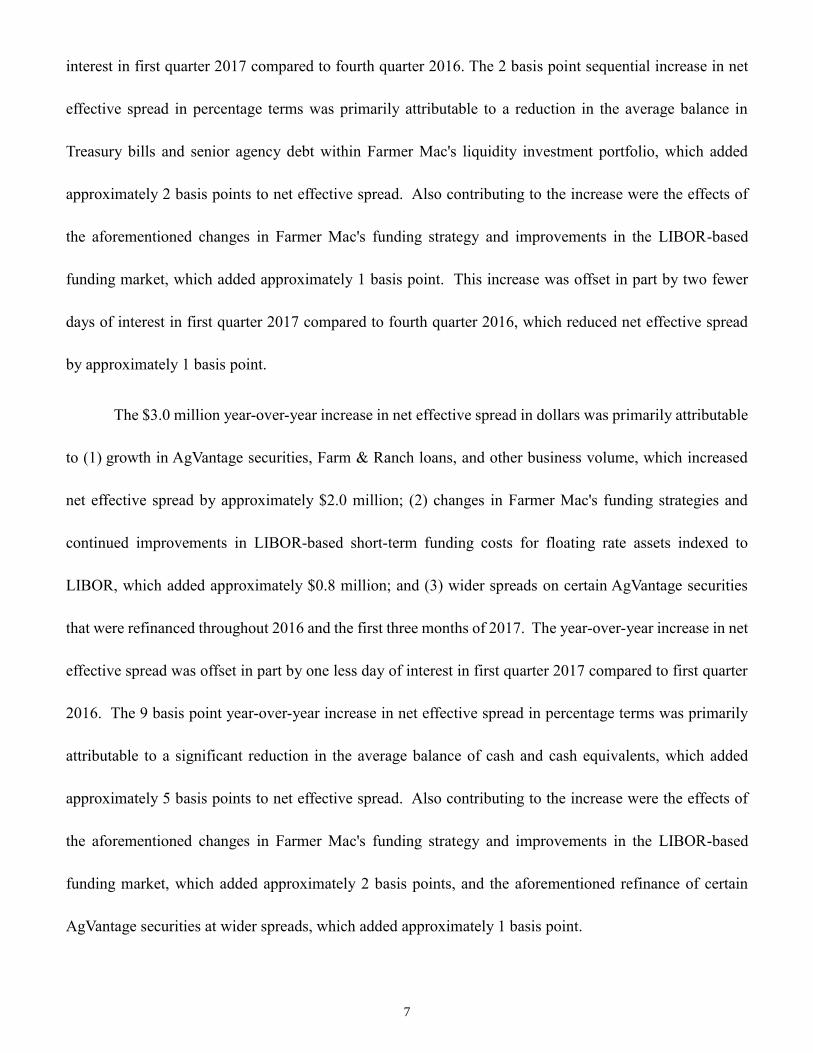
interest in first quarter 2017 compared to fourth quarter 2016. The 2 basis point sequential increase in net
effective spread in percentage terms was primarily attributable to a reduction in the average balance in
Treasury bills and senior agency debt within Farmer Mac's liquidity investment portfolio, which added
approximately 2 basis points to net effective spread. Also contributing to the increase were the effects of
the aforementioned changes in Farmer Mac's funding strategy and improvements in the LIBOR-based
funding market, which added approximately 1 basis point. This increase was offset in part by two fewer
days of interest in first quarter 2017 compared to fourth quarter 2016, which reduced net effective spread
by approximately 1 basis point.
The $3.0 million year-over-year increase in net effective spread in dollars was primarily attributable
to (1) growth in AgVantage securities, Farm & Ranch loans, and other business volume, which increased
net effective spread by approximately $2.0 million; (2) changes in Farmer Mac's funding strategies and
continued improvements in LIBOR-based short-term funding costs for floating rate assets indexed to
LIBOR, which added approximately $0.8 million; and (3) wider spreads on certain AgVantage securities
that were refinanced throughout 2016 and the first three months of 2017. The year-over-year increase in net
effective spread was offset in part by one less day of interest in first quarter 2017 compared to first quarter
2016. The 9 basis point year-over-year increase in net effective spread in percentage terms was primarily
attributable to a significant reduction in the average balance of cash and cash equivalents, which added
approximately 5 basis points to net effective spread. Also contributing to the increase were the effects of
the aforementioned changes in Farmer Mac's funding strategy and improvements in the LIBOR-based
funding market, which added approximately 2 basis points, and the aforementioned refinance of certain
AgVantage securities at wider spreads, which added approximately 1 basis point.
8
Credit
In the Farm & Ranch portfolio, 90-day delinquencies were $50.8 million (0.81 percent of the Farm
& Ranch portfolio) as of March 31, 2017, compared to $21.0 million (0.34 percent) as of December 31,
2016 and $34.7 million (0.61 percent of the Farm & Ranch portfolio) as of March 31, 2016. Those 90-day
delinquencies were comprised of 57 delinquent loans as of March 31, 2017, compared with 38 delinquent
loans as of December 31, 2016 and 60 delinquent loans as of March 31, 2016. Approximately half of the
net increase in Farmer Mac's 90-day delinquencies as a percentage of its Farm & Ranch portfolio from year-
end resulted from the delinquency of a single borrower on two permanent planting loans to which Farmer
Mac had $15.4 million of exposure as of March 31, 2017. That delinquency was due to idiosyncratic factors
specific to the borrower and not related to macroeconomic factors in the agricultural economy. Farmer Mac
believes that it remains adequately collateralized on these loans. The increase in 90-day delinquencies from
year-end is consistent with the seasonal pattern of Farmer Mac's 90-day delinquencies fluctuating from
quarter to quarter, both in dollars and as a percentage of the outstanding Farm & Ranch portfolio, with
higher levels generally observed at the end of the first and third quarters of each year, which corresponds
with the annual (January 1st) and semi-annual (January 1st and July 1st) payment characteristics of most
Farm & Ranch loans. Farmer Mac expects that over time its 90-day delinquency rate will eventually revert
closer to Farmer Mac's historical average due to macroeconomic factors and the cyclical nature of the
agricultural economy and believes that approximately half of the increase in Farmer Mac's delinquency rate
in first quarter 2017 from year-end was attributable at least in part to these factors. Farmer Mac's average
90-day delinquency rate for the Farm & Ranch line of business over the last fifteen years is approximately
one percent.

9
For Farmer Mac's other lines of business, there are currently no delinquent AgVantage securities or
Rural Utilities loans held or underlying LTSPCs, and USDA Securities are backed by the full faith and credit
of the United States. As a result, across all of Farmer Mac's lines of business, 90-day delinquencies
represented 0.28 percent of total business volume as of March 31, 2017, compared to 0.12 percent as of
December 31, 2016 and 0.21 percent as of the year-ago quarter.
Another indicator that Farmer Mac considers in analyzing the credit quality of its Farm & Ranch
portfolio is the level of internally-rated "substandard" assets, both in dollars and as a percentage of the
outstanding Farm & Ranch portfolio. Assets categorized as "substandard" have a well-defined weakness or
weaknesses, and there is a distinct possibility that some loss will be sustained if deficiencies are not
corrected. As of March 31, 2017, Farmer Mac's substandard assets were $171.5 million (2.7 percent of the
Farm & Ranch portfolio), compared to $165.2 million (2.7 percent of the Farm & Ranch portfolio) as of
December 31, 2016. Those substandard assets were comprised of 263 loans as of March 31, 2017, compared
to 287 loans as of December 31, 2016. The $6.3 million increase from year-end 2016 was in-line with
growth in the Farm & Ranch portfolio. Farmer Mac expects that over time its substandard asset rate will
eventually revert closer to Farmer Mac's historical average due to macroeconomic factors and the cyclical
nature of the agricultural economy. Although some credit losses are inherent to the business of agricultural
lending, Farmer Mac believes that any losses associated with the current agricultural credit cycle will be
moderated by the strength and diversity of its portfolio, which Farmer Mac believes is adequately
collateralized. Farmer Mac's average substandard assets as a percentage of its Farm & Ranch portfolio over
the last 15 years is approximately 4 percent.
10
Lines of Business
Farmer Mac's operations consist of four lines of business – Farm & Ranch, USDA Guarantees, Rural
Utilities, and Institutional Credit. Net interest income by business segment for first quarter 2017 was $12.8
million (214 basis points) for Farm & Ranch, $5.3 million (103 basis points) for USDA Guarantees, $2.9
million (119 basis points) for Rural Utilities, and $13.5 million (88 basis points) for Institutional Credit.
Net effective spread by business segment for first quarter 2017 was $10.7 million (180 basis points) for
Farm & Ranch, $4.7 million (91 basis points) for USDA Guarantees, $2.6 million (106 basis points) for
Rural Utilities, and $12.6 million (82 basis points) for Institutional Credit.
Liquidity and Capital
Farmer Mac's core capital totaled $624.3 million as of March 31, 2017, exceeding the statutory
minimum capital requirement by $148.7 million, or 31 percent, compared to $609.7 million as of
December 31, 2016, which was $143.2 million, or 31 percent, above the statutory minimum capital
requirement. The increase in capital in excess of the minimum capital level was due primarily to an increase
in retained earnings and offset in part by an increase in the minimum capital required to support the growth
of on-balance sheet assets during first quarter 2017.
As of March 31, 2017, Farmer Mac's total stockholders' equity was $665.8 million, compared to
$643.4 million as of December 31, 2016. The increase in total stockholders' equity was a result of an
increase in retained earnings and accumulated other comprehensive income.
As prescribed by FCA regulations, Farmer Mac is required to maintain a minimum of 90 days of
liquidity. In accordance with the methodology prescribed by those regulations, Farmer Mac maintained an

11
average of 181 days of liquidity during first quarter 2017 and had 194 days of liquidity as of March 31,
2017.
Use of Non-GAAP Measures
In the analysis of its financial information, Farmer Mac sometimes uses measures of financial
performance that are not presented in accordance with generally accepted accounting principles in the
United States (GAAP), and these are considered "non-GAAP measures." Specifically, Farmer Mac uses the
following non-GAAP measures: "core earnings," "core earnings per share," and "net effective spread."
Farmer Mac uses these non-GAAP measures to measure corporate economic performance and develop
financial plans because, in management's view, they are useful alternative measures in understanding
Farmer Mac's economic performance, transaction economics, and business trends. The non-GAAP financial
measures that Farmer Mac uses may not be comparable to similarly labeled non-GAAP financial measures
disclosed by other companies. Farmer Mac's disclosure of these non-GAAP measures is intended to be
supplemental in nature, and is not meant to be considered in isolation from, as a substitute for, or as more
important than, the related financial information prepared in accordance with GAAP.
Core Earnings and Core Earnings per Share
Core earnings and core earnings per share principally differ from net income attributable to common
stockholders and earnings per common share, respectively, by excluding the effects of fair value
fluctuations. These fluctuations are not expected to have a cumulative net impact on Farmer Mac's financial
condition or results of operations reported in accordance with GAAP if the related financial instruments are
held to maturity, as is expected. Among other items, these fair value fluctuations have included unrealized
gains or losses on financial derivatives and hedging activities. Variation margin is exchanged between
Farmer Mac and its counterparties on both its cleared and non-cleared derivatives portfolios. Prior to first

12
quarter 2017, Farmer Mac accounted for variation margin as collateral and associated unrealized gains or
losses on those centrally cleared derivative contracts. However, beginning in first quarter 2017, the variation
margin amounts exchanged between Farmer Mac and its counterparties on cleared derivatives are
considered as settlement rather than collateral as a result of a change in variation margin rules implemented
by the CME, the central clearinghouse used by Farmer Mac. Specifically, effective January 3, 2017, CME
began to deem the exchange of variation margin between derivatives counterparties as a partial settlement
of each respective derivative contract rather than as collateral pledged by a counterparty. Accordingly,
beginning in first quarter 2017, Farmer Mac presents its cleared derivatives portfolio net of variation margin
payments on its consolidated balance sheets and recognizes realized gains or losses as a result of these
payments on its consolidated statements of operations. However, Farmer Mac believes that even though
these variation margin amounts are accounted for as realized gains or losses on financial derivatives and
hedging activities as a result of the CME rule change, the economic character of these transactions remains
the same as they were before the change. The exchange of variation margin, whether considered a partial
settlement of or the pledge of collateral under a derivatives contract, is not expected to have a cumulative
net impact on Farmer Mac's financial condition or results of operations reported in accordance with GAAP
because the related financial instruments are expected to be held to maturity. Therefore, beginning in first
quarter 2017, Farmer Mac excludes the effects of realized gains or losses resulting from the exchange of
variation margin on its cleared derivatives portfolio in its calculations of core earnings and core earnings
per share to present them on a consistent basis with quarters prior to 2017.
Core earnings and core earnings per share also differ from net income attributable to common
stockholders and earnings per common share, respectively, by excluding specified infrequent or unusual
transactions that Farmer Mac believes are not indicative of future operating results and that may not reflect

13
the trends and economic financial performance of Farmer Mac's core business. For example, the loss from
retirement of the Farmer Mac II LLC Preferred Stock in first quarter 2015 has been excluded from core
earnings and core earnings per share because it is not a frequently occurring transaction and not indicative
of future operating results. This is also consistent with Farmer Mac's previous treatment of these types of
origination costs associated with securities underwriting that are capitalized and deferred during the life of
the security. For a reconciliation of Farmer Mac's net income attributable to common stockholders to core
earnings and of earnings per common share to core earnings per share, see the "Reconciliations" section
below.
Net Effective Spread
Farmer Mac uses net effective spread to measure the net spread Farmer Mac earns between its
interest-earning assets and the related net funding costs of these assets. Net effective spread differs from
net interest income and net interest yield because it excludes (1) the amortization of premiums and discounts
on assets consolidated at fair value that are amortized as adjustments to yield in interest income over the
contractual or estimated remaining lives of the underlying assets, and (2) interest income and interest
expense related to consolidated trusts with beneficial interests owned by third parties, which are presented
on Farmer Mac's consolidated balance sheets as "Loans held for investment in consolidated trusts, at
amortized cost." Farmer Mac excludes from net effective spread premiums and discounts on assets
consolidated at fair value because they either do not reflect actual cash premiums paid for the assets at
acquisition or are not expected to have an economic effect on Farmer Mac's financial performance if the
assets are held to maturity, as is expected. Farmer Mac also excludes from net effective spread the interest
income and interest expense associated with the consolidated trusts and the average balance of the loans
underlying these trusts to reflect management's view that the net interest income Farmer Mac earns on the

14
related Farmer Mac Guaranteed Securities owned by third parties is effectively a guarantee fee.
Accordingly, the excluded interest income and interest expense associated with consolidated trusts is
reclassified to guarantee and commitment fees for purposes of determining Farmer Mac's core earnings.
Net effective spread also principally differs from net interest income and net interest yield because
it includes the accrual of income and expense related to the contractual amounts due on financial derivatives
that are not designated in hedge accounting relationships ("undesignated financial derivatives"). Farmer
Mac uses interest rate swaps to manage its interest rate risk exposure by synthetically modifying the interest
rate reset or maturity characteristics of certain assets and liabilities. The accrual of the contractual amounts
due on interest rate swaps designated in hedge accounting relationships is included as an adjustment to the
yield or cost of the hedged item and is included in net interest income. For undesignated financial
derivatives, Farmer Mac records the income or expense related to the accrual of the contractual amounts
due in "Gains/(losses) on financial derivatives and hedging activities" on the consolidated statements of
operations. However, the accrual of the contractual amounts due for undesignated financial derivatives are
included in Farmer Mac's calculation of net effective spread, which is intended to reflect management's view
of the net spread between an asset and all of its related funding, including any associated derivatives,
whether or not they are in a hedge accounting relationship. For a reconciliation of net interest income and
net interest yield to net effective spread, see the "Reconciliations" section below.
Forward-Looking Statements
Management's expectations for Farmer Mac's future necessarily involve a number of assumptions
and estimates and the evaluation of risks and uncertainties. Various factors or events, both known and

15
unknown, could cause Farmer Mac's actual results to differ materially from the expectations as expressed
or implied by the forward-looking statements herein, including uncertainties regarding:
• the availability to Farmer Mac of debt and equity financing and, if available, the reasonableness
of rates and terms;
• legislative or regulatory developments that could affect Farmer Mac, its sources of business, or
the agricultural or rural utilities industries;
• fluctuations in the fair value of assets held by Farmer Mac and its subsidiaries;
• the rate and direction of development of the secondary market for agricultural mortgage and rural
utilities loans, including lender interest in Farmer Mac's products and the secondary market
provided by Farmer Mac;
• the general rate of growth in agricultural mortgage and rural utilities indebtedness;
• the effect of economic conditions, including the effects of drought and other weather-related
conditions and fluctuations in agricultural real estate values, on agricultural mortgage lending
and borrower repayment capacity;
• developments in the financial markets, including possible investor, analyst, and rating agency
reactions to events involving government-sponsored enterprises, including Farmer Mac;
• changes in the level and direction of interest rates, which could, among other things, affect the
value of collateral securing Farmer Mac's agricultural mortgage loan assets;
• the degree to which Farmer Mac is exposed to basis risk, which results from fluctuations in
Farmer Mac's borrowing costs relative to market indexes such as LIBOR; and
• volatility in commodity prices relative to costs of production and/or export demand for U.S.
agricultural products.
Other risk factors are discussed in "Risk Factors" in Part I, Item 1A in Farmer Mac's Annual Report
on Form 10-K for the year ended December 31, 2016 filed with the U.S. Securities and Exchange
Commission ("SEC") on March 9, 2017 and in the Quarterly Report on Form 10-Q for the quarter ended
March 31, 2017 filed with the SEC earlier today. In light of these potential risks and uncertainties, no undue
16
reliance should be placed on any forward-looking statements expressed in this release. The forward-looking
statements contained in this release represent management's expectations as of the date of this release.
Farmer Mac undertakes no obligation to release publicly the results of revisions to any forward-looking
statements included in this release to reflect new information or any future events or circumstances, except
as otherwise mandated by the SEC. The information contained in this release is not necessarily indicative
of future results.
Earnings Conference Call Information
The conference call to discuss Farmer Mac's first quarter 2017 financial results will be held
beginning at 11:00 a.m. eastern time on Wednesday, May 10, 2017 and can be accessed by telephone or live
webcast as follows:
Telephone (Domestic): (888) 346-2616
Telephone (International): (412) 902-4254
Webcast: https://www.farmermac.com/investors/events-presentations/
Presentation materials to be referenced during the call will be posted on the webpage that can be
accessed by clicking on the link noted above. When dialing in to the call, please ask for the conference
chairman Tim Buzby. The call can be heard live and will also be available for replay on Farmer Mac’s
website for two weeks following the conclusion of the call.
More complete information about Farmer Mac's performance for first quarter 2017 is set forth in
Farmer Mac's Annual Report on Form 10-Q for the period ended March 31, 2017 filed today with the SEC.

17
About Farmer Mac
Farmer Mac is a vital part of the agricultural credit markets and was created to increase access to
and reduce the cost of capital for the benefit of American agricultural and rural communities. As the nation’s
premier secondary market for agricultural credit, we provide financial solutions to a broad spectrum of the
agricultural community, including agricultural lenders, agribusinesses, and other institutions that can benefit
from access to flexible, low-cost financing and risk management tools. Farmer Mac‘s customers benefit
from our low cost of funds, low overhead costs, and high operational efficiency. In fact, we are often able
to provide the lowest cost of borrowing to agricultural and rural borrowers. For more than a quarter-century,
Farmer Mac has been delivering the capital and commitment rural America deserves. Additional
information about Farmer Mac (including the Annual Report on Form 10-K and Quarterly Report on Form
10-Q referenced above) is available on Farmer Mac's website at www.farmermac.com.
CONTACT: Jalpa Nazareth, Investor Relations
Megan Murray-Pelaez, Media Inquiries
(202) 872-7700
* * * *
18
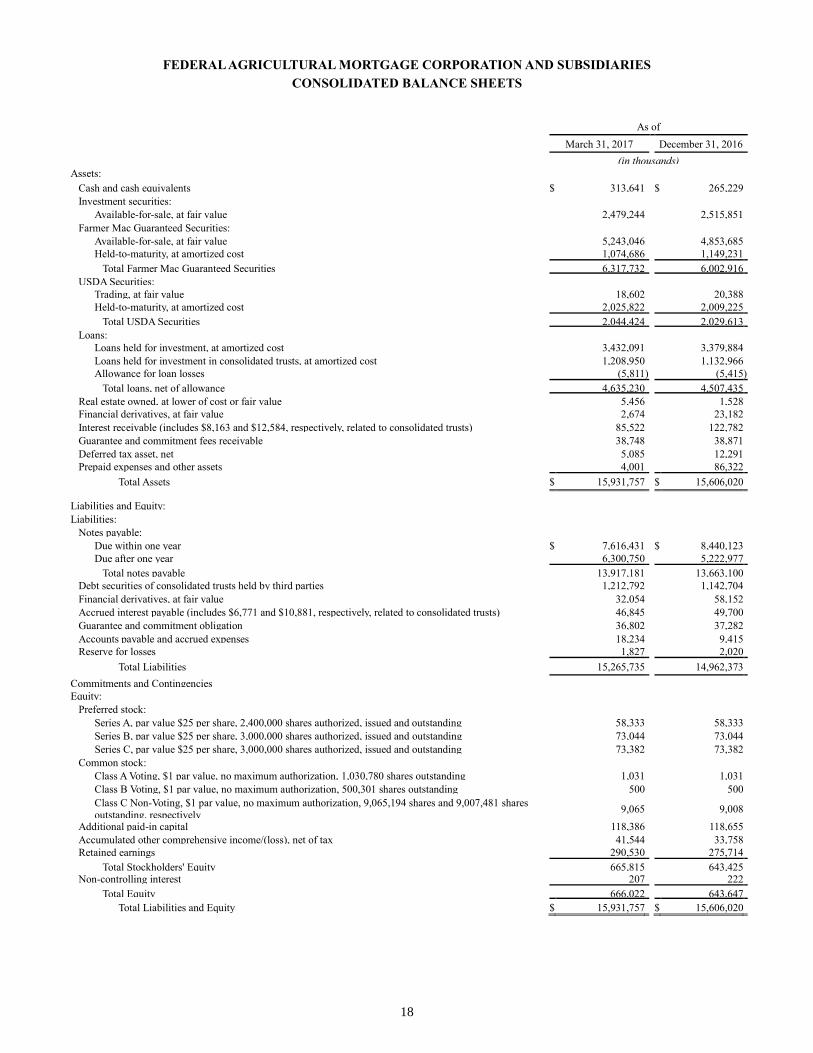
FEDERAL AGRICULTURAL MORTGAGE CORPORATION AND SUBSIDIARIES
CONSOLIDATED BALANCE SHEETS
As of
March 31, 2017 December 31, 2016
(in thousands)
Assets: Cash and cash equivalents $ 313,641 $ 265,229 Investment securities:
Available-for-sale, at fair value 2,479,244 2,515,851 Farmer Mac Guaranteed Securities:
Available-for-sale, at fair value 5,243,046 4,853,685 Held-to-maturity, at amortized cost 1,074,686 1,149,231
Total Farmer Mac Guaranteed Securities 6,317,732 6,002,916 USDA Securities:
Trading, at fair value 18,602 20,388 Held-to-maturity, at amortized cost 2,025,822 2,009,225
Total USDA Securities 2,044,424 2,029,613 Loans:
Loans held for investment, at amortized cost 3,432,091 3,379,884 Loans held for investment in consolidated trusts, at amortized cost 1,208,950 1,132,966 Allowance for loan losses (5,811 ) (5,415 )
Total loans, net of allowance 4,635,230 4,507,435 Real estate owned, at lower of cost or fair value 5,456 1,528 Financial derivatives, at fair value 2,674 23,182 Interest receivable (includes $8,163 and $12,584, respectively, related to consolidated trusts) 85,522 122,782 Guarantee and commitment fees receivable 38,748 38,871 Deferred tax asset, net 5,085 12,291 Prepaid expenses and other assets 4,001 86,322
Total Assets $ 15,931,757 $ 15,606,020
Liabilities and Equity: Liabilities:
Notes payable: Due within one year $ 7,616,431 $ 8,440,123 Due after one year 6,300,750 5,222,977
Total notes payable 13,917,181 13,663,100 Debt securities of consolidated trusts held by third parties 1,212,792 1,142,704 Financial derivatives, at fair value 32,054 58,152 Accrued interest payable (includes $6,771 and $10,881, respectively, related to consolidated trusts) 46,845 49,700 Guarantee and commitment obligation 36,802 37,282 Accounts payable and accrued expenses 18,234 9,415 Reserve for losses 1,827 2,020
Total Liabilities 15,265,735 14,962,373
Commitments and Contingencies Equity:
Preferred stock: Series A, par value $25 per share, 2,400,000 shares authorized, issued and outstanding 58,333 58,333 Series B, par value $25 per share, 3,000,000 shares authorized, issued and outstanding 73,044 73,044
Series C, par value $25 per share, 3,000,000 shares authorized, issued and outstanding 73,382 73,382 Common stock:
Class A Voting, $1 par value, no maximum authorization, 1,030,780 shares outstanding 1,031 1,031 Class B Voting, $1 par value, no maximum authorization, 500,301 shares outstanding 500 500 Class C Non-Voting, $1 par value, no maximum authorization, 9,065,194 shares and 9,007,481 shares outstanding, respectively
9,065 9,008
Additional paid-in capital 118,386 118,655 Accumulated other comprehensive income/(loss), net of tax 41,544 33,758 Retained earnings 290,530 275,714
Total Stockholders' Equity 665,815 643,425 Non-controlling interest 207 222
Total Equity 666,022 643,647 Total Liabilities and Equity $ 15,931,757 $ 15,606,020

19
FEDERAL AGRICULTURAL MORTGAGE CORPORATION AND SUBSIDIARIES
CONSOLIDATED STATEMENTS OF OPERATIONS
For the Three Months Ended
March 31, 2017 March 31, 2016
(in thousands, except per share amounts)
Interest income:
Investments and cash equivalents $ 7,243 $ 6,681
Farmer Mac Guaranteed Securities and USDA Securities 42,522 35,510
Loans 36,852 31,700
Total interest income 86,617 73,891
Total interest expense 49,546 40,251
Net interest income 37,071 33,640
Provision for loan losses (637 ) (49 )
Net interest income after provision for loan losses 36,434 33,591
Non-interest income/(loss):
Guarantee and commitment fees 3,844 3,626
Gains/(losses) on financial derivatives and hedging activities 2,486 (6,782 )
(Losses)/gains on trading securities (82 ) 358
Losses on sale of available-for-sale investment securities — (9 )
Losses on sale of real estate owned (5 ) —
Other income 553 101
Non-interest income/(loss) 6,796 (2,706 )
Non-interest expense:
Compensation and employee benefits 6,317 5,774
General and administrative 3,800 3,526
Regulatory fees 625 613
Real estate owned operating costs, net — 39
(Release of)/provision for reserve for losses (193 ) 14
Non-interest expense 10,549 9,966
Income before income taxes 32,681 20,919
Income tax expense 10,786 7,335
Net income 21,895 13,584
Less: Net loss attributable to non-controlling interest 15 28
Net income attributable to Farmer Mac 21,910 13,612
Preferred stock dividends (3,295 ) (3,295 )
Net income attributable to common stockholders $ 18,615 $ 10,317
Earnings per common share and dividends:
Basic earnings per common share $ 1.76 $ 0.99
Diluted earnings per common share $ 1.73 $ 0.94
Common stock dividends per common share $ 0.36 $ 0.26

20
Reconciliations
A reconciliation of Farmer Mac's net income attributable to common stockholders to core earnings
and core earnings per share are presented in the following tables along with a breakdown of the
composition of core earnings for the periods indicated:
Reconciliation of Net Income Attributable to Common Stockholders to Core Earnings
For the Three Months Ended
March 31, 2017 December 31, 2016 March 31, 2016
(in thousands, except per share amounts)
Net income attributable to common stockholders $ 18,615 $ 25,465 $ 10,317
Less reconciling items:
Gains/(losses) on financial derivatives and hedging activities due to
fair value changes 4,805 17,233
(2,989 )
Unrealized (losses)/gains on trading securities (82 ) (474 ) 358
Amortization of premiums/discounts and deferred gains on assets
consolidated at fair value (127 ) (40 ) (281 )
Net effects of settlements on agency forward contracts 32 1,024 (255 )
Income tax effect related to reconciling items (1,620 ) (6,210 ) 1,109
Sub-total 3,008 11,533 (2,058 )
Core earnings $ 15,607 $ 13,932 $ 12,375
Composition of Core Earnings:
Revenues:
Net effective spread(1) $ 32,866 $ 31,928 $ 29,949
Guarantee and commitment fees(2) 5,317 5,158 4,669
Other(3) 1,061 1,189 (517 )
Total revenues 39,244 38,275 34,101
Credit related expense (GAAP):
Provision for losses 444 512 63
REO operating expenses — — 39
Losses on sale of REO 5 — —
Total credit related expense 449 512 102
Operating expenses (GAAP):
Compensation and employee benefits 6,317 5,949 5,774
General and administrative 3,800 4,352 3,526
Regulatory fees 625 625 613
Total operating expenses 10,742 10,926 9,913
Net earnings 28,053 26,837 24,086
Income tax expense(4) 9,166 9,581 8,444
Net loss attributable to non-controlling interest (GAAP) (15 ) 28 (28 )
Preferred stock dividends (GAAP) 3,295 3,296 3,295
Core earnings $ 15,607 $ 13,932 $ 12,375
Core earnings per share:
Basic $ 1.48 $ 1.33 $ 1.18
Diluted 1.45 1.30 1.12

21
(1) Net effective spread is a non-GAAP measure. See below for a reconciliation of net interest income to net effective spread.
(2) Includes interest income and interest expense related to consolidated trusts owned by third parties reclassified from net interest income to guarantee and
commitment fees to reflect management's view that the net interest income Farmer Mac earns is effectively a guarantee fee on the consolidated Farmer
Mac Guaranteed Securities.
(3) Reflects reconciling adjustments for the reclassification to exclude expenses related to interest rate swaps not designated as hedges and fair value
adjustments on financial derivatives and trading assets and a reconciling adjustment to exclude the recognition of deferred gains over the estimated lives
of certain Farmer Mac Guaranteed Securities and USDA Securities. First quarter 2017 includes $1.0 million of fees received upon the inception of swaps
cleared through CME and $0.5 million of hedging losses, compared to $0.1 million of fees received and $0.9 million of hedging losses, respectively, in
first quarter 2016.
(4) Includes the tax impact of non-GAAP reconciling items between net income attributable to common stockholders and core earnings. First quarter 2017
includes $0.7 million of tax benefits upon the vesting of restricted stock and the exercise of SARs under new accounting guidance for stock-based awards
that became effective in first quarter
Reconciliation of GAAP Basic Earnings Per Share to Core Earnings Basic Earnings Per Share
For the Three Months Ended
March 31,
2017 December 31,
2016 March 31,
2016
(in thousands, except per share amounts)
GAAP - Basic EPS $ 1.76 $ 2.42 $ 0.99
Less reconciling items:
Gains/(losses) on financial derivatives and hedging activities due to fair value changes 0.45 1.63 (0.28 )
Unrealized (losses)/gains on trading securities (0.01 ) (0.05 ) 0.03
Amortization of premiums/discounts and deferred gains on assets consolidated at fair value (0.01 ) —
(0.03 )
Net effects of settlements on agency forward contracts — 0.10 (0.02 )
Income tax effect related to reconciling items (0.15 ) (0.59 ) 0.11
Sub-total 0.28 1.09 (0.19 )
Core Earnings - Basic EPS $ 1.48 $ 1.33 $ 1.18
Shares used in per share calculation (GAAP and Core Earnings) 10,551 10,512 10,465
Reconciliation of GAAP Diluted Earnings Per Share to Core Earnings Diluted Earnings Per Share
For the Three Months Ended
March 31,
2017 December 31,
2016 March 31,
2016
(in thousands, except per share amounts)
GAAP - Diluted EPS $ 1.73 $ 2.38 $ 0.94
Less reconciling items:
Gains/(losses) on financial derivatives and hedging activities due to fair value changes 0.45 1.60 (0.26 )
Unrealized (losses)/gains on trading securities (0.01 ) (0.04 ) 0.03
Amortization of premiums/discounts and deferred gains on assets consolidated at fair
value (0.01 ) — (0.03 )
Net effects of settlements on agency forward contracts — 0.10 (0.02 )
Income tax effect related to reconciling items (0.15 ) (0.58 ) 0.10
Sub-total 0.28 1.08 (0.18 )
Core Earnings - Diluted EPS $ 1.45 $ 1.30 $ 1.12
Shares used in per share calculation (GAAP and Core Earnings) 10,782 10,700 11,003

22
The following table presents a reconciliation of net interest income and net yield to net effective
spread for the periods indicated:
Reconciliation of GAAP Net Interest Income/Yield to Net Effective Spread
For the Three Months Ended
March 31, 2017 December 31, 2016 March 31, 2016
Dollars Yield Dollars Yield Dollars Yield
(dollars in thousands)
Net interest income/yield $ 37,071 0.96 % $ 36,713 0.95 % $ 33,640 0.88 %
Net effects of consolidated trusts (1,472 ) 0.03 % (1,369 ) 0.04 % (1,043 ) 0.02 %
Expense related to undesignated financial derivatives (2,867 ) (0.08 )% (3,495 ) (0.10 )% (2,669 ) (0.08 )%
Amortization of premiums/discounts on assets consolidated at fair value 134 — % 79
— % 21
— %
Net effective spread $ 32,866 0.91 % $ 31,928 0.89 % $ 29,949 0.82 %

23
The following table presents core earnings for Farmer Mac's reportable operating segments and a
reconciliation to consolidated net income for the three months ended March 31, 2017:
Core Earnings by Business Segment
For the Three Months Ended March 31, 2017
Farm & Ranch
USDA Guarantees
Rural Utilities
Institutional Credit Corporate
Reconciling Adjustments
Consolidated Net Income
(in thousands)
Net interest income $ 12,754 $ 5,283 $ 2,948 $ 13,502 $ 2,584 $ — $ 37,071
Less: reconciling adjustments(1)(2)(3) (2,070 ) (580 ) (309 ) (921 ) (325 ) 4,205 —
Net effective spread 10,684 4,703 2,639 12,581 2,259 4,205 —
Guarantee and commitment fees(2) 4,295 74 492 455 — (1,472 ) 3,844
Other income/(expense)(3)(4) 194 14 5 — 843 1,896 2,952
Non-interest income/(loss) 4,489 88 497 455 843 424 6,796
Provision for loan losses (637 ) — — — — — (637 )
Release of reserve for losses 193 — — — — — 193
Other non-interest expense (4,065 ) (1,087 ) (587 ) (1,521 ) (3,482 ) — (10,742 )
Non-interest expense(5) (3,872 ) (1,087 ) (587 ) (1,521 ) (3,482 ) — (10,549 )
Core earnings before income taxes 10,664 3,704 2,549 11,515 (380 ) 4,629 (6) 32,681
Income tax (expense)/benefit (3,732 ) (1,296 ) (892 ) (4,030 ) 785 (1,621 ) (10,786 )
Core earnings before preferred stock dividends and attribution of
income to non-controlling interest 6,932
2,408
1,657
7,485
405
3,008
(6) 21,895
Preferred stock dividends — — — — (3,295 ) — (3,295 )
Non-controlling interest — —
—
—
15
—
15
Segment core earnings/(losses) $ 6,932 $ 2,408 $ 1,657 $ 7,485 $ (2,875 ) $ 3,008 (6) $ 18,615
Total assets at carrying value $ 3,693,360 $ 2,109,264 $ 1,005,187 $ 6,315,591 $ 2,808,355 $ — $ 15,931,757
Total on- and off-balance sheet
program assets at principal balance $ 6,240,467 $ 2,149,697
$ 1,868,794
$ 7,585,583
—
$ 17,844,541

24
(1) Excludes the amortization of premiums and discounts on assets consolidated at fair value, originally included in interest income, to reflect core earnings
amounts.
(2) Includes the reclassification of interest income and interest expense from consolidated trusts owned by third parties to guarantee and commitment fees, to
reflect management's view that the net interest income Farmer Mac earns is effectively a guarantee fee.
(3) Includes the reclassification of interest expense related to interest rate swaps not designated as hedges, which are included in "Gains/(losses) on financial
derivatives and hedging activities" on the consolidated financial statements, to determine the effective funding cost for each operating segment.
(4) Includes reconciling adjustments for fair value adjustments on financial derivatives and trading assets. Also includes a reconciling adjustment related to
the recognition of deferred gains over the estimated lives of certain Farmer Mac Guaranteed Securities and USDA Securities. In 2016 and prior periods,
fair value adjustments on financial derivatives included variation margin payment amounts because those amounts were considered to be collateral of the
related exposure and were accounted for as unrealized gains or losses. However, effective first quarter 2017, CME implemented a change in its rules
related to the exchange of variation margin, whereby variation margin payments are considered a partial settlement of the respective derivatives contracts
rather than as pledged collateral, and accounted for as realized gains and losses. See Note 4 for more information about this rule change. Farmer Mac
believes that even though these variation margin amounts are now accounted for as realized gains or losses on financial derivatives and hedging activities
as a result of the CME rule change, their economic character will remain the same as they were before the change. The exchange of variation margin,
whether considered a partial settlement of or the pledge of collateral under a derivatives contract, is not expected to have a cumulative net impact on
Farmer Mac's financial condition or results of operations reported in accordance with GAAP because the related financial instruments are expected to be
held to maturity. Therefore, beginning in 2017, this reconciling adjustment includes realized gains and losses on financial derivatives centrally cleared
through CME resulting from the exchange of variation margin. As a result, core earnings subsequent to 2016 will be presented on a consistent basis with
core earnings in 2016 and prior periods.
(5) Includes directly attributable costs and an allocation of indirectly attributable costs based on staffing.
(6) Net adjustments to reconcile to the corresponding income measures: core earnings before income taxes reconciled to income before income taxes; core
earnings before preferred stock dividends and attribution of income to non-controlling interest reconciled to net income; and segment core earnings
reconciled to net income attributable to common stockholders.
25
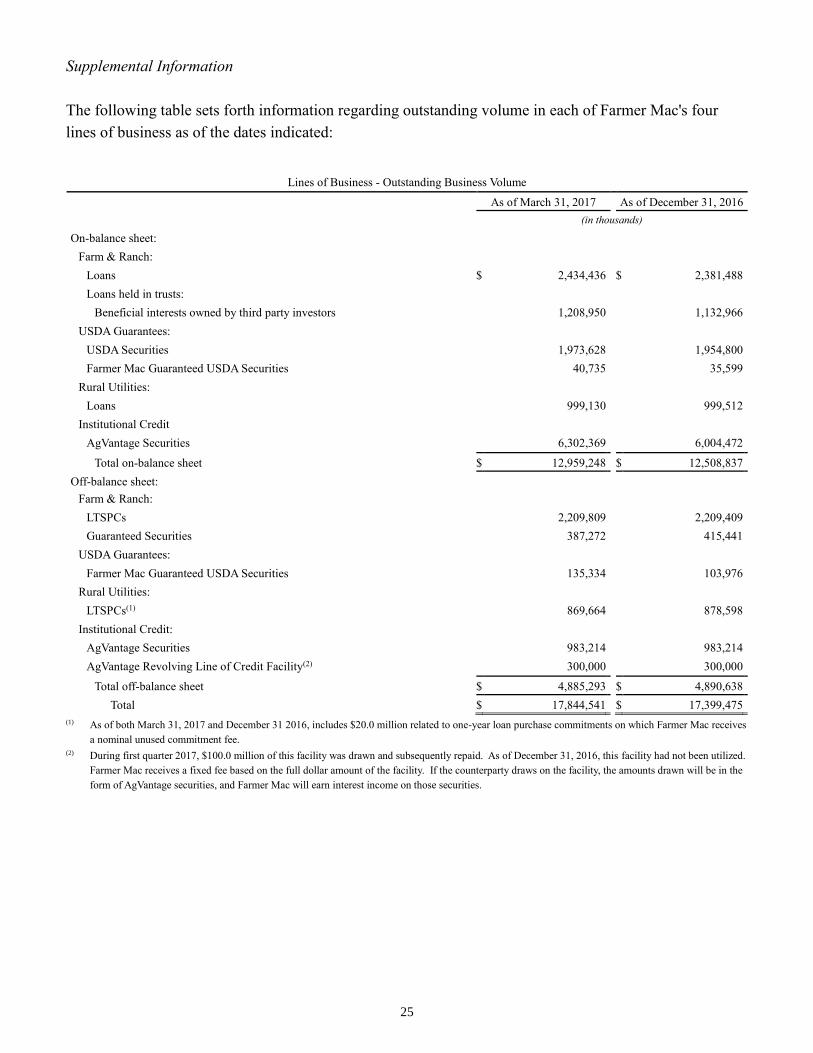
Supplemental Information
The following table sets forth information regarding outstanding volume in each of Farmer Mac's four
lines of business as of the dates indicated:
Lines of Business - Outstanding Business Volume
As of March 31, 2017 As of December 31, 2016
(in thousands)
On-balance sheet:
Farm & Ranch:
Loans $ 2,434,436 $ 2,381,488
Loans held in trusts:
Beneficial interests owned by third party investors 1,208,950 1,132,966
USDA Guarantees:
USDA Securities 1,973,628 1,954,800
Farmer Mac Guaranteed USDA Securities 40,735 35,599
Rural Utilities:
Loans 999,130 999,512
Institutional Credit
AgVantage Securities 6,302,369 6,004,472
Total on-balance sheet $ 12,959,248 $ 12,508,837
Off-balance sheet:
Farm & Ranch:
LTSPCs 2,209,809 2,209,409
Guaranteed Securities 387,272 415,441
USDA Guarantees:
Farmer Mac Guaranteed USDA Securities 135,334 103,976
Rural Utilities:
LTSPCs(1) 869,664 878,598
Institutional Credit:
AgVantage Securities 983,214 983,214
AgVantage Revolving Line of Credit Facility(2) 300,000 300,000
Total off-balance sheet $ 4,885,293 $ 4,890,638
Total $ 17,844,541 $ 17,399,475
(1) As of both March 31, 2017 and December 31 2016, includes $20.0 million related to one-year loan purchase commitments on which Farmer Mac receives
a nominal unused commitment fee.
(2) During first quarter 2017, $100.0 million of this facility was drawn and subsequently repaid. As of December 31, 2016, this facility had not been utilized.
Farmer Mac receives a fixed fee based on the full dollar amount of the facility. If the counterparty draws on the facility, the amounts drawn will be in the
form of AgVantage securities, and Farmer Mac will earn interest income on those securities.

26
The following table presents the quarterly net effective spread by segment:
Net Effective Spread by Line of Business
Farm & Ranch USDA Guarantees Rural Utilities Institutional Credit Corporate Net Effective
Spread
Dollars Yield Dollars Yield Dollars Yield Dollars Yield Dollars Yield Dollars Yield
(dollars in thousands)
For the quarter ended:
March 31, 2017(1) $ 10,684 1.80 % $ 4,703 0.91 % $ 2,639 1.06 % $ 12,581 0.82 % $ 2,259 0.32 % $ 32,866 0.91 %
December 31, 2016 10,349 1.78 % 5,334 1.08 % 2,623 1.05 % 11,627 0.78 % 1,995 0.26 % 31,928 0.89 %
September 30, 2016 10,703 1.90 % 5,189 1.07 % 2,643 1.05 % 11,427 0.75 % 2,237 0.24 % 32,199 0.86 %
June 30, 2016 9,875 1.78 % 4,588 0.96 % 2,562 1.03 % 11,407 0.77 % 2,594 0.29 % 31,026 0.84 %
March 31, 2016 9,461 1.71 % 4,308 0.91 % 2,538 1.02 % 11,090 0.80 % 2,552 0.26 % 29,949 0.82 %
December 31, 2015 9,381 1.72 % 4,518 0.96 % 2,845 1.14 % 10,899 0.80 % 2,306 0.26 % 29,949 0.85 %
September 30, 2015 9,628 1.80 % 4,630 0.99 % 2,907 1.18 % 11,271 0.81 % 1,951 0.25 % 30,387 0.88 %
June 30, 2015 9,681 1.82 % 4,466 0.98 % 2,838 1.18 % 10,860 0.78 % 1,942 0.25 % 29,787 0.88 %
March 31, 2015(2) 10,114 1.97 % 4,225 0.95 % 2,804 1.15 % 10,425 0.77 % 1,689 0.20 % 29,257 0.86 %
(1) Net effective spread is a non-GAAP measure. See "Non-GAAP Measures" for a reconciliation of GAAP net interest income by line of business to net effective
spread by line of business.
(2) Beginning in first quarter 2015, Farmer Mac revised its methodology for interest expense allocation among the Farm & Ranch, USDA Guarantees, and Rural
Utilities lines of business. As a result of this revision, a greater percentage of interest expense has been allocated to the longer-term assets included within the
USDA Guarantees and Rural Utilities lines of business.

27
The following table presents quarterly core earnings reconciled to net income attributable to common
stockholders:
Core Earnings by Quarter Ended
March 2017
December 2016
September 2016
June 2016
March 2016
December 2015
September 2015
June 2015
March 2015
(in thousands)
Revenues: Net effective spread $ 32,866 $ 31,928 $ 32,199 $ 31,026 $ 29,949 $ 29,949 $ 30,387 $ 29,787 $ 29,257
Guarantee and commitment fees 5,317 5,158 4,533 4,810 4,669 4,730 4,328 4,085 4,012
Other 1,061 1,189 (32 ) (125 ) (517 ) (284 ) (93 ) (24 ) (405 )
Total revenues 39,244 38,275 36,700 35,711 34,101 34,395 34,622 33,848 32,864
Credit related (income)/expense:
Provision for/(release of) losses 444 512 (31 ) 458 63 (49 ) (303 ) 1,256 (696 )
REO operating expenses — — — — 39 44 48 — (1 )
(Gains)/losses on sale of REO 5 — (15 ) — — — — — 1
Total credit related
(income)/expense 449
512
(46 ) 458
102
(5 ) (255 ) 1,256
(696 )
Operating expenses:
Compensation and employee
benefits 6,317
5,949
5,438
5,611
5,774
5,385
5,236
5,733
5,693
General and administrative 3,800 4,352 3,474 3,757 3,526 3,238 3,676 3,374 2,823
Regulatory fees 625 625 613 612 613 613 600 600 600
Total operating expenses 10,742 10,926 9,525 9,980 9,913 9,236 9,512 9,707 9,116
Net earnings 28,053 26,837 27,221 25,273 24,086 25,164 25,365 22,885 24,444
Income tax expense(1) 9,166 9,581 9,497 8,956 8,444 8,855 8,924 8,091 6,692
Net (loss)/income attributable to non-controlling interest (15 ) 28
(18 ) (16 ) (28 ) (60 ) (36 ) (119 ) 5,354
Preferred stock dividends 3,295 3,296 3,295 3,296 3,295 3,296 3,295 3,296 3,295
Core earnings $ 15,607 $ 13,932 $ 14,447 $ 13,037 $ 12,375 $ 13,073 $ 13,182 $ 11,617 $ 9,103
Reconciling items:
Gains/(losses) on financial derivatives and hedging activities
due to fair value changes 4,805
17,233
1,460
(2,076 ) (2,989 ) 2,743
(6,906 ) 15,982
(895 )
Unrealized (losses)/gains on
trading assets (82 ) (474 ) 1,182
394
358
696
(8 ) 170
362
Amortization of
premiums/discounts and deferred gains on assets consolidated at fair
value
(127 ) (40 ) (157 ) (371 ) (281 ) (263 ) (117 ) (125 ) (814 )
Net effects of settlements on agency forward contracts 32
1,024
464
466
(255 ) (162 ) (390 ) 197
(252 )
Loss on retirement of Farmer Mac II LLC Preferred Stock —
—
—
—
—
—
—
—
(8,147 )
Income tax effect related to reconciling items (1,620 ) (6,210 ) (1,032 ) 556
1,109
(1,055 ) 2,598
(5,679 ) 2,461
Net income attributable to
common stockholders $ 18,615
$ 25,465
$ 16,364
$ 12,006
$ 10,317
$ 15,032
$ 8,359
$ 22,162
$ 1,818
(1) First quarter 2017 includes $0.7 million of tax benefits upon the vesting of restricted stock and the exercise of SARs associated with new accounting
guidance for stock-based awards that became effective in first quarter 2017.