Embed Size (px)
Citation preview
2 | P a g e
2011 - 2025
South African
Agricultural
Production Strategy
3 | P a g e
Table of Contents
TABLE OF CONTENTS ...................................................................................................................... 3
1 EXECUTIVE SUMMARY ............................................................................................................ 7
Salient Features of the Sector .............................................................................................................. 7
Problem Statement ............................................................................................................................ 10
Purpose Statement ............................................................................................................................ 11
Strategic Goals .................................................................................................................................. 13
Strategic Objectives: .......................................................................................................................... 13
Strategic Interventions ....................................................................................................................... 14
The Farmers Development Programme / Act ..................................................................................... 14
The Food Security Programme / Act .................................................................................................. 15
2 THE ROLE OF THE AGRICULTURAL PRODUCTION SECTOR ....................................... 16
3 SOUTH AFRICA’S AGRICULTURAL DEVELOPMENT STRATEGIES AND POLICIES 18
Strategic Policies ............................................................................................................................... 19
4 THE POLICY FRAMEWORK OF THE SOUTH AFRICAN AGRICULTURAL
PRODUCTION STRATEGY ............................................................................................................. 22
5 SOUTH AFRICA’S NATURAL GROWTH POTENTIAL ....................................................... 25
5.1 Protection of Agricultural Land .............................................................................................. 27
5.2 Land Cover / Land Use ......................................................................................................... 28
5.3 Status of Natural Resources ................................................................................................. 30
5.4 Land Capability ..................................................................................................................... 33
5.5 Production Suitability ............................................................................................................ 38
6 THE SOUTH AFRICAN AGRICULTURAL PRODUCTION SECTOR................................. 39
6.1 Commodity Production Analysis ............................................................................................ 39
6.1.1 Maize Industry ................................................................................................................ 39
6.1.2 Wheat Industry ............................................................................................................... 40
6.1.3 Grain Sorghum Industry .................................................................................................. 43
6.1.4 Sunflower Seed Industry ................................................................................................. 45
6.1.5 Poultry Industry............................................................................................................... 46
4 | P a g e
6.1.6 Beef Industry .................................................................................................................. 48
6.1.7 Mutton Industry ............................................................................................................... 49
6.1.8 Pork Industry .................................................................................................................. 51
6.1.9 Fruit Industry .................................................................................................................. 52
6.1.10 Viticulture Industry .......................................................................................................... 56
6.1.11 Aquaculture Industry ....................................................................................................... 57
7 PRODUCTION AND ECONOMIC PERFORMANCE, PROFITABILITY AND FOOD
AFFORDABILITY .............................................................................................................................. 58
7.1 Production Performance – ensuring food availability.............................................................. 58
7.2 Economic Performance of the Agricultural Production Sector ................................................ 62
7.3 Profitability of the Agricultural Production Sector ................................................................... 63
7.4 Food Affordability .................................................................................................................. 70
7.5 The Required Synergy between Food Production, Food Availability, and the Profitability of the Agricultural Production Sector, in order to ensure National Food Security........................................... 73
8 THE SOUTH AFRICAN AGRICULTURAL STRATEGIC PLAN.......................................... 75
8.1 Key Challenges..................................................................................................................... 75
8.2 Strategic Goals: .................................................................................................................... 76
8.3 Strategic Objectives: ............................................................................................................. 76
8.4 Focus Groups ....................................................................................................................... 77
8.5 Strategic Interventions .......................................................................................................... 77
8.5.1 The Food Security Act / Programme ............................................................................... 77
8.5.2 The Farmer Development Act / Programme .................................................................... 78
8.5.2.6 Agricultural Spatial Economic Development System .............................................................. 81
9 IMPLEMENTATION FRAMEWORK ........................................................................................ 83
REFERENCE LIST ................................................................................................................................ 89
List of Tables
Table 1 Land capability classes for South Africa .................................................................................... 35
Table 2: Wine Production (2003 – 2007) ................................................................................................ 57
5 | P a g e
Table 3: Wine Exports during the past 5 (2003 – 2007) .......................................................................... 57
Table 4: Aquaculture Production in South Africa .................................................................................... 57
Table 5: Sector contributions to GDP since 1965 ................................................................................... 62
Table 6: GDP contribution, 1990 and 2004 (%) ...................................................................................... 63
Table 7- SA abalone farming 2008 – Profitability .................................................................................... 69
List of Figures
Figure 1: Interaction between humans and the environment ................................................................... 27
Figure 2: Demarcated agricultural land according to Act 70 of 1970 ....................................................... 28
Figure 3: Aridity zones in South Africa ................................................................................................... 30
Figure 4: Annual rainfall ......................................................................................................................... 31
Figure 5: Slope Percentage ................................................................................................................... 32
Figure 6: Grazing Potential .................................................................................................................... 33
Figure 7: Land capability classification for South Africa .......................................................................... 36
Figure 8: Spatial Data ............................................................................................................................ 37
Figure 9: Agro-ecological zones for Ekhurhuleni Metropolitan Municipality – Gauteng ............................ 38
Figure 10: Maize Production and Consumption ..................................................................................... 39
Figure 11: Maize Exports and Imports ........................................................................................................
Figure 12: Wheat: Production, available for consumption and, per capita ............................................... 41
Figure 13: Wheat Exports and Imports ................................................................................................... 42
Figure 14: Sorghum: Production, available for consumption and per capita consumption (1990-2009).... 43
Figure 15: Sorghum: Exports and Imports .............................................................................................. 44
Figure 16: Sunflower Seed Production & Consumption .......................................................................... 45
Figure 17: Sunflower and Seed Exports and Imports .............................................................................. 46
Figure 18: Poultry: Production, available for consumption and ................................................................ 46
Figure 19: Poultry Exports and Imports .................................................................................................. 47
Figure 20: Beef: Production, available for consumption and ................................................................... 48
6 | P a g e
Figure 21: Beef: Production, available for consumption and per capita consumption (1990-2009)
Figure 22: Mutton: Production, available for consumption and per capita consumption (1990-2009) ....... 49
Figure 23: Mutton Exports vs Imports ..................................................................................................... 50
Figure 24: Pork: Production, available for consumption and per capita consumption (1990-2009)........... 51
Figure 25: Pork Exports vs Imports ........................................................................................................ 52
Figure 26: Deciduous and subtropical fruit: Production, consumption and per capit consumption ........... 53
Figure 27: Deciduous fruit export Destinations ....................................................................................... 54
Figure 28: Subtropical fruit export .......................................................................................................... 56
Figure 29: Indices of the Volume of Agricultural Production .................................................................... 59
Figure 30: Area planted with the principal field crops .............................................................................. 59
Figure 31: Total output of the principal field crops .................................................................................. 60
Figure 32: Yields of the principle field crops ........................................................................................... 61
Figure 33: Yields Self-Sufficiency Indices of selected agricultural commodities ...................................... 61
Figure 34: The contribution of agriculture to GDP since 1911 ................................................................. 63
Figure 35: Gross Value of Agricultural Production, 2004/05-2008/09 (July - June) .................................. 64
Figure 36: Gross Income of Agricultural Producers (GFI) 2004-2008 (January – December) .................. 66
Figure 37: Gross Income from Major Products, 2007/08 vs 2008/09 (July to June) ................................. 66
Figure 38: Real gross and net farm income 1990-2007 .......................................................................... 67
Figure 39: Average Return on Agricultural Investment 1990-2007 .......................................................... 68
Figure 40: Distribution of income by farming units, 2002 ........................................................................ 68
Figure 41: The monthly cost of a typical consumer food basket for the period January 2007 to December
2008 ...................................................................................................................................................... 71
Figure 42: Real farm-to-retail price spread of brown bread and white bread (January 2005 to December
2008) ..................................................................................................................................................... 72
Figure 44: An Overview of the Strategic Plan ......................................................................................... 84
Figure 45: Implementation Framework ................................................................................................... 87
7 | P a g e
1 Executive Summary
For the past 2-3 years, midst a global threat on the availability and affordability of basic food
products, plunging most countries into a threatening food crisis, governments debated and re-
looked at the role agriculture plays both economically and socially. It is argued within the context
of this document, further supported by the ANC‘s Polokwane resolutions, agriculture have a
fundamental role to play in industrialisation and development, and that the role of agricultural
production lies in:
1. the qualitative and quantitative production of food for the purpose of
ensuring national food security;
2. the economic growth and development of agriculture, and in;
3. rural economic development.
It is within this context that the South African Agricultural Production Strategy seeks to position
primary agriculture production for the purpose of improving the national food safety and security,
and agricultural economic output in a profitable and sustainable manner, through a qualitative
and quantitative improvement of South Africa‘s agricultural productivity, productive efficiency,
trade and regulatory environment for all commodity groups. Given the scope and nature of
agriculture and by achieving the aforementioned, rural economic growth and development can
be fuelled to increase rural employment, alleviate the plight of the poor, who mostly reside in
rural areas and stimulate off-farm industrial development. Investment in non-farm economic
activities will also be stimulated due to the primary sector‘s strong backward and forward
linkages.
Salient Features of the Sector
In order to put the South African Agricultural Production Strategy in perspective it is necessary
to consider the salient features of the sector. The agricultural production environment is dualistic
and has the following features:
Commercial agriculture:
Made up of less than 40,000 farming units;
Covers a production area of approximately 82 million hectares;
Is responsible for more than 99 % of South Africa‘s formal marketed agricultural output;
8 | P a g e
There has been a significant increase in the concentration of farm holdings as a result of
smaller and less efficient farms, unable to take advantage of increasing economies of
scale, being forced out of the sector;
Despite the decrease in the number of farming units, output from commercial agriculture
has continued to grow, implying an increase in the efficiency of production;
Export growth has exploded, especially in the horticultural sector. Trade figures show
farm exports of South Africa increased from, R45 bn in 2008 to R46 bn in 2009 while
imports decreased by 8,5 % to R35 bn in 2009.
The sector has however become more sustainable in environmental terms.
Smallholder agriculture:
Consists of 1.3 million farming households;
Farm an estimated 14 million hectares of agricultural land;
Is concentrated principally in the former homeland areas of the country, thus
marginalized into regions of poor productive land, with little or no infrastructural support,
and water resources.
The smallholder farmers thus typically have low levels of production efficiency, and
engage in agricultural production to supplement their household food requirements, with
surplus sold at local markets.
Smallholder farmers‘ production inefficiency is further related to their lack in sufficient
farm management skills e.g. natural resource management, production and
infrastructural management etc.
This is further exacerbated by poor support services directed at smallholder farmers e.g.
financial services, technical support, access to transport and other support infrastructure.
Subsistent agriculture:
There is currently a lack of sufficient data regarding the subsistent sector.
Subsistent farmers practice agriculture mainly for household consumption. However,
recent studies have shown an increase in dependence on market purchases by both
urban and rural households, in some cases reaching 90 % of the food supplies.
Subsistence and smallholder agriculture can however play an important role in reducing
the vulnerability of rural and urban food-insecure households, improving livelihoods, and
helping to mitigate against high food price inflation.
9 | P a g e
Production:
Between 1990 and 2009, field crop production increased by 13 %, horticultural
production by 62 %, and animal products by 29 %.
The largest component of agricultural production currently is animal products.
Data reflect the increasing importance of horticultural exports as a share of total
agricultural output.
Variations in crop production are largely derived from the variability in maize production,
which is in turn influenced by climatic conditions, producers‘ willingness to plant, and in
industry average yields.
Farmers‘ willingness to produce, in turn, is influenced by the profitability of production,
i.e. price offers, both domestically and internationally, and the suitability of the natural
resource base. The tradeoffs between these factors influence the affordability and
availability of food.
Self-sufficiency levels are currently below domestic consumption requirements for most
principled food commodities and are supplemented by increasing import levels. On
average, agricultural production increased by 30 % over the mentioned period, while the
population increased by 32 %.
Research conducted by South Africa‘s competition commission further suggests that an
increase in anti-competitive behaviour, negatively impacts food productivity, food
availability and affordability within the country. High food prices may therefore not be a
function of low levels of production, climate change and profitability alone.
Contribution to the economy:
Share of GDP ≈ 3 % in 2005-2007 (down from 9.1 % in 1965). Its small direct
contribution tends to overshadow the many other positive contributions this sector
makes to the economy;
o Secondary growth generation is approximately 20 to 30 %;
Has some of the strongest backward, forward and employment multipliers in the
economy;
Provides a social welfare net to the most vulnerable in society, especially in rural areas;
8 % of total employment by primary agriculture. It is however concerning that agriculture
has lost 50 % of its employment during1970-95, especially in light of the fact that it has
one of the strongest employment multipliers in the economy;
10 | P a g e
The sector as a whole is a net earner of foreign exchange. However, cognisance must
be taken that the processed food sector is a net importer.
Equity in the sector:
Although all agricultural strategies and programmes devised by the department since
1995 aimed to deracialise the sector via land and labour market reforms, the sector
continues to wrestle with entrenched inequalities.
Support to the sector:
The commercial, smallholder, and subsistence farmers currently receive less support
from the state than most of their counterparts in every industrial country in the world;
these are also the markets where South African agricultural exports must compete;
Measured in terms of the internationally accepted benchmark, namely the producer
support estimate or PSE as calculated by the OECD, direct support provided to the
agricultural sector in South Africa is similar to countries like Chile and Brazil. There is
furthermore clear indication that these two countries are making efforts to increase
support to their agricultural sectors in various ways. The level of support offered to these
producers, including South Africa, is considerably lower than the OECD average of
26 %; and
The total cost of support to the agricultural sector, measured as a percentage of the
GDP, decreased from 1 % between 1995 and 1997, to 0.59 % between 2005 and 2007.
This is considerably lower than the average of 0.97 % for developed countries. The
difference in the total cost of support measured in value terms is significant if one
consider the enormous difference between the GPP‘s of developed countries and that of
a country like South Africa.
Problem Statement
Although all agricultural strategies and programmes devised by the department since 1995
aimed to deracialise the sector, via land and labour market reforms, the sector continues to
wrestle with entrenched inequalities.
Despite the agricultural sector becoming more profitable and more productive, i.e.:
11 | P a g e
The average return on investment generated by the agricultural sector increased from a
low of 7 % in 1992 to a high of 19.5 % in 2002;
Field crop production increased by 13 %, horticultural production by 62 %, and animal
products by 29 %, between 1990 and 2009;
More recent statistics show an average increase of 11.8 % in the volume of agricultural
production, an increase of 19.7 % in the total gross value of agricultural production, and
a R7.5 billion increase in net profit over 12 months ended June 2008.
..per capita production of food is currently at an all time low, i.e. production of principled foods
are currently lower than consumption requirements and are supplemented by increasing levels
of imports.
However, South Africa‘s self-sufficiency indices are influenced by farmers‘ decision to plant and
export, which are in turn influenced by prices offered domestically vs internationally; the
profitability of production; and climatic conditions. Farmers‘ decision-making process has thus
far been poorly supported, due to the poor management and dissemination of required
information. Furthermore, without the consumer and national food security as priority within this
critical decision-making process, mitigation between these factors (food production, food
availability, profitability of production, and affordability of food) has remained ad hoc.
Furthermore, South Africa‘s farming units have consolidated from 60,000 farms in 2002 to
40,000 currently, decreasing the competitiveness of the sector domestically. Increasing
differences between farm and retail prices for certain products such as wheat, maize, and
chicken further suggest that food prices are influenced by pricing and costing structure across
the value chain. Although an in-depth analysis on pricing and costing structures across the
production value chain is required, we would like to argue that there are disparities between
production levels, food availability, and food affordability. This thus suggests that increased food
prices are also a product of market costing and pricing structure, rather than solely a result of
food demand and decreased production levels.
Purpose Statement
The South African Agricultural Production Strategy seeks to position primary agriculture by
targeting subsistence, smallholder and commercial production for the purpose of improving
national food safety and security and agricultural economic output in a profitable and
sustainable manner, through a qualitative and quantitative improvement of South Africa‘s
12 | P a g e
agricultural productivity, production efficiency and trade and regulatory environment for all
commodity groups. It furthermore seeks to stimulate rural economic growth and development.
The agricultural production sector, in adhering to national government priorities, will furthermore
effect broad based black economic empowerment, and rural economic development, by
addressing growing inequality and decreasing competitiveness within the agricultural production
sector. This becomes the focal point of this strategy through the support of subsistence farmers,
smallholder, and struggling commercial farmers. Improving and up-scaling government support
to these farmers is central to improving the competitiveness and productivity of the sector, in
turn stimulating rural economic development and influencing food availability and food
affordability.
13 | P a g e
Strategic Goals
To increase the entry levels into commercial agriculture;
To improve the national agricultural economic output and national food safety and security
through a qualitative and quantitative improvement of South Africa‘s agricultural productivity,
productive efficiency, trade and regulatory environment, and the spatial management of
information and knowledge systems for all commodity groups;
To improve agricultural support services, the regulatory framework, and the competitive
advantage for commodity sectors, according to their needs and requirements as stated in
their respective commodity strategies;
To stimulate rural economic growth and development, by stimulating spatial economic
planning and implementation, further serving as an incentive for investment in rural areas.
Strategic Objectives:
Improve the food security, policy and legislative framework to mitigate against high
global food prices and market manipulation;
To improve the domestic and global competitiveness of the South African agricultural
sector;
Create formal platforms of interaction, between government and industry, to serve as
platforms of dialogue, during planning, monitoring and evaluation processes;
To improve national coordination and management of government support services
to farmers, and decentralised support services in the form of local Agricultural
Development Service Centres;
To address the decreasing production levels among the smallholder and subsistence food
producers through commodity-based experiential training and mentorship academies,
as a prerequisite to government financial support;
To improve the government‘s planning capacity at national, provincial and local levels,
through the formulation and installation of knowledge and information management
systems, e.g. decision support systems.
These objectives will be achieved through the following Strategic Interventions:
14 | P a g e
Strategic Interventions
The Farmers Development Programme / Act
The aim of the Farmers Development Programme / Act is to improve the entry levels of
smallholder farmers into commercial agriculture, to create space for smallholder farmers to grow
their businesses where this suits their strategies, to ensure a growing and competitive
commercial sector, and to counter the effect of a growing concentration of farms, through
supporting:
market development programmes with specially generated markets for smallholder farmers;
infrastructure development programmes aimed at smallholder farmers;
improved access to development finance for smallholder farmers;
improved access to information, knowledge and training resources;
improved planning and implementation of farming practices; and
improved natural resource management, through spatial information management, and
planning systems.
This strategy furthermore seeks to stimulate rural economic growth by stimulating agricultural
development through a commodity based, value chain approach to spatial planning, both at a
provincial and local level. Through the Farmers Development Programme / Act, spatial planning
initiatives will:
identify areas where key commodities (including maize, wheat, beef, dairy, sheep, fruit and
aquaculture) are most suited for production at a local level, further informed by market and
trade analyses;
use the information on the agricultural land potential to further plan for infrastructural and
market development within the respective areas;
use Decision Support Systems (Knowledge and Information Management Systems) to
support decision makers and planners of agricultural development, both within government
and industry;
list commodities identified for domestic production, as priority at a national and provincial
level in terms of farmer support programmes offered.
While as national government we have a responsibility to provide a stimulating environment for
industry to grow and prosper, we also carry the responsibility of ensuring that all South Africans
15 | P a g e
benefit from the economic growth of the country. Ensuring national food security is thus a
priority, and forms part of government‘s national imperative and development indicators.
The Food Security Programme / Act
Food security exists when all people, at all times, have physical and economic access to
sufficient, safe and nutritious food to meet their dietary needs and food preferences for an active
and healthy life (Cotula, 2008). Although the Food Security Act / Programme lacks a policy
framework, this strategy identifies five pillars of food security, i.e. food availability, affordability,
stability of supply, access and utilisation. As primary agricultural production clearly affects food
availability, affordability and supply, a legislative framework is required to ensure the proper
mitigation between all factors impacting the availability, affordability and supply of principled
foods, with the objective of realising national food security, and achieving the right to food, for
all. The Act therefore aims to:
1. identify food insecure communities through knowledge and information management
systems, able to provide continuous and updated analysis of the state of food insecurity
at a national, provincial and local level.
2. ensure qualitative and quantitative production of principled food commodities within
identified food insecure communities;
3. ensure that, where South Africa are unable to produce profitably, sufficient levels are
imported;
4. ensure that, where South Africa are able to produce food efficiently and sufficiently, the
domestic market does not strain under farmers‘ decision to export, and that exports are
not at the expense of national food security;
5. ensure the profitability of production of identified priority commodities, in this way
ensuring farmers are always to gain from the production of principled food commodities;
and
6. to ensure that food prices and food affordability are not compromised at the expense of
the above mentioned factors.
Furthermore, an interrelated dependency between agricultural production and agro-processing
clearly affects performance of the agricultural sector as a whole, including food prices. A
16 | P a g e
commodity based, value-chain approach is thus required for ensuring a prosperous agricultural
production sector, and to effectively mitigate against increasing food prices.
In devising the Agricultural Production Strategy, it is thus important that clear linkages are
forged between agricultural production and agro-processing, which covers:
1. Market development
2. Food availability and affordability
2 THE ROLE OF THE AGRICULTURAL PRODUCTION
SECTOR
The food price crisis of 2007/08 reopened the debate on the role of agriculture in social and
economic development, a role that comes at a time when most countries are dealing with a 2-3
year plunge into a growing food crisis. Questions as to why most countries are experiencing a
food crisis, have spurned governments to revisit the role agriculture plays both socially and
economically. The fundamental role that agriculture plays in development has long been
recognised by agricultural development scholars and practitioners. Agriculture has historically
been seen as a source of contributions that helped induce industrial growth and a structural
transformation of the economy (Byerlee, de Janvry, & Sadoulet, 2009; Timmer & Akkus, 2008).
However, industrialisation policies often taxed agriculture, while integrated rural development
policies aimed at the alleviation of rural poverty were difficult to implement. The result was a
decades-long neglect of agriculture, despite the experience of China, where the benefits of
agriculture-based growth could be seen clearly. In addition, globalisation, integrated value
chains, rapid technological and institutional innovations, and environmental constraints have
deeply changed the context for agriculture's role. This strategy argues that agriculture's multiple
functions for development in triggering economic growth, rural development, reducing poverty,
and in providing national food security, must be recognised.
Byerlee, et al., (2009) summarise the historical growth of the ―classical view‖ on the role that
agriculture plays in economic development. In the classical view industrial development was
required for economic growth, and agriculture supported growth in the industrial sector. This
approach was supported by empirical studies of the growth path of the Western economies and
by the experience of the ―Asian miracle‖ economies.
17 | P a g e
Despite broad acceptance of the structural transformation paradigm, recent studies reflect a
need to rethink agriculture‘s role in development for two reasons outlined by Byerlee, et al.,
(2009). ―First, the structural transformation models even with their more nuanced view of the
role of agriculture still see agriculture as the ―handmaiden‖ of industrialization‖ (Byerlee et al.,
2009). Second, even within a broader paradigm of agriculture for development, the world in
which agriculture operates has changed drastically due to globalisation, new technologies and
institutions, and new more demanding markets has spurred rapid growth in the demand for
agricultural exports, especially for higher value products, reducing developing countries‘ output
of basic foods, and opening the potential to cheaper imported foods.
Some of these changes are favourable while others need to be guarded against. Expanded
markets for labour-intensive non-traditional exports create new opportunities for farmers in
developing countries, but they leave further challenges in the implementation of the
development agenda, such as the dependence on global markets for cheaper imported foods,
which left many countries that have chosen this route vulnerable to soaring, unstable global
food prices.
Furthermore, the competitiveness of agriculture in developing countries and the viability of the
smallholder, subsistence farmer are called into question by restricted access to proprietary
technological innovations, economies of scale in provisioning more demanding supply chains,
and a declining role and capacity of the state in servicing the small farm sector.
South African agriculture faces many of these same challenges. This strategy argues that, even
in the dramatically changed context of the 21st century, agriculture remains critical to South
Africa‘s development agenda in meeting four central strategic objectives as guided by the South
African Agricultural Sector Plan:
1. Ensure increased access and participation in the sector
2. Ensuring household food security, and national food security, by ensuring food
availability and affordability
3. Ensuring sustainable natural resource management
4. Ensuring sound agricultural economic growth that maximises positive spillover effects
into the rest of the economy
18 | P a g e
3 SOUTH AFRICA’S AGRICULTURAL DEVELOPMENT
STRATEGIES AND POLICIES
Policy interventions can affect the direction and rate of change in the performance of any sector,
and also play a critical role in the production performance of agriculture. A detailed evaluation of
the implementation of South African policies is, therefore, critical in the assessment and
planning of South Africa‘s strategic interventions for improved agricultural production.
In this regard, a distinction can be made between sector-wide policies and those that affect
agricultural production directly. The former includes the four main agricultural policy thrusts of
the post-1994 era, which had both a direct and an indirect impact on agricultural production. In
chronological order these were (Vink, Tregurtha and Kirsten, 2008):
First, the liberalisation of agricultural trade under the Marrakech Agreement and its
Agreement on Agriculture, along with South Africa‘s own trade liberalisation agenda in
the period 1994-1996. During this period, South Africa moved away from the direct
controls over the import and export of agricultural commodities that had characterised
the era of the Control Boards, and put tariff equivalent protection in place. These tariffs
were then subject to the agreed reductions under the Agreement. However, at the same
time the government unilaterally liberalised the SACU tariff structure by reducing both
the level and the number of tariff lines. The result is that agricultural producers in general
have little protection (with significant exceptions such as red meat, wine, etc.), and face
the typical structure of tariff escalation, whereby processed food products are more
heavily protected than the raw materials.
Second, government started to dismantle the elaborate structure of direct subsidies that
had been in place, only available to predominantly white commercial farmers for
decades (in many instances from before 1945). These subsidies took the form of
assistance with on-farm infrastructure (e.g. dams, fencing, irrigation works), with
conservation works (contouring, prevention of soil erosion, etc.) with general
infrastructure such as grain silos, railroad spurs and sidings and so forth. Whilst the aim
was to stop all government programmes which perpetuated racial discrimination, it is
also clear that, in the process of dismantling such support programme that prospective
black emerging farmers were too denied the same level of support. Government did
subsequently try and put alternative support structures and services in place for
19 | P a g e
emerging farmers and for land reform beneficiaries in the form of the BATAT and CASP
programmes, but these were unable to provide the required support at levels which
could undo the legacies of apartheid, midst a changing market environment (see below).
Third, government commenced with a range of programmes to regulate the use of land,
water resources and farm labour which had considerable impact on farming. The aim of
the land reform programme was to provide restitution to those who were disadvantaged
under apartheid legislation, and to provide additional opportunities to those who were
discriminated against under the previous regime. Unfortunately the land reform
programme have not succeeded in providing the type and level of support required, and
its failure has now placed additional strain on the agricultural sector. In short, while
farmers were confronted with deregulated and liberalised markets for the products they
produced (see below), they were also facing increasing regulation and other forms of
state intervention in the markets for the goods and services they procure in order to
produce.
Fourth, the system of control over the marketing of agricultural products that had been
put in place since the 1930s was dismantled in a so-called ‗big bang‘ deregulation in
1997. The result was that, by early 1998, statutory intervention in agriculture had all but
ceased, with a few exceptions such as the right of industry bodies to levy funds from
farmers to pay for activities such as industry information, generic product promotion,
research and empowerment activities.
Strategic Policies
Within the context of government‘s development agenda, N. Vink et al. (2008) identify five main
strategic policy documents that shaped South African agriculture post 1994:
1. Broadening Access to Agriculture Thrust (BATAT);
2. The White Paper on Agricultural Policy;
3. The Agricultural Policy in South Africa Discussion document;
4. The Strategic Plan for South African Agriculture, “Sector Plan”; and
5. The Accelerated and Shared Growth Initiative for South Africa (ASGISA).
20 | P a g e
The key focus of these strategic policies was to tackle past economic and social inequalities
since the end of white rule in 1994. While South Africa‘s policy changes allowed government to
take up a number of initiatives to support subsistence and smallholder farmers, implementation
thereof remained project based (Ruth Hall, 2009), with little or ineffective impact on output by
the targeted ―previously disadvantaged black communities‖.
In reviewing South Africa‘s strategic policies, we start with the Broadening Access to Agriculture
Thrust (BATAT) of the mid-1990sincluded farmer support and production loans. However, this
programme failed to materialise. The Farmer Settlement Programme (FSP), which was
responsible for post-settlement agricultural support to land reform beneficiaries, had no
dedicated budget until 2004. The FSP, now renamed the Livelihoods Development Support
Programme, has limited reach and impact, rather than being a mechanism for restructuring the
economic and market environment for smallholder and subsistence farmers (National Treasury,
2007; Ruth Hall, 2009).
Lacking a comprehensive approach to changing and providing an enabling environment in
which smallholder and subsistence farmers could develop into viable commercial enterprises,
the Comprehensive Agricultural Support Programme (CASP) was established in 2004. The
function of this new programme is to support new farmers. CASP is currently allocated R750
million over the three-year medium-term expenditure framework (MTEF). However,
implementation of CASP followed a similar path as that of FSP, mainly providing on-farm
infrastructural support, lacking the comprehensive support it was intended to provide.
Recently, an evaluation of the implementation of the Sector Plan, which assessed the extent to
which the intended objectives and outcomes had been realised over the past five years, was
conducted (N. Vink et al., 2008). The accompanying performance scorecard suggested that
good progress was made in some areas, such as sustainable resource management, while
other areas, such as equitable access and participation, still required urgent attention (N. Vink &
Kirsten, 2002).
Although all strategies devised by the department since 1995 state the importance of support for
the commercial and small-scale farmers (smallholder and subsistence), currently they receive
less support from the state than their counterparts in every industrial country in the world with
the exception of New Zealand (N. Vink et al., 2008). Direct support to agriculture, as measured
by the OECD, is expressed as a percentage of gross farming income (NAMC, 2008). This is
referred to as the producer support estimate or PSE, and was as follows for the period of 2005
21 | P a g e
to 2007: Chile (4 %), Brazil (6 %), South Africa (6 %), China (9 %), Ukraine (9 %) and Russia
(14 %) (NAMC, 2008). The level of support offered to producers is considerably lower than the
OECD average of 26 % (NAMC, 2008).
Direct support to producers in South Africa shows a declining tendency over the period 1995 to
2001 (NAMC, 2008). The largest part of this support is in the form of price support, for example
tariffs on some categories of imports (NAMC, 2008). However, it is worth mentioning that the
price gap between international and national prices declined from 13 % between 1995 and
1997, to only 5 % for the period 2005 to 2007 (NAMC, 2008). In other words, the protection
received by agriculture in general by means of tariffs substantially decreased (NAMC, 2008).
Despite this, the value of support to agriculture in the form of general services (support that is
not specifically linked to a commodity, such as extension services), has increased (NAMC,
2008). The largest amounts are linked to the implementation of the land reform programme
(NAMC, 2008). The total cost of support to the agricultural sector, measured as a percentage of
the GDP, decreased from 1 % between 1995 and 1997 to 0.59 % between 2005 and 2007
(NAMC, 2008). This is considerably lower than the average of 0.97 % for developed countries
(NAMC, 2008).
Despite these challenges, performance data, as discussed in the following sections, indicate
that the commercial sector has done relatively well since the early 1990s, with the real gross
value of production of the commercial sector up from some R35 bn in 1994/95 to close to
R50 bn in 2007 (in rand values from the year 2000), and a real net farm income has remained at
around R10 bn, also in rand values from 2000. While changes in the contribution of subsistence
and smallholder farmers to agriculture is unclear, there is some evidence that ineffective farmer
support programmes have prevented land reform beneficiaries from contributing to total output,
and have resulted in a decline in agricultural production in the communal farming areas, leaving
these farmers more vulnerable to global market changes than the commercial farmer. Improving
the design, planning and execution of Farmer Support Programmes thus becomes critical for
increased production in the smallholder sector and for greater integration with the commercial
farming sector.
In summary, government at this stage still lacks policy through which an economic and market
environment can be provided for the transformation of South Africa‘s agricultural sector, whilst
maintaining productivity and production efficiency for purposes of ensuring national food
security.
22 | P a g e
Furthermore, uncoordinated implementation and planning by government further frustrated the
effective impact of government strategy, with each programme designing its own
implementation plan, leaving a fragmented scatter of projects across South Africa‘s landscape.
The realisation of the change we aim to effect through our strategies critically depends on our
ability to translate policy objectives into effective strategic, implementation plans, and monitoring
and evaluation systems. The poor performance of South Africa‘s strategic plans and policies
may not lie in their content, but in the lack of effective implementation, continuous monitoring
and evaluation of progress made, and resultant corrective action.
More importantly is the disjointed implementation of government strategies. Cooperative
governance requires effective management across all three spheres of government, sector
organisations, and farmers. Without an integrated approach and effective management of
actions, roles and responsibilities, most strategies devised by the department will result in
ineffective implementation.
To date, therefore, South Africa‘s agricultural strategies and policies have not succeeded in
providing effective support on a meaningful scale for the smallholder and subsistence farmers,
while the sector is still plagued by dualism between the two parts of the sector.
4 The Policy Framework of the South African
Agricultural Production Strategy
The policy framework of the South African Agricultural Production Strategy falls within the
broader policy areas as stated within the White Paper on Agriculture (NDA, 1995) and The
Strategic Plan of South African Agriculture i.e. Sector Plan (NDA, 1995), in the following
manner:
The Food Security Programme / Act‘s purpose to address national and household food security
through the mitigation of factors contributing to increasing food prices, and the provision of
household food security, through information management systems, and household production
systems, is supported by the first policy area of the White Paper on Agriculture, stating that:
23 | P a g e
1.1 National and household food security are equally important and must be addressed from a
multidimensional point of view.
The Farmer Development Programme / Act, which seeks to improve agricultural economic
development and planning; improve and decentralise support services; forge stronger linkages
between science and technology development, farmers and industry; improve and localise
commodity specific research, training and mentorship packages; speaks to the following policy
areas of the White Paper on Agriculture:
1.2 Agriculture is an important sector for social and economic growth and development in rural areas, and will be recognised and promoted as such.
1.3 The research and institutional infrastructure of South Africa is important for the development
of agriculture in Africa.
1.5 Agricultural practices which take into account the highly variable weather conditions and limited agricultural potential of South Africa, will continuously be developed and applied in their local context.
1.6 Services to farmers will be rendered in an equitable manner which discourages existing and potentially discriminatory practices and allows the benefits of development to be more widely distributed, taking into account that access to resources, scale of production, use of purchased inputs and volume of marketable produce differ from farmer to farmer.
1.7 The regulatory framework for agriculture will be scale neutral and will facilitate participation
in production and marketing by new entrants to farming.
1.8 Affirmative action programmes will be focused on South Africans with a low income who were previously denied access to opportunities in agriculture, and will ensure access to
agricultural resources, credit and farmer-support services.
1.9 Government agricultural programmes should contribute to the independence and selfreliance of all participants in the agricultural sector.
1.10 Agricultural support programmes will be designed in such a manner as to improve the
quality of life, skills and productivity of farmers and farm workers.
1.11 Government agricultural programmes will be aimed at specific objectives and will, subject to preassessment, evaluation and monitoring within predetermined time frames, operate on the
basis of voluntary participation.
1.12 Agricultural support services will be rendered to farmers who participate in land-reform programmes.
1.13 Social subsidy programmes should not jeopardise the realisation of the economic viability
of the agricultural sector.
24 | P a g e
The South African Agricultural Production Strategy furthermore speaks to the National Industrial
Policy Framework (NIPF) of the Department of Trade and Industry (DTI). The main objectives of
the NIPF are (DTI, 2007a):
To facilitate diversification beyond our current reliance on traditional commodities and
nontradeable services. This requires the promotion of increased value-addition per
capita, characterised particularly by movement into non-traditional tradeable goods and
services that are competitive in both export markets and the domestic economy.
The long-term intensification of South Africa‘s industrialisation process, and movement
towards a twenty-first century knowledge economy.
The promotion of a more labour-absorbing industrialisation path with a particular
emphasis on tradeable labour-intensive goods and services and economic linkages that
catalyse employment creation.
The promotion of a broader-based industrialisation path characterised by greater levels
of participation by historically disadvantaged economic citizens and marginalised regions
in the mainstream of the industrial economy.
Contributing to industrial development in Africa, with a strong emphasis on building
regional productive capabilities.
Under the Industrial Policy Action Plan, a range of policy actions for immediate implementation
are identified. These include sectoral actions which identifies that ―further strategy work needs
to be developed within Agriculture and Agroprocessing‖ (DTI, 2007b). The sub-programmes
Agro-Processing within DTI and Agricultural Production within DAFF, have therefore been
tasked with developing strategies in their respective sectors.
There is, however, a policy gap which speaks to achieving the progressive realisation of the
right to adequate food, within the context of agricultural production and national food security. It
is therefore recommended that policies be developed for Agricultural Production and Food
Security, which speaks to:
The right to food as a tool to mitigate potential trade-offs between different factors
influencing food affordability, distribution and availability (e.g. differences between farm
25 | P a g e
and retail prices, the importance of profitable production, climate coping strategies and
food security needs). Policy is required that manages the interface between agriculture
and food security.
Knowledge and Information Management Systems on food security, crop yield and
livestock production, and forecasting.
Partnerships between national, provincial, and local research institutions, farmers and
extension.
The ability of the commercial sector to respond to increased market opportunities, which
will ultimately determine any gains from global trade liberalisation.
Community-based disaster risk reduction systems (e.g. national and sub-national early
warning systems).
Sustainable water management.
Capacity-building and technology transfer.
5 SOUTH AFRICA’S NATURAL GROWTH POTENTIAL
Agriculture and its related activities is an important industry in any developing country. It is not
only regarded as an economic asset, but it also assists with the creation of jobs and alleviation
of poverty. However, a much more important factor is the crucial role that agriculture has to play
in feeding a nation (Collett, 2008).
South Africa as a country is no exception to this fact. Unfortunately the harsh environmental
conditions found in the country make it very difficult to produce crops with sustained high yields.
The variance in the climate and types of soil places heavy demands on the producers, also
bearing in mind that the country has a limited amount of high potential agricultural land for
sustained crop production. This fact also does not include the impact of external factors on
agriculture such as production management skills, cultivation practices and economic variances.
Knowledge of the land, the shortcomings and possibilities forms the basis of any successful and
sustainable farming production. Over the years research in agriculture together with the
practical experience gained by farmers has enabled South Africa, notwithstanding the harsh
26 | P a g e
environmental conditions, to become largely self-sufficient in its agricultural production and even
resulted in surpluses being made available for export.
Sustainable farming practices is therefore of the utmost importance to ensure national food
security. One of the most important components of sustainability is the effective management of
natural resources.
The increased demand on the limited natural resource base carries a detrimental impact on the
environment. This is mainly attributed to ineffective land use planning, subsequent ineffective
management and implementation of land use plans, the excessive use of herbicides and
pesticides impacting on the quality of the water resources, the use of selective cultivation
methods that are not suitable for the area concerned, cultivation of areas that are not suitable
for agricultural production, unsuitable irrigation practices, and the lack of soil conservation
practices (Collett, 2008).
DEAT (2006) refers to a conference on the Human Environment, hosted by the United Nations
(UN) in 1972, where it points out that economic growth, if not carefully monitored, would
overshoot the earth‘s ability to renew and maintain its resources to ensure future life and
development. This concern was confirmed by the fact that in 2001 the global ecological footprint
(people‘s natural resource consumption) was 2.2 global ha per person, whilst the productive
area of the biosphere was estimated at an average of 1.8 global ha per person – translating into
the fact that earth‘s resources are being spent faster than they are generated (DEAT, 2006).
The South African ecological footprint is currently 2.8 global ha per person, higher than the
world‘s average, ranking South Africa 42nd out of 148 countries (DEAT, 2006). Between 1991
and 2001, there was an increase of the per capita footprint by 2 % and a decrease of the bio-
capacity per capita by 4 % (DEAT, 2006). It can therefore be concluded that there is an increase
in pressures on the environment.
A sustainable farm on the other hand is defined as ―a farm where the existing and potential
farming activities, considered in concert with the participants and the environment, are such that
the farm remains viable in the foreseeable future and in harmony with its social and
environmental context when operated on a standalone basis and without extraneous
intervention (Aihoon, Cherry, & Kassier, 2007).
27 | P a g e
LAND MANAGEMENT
FOOD PRODUCTION
NATURAL RESOURCE BASE
WATER CLIMATE SOIL
HUMANS
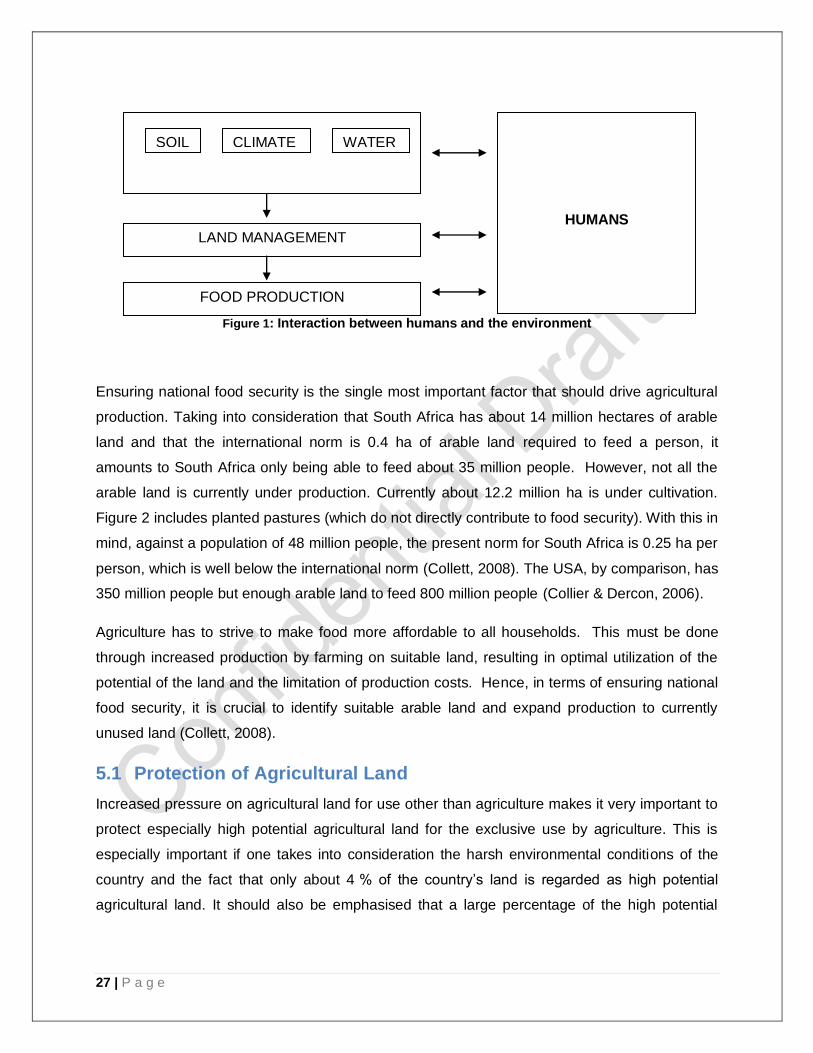
Figure 1: Interaction between humans and the environment
Ensuring national food security is the single most important factor that should drive agricultural
production. Taking into consideration that South Africa has about 14 million hectares of arable
land and that the international norm is 0.4 ha of arable land required to feed a person, it
amounts to South Africa only being able to feed about 35 million people. However, not all the
arable land is currently under production. Currently about 12.2 million ha is under cultivation.
Figure 2 includes planted pastures (which do not directly contribute to food security). With this in
mind, against a population of 48 million people, the present norm for South Africa is 0.25 ha per
person, which is well below the international norm (Collett, 2008). The USA, by comparison, has
350 million people but enough arable land to feed 800 million people (Collier & Dercon, 2006).
Agriculture has to strive to make food more affordable to all households. This must be done
through increased production by farming on suitable land, resulting in optimal utilization of the
potential of the land and the limitation of production costs. Hence, in terms of ensuring national
food security, it is crucial to identify suitable arable land and expand production to currently
unused land (Collett, 2008).
5.1 Protection of Agricultural Land
Increased pressure on agricultural land for use other than agriculture makes it very important to
protect especially high potential agricultural land for the exclusive use by agriculture. This is
especially important if one takes into consideration the harsh environmental conditions of the
country and the fact that only about 4 % of the country‘s land is regarded as high potential
agricultural land. It should also be emphasised that a large percentage of the high potential
28 | P a g e
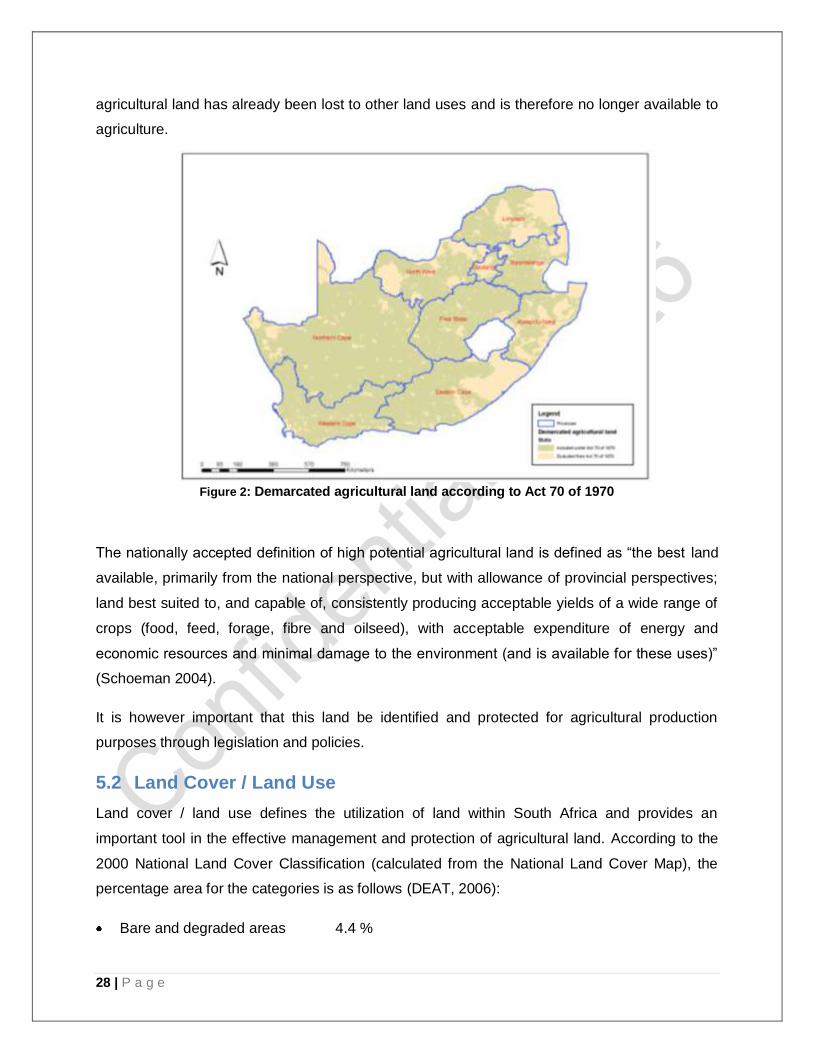
agricultural land has already been lost to other land uses and is therefore no longer available to
agriculture.
Figure 2: Demarcated agricultural land according to Act 70 of 1970
The nationally accepted definition of high potential agricultural land is defined as ―the best land
available, primarily from the national perspective, but with allowance of provincial perspectives;
land best suited to, and capable of, consistently producing acceptable yields of a wide range of
crops (food, feed, forage, fibre and oilseed), with acceptable expenditure of energy and
economic resources and minimal damage to the environment (and is available for these uses)‖
(Schoeman 2004).
It is however important that this land be identified and protected for agricultural production
purposes through legislation and policies.
5.2 Land Cover / Land Use
Land cover / land use defines the utilization of land within South Africa and provides an
important tool in the effective management and protection of agricultural land. According to the
2000 National Land Cover Classification (calculated from the National Land Cover Map), the
percentage area for the categories is as follows (DEAT, 2006):
Bare and degraded areas 4.4 %
29 | P a g e
Cultivated areas 10.5 %
Grasslands 20.0 %
Indigenous forests 0.4 %
Mines 0.2 %
Forest plantations 1.4 %
Shrub lands and herb lands 34.6 %
Urban areas 1.5 %
Waterbodies 0.6 %
Wetlands 0.7 %
Woodlands and bush lands 25.7 %
Of the cultivated areas (10.5 % in total), 82 % is used for commercial purposes, 6.2 % is
permanently under cultivation, whilst 85 % is under dry land cultivation (DEAT, 2006). Soil
erosion has left 0.7 million ha degraded whilst 0.2 million ha has been degraded by mining
activities (DEAT, 2006).
30 | P a g e
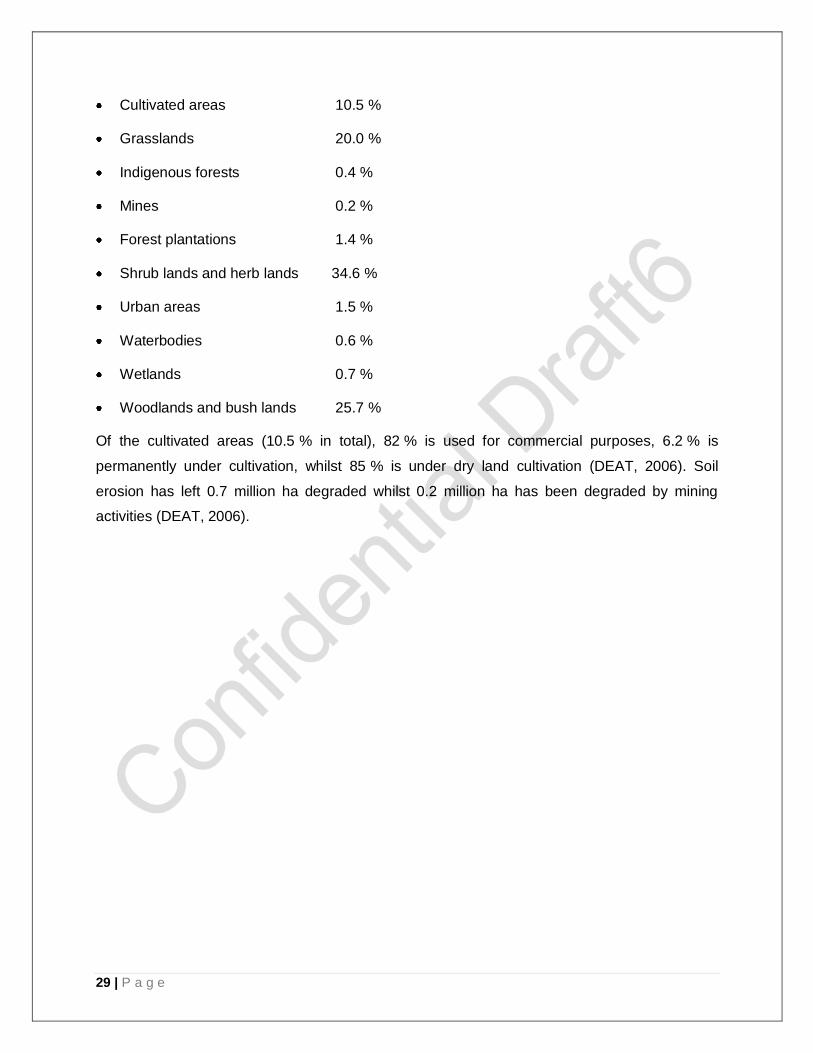
5.3 Status of Natural Resources
Human impact and the harsh climatic conditions have resulted in more than half of South
Africa‘s land surface being under threat of desertification (see figure 3). It is estimated that the
annual soil loss due to erosion is 2.5 tons, which exceeds the rate of soil formation of 0.31 ton
ha/year by far (DoA., 2004).
Figure 3: Aridity zones in South Africa
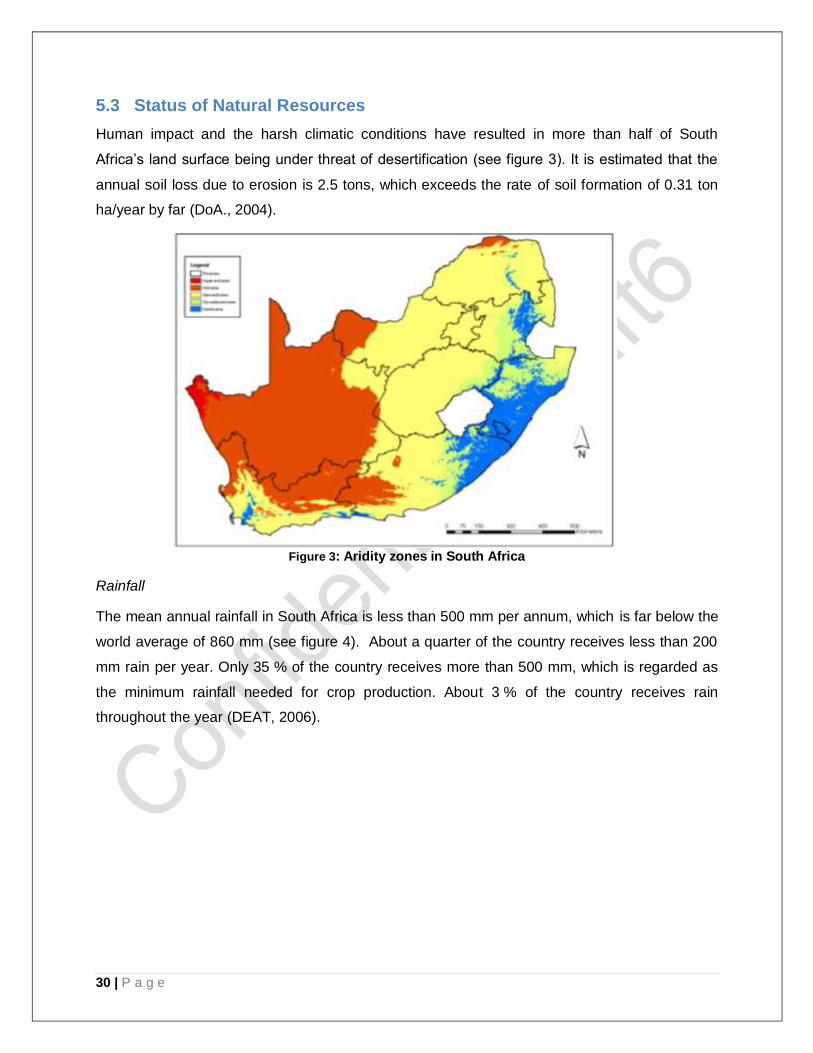
Rainfall
The mean annual rainfall in South Africa is less than 500 mm per annum, which is far below the
world average of 860 mm (see figure 4). About a quarter of the country receives less than 200
mm rain per year. Only 35 % of the country receives more than 500 mm, which is regarded as
the minimum rainfall needed for crop production. About 3 % of the country receives rain
throughout the year (DEAT, 2006).
31 | P a g e
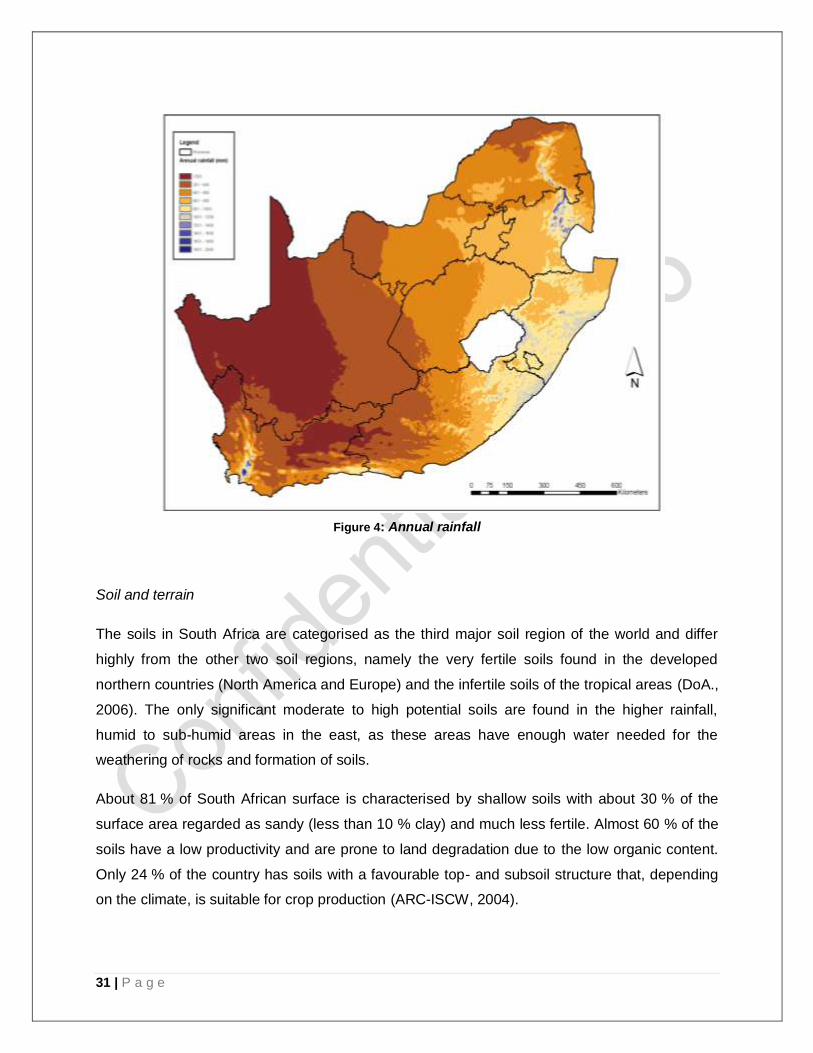
Figure 4: Annual rainfall
Soil and terrain
The soils in South Africa are categorised as the third major soil region of the world and differ
highly from the other two soil regions, namely the very fertile soils found in the developed
northern countries (North America and Europe) and the infertile soils of the tropical areas (DoA.,
2006). The only significant moderate to high potential soils are found in the higher rainfall,
humid to sub-humid areas in the east, as these areas have enough water needed for the
weathering of rocks and formation of soils.
About 81 % of South African surface is characterised by shallow soils with about 30 % of the
surface area regarded as sandy (less than 10 % clay) and much less fertile. Almost 60 % of the
soils have a low productivity and are prone to land degradation due to the low organic content.
Only 24 % of the country has soils with a favourable top- and subsoil structure that, depending
on the climate, is suitable for crop production (ARC-ISCW, 2004).
32 | P a g e
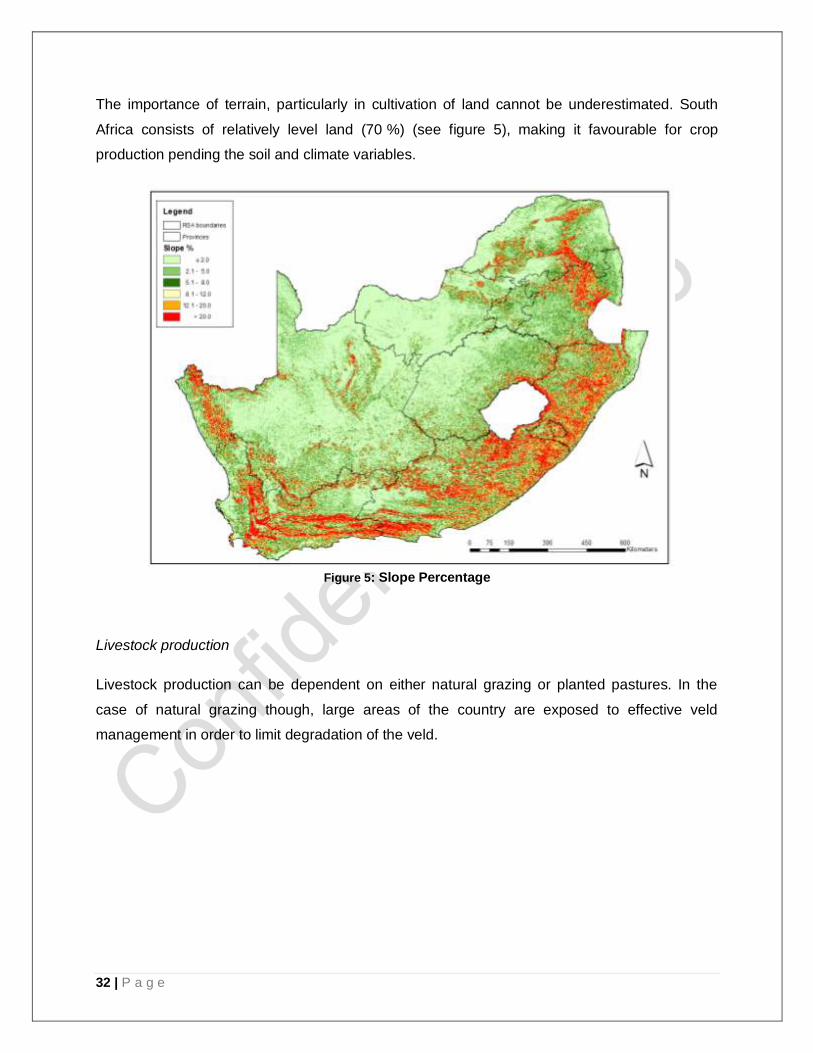
The importance of terrain, particularly in cultivation of land cannot be underestimated. South
Africa consists of relatively level land (70 %) (see figure 5), making it favourable for crop
production pending the soil and climate variables.
Figure 5: Slope Percentage
Livestock production
Livestock production can be dependent on either natural grazing or planted pastures. In the
case of natural grazing though, large areas of the country are exposed to effective veld
management in order to limit degradation of the veld.
33 | P a g e
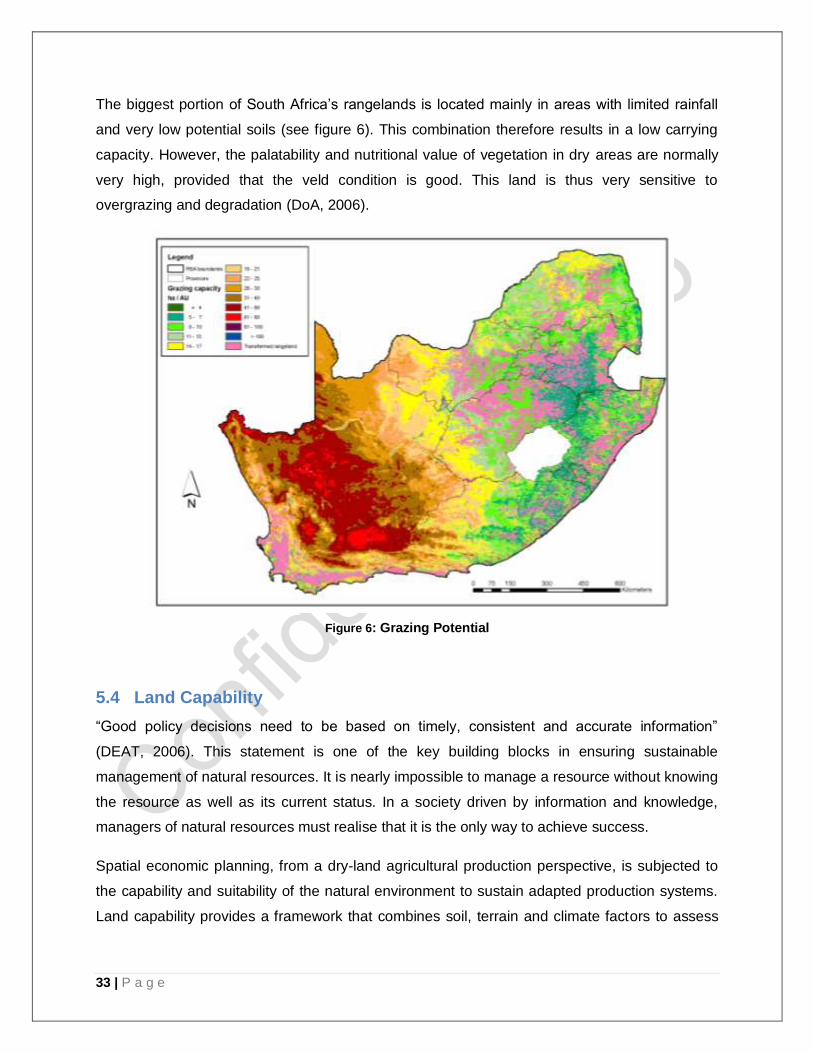
The biggest portion of South Africa‘s rangelands is located mainly in areas with limited rainfall
and very low potential soils (see figure 6). This combination therefore results in a low carrying
capacity. However, the palatability and nutritional value of vegetation in dry areas are normally
very high, provided that the veld condition is good. This land is thus very sensitive to
overgrazing and degradation (DoA, 2006).
Figure 6: Grazing Potential
5.4 Land Capability
―Good policy decisions need to be based on timely, consistent and accurate information‖
(DEAT, 2006). This statement is one of the key building blocks in ensuring sustainable
management of natural resources. It is nearly impossible to manage a resource without knowing
the resource as well as its current status. In a society driven by information and knowledge,
managers of natural resources must realise that it is the only way to achieve success.
Spatial economic planning, from a dry-land agricultural production perspective, is subjected to
the capability and suitability of the natural environment to sustain adapted production systems.
Land capability provides a framework that combines soil, terrain and climate factors to assess
34 | P a g e
the most intensive long-term use of land for rain-fed agriculture and at the same time indicate
the permanent limitations associated with the different land-use classes.
Scotney et al. (1991) within the concept of land capability defines land capability as ―the extent
to which land can meet the needs of one or more uses under defined conditions of
management, without permanent damage. Land capability is an expression of the effect of
physical factors (e.g. terrain form and soil type), including climate, on the total suitability and
potential for use for crops that require regular tillage, for grazing, for forestry and for wildlife
without damage. Land capability involves the consideration of (i) the risks of damage from
erosion and other causes, (ii) the difficulties in land use caused by physical factors, including
climate and (iii) the production potential‖ (Scotney et al., 1991).
The current land capability data set that is used as the national norm indicates that there are
little or no soils in South Africa that are not subject to limitations. Most of the country‘s soils have
moderate to severe limitations largely due to limited soil depth or moderate erodibility, caused
by sandy texture or slopes. Areas with a very good climate, such as in KwaZulu Natal and the
former Transkei of the Eastern Cape, had to be degraded due to high slopes and limited soil
depth. It was determined that nowhere in South Africa do best soil and good climate classes
coincide (Schoeman, Van der Walt, Monnik, Thackrah, & Malherbe, J. and Le Roux, R.E.,
2002).
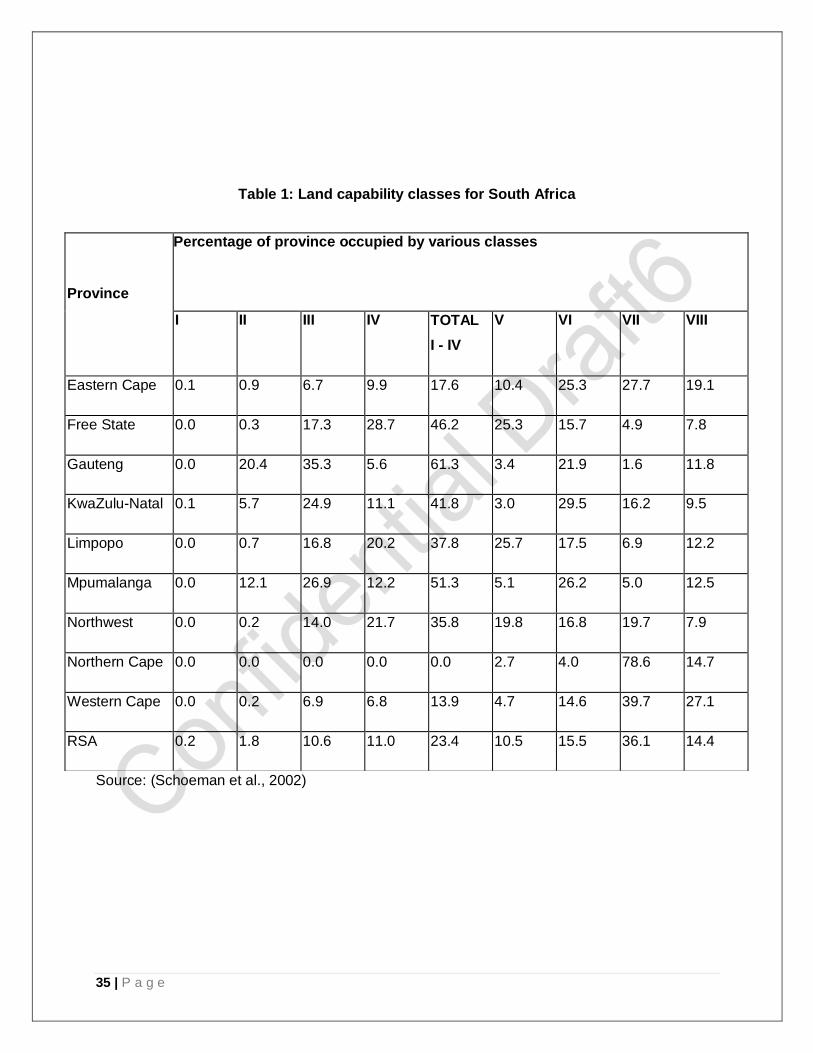
Most of the arable land in the country is classified as Class III or IV. If Class IV is included, the
total arable land in the country is 23.4 %, which is higher than the 12 % traditionally accepted.
Classes I to III represent 12.4 %. Ninety eight percent (98 %) of South Africa (Class III – VIII)
has severe limitations in terms of rainfall, terrain or soils. Unique farmland, especially in the
Western Cape, is classified as Class IV and V mainly due to limited soil depth. Table 1 indicates
the percentages of land capability classes in South Africa per province.
35 | P a g e
Table 1: Land capability classes for South Africa
Source: (Schoeman et al., 2002)
Province
Percentage of province occupied by various classes
I II III IV TOTAL
I - IV
V VI VII VIII
Eastern Cape 0.1 0.9 6.7 9.9 17.6 10.4 25.3 27.7 19.1
Free State 0.0 0.3 17.3 28.7 46.2 25.3 15.7 4.9 7.8
Gauteng 0.0 20.4 35.3 5.6 61.3 3.4 21.9 1.6 11.8
KwaZulu-Natal 0.1 5.7 24.9 11.1 41.8 3.0 29.5 16.2 9.5
Limpopo 0.0 0.7 16.8 20.2 37.8 25.7 17.5 6.9 12.2
Mpumalanga 0.0 12.1 26.9 12.2 51.3 5.1 26.2 5.0 12.5
Northwest 0.0 0.2 14.0 21.7 35.8 19.8 16.8 19.7 7.9
Northern Cape 0.0 0.0 0.0 0.0 0.0 2.7 4.0 78.6 14.7
Western Cape 0.0 0.2 6.9 6.8 13.9 4.7 14.6 39.7 27.1
RSA 0.2 1.8 10.6 11.0 23.4 10.5 15.5 36.1 14.4
36 | P a g e
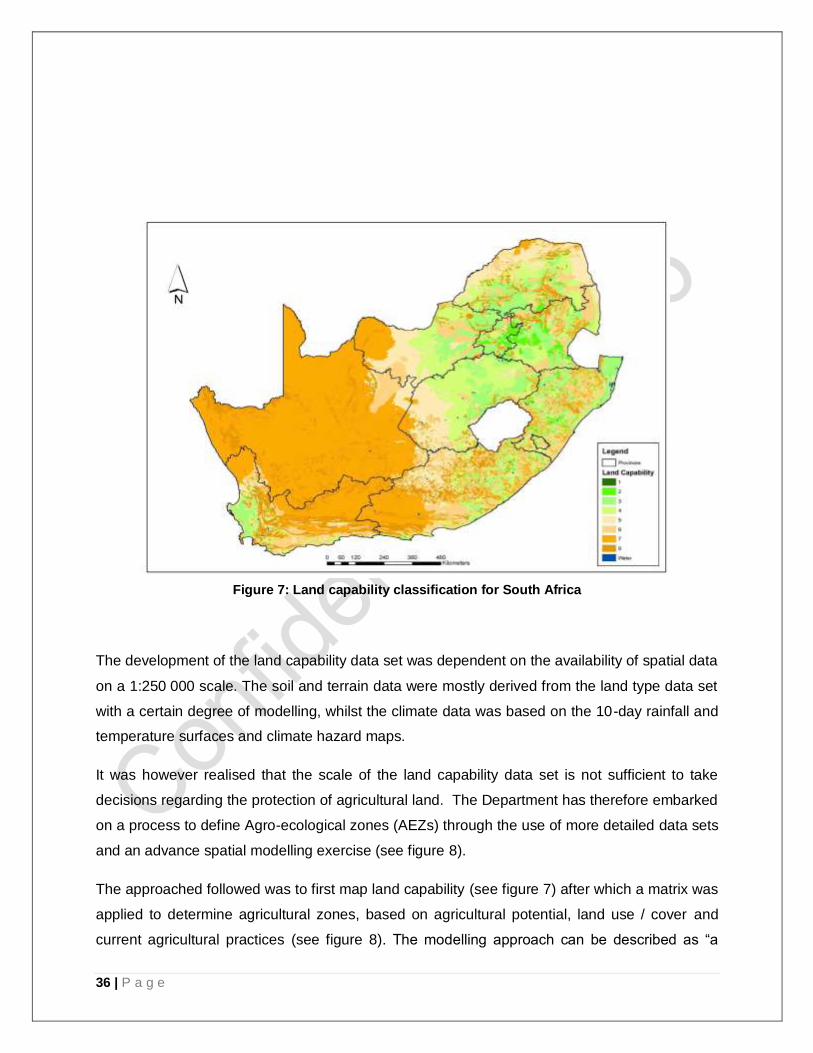
Figure 7: Land capability classification for South Africa
The development of the land capability data set was dependent on the availability of spatial data
on a 1:250 000 scale. The soil and terrain data were mostly derived from the land type data set
with a certain degree of modelling, whilst the climate data was based on the 10-day rainfall and
temperature surfaces and climate hazard maps.
It was however realised that the scale of the land capability data set is not sufficient to take
decisions regarding the protection of agricultural land. The Department has therefore embarked
on a process to define Agro-ecological zones (AEZs) through the use of more detailed data sets
and an advance spatial modelling exercise (see figure 8).
The approached followed was to first map land capability (see figure 7) after which a matrix was
applied to determine agricultural zones, based on agricultural potential, land use / cover and
current agricultural practices (see figure 8). The modelling approach can be described as ―a
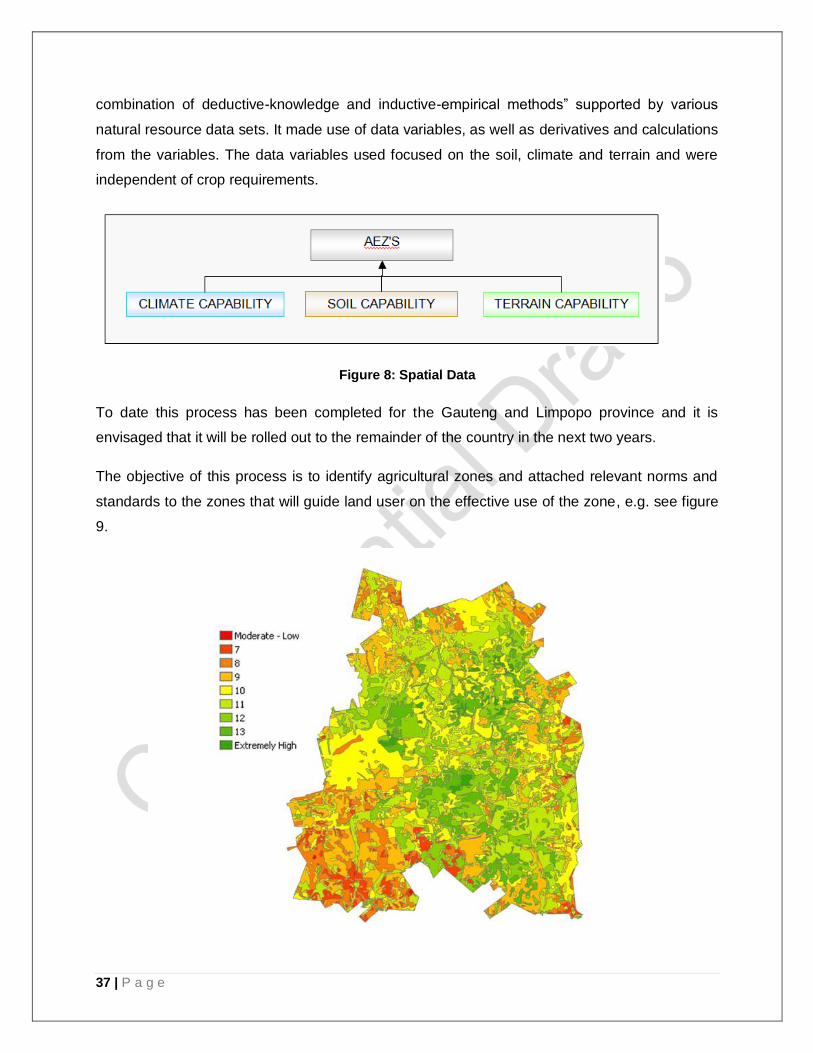
37 | P a g e
combination of deductive-knowledge and inductive-empirical methods‖ supported by various
natural resource data sets. It made use of data variables, as well as derivatives and calculations
from the variables. The data variables used focused on the soil, climate and terrain and were
independent of crop requirements.
Figure 8: Spatial Data
To date this process has been completed for the Gauteng and Limpopo province and it is
envisaged that it will be rolled out to the remainder of the country in the next two years.
The objective of this process is to identify agricultural zones and attached relevant norms and
standards to the zones that will guide land user on the effective use of the zone, e.g. see figure
9.
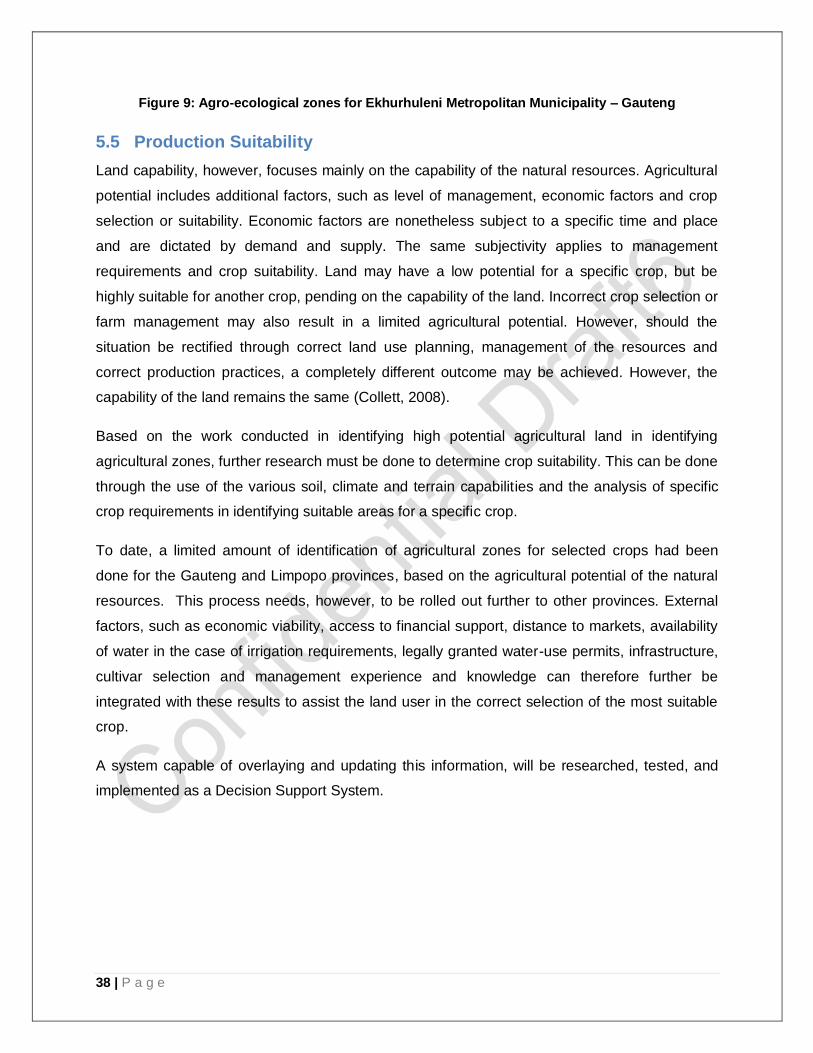
38 | P a g e
Figure 9: Agro-ecological zones for Ekhurhuleni Metropolitan Municipality – Gauteng
5.5 Production Suitability
Land capability, however, focuses mainly on the capability of the natural resources. Agricultural
potential includes additional factors, such as level of management, economic factors and crop
selection or suitability. Economic factors are nonetheless subject to a specific time and place
and are dictated by demand and supply. The same subjectivity applies to management
requirements and crop suitability. Land may have a low potential for a specific crop, but be
highly suitable for another crop, pending on the capability of the land. Incorrect crop selection or
farm management may also result in a limited agricultural potential. However, should the
situation be rectified through correct land use planning, management of the resources and
correct production practices, a completely different outcome may be achieved. However, the
capability of the land remains the same (Collett, 2008).
Based on the work conducted in identifying high potential agricultural land in identifying
agricultural zones, further research must be done to determine crop suitability. This can be done
through the use of the various soil, climate and terrain capabilities and the analysis of specific
crop requirements in identifying suitable areas for a specific crop.
To date, a limited amount of identification of agricultural zones for selected crops had been
done for the Gauteng and Limpopo provinces, based on the agricultural potential of the natural
resources. This process needs, however, to be rolled out further to other provinces. External
factors, such as economic viability, access to financial support, distance to markets, availability
of water in the case of irrigation requirements, legally granted water-use permits, infrastructure,
cultivar selection and management experience and knowledge can therefore further be
integrated with these results to assist the land user in the correct selection of the most suitable
crop.
A system capable of overlaying and updating this information, will be researched, tested, and
implemented as a Decision Support System.
39 | P a g e
6 THE SOUTH AFRICAN AGRICULTURAL
PRODUCTION SECTOR
6.1 Commodity Production Analysis
6.1.1 Maize Industry
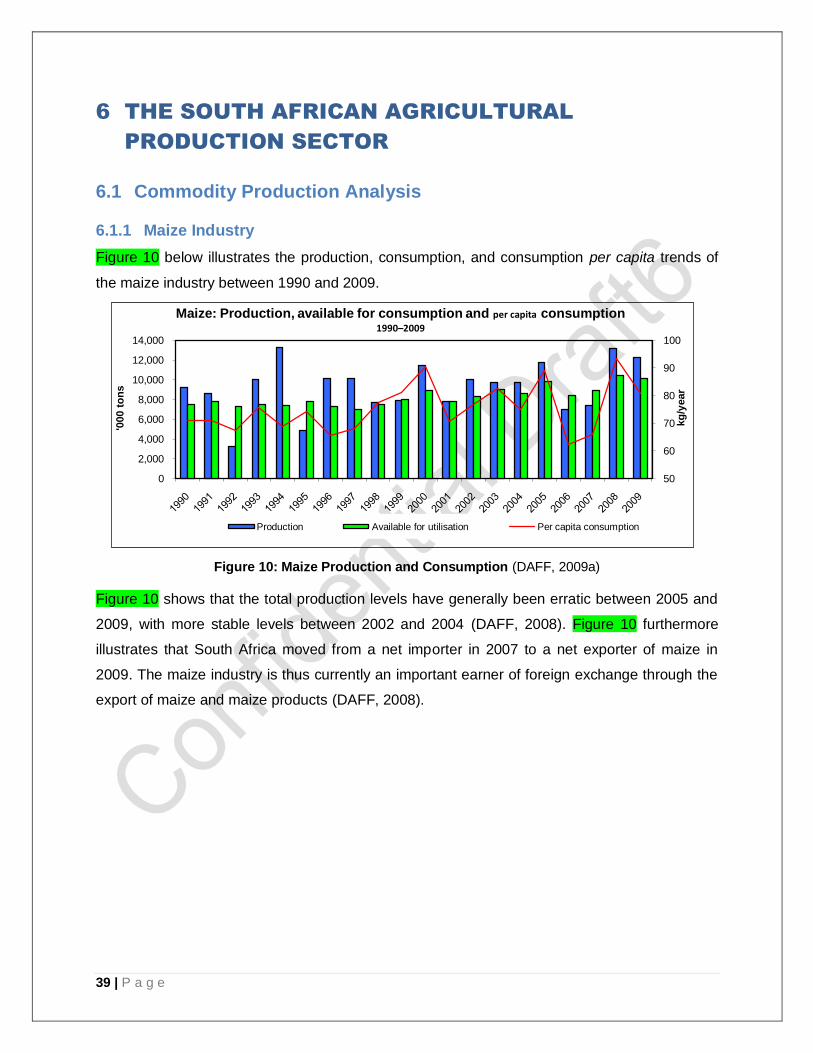
Figure 10 below illustrates the production, consumption, and consumption per capita trends of
the maize industry between 1990 and 2009.
Figure 10: Maize Production and Consumption (DAFF, 2009a)
Figure 10 shows that the total production levels have generally been erratic between 2005 and
2009, with more stable levels between 2002 and 2004 (DAFF, 2008). Figure 10 furthermore
illustrates that South Africa moved from a net importer in 2007 to a net exporter of maize in
2009. The maize industry is thus currently an important earner of foreign exchange through the
export of maize and maize products (DAFF, 2008).
50
60
70
80
90
100
0
2,000
4,000
6,000
8,000
10,000
12,000
14,000
kg
/year
'000 t
on
s
Maize: Production, available for consumption and per capita consumption1990–2009
Production Available for utilisation Per capita consumption
40 | P a g e
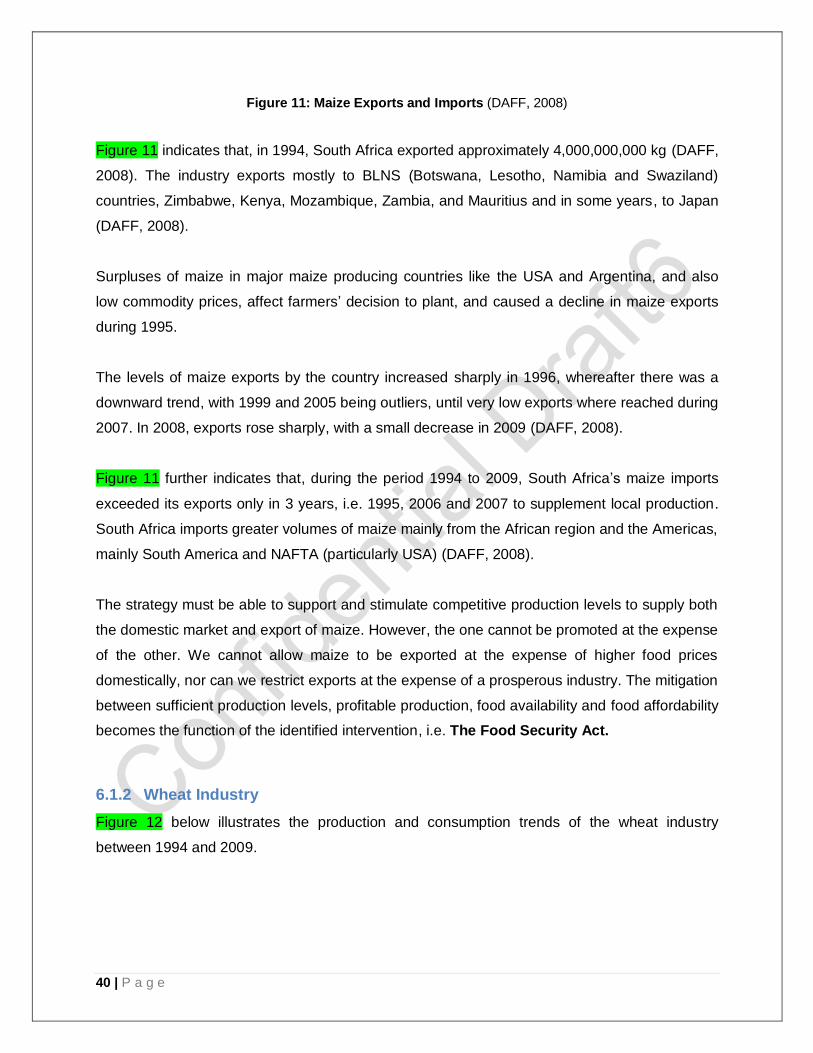
Figure 11: Maize Exports and Imports (DAFF, 2008)
Figure 11 indicates that, in 1994, South Africa exported approximately 4,000,000,000 kg (DAFF,
2008). The industry exports mostly to BLNS (Botswana, Lesotho, Namibia and Swaziland)
countries, Zimbabwe, Kenya, Mozambique, Zambia, and Mauritius and in some years, to Japan
(DAFF, 2008).
Surpluses of maize in major maize producing countries like the USA and Argentina, and also
low commodity prices, affect farmers‘ decision to plant, and caused a decline in maize exports
during 1995.
The levels of maize exports by the country increased sharply in 1996, whereafter there was a
downward trend, with 1999 and 2005 being outliers, until very low exports where reached during
2007. In 2008, exports rose sharply, with a small decrease in 2009 (DAFF, 2008).
Figure 11 further indicates that, during the period 1994 to 2009, South Africa‘s maize imports
exceeded its exports only in 3 years, i.e. 1995, 2006 and 2007 to supplement local production.
South Africa imports greater volumes of maize mainly from the African region and the Americas,
mainly South America and NAFTA (particularly USA) (DAFF, 2008).
The strategy must be able to support and stimulate competitive production levels to supply both
the domestic market and export of maize. However, the one cannot be promoted at the expense
of the other. We cannot allow maize to be exported at the expense of higher food prices
domestically, nor can we restrict exports at the expense of a prosperous industry. The mitigation
between sufficient production levels, profitable production, food availability and food affordability
becomes the function of the identified intervention, i.e. The Food Security Act.
6.1.2 Wheat Industry
Figure 12 below illustrates the production and consumption trends of the wheat industry
between 1994 and 2009.
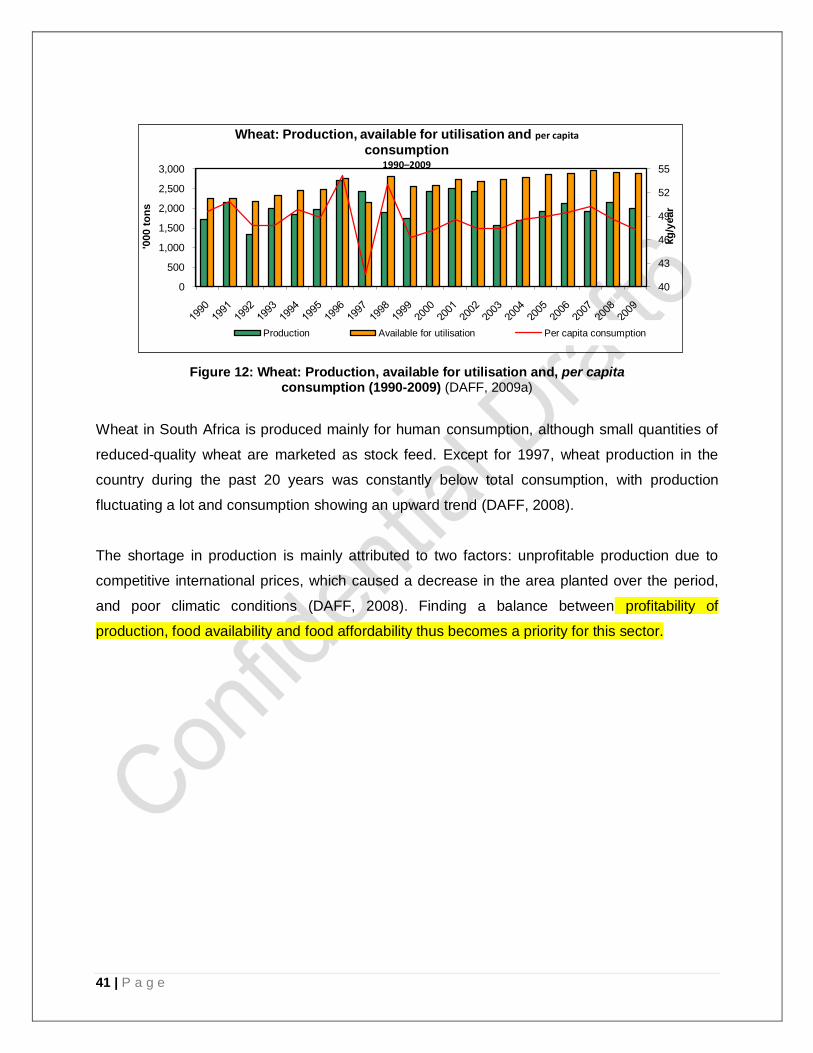
41 | P a g e
Figure 12: Wheat: Production, available for utilisation and, per capita consumption (1990-2009) (DAFF, 2009a)
Wheat in South Africa is produced mainly for human consumption, although small quantities of
reduced-quality wheat are marketed as stock feed. Except for 1997, wheat production in the
country during the past 20 years was constantly below total consumption, with production
fluctuating a lot and consumption showing an upward trend (DAFF, 2008).
The shortage in production is mainly attributed to two factors: unprofitable production due to
competitive international prices, which caused a decrease in the area planted over the period,
and poor climatic conditions (DAFF, 2008). Finding a balance between profitability of
production, food availability and food affordability thus becomes a priority for this sector.
40
43
46
49
52
55
0
500
1,000
1,500
2,000
2,500
3,000
kg
/year
'000 t
on
sWheat: Production, available for utilisation and per capita
consumption1990–2009
Production Available for utilisation Per capita consumption
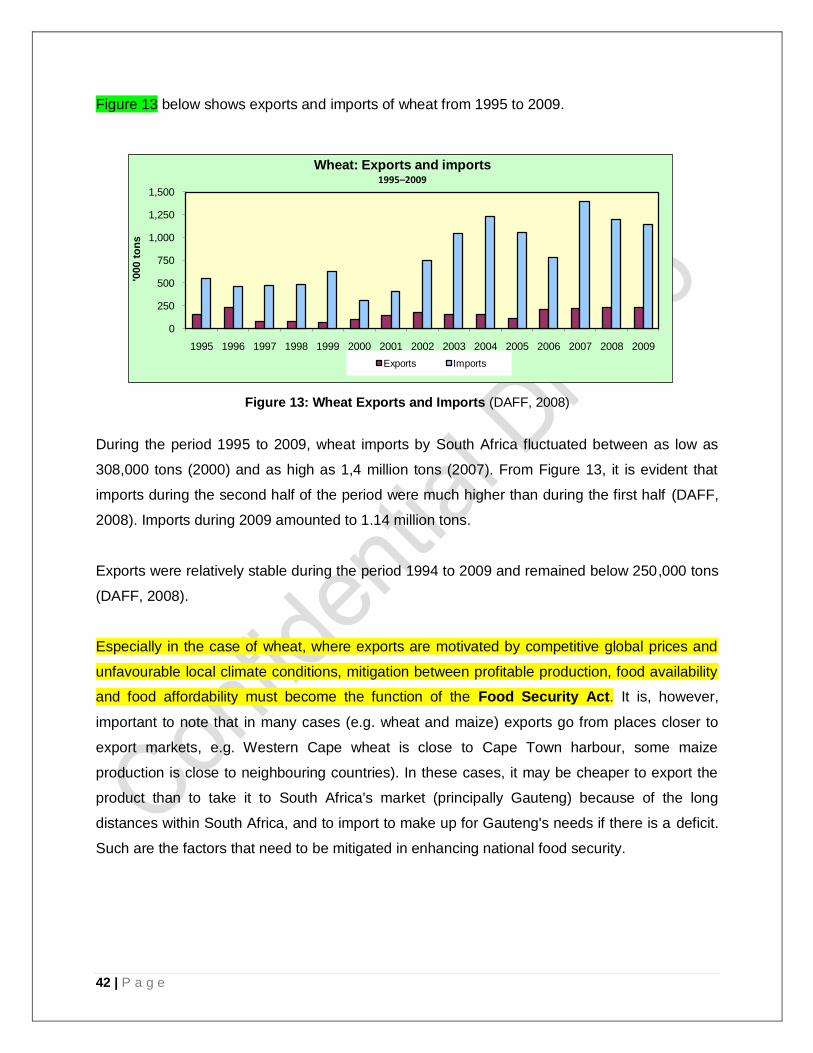
42 | P a g e
Figure 13 below shows exports and imports of wheat from 1995 to 2009.
Figure 13: Wheat Exports and Imports (DAFF, 2008)
During the period 1995 to 2009, wheat imports by South Africa fluctuated between as low as
308,000 tons (2000) and as high as 1,4 million tons (2007). From Figure 13, it is evident that
imports during the second half of the period were much higher than during the first half (DAFF,
2008). Imports during 2009 amounted to 1.14 million tons.
Exports were relatively stable during the period 1994 to 2009 and remained below 250,000 tons
(DAFF, 2008).
Especially in the case of wheat, where exports are motivated by competitive global prices and
unfavourable local climate conditions, mitigation between profitable production, food availability
and food affordability must become the function of the Food Security Act. It is, however,
important to note that in many cases (e.g. wheat and maize) exports go from places closer to
export markets, e.g. Western Cape wheat is close to Cape Town harbour, some maize
production is close to neighbouring countries). In these cases, it may be cheaper to export the
product than to take it to South Africa's market (principally Gauteng) because of the long
distances within South Africa, and to import to make up for Gauteng's needs if there is a deficit.
Such are the factors that need to be mitigated in enhancing national food security.
0
250
500
750
1,000
1,250
1,500
1995 1996 1997 1998 1999 2000 2001 2002 2003 2004 2005 2006 2007 2008 2009
'000 t
on
s
Wheat: Exports and imports1995–2009
Exports Imports
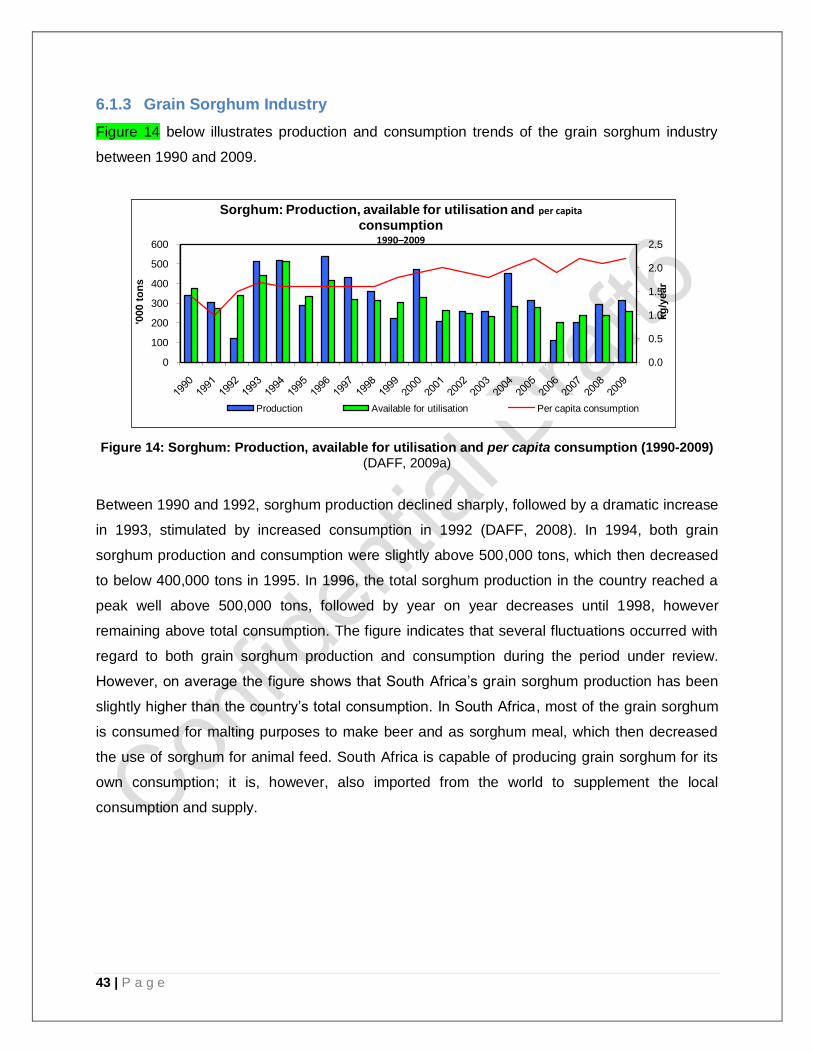
43 | P a g e
6.1.3 Grain Sorghum Industry
Figure 14 below illustrates production and consumption trends of the grain sorghum industry
between 1990 and 2009.
Figure 14: Sorghum: Production, available for utilisation and per capita consumption (1990-2009) (DAFF, 2009a)
Between 1990 and 1992, sorghum production declined sharply, followed by a dramatic increase
in 1993, stimulated by increased consumption in 1992 (DAFF, 2008). In 1994, both grain
sorghum production and consumption were slightly above 500,000 tons, which then decreased
to below 400,000 tons in 1995. In 1996, the total sorghum production in the country reached a
peak well above 500,000 tons, followed by year on year decreases until 1998, however
remaining above total consumption. The figure indicates that several fluctuations occurred with
regard to both grain sorghum production and consumption during the period under review.
However, on average the figure shows that South Africa‘s grain sorghum production has been
slightly higher than the country‘s total consumption. In South Africa, most of the grain sorghum
is consumed for malting purposes to make beer and as sorghum meal, which then decreased
the use of sorghum for animal feed. South Africa is capable of producing grain sorghum for its
own consumption; it is, however, also imported from the world to supplement the local
consumption and supply.
0.0
0.5
1.0
1.5
2.0
2.5
0
100
200
300
400
500
600
kg
/year
'000 t
on
s
Sorghum: Production, available for utilisation and per capita
consumption1990–2009
Production Available for utilisation Per capita consumption
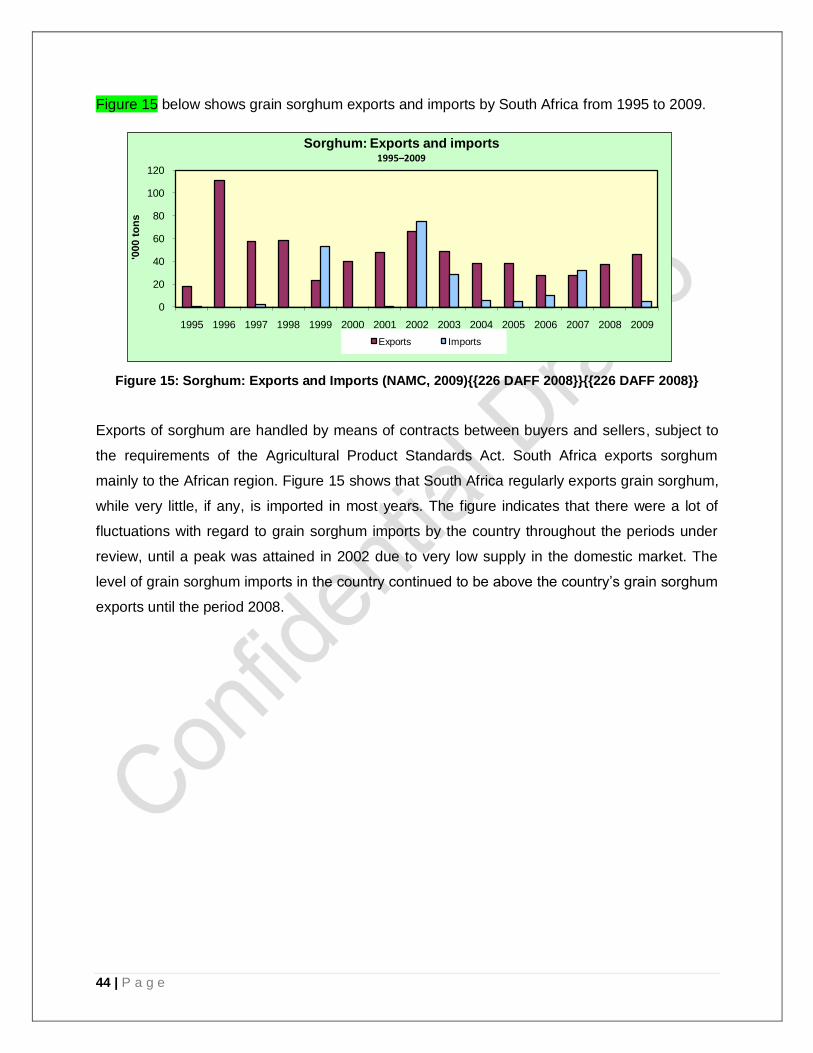
44 | P a g e
Figure 15 below shows grain sorghum exports and imports by South Africa from 1995 to 2009.
Figure 15: Sorghum: Exports and Imports (NAMC, 2009){{226 DAFF 2008}}{{226 DAFF 2008}}
Exports of sorghum are handled by means of contracts between buyers and sellers, subject to
the requirements of the Agricultural Product Standards Act. South Africa exports sorghum
mainly to the African region. Figure 15 shows that South Africa regularly exports grain sorghum,
while very little, if any, is imported in most years. The figure indicates that there were a lot of
fluctuations with regard to grain sorghum imports by the country throughout the periods under
review, until a peak was attained in 2002 due to very low supply in the domestic market. The
level of grain sorghum imports in the country continued to be above the country‘s grain sorghum
exports until the period 2008.
0
20
40
60
80
100
120
1995 1996 1997 1998 1999 2000 2001 2002 2003 2004 2005 2006 2007 2008 2009
'000 t
on
sSorghum: Exports and imports
1995–2009
Exports Imports
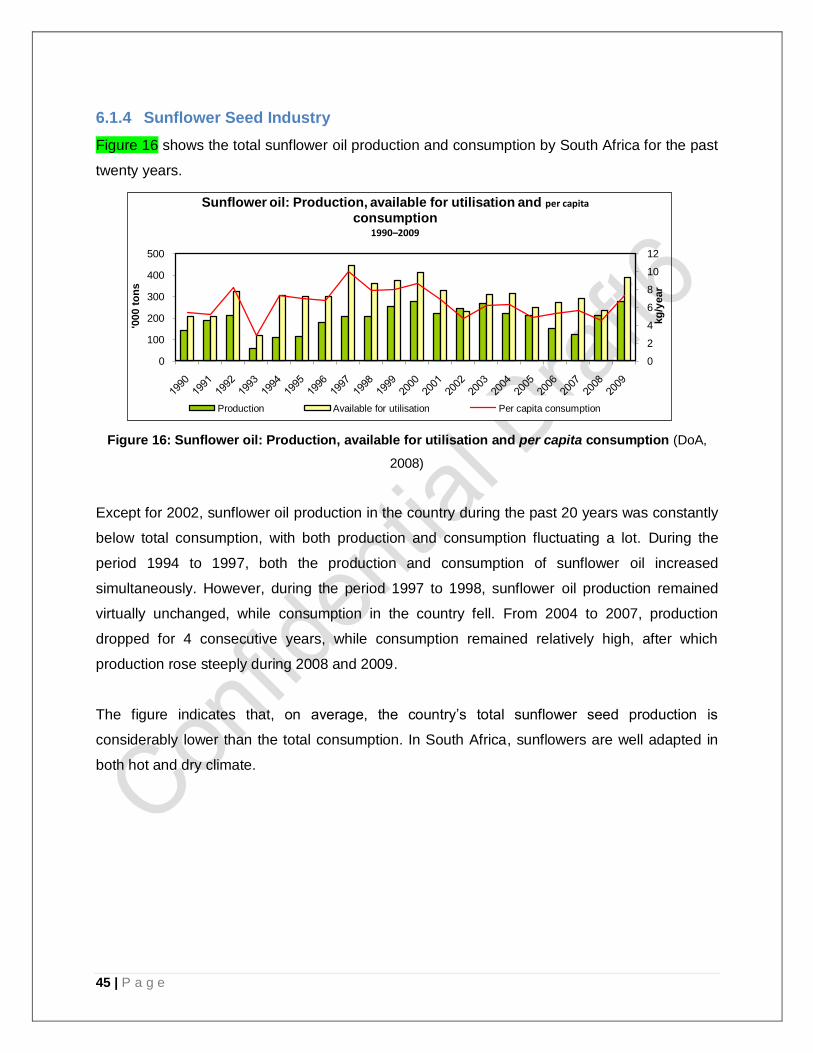
45 | P a g e
6.1.4 Sunflower Seed Industry
Figure 16 shows the total sunflower oil production and consumption by South Africa for the past
twenty years.
Figure 16: Sunflower oil: Production, available for utilisation and per capita consumption (DoA,
2008)
Except for 2002, sunflower oil production in the country during the past 20 years was constantly
below total consumption, with both production and consumption fluctuating a lot. During the
period 1994 to 1997, both the production and consumption of sunflower oil increased
simultaneously. However, during the period 1997 to 1998, sunflower oil production remained
virtually unchanged, while consumption in the country fell. From 2004 to 2007, production
dropped for 4 consecutive years, while consumption remained relatively high, after which
production rose steeply during 2008 and 2009.
The figure indicates that, on average, the country‘s total sunflower seed production is
considerably lower than the total consumption. In South Africa, sunflowers are well adapted in
both hot and dry climate.
0
2
4
6
8
10
12
0
100
200
300
400
500
kg
/year
'000 t
on
s
Sunflower oil: Production, available for utilisation and per capita
consumption1990–2009
Production Available for utilisation Per capita consumption
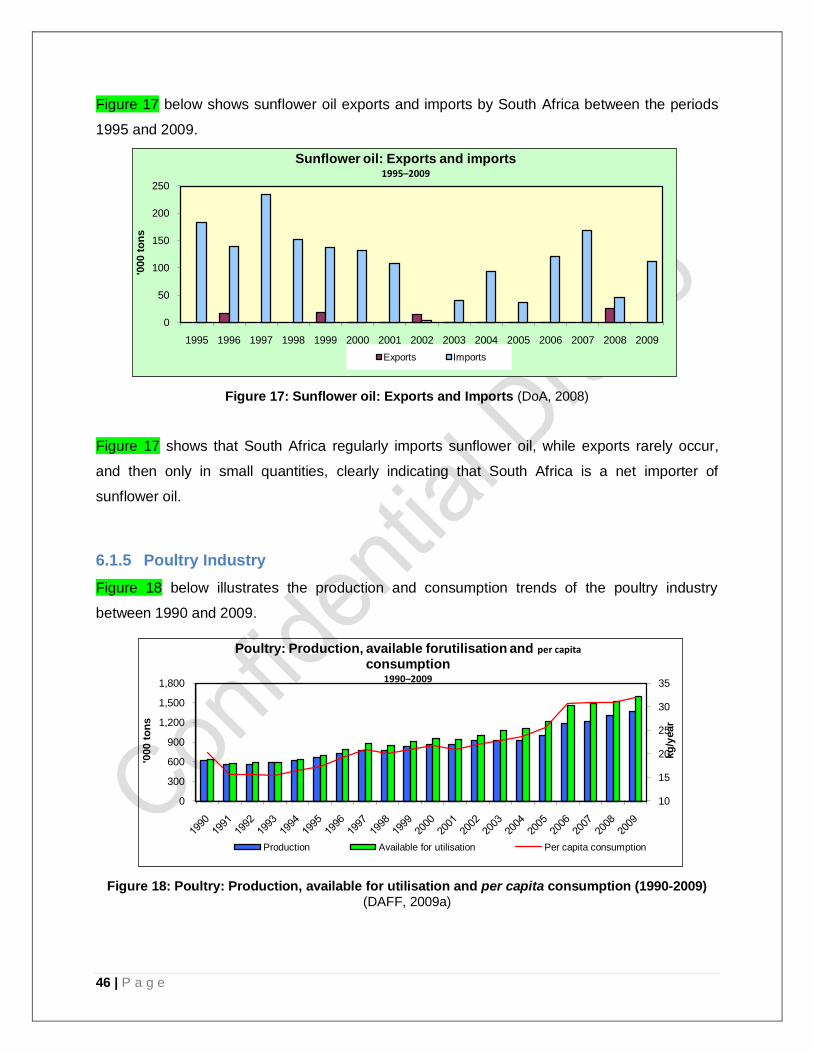
46 | P a g e
Figure 17 below shows sunflower oil exports and imports by South Africa between the periods
1995 and 2009.
Figure 17: Sunflower oil: Exports and Imports (DoA, 2008)
Figure 17 shows that South Africa regularly imports sunflower oil, while exports rarely occur,
and then only in small quantities, clearly indicating that South Africa is a net importer of
sunflower oil.
6.1.5 Poultry Industry
Figure 18 below illustrates the production and consumption trends of the poultry industry
between 1990 and 2009.
Figure 18: Poultry: Production, available for utilisation and per capita consumption (1990-2009) (DAFF, 2009a)
0
50
100
150
200
250
1995 1996 1997 1998 1999 2000 2001 2002 2003 2004 2005 2006 2007 2008 2009
'000 t
on
s
Sunflower oil: Exports and imports1995–2009
Exports Imports
10
15
20
25
30
35
0
300
600
900
1,200
1,500
1,800
kg
/year
'000 t
on
s
Poultry: Production, available forutilisation and per capita
consumption1990–2009
Production Available for utilisation Per capita consumption
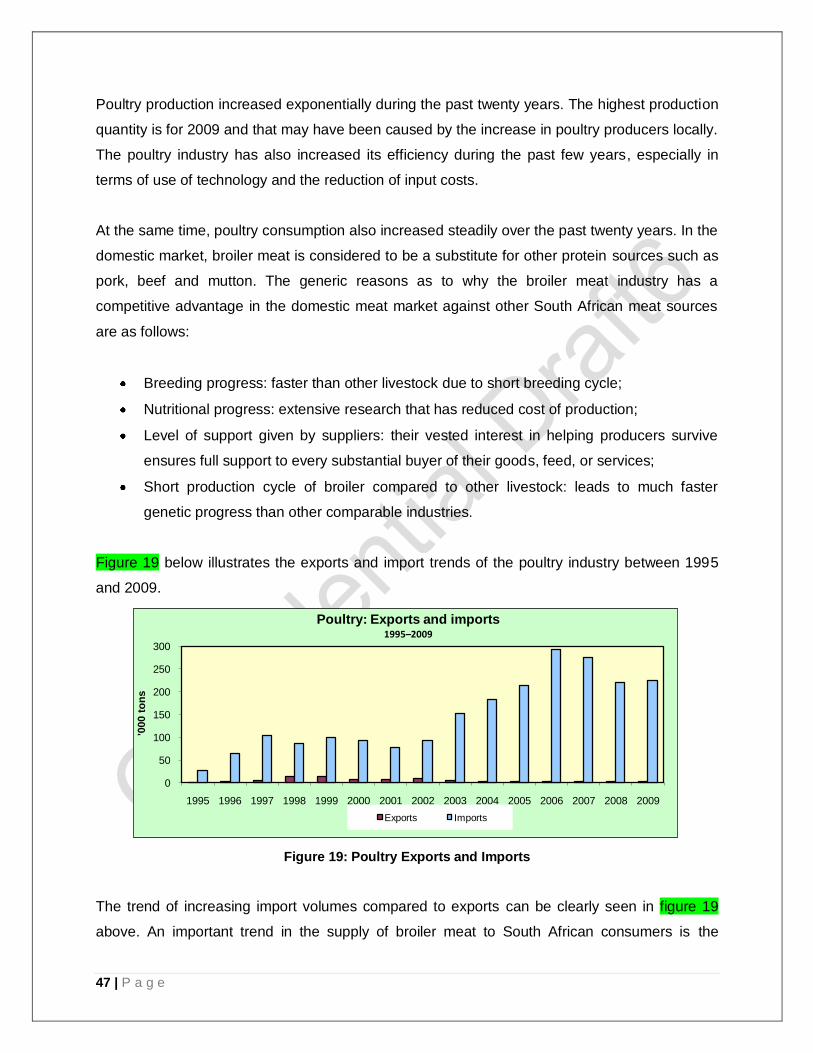
47 | P a g e
Poultry production increased exponentially during the past twenty years. The highest production
quantity is for 2009 and that may have been caused by the increase in poultry producers locally.
The poultry industry has also increased its efficiency during the past few years, especially in
terms of use of technology and the reduction of input costs.
At the same time, poultry consumption also increased steadily over the past twenty years. In the
domestic market, broiler meat is considered to be a substitute for other protein sources such as
pork, beef and mutton. The generic reasons as to why the broiler meat industry has a
competitive advantage in the domestic meat market against other South African meat sources
are as follows:
Breeding progress: faster than other livestock due to short breeding cycle;
Nutritional progress: extensive research that has reduced cost of production;
Level of support given by suppliers: their vested interest in helping producers survive
ensures full support to every substantial buyer of their goods, feed, or services;
Short production cycle of broiler compared to other livestock: leads to much faster
genetic progress than other comparable industries.
Figure 19 below illustrates the exports and import trends of the poultry industry between 1995
and 2009.
Figure 19: Poultry Exports and Imports
The trend of increasing import volumes compared to exports can be clearly seen in figure 19
above. An important trend in the supply of broiler meat to South African consumers is the
0
50
100
150
200
250
300
1995 1996 1997 1998 1999 2000 2001 2002 2003 2004 2005 2006 2007 2008 2009
'000 t
on
s
Poultry: Exports and imports1995–2009
Exports Imports
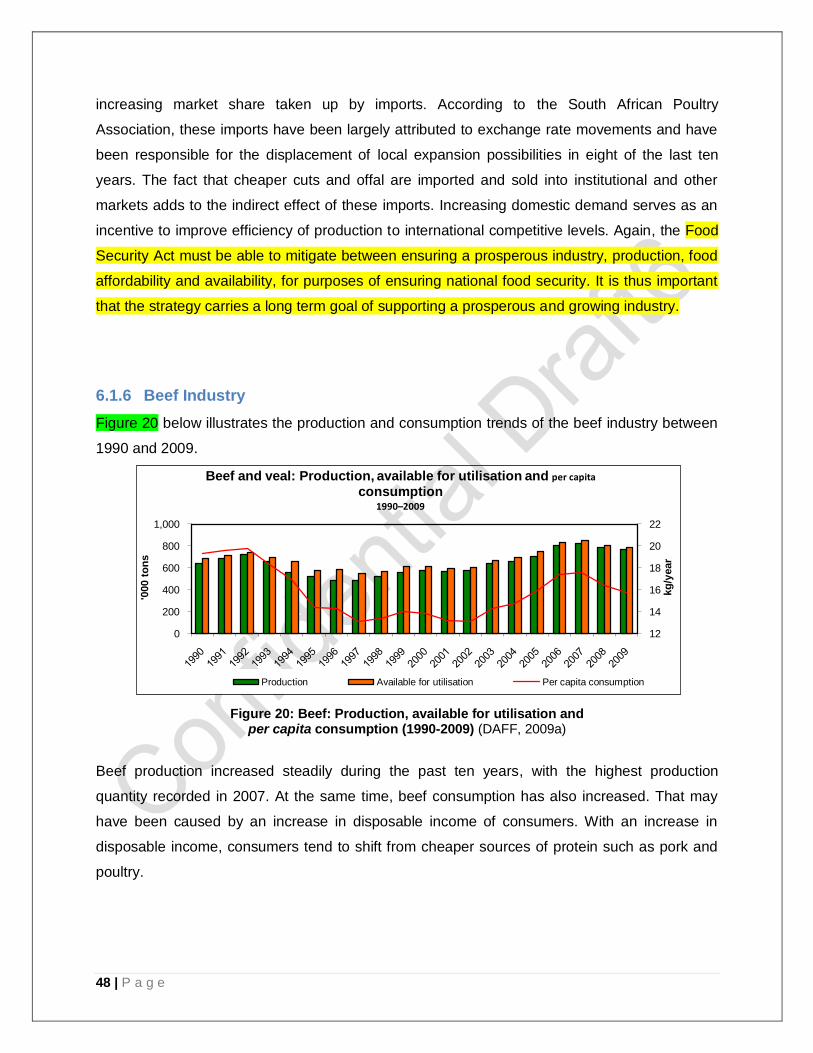
48 | P a g e
increasing market share taken up by imports. According to the South African Poultry
Association, these imports have been largely attributed to exchange rate movements and have
been responsible for the displacement of local expansion possibilities in eight of the last ten
years. The fact that cheaper cuts and offal are imported and sold into institutional and other
markets adds to the indirect effect of these imports. Increasing domestic demand serves as an
incentive to improve efficiency of production to international competitive levels. Again, the Food
Security Act must be able to mitigate between ensuring a prosperous industry, production, food
affordability and availability, for purposes of ensuring national food security. It is thus important
that the strategy carries a long term goal of supporting a prosperous and growing industry.
6.1.6 Beef Industry
Figure 20 below illustrates the production and consumption trends of the beef industry between
1990 and 2009.
Figure 20: Beef: Production, available for utilisation and per capita consumption (1990-2009) (DAFF, 2009a)
Beef production increased steadily during the past ten years, with the highest production
quantity recorded in 2007. At the same time, beef consumption has also increased. That may
have been caused by an increase in disposable income of consumers. With an increase in
disposable income, consumers tend to shift from cheaper sources of protein such as pork and
poultry.
12
14
16
18
20
22
0
200
400
600
800
1,000
kg
/year
'000 t
on
s
Beef and veal: Production, available for utilisation and per capita
consumption1990–2009
Production Available for utilisation Per capita consumption
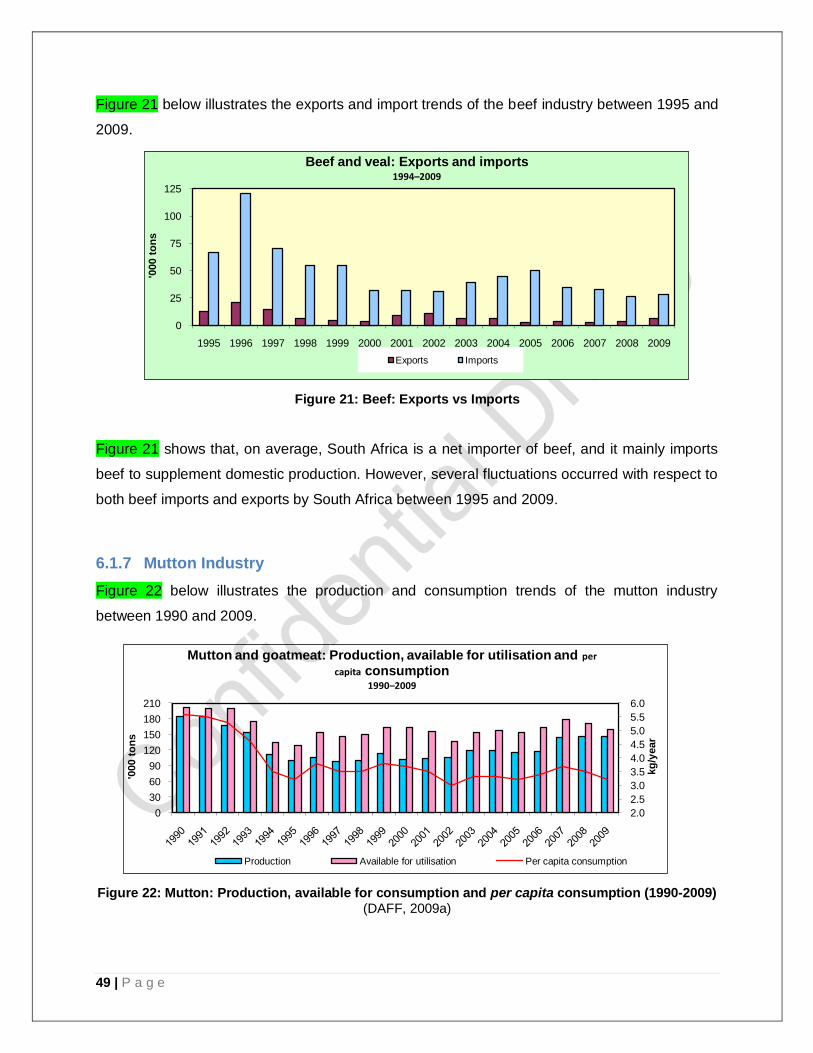
49 | P a g e
Figure 21 below illustrates the exports and import trends of the beef industry between 1995 and
2009.
Figure 21: Beef: Exports vs Imports
Figure 21 shows that, on average, South Africa is a net importer of beef, and it mainly imports
beef to supplement domestic production. However, several fluctuations occurred with respect to
both beef imports and exports by South Africa between 1995 and 2009.
6.1.7 Mutton Industry
Figure 22 below illustrates the production and consumption trends of the mutton industry
between 1990 and 2009.
Figure 22: Mutton: Production, available for consumption and per capita consumption (1990-2009) (DAFF, 2009a)
0
25
50
75
100
125
1995 1996 1997 1998 1999 2000 2001 2002 2003 2004 2005 2006 2007 2008 2009
'000 t
on
sBeef and veal: Exports and imports
1994–2009
Exports Imports
2.0
2.5
3.0
3.5
4.0
4.5
5.0
5.5
6.0
0
30
60
90
120
150
180
210
kg
/year
'000 t
on
s
Mutton and goatmeat: Production, available for utilisation and per
capita consumption1990–2009
Production Available for utilisation Per capita consumption
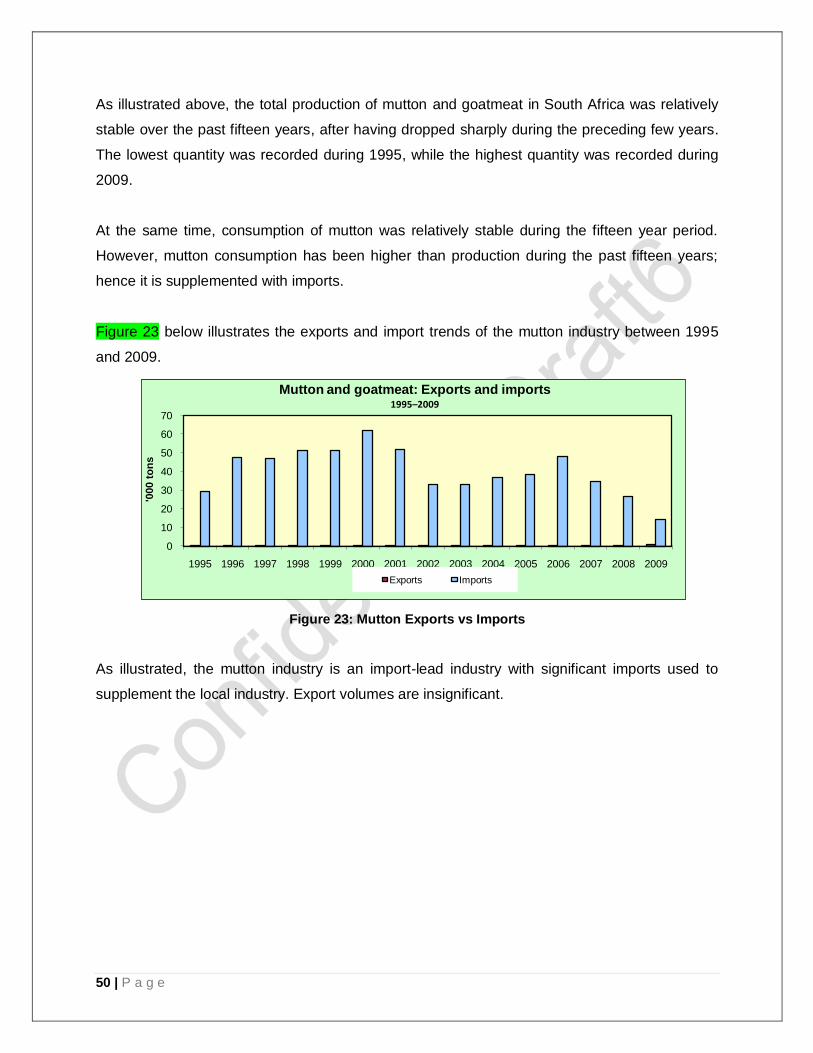
50 | P a g e
As illustrated above, the total production of mutton and goatmeat in South Africa was relatively
stable over the past fifteen years, after having dropped sharply during the preceding few years.
The lowest quantity was recorded during 1995, while the highest quantity was recorded during
2009.
At the same time, consumption of mutton was relatively stable during the fifteen year period.
However, mutton consumption has been higher than production during the past fifteen years;
hence it is supplemented with imports.
Figure 23 below illustrates the exports and import trends of the mutton industry between 1995
and 2009.
Figure 23: Mutton Exports vs Imports
As illustrated, the mutton industry is an import-lead industry with significant imports used to
supplement the local industry. Export volumes are insignificant.
0
10
20
30
40
50
60
70
1995 1996 1997 1998 1999 2000 2001 2002 2003 2004 2005 2006 2007 2008 2009
'000 t
on
s
Mutton and goatmeat: Exports and imports1995–2009
Exports Imports
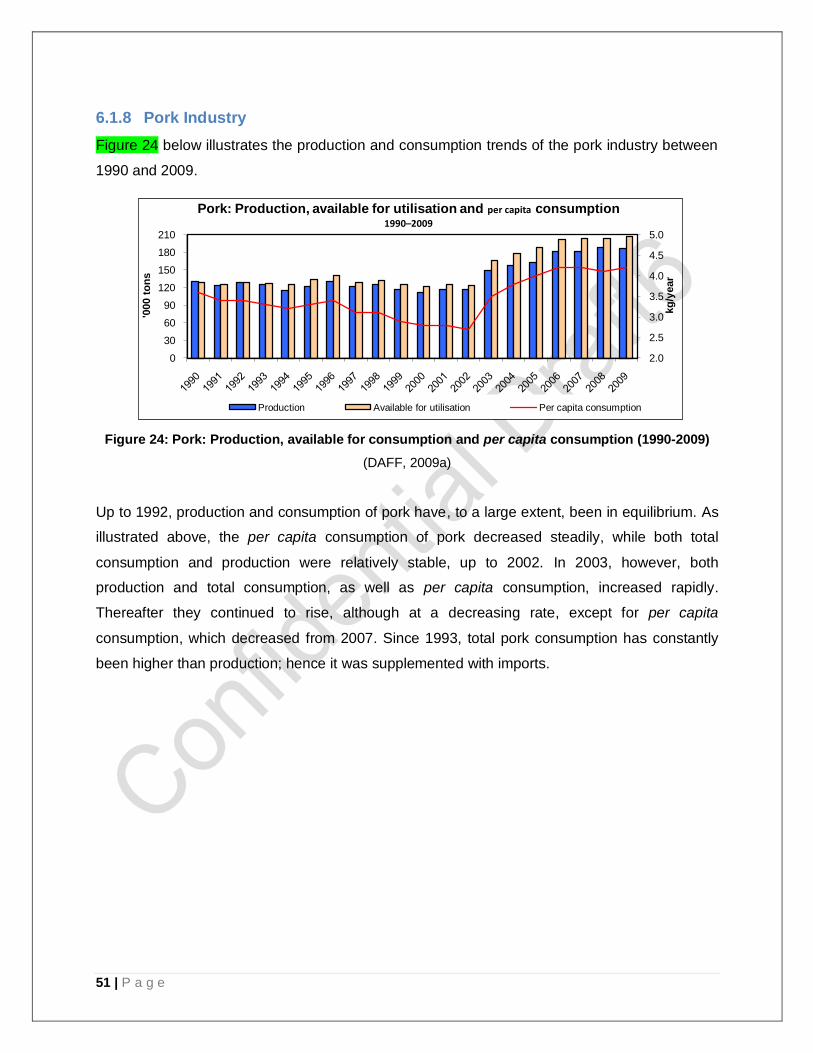
51 | P a g e
6.1.8 Pork Industry
Figure 24 below illustrates the production and consumption trends of the pork industry between
1990 and 2009.
Figure 24: Pork: Production, available for consumption and per capita consumption (1990-2009)
(DAFF, 2009a)
Up to 1992, production and consumption of pork have, to a large extent, been in equilibrium. As
illustrated above, the per capita consumption of pork decreased steadily, while both total
consumption and production were relatively stable, up to 2002. In 2003, however, both
production and total consumption, as well as per capita consumption, increased rapidly.
Thereafter they continued to rise, although at a decreasing rate, except for per capita
consumption, which decreased from 2007. Since 1993, total pork consumption has constantly
been higher than production; hence it was supplemented with imports.
2.0
2.5
3.0
3.5
4.0
4.5
5.0
0
30
60
90
120
150
180
210
kg
/year
'000 t
on
s
Pork: Production, available for utilisation and per capita consumption1990–2009
Production Available for utilisation Per capita consumption
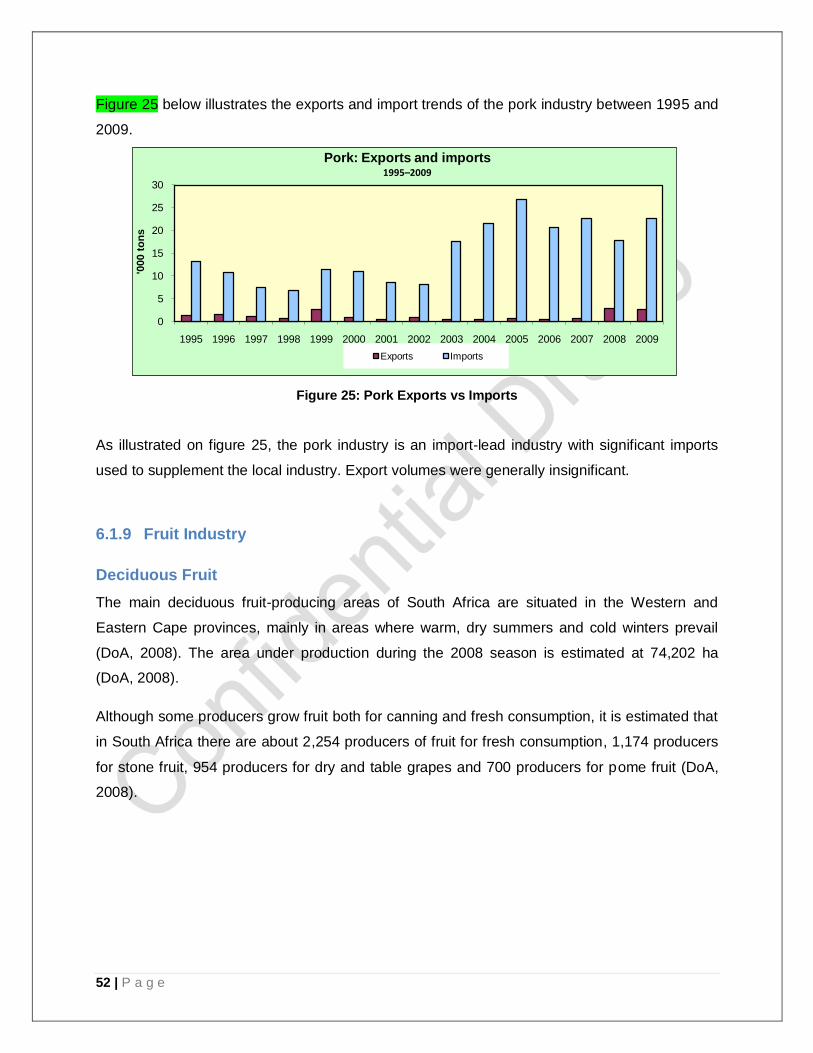
52 | P a g e
Figure 25 below illustrates the exports and import trends of the pork industry between 1995 and
2009.
Figure 25: Pork Exports vs Imports
As illustrated on figure 25, the pork industry is an import-lead industry with significant imports
used to supplement the local industry. Export volumes were generally insignificant.
6.1.9 Fruit Industry
Deciduous Fruit
The main deciduous fruit-producing areas of South Africa are situated in the Western and
Eastern Cape provinces, mainly in areas where warm, dry summers and cold winters prevail
(DoA, 2008). The area under production during the 2008 season is estimated at 74,202 ha
(DoA, 2008).
Although some producers grow fruit both for canning and fresh consumption, it is estimated that
in South Africa there are about 2,254 producers of fruit for fresh consumption, 1,174 producers
for stone fruit, 954 producers for dry and table grapes and 700 producers for pome fruit (DoA,
2008).
0
5
10
15
20
25
30
1995 1996 1997 1998 1999 2000 2001 2002 2003 2004 2005 2006 2007 2008 2009
'000 t
on
s
Pork: Exports and imports1995–2009
Exports Imports
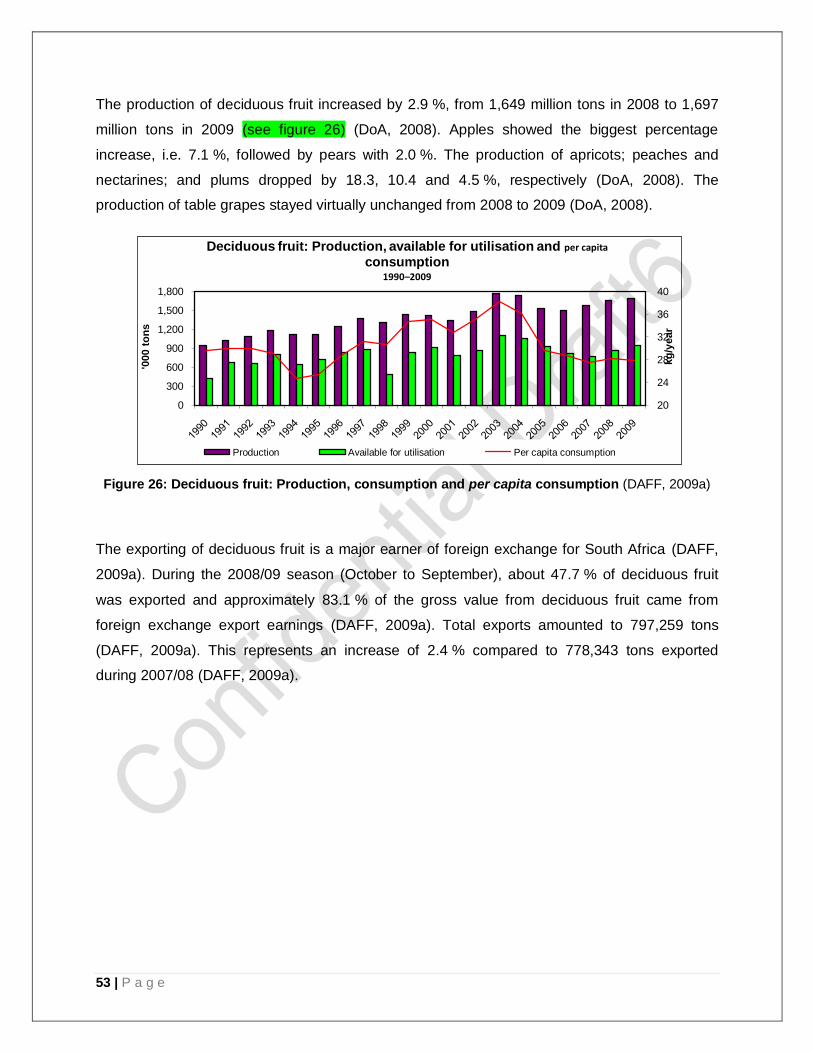
53 | P a g e
The production of deciduous fruit increased by 2.9 %, from 1,649 million tons in 2008 to 1,697
million tons in 2009 (see figure 26) (DoA, 2008). Apples showed the biggest percentage
increase, i.e. 7.1 %, followed by pears with 2.0 %. The production of apricots; peaches and
nectarines; and plums dropped by 18.3, 10.4 and 4.5 %, respectively (DoA, 2008). The
production of table grapes stayed virtually unchanged from 2008 to 2009 (DoA, 2008).
Figure 26: Deciduous fruit: Production, consumption and per capita consumption (DAFF, 2009a)
The exporting of deciduous fruit is a major earner of foreign exchange for South Africa (DAFF,
2009a). During the 2008/09 season (October to September), about 47.7 % of deciduous fruit
was exported and approximately 83.1 % of the gross value from deciduous fruit came from
foreign exchange export earnings (DAFF, 2009a). Total exports amounted to 797,259 tons
(DAFF, 2009a). This represents an increase of 2.4 % compared to 778,343 tons exported
during 2007/08 (DAFF, 2009a).
20
24
28
32
36
40
0
300
600
900
1,200
1,500
1,800
kg
/year
'000 t
on
s
Deciduous fruit: Production, available for utilisation and per capita
consumption1990–2009
Production Available for utilisation Per capita consumption
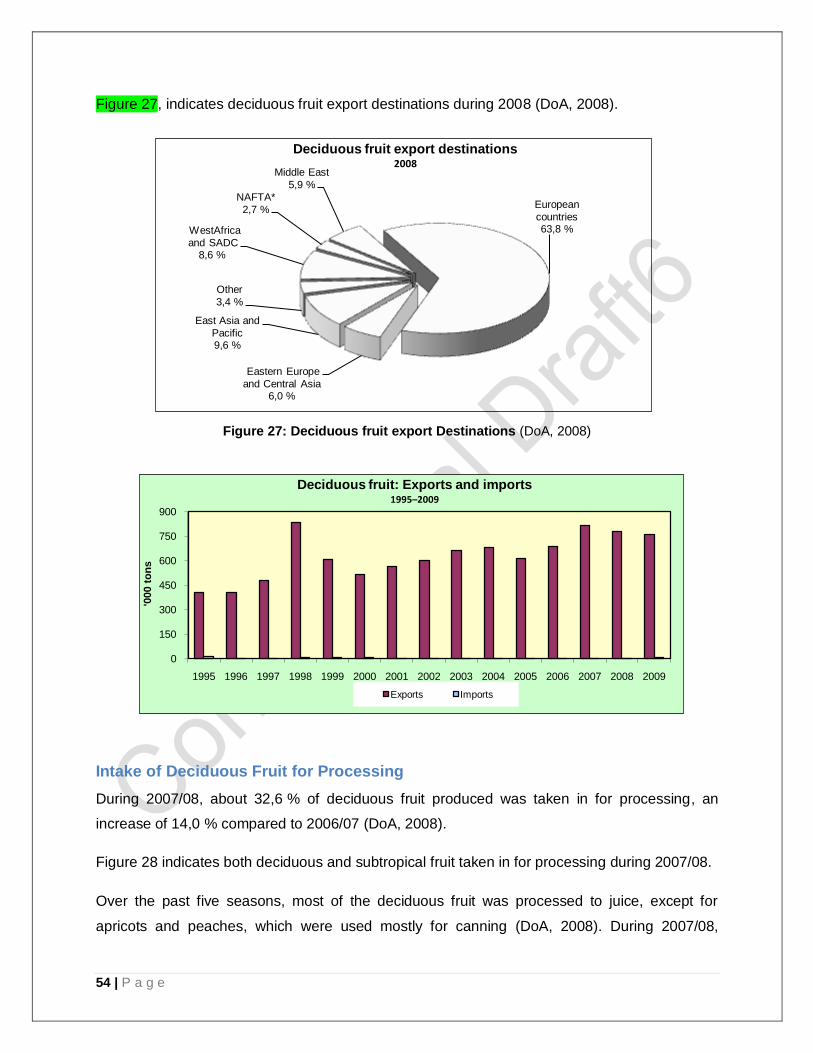
54 | P a g e
Figure 27, indicates deciduous fruit export destinations during 2008 (DoA, 2008).
Figure 27: Deciduous fruit export Destinations (DoA, 2008)
Intake of Deciduous Fruit for Processing
During 2007/08, about 32,6 % of deciduous fruit produced was taken in for processing, an
increase of 14,0 % compared to 2006/07 (DoA, 2008).
Figure 28 indicates both deciduous and subtropical fruit taken in for processing during 2007/08.
Over the past five seasons, most of the deciduous fruit was processed to juice, except for
apricots and peaches, which were used mostly for canning (DoA, 2008). During 2007/08,
0
150
300
450
600
750
900
1995 1996 1997 1998 1999 2000 2001 2002 2003 2004 2005 2006 2007 2008 2009
'000 t
on
s
Deciduous fruit: Exports and imports1995–2009
Exports Imports
European
countries63,8 %
Eastern Europe
and Central Asia6,0 %
East Asia and
Pacific9,6 %
Other
3,4 %
WestAfrica
and SADC8,6 %
NAFTA*
2,7 %
Middle East
5,9 %
Deciduous fruit export destinations2008
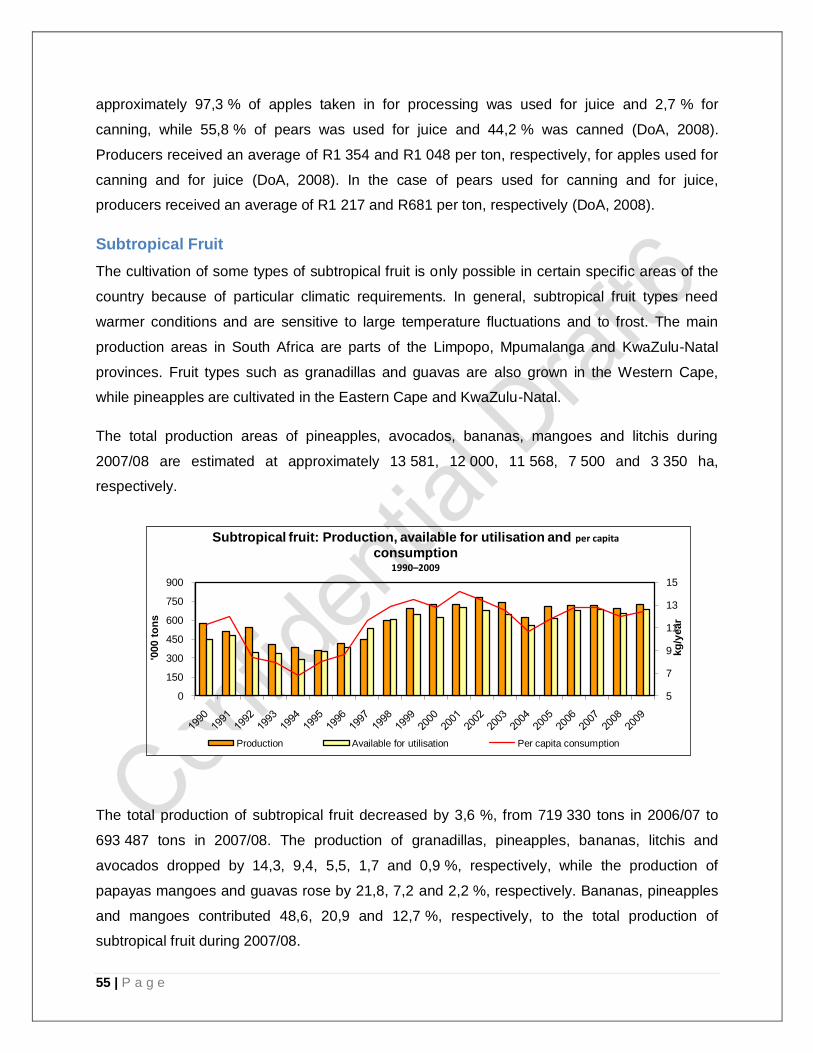
55 | P a g e
approximately 97,3 % of apples taken in for processing was used for juice and 2,7 % for
canning, while 55,8 % of pears was used for juice and 44,2 % was canned (DoA, 2008).
Producers received an average of R1 354 and R1 048 per ton, respectively, for apples used for
canning and for juice (DoA, 2008). In the case of pears used for canning and for juice,
producers received an average of R1 217 and R681 per ton, respectively (DoA, 2008).
Subtropical Fruit
The cultivation of some types of subtropical fruit is only possible in certain specific areas of the
country because of particular climatic requirements. In general, subtropical fruit types need
warmer conditions and are sensitive to large temperature fluctuations and to frost. The main
production areas in South Africa are parts of the Limpopo, Mpumalanga and KwaZulu-Natal
provinces. Fruit types such as granadillas and guavas are also grown in the Western Cape,
while pineapples are cultivated in the Eastern Cape and KwaZulu-Natal.
The total production areas of pineapples, avocados, bananas, mangoes and litchis during
2007/08 are estimated at approximately 13 581, 12 000, 11 568, 7 500 and 3 350 ha,
respectively.
The total production of subtropical fruit decreased by 3,6 %, from 719 330 tons in 2006/07 to
693 487 tons in 2007/08. The production of granadillas, pineapples, bananas, litchis and
avocados dropped by 14,3, 9,4, 5,5, 1,7 and 0,9 %, respectively, while the production of
papayas mangoes and guavas rose by 21,8, 7,2 and 2,2 %, respectively. Bananas, pineapples
and mangoes contributed 48,6, 20,9 and 12,7 %, respectively, to the total production of
subtropical fruit during 2007/08.
5
7
9
11
13
15
0
150
300
450
600
750
900
kg
/year
'000 t
on
s
Subtropical fruit: Production, available for utilisation and per capita
consumption1990–2009
Production Available for utilisation Per capita consumption
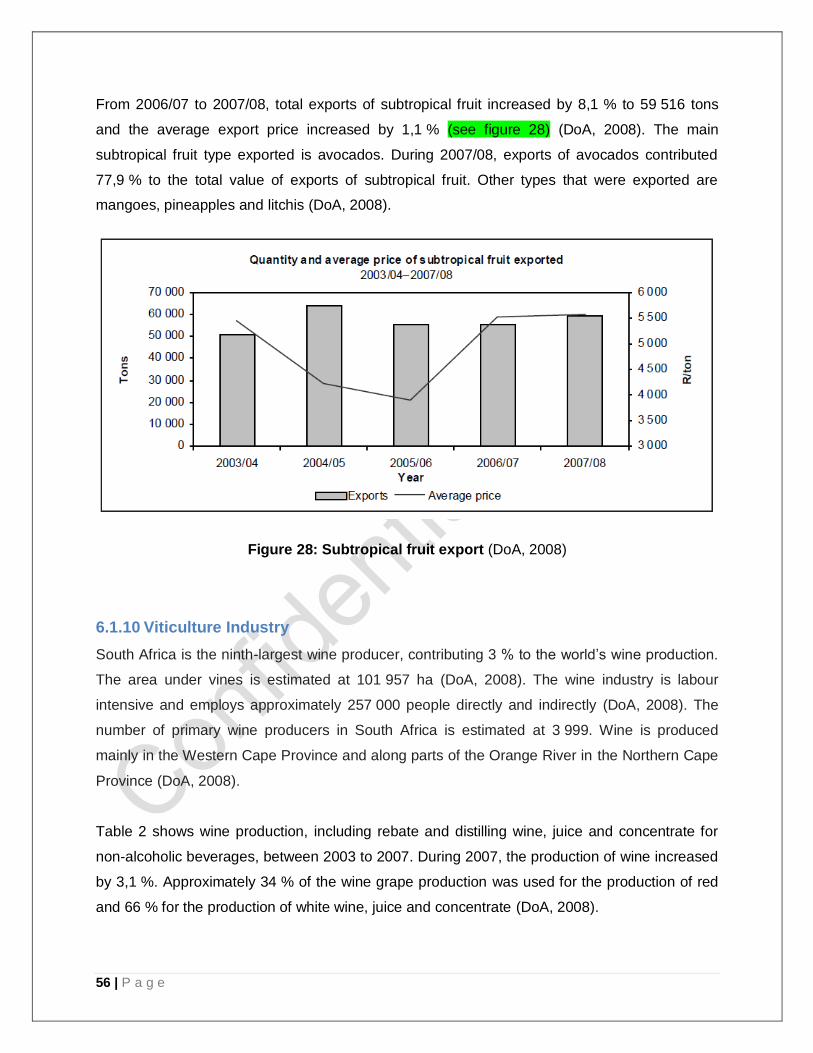
56 | P a g e
From 2006/07 to 2007/08, total exports of subtropical fruit increased by 8,1 % to 59 516 tons
and the average export price increased by 1,1 % (see figure 28) (DoA, 2008). The main
subtropical fruit type exported is avocados. During 2007/08, exports of avocados contributed
77,9 % to the total value of exports of subtropical fruit. Other types that were exported are
mangoes, pineapples and litchis (DoA, 2008).
Figure 28: Subtropical fruit export (DoA, 2008)
6.1.10 Viticulture Industry
South Africa is the ninth-largest wine producer, contributing 3 % to the world‘s wine production.
The area under vines is estimated at 101 957 ha (DoA, 2008). The wine industry is labour
intensive and employs approximately 257 000 people directly and indirectly (DoA, 2008). The
number of primary wine producers in South Africa is estimated at 3 999. Wine is produced
mainly in the Western Cape Province and along parts of the Orange River in the Northern Cape
Province (DoA, 2008).
Table 2 shows wine production, including rebate and distilling wine, juice and concentrate for
non-alcoholic beverages, between 2003 to 2007. During 2007, the production of wine increased
by 3,1 %. Approximately 34 % of the wine grape production was used for the production of red
and 66 % for the production of white wine, juice and concentrate (DoA, 2008).
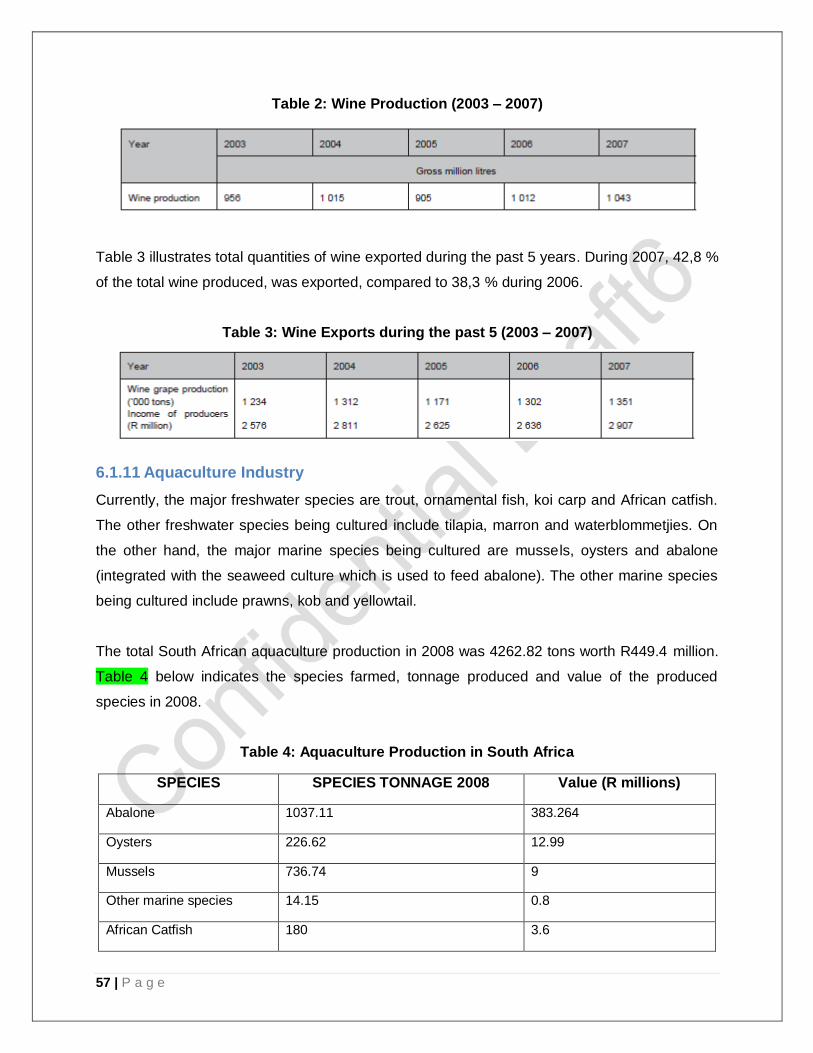
57 | P a g e
Table 2: Wine Production (2003 – 2007)
Table 3 illustrates total quantities of wine exported during the past 5 years. During 2007, 42,8 %
of the total wine produced, was exported, compared to 38,3 % during 2006.
Table 3: Wine Exports during the past 5 (2003 – 2007)
6.1.11 Aquaculture Industry
Currently, the major freshwater species are trout, ornamental fish, koi carp and African catfish.
The other freshwater species being cultured include tilapia, marron and waterblommetjies. On
the other hand, the major marine species being cultured are mussels, oysters and abalone
(integrated with the seaweed culture which is used to feed abalone). The other marine species
being cultured include prawns, kob and yellowtail.
The total South African aquaculture production in 2008 was 4262.82 tons worth R449.4 million.
Table 4 below indicates the species farmed, tonnage produced and value of the produced
species in 2008.
Table 4: Aquaculture Production in South Africa
SPECIES SPECIES TONNAGE 2008 Value (R millions)
Abalone 1037.11 383.264
Oysters 226.62 12.99
Mussels 736.74 9
Other marine species 14.15 0.8
African Catfish 180 3.6
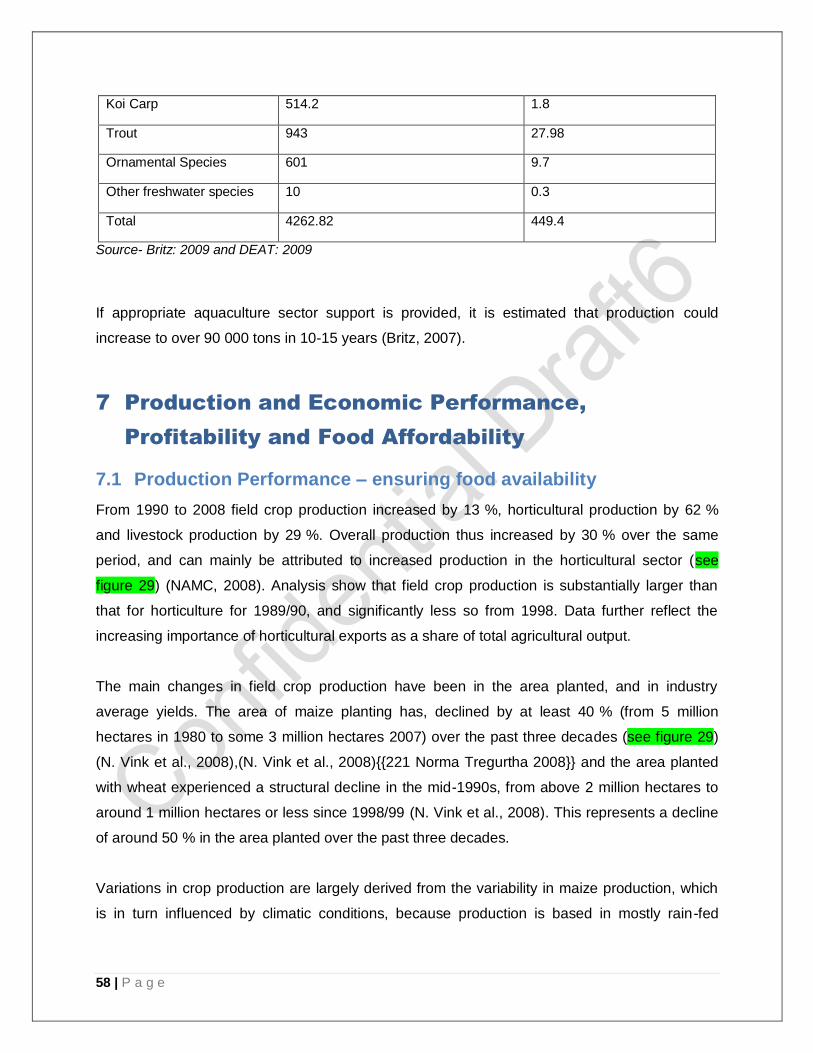
58 | P a g e
Koi Carp 514.2 1.8
Trout 943 27.98
Ornamental Species 601 9.7
Other freshwater species 10 0.3
Total 4262.82 449.4
Source- Britz: 2009 and DEAT: 2009
If appropriate aquaculture sector support is provided, it is estimated that production could
increase to over 90 000 tons in 10-15 years (Britz, 2007).
7 Production and Economic Performance,
Profitability and Food Affordability
7.1 Production Performance – ensuring food availability
From 1990 to 2008 field crop production increased by 13 %, horticultural production by 62 %
and livestock production by 29 %. Overall production thus increased by 30 % over the same
period, and can mainly be attributed to increased production in the horticultural sector (see
figure 29) (NAMC, 2008). Analysis show that field crop production is substantially larger than
that for horticulture for 1989/90, and significantly less so from 1998. Data further reflect the
increasing importance of horticultural exports as a share of total agricultural output.
The main changes in field crop production have been in the area planted, and in industry
average yields. The area of maize planting has, declined by at least 40 % (from 5 million
hectares in 1980 to some 3 million hectares 2007) over the past three decades (see figure 29)
(N. Vink et al., 2008),(N. Vink et al., 2008){{221 Norma Tregurtha 2008}} and the area planted
with wheat experienced a structural decline in the mid-1990s, from above 2 million hectares to
around 1 million hectares or less since 1998/99 (N. Vink et al., 2008). This represents a decline
of around 50 % in the area planted over the past three decades.
Variations in crop production are largely derived from the variability in maize production, which
is in turn influenced by climatic conditions, because production is based in mostly rain-fed
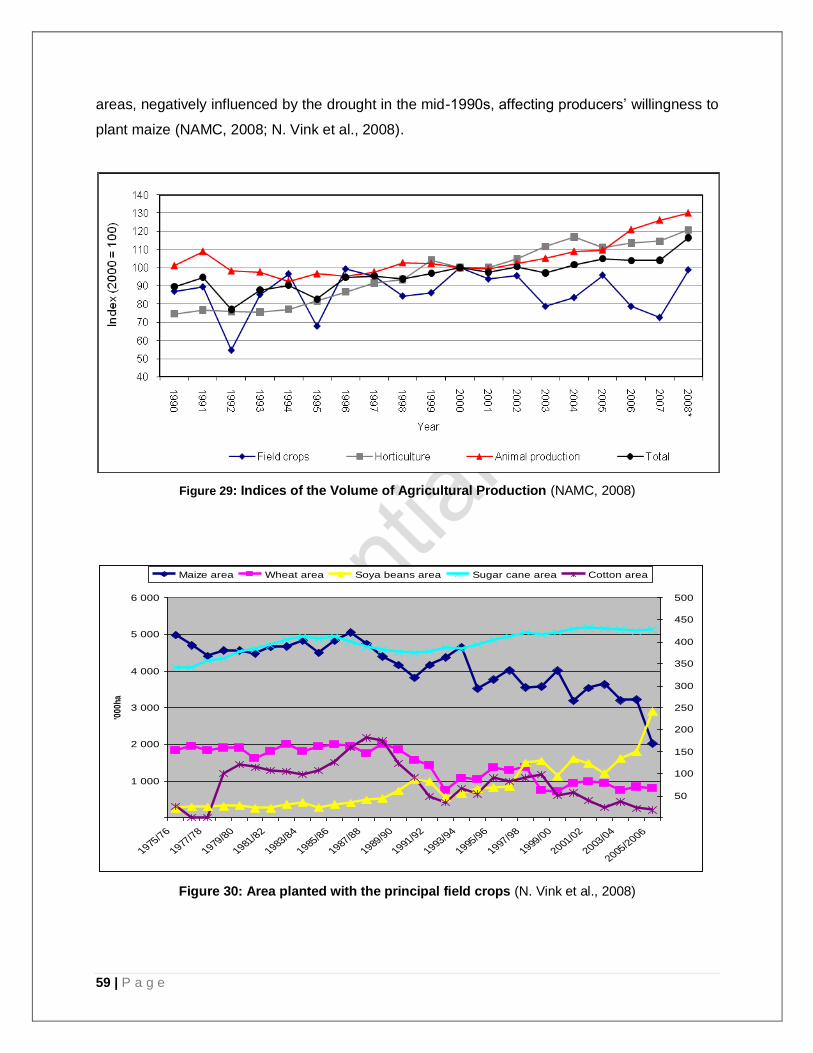
59 | P a g e
areas, negatively influenced by the drought in the mid-1990s, affecting producers‘ willingness to
plant maize (NAMC, 2008; N. Vink et al., 2008).
Figure 29: Indices of the Volume of Agricultural Production (NAMC, 2008)
Figure 30: Area planted with the principal field crops (N. Vink et al., 2008)
1 000
2 000
3 000
4 000
5 000
6 000
1975/7
6
1977/7
8
1979/8
0
1981/8
2
1983/8
4
1985/8
6
1987/8
8
1989/9
0
1991/9
2
1993/9
4
1995/9
6
1997/9
8
1999/0
0
2001/0
2
2003/0
4
2005/2
006
'000
ha
50
100
150
200
250
300
350
400
450
500
Maize area Wheat area Soya beans area Sugar cane area Cotton area
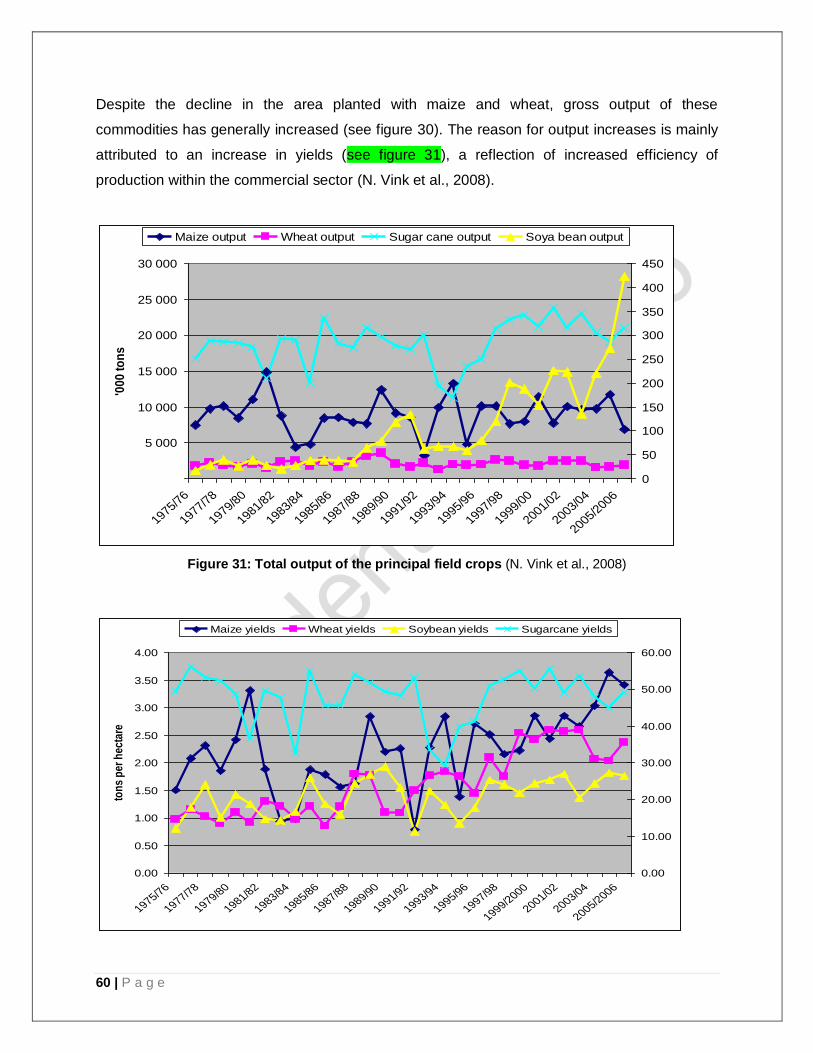
60 | P a g e
Despite the decline in the area planted with maize and wheat, gross output of these
commodities has generally increased (see figure 30). The reason for output increases is mainly
attributed to an increase in yields (see figure 31), a reflection of increased efficiency of
production within the commercial sector (N. Vink et al., 2008).
Figure 31: Total output of the principal field crops (N. Vink et al., 2008)
5 000
10 000
15 000
20 000
25 000
30 000
1975/76
1977/78
1979/80
1981/82
1983/84
1985/86
1987/88
1989/90
1991/92
1993/94
1995/96
1997/98
1999/00
2001/02
2003/04
2005/2006
'00
0 t
on
s
0
50
100
150
200
250
300
350
400
450
Maize output Wheat output Sugar cane output Soya bean output
0.00
0.50
1.00
1.50
2.00
2.50
3.00
3.50
4.00
1975/76
1977/78
1979/80
1981/82
1983/84
1985/86
1987/88
1989/90
1991/92
1993/94
1995/96
1997/98
1999/2000
2001/02
2003/04
2005/2006
ton
s p
er h
ecta
re
0.00
10.00
20.00
30.00
40.00
50.00
60.00
Maize yields Wheat yields Soybean yields Sugarcane yields
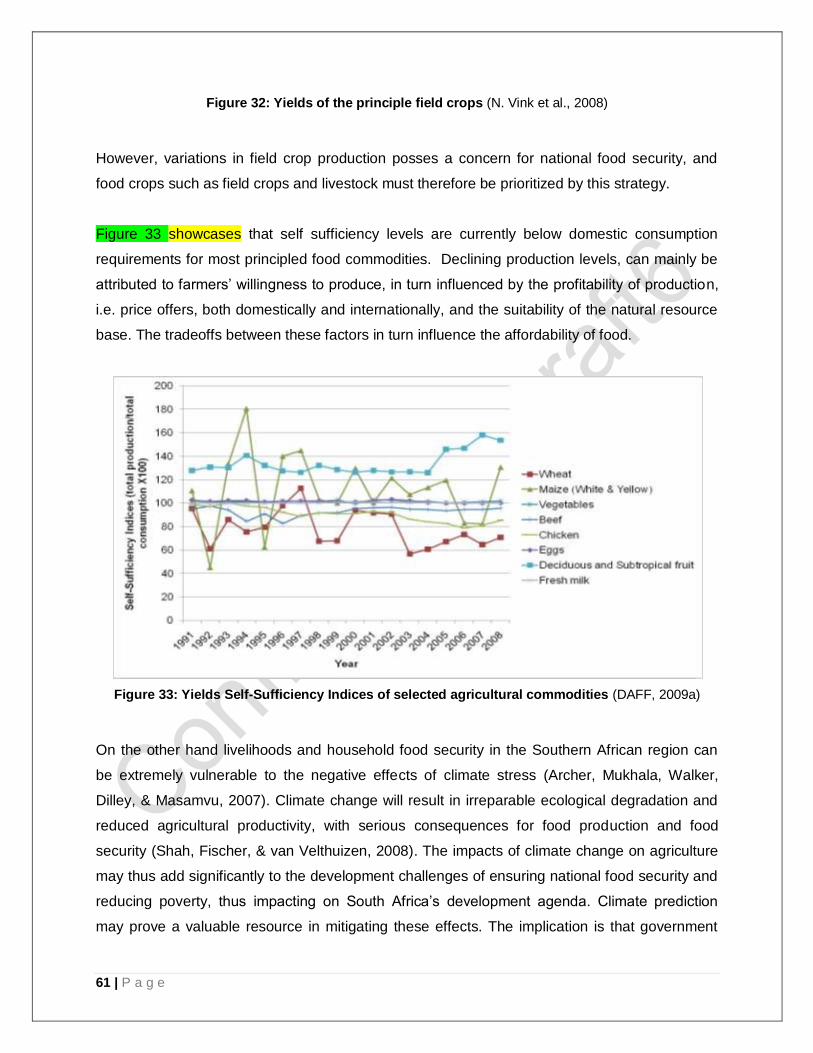
61 | P a g e
Figure 32: Yields of the principle field crops (N. Vink et al., 2008)
However, variations in field crop production posses a concern for national food security, and
food crops such as field crops and livestock must therefore be prioritized by this strategy.
Figure 33 showcases that self sufficiency levels are currently below domestic consumption
requirements for most principled food commodities. Declining production levels, can mainly be
attributed to farmers‘ willingness to produce, in turn influenced by the profitability of production,
i.e. price offers, both domestically and internationally, and the suitability of the natural resource
base. The tradeoffs between these factors in turn influence the affordability of food.
Figure 33: Yields Self-Sufficiency Indices of selected agricultural commodities (DAFF, 2009a)
On the other hand livelihoods and household food security in the Southern African region can
be extremely vulnerable to the negative effects of climate stress (Archer, Mukhala, Walker,
Dilley, & Masamvu, 2007). Climate change will result in irreparable ecological degradation and
reduced agricultural productivity, with serious consequences for food production and food
security (Shah, Fischer, & van Velthuizen, 2008). The impacts of climate change on agriculture
may thus add significantly to the development challenges of ensuring national food security and
reducing poverty, thus impacting on South Africa‘s development agenda. Climate prediction
may prove a valuable resource in mitigating these effects. The implication is that government
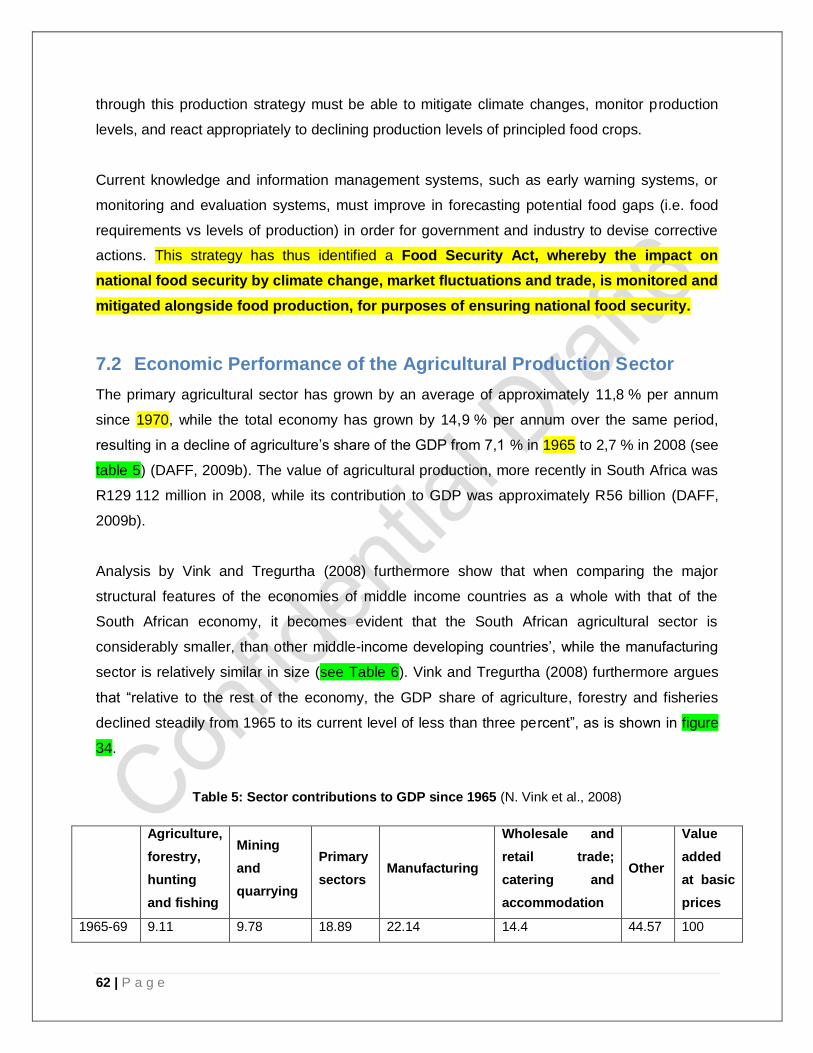
62 | P a g e
through this production strategy must be able to mitigate climate changes, monitor production
levels, and react appropriately to declining production levels of principled food crops.
Current knowledge and information management systems, such as early warning systems, or
monitoring and evaluation systems, must improve in forecasting potential food gaps (i.e. food
requirements vs levels of production) in order for government and industry to devise corrective
actions. This strategy has thus identified a Food Security Act, whereby the impact on
national food security by climate change, market fluctuations and trade, is monitored and
mitigated alongside food production, for purposes of ensuring national food security.
7.2 Economic Performance of the Agricultural Production Sector
The primary agricultural sector has grown by an average of approximately 11,8 % per annum
since 1970, while the total economy has grown by 14,9 % per annum over the same period,
resulting in a decline of agriculture‘s share of the GDP from 7,1 % in 1965 to 2,7 % in 2008 (see
table 5) (DAFF, 2009b). The value of agricultural production, more recently in South Africa was
R129 112 million in 2008, while its contribution to GDP was approximately R56 billion (DAFF,
2009b).
Analysis by Vink and Tregurtha (2008) furthermore show that when comparing the major
structural features of the economies of middle income countries as a whole with that of the
South African economy, it becomes evident that the South African agricultural sector is
considerably smaller, than other middle-income developing countries‘, while the manufacturing
sector is relatively similar in size (see Table 6). Vink and Tregurtha (2008) furthermore argues
that ―relative to the rest of the economy, the GDP share of agriculture, forestry and fisheries
declined steadily from 1965 to its current level of less than three percent‖, as is shown in figure
34.
Table 5: Sector contributions to GDP since 1965 (N. Vink et al., 2008)
Agriculture,
forestry,
hunting
and fishing
Mining
and
quarrying
Primary
sectors Manufacturing
Wholesale and
retail trade;
catering and
accommodation
Other
Value
added
at basic
prices
1965-69 9.11 9.78 18.89 22.14 14.4 44.57 100
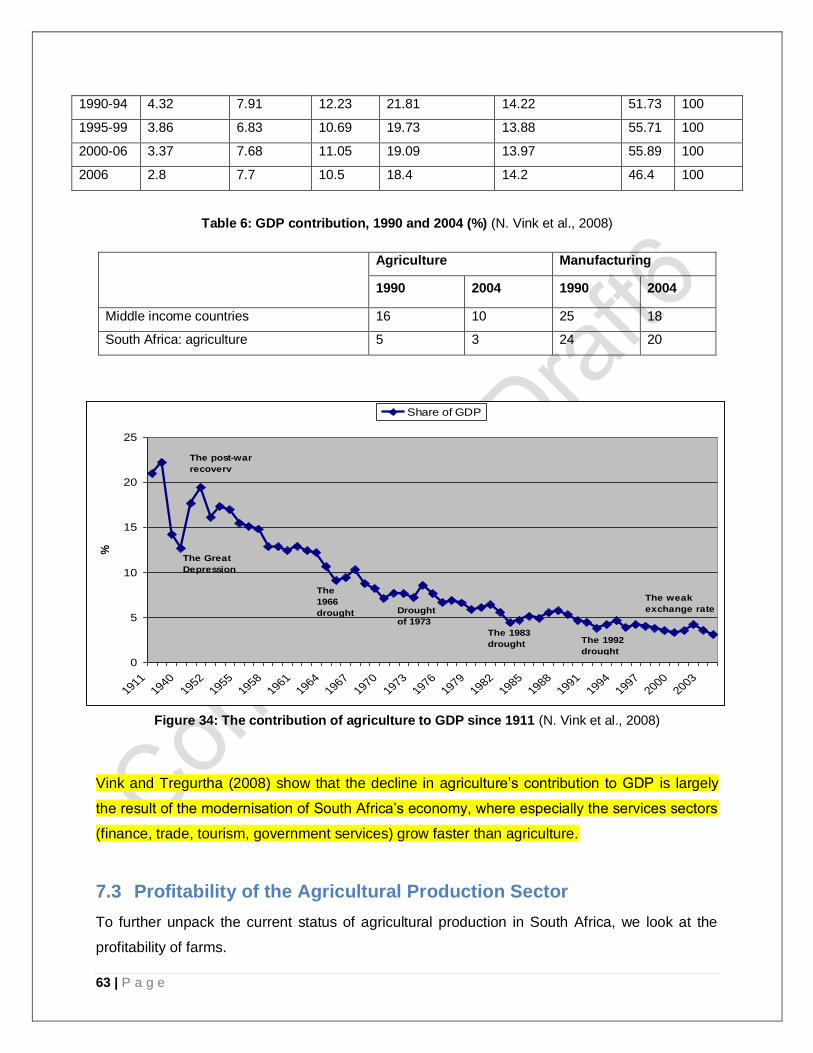
63 | P a g e
1990-94 4.32 7.91 12.23 21.81 14.22 51.73 100
1995-99 3.86 6.83 10.69 19.73 13.88 55.71 100
2000-06 3.37 7.68 11.05 19.09 13.97 55.89 100
2006 2.8 7.7 10.5 18.4 14.2 46.4 100
Table 6: GDP contribution, 1990 and 2004 (%) (N. Vink et al., 2008)
Agriculture Manufacturing
1990 2004 1990 2004
Middle income countries 16 10 25 18
South Africa: agriculture 5 3 24 20
Figure 34: The contribution of agriculture to GDP since 1911 (N. Vink et al., 2008)
Vink and Tregurtha (2008) show that the decline in agriculture‘s contribution to GDP is largely
the result of the modernisation of South Africa‘s economy, where especially the services sectors
(finance, trade, tourism, government services) grow faster than agriculture.
7.3 Profitability of the Agricultural Production Sector
To further unpack the current status of agricultural production in South Africa, we look at the
profitability of farms.
0
5
10
15
20
25
19111940
19521955
19581961
19641967
19701973
19761979
19821985
19881991
19941997
20002003
%
Share of GDP
The Great
Depression
The
1966
drought
The 1983
drought
The weak
exchange rate
The post-war
recovery
Drought
of 1973
The 1992
drought
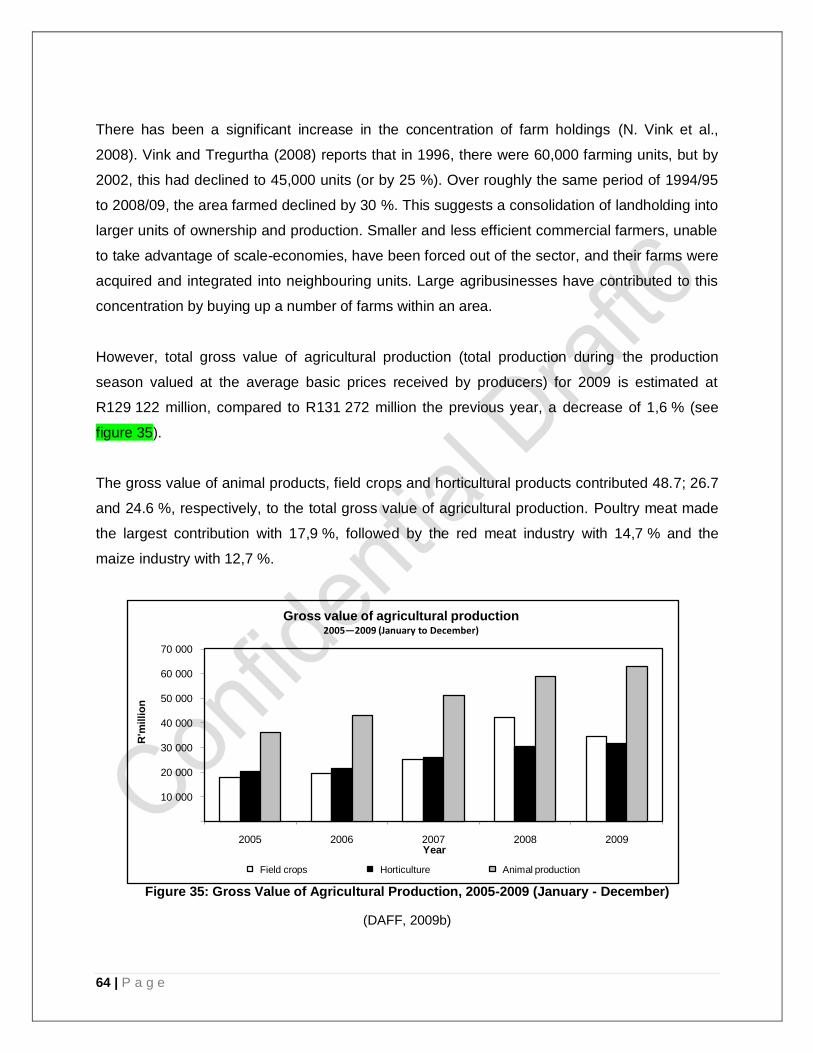
64 | P a g e
There has been a significant increase in the concentration of farm holdings (N. Vink et al.,
2008). Vink and Tregurtha (2008) reports that in 1996, there were 60,000 farming units, but by
2002, this had declined to 45,000 units (or by 25 %). Over roughly the same period of 1994/95
to 2008/09, the area farmed declined by 30 %. This suggests a consolidation of landholding into
larger units of ownership and production. Smaller and less efficient commercial farmers, unable
to take advantage of scale-economies, have been forced out of the sector, and their farms were
acquired and integrated into neighbouring units. Large agribusinesses have contributed to this
concentration by buying up a number of farms within an area.
However, total gross value of agricultural production (total production during the production
season valued at the average basic prices received by producers) for 2009 is estimated at
R129 122 million, compared to R131 272 million the previous year, a decrease of 1,6 % (see
figure 35).
The gross value of animal products, field crops and horticultural products contributed 48.7; 26.7
and 24.6 %, respectively, to the total gross value of agricultural production. Poultry meat made
the largest contribution with 17,9 %, followed by the red meat industry with 14,7 % and the
maize industry with 12,7 %.
Figure 35: Gross Value of Agricultural Production, 2005-2009 (January - December)
(DAFF, 2009b)
10 000
20 000
30 000
40 000
50 000
60 000
70 000
2005 2006 2007 2008 2009
R'm
illio
n
Year
Gross value of agricultural production2005—2009 (January to December)
Field crops Horticulture Animal production
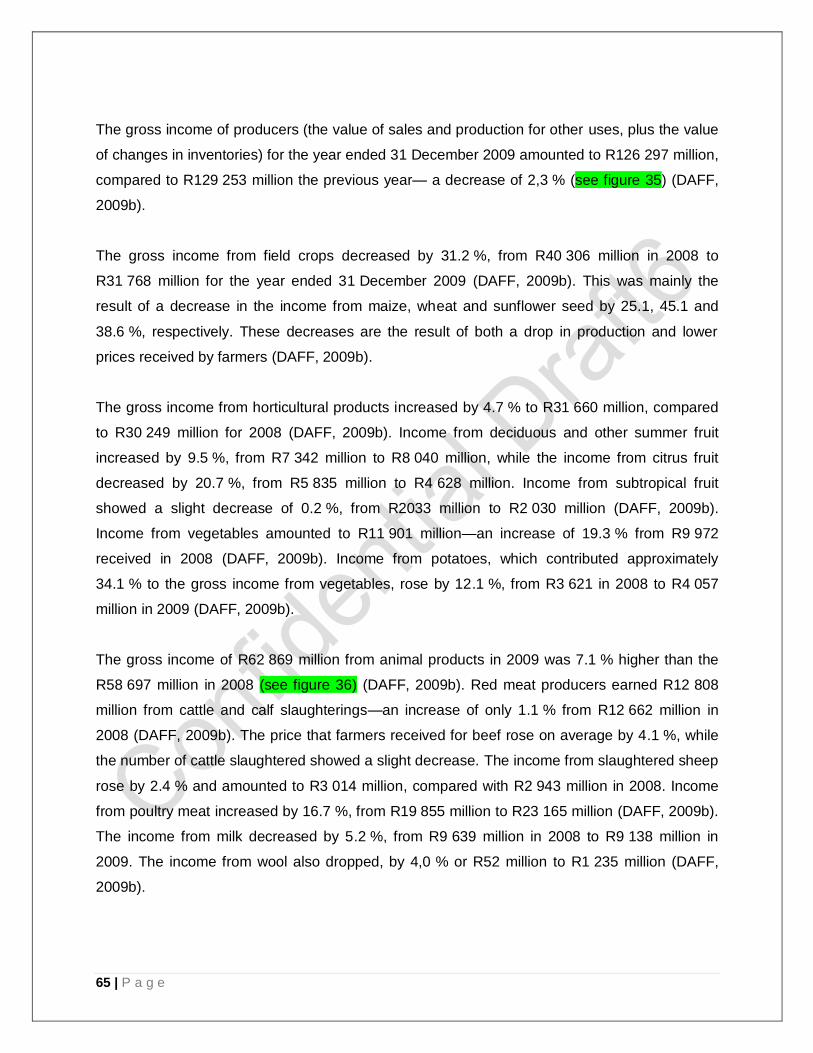
65 | P a g e
The gross income of producers (the value of sales and production for other uses, plus the value
of changes in inventories) for the year ended 31 December 2009 amounted to R126 297 million,
compared to R129 253 million the previous year— a decrease of 2,3 % (see figure 35) (DAFF,
2009b).
The gross income from field crops decreased by 31.2 %, from R40 306 million in 2008 to
R31 768 million for the year ended 31 December 2009 (DAFF, 2009b). This was mainly the
result of a decrease in the income from maize, wheat and sunflower seed by 25.1, 45.1 and
38.6 %, respectively. These decreases are the result of both a drop in production and lower
prices received by farmers (DAFF, 2009b).
The gross income from horticultural products increased by 4.7 % to R31 660 million, compared
to R30 249 million for 2008 (DAFF, 2009b). Income from deciduous and other summer fruit
increased by 9.5 %, from R7 342 million to R8 040 million, while the income from citrus fruit
decreased by 20.7 %, from R5 835 million to R4 628 million. Income from subtropical fruit
showed a slight decrease of 0.2 %, from R2033 million to R2 030 million (DAFF, 2009b).
Income from vegetables amounted to R11 901 million—an increase of 19.3 % from R9 972
received in 2008 (DAFF, 2009b). Income from potatoes, which contributed approximately
34.1 % to the gross income from vegetables, rose by 12.1 %, from R3 621 in 2008 to R4 057
million in 2009 (DAFF, 2009b).
The gross income of R62 869 million from animal products in 2009 was 7.1 % higher than the
R58 697 million in 2008 (see figure 36) (DAFF, 2009b). Red meat producers earned R12 808
million from cattle and calf slaughterings—an increase of only 1.1 % from R12 662 million in
2008 (DAFF, 2009b). The price that farmers received for beef rose on average by 4.1 %, while
the number of cattle slaughtered showed a slight decrease. The income from slaughtered sheep
rose by 2.4 % and amounted to R3 014 million, compared with R2 943 million in 2008. Income
from poultry meat increased by 16.7 %, from R19 855 million to R23 165 million (DAFF, 2009b).
The income from milk decreased by 5.2 %, from R9 639 million in 2008 to R9 138 million in
2009. The income from wool also dropped, by 4,0 % or R52 million to R1 235 million (DAFF,
2009b).
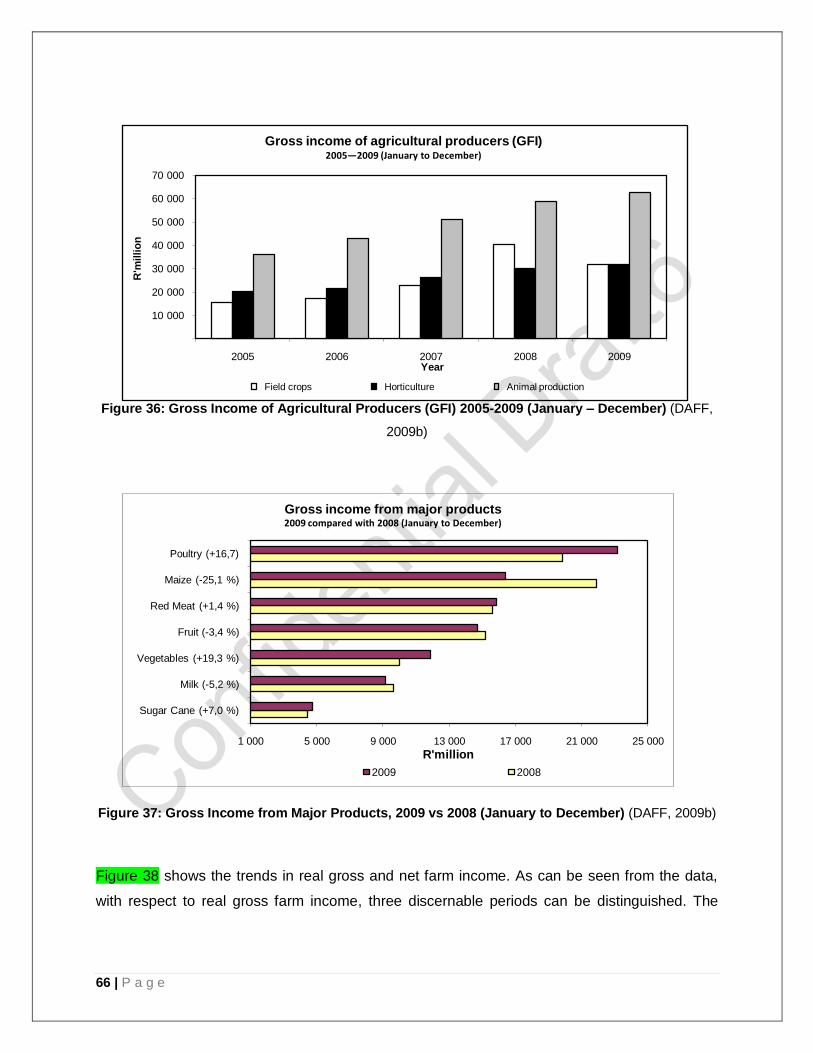
66 | P a g e
Figure 36: Gross Income of Agricultural Producers (GFI) 2005-2009 (January – December) (DAFF,
2009b)
Figure 37: Gross Income from Major Products, 2009 vs 2008 (January to December) (DAFF, 2009b)
Figure 38 shows the trends in real gross and net farm income. As can be seen from the data,
with respect to real gross farm income, three discernable periods can be distinguished. The
10 000
20 000
30 000
40 000
50 000
60 000
70 000
2005 2006 2007 2008 2009
R'm
illio
n
Year
Gross income of agricultural producers (GFI)2005—2009 (January to December)
Field crops Horticulture Animal production
1 000 5 000 9 000 13 000 17 000 21 000 25 000
Sugar Cane (+7,0 %)
Milk (-5,2 %)
Vegetables (+19,3 %)
Fruit (-3,4 %)
Red Meat (+1,4 %)
Maize (-25,1 %)
Poultry (+16,7)
R'million
Gross income from major products2009 compared with 2008 (January to December)
2009 2008
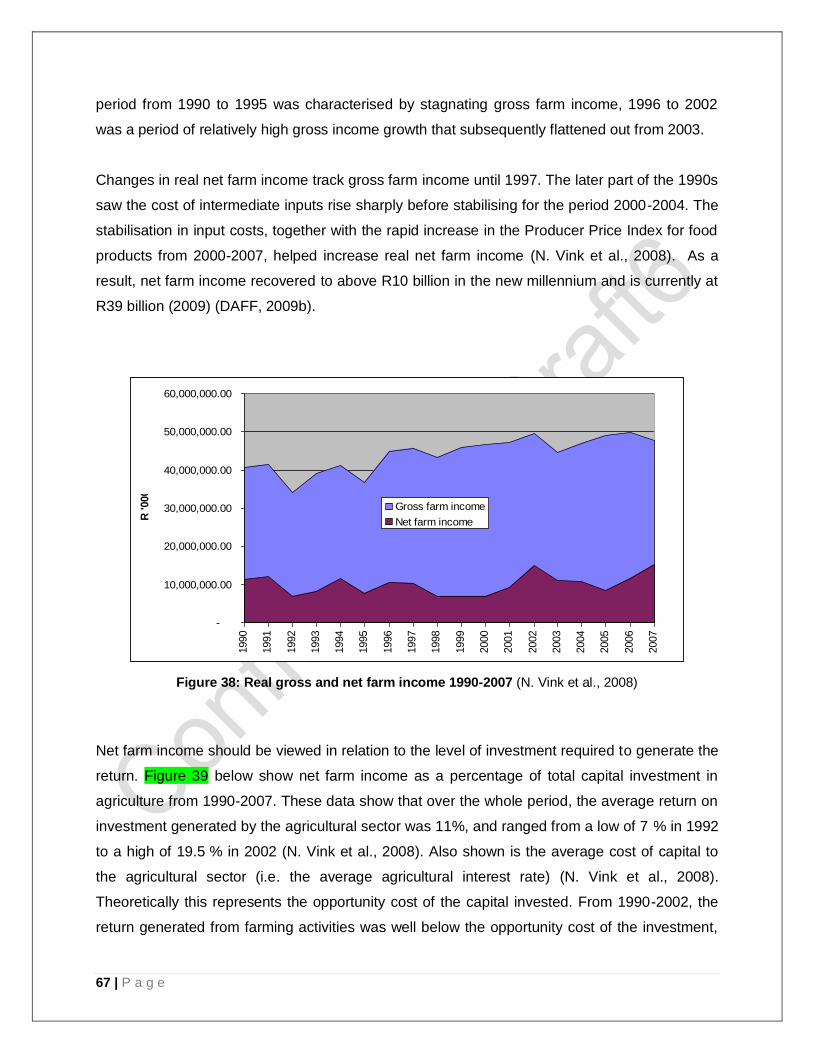
67 | P a g e
period from 1990 to 1995 was characterised by stagnating gross farm income, 1996 to 2002
was a period of relatively high gross income growth that subsequently flattened out from 2003.
Changes in real net farm income track gross farm income until 1997. The later part of the 1990s
saw the cost of intermediate inputs rise sharply before stabilising for the period 2000-2004. The
stabilisation in input costs, together with the rapid increase in the Producer Price Index for food
products from 2000-2007, helped increase real net farm income (N. Vink et al., 2008). As a
result, net farm income recovered to above R10 billion in the new millennium and is currently at
R39 billion (2009) (DAFF, 2009b).
Figure 38: Real gross and net farm income 1990-2007 (N. Vink et al., 2008)
Net farm income should be viewed in relation to the level of investment required to generate the
return. Figure 39 below show net farm income as a percentage of total capital investment in
agriculture from 1990-2007. These data show that over the whole period, the average return on
investment generated by the agricultural sector was 11%, and ranged from a low of 7 % in 1992
to a high of 19.5 % in 2002 (N. Vink et al., 2008). Also shown is the average cost of capital to
the agricultural sector (i.e. the average agricultural interest rate) (N. Vink et al., 2008).
Theoretically this represents the opportunity cost of the capital invested. From 1990-2002, the
return generated from farming activities was well below the opportunity cost of the investment,
-
10,000,000.00
20,000,000.00
30,000,000.00
40,000,000.00
50,000,000.00
60,000,000.00
1990
1991
1992
1993
1994
1995
1996
1997
1998
1999
2000
2001
2002
2003
2004
2005
2006
2007
R '000
Gross farm income
Net farm income
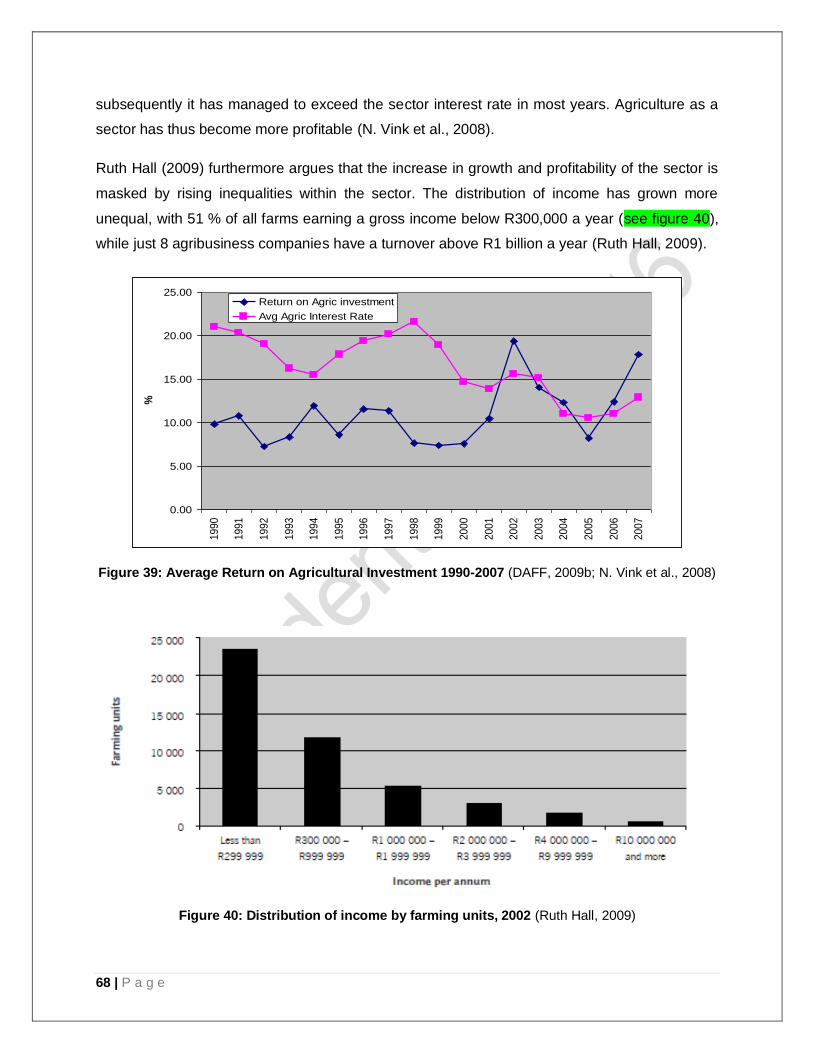
68 | P a g e
subsequently it has managed to exceed the sector interest rate in most years. Agriculture as a
sector has thus become more profitable (N. Vink et al., 2008).
Ruth Hall (2009) furthermore argues that the increase in growth and profitability of the sector is
masked by rising inequalities within the sector. The distribution of income has grown more
unequal, with 51 % of all farms earning a gross income below R300,000 a year (see figure 40),
while just 8 agribusiness companies have a turnover above R1 billion a year (Ruth Hall, 2009).
Figure 39: Average Return on Agricultural Investment 1990-2007 (DAFF, 2009b; N. Vink et al., 2008)
Figure 40: Distribution of income by farming units, 2002 (Ruth Hall, 2009)
0.00
5.00
10.00
15.00
20.00
25.00
1990
1991
1992
1993
1994
1995
1996
1997
1998
1999
2000
2001
2002
2003
2004
2005
2006
2007
%
Return on Agric investment
Avg Agric Interest Rate
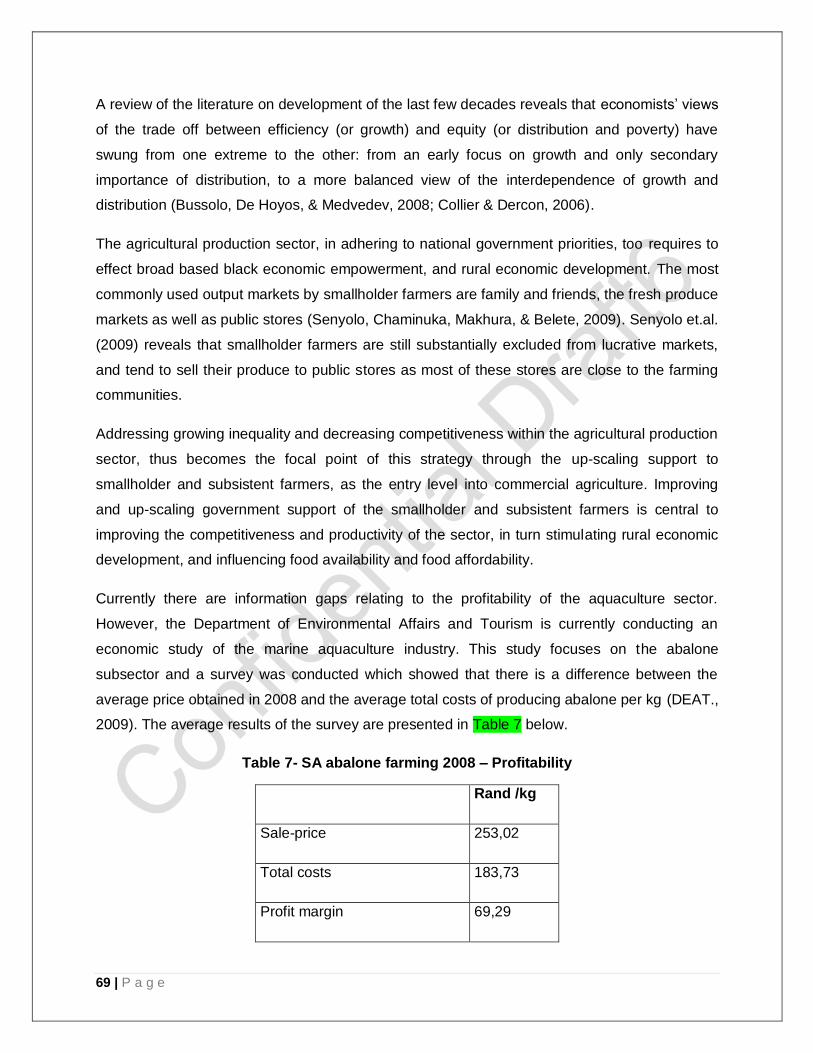
69 | P a g e
A review of the literature on development of the last few decades reveals that economists‘ views
of the trade off between efficiency (or growth) and equity (or distribution and poverty) have
swung from one extreme to the other: from an early focus on growth and only secondary
importance of distribution, to a more balanced view of the interdependence of growth and
distribution (Bussolo, De Hoyos, & Medvedev, 2008; Collier & Dercon, 2006).
The agricultural production sector, in adhering to national government priorities, too requires to
effect broad based black economic empowerment, and rural economic development. The most
commonly used output markets by smallholder farmers are family and friends, the fresh produce
markets as well as public stores (Senyolo, Chaminuka, Makhura, & Belete, 2009). Senyolo et.al.
(2009) reveals that smallholder farmers are still substantially excluded from lucrative markets,
and tend to sell their produce to public stores as most of these stores are close to the farming
communities.
Addressing growing inequality and decreasing competitiveness within the agricultural production
sector, thus becomes the focal point of this strategy through the up-scaling support to
smallholder and subsistent farmers, as the entry level into commercial agriculture. Improving
and up-scaling government support of the smallholder and subsistent farmers is central to
improving the competitiveness and productivity of the sector, in turn stimulating rural economic
development, and influencing food availability and food affordability.
Currently there are information gaps relating to the profitability of the aquaculture sector.
However, the Department of Environmental Affairs and Tourism is currently conducting an
economic study of the marine aquaculture industry. This study focuses on the abalone
subsector and a survey was conducted which showed that there is a difference between the
average price obtained in 2008 and the average total costs of producing abalone per kg (DEAT.,
2009). The average results of the survey are presented in Table 7 below.
Table 7- SA abalone farming 2008 – Profitability
Rand /kg
Sale-price 253,02
Total costs 183,73
Profit margin 69,29

70 | P a g e
(Source- DEAT: 2009)
The return on investment was also calculated based on the historical investment and on the
given replacement value in 2008 of the capital invested. The return on assets was calculated to
be around 15 %. These results indicate that the economic situation in the South African abalone
farming subsector was very good in 2008. The profitability seems to have a generous margin,
but will of course be vulnerable to the prices obtained in the market and to rising production
costs especially energy (electricity and fuel) and feed costs (DEAT., 2009).
7.4 Food Affordability
Determining whether food production levels and the profitability of the sector had any impact on
food availability and consumption, we draw rough inferences by looking at the population growth
which increased by 32 % between 1990 and 2008 while production increased by 30 % (NAMC,
2008). Without factoring in exports and imports, based on production levels alone, we notice
that South Africa lags in producing enough food for its growing population. The NAMC (2008)
correctly explains that ―the increase in agricultural production was largely due to the increase in
horticultural production‖, the expansion of production in the field crop sector is thus reason for
concern if one considers the trend in population growth and its importance in ensuring national
food security.
With respect to consumer prices we see that the consumer price index (CPI) on all items has in
fact increased by 11.5 % for the year ending 31 December 2008. The CPI of food increased by
13.9 % and that of nonfood items by 7.8 % (DoA, 2008a). Meat, grain products, vegetables and
fruit prices increased by 8.0 %, 21.3%, 13.5 %, and 22.1 %, respectively. Dairy products and
eggs rose by 18.7 % and sugar and related products by 22.9 % (DoA, 2008b). However wheat
and maize prices have decreased remarkably for 2008/09, i.e. by 36.24 % and 12.19 %
respectively (NAMC, 2009a). On average, the price of wheat and maize products decreased by
0.71 % and 5.31 % respectively for January to April 2009 (DAFF, 2009b; DoA, 2008).
Extracted from NAMC (2009) we look at the impact of food inflation on consumers. From
January 2007 to December 2008 the cost of a basic food basket rose steadily by R110 (44 %)
to R362 in nominal terms. The cost of the food basket expressed as a share of the average
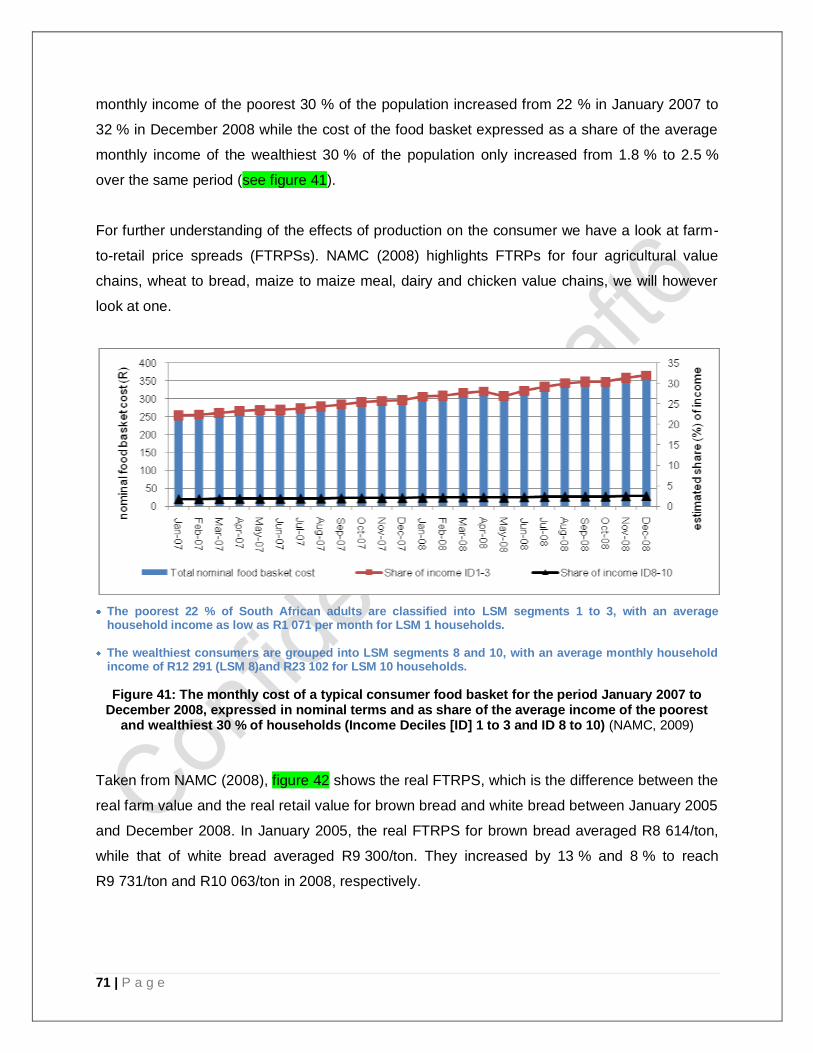
71 | P a g e
monthly income of the poorest 30 % of the population increased from 22 % in January 2007 to
32 % in December 2008 while the cost of the food basket expressed as a share of the average
monthly income of the wealthiest 30 % of the population only increased from 1.8 % to 2.5 %
over the same period (see figure 41).
For further understanding of the effects of production on the consumer we have a look at farm-
to-retail price spreads (FTRPSs). NAMC (2008) highlights FTRPs for four agricultural value
chains, wheat to bread, maize to maize meal, dairy and chicken value chains, we will however
look at one.
The poorest 22 % of South African adults are classified into LSM segments 1 to 3, with an average household income as low as R1 071 per month for LSM 1 households.
The wealthiest consumers are grouped into LSM segments 8 and 10, with an average monthly household income of R12 291 (LSM 8)and R23 102 for LSM 10 households.
Figure 41: The monthly cost of a typical consumer food basket for the period January 2007 to December 2008, expressed in nominal terms and as share of the average income of the poorest
and wealthiest 30 % of households (Income Deciles [ID] 1 to 3 and ID 8 to 10) (NAMC, 2009)
Taken from NAMC (2008), figure 42 shows the real FTRPS, which is the difference between the
real farm value and the real retail value for brown bread and white bread between January 2005
and December 2008. In January 2005, the real FTRPS for brown bread averaged R8 614/ton,
while that of white bread averaged R9 300/ton. They increased by 13 % and 8 % to reach
R9 731/ton and R10 063/ton in 2008, respectively.
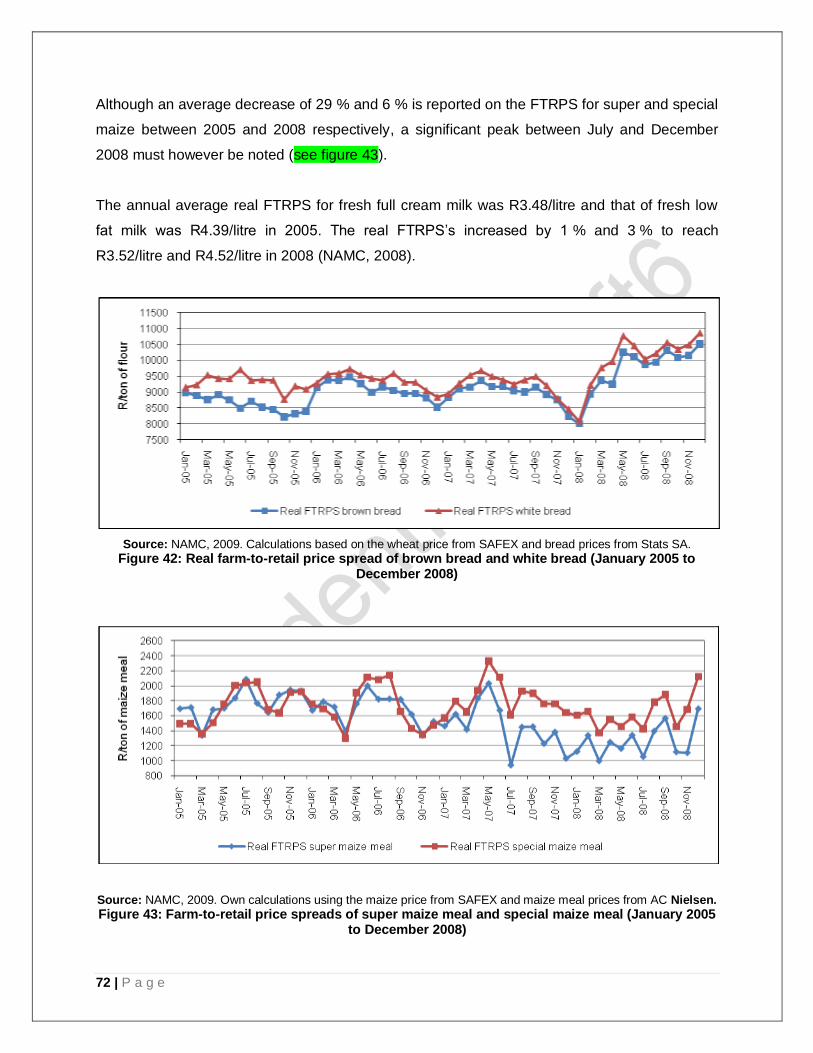
72 | P a g e
Although an average decrease of 29 % and 6 % is reported on the FTRPS for super and special
maize between 2005 and 2008 respectively, a significant peak between July and December
2008 must however be noted (see figure 43).
The annual average real FTRPS for fresh full cream milk was R3.48/litre and that of fresh low
fat milk was R4.39/litre in 2005. The real FTRPS‘s increased by 1 % and 3 % to reach
R3.52/litre and R4.52/litre in 2008 (NAMC, 2008).
Source: NAMC, 2009. Calculations based on the wheat price from SAFEX and bread prices from Stats SA.
Figure 42: Real farm-to-retail price spread of brown bread and white bread (January 2005 to December 2008)
Source: NAMC, 2009. Own calculations using the maize price from SAFEX and maize meal prices from AC Nielsen.
Figure 43: Farm-to-retail price spreads of super maize meal and special maize meal (January 2005 to December 2008)
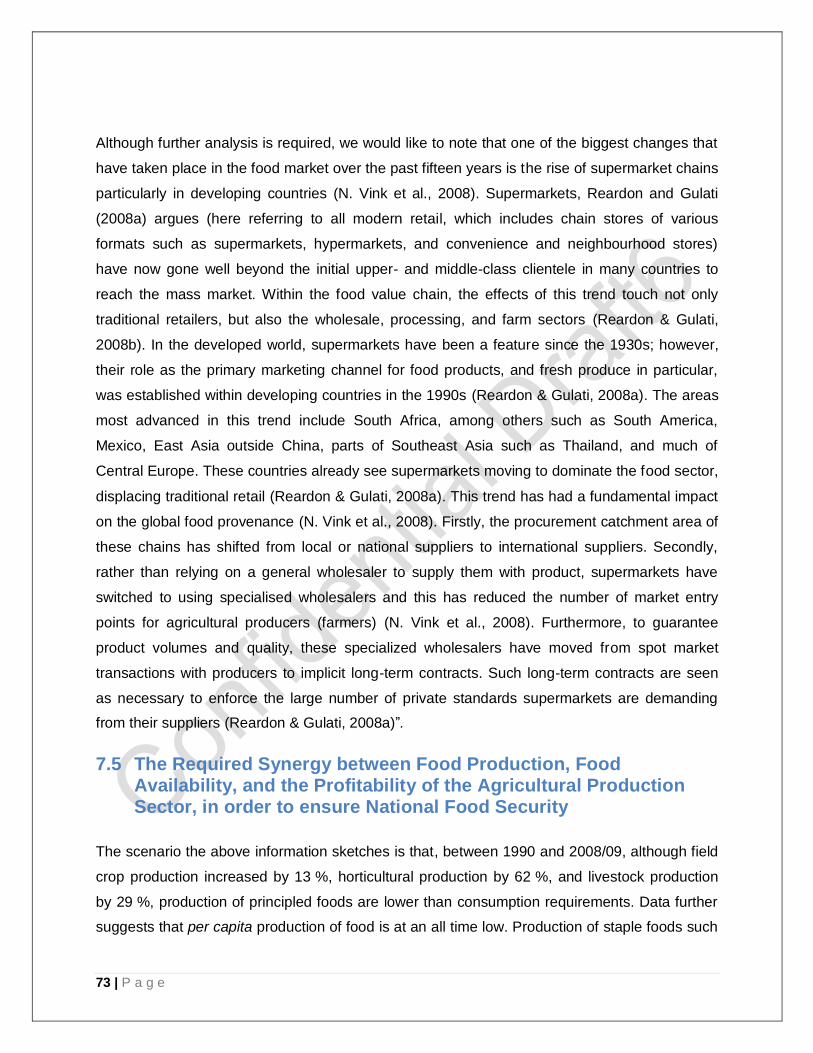
73 | P a g e
Although further analysis is required, we would like to note that one of the biggest changes that
have taken place in the food market over the past fifteen years is the rise of supermarket chains
particularly in developing countries (N. Vink et al., 2008). Supermarkets, Reardon and Gulati
(2008a) argues (here referring to all modern retail, which includes chain stores of various
formats such as supermarkets, hypermarkets, and convenience and neighbourhood stores)
have now gone well beyond the initial upper- and middle-class clientele in many countries to
reach the mass market. Within the food value chain, the effects of this trend touch not only
traditional retailers, but also the wholesale, processing, and farm sectors (Reardon & Gulati,
2008b). In the developed world, supermarkets have been a feature since the 1930s; however,
their role as the primary marketing channel for food products, and fresh produce in particular,
was established within developing countries in the 1990s (Reardon & Gulati, 2008a). The areas
most advanced in this trend include South Africa, among others such as South America,
Mexico, East Asia outside China, parts of Southeast Asia such as Thailand, and much of
Central Europe. These countries already see supermarkets moving to dominate the food sector,
displacing traditional retail (Reardon & Gulati, 2008a). This trend has had a fundamental impact
on the global food provenance (N. Vink et al., 2008). Firstly, the procurement catchment area of
these chains has shifted from local or national suppliers to international suppliers. Secondly,
rather than relying on a general wholesaler to supply them with product, supermarkets have
switched to using specialised wholesalers and this has reduced the number of market entry
points for agricultural producers (farmers) (N. Vink et al., 2008). Furthermore, to guarantee
product volumes and quality, these specialized wholesalers have moved from spot market
transactions with producers to implicit long-term contracts. Such long-term contracts are seen
as necessary to enforce the large number of private standards supermarkets are demanding
from their suppliers (Reardon & Gulati, 2008a)‖.
7.5 The Required Synergy between Food Production, Food Availability, and the Profitability of the Agricultural Production Sector, in order to ensure National Food Security
The scenario the above information sketches is that, between 1990 and 2008/09, although field
crop production increased by 13 %, horticultural production by 62 %, and livestock production
by 29 %, production of principled foods are lower than consumption requirements. Data further
suggests that per capita production of food is at an all time low. Production of staple foods such
74 | P a g e
as wheat is influenced by farmers‘ decisions to produce (plant), which is in turn influenced by
favourable climatic conditions, and available market prices. While government is responsible for
upholding and stimulating a productive and profitable agricultural production sector, it does this
for both economic reasons, and in fulfilling its responsibility to the consumer in ensuring and
maintaining national food security.
Providing strategic leadership across these areas of interest i.e. food production, food
availability, profitability of the sector, and food affordability, requires an understanding of what
factors are at play, and how they influence the areas of interest of this strategy. Such an
understanding however requires an in depth analysis of all factors at play within, and across the
agricultural production value chain - information which is currently only available ending 2002.
There is thus a vital information gap, which is unable to inform required interventions in ensuring
food affordability, through the mitigation of maintaining food production, food availability, food
distribution, and the profitability of the sector. The strategy thus currently argues broadly around
these issues understanding the need for detail, in order to identify specific and required
interventions.
Currently guiding these broad arguments are increasing differences between farmer and retail
prices for certain products such as wheat, maize, and chicken, suggesting that food prices are
influenced by pricing and costing structures across the value chain. The prime focus of this
strategy is thus to overcome disparities between food production levels, food availability, food
distribution and food affordability, through a qualitative and quantitative improvement of South
Africa‘s agricultural productivity, productive efficiency and regulatory environment for all
commodity groups. It furthermore seeks to stimulate rural economic growth and development in
this regard.
Furthermore, an interrelated dependency between agricultural production and agro-processing
must be recognized as it clearly affects performance of the agricultural sector as a whole. This
interrelated dependency furthermore affects the availability and affordability of food products. A
commodity based, value-chained approach is thus critical in ensuring a prosperous agricultural
production sector that is able to produce according to market demand and market requirements.
In turn agro-processing must be able to adapt according to new produce available within the
agricultural production sector.
75 | P a g e
In devising the Agricultural Production Strategy, is thus important that clear linkages are forged
between agricultural production and agro-processing, and covers the following fields of
collaboration:
1. Market development;
2. Food availability and affordability
8 The South African Agricultural Strategic Plan
8.1 Key Challenges
The key challenges faced by South African agriculture today include:
An unregulated market environment has left the domestic agricultural market vulnerable
to fluctuating, and high global prices of agricultural staple foods, e.g. maize, wheat, and
soya. Domestically produced products are impacted upon by the international market;
A growing Retail Supermarket Sector. The procurement catchment area of supermarket
chains has shifted from local or national suppliers to international suppliers both
domestically and within the SADC region, and has decreased the number of market entry
points for agricultural producers;
Increasing farmer to retail price differences for certain food products such as bread and
chicken, impact on food prices;
Growing food insecurity contributed by increasing food prices;
Poorly skilled and marginalised i.t.o accessibility to natural resources (water and
productive land, of subsistence and smallholder farmers, translates into low production
outputs, asset loss and land degradation;
Poor infrastructural support. Infrastructural development allows for farmers and buyers to
link, and in turn, boosts local sales; translating into local economic development;
Increasing input costs (animal nutrition, seed, fertiliser, etc.)
76 | P a g e
Poorly defined economies of scale leads to poor farm management, and local agricultural
economic planning. The number of commercial farms are decreasing while their farm
sizes are increasing, indicating a consolidation of the commercial farming sector.
Lack of, or poor agricultural spatial economic planning. Agricultural planning has to be
considered at local, regional, and national levels, to effect market flows, infrastructural
requirements and rural development.
Poor information and knowledge management for improving farming practices among
smallholder farmers. All farmers require information and knowledge, to improve and address
production challenges. The distribution, collection and storage of required information and
knowledge is pivotal to the success of any agricultural sector.
Although attempts have been made to improve the alignment between research and
practice, research and development planning still bears little or no impact on the growth
and development of South Africa‘s agricultural economy.
8.2 Strategic Goals:
To increase the entry levels of smallholder farmers into commercial agriculture;
To improve the national agricultural economic output, national food safety and security,
through a qualitative and quantitative improvement of South Africa‘s agricultural productivity,
productive efficiency, trade and regulatory environment, and the spatial management of
information and knowledge systems for all commodity groups;
To improve agricultural support services, the regulatory framework, and the competitive
advantage for commodity sectors, according to their needs and requirements as stated in
their respective commodity strategies;
To stimulate rural economic growth and development, by stimulating spatial economic
planning and implementation, further serving as an incentive for investment in rural areas.
8.3 Strategic Objectives:
Improve the food security, policy and legislative framework to militate against high
global food prices, and market manipulation.
77 | P a g e
To improve the domestic and global competitiveness of the South African agricultural
sector.
Create formal platforms of interaction, between government and industry, to serve as
platforms of dialogue, during planning, monitoring and evaluation processes.
To improve national coordination and management of government support services
to farmers, and decentralized support services in the form of local Agricultural
Development Service Centres.
To address the decreasing production levels among the smallholder and subsistent food
producers through commodity-based experiential training and mentorship academies,
as a prerequisite to government financial support.
To improve the government‘s planning capacity at national, provincial and local levels,
through the formulation and installation of knowledge and information management
systems, e.g. decision support systems.
8.4 Focus Groups
Subsistence farmers (producing for household consumption)
Smallholder farmers (producing enough surplus for local market)
Commercial farmers (product sales mostly for domestic and export markets)
8.5 Strategic Interventions
8.5.1 The Food Security Act / Programme
Food security exists when all people, at all times, have physical and economic access to
sufficient, safe and nutritious food to meet their dietary needs and food preferences for an active
and healthy life (Cotula, 2008). Although the Food Security Act / Programme lacks a policy
framework, this strategy, identifies five pillars of food security i.e. food availability, affordability,
stability of supply, access and utilization. As primary agricultural production clearly affects food
availability, affordability, and supply, a legislative framework is required to ensure the proper
mitigation between all factors impacting the availability, affordability and supply of principled
foods, with the objective of realising national food security, and achieving the right to food, for
all. The act therefore aims to:
78 | P a g e
7. identify food insecure communities through knowledge and information management
systems, able to provide continues and updated analysis of the state of food insecurity at
a national, provincial and local level.
8. ensure qualitative and quantitative production of principled food commodities within
identified food insecure communities;
9. ensure that, where South Africa are unable to produce profitability, sufficient levels are
imported;
10. ensure that, where South Africa are able to produce efficiently and sufficiently, the
domestic market does not strain under farmers‘ decision to export at the expense of
national food security;
11. ensure the profitability of production of identified priority commodities, in this way
ensuring farmers are always to gain from the production of principled food commodities;
and
12. to ensure that food prices and food affordability are not compromised at the expense of
the above mentioned factors.
More importantly, is the monitoring and evaluation of all legislative and policy impacts.
Information gathered through such M&E processes will in turn inform future planning cycles.
8.5.2 The Farmer Development Act / Programme
South Africa‘s liberalized market environment has made it difficult for agricultural strategies and
policies to provide effective support, on a meaningful scale, in which smallholder and
subsistence farmers are able to be self reliant and to build their enterprises. The following thus
aims to upscale and provide a comprehensive package of institutional and technical support.
The Farmer Development Programme / Act aims to provide the support required both to
beneficiaries of land reform and restitution programmes of the Department of Rural
Development and Land Affairs, and to commercial, subsistent and smallholder farmers outside
these programmes.
8.5.2.1 Agricultural Input & Infrastructural Coupon Programme (AIICP)
For immediate impact the Farmers Development Programme / Act / Programme, will provide
affordable agricultural inputs through an Agricultural Input & Infrastructural Coupon
79 | P a g e
Programme (AIICP), subsidizing the most expensive input material for selected production
systems (those contributing most to household food security), including:
tractors;
fencing;
repairs of equipment;
different types of fertilisers;
animal supplements;
plant and animal disease control;
The coupon systems will be targeted at smallholder and subsistece farmers only, based on the
size and level of production. The coupon system will furthermore act as a subsidy to what
farmers themselves have already invested, i.e. covering 80-90 % of the cost.
8.5.2.2 Agricultural Academies (Centres of Excellence)
The agricultural academy programme will localize and prioritize skills development to extension
officers, commercial, smallholder, and subsistence farmers, through the upgrading and
expansion of existing commodity based agricultural academies.
Each academy will have a cooperative agreement with an identified Agricultural training college
through which the farmers will graduate, and training facilities will be provided.
The training programmes will be certified, qualifying farmers for government support, i.e. the
training programmes will act as a prerequisite for government financial support, followed by an
incubated mentorship programme.
The incubation mentorship programme will provide day-to-day support and assistance from a
mentor (retired farmers) for a specified period of time.
8.5.2.3 Agriculture Development Service Centres
DAFF will respond to the capacity-building needs of both the subsistence and smallholder
farming sector through decentralized Agriculture Development Service Centres, with targeted
support for:
Improved farming practices (farm, financial and asset management)
80 | P a g e
Improved access to knowledge and information, through a decentralized training facility
Training and capacity building for producing for the export and domestic markets
Mentorship programmes
Entrepreneurial development
The Decentralized Agricultural Development Service Centres will act as the satellite stations of
the academies, through which they further provide training and skills development programmes
suited to the type of production systems most prevalent, as defined by the Agricultural Spatial
Economic development programme.
The centres will further provide multi-level services including animal health, animal nutritional
support, market information, marketing facilities (e.g. auctioneering), etc. The centres‘ primary
function includes training and localizing government agricultural services based on commodities
relevant to the region it operates in, e.g. cotton, grain, wool, cattle, dairy, etc.
Training and capacity building programmes will be done in partnerships with major educational
and training institutions such as Universities, NGOs, Colleges and Research Institutions.
8.5.2.4 Agricultural Innovation System
Effecting an agricultural innovation system, allows Research and Development to target industry
and farmer requirements, both technically and in terms of market requirements. Research and
development furthermore opens market opportunities, through biotechnology and improves the
value added impact of product quality.
8.5.2.5 Commodity Forums
In alignment with the international Agribusiness forum, resolutions, of which South Africa was a
part of, this strategy too seeks to forge partnerships with industry. Partnerships per commodity
or sector must take place at both national and provincial levels. These platforms of interaction
between national and provincial government must be formalized and legislated.
It is only through an integrated, value-chain approach that South Africa could ensure a viable
and prosperous agricultural sector for the future. These partnerships, whether they be Private to
Private or Public to Private, will strengthen the agricultural industry as a whole. Representative
forums where industry interacts with government, is required to improve communication and
81 | P a g e
delivery of government programmes. DAFF is however required to play a coordinating,
secretariat role, devising the agenda, reports and implementation of decisions made.
8.5.2.6 Agricultural Spatial Economic Development System
Influenced by water availability, suitable land and infrastructural development, agriculture is one
of the few sectors that operate completely as a ―spatial economic‖ sector. Investing in, and
improving our ability to plan agriculture spatially is pivotal for:
Developing local agricultural economies.
Facilitating provincial and local area based planning.
In identifying viable agricultural business opportunities
Planning infrastructural development
Serve as an incentive for investment.
Market infrastructure development planning and implementation
Addressing poorly defined economies of scale
Develop Market linkages
Furthermore, available agricultural land is slowly being used for industrial production, such as
mining, property development, and foreign investment. Spatial Economic Planning furthermore
allows for agricultural zoning, and protection against the uptake of limited agricultural land into
the industrial sector.
8.5.2.7 Agricultural Decision Support System
It is pivotal for sustainable government interventions that agricultural development planning is
based on evidence and social and economic requirements. It is furthermore important that
Agriculture planning participates in local economic development planning process. An
Agricultural Planning System will enable provinces, and municipalities to better analyse their
land and economic potential, and allowing them to look at different alternatives within the
framework of such an analysis.
Great importance must be attached to the importance of evidence based decision-support
systems for Agricultural planning. This will further facilitate the successful implementation of well
82 | P a g e
informed projects and programmes at local levels and furthermore stimulate local agricultural
economic development. The aims of an Agricultural Planning System are:
To provide updated information and data on agricultural production at local and
provincial levels.
To provide an analysis of such information and data
To provide alternative scenarios for growth and development of agriculture within the
specified region.
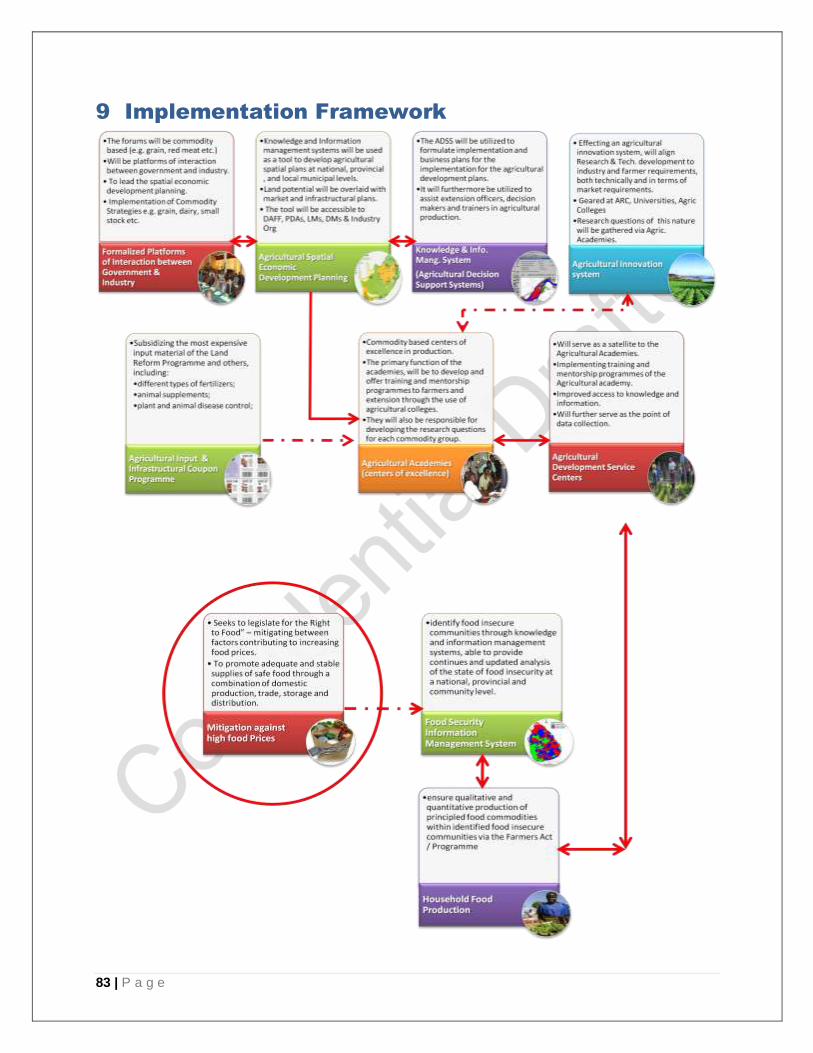
83 | P a g e
9 Implementation Framework
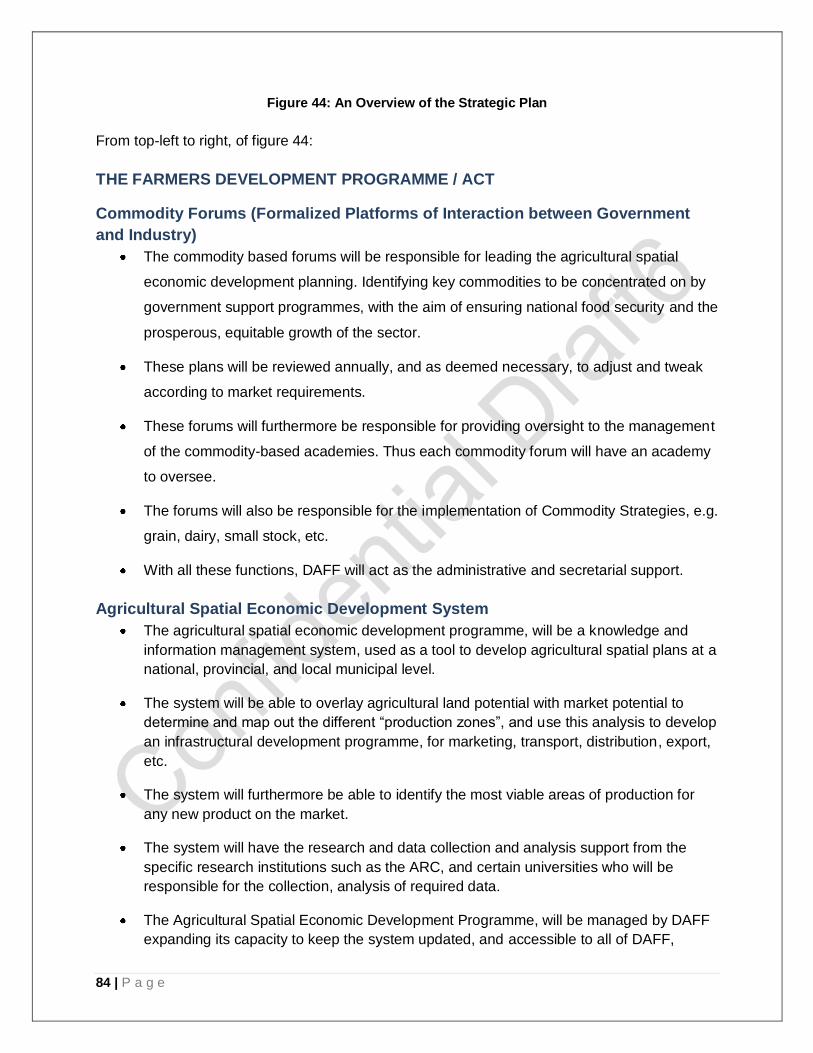
84 | P a g e
Figure 44: An Overview of the Strategic Plan
From top-left to right, of figure 44:
THE FARMERS DEVELOPMENT PROGRAMME / ACT
Commodity Forums (Formalized Platforms of Interaction between Government
and Industry)
The commodity based forums will be responsible for leading the agricultural spatial
economic development planning. Identifying key commodities to be concentrated on by
government support programmes, with the aim of ensuring national food security and the
prosperous, equitable growth of the sector.
These plans will be reviewed annually, and as deemed necessary, to adjust and tweak
according to market requirements.
These forums will furthermore be responsible for providing oversight to the management
of the commodity-based academies. Thus each commodity forum will have an academy
to oversee.
The forums will also be responsible for the implementation of Commodity Strategies, e.g.
grain, dairy, small stock, etc.
With all these functions, DAFF will act as the administrative and secretarial support.
Agricultural Spatial Economic Development System
The agricultural spatial economic development programme, will be a knowledge and
information management system, used as a tool to develop agricultural spatial plans at a
national, provincial, and local municipal level.
The system will be able to overlay agricultural land potential with market potential to
determine and map out the different ―production zones‖, and use this analysis to develop
an infrastructural development programme, for marketing, transport, distribution, export,
etc.
The system will furthermore be able to identify the most viable areas of production for
any new product on the market.
The system will have the research and data collection and analysis support from the
specific research institutions such as the ARC, and certain universities who will be
responsible for the collection, analysis of required data.
The Agricultural Spatial Economic Development Programme, will be managed by DAFF
expanding its capacity to keep the system updated, and accessible to all of DAFF,
85 | P a g e
PDAs, LMs, DMs & Industry Org, to be used to develop their own agricultural
development plans.
Agricultural Decision Support System (ADSS)
The ADSS will be utilized to formulate implementation and business plans for the
implementation of the agricultural development plans, per province and local
government.
It will furthermore be utilized to assist extension officers, decision makers and trainers in
their daily challenges such as a knowledge on pest management, nutritional
management, breeding, etc.
The Agricultural Decision Support System, will too be managed by DAFF expanding its
capacity to keep the system updated, and accessible to farmers, extension officers,
DAFF, PDAs, LMs, DMs, & Industry Organisations.
The Agricultural Decision Support System will too require a designated partner
responsible for data collection and statistical analysis.
Agricultural Innovation System
Research questions will be gathered by the Agricultural Development Centers, and
communicated to DAFF via the Agricultural Academies. The purpose is to identify
challenges requiring research intervention.
The role of DAFF will be to be to package the research questions into research
strategies aimed at investigating the identified challenges and for devising solutions.
These questions will be geared at all research institutions such as the ARC, Universities,
Agricultural Colleges, etc. via DAFF.
Primary to this intervention will be a partnership with the Department of Science and
Technology.
Agricultural Academies
The Agricultural Academies will be commodity based centers of excellence in
production.
Such centers exists to various degrees for different commodity groups, e.g. the
Sugarcane Research Institute of the South African Sugar Association, with both
research and training capacity.
The strategy however seeks to upscale and elevate the training capacity of these
institutions, to develop training material and training of trainers capacity, as the primary
function of the academies, will be to develop and offer training and mentorship
programmes to farmers and extension through the use of agricultural colleges as a
resource base.
86 | P a g e
They will also be responsible for developing the research questions for each commodity
group, providing clear directive as to what the focus of research within their respective
fields should.
A further function of the Agricultural Academies would be to disseminate training
material to, and train trainers of the Agricultural Development centres.
Agricultural Development Service Centres
The Agricultural Development Service Centres, will serve as the ―arm‖ of DAFF, and
PDAs with respect to services offered to farmers and the public, including training, e.g.
o Animal registration
o Veterinary Services, etc.
Provision of the required capacity to offer these services, will be done via one office
within DAFF and the PDAs.
The centers will furthermore provide on-farm training relevant to, and in line to the local
Agricultural Spatial Economic Plan.
It will too have access to the Agricultural Decision Support System and the Agricultural
Spatial Economic Development System, to improve access to knowledge and
information.
The centers will furthermore serve as points of data collection, managed by extension
services.
THE FOOD SECURITY PROGRAMME / ACT
The food security programme / act, seeks to:
Ensure household food security, and to
Mitigate against increasing food prices
The programme seeks to mitigate between conflicting factors operating within and across the
production value chain, ensuring food affordability, by mitigating between factors mostly
impacting food prices. These factors broadly includes:
food availability
o whether produced domestically vs imports;
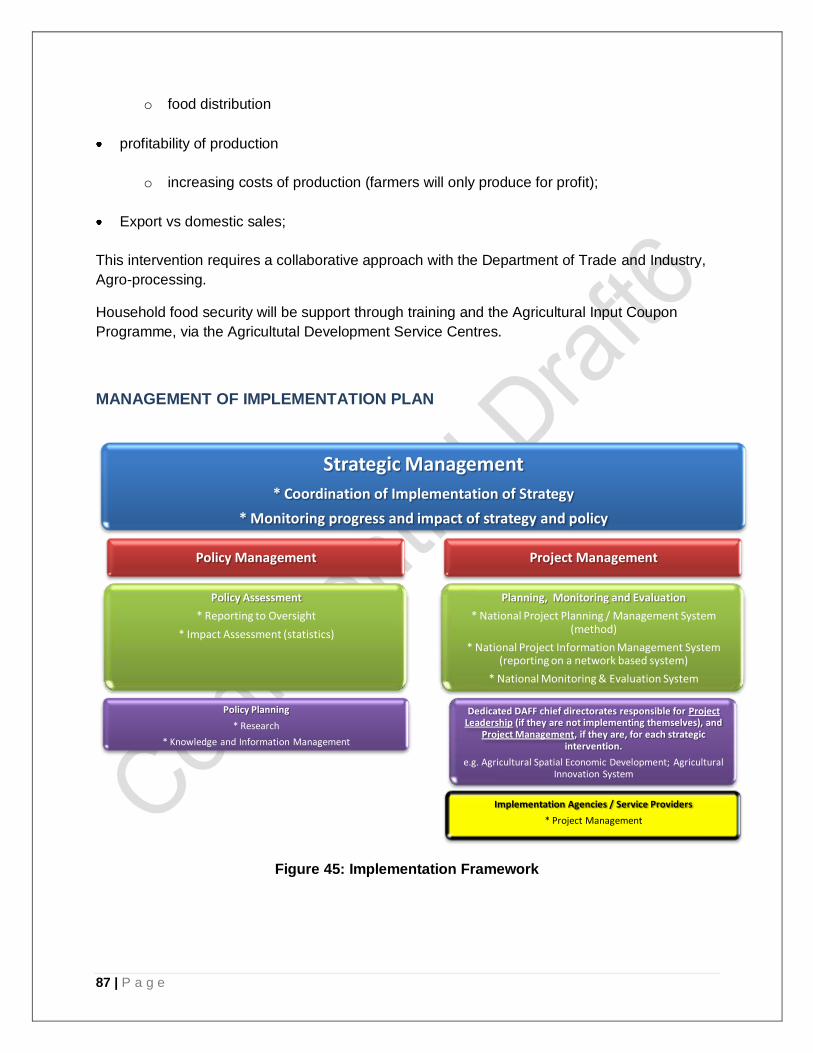
87 | P a g e
o food distribution
profitability of production
o increasing costs of production (farmers will only produce for profit);
Export vs domestic sales;
This intervention requires a collaborative approach with the Department of Trade and Industry,
Agro-processing.
Household food security will be support through training and the Agricultural Input Coupon
Programme, via the Agricultutal Development Service Centres.
MANAGEMENT OF IMPLEMENTATION PLAN
Figure 45: Implementation Framework
Strategic Management
* Coordination of Implementation of Strategy
* Monitoring progress and impact of strategy and policy
Policy Management
Policy Assessment
* Reporting to Oversight
* Impact Assessment (statistics)
Policy Planning
* Research
* Knowledge and Information Management
Project Management
Planning, Monitoring and Evaluation
* National Project Planning / Management System (method)
* National Project Information Management System (reporting on a network based system)
* National Monitoring & Evaluation System
Dedicated DAFF chief directorates responsible for Project Leadership (if they are not implementing themselves), and
Project Management, if they are, for each strategic intervention.
e.g. Agricultural Spatial Economic Development; Agricultural Innovation System
Implementation Agencies / Service Providers
* Project Management
88 | P a g e
The strategy will require a particular programme / branch within DAFF that will be
responsible for the strategic oversight of the SA Agricultural Production Strategy.
This programme / branch within DAFF, will thus be responsible for implementing a:
o project management system;
o monitoring and evaluation system, and be responsible for overall reporting on the
progress and impact of the strategy.
Identifying roles and responsibilities for implementing the strategy is furthermore key in
ensuring effective management there of. It would thus be pivotal to the success of this
strategy that DAFF coordinates an implementation planning session with stakeholders
(more importantly the implementing agents) i.e. Provincial and Local government, industry,
SOEs, etc. to devise the implementation plan for the SA Agricultural Production Strategy.
The implementation plan will be done by proper project management principles, a method
which must be adopted by all implementing agents of the strategy.
This methodology will therefore encompass a national monitoring and evaluation system,
through which all implementing agents will report to DAFF.
The policy and legislative elements of the strategy must be administered and managed by
DAFF.
Reference List
1. Aihoon, K., Cherry, M., & Kassier, E. (2007). Definition of farm and farmer terminology.
Pretoria, South Africa: Agri-Africa Consultants.
2. Archer, E., Mukhala, E., Walker, S., Dilley, M., & Masamvu, K. (2007). Sustaining agricultural production and food security in southern africa: An improved role for climate prediction? Climatic Change, 83(3), 287-300.
3. ARC-ISCW. (2004). Overview of the status of the agricultural natural resources of south africa. ARC-ISCW report no GW/A/2004/13. Pretoria, South Africa: Agricultural
Research Council - Institute for Soil Climate and Water.
4. Britz, P. J. (2007). Growth potential of the south african aquaculture industry and recommendations for sector development. Pretoria, South Africa: Department of Trade and Industry.
5. Bussolo, M., De Hoyos, R., & Medvedev, D. (2008). Economic growth and income distribution: Linking macroeconomic models with household survey data at the global level. International Association for Research in Income and Wealth (IARIW) 30th General Conference, Portoroz, Slovenia, August, 24-30.
6. Byerlee, D., de Janvry, A., & Sadoulet, E. (2009). Agriculture for development: Toward a new paradigm. Annu.Rev.Resour.Econ, 1, 1.1-1.20.
7. Collett, A. (2008). The determination, protection and management of high potential agricultural land in south africa with special reference to gauteng. Unpublished M.Sc,
University of Pretoria, Pretoria, South Africa.
8. Collier, P., & Dercon, S. (2006). Review article: The complementarities of poverty reduction, equity, and growth: A perspective on the world development report 2006. Economic Development and Cultural Change, 55(1), 223-236.
9. Cotula, L. (2008). The right to food and access to natural Resources–Using human rights arguments and mechanisms to improve resource access for the rural poor.
10. DAFF. (2008). Situational analysis of various agricultural products in south africa.
Pretoria, South Africa: DAFF.
11. DAFF. (2009a). Commodity based production, consumption, and consumption per capita. Unpublished manuscript.
12. DAFF. (2009b). Economic review of south african agriculture. Pretoria, South Africa:
DAFF.
13. DEAT. (2006). South africa environment outlook. A report on the state of the environment. Pretoria, South Africa: Department of Environmental Affairs and Tourism.
14. DEAT. (2009). Marine aquaculture annual report. Pretoria, South Africa: Department of
Environmental Affairs and Tourism, 2008.
90 | P a g e
15. DoA. (2008). Trends in the agricultural sector. Pretoria, South Africa:
16. DoA. (2004). Strategic plan for the department of agriculture. Pretoria, South Africa:
Department of Agriculture.
17. DoA. (2006). Strategic plan for the department of agriculture. Pretoria, South Africa:
Department of Agriculture.
18. Industrial Policy Framework, (2007a).
19. Industrial Policy Framework Action Plan, (2007b).
20. NAMC. (2008). Food cost review. Pretoria, South Africa: NAMC and DAFF.
21. NAMC. (2009). Quarterly food price trends. Pretoria, South Africa: DAFF.
22. National Treasury. (2007). Estimates of national expediture 2007/08. Pretoria, South
Africa: National Treasury.
23. White Paper on Agriculture, (1995).
24. Reardon, T., & Gulati, A. (2008a). The rise of supermarkets and their development implications: International experience relevant for india. IFPRI Discussion Papers,
25. Reardon, T., & Gulati, A. (2008b). The supermarket revolution in developing countries: Policies for "competitiveness with inclusiveness". Policy Briefs,
26. Ruth Hall. (2009). In Ruth Hall (Ed.), Another countryside? policy options for land and agrarian reform in south africa. Bellville, South Africa: Institute for Poverty, Land and
Agrarian Studies, School of Government, University of the Western Cape.
27. Schoeman, J. L., Van der Walt, M., Monnik, K. A., Thackrah, A., & Malherbe, J. and Le Roux, R.E. (2002). Development and application of a land capability classification system for south africa. Unpublished ARC-ISCW Report GW/A/2000/57.Agricultural Research Council-Institute for Soil, Climate and Water, Pretoria, South Africa,
28. Scotney, D. M., Ellis, F., Nott, R. W., Taylor, K. P., van Niekerk, B. J., & Verster, E. and Wood, P.C. (1991). A system of soil and land capability classification for agriculture in the SATBVC states. Pretoria, South Africa: Department of Agriculture.
29. Senyolo, G., Chaminuka, P., Makhura, M., & Belete, A. (2009). Patterns of access and utilization of output markets by emerging farmers in south africa: Factor analysis approach. African Journal of Agricultural Research, 4(3), 208-214.
30. Shah, M., Fischer, G., & van Velthuizen, H. (2008). Food security and sustainable agriculture. the challenges of climate change in sub-saharan africa. CSD, United Nations, New York,
31. Timmer, C. P., & Akkus, S. (2008). The structural transformation as a pathway out of poverty: Analytics, empirics and politics. Center for Global Development Working Paper, 150
32. Vink, N., & Kirsten, J. (2002). Pricing behaviour in the south african food and agricultural sector
91 | P a g e
33. Vink, N., Tregurtha, N., & Kirsten, J. (2008). Presidency fifteen year review report - review of agricultural policies and support. Pretoria, South Africa: ComMark Trust.