Embed Size (px)
Citation preview

Farming a Flat Function
AAE 320
Overview of Talk
“Farming a Flat Function” What is it? (Give Examples) What does it mean? (Implications)
In my opinion, this problem underlies a lot of complaints about farmers and the environment
It’s not a simple problem to explain or to fix
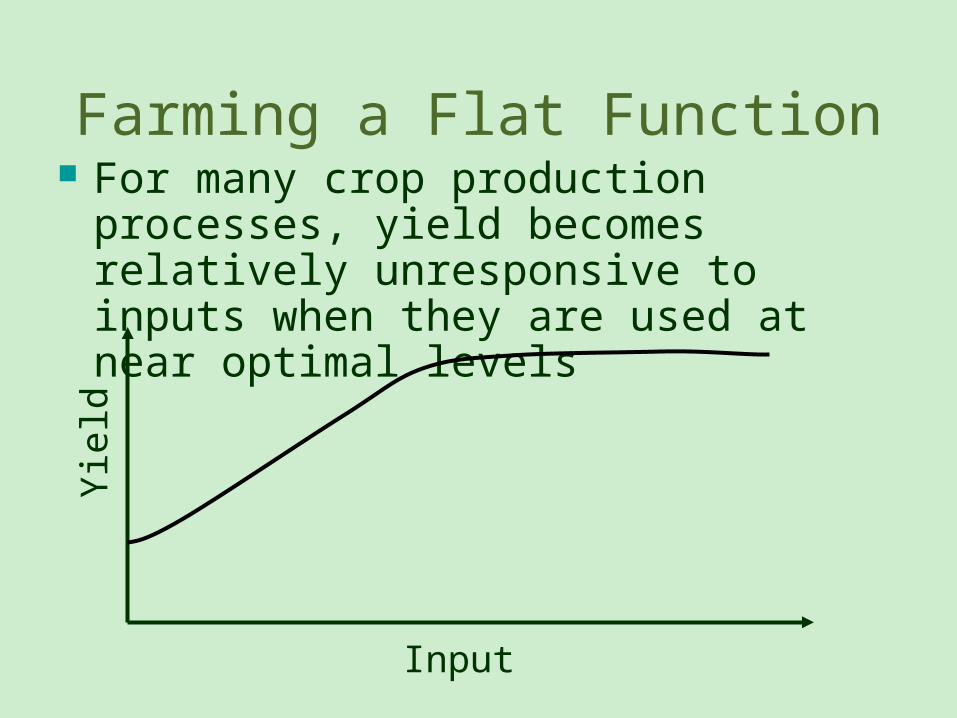
Farming a Flat Function For many crop production processes,
yield becomes relatively unresponsive to inputs when they are used at near optimal levels
Input
Yield
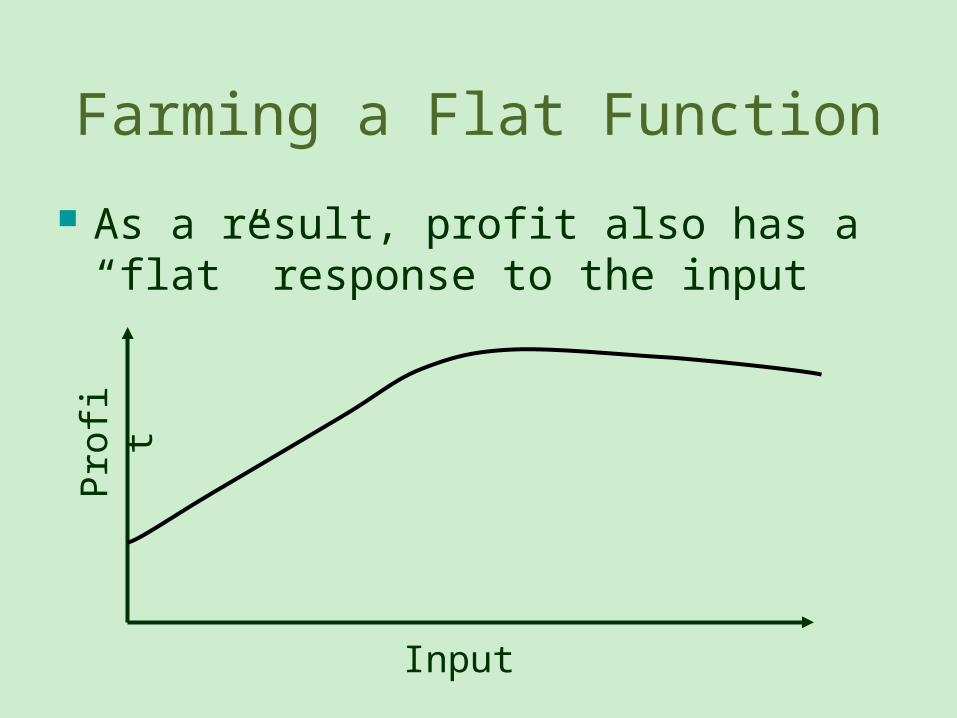
Farming a Flat Function
As a result, profit also has a “flat” response to the input
Input
Pro
fit

Mitchell (2004)
Assembled data from experiments examining corn response to nitrogen
Most from late 1980’s and early 1990’s
Seven states (IA, IL, IN, MN, NE, PN, WI)
Almost 6,000 individual observations Analysis to see if could statistically
observe effect of nitrogen on yield when at high/near optimal nitrogen rates
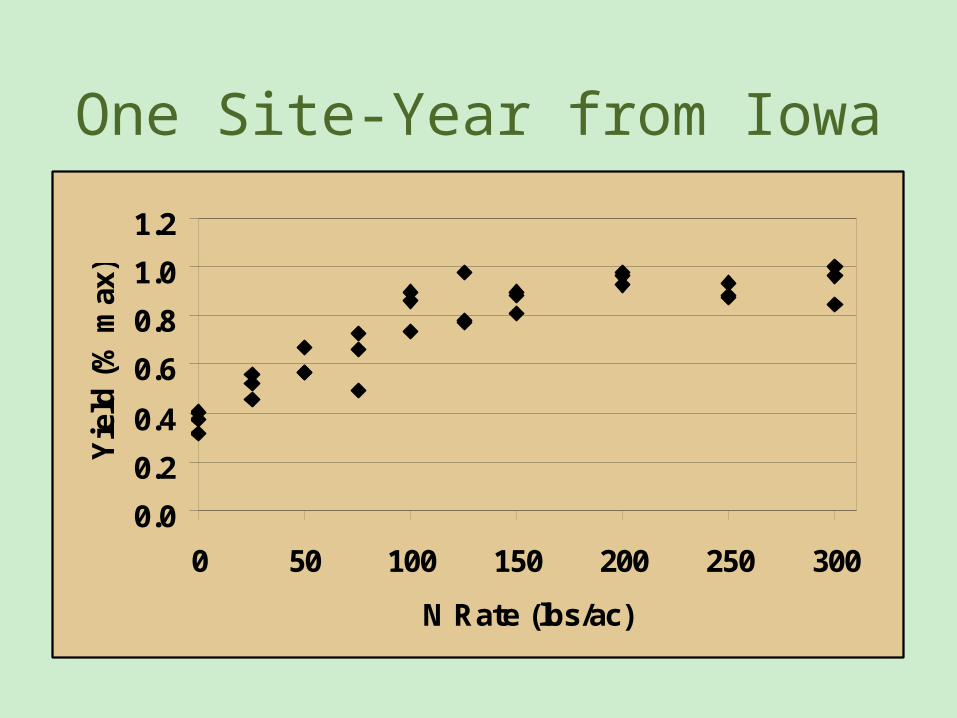
One Site-Year from Iowa
0.0
0.2
0.4
0.6
0.8
1.0
1.2
0 50 100 150 200 250 300
N Rate (lbs/ac)
Yie
ld (
% m
ax)
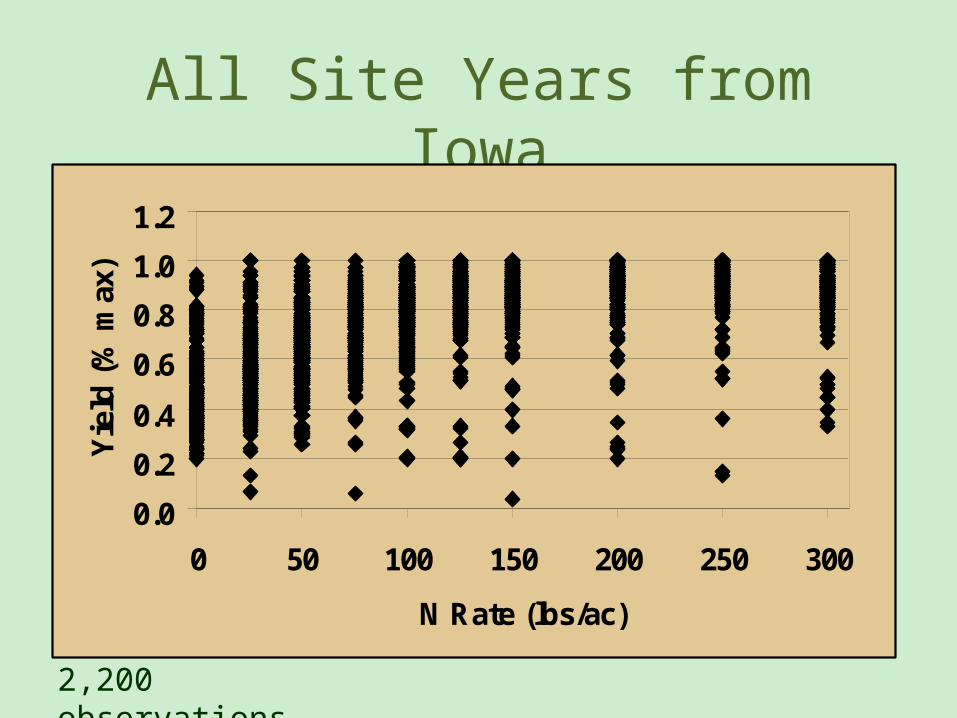
All Site Years from Iowa
0.0
0.2
0.4
0.6
0.8
1.0
1.2
0 50 100 150 200 250 300
N Rate (lbs/ac)
Yie
ld (
% m
ax)
2,200 observations
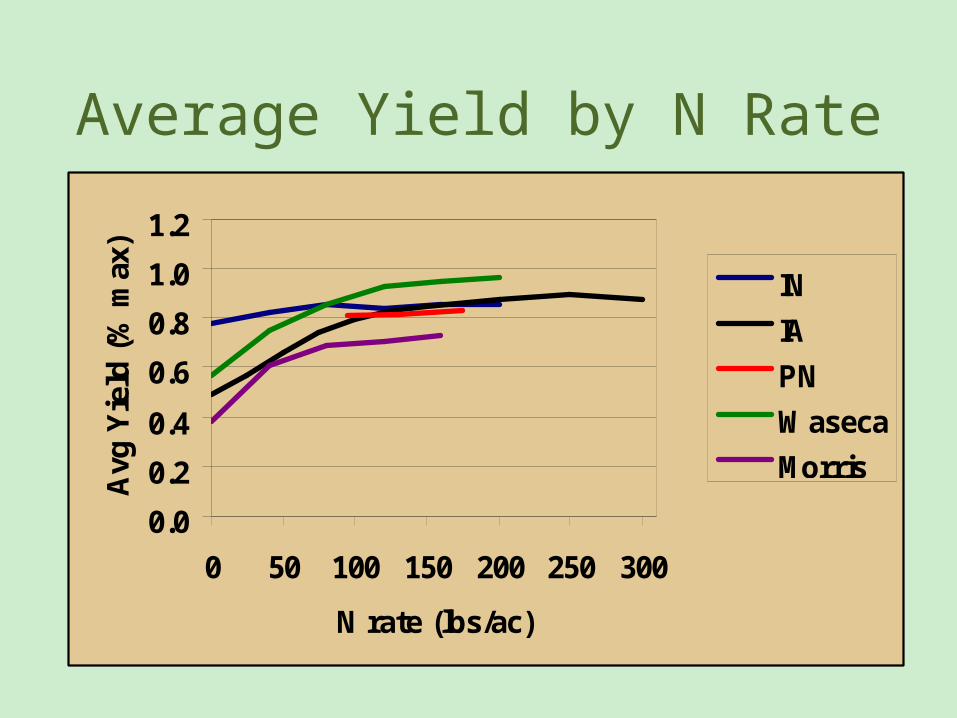
Average Yield by N Rate
0.0
0.2
0.4
0.6
0.8
1.0
1.2
0 50 100 150 200 250 300
N rate (lbs/ac)
Avg
Yie
ld (
% m
ax)
IN
IA
PN
Waseca
Morris
Main Point
Once N rates get above 85-100 lbs/ac, expected (average) corn yield very flat, but lots of variability around this average
Makes identifying yield effects of nitrogen on corn statistically difficult/impossible
Change in yield with changing N rate hard to see with all the noise from other factors
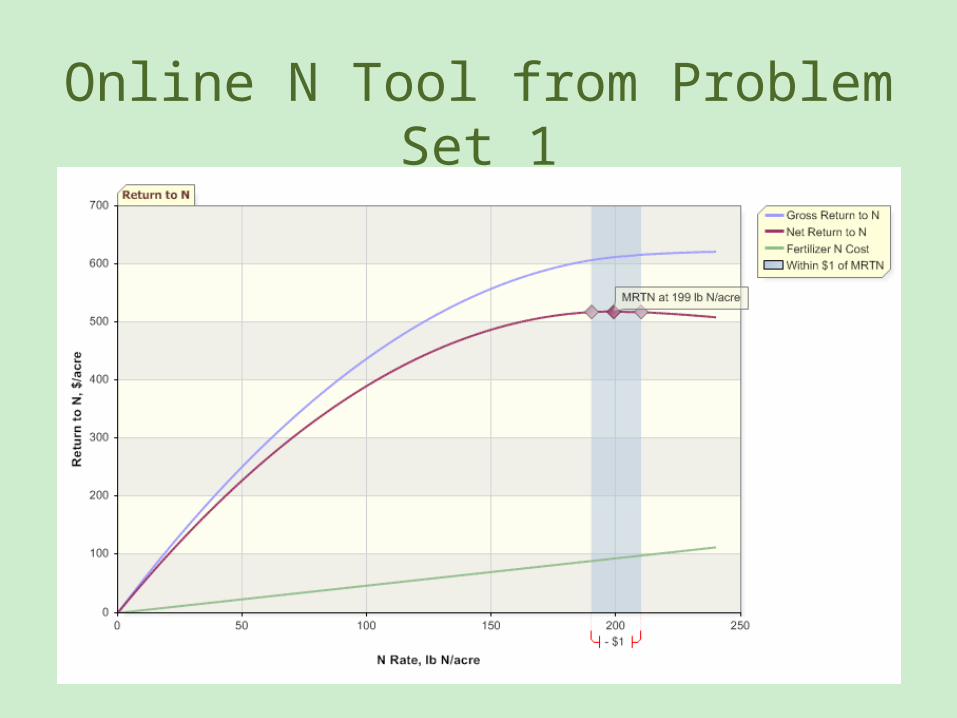
Online N Tool from Problem Set 1
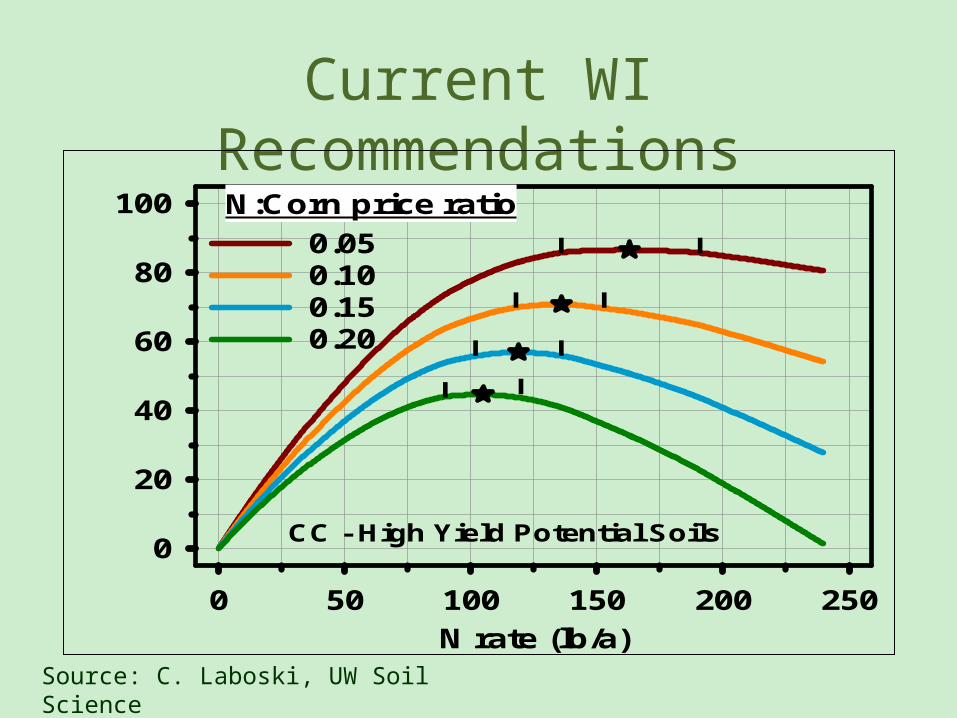
Current WI Recommendations
N rate (lb/a)
0 50 100 150 200 250
Ne
t retu
rn to
N ($
/a)
0
20
40
60
80
100
0.050.100.150.20
N:Corn price ratio
CC - High Yield Potential Soils
Source: C. Laboski, UW Soil Science
Main Point WI nitrogen recommendations for corn
give the range of N rates that are within $1/ac of the maximum return
Notice how wide the range of N rates is Over the range of application rates the
recommendations give, expected net returns vary less than $1/ac
Returns from applying nitrogen to corn are very flat when near optimal levels
See the same thing for corn seeding rates: very flat returns
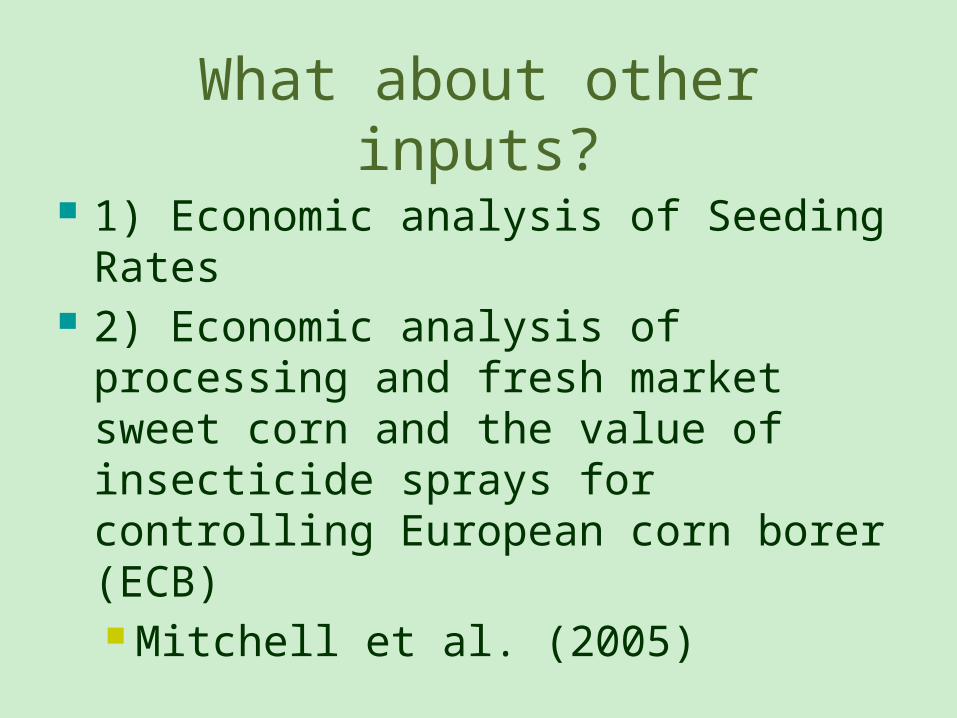
What about other inputs?
1) Economic analysis of Seeding Rates
2) Economic analysis of processing and fresh market sweet corn and the value of insecticide sprays for controlling European corn borer (ECB) Mitchell et al. (2005)
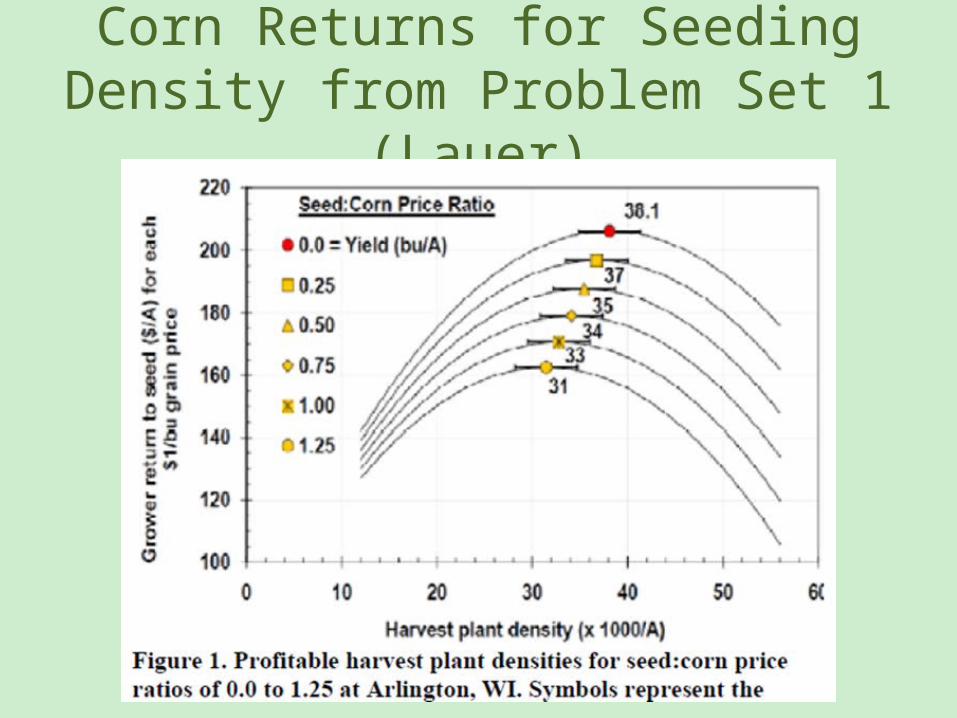
Corn Returns for Seeding Density from Problem Set 1
(Lauer)
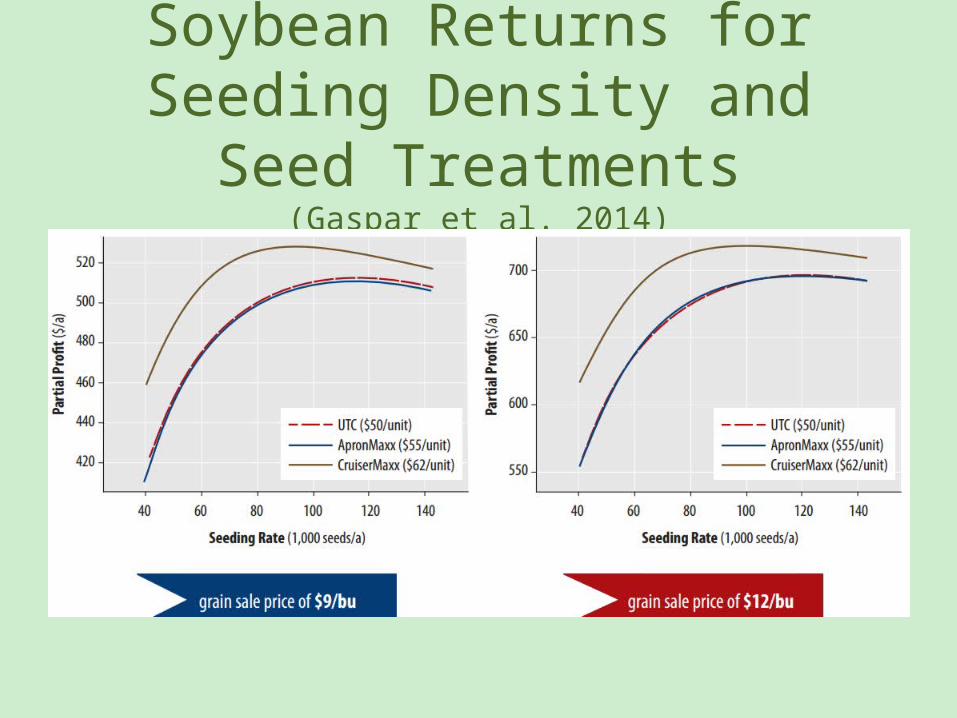
Soybean Returns for Seeding Density and Seed
Treatments(Gaspar et al. 2014)
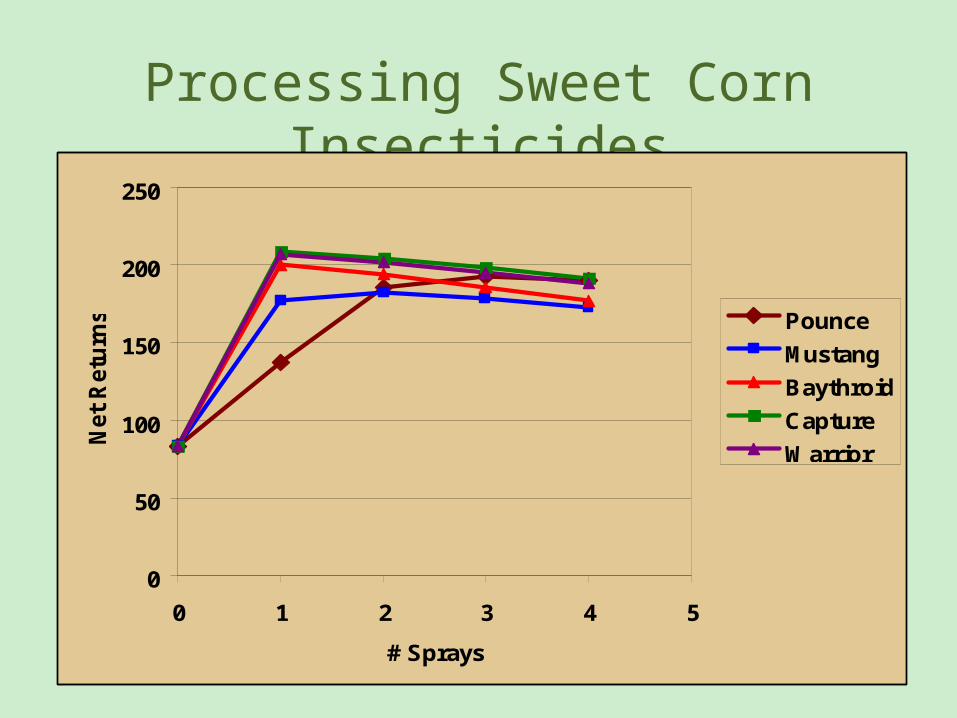
Processing Sweet Corn Insecticides
0
50
100
150
200
250
0 1 2 3 4 5
# Sprays
Net
Retu
rns Pounce
Mustang
Baythroid
Capture
Warrior
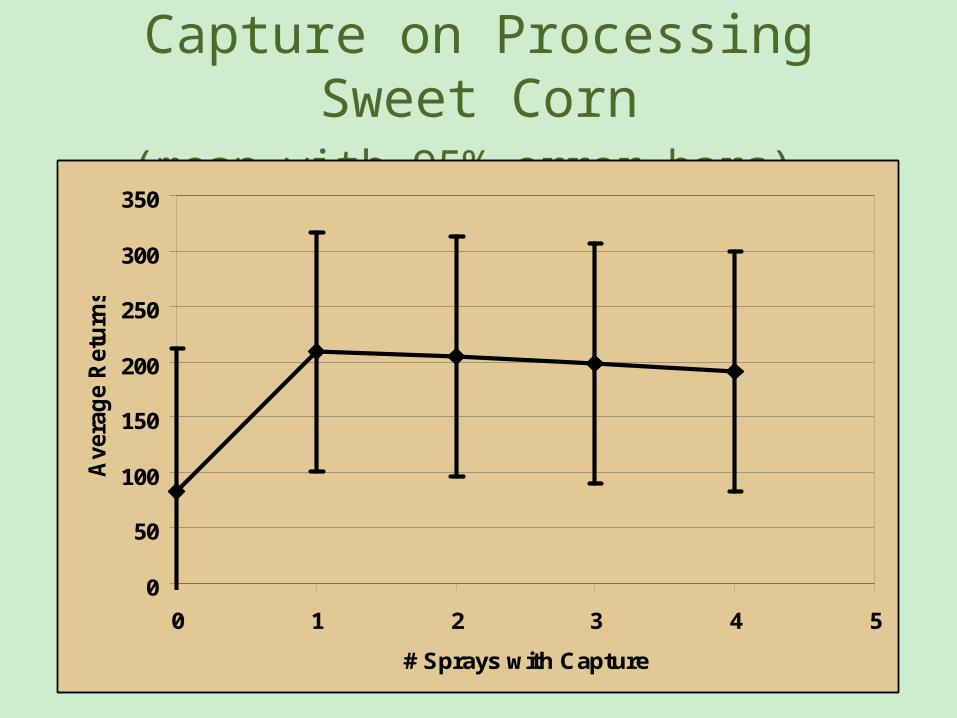
Capture on Processing Sweet Corn
(mean with 95% error bars)
0
50
100
150
200
250
300
350
0 1 2 3 4 5
# Sprays with Capture
Ave
rag
e R
etu
rns
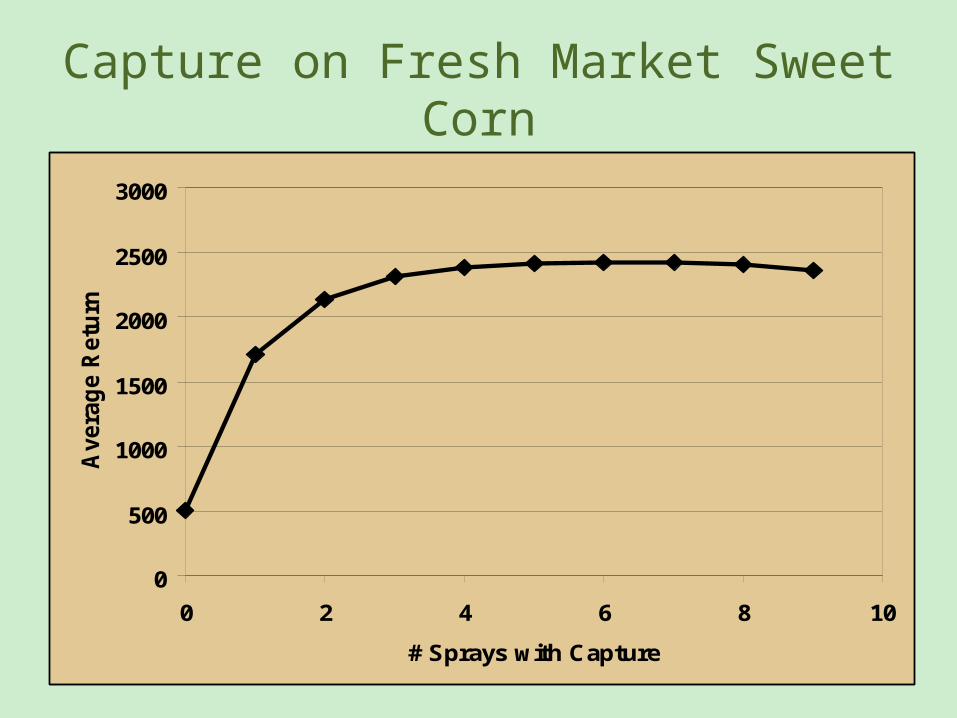
Capture on Fresh Market Sweet Corn
0
500
1000
1500
2000
2500
3000
0 2 4 6 8 10
# Sprays with Capture
Avera
ge R
etu
rns

Capture on Fresh Market Sweet Corn
(mean with 95% error bars)
0
500
1000
1500
2000
2500
3000
3500
0 1 2 3 4 5 6 7 8 9 10
# Sprays with Capture
Avera
ge R
etu
rns
Main Point
Farmers are “Farming a Flat Function” for several of main inputs
Implications 1) Small profit change over wide input
range 2) Impact of inputs on returns is hard to
see with all the variability from other factors
3) Wide range of input levels consistent with profit maximization

Under use of inputs is often obvious See weeds, insects, diseased plants, yellow or
purple crop, wilted crops Over use of inputs is often invisible
How many farmers leave an untreated check strip?
When Farming on a Flat Function, How do you know if you put on too much Fertilizer? Fungicide? Insecticide? Water?
Over use of inputs often an invisible cost
And Another Issue
Can’t?Costly!
Main Point
Implications of Farming a Flat Function when under use of inputs is obvious and over use is invisible
Wide range of input levels consistent with profit maximization (and risk management)
Some inputs turn out to not be used/needed afterwards, but cannot tell when put them on
Some of the “extra” inputs end up as pollution
Farmers accused of using too many inputs
In my opinion
This problem underlies a lot of complaints about farmers and the environment
It’s not a simple problem to explain to the public: Why do farmer use so much fertilizer, pesticide, water, etc.? Would farmers waste money on purpose?
Most farmers make an honest effort to be good stewards
But farming is messy and variable and it is expensive to find out where you are or will be on some flat function
What’s the answer? More/better technology? Try to better match “natural” systems? Both? Something else?