Embed Size (px)
Citation preview

FARMWORKER HOUSING
STUDY AND ACTION PLAN
FOR SALINAS VALLEY
AND PAJARO VALLEY
FINAL JUNE 2018
i
Acknowledgements This Study was funded by a collaboration of County and City governments,
affordable housing developers, and nonprofit organizations in Salinas Valley and
Pajaro Valley. Thanks to the leadership of the City Council, Mayor, and Measure
G Committee, the City of Salinas contributed more than two-thirds of the costs
of the Study and Regional Forum. Salinas also coordinated the preparation of
the Study and organization of the Regional Forum.
The preparation of this report was financed in part through grants from the
United States Department of Transportation (DOT) and facilitated by the
Metropolitan Planning Organization, the Association of Monterey Bay Area
Governments. Additional financial assistance was provided by the California
State Department of Transportation.
Research Team California Institute for Rural Studies - Lead
Gail Wadsworth
Don Villarejo
Richard Mines
Ildi Cummins-Carlisle
California Coalition for Rural Housing
Robert Wiener
Edward Samson
OVERSIGHT COMMITTEE MEMBERS • Association of Monterey Bay Area Governments: Heather Adamson,
Director of Planning and Sean Vienna, Planner
• Building Healthy Communities: Cesar Lara, Policy and Communications
Director and Monica Gurmilan, Land Use Policy Coordinator
• California Strawberry Commission: Carolyn O’Donnell, Communications
Director
• Center for Community Advocacy: Sabino Lopez, Interim Executive
Director; Juan Uranga, Executive Director (retired)
• CHISPA: Alfred Diaz-Infante, President/CEo
• City of Gonzales: Rene Mendez, City Manager and Thomas Truszkowski,
Deputy City Manager/Community Development Director
• City of Greenfield: Mic Steinmann, Community Services Director
• City of King: Steve Adams, City Manager and Maricruz Aguilar, Planner
• City of Salinas: Megan Hunter, Director of Community Development
ii
• City of Soledad: Michael McHatten, City Manager; Brent Slama,
Community and Economic Development Director
• City of Watsonville: Suzi Merriam, Director of Community Development
• Eden Housing: Jane Barr, Associate Director Real Estate Development
• Elkhorn Packing: Pete Colburn
• Grower-Shipper Association of Central California: Jim Bogart, President
and General Counsel
• MidPen Housing: Betsy Wilson, Director of Housing Development
• Monterey Bay Economic Partnership: Matt Huerta, Housing Program
Manager
• Monterey County Department of Health: Krista Hanni, Planning,
Evaluation and Policy Manager
• Monterey County Department of Social Services, Community Action
Partnership: Glorietta Rowland, Management Analyst-Homeless
Services; Lauren Suwansupa, Interim Community Affiliations Manager
and Margarita Zarraga, Community Affiliations Manager (retired)
• Monterey County Economic Development Department: David Spaur,
Economic Development Director
• Monterey County Farm Bureau: Norm Groot, Executive Director
• Monterey County Health in All Policies (HiAP) –Salinas: Carmen Gil, HiAP
Manager
• Monterey County Housing Authority: Jean Goebel, Executive Director
• Nunes Company: Brett Harrell, General Counsel
• Santa Cruz County: Julie Conway, Housing Manager
• Santa Cruz county Farm Bureau: Jess Brown, Executive Director
• Santa Cruz County Housing Authority: Jenny Panetta, Executive
Director
• United Way Monterey County: Katy Castagna, Executive Director
FUNDING PARTNERS Association of Monterey Bay Area Governments (AMBAG)
City of Gonzales
City of Greenfield
City of King
City of Salinas
City of Soledad
City of Watsonville
MidPen Housing
Monterey County
Monterey County Association of Realtors
iii
Monterey County Housing Authority
Monterey County Housing Development Corporation
Santa Cruz County
United Way Monterey County
PROJECT MANAGEMENT TEAM, CITY OF SALINAS Jennifer Coile, Project Manager, Advanced Planning Division
Megan Hunter, Director of Community Development
Tara Hullinger, Planning Manager, Advanced Planning Division
Adam Garrett, Assistant Planner, Advanced Planning Division
Denise Ledesma, Administrative Aide
Elani Trejo-Ezquivel, Office Technician
SURVEY TEAM Ana Vega
Lidia Contreras
Ofelia Flores
Jorge Sanjuan
Rafael Flores
Fernando Samayoa
Jessie Arreola
Steven Viorato
Maria Dominguez
Gloria Mora Avila
Cristina Cazares
Jesus Barron
Daniel Ibarra-Rojo
Mirna Robles
Rodrigo Peralta Báez
Aida Lopez
Janett Beltran
Maria Rios
Jaimee Depompeo
Roberto Mora

Executive Summary
Through a process of gathering primary and secondary data on the Salinas and
Pajaro Valley Laborshed, the research team of California Institute for Rural
Studies and California Coalition for Rural Housing has identified some specific
needs, barriers and solutions to the farmworker housing crisis in the Pajaro Valley
of Santa Cruz County and the Salinas Valley of Monterey County
Beginning in December, 2016, we undertook a thorough compilation and
analysis of existing databases on agricultural trends and labor patterns in the
region. From this research, we found that the estimated number of unique
individual agricultural workers employed in the region during 2016 was 91,433.
An estimated half of California’s current crop workers tell government
interviewers they lack authorization for U.S. employment. And those who are
documented are aging. Finally, the flow of foreign agricultural workers into the
U.S. has declined sharply. Some employers report labor shortages. Intense efforts
to mechanize every aspect of production are underway. Still other employers
have sought H-2A workers to supplement their domestic workforce.
We implemented a survey of 420 farmworkers in the laborshed as well as
interviews with employers and other stakeholders to gather primary data.
Among the farmworkers surveyed, men and women were relatively evenly
distributed across age groups with 75% of the interviewees married. The clear
majority of the immigrant farmworker interviewees had very few years of
schooling. They were 92% immigrants (not born in the U.S.). About one fifth
were follow-the-crop migrants (FTC) who had traveled outside the two county
area for agricultural employment.
Most households of farmworkers interviewed included non-family members who
were for the most part other farmworkers. There are consistently stunningly high
rates of residences that are above the severely crowded condition of 2.0 people
per room. This is true of almost all the subgroups of the population. Often more
than 5 people per bathroom.
About 40% of respondents live in houses, 30% in apartments. Another 19% live in
rented rooms without kitchens -- either in houses or apartments. Another 12%
live in “other” types of dwellings1. Eighty-nine percent of farmworkers were
1 Like motels, boarding houses or barracks
i
renters and 11% owners. Of those who reported as owners, a quarter own
mobile homes.
Other characteristics of those interviewed included:
Most have only completed primary school.
Wages ranged from a median of $12.79 per hour, mean of $13.64, with
median annual income of $25,000.
The majority do not work all year in agriculture.
o 7.5 months is the median.
o 44% of migrants work all year, 20% of non-migrants work year round.
Average age at arrival is about 20,
Median number of years in the US is 15 years.
Median age was 37
Median number of years with current employer is 4 years; a quarter
worked for their employer for 8 years or more.
Two-thirds are from four states in Mexico:
o Oaxaca 21%
o Michoacan 19%
o Jalisco 14%
o Guanajuato 10%
13% self-identified as indigenous Mixtec, Triqui, Zapotec
They work in a range of crops throughout the region.
o 46% participate in harvest
o 16% are packers
o 38% participate in all other farm-related tasks such as:
Weeding
Irrigating
Thinning
Pruning
Loading
Driving
Operating machines
Of the employers interviewed, a vast majority viewed the labor shortage as their
main challenge to success. Those who did not hire H-2A workers had little
knowledge of the conditions or type of housing in which their workers lived. And
while the majority of employers noted that they were facing a labor shortage
very few of those interviewed correlated this with a housing crisis.
ii
A primary idea expressed among stakeholders interviewed was that workers
were frequently victims of the current policies in effect at all levels of
government. Stakeholders included employers not included in the survey,
farmworker advocates, housing developers, housing managers, land use
planners, service providers, attorneys, and academics. Under this umbrella of
“victimization,” stakeholders mentioned exploitation of workers across the
board. There were mentions of how workers are recruited and paid, migration
challenges, and physical demands of the work. About half of the stakeholders
expressed concern about the cost of developing more housing and how to pay
for it.
The farmworker housing demand model developed in this project calculates the
total housing units needed of all types, based on target People Per Dwelling
(PPD), and total permanent affordable farmworker housing based on the
current rate that farmworkers access subsidized housing.
Key findings of the demand model were:
An additional 45,560 units of farmworker housing are needed to alleviate
critical overcrowding in farmworker households that are occupied at 7.00
PPD to the average PPD of 3.23 in Monterey County and the average PPD
2.60 in Santa Cruz County
A total of 5,372 units of permanent affordable farmworker housing are
needed to maintain the present “access rate”2 of 7.6 percent of
farmworkers to subsidized housing
The data from this study indicate an overwhelming need for affordable
permanent year-round family housing. However, approximately 20% of the total
population, or 18,300 farmworkers, are migrant, non-permanent residents. Of
those, more than 4,600 are H-2A visa workers. The H-2A employer is required to
provide housing, and many have contracted with motels to fulfill this
requirement.
The research team compiled a list of current funding for farmworker housing,
shown below.
2 Calculated by research team based on survey results

iii
The non-profit, for-profit, and housing authorities have the experience, flexibility,
and expertise to continue to build and manage affordable housing units for
farmworkers. However, projecting the number of units that these organizations,
and others, can reasonably develop over the next ten years based on historical
rates of development and in anticipation of increased funding and reduction of
development barriers we calculated that an additional 930 units could possibly
be constructed, far short of the 5,300 units necessary.
Project feasibility is constrained by adequate availability of land, cost of land,
cost of construction, funding resources, and governmental regulations. The
ability to address the housing gap is not solely dependent upon the capacity of
the local organizations but will require significant improvement in the conditions
that restrict the development of affordable housing.
Based on the in depth research, there are a range of potential actions to
remove barriers and encourage development. The Study Oversight Committee
prepared a Draft Action Plan for discussion with potential actions regarding
Housing Type, Financing, Sites, and Regulatory Reforms.
Federal USDA Section 514/516 Farm Labor Housing
USDA Section 521 Rural Rental Assistance
USDA Section 502 Direct Loan/Section 523 Mutual
Self-Help Housing Technical Assistance
HUD Community Development Block Grant
HUD HOME Investment Partnerships
Federal Home Loan Bank Board Affordable
Housing Program
State HCD Joe Serna, Jr., Farm Worker Housing Grant
HCD California Self-Help Housing Program
HCD CalHome
HCD Multifamily Housing Program
TCAC Federal and State Low-Income Housing Tax
Credits
HCD Farm Worker Housing Tax Credit Assistance
SGC Affordable Housing and Sustainable
Communities Program
USDA = U.S. Department of Agriculture
HUD = U.S. Department of Housing and Urban Development
HCD = California Department of Housing and Community Development
TCAC = California Tax Credit Allocation Committee
SGC = California Strategic Growth Council
iv
DRAFT ACTION PLAN – APRIL 2018
Farmworker Housing Study Oversight Committee Recommendations
The following was considered at the Regional Forum on April 19, 2018.
Overview
This research found that the estimated number of unique individual workers employed
in agriculture in the region during 2016 was 91,433. It is clear from the primary data
collected in the survey phases of this study that farmworker housing in the Salinas-Pajaro
Laborshed needs to be drastically increased.
Farmworker housing in the region is severely crowded. In assessing the needs based on
survey data, an astounding 45,560 additional units of farmworker housing are needed
to alleviate critical overcrowding in farmworker households.
Based upon income levels and housing costs, farmworkers need subsidized housing.
The survey determined that 7.6% of farmworkers currently access subsidized housing.
Just to maintain that 7.6% “access rate,” a total of 5,300 units of permanent affordable
subsidized farmworker housing are needed.
Study data demonstrates that the preponderance of workers are year-round residents.
75% of those surveyed are married, often living in households with minor children born in
the United States. Although frequently the focus has been on providing housing for
temporary farmworkers, the data is clear that the most significant need is for
permanent farmworker family housing.
While there is new funding in the State of California for affordable housing including
resources specifically targeted to farmworkers, the demand will not be met with what is
currently available. Therefore, this action plan is focused on what we can collectively
do to quickly produce affordable farmworker housing with a focus on permanent
farmworker families.
Goal: Make available 5,300 permanent, affordable farmworker housing units over the
next five years to stabilize the agriculture workforce in the Salinas and Pajaro Valley
Region.
Housing Types
Objective: Promote alternative farmworker housing tenure and development prototypes
that have worked in Monterey Bay Region, California, and other parts of the nation.
v
H1. Family housing priority: Prioritize the construction of permanent, year-round
housing for farmworker families.
H2. Intergenerational: Facilitate the development of intergenerational farmworker
housing for multiple generations of farmworkers (retirees, working adults, and
children) to create opportunities for mutual self-reliance, such as provision of
childcare and elder care. Best practice includes the Desert Gardens
Apartments in Indio.
H3. Services: Incentivize housing that incorporates wrap-around services to
strengthen families, transfer new skills, and build leadership.
H4. Accessory Units: Facilitate the development of Accessory Dwelling Units (ADUs)
by considering the reduction of ADU impact and permit fees, disseminating
public information, and establishing lender products for ADU new construction
and rehabilitation.
H5. Seasonal: Facilitate private sector development of farmworker housing with
unrestricted funding sources to allow flexibility in providing housing for seasonal,
migrant, or any other farmworker regardless of documentation.
H6. Energy Efficiency: Support housing projects, both new construction and
rehabilitation, which integrate energy efficiency, water conservation, and other
green elements that reduce operational costs to sustain the project over time.
Best practice includes the Mutual Housing at Spring Lake in Woodland.
H7. New Technologies: Educate the local International Code Councils and Building
Officials to streamline the approval of new building technologies, such as
modular construction as alternative to traditional stick-built, which have the
potential to more efficiently and economically scale up housing production.
Best practice includes George Ortiz Plaza I in Santa Rosa.
H8. Emergency Housing: Investigate and pilot the use of innovative emergency
housing types for seasonal, migrant farmworkers such as mobile homes.
H9. H-2A Worker Lodging: Collaborate with other jurisdictions to develop a model
ordinance for the temporary use of motels/hotels for H-2A or other seasonal
farmworkers.
H10. Housing Cooperatives: Support the development of new housing cooperatives
or assist residents of existing housing, such as labor camps and mobile home
parks, to convert their housing to limited-equity cooperatives as an affordable
alternative to renting and fee-simple ownership.
H11. Mutual Housing: Support resident-controlled mutual housing and mutual housing
associations, which empower tenants to be leaders and activists in the
governance and operation of their homes.

vi
Suitable Sites
Objective: Collaborate among jurisdictions to identify appropriate locations for
farmworker housing within cities and unincorporated counties to facilitate development
of farmworker housing.
S1. Map Sites: Map appropriate sites for farmworker housing in collaboration with
local jurisdictions in the region and streamline the approval processes whenever
possible.
S2. Zoning: Encourage local jurisdictions to evaluate current General Plan and
zoning based upon housing funding criteria and, when appropriate, re-zone
properties to create additional sites for affordable, farmworker housing.
S3. City-County Agreements: Establish agreements between counties and cities that
allow for contiguous, unincorporated county land to connect to city
infrastructure to facilitate development of farmworker housing.
S4. Agriculture Zoning: Relax restrictions on the residential use of agriculturally-zoned
land in unincorporated county areas that restrict on-farm residential
development.
S5. Overlay Zones: Promote the establishment of Affordable Housing Overlay Zones
in ‘high-opportunity’ areas within Monterey County that include a bundle of
effective and flexible incentives to encourage developers to build affordable
and farmworker housing.
S6. On-farm housing: Encourage on-farm employee housing.
S7. Ag Land: Incentivize growers with marginal agricultural land contiguous to and
surrounded by urban uses to dedicate, discount, or lease land for farmworker
housing, including no-cost release from Williamson Act contracts.
S8. Assembling parcels: Enable property owners with contiguous sites appropriate
for farmworker housing to parcellate the land or create new lot lines to
accommodate larger, more economically feasible projects.
S9. Land Trusts: Encourage existing land trusts or the creation of new land trusts that
build and preserve farmworker housing on land that is leased from the trust and
held in restricted affordability in perpetuity.
S10. Transit Strategies: Support the implementation of appropriate strategies identified
in AMBAG’s regional study of Transportation Alternatives for Rural Areas, such as
expanded vanpools, mobility hub development, public/private partnerships with
Transportation Network Companies, Expanded Express Transit Service, and
Workforce Housing Developments.
vii
S11. Transit: Coordinate with regional transit agencies to provide better access
between housing sites and agricultural workplaces.
Financing
Objective 1: Proactively pursue and leverage governmental and non-governmental
funds to increase the inventory of farmworker housing.
Objective 2: Capitalize on existing regional and local housing trust funds and create
new local funding sources for the construction, rehabilitation, acquisition, and operation
of farmworker housing.
F1. New State Funding: Effectively leverage new State funding resources including SB
2, the Building Homes and Jobs Act, and SB 3, the Veterans and Affordable
Housing Bond Act of 2018, if approved by voters in November 2018, to finance
new permanent, affordable farmworker housing.
F2. Expedite SB 2 Funds: Advocate that the California Department of Housing and
Community Development (HCD) expedite processing of SB 2 funding and
develop reasonable program guidelines to facilitate development of affordable
farmworker housing.
F3. State Bond: Outreach to local residents and advocate for the passage of the
Veterans and Affordable Housing Bond in November 2018 as a source for
affordable farmworker housing for the Region.
F4. Santa Cruz County Bond: Continue collaboration among Santa Cruz County
stakeholders to include a local housing bond measure on the ballot in November
2018 and effectively campaign for its passage.
F5. Monterey County Bond: Continue efforts among Monterey County stakeholders
to initiate a local housing bond for the November 2020 election.
F6. Ag Business Funding: Facilitate the creation of alternative funding mechanisms
by convening agricultural representatives interested in sharing resources to build
and operate farmworker housing both for year-round, permanent and
seasonable, migrant housing. Best practice includes the Napa self-assessment of
wine grape growers.
F7. Inclusionary Housing: Update and strengthen local Inclusionary Housing
Programs as a mechanism to provide additional affordable housing units that
could be targeted for farmworkers.
F8. Linkage Fees: Explore the development of Commercial/Industrial Linkage Fee
Programs to ensure there is a jobs-housing balance and/or fit to meet the
affordable housing needs of new employees and local residents.

viii
F9. Local Funding: Maximize local funding resources to be in the best possible
competitive position to leverage conventional non-local grants, investor equity,
and low-cost financing for production and preservation of farmworker housing.
F10. Competitive Parcels: Pro-actively market parcels within jurisdictions that would
likely be competitive under existing State-administered housing programs, such
as the Federal and State Low-Income Housing Tax Credit Programs.
F11. Local/Federal Funds: Commit federal pass-through funds, such as Community
Development Block Grant and Home Investment Partnership grants, to the
production and preservation of farmworker housing.
F12. Parcel Taxes: Explore Parcel Taxes for affordable housing (including farmworker
housing) that would tax land rather than new development.
F13. Transient Occupancy Taxes: Explore an increase to Transient Occupancy Taxes
on hotels, motels, vacation rentals, and other accommodations in the Monterey
Bay Region to support affordable housing for service workers and farmworkers.
F14. Cannabis Taxes: Explore allocating a portion of Cannabis Business Taxes to foster
affordable housing production including funding of planning staff to shepherd
projects through the process.
F15. Federal/State Funds: Aggressively apply for Federal and State housing finance
programs that are occupationally-restricted or advantage farmworker housing,
namely USDA Section 514/516 Farm Labor Housing coupled with USDA Section
521 Rural Rental Assistance and California Joe Serna, Jr., Farmworker Housing
Grant, State Farmworker Housing Tax Credit, and Multifamily Housing Program.
F16. Support USDA Programs: Advocate for the continuation and expansion of USDA
Section 514/516 Farm Labor Housing Program and USDA Section 523 Rural Rental
Assistance Program.
F17. USDA Funds: Educate affordable housing providers about successful strategies to
couple USDA Section 523 Rural Rental Assistance and USDA Section 514/516
Farm Labor Housing Programs to help fund affordable farmworker housing.
F18. USDA Regulations: Reform the USDA Section 514/516 Farm Labor Housing loans
and grants to allow projects that include both farmworker and non-farmworker
units. Best practices include the Nuevo Amanecer Apartments in Pajaro and
Azahar Place Apartments in Ventura.
F19. Mutual Self-Help: Reintroduce the Mutual Self-Help Housing method of sweat
equity and owner-building of single-family homes under the supervision of local
nonprofit housing organizations using a combination of USDA Rural Development
Section 502 Direct Loan and Section 523 Technical Assistance Grants with State

ix
Joe Serna, Jr., Farmworker Housing Grant Program funds to produce affordable
homeownership opportunities for farmworkers.
Regulatory Reform
Objective: Change regulations to remove barriers, streamline processing, and reduce
costs for the development of farmworker housing.
R1. Update Zoning: Promote and fund the update of restrictive and outdated zoning
designations that limit residential densities, height, setbacks, and Floor-Area-
Ratios (FARs), especially in urban cores and corridors, and identify and eliminate
unnecessary or redundant discretionary reviews that cause costly delays and
discourage applicants.
R2. Remove Barriers – Employer-Sponsored Housing: Identify and eliminate barriers
for the development of employer-sponsored housing while ensuring that the
development is built to allow for future conversion to multi-family should the
employer sell the property.
R3. CA Coastal Commission Obstacles: Remove impediments to farmworker housing
within areas subject to the California Coastal Commission through update of
Local Coastal Plans and reform the regulations governing the exemption of
agriculture activities and permits set by the California Coastal Act.
R4. SB 2 Funded Streamlining: Apply for SB 2 funding to update zoning and revise
other regulations to streamline production of farmworker housing and other
housing types.
R5. Priority Processing: Allow for priority processing of by-right, year-round,
permanent farmworker housing projects that meet underlying zoning
requirements.
R6. Ombudsman Assistance: Fund and designate a point-person or ombudsperson
responsible for shepherding farmworker housing project applications through the
local government approval process and advocating for them. Best practice
includes an ombudsman in San Mateo County for farmworker housing.
R7. Template Plans: Design and develop pre-approved plans and adopt modified
development-by-right for farmworker housing, including dormitory-style, modular,
and multifamily prototypes proposed on agricultural parcels meeting specified
site and zoning criteria in unincorporated areas. Best practice includes a recent
approach adopted in Ventura County.
R8. Development Impact Fees: Encourage local jurisdictions to consider adopting
ordinances that waive development impact fees for affordable farmworker
housing.
x
R9. Fee Deferral: Support local jurisdictions in establishing development fee deferral
programs for affordable and workforce housing and implement the program
when requested by the developer.
R10. Fees – Smaller Units: Incentivize smaller, less expensive units by charging
developer impact fees based on unit square footage rather than per unit and
reducing minimum net land area per unit requirements.
R11. Parking Requirements: Encourage local jurisdictions to allow for greater flexibility
in the provision of parking for affordable farmworker housing, where appropriate.
R12. Mixed Use Requirements: Provide greater flexibility in the ratio of residential and
commercial space in mixed-use districts or zones to allow for more space that is
residential.
R13. Density Bonus: Educate local jurisdictions about the application of state-density
bonus to facilitate affordable farmworker housing and encourage the
development of an enhanced or super-density bonus where appropriate.
R14. Outreach: Conduct outreach and education workshops to stakeholders and the
public so that potential applicants and local communities better understand the
rules and regulations governing farmworker housing.
R15. Collaboration: Encourage local jurisdictions to proactively collaborate with
affordable housing developers and develop solutions that remove site-specific
land use barriers whenever possible.
R16. Staff Training: Expand training of city and county staff and local elected
officials about State and local land use laws and regulations and foster
can-do collaborative

xi
Acronyms used in this report
ADU Accessory Dwelling Unit
AHP Affordable Housing Program
AHSC Affordable Housing Sustainable Communities
AMBAG Association of Monterey Bay Area Governments
AMI Area Median Income
BLS Bureau of Labor Statistics
CCRH California Coalition for Rural Housing
CDBG Community Development Block Grant
CEQA California Environmental Quality Act
CHDO Community Housing Development Organization
CIRS California Institute for Rural Studies
CLT Community Land Trust
FHLB Federal Home Loan Bank
FMMP Farmland Mapping and Monitoring Program
FLC Farm labor Contractor
HCD California Department of Housing and Community Development
HOZ Housing Opportunity Zones
HUD U.S. Department of Housing and Urban Development
LIHTC Low Income Housing Tax Credit
MBEP Monterey Bay Economic Partnership
MPO Metropolitan Planning Organization
MTP Metropolitan Transportation Plan
NAICS North American Industrial Classification Syste
NAWS National Agricultural Worker Survey
PPD Persons Per Dwelling
QCEW Quarterly Census of Employment and Wages
xii
RHNA Regional Housing Needs Allocation
SCS Sustainable Communities Strategy
SGC Strategic Growth Council
SPAWHS Salinas Pajaro Agricultural Worker Housing Survey
TCAC Tax Credit Allocation Commission
USDA U.S. Department of Agriculture

xiii
Contents Acknowledgements ...................................................................................................... i
OVERSIGHT COMMITTEE MEMBERS ............................................................................ i
FUNDING PARTNERS ................................................................................................... ii
PROJECT MANAGEMENT TEAM, CITY OF SALINAS ...................................................iii
SURVEY TEAM..............................................................................................................iii
Executive Summary ........................................................................................................
DRAFT ACTION PLAN – APRIL 2018 .............................................................................. iv
Farmworker Housing Study Oversight Committee Recommendations ........... iv
Overview ................................................................................................................... iv
Goal: Make available 5,300 permanent, affordable farmworker housing units
over the next five years to stabilize the agriculture workforce in the Salinas and
Pajaro Valley Region................................................................................................ iv
Housing Types ........................................................................................................... iv
Suitable Sites ............................................................................................................. vi
Financing .................................................................................................................. vii
Regulatory Reform .................................................................................................... ix
Acronyms used in this report ...................................................................................... xi
Introduction ................................................................................................................... 1
Project Purpose: ......................................................................................................... 3
Community Collaboration: ....................................................................................... 3
Defining the Laborshed ............................................................................................. 4
Salinas-Pajaro Laborshed Farms, Agricultural Production and Employment ......... 4
Executive Summary .................................................................................................. 4
Farms and production .............................................................................................. 5
Agricultural employment.......................................................................................... 6
Discussion .................................................................................................................... 8
Farms and Farm Production ..................................................................................... 9
Agricultural land use ............................................................................................... 10
xiv
Farms and farmers in the Salinas-Pajaro Laborshed .......................................... 13
Size concentration of harvested cropland increased between 1992 and
2012 ............................................................................................................................ 15
Increased harvested acreage of vegetables, berries and some orchard
crops .......................................................................................................................... 17
Recent trends in the Salinas-Pajaro Region’s farm production ....................... 20
Recent trends in the production of major individual crops .............................. 25
Organic production ................................................................................................ 28
Cannabis: the crop that isn’t ................................................................................. 29
Multi-county operations of Salinas-Pajaro farm operators ............................... 30
Agricultural Employment in the Salinas-Pajaro Laborshed ................................. 31
Defining the farmworker population .................................................................... 31
Hired farm labor reported by the Census of Agriculture ................................... 34
Agricultural employment in the Salinas-Pajaro Laborshed reported by BLS .. 35
Farms reporting contract labor expenses in the Salinas-Pajaro Laborshed ... 39
Agricultural services employment in the Salinas-Pajaro Laborshed ................ 42
H-2A non-immigrant temporary foreign agricultural workers ........................... 49
Estimate of the number of agricultural workers in the Salinas- Pajaro
laborshed .................................................................................................................. 50
San Benito County is arguably part of the Salinas-Pajaro laborshed ............. 52
Discussion .................................................................................................................. 53
Data issues in administrative reports of agricultural services employment .... 56
Conclusions .............................................................................................................. 57
Analysis of Existing Farmworker Housing Inventory in Santa Cruz and Monterey
Counties ....................................................................................................................... 58
Site Suitability ............................................................................................................... 63
Executive Summary ................................................................................................ 63
Introduction .............................................................................................................. 65
Identification of Eligible Areas that Qualify for Financing under AHSC and
LIHTC .......................................................................................................................... 69
Specific Site Suitability Criteria for Determining Project Sites ............................ 76
Additional Consideration for Site Suitability Criteria ........................................... 78
xv
High Amenity Parcels .............................................................................................. 83
The Intersection of Housing, Employment, and Transit ............................................ 85
Executive Summary ................................................................................................ 85
Introduction .............................................................................................................. 86
Social Equity and Environmental Justice .............................................................. 89
Healthy Communities .............................................................................................. 90
Environment ............................................................................................................. 91
Economic Vitality..................................................................................................... 91
Access and Mobility ............................................................................................... 92
Transit-Oriented Development ............................................................................... 96
Conclusion ................................................................................................................ 99
Land Use Barriers and Reforms for Farmworker Housing Development in Santa
Cruz and Monterey Counties ..................................................................................... 99
Land Use Barriers ................................................................................................... 101
Lack of Available and Developable Land .......................................................... 102
Local Processing and Bureaucratic Obstacles .................................................. 111
Land Use Reforms .................................................................................................. 114
Other Local Land Use Approaches and Innovations ......................................... 132
Conclusion ............................................................................................................. 139
The Salinas Pajaro Agricultural Workers Housing Survey (SPAWHS)..................... 141
Executive Summary .............................................................................................. 141
Demographics of the Interviewees .................................................................... 142
Demographics of other members of the Household ....................................... 143
Types of housing: ................................................................................................... 143
Methods: Surveys and Interviews ........................................................................ 146
Farmworker Survey ................................................................................................ 147
Sampling Frame ..................................................................................................... 147
The Sampling Universe .......................................................................................... 148
Sampling Workers .................................................................................................. 149
Employer Interviews ............................................................................................... 150
Stakeholder interviews .......................................................................................... 151
xvi
Recruitment, Training, and Supervision of worker interviewers: ..................... 151
Analysis of the Data .............................................................................................. 152
Demographics of the Interviewees ..................................................................... 152
Definitions of the Household Units ........................................................................ 159
Household Units--Who are household members? ............................................ 161
Education and Farm Labor Participation of Associated Household Members
.................................................................................................................................. 163
Migrant Farmworkers in the Salinas-Pajaro Laborshed ..................................... 165
Household Types ................................................................................................... 169
Joint Dwellings ........................................................................................................ 169
Further findings about housing ............................................................................ 173
People per room .................................................................................................... 174
Descriptions of Dwellings: Rent or Mortgage ...................................................... 177
Discussion of owner/renter and payments in mobile homes ......................... 180
Payments for Utilities .............................................................................................. 181
Payment and use of garbage, telephone, cable and internet service ....... 183
Complaints about condition of dwellings ......................................................... 184
Transportation ........................................................................................................ 186
Wages, Employment and Income ....................................................................... 189
Assets of households ............................................................................................. 198
H-2A workers in the SPAWHS ................................................................................ 200
Qualitative Data Report ............................................................................................ 202
Summary of Qualitative Data ............................................................................... 202
Employer Interviews .............................................................................................. 204
Stakeholder Interviews .......................................................................................... 204
Qualitative Survey Results: .................................................................................... 204
Employer Interviews .............................................................................................. 207
Primary challenges to success............................................................................. 208
Suggestions for improving housing problem ..................................................... 208
What are the perceived barriers to building worker housing? ...................... 209
What are some of the solutions employers see for the housing crisis? ......... 210

xvii
What do employers know about where their workers live? ........................... 211
Stakeholder Interviews .......................................................................................... 212
Development, Management, Financing ................................................................ 214
Best Practices and Alternative Housing Types ....................................................... 214
Modeling what Works for the Pajaro and Salinas Valleys Laborshed: Case
Studies .................................................................................................................... 214
Aliso Village East .................................................................................................... 216
Azahar Place Apartments .................................................................................... 220
Desert Gardens Apartments ................................................................................ 229
George Ortiz Plaza I Apartments ......................................................................... 236
Mutual Housing at Spring Lake ............................................................................ 244
River Ranch Migrant Housing Center .................................................................. 254
Evaluation of alternative housing types .............................................................. 262
Tiny Houses .............................................................................................................. 262
Other Alternatives for Farmworkers ..................................................................... 265
Alternative Models: Development, Tenure, Funding .......................................... 267
Alternative Development and Tenure Models ................................................... 267
Mutual Housing ...................................................................................................... 267
Mutual Self-Help Housing ...................................................................................... 269
Limited-Equity Housing Cooperative .................................................................. 270
Community Land Trust .......................................................................................... 272
Action Plan from Oversight Committee – Housing Types .................................. 273
Alternative Funding Models.................................................................................. 275
California’s New State Housing Trust Fund: The ‘Permanent Source’ ........... 277
State Farmworker Housing Trust Fund: The Case of Washington State ......... 277
Grower Self-Assessments: The Case of Napa County Vintners ...................... 279
Inclusionary Housing: Fostering Social and Economic Inclusion .................... 280
Commercial and Housing Linkage Fees: Creating a Jobs-Housing Balance
.................................................................................................................................. 283
Special Taxes .......................................................................................................... 285
Public Benefit Zoning: Harnessing the Public Share of Land Value Increases
.................................................................................................................................. 289

xviii
Taxing Cannabis: New Source of Revenue for Farm Labor Housing? .............. 291
Conclusion ............................................................................................................. 294
Federal Housing Funding Resources ....................................................................... 298
U.S. Department of Agriculture Rural Development ........................................... 298
Section 514/516 Farmworker Housing Loans and Grants ................................ 298
Section 521 Rural Rental Assistance ................................................................... 302
Section 502 Direct Loan/Section 523 Mutual Self-Help Technical Assistance
Grant........................................................................................................................ 304
U.S. Department of Housing and Urban Development ...................................... 308
Community Development Block Grant Program ............................................. 308
HOME Investment Partnerships Program ........................................................... 310
Federal Home Loan Bank ..................................................................................... 313
Affordable Housing Program ............................................................................... 313
State Housing Funding Resources ........................................................................... 314
SB 2 – Building Homes and Jobs Act ................................................................... 315
SB 3 – Veterans and Affordable Housing Bond Act of 2018 .............................. 316
California Department of Housing and Community Development .................. 317
Joe Serna, Jr. Farmworker Housing Grant Program (currently inactive) ......... 317
California Self-Help Housing Program (currently inactive) ............................... 320
CalHome (currently inactive) .............................................................................. 322
Multifamily Housing Program (currently inactive) .............................................. 324
California Tax Credit Allocation Committee....................................................... 326
Federal and State Low-Income Housing Tax Credit Programs ...................... 326
Farmworker Housing Assistance Tax Credit Program ....................................... 331
Affordable Housing and Sustainable Communities Program ......................... 334
Farmworker Housing Demand and Regional Organizational Capacity ............. 341
Executive Summary .............................................................................................. 341
Introduction ............................................................................................................ 343
Demand Model Data and Assumptions .............................................................. 346
Total Farmworker Population including Minor Children ................................... 346
Demand for Permanent Farmworker Housing .................................................... 348
xix
Demand for Permanent Affordable Subsidized Farmworker Housing .............. 349
Current Housing Stock .......................................................................................... 350
Regional Development Organizational Capacity ............................................. 352
Regional Development Organizations ............................................................... 352
Current Farmworker Housing Activity ................................................................. 354
Limits to Capacity .................................................................................................. 355
Projected Development and Affordable Housing Gap ................................. 356
Conclusion ............................................................................................................. 357
Goal: Produce 5,300 permanent, affordable farmworker housing units over the
next five years to stabilize the agriculture workforce in the Salinas and Pajaro
Valley Region. ........................................................................................................ 358
DRAFT ACTION PLAN – APRIL 2018 ........................................................................... 359
Overview ................................................................................................................ 359
Oversight Committee Recommendations .............................................................. 360
Goal: Produce 3,500 permanent, affordable farmworker housing units over the
next five years to stabilize the agriculture workforce in the Salinas and Pajaro
Valley Region. ........................................................................................................ 360
Housing Types ........................................................................................................ 360
Suitable Sites .......................................................................................................... 361
Financing ................................................................................................................ 362
Regulatory Reform ................................................................................................. 364
Regional Forum – April 19, 2018 ........................................................................... 366
Appendix 1. Estimated number of persons employed as agricultural workers in
the Salinas-Pajaro Valley during 2016. ................................................................... 368
Appendix 2: Site Suitability ....................................................................................... 375
Tax Credit Allocation Committee (TCAC) Rural Eligible High Amenity Parcels
................................................................................................................................. 375
Affordable Housing and Sustainable Communities (AHSC) Rural Innovations
Project Area (RIPA) Eligible High Amenity Parcels ............................................ 381
Conclusion ............................................................................................................. 389
Appendix 3: Targeted Types of Employers and Actual Selection of Types of
Employers* 2017 SPAWHS ......................................................................................... 391
Appendix 4: Data Tables 2017 SPAWHS .................................................................. 393

xx
Appendix 5: Survey Training Manual ...................................................................... 395
Entrenamiento para La Encuesta para la mejora de la vivienda de los
jornaleros de Pájaro y Salinas .............................................................................. 395
Appendix 6: Survey Instrument, Spanish ................................................................ 411
Sección IV Transporte .......................................................................................... 428
Notas del encuestador: ........................................................................................ 434
Appendix 7: Survey Instrument. English .................................................................. 438
APPENDIX 8: Summary Profiles and Descriptions of Select Organizations .......... 460
Community Housing Improvement Systems and Planning Association (CHISPA)
................................................................................................................................. 461
Eden Housing, Inc. ................................................................................................. 462
MidPen Housing Corporation ............................................................................... 463
Housing Authority of the County of Monterey .................................................... 464
Housing Authority of the County of Santa Cruz .................................................. 465
Appendix 9: Non-Profit, For-Profit, and Public Agencies that Supply and Manage
Affordable Housing in Santa Cruz and Monterey Counties .................................. 466
Appendix 10: Permanent Affordable Farmworker Housing Demand Model ...... 467
Appendix 11: Regional Forum – April 19, 2018 ....................................................... 470
Figures and Tables .................................................................................................... 471
End Notes ................................................................................................................... 476
1 | P a g e
Farmworker Housing Study and Action Plan for Salinas Valley and Pajaro Valley -
Final June 2018
SECTION 1: NEEDS ASSESSMENT Introduction
During the 2015-2023 Housing Element Update process, the City of Salinas was
asked to conduct a needs assessment of farmworker housing. Meanwhile, south
Salinas Valley mayors were travelling to Napa County to learn about their
pioneering solutions for funding farmworker housing. The City of Salinas agreed
to coordinate a regional survey and study of farmworker housing and the
development of an Action Plan to address the needs.
In August 2015, the Building Healthy Communities (BHC) – East Salinas Housing
Workgroup submitted a letter to the City of Salinas requesting that the Housing
Element 2015-2023 include an action to “conduct a special study that requires a
scientific community survey and/or a survey of agricultural employers in the
county to further define housing needs of farm labor workforce, financing
constraints and opportunities, and best practices.” Members of the Workgroup
included representatives of BHC, the Center for Community Advocacy, CHISPA,
Community Organized for Relational Power in Action, Monterey Bay Central
Labor Council, and Health in All Policies of the Monterey County Health
Department.
The Salinas City Council agreed to the request and added the action to the
Housing Element. The mayors of South Salinas Valley cities had been studying
alternative models for farmworker housing and when asked to collaborate in the
regional study, insisted that an “Action Plan” also be developed. When the
Study was announced, the Association of Monterey Bay Area Governments and
Santa Cruz County offered to participate and financially contribute to the study.
Therefore, the scope expanded to include Pajaro Valley as well as Salinas
Valley.
The City of Salinas served as the project management team and engaged a
contract project manager, Jennifer Coile, to coordinate the study.
2 | P a g e
Farmworker Housing Study and Action Plan for Salinas Valley and Pajaro Valley -
Final June 2018
A Request for Proposals was issued in July 2016 and a contract with the
California Institute for Rural Studies (CIRS) and California Coalition for Rural
Housing (CCRH) was executed in December 2016. CIRS and CCRH are
experienced with conducting agricultural workforce surveys and analyzing best
practice projects throughout California.
The California Institute for Rural Studies (CIRS) has been at the forefront of
research on rural California for 40 years, with an emphasis on promoting
improved health and well-being among agricultural workers. CIRS has
completed two farmworker housing assessments for counties in California and is
in process of a third. In 2007, CIRS completed the initial assessment of the
demand for farmworker housing in Napa County. The following year, CIRS
completed an assessment of the demand for farmworker housing and
transportation in Mendocino County. CIRS is currently working on a farmworker
housing assessment and action plan for the Salinas Pajaro laborshed. In 2013,
CIRS participated in a statewide effort to determine the needs for farmworker
housing and transportation and to offer proposals for solutions to the California
Department of Food and Agriculture. This work resulted in a collaborative
publication entitled “Shelter +Mobility Recommendations for California’s
Specialty Crop Ag Workforce.”
Working in the Eastern Coachella Valley, CIRS has completed a population
health report, an extensive survey tool, an environmental assessment tool for
housing conditions, a set of maps and policy briefs and an assessment of the
cumulative environmental vulnerability for the region. To achieve our goals,
CIRS recently completed a large-scale household survey of resident health that
relies on random selection of residences. Coupled with this survey is an
observational and environmental assessment of housing conditions. Data from
that extensive project is currently being analyzed.
Formed in 1976, the California Coalition for Rural Housing (CCRH) is the oldest
statewide association of community-based nonprofit housing development
organizations in the U.S. and the only statewide rural housing coalition. Our
members include both public housing authorities and private, nonprofit
agencies that specialize in the production of homes for rent and purchase by
low-income families. In San Mateo County, Mid-Pen Housing Coalition is an
active board member and partner.
From inception, CCRH has been dedicated to meeting the needs of
farmworkers for decent and affordable shelter. The organization was created

3 | P a g e
Farmworker Housing Study and Action Plan for Salinas Valley and Pajaro Valley -
Final June 2018
following a farmworker housing conference convened by then Governor Jerry
Brown to provide a voice for farmworker housing in the State Legislature. Our
members, working throughout California’s agricultural valleys, are the leading
producers and operators of farmworker housing in the state and the nation. In
addition to Mid-Pen, another eight organizations have developed farmworker
housing in coastal counties: Cabrillo Economic Development Corporation
(Ventura), People’s Self-Help Housing (San Luis Obispo), CHISPA (Monterey),
Ecumenical Association for Housing (Marin), Burbank Housing and California
Human Development Corporation (Sonoma), Rural Communities Housing
Development Corporation (Mendocino), and Napa Valley Community Housing
(Napa).
Project Purpose: • Develop a collective Action Plan to address farmworker housing
shortages so employers can rely on trained stable workforce.
• Foster regional collaboration so that the supply of farmworker
accommodations matches needs of specific types of farmworkers (e.g.
seasonal unaccompanied vs. year-round family) and improves
farmworker family health through safe living conditions.
• Provide current data to support advocacy for resources and resource
allocation, e.g. supporting project financing by affordable housing
developers.
Community Collaboration:
The study has been guided by an Oversight Committee comprised of twenty-
five representatives of funding partners (Monterey County, Santa Cruz County,
the Monterey Bay Association of Governments (AMBAG), the cities of King,
Gonzales, Soledad, Greenfield, and Salinas, Midpen Housing, Monterey County
Housing Authority, Monterey County Housing Development Corporation, and
Monterey County United Way) and stakeholders such as Grower Shipper
Association of the Central Coast, CHISPA, California Strawberry Commission,
Center for Community Advocacy, Elkhorn Packing, Health in All Policies Salinas
Workgroup, , Monterey Bay Economic Partnership, Nunes Companies, and
Building Healthy Communities East Salinas. This Committee has been directly
involved in guiding the development of the study stayed on track and meeting
the goals of the collaborative partnership. The Monterey County Association of
Realtors and Monterey County United Way contributed to the costs of the
Regional Forum to discuss the Study.

4 | P a g e
Farmworker Housing Study and Action Plan for Salinas Valley and Pajaro Valley -
Final June 2018
Defining the Laborshed
The concept of a
“laborshed” is
modeled from the
geographical
concept of a
watershed.
Similarly, a
laborshed can be
defined as a
geographical area
where labor
“flows.” The
laborshed in this
case is defined as
the area or region
from which the
Salinas and Pajaro
Valleys draw their
workers, regardless
of political
boundaries.3 Figure 1 is
a map showing the outlines of our study area which is comprised of the
employment centers for the Salinas-Pajaro Valleys. These boundaries were
agreed upon prior to study initiation but in completion of our research, we found
that the actual laborshed for the region was quite a bit larger geographically
with workers traveling from as far as Yuma, Arizona, on a regular, seasonal basis.
This will be discussed in more detail in the body of this report.
Salinas-Pajaro Laborshed Farms, Agricultural
Production and Employment
Executive Summary
The Salinas and Pajaro Laborshed comprise the nation’s leading region for the
production of fresh market vegetables, outstripping the entire state of second-
ranked Florida’s production by more than 25%, as measured by harvested fresh
3 Various workforce development agencies across the US use this term.
Salinas Valley
Pajaro Valley
FIGURE 1 MAP OF STUDY AREA
5 | P a g e
Farmworker Housing Study and Action Plan for Salinas Valley and Pajaro Valley -
Final June 2018
vegetable acreage. The economies of Monterey and Santa Cruz Counties are
primarily based on their farms.
Farms and production
There are 1,846 farms in Monterey and Santa Cruz Counties, as reported in the
2012 Census of Agriculture. About one-third were livestock and other animal
producers, one-third were fruit crop growers, one-seventh each were vegetable
farms, or nursery and floriculture farms, and just one-fourteenth were hay and
grain farms.
Between 1992 and 2012, there were dramatic increases of planted acreage of
two crops. While the harvested acreage of vegetables changed only modestly,
both the amount of land planted to berries and to winegrapes increased
dramatically.
Paradoxically, during the same twenty-year period, the number of farms
reporting harvested vegetable acreage fell by 16%, those with berry plantings
decreased by 26%, and the number growing apples declined by 44% in accord
with the decrease acreage of apples. But the number with winegrape plantings
doubled.
During the past decade, measured by comparing three-year annual averages
of farm cash receipts (inflation-adjusted 2016 dollars), production of crop and
animal commodities increased by 14%, to $5.2 billion (B). Of that total, $3.2 B
were vegetables, $1.5 B were fruit crops (mostly strawberries), $0.4 B were
floriculture and nursery crops, and $0.1 B were all other types of agriculture.
Not all crops fared equally well during this period: the value of vegetable
production grew by 12% while the value of fruit production, mainly berries,
increased by a remarkable 37%. But the value of cut flowers and other
ornamentals actually fell by 11%, mainly owing to sharply falling retail sales
during the Great Recession. Increased cut flower imports forced some
producers out of business.
A notable trend was increased size concentration of production during the past
two decades. The reported total of harvested cropland acres among farms with
at least 1,000 acres of such land increased from 158,091 acres in 1992 to 227,932
acres in 2012, a growth of 44%. During the same twenty-year period, the
reported sub-totals of harvested cropland acres in every one of the four smaller
reported size categories fell, for an overall decline of 35,726 acres (- 30%).
6 | P a g e
Farmworker Housing Study and Action Plan for Salinas Valley and Pajaro Valley -
Final June 2018
The region’s major vegetable product – all types of lettuce – underwent
substantial shifts during the past ten years: very much lower output of head
lettuce and some types of leaf lettuce while romaine output rose significantly.
Among fruit crops, berry output (tons) and value (adjusted 2016 $) each
increased by about 39%. Winegrape output (tons) fell by 21% during the past
decade, while value declined by just 12%, possibly associated with changes
varietals planted.
The organic category continued to increase its share of production during the
past decade, from 5.6% of total value of farm cash receipts during 2007 to 9.8%
of the value during 2016. Organic sales reached $481 million in 2016.
Agricultural employment
Corresponding to these trends in the pattern of crop production, labor demand
for berry production rose sharply, while labor demand for winegrape and head
lettuce production declined. During the past decade, agricultural employment
in the two-county region increased substantially.
An agricultural worker is “someone who performs agricultural labor on a farm,”
and data for “farm” and “agricultural labor” are defined by the North American
Industrial Classification System (NAICS), adopted by all Federal agencies in 2002.
Many farm and ranch operations directly employ agricultural workers, as do the
many businesses providing agricultural services in support of crop and animal
production. The latter include farm labor contractors and companies that
prepare fresh produce for marketing, such as salad plants.
As part of their quarterly unemployment tax obligations, nearly every California
employer is required to report the number of persons on their payroll during the
pay period that includes the 12th day of the month for each month of the
quarter. The Quarterly Census of Employment and Wages (QCEW) is compiled
by the Bureau of Labor Statistics from those reports submitted by employers. The
QCEW provides the only reliable monthly employment totals of agricultural
workers.
For the three-year period 2014-16, the average monthly employment in the
region reached 80,715 during July. The month of the lowest total, with 34,737
employed, was January, reflecting the seasonal pattern of agriculture sector
jobs.

7 | P a g e
Farmworker Housing Study and Action Plan for Salinas Valley and Pajaro Valley -
Final June 2018
The three-year annual average of monthly employment in the region increased
from 49,035 during 2005-07 to 60,837 during 2014-16. Thus, annual average
agricultural employment in the Salinas-Pajaro Laborshed increased by a
remarkable 24% during the past decade.
Though relatively small in number – less than 5% of agricultural workers - even
more rapidly increasing was the total number temporary foreign agricultural
workers certified for employment in the region under the H-2A visa program. The
numbers of such workers are included in the reported QCEW data because they
were employed by U.S. businesses. By 2017, the number of H-2A working in the
Salinas-Pajaro Laborshed was more than 4,300, up from just 636 three years
earlier.
A surprising finding of the QCEW reports is that, for every single month, the 2014-
16 average employment finds the number of employees of businesses providing
support services for crop and animal production was larger than the number of
direct-hire employees of crop and animal farms. The largest share of support
service employees were persons working for farm labor contractors.
Increased reliance on farm labor contractors is a long-term trend throughout
California agriculture. The agricultural census reported that 1,329 farms in the
Salinas-Pajaro region had directly hired farm labor in 1978; by 2012, the number
had dropped to 980 (-26%). During 1978, just 406 farms had contact labor; by
2012, the number of farms with contract labor had increased to 564 (+39%).
Although the evidence is sparse, comparing similar tasks for a specific crop finds
the average wage rate reportedly earned by labor contactor employees is very
nearly the same as for workers directly hired by farm operators. However, farm
operators are more likely to offer non-wage benefits. But the proportion of farms
offering housing benefits to their seasonal employees has declined precipitously
during the past two decades.
The farm labor contractor (FLC) sector has also experienced an increase in size
concentration in recent years. In Monterey County, where most FLCs in the
region are based, the total number of FLC employees during the third calendar
quarter of the year more than doubled between 1990 and 2016, from 18,914 to
40,468. FLCs with 500 or more workers on payroll had just a one-fourth share of
such employment in 1990. By 2016, the number of these largest FLCs had tripled
and they had a two-thirds share of the County’s contract labor employment.
8 | P a g e
Farmworker Housing Study and Action Plan for Salinas Valley and Pajaro Valley -
Final June 2018
There has also been a dramatic increase of multi-county farm labor contracting
in the Salinas-Pajaro region in recent year. But QCEW data and other
administrative data fail to accurately report either the amount of their
employment in the region, or in each of the counties where they are active.
Altogether, during 2016, there were 118 licensed farm labor contractors who
were registered with the County Agricultural Commissioners of either Monterey
or Santa Cruz County, or both. But just a total of 70 were represented in the
QCEW file for the region. More than half of the 118 had registered in other
counties as will. Some thirteen of the total had registered in ten or more
counties.
Discussion A principal finding of this report is that the estimated number of unique individual
workers employed in the region during 2016 was 91,433.
Although some might be shocked that such a large estimated number of
individuals were agricultural workers in Monterey and Santa Cruz counties during
2016, single-week, peak-season employment was reported to have been 80,714
during this period. Despite increased mechanization, challenges of reported
labor shortages, intrusive regulation, substantial increases in the state’s minimum
wage rate, employment has increased.
Of great significance is the Salinas-Pajaro Laborshed fresh market produce
industry pioneered new products that became standard items found in retail
markets, such as bagged and washed fresh-cut produce, as well as production
for the fast-growing foodservice markets. The ballooning, mass-market organic
category had its origins here.
Nevertheless, there are indicators that the market for fresh vegetables may be
softening somewhat. The USDA report on U.S. utilization of fresh vegetables finds
a decline of 14.7 lbs. in annual per capita consumption, about -7%, based on
three-year annual averages from 2003-05 to 2013-15.
A large survey by the U.S. Centers for Disease Control and Prevention finds just
9% of U.S. adults meet the recommended daily consumption of fresh vegetables
and only 12.2% similarly meet the recommendation for fresh fruit.
The annual Fresh Trends survey of consumers similarly finds a statistically
significant decline between 2007-0 and 2015-17 in the proportion of households
reporting retail purchases of lettuce, celery and salad mix. Smaller nominal
9 | P a g e
Farmworker Housing Study and Action Plan for Salinas Valley and Pajaro Valley -
Final June 2018
declines, but not statistically significant, were also reported for broccoli and
cauliflower. But purchases of spinach were nominally higher, but not by a
statistically significant amount.
Starting in 2016, for the very first time, household expenditures for the purchase
of meals prepared outside of the home exceeded expenditure for the purchase
of groceries for the preparation of meals in the home. From fast-food to pizza
delivery, and institutional foodservice to formal restaurants, meals purchased
away from home have become the fastest-growing sector of the food business.
Although it is beyond the scope of the present report to speculate about the
future demand for fresh produce, the very low per-capita consumption can be
viewed as a challenge to the industry. Thirty years ago, salad mix and organic
produce were the sole province of food co-operatives and “hippy” enclaves,
but are both mainstream and fast-growing categories.
A serious additional problem is of immediate concern. An estimated half of
California’s current crop workers tell government interviewers they lack
authorization for U.S. employment. And those who are documented are aging.
Finally, the flow of foreign agricultural workers into the U.S. has declined sharply.
Some employers report labor shortages. Intense efforts to mechanize every
aspect of production are underway. Still other employers have sought H-2A
workers to supplement their domestic workforce.
The displacement of older, established members of the workforce by new
workers has not been studied or discussed, but might present societal problems
in the near term.
Policy discourse in Congress to address these concerns of the agriculture
industry is at a standstill: it appears unlikely that major changes in immigration
law will be enacted in the near term. Meanwhile, enforcement is being stepped
up.
Farms and Farm Production
The present report is intended to provide an overview and discussion of trends
within the agricultural sector of the Salinas-Pajaro Laborshed. Agriculture begins
with the land, and the farms whose operations produce food and fiber. It is only
natural that this report also begins with an examination of land use and the
10 | P a g e
Farmworker Housing Study and Action Plan for Salinas Valley and Pajaro Valley -
Final June 2018
farms whose production is the basis of the region’s economy. The report
continues with an overview of production, and, finally, a separate section
focuses on agricultural employment.
The Salinas-Pajaro region has long been the state and national leader in the
production of fresh vegetables and berries. Less well understood is the extent to
which the region has successfully adapted to significant shifts in consumer
preferences and purchasing behaviors. Packaged fresh cut produce, such as
bagged leafy greens, as well as foodservice produce, have become major
segments of the fresh vegetable sector of the industry. Much of the innovation
of this sector was pioneered in California, mostly in the Salinas-Pajaro region.
Agricultural land use
The combined land area of the Salinas-Pajaro region that is devoted to
agriculture production was reported in the 2012 agricultural census to be 1.4
million acres. The total land area of the two counties was reported to be about
2.4 million acres. Thus, the majority of land within the two counties, about 57%, is
devoted to agricultural production. A substantial share of the region’s land is
forested, much of which is within the north tract of the federally protected Los
Padres National Forest.
While many are aware of crop production in this region, nearly two-thirds of the
region’s farmland is devoted to pasture or range, some 887,434 acres in 2012.
Figure 1 presents the major agricultural uses of the region’s farmland.4 About
200,100 acres were used for vegetable production, just over 22,800 acres
planted to berries, orchards (trees and vineyards) were 64,300 acres, and other
types of crops, such as cut flowers & nursery crops, as well as grain and hay
crops, accounted for about 56,100 acres.
4 2012 Census of Agriculture. California, State and County Data, Volume 1, Geographic Area
Series, Part 5. United States Department of Agriculture, National Agricultural Statistics Service,
May 2014. County Data. Table 8. Farms, Land In Farms, Value of Land and Buildings, and Land
Use: 2012 and 2007, pp. 302ff.

11 | P a g e
Farmworker Housing Study and Action Plan for Salinas Valley and Pajaro Valley -
Final June 2018
FIGURE 2 AGRICULTURAL LAND: MONTEREY AND SANTA CRUZ COUNTIES 2012
Of the region’s cropland, some 312,594 acres were harvested in 2012. A total of
292,732 acres of farmland in the region were irrigated, about 21%.
Although 201,138 acres of land are used for vegetable production, owing to
successive multi-cropping on some pieces of ground, the total harvested
vegetable acreage was 279,444 acres in 2012. It is not unusual for a piece of
ground to be planted and then harvested in vegetables more than once in the
course of a year.
All but a small portion of the region’s vegetable production is for the fresh
market. In 2012, the agricultural census reported 15,014 acres of vegetables had
been harvested for processing (typically canned or frozen) but 264,419 acres
had been harvested for the fresh market. Hence, in that year, 95% of the
harvested vegetable acreage was destined for the fresh market.
Pasture & range
64%
Other farm use
11%
Other cropland
4%
Orchards & vines
5%
Berries
2%
Vegetables
14%
Agricultural Land:
Monterey & Santa Cruz Counties 2012Total Farmland = 1,390,902 acres
Source: USDA, 2012 Census of Agriculture. Caifornia. County
Data
12 | P a g e
Farmworker Housing Study and Action Plan for Salinas Valley and Pajaro Valley -
Final June 2018
The amount of Salinas-Pajaro regional land used for vegetable production, as
reported in the quinquennial agricultural census, has changed little from 1997
when 199,578 acres were reported for that purpose. The 2012 total of 201,138
acres were in vegetable production representing just a 1% increase in this
fifteen-year interval.
In contrast, land planted to berries, and land in wine grape vineyards have
increased by significant amounts during the same fifteen-year period. Land in
berry production increased from 15,084 acres in 1997 to 22,790 in 2012, an
increase of 52%. Land in wine grape vineyards also increased, from 44,309 acres
in 1997 to 57,852 acres in 2012, an increase of 31%.
Unlike some other agricultural regions of the state, the combined amount of
Salinas-Pajaro region cropland devoted to the production of berry, wine grape
and vegetables has increased in recent years. The region’s total acreage of
berries, wine grapes and vegetable production expanded from 258,971 acres in
1997 to 281,780 acres in 2012, a net growth of 22,823 acres, or +8%.
However, the Salinas-Pajaro region’s cut flower and ornamental nursery farm
sector experienced major setbacks in the past decade. From 2007 to 2012, the
annual value of this sector’s production decreased from $372.1 million to $288.4
million, a loss of $83.7 million, or 22.5% (inflation-adjusted 2012 $). Nearly all of this
decline occurred among Monterey County cut flower and ornamental plant
growers; in Sana Cruz County, inflation-adjusted sales of these commodities was
nearly the same in both 2007 and 2012.
The Salinas-Pajaro region was just one among many regions of the United States
to experience a sharp falloff of cut flower and ornamental nursery crop
production. During the period 2007 through 2012, inflation-adjusted farm cash
receipts from the marketing of U.S. Nursery, Greenhouse, Floriculture and Sod
Crops fell by 20%.5 Inflation adjusted California-wide farm sales of floral and
nursery crops fell by an even greater proportion, about 35%.6
5 See 2012 Census of Agriculture. United States, USDA, May 2014. Table 2. Market Value of
Agricultural Products Sold Including Landlord’s Share and Direct Sales: 2012 and 2007, p. 9.
Adjustment for inflation relied on the annual value of the GDP implicit price deflator, as
published in Economic Report of the President, Table B-3. Quantity and price indexes for gross
domestic product, and percent changes, 1965-2016. January 2017. Appendix B, p. 568 6 See 2012 Census of Agriculture. California, USDA, May 2014. Table 2. Market Value of
Agricultural Products Sold Including Landlord’s Share and Direct Sales: 2012 and 2007, p. 9. See
Footnote above for procedure for the adjustment for inflation.
13 | P a g e
Farmworker Housing Study and Action Plan for Salinas Valley and Pajaro Valley -
Final June 2018
There were two factors which accounted for this decline. First, several types of
cut flowers imported from Latin America have largely displaced much of U.S.
production. Imports of these products account for 79% of the U.S. supply.7 Some
types of imported cut flower products, such as roses and carnations, have
achieved a domestic market share of 90% or more.
Second, the Great Recession confronted many consumers with difficult
purchasing choices. The millions of families who experienced loss of employment
within the household, or lost the family home, or lost both, cut back discretionary
purchases, which meant fewer purchases of ornamentals. This industry sector
has yet to fully recover. The large negative impact of the Great Recession on
consumer demand for cut flowers and ornamental plants led to an abrupt and
sharp decline in reported sales by florists following the onset of the Great
Recession in 2008. U.S. florist retail sales fell from $6.8 billion in 2007 to $4.7 billion
in 2012 (inflation-adjusted 2012 $), an especially sharp 31% decline.8
Farms and farmers in the Salinas-Pajaro Laborshed
According to the most recent agricultural census, there were 1,846 farms
producing agriculture commodities valued at $1,000 or more and intended for
sale, within Monterey and Santa Cruz Counties.9 The number of farms has varied
modestly during the three most recent agricultural censuses, from a high of 1,970
in 2002, down by just 124 farms (-6%) in 2012.
The preponderance of pasture and range in the region is reflected in the finding
that about one-third of the region’s farms, or 654 out of 1,846, reported using this
vast pastureland for the production of livestock or other types of animals, or
animal products.
Farms are classified according to their principal type of agricultural production.
Figure 2 presents the classification of Salinas-Pajaro farms according to their
principal type of agriculture production (value) during 2012. In this region, the
number of livestock and other animal production farms – 626 – is larger than the
number in any other farm classifications, accounting for 34% of all farms.
7 Industry Fact Sheet. California Cut Flower Commission. See CCFC.org 2016. 8 See U.S. Census Bureau, Economic Census, Florists, 2007 and 2012. 9 2012 Census of Agriculture. California. State and County Data. Volume 1, Geographic Area
Series, Part 5; United States Department of Agriculture, National Agricultural Statistics Service,
May 2014, 550 pp + Appendices.

14 | P a g e
Farmworker Housing Study and Action Plan for Salinas Valley and Pajaro Valley -
Final June 2018
Among crop producers, by a very large margin, fruit growers, mainly strawberry
farms, outnumbered those in each of the other categories, with 620 farms.
Vegetable farms and greenhouse or nursery farms accounted for nearly equal
numbers, 237 and 238, respectively. There were just 125 farms whose principal
agricultural product is grain, hay or other field crops.
FIGURE 3 NUMBER OF FARMS: MONTEREY AND SANTA CRUZ COUNTIES BY TYPE
While the total number of farms in the Salinas-Pajaro region has changed little in
the past several decades, there have been some significant changes of the
number of farms within specific categories. This is illustrated in Figure 3 in which
the numbers of farms of each principal type are compared for the twenty-year
period, 1992-2012.
1111 & 1119 Grain,
hay and other field
crops
7%
1112 Vegetable &
melon crops
13%
1113 Fruit & nut
crops
33%
1114 Greenhouse,
nursery & floriculture
13%
1112 Livestock &
other animal
production
34%
Number of farms, Monterey & Santa Cruz Counties, by
Type of farm, 2012 Total number of farms = 1,846
Source: USDA, 2012 Census of Agriculture. California. County Data

15 | P a g e
Farmworker Housing Study and Action Plan for Salinas Valley and Pajaro Valley -
Final June 2018
FIGURE 4 NUMBER OF FARMS: MONTEREY AND SANTA CRUZ COUNTIES BY PRINCIPAL TYPE
For the three leading types of crop farms combined – Vegetable and Melon
Crops, Fruit and Nut Crops, and Greenhouse, Nursery and Floriculture Crops –
there was a decrease of the number of farms in the region in 2012 as compared
with twenty years earlier: 223 fewer farms. For Grain, Hay and Other Field Crop
farms, there was a net increase of 39 farms, and for Livestock and Other Animal
Production, there was a net increase of 12 farms. The overall number of farms in
the region declined somewhat in this period, by about 8%.
Size concentration of harvested cropland increased between 1992
and 2012
The reported increase of cropland harvested in the region by 34,115 acres
between 1992 and 2012, combined with the decline of the number of farms
during that period indicates size concentration among crop farms has
increased. This hypothesis was put to a test. Agricultural census data report the
0
100
200
300
400
500
600
700
800
Grain, hay and
other field crops
Vegetable &
melon crops
Fruit & nut crops Greenhouse,
nursery &
floriculture
Livestock & other
animal
production
Nu
mb
er
of
Fa
rms
Number of Farms, by Principal Type, Monterey and
Santa Cruz Counties, 1992 & 2012Source: USDA, 1992 & 2012 Census of Agriculture. California. County
Data
1992 2012

16 | P a g e
Farmworker Housing Study and Action Plan for Salinas Valley and Pajaro Valley -
Final June 2018
amount of cropland harvested by those farms with 1,000 acres or more of
cropland harvested gained a sharply increased share of the region’s total.
Figure 4 presents the findings of the total amount of cropland acres harvested
by each of five size groups of farms according to their amount of cropland
harvested during 1992 and 2016. The figure indicates the amount cropland
harvested for Monterey and Santa Cruz Counties combined, rather than
separately for each county.
For those farms which had 1,000 acres or more of harvested cropland in each of
those two specific years, the combined total of acreage harvested increased
substantially during the twenty-year period, from a total of 158,091 acres in 1992
to 227,932 acres in 2012, an increase of 69,841 acres, or +44%. In every one of
the four smaller size categories, the cropland acres harvested in 2012 was
smaller than in 1992. Moreover, the number of farms with 1,000 acres or more of
harvested cropland in 2012 was larger than the corresponding number in 1992,
74 vs. 65.
FIGURE 5 MONTEREY AND SANTA CRUZ FARMS HARVESTED ACRES BY AMOUNT HARVESTED
0
50000
100000
150000
200000
250000
Less than 50
cropland acres
50 to 199
cropland acres
200 to 499
cropland acres
500 to 999
cropland acres
1,000 or more
cropland acres
Tota
l c
rop
ac
res
ha
rve
ste
d
Harvested Crop Acres by Amount Harvested
Monterey & Santa Cruz County Farms, 1992-2012Source: USDA, 1992 & 2012 Census of Agriculture. California. County
Data
1992 2012

17 | P a g e
Farmworker Housing Study and Action Plan for Salinas Valley and Pajaro Valley -
Final June 2018
It is significant to compare the total crop acres harvested in those specific years.
In 1992, the total cropland harvested was 278,479 acres, while in 2012 the total
was 312,594 acres, an increase of 34,115 acres, or 12%.
Thus, the net increase of harvested cropland among farms with at least 1,000
acres harvested – 69,841 acres – was more than twice as great as the net
increase of cropland acres harvested for all farms – 34,115 acres. Therefore, the
largest farms not only captured all of the net increase of harvested cropland
acreage among all farms, they also captured a combined 35,726 harvested
cropland acres formerly harvested by farms in all four of the smaller size groups.
The amount of harvested cropland acres lost by farms in all four of the smaller
size groups – 35,726 acres – represented nearly 30% of the total harvested
acreage of those four size groups – 120,380 acres – during 1992. Of course, it is
possible, even likely, that one or more specific farms formerly in a smaller size
group during 1992 may have expanded substantially in later years and may
have been in the largest size group in 2012, as suggested by the increase of the
number of the largest farms to 75 from a figure of 65 during 1992.
While the agricultural census does not identify which types of farms experienced
this increase of size concentration among Salinas-Pajaro Laborshed farms, the
census separately reported there were 65 vegetable farms with 1,000 or more
harvested acres in 2012. Hence, most of the 74 farms with 1,000 or more acres of
harvested cropland in 2012 were producing vegetables.
Increased harvested acreage of vegetables, berries and some
orchard crops
During the 20-year interval from 1992 through 2012, three major types of crops
were reported to have had substantial increases of harvested acreage. During
the same period, there were also notable changes in the number of farms
reporting harvested acreage among these same crops.
Among all types of vegetables, between 1992 and 2012, the harvested acreage
increased from 245,560 acres to 279,444 acres. But the number of farms
reporting harvested vegetables declined, from 371 to 310. These changes were
consistent with the discussion in the previous section in which a notable increase
of concentration of production by size of harvested acreage was reported.
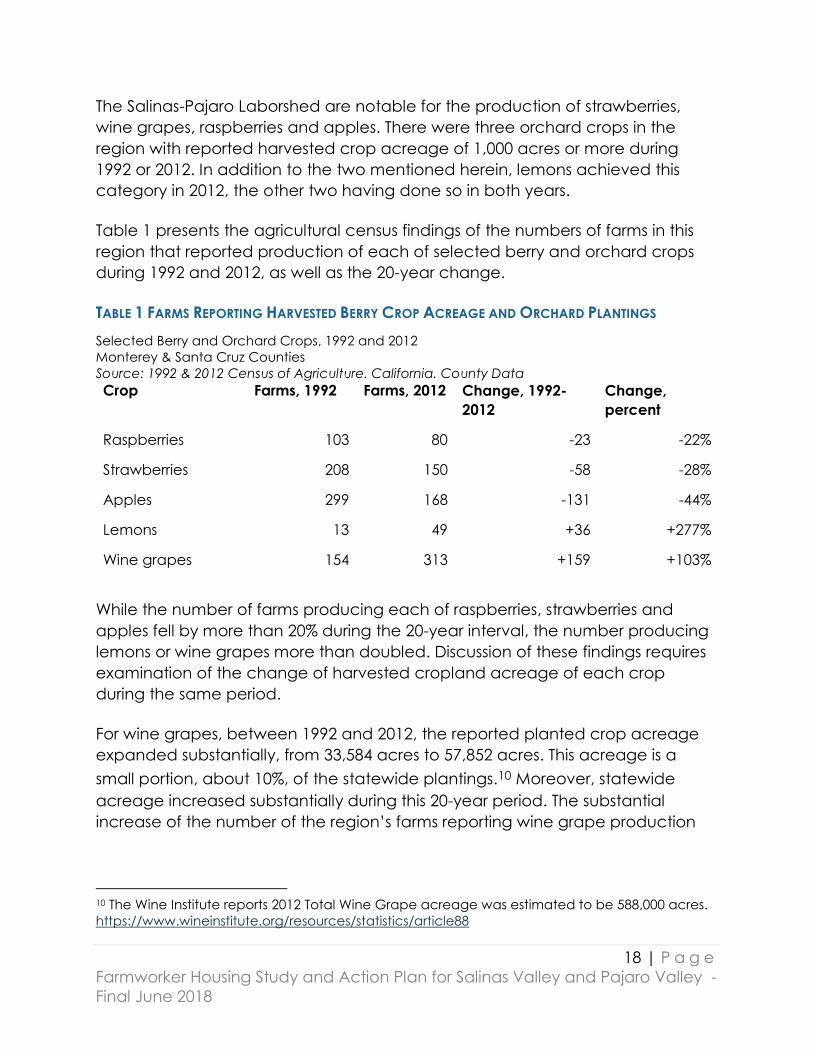
18 | P a g e
Farmworker Housing Study and Action Plan for Salinas Valley and Pajaro Valley -
Final June 2018
The Salinas-Pajaro Laborshed are notable for the production of strawberries,
wine grapes, raspberries and apples. There were three orchard crops in the
region with reported harvested crop acreage of 1,000 acres or more during
1992 or 2012. In addition to the two mentioned herein, lemons achieved this
category in 2012, the other two having done so in both years.
Table 1 presents the agricultural census findings of the numbers of farms in this
region that reported production of each of selected berry and orchard crops
during 1992 and 2012, as well as the 20-year change.
TABLE 1 FARMS REPORTING HARVESTED BERRY CROP ACREAGE AND ORCHARD PLANTINGS
Selected Berry and Orchard Crops, 1992 and 2012
Monterey & Santa Cruz Counties
Source: 1992 & 2012 Census of Agriculture. California. County Data
Crop Farms, 1992 Farms, 2012 Change, 1992-
2012
Change,
percent
Raspberries 103 80 -23 -22%
Strawberries 208 150 -58 -28%
Apples 299 168 -131 -44%
Lemons 13 49 +36 +277%
Wine grapes 154 313 +159 +103%
While the number of farms producing each of raspberries, strawberries and
apples fell by more than 20% during the 20-year interval, the number producing
lemons or wine grapes more than doubled. Discussion of these findings requires
examination of the change of harvested cropland acreage of each crop
during the same period.
For wine grapes, between 1992 and 2012, the reported planted crop acreage
expanded substantially, from 33,584 acres to 57,852 acres. This acreage is a
small portion, about 10%, of the statewide plantings.10 Moreover, statewide
acreage increased substantially during this 20-year period. The substantial
increase of the number of the region’s farms reporting wine grape production
10 The Wine Institute reports 2012 Total Wine Grape acreage was estimated to be 588,000 acres.
https://www.wineinstitute.org/resources/statistics/article88

19 | P a g e
Farmworker Housing Study and Action Plan for Salinas Valley and Pajaro Valley -
Final June 2018
reflects a great increase of the number of small producers, including boutique
wineries, as well as the expansion of acreage by some of the larger producers.
The history of the region’s lemon production is somewhat similar. From 1992 to
2012, the planted crop acreage of lemons increased from 872 acres to 2,044
acres. The majority of the state’s lemon production is located in along the South
Coastal portion of the state, mainly in Ventura County. Nevertheless, increased
consumption of lemons, and favorable local growing conditions, presented an
opportunity for farmers in the Monterey and Santa Cruz Counties to begin
producing this crop. Correspondingly, the number of farmers growing lemons in
this region increased.
The reported harvested crop acreage for raspberries, strawberries and apples in
the Monterey-Pajaro region is compared for 1992 and 2012 in Figure 6. A
notable contrast is the sharp increase in the harvested acreage of both berry
crops and the substantial decline of the planted acreage of apple crops.
FIGURE 6 ACREAGE BERRY AND APPLE CROPS, MONTEREY AND SANTA CRUZ COUNTIES
The sharply reduced number of berry farms in the Salinas-Pajaro Valleys region
while production acreage expanded greatly is associated with increased size
0
2,000
4,000
6,000
8,000
10,000
12,000
14,000
16,000
18,000
20,000
Raspberries, harvested Strawberries, harvested Apples, planted
Ac
res
Acreage, Monterey & Santa Cruz Counties
Berry and Apple Crops, 1992 & 2012Source: USDA, 1992 & 2012 Census of Agriculture. California.
County Data
1992 2012

20 | P a g e
Farmworker Housing Study and Action Plan for Salinas Valley and Pajaro Valley -
Final June 2018
concentration. As it happens, the dominant region for California berry
production is the Salinas-Pajaro Laborshed, with two-thirds of harvested
raspberries and nearly half of harvested strawberries. While statewide
production of both crops increased substantially during the 1992-2012 period,
prices and yields varied substantially from year-to-year as well as within the
yearly seasons. Moreover, both berry crop industries are highly competitive and
the costs of production are extremely high.
As a consequence of these factors, annual profit margins are likely to be quite
variable, even negative for many producers in some years. Some new berry
farmers likely faced economic losses forcing them to leave the business. Also,
economies of scale may provide a modest competitive advantage for some
larger producers enabling them to remain in business from year-to-year, but may
present some smaller producers, or new farmers, with difficult challenges. In
these conditions, it would be expected that, on average, some smaller
producers would be more likely to end production, and some larger producers
may be able to expand, either through acquiring abandoned land or accessing
expiring cropland leases.
The apple industry in the Salinas-Pajaro region had the opposite experience:
sharply reduced acreage from 4,941 in 1992 to 2,679 in 2012, nearly all located
in Santa Cruz County. During 1992, most farm income from apple production in
the Salinas-Pajaro region was from apple juice, not from the fresh market. In
subsequent years, substantially increased production from the state of
Washington, including processed apple products and juice, led to a weakened
market in California. Statewide apple production also plunged from 32,654
acres harvested in 1992 to 12,509 in 2012.11 Many apple producers faced
declining markets and falling prices, which led some growers to pull trees and
plant other crops. Thus, the decline of the number of apple growers from 209 in
1992 to 168 in 2012 can be partially attributed to adverse market conditions.
Recent trends in the Salinas-Pajaro Region’s farm production
In the preceding sections of the present report, the discussion has relied mostly
on the Census of Agriculture, which is conducted every fifth year.12 An
important aspect of these findings is that data is collected directly from farm
operators enabling enumeration of farms, land use, costs of production
11 From 1992 to 2012, California’s harvested apple acreage fell from 32,654 acres to 12,509 acres.
See the annual summary report of country agricultural commissioners. 12 At present, the Census of Agriculture is conducted for years ending in 2 or 7.

21 | P a g e
Farmworker Housing Study and Action Plan for Salinas Valley and Pajaro Valley -
Final June 2018
(separately for labor and other types of essential inputs) and other aspects of
farm activity at every level of geography. No other source of information about
U.S. agriculture enumerates farms.
But reliance on the Census of Agriculture is inadequate for understanding
current production trends because short-term events between census years are
missed. The census methodology is analogous to reading every fifth chapter of a
novel and then preparing a review of the whole novel, having missed crucial
parts of the story. Such a reviewer would be ill-prepared to discuss nuances of
the plot.
Crop production variables, including acreage, yield and price, are subject to
uncontrollable external conditions in California: droughts, freezes, flooding,
windstorms and excessive heat, as well as labor shortages and market
conditions. Both the physical quantity harvested and wholesale prices vary
substantially from year to year. Therefore, it is useful to construct a methodology
that relies on multi-year averages of output and value.
Production is most often measured by the value of sales of agricultural products
by farms. In what follows, averages of three successive years of production are
calculated to taking account of possible short-term events.
For the three-year period 2014-16, the total value of farm production in the
Salinas-Pajaro Laborshed was $5.2 billion (adjusted 2016 $). Figure 7 indicates the
contribution of each principal agricultural sector in the region to the total.
FIGURE 7 VALUE OF FARM PRODUCTION
Vegetables,
$3,169,852,022
Fruit,
$1,526,299,316
Floriculture &
Nursery,
$417,220,632
Other
agriculture,
$108,012,518
Value of Farm Production
(adjusted 2016 $)2014-16 Average, Salinas-Pajaro Valleys
Sources: Monterey & Santa Cruz Counties, Agricultural
Commissioners, Crop Reports
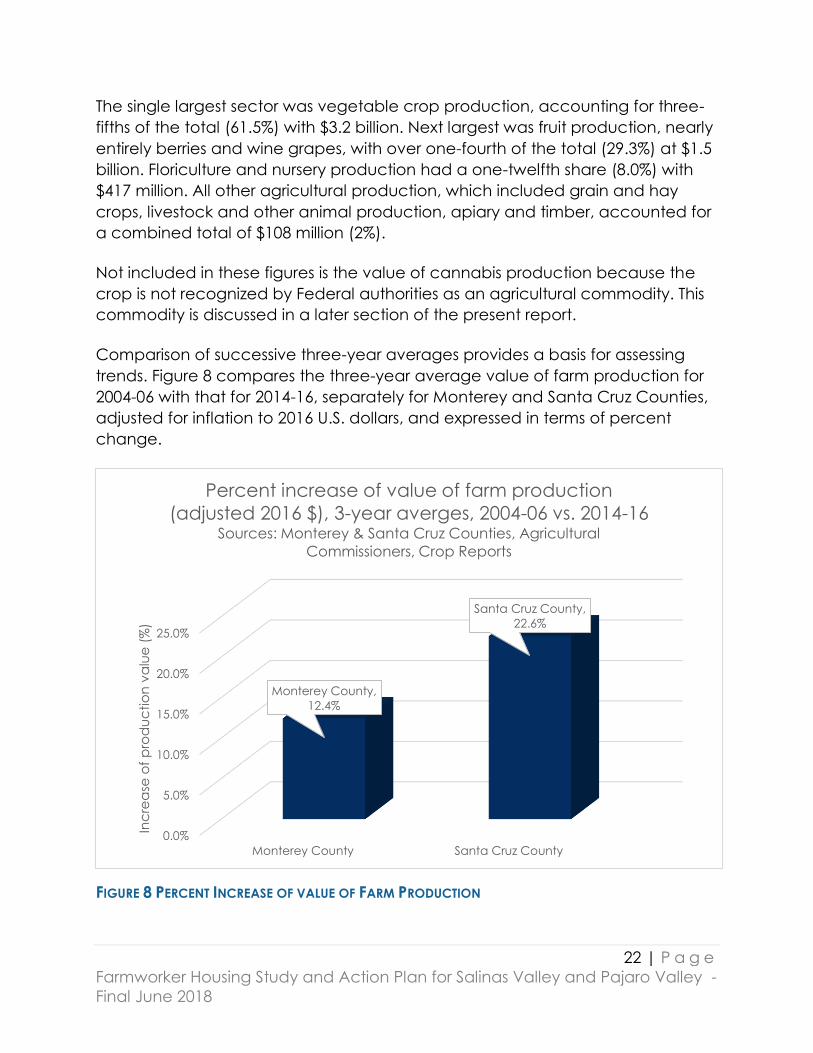
22 | P a g e
Farmworker Housing Study and Action Plan for Salinas Valley and Pajaro Valley -
Final June 2018
The single largest sector was vegetable crop production, accounting for three-
fifths of the total (61.5%) with $3.2 billion. Next largest was fruit production, nearly
entirely berries and wine grapes, with over one-fourth of the total (29.3%) at $1.5
billion. Floriculture and nursery production had a one-twelfth share (8.0%) with
$417 million. All other agricultural production, which included grain and hay
crops, livestock and other animal production, apiary and timber, accounted for
a combined total of $108 million (2%).
Not included in these figures is the value of cannabis production because the
crop is not recognized by Federal authorities as an agricultural commodity. This
commodity is discussed in a later section of the present report.
Comparison of successive three-year averages provides a basis for assessing
trends. Figure 8 compares the three-year average value of farm production for
2004-06 with that for 2014-16, separately for Monterey and Santa Cruz Counties,
adjusted for inflation to 2016 U.S. dollars, and expressed in terms of percent
change.
FIGURE 8 PERCENT INCREASE OF VALUE OF FARM PRODUCTION
0.0%
5.0%
10.0%
15.0%
20.0%
25.0%
Monterey County Santa Cruz County
Monterey County,
12.4%
Santa Cruz County,
22.6%
Inc
rea
se o
f p
rod
uc
tio
n v
alu
e (
%)
Percent increase of value of farm production
(adjusted 2016 $), 3-year averges, 2004-06 vs. 2014-16Sources: Monterey & Santa Cruz Counties, Agricultural
Commissioners, Crop Reports
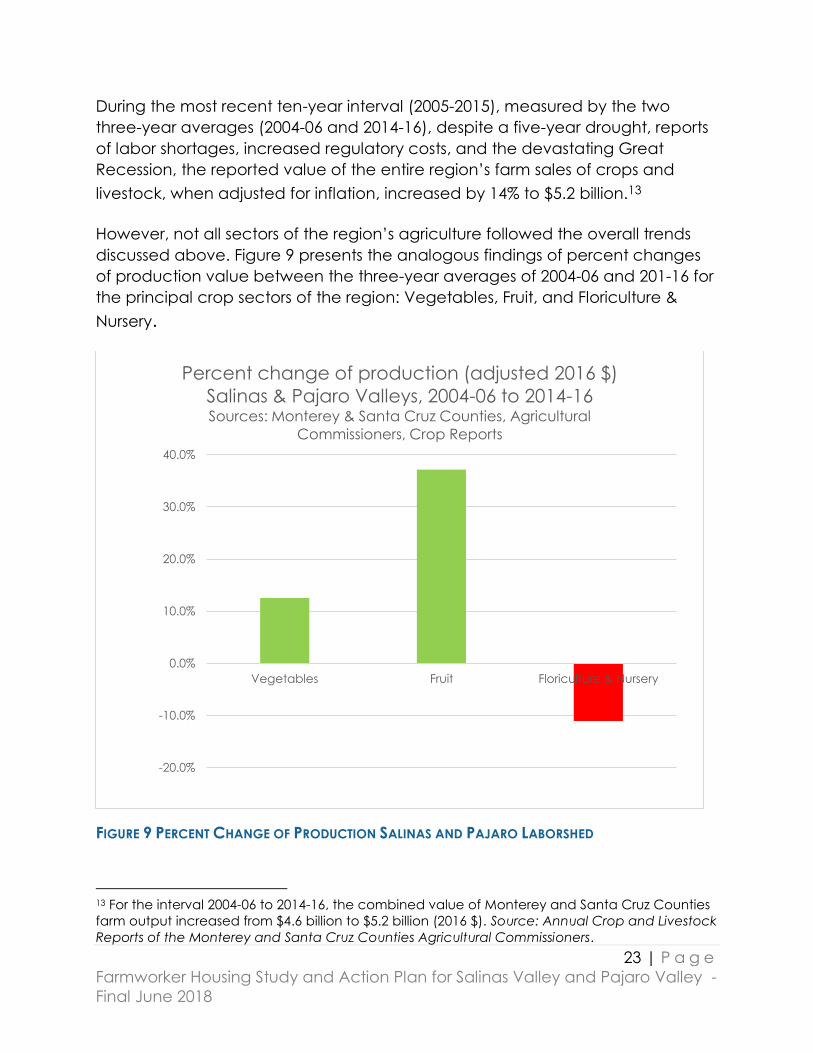
23 | P a g e
Farmworker Housing Study and Action Plan for Salinas Valley and Pajaro Valley -
Final June 2018
During the most recent ten-year interval (2005-2015), measured by the two
three-year averages (2004-06 and 2014-16), despite a five-year drought, reports
of labor shortages, increased regulatory costs, and the devastating Great
Recession, the reported value of the entire region’s farm sales of crops and
livestock, when adjusted for inflation, increased by 14% to $5.2 billion.13
However, not all sectors of the region’s agriculture followed the overall trends
discussed above. Figure 9 presents the analogous findings of percent changes
of production value between the three-year averages of 2004-06 and 201-16 for
the principal crop sectors of the region: Vegetables, Fruit, and Floriculture &
Nursery.
FIGURE 9 PERCENT CHANGE OF PRODUCTION SALINAS AND PAJARO LABORSHED
13 For the interval 2004-06 to 2014-16, the combined value of Monterey and Santa Cruz Counties
farm output increased from $4.6 billion to $5.2 billion (2016 $). Source: Annual Crop and Livestock
Reports of the Monterey and Santa Cruz Counties Agricultural Commissioners.
-20.0%
-10.0%
0.0%
10.0%
20.0%
30.0%
40.0%
Vegetables Fruit Floriculture & Nursery
Percent change of production (adjusted 2016 $)
Salinas & Pajaro Valleys, 2004-06 to 2014-16Sources: Monterey & Santa Cruz Counties, Agricultural
Commissioners, Crop Reports

24 | P a g e
Farmworker Housing Study and Action Plan for Salinas Valley and Pajaro Valley -
Final June 2018
While the percent change of the inflation-adjusted ten-year period (2005-2015)
regional production of Vegetables grew by 12.5% and the corresponding
increase of Fruit production was 37.3%, the Floriculture & Nursery crop industry
experienced a decline of 11.1%. Some of the factors associated with these
changes in output were discussed in previous sections of this report.
There were substantial differences between the two counties in the relative
values of the principal sectors of agricultural production. Figure 10 presents the
3-year averages for 2014-16, adjusted for inflations in 2016 $, of the principal
sectors of agricultural production in each county.
Clearly, the dominant contribution to farm production during this period was the
Salinas Valley’s vegetable sector. The next largest sector was the Salinas Valley’s
fruit production, mainly berries and wine grapes. Ranking third was the Pajaro
Valley’s fruit production, mainly berries and apples. Berry production alone
accounted for two-thirds of Santa Cruz County’s agricultural production in 2016.
Both the Floriculture and Nursery product sector and the Other Agriculture
sector, which together totaled about 10% of all production in the region, were
relatively small contributors to the agricultural economy of the region.
FIGURE 10 MONTEREY AND SANTA CRUZ COUNTIES: VALUE OF FARM PRODUCTION
$0
$500,000,000
$1,000,000,000
$1,500,000,000
$2,000,000,000
$2,500,000,000
$3,000,000,000
$3,500,000,000
Vegetables Fruit Floriculture &
Nursery
Other agriculture
Aju
ste
d 2
016 $
Value of Farm Production, 2014-16 Average
Monterey and Santa Cruz CountiesSources: Monterey & Santa Cruz Counties, Agricultural Commissioners, Crop
Reports
Monterey County Santa Cruz County

25 | P a g e
Farmworker Housing Study and Action Plan for Salinas Valley and Pajaro Valley -
Final June 2018
Recent trends in the production of major individual crops
The substantial growth of the value of vegetable crop production in the region is
notable, but there have also been diverging trends for specific types of some
crops. These trends are most apparent for head lettuce and Romaine lettuce,
and for bulk head and bulk leaf lettuce.
Head lettuce production in the region declined substantially as measure by 3-
year average harvested acreage from 2004-06 to 2014-16. At the same time
Romaine lettuce production expanded. This is indicated in Figure 11 in which the
average harvested acres of head lettuce and Romaine lettuce are compared
using 3-year averages for both periods.
FIGURE 11 HARVESTED ACREAGE LETTUCE, SALINAS PAJARO LABORSHED
The sharp decline in harvested acreage of head lettuce and other leaf lettuce
contrasts with the increased harvested acreage of Romaine. Moreover, not
shown in the figure, was a decline of the total harvested acreage of all types of
0
10000
20000
30000
40000
50000
60000
70000
80000
Lettuce, head Romaine Lettuce, other leaf
Ha
rve
ted
Ac
rea
ge
Harvested Acreage, Lettuce, Salinas-Pajaro Valleys
3-year Averages, 2004-06 & 2014-16Sources: Monterey & Santa Cruz Counties, Agricultral Commissioners, Crop
Reports
2004-06 Average 2014-2016 Average
26 | P a g e
Farmworker Housing Study and Action Plan for Salinas Valley and Pajaro Valley -
Final June 2018
lettuce varieties from 170,982 acres during 2004-06 to 111,449 acres during 2014-
16, a falloff of 35% in just a decade.
Romaine prices were consistently higher than head lettuce prices during this
period. A highly prized lettuce product in today’s wholesale markets are Hearts
of Romaine which reportedly sold F.O.B. from Salinas-Watsonville during the
week starting October 30, 2017, for about $20 for 12 3-count packages weighing
22 oz. each.14 By contrast, cartons of 24s filmed-wrapped iceberg lettuce sold
F.O.B. through the same wholesale market for about $10.90.15 At these prices,
the wholesale price for one head of iceberg lettuce weighing 1.7 lb. was about
$0.45 while 1.4 lb. of Romaine hearts sold for $1.67.
Retail prices vary considerably. On November 27, 2017, at HEB, a major
supermarket chain in Texas, offered an organic 3-count package of Hearts of
Romaine for $3.58, weighing 1.39 lb., while also offering one head of iceberg
lettuce weighing 1.82 lb. for $1.48 each.16
What is interesting about this trend is the value of lettuce production during this
period, measured in inflation-adjusted 2016 $, actually increased, from $1.148
billion for the 3-year average of 2004-06 to $1.437 billion for the 3-year average
of 2014-16. Thus, there was a 25% growth in lettuce revenues (inflation adjusted
2016 $) while harvested acreage was reduced by 35%. The most recent mix of
the types of lettuce being produced resulted in greater total revenue for
producers, even though the overall acreage had been significantly reduced.
Findings for non-lettuce vegetable production in the region during this same
period contrasts with the results for lettuce discussed above. The harvested
acreage of all other vegetables combined, excluding all types of lettuce,
expanded, from a 3-year average of 154,399 acres during 2004-06 to a 3-year
average of 184,156 acres during 2014-16, but the total value of those crops,
adjusted to 2016 $, increased only very slightly, from a 3-year average of about
14 See USDA Market News, October 30, 2017, which reported “Hearts 12 3-count packages
mostly $19.45 - $20.65”. 15 See USDA Market News, October 30, 2017, which reported “Cartons of 24s filmed-lined mostly
$10.25 - $11.56”. 16 https://www.heb.com/category/shop/food-and-drinks/fruit-and-
vegetables/vegetables/lettuce/3044/3359

27 | P a g e
Farmworker Housing Study and Action Plan for Salinas Valley and Pajaro Valley -
Final June 2018
$1.671 billion during 2004-06 to a 3-year average of about $1.732 billion, or about
3.7%.
The production of berries and wine grapes differs substantially from what was
found among the principal vegetables grown in the Salinas-Pajaro Laborshed.
As previously discussed, the harvested acreage of each of raspberries and
strawberries, and the planted acreage of wine grapes, substantially increased
during the 20-year interval from 1992 to 2012, as reported in the Census of
Agriculture. But the census only provides a snapshot of acreage and the
number of farms in five-year intervals. The determination of trends of production
requires year-by-year findings.
The changes in 3-year average of annual berry and wine grape output,
measured in tons, for the period 2004-06 to 2014-16 are indicted in Figure 12.
FIGURE 12 BERRY AND WINE GRAPE PRODUCTION SALINAS PAJARO LABORSHED
While berry output increased by 39%, the total value of berry production
increased from a 3-year average of $850 million during 2004-06 to a 3-year
average of $1,189 million, an increase of 39.8%, nearly identical to the growth in
0
100000
200000
300000
400000
500000
600000
700000
2004-06 Average 2014-2016 Average
Ton
s o
f h
arv
est
e c
rop
s
Berry and Wine Grape Farm Production, tons
Salinas-Pajaro Valleys, 3-year averages,
2004-06 to 2014-16Sources: Monterey & Santa Cruz Counties, Agricultural Commissionrs,
Crop Reports
Berries Grapes, wine
28 | P a g e
Farmworker Housing Study and Action Plan for Salinas Valley and Pajaro Valley -
Final June 2018
total production volume (tons). This suggests that increases of supply have
followed very closely to increases in demand during this period.
For winegrape farm production, total annual output in successive 3-year
intervals fell by 21% between 2004-06 and 2014-16. However, the total annual
value of wine grape production declined during the same period, from $264
million in 2004-06 to $231 million, or about -12% during 2014-16. This decline in
value suggests wine grape production volume decreases were less than what
may have been required to meet changes in consumer demand. But adjusting
wine grape production volume is much more complicated than increasing or
reducing production of an annual fresh crop. Consumer preferences for
differing types of wines are notoriously fickle, switching abruptly from dry white
wines some years ago to favoring intense red wines. Some red varieties require
much smaller berries, with less liquid, to obtain the intense flavor preferred by
many consumers.
Organic production
The Salinas-Pajaro Valleys region is the nation’s major center of organic crop
and livestock production, with the value increasing from 5.64% of the region’s
total value of farm cash receipts from the sale of agricultural commodities in
2007, to 9.82% of the total in 2016.17 The 2016 total value of organic production
in the region was $480,770,000.
The major innovator of mass-market organic fresh produce in California was
Natural Selection Foods, under the brand name Earthbound Farm Organic.
Headquartered in San Juan Bautista in neighboring San Benito County, the
company was a relatively minor participant in the fresh produce industry until, in
1999, two major Salinas Valley grower-packer-shippers partnered with the
company for the purpose of developing large-scale organic production. Each
outside firm acquired a one-third interest in the venture, while the original
owners retained the remaining one-third interest.
Ultimately, the new venture proved to be a breakthrough success, competing
successfully with the established major brands of conventionally grown produce.
Ten years later, the Salinas partners sold down their interests, and, ultimately, in
17 The 2016 county agricultural commissioners’ crop and livestock reports indicate a value of
$365,190,000 for Monterey County and $115,582,000 for Santa Cruz County. However, the 2007
crop and livestock report for Santa Cruz County did not indicate a value of production, while for
Monterey County the value was $226,843,000. At the same time the
29 | P a g e
Farmworker Housing Study and Action Plan for Salinas Valley and Pajaro Valley -
Final June 2018
2015, Earthbound Farm was sold to WhiteWave, the parent company of Land O’
Lakes, Horizon Milk and Silk. Reportedly, Earthbound Farm’s annual sales had
increased from $10 million to over $500 million, becoming the nation’s largest
producer of organic produce.
Cannabis: the crop that isn’t
Cannabis is currently produced in the Salinas-Pajaro Laborshed, in greenhouses
and on other farm property, but is not officially recognized as a crop by Federal
authorities. Some abandoned greenhouses in the region, closed when the cut
flower and nursery products sector experienced a substantial downturn in
business, discussed previously in this report, have been repurposed for cannabis
production. For many decades, production was prevalent in some regions of
California, although unlawful. Production for treatment of some medical
conditions, suitably approved by appropriate authorities, has been permitted
under California law for several years, but, starting January 2018, production for
specified types of recreational is now be allowed under California law.
Lacking recognition by Federal authorities, the cannabis industry has not been
required to report production information, including employment or sales data,
let alone the extensive details about operations included in the agricultural
census for crops which are recognized. As a result, only anecdotal information
or reports based on fragmentary data on medical use were publicly available.
Starting in 2018, producers for recreational purposes were required to be
licensed under California law. Regulations governing production include the
right of county authorities to tax producers, which will provide some basic
information about the cannabis industry’s production.
An estimate of producer sales of cannabis in the Central Coast region of
California, which includes all of Monterey and Santa Cruz Counties, suggested a
figure of $1.5 billion.18 It is also estimated that statewide farm sales of cannabis
are approximately $22 billion.19
18 Conference on Compliance, Farm Labor, Immigration, ALRB, and Cannabis, UC Davis & ALRB,
April 14, 2017. 19 Ibid.
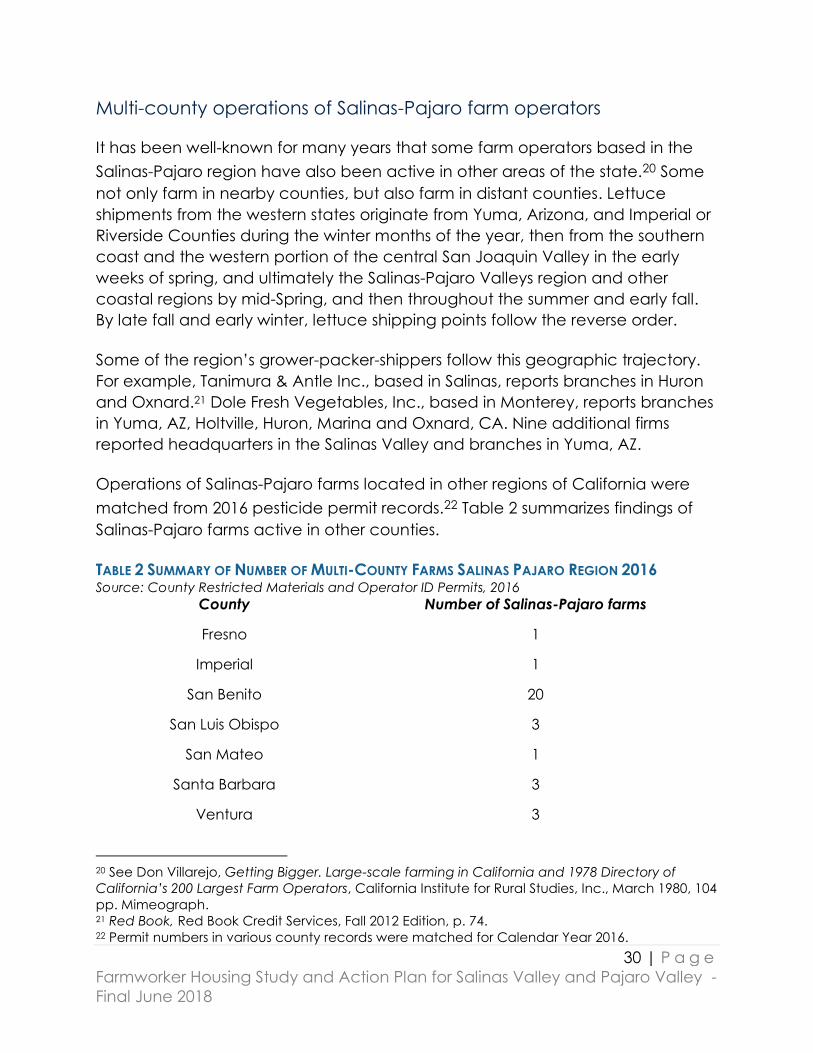
30 | P a g e
Farmworker Housing Study and Action Plan for Salinas Valley and Pajaro Valley -
Final June 2018
Multi-county operations of Salinas-Pajaro farm operators
It has been well-known for many years that some farm operators based in the
Salinas-Pajaro region have also been active in other areas of the state.20 Some
not only farm in nearby counties, but also farm in distant counties. Lettuce
shipments from the western states originate from Yuma, Arizona, and Imperial or
Riverside Counties during the winter months of the year, then from the southern
coast and the western portion of the central San Joaquin Valley in the early
weeks of spring, and ultimately the Salinas-Pajaro Valleys region and other
coastal regions by mid-Spring, and then throughout the summer and early fall.
By late fall and early winter, lettuce shipping points follow the reverse order.
Some of the region’s grower-packer-shippers follow this geographic trajectory.
For example, Tanimura & Antle Inc., based in Salinas, reports branches in Huron
and Oxnard.21 Dole Fresh Vegetables, Inc., based in Monterey, reports branches
in Yuma, AZ, Holtville, Huron, Marina and Oxnard, CA. Nine additional firms reported headquarters in the Salinas Valley and branches in Yuma, AZ.
Operations of Salinas-Pajaro farms located in other regions of California were
matched from 2016 pesticide permit records.22 Table 2 summarizes findings of
Salinas-Pajaro farms active in other counties.
TABLE 2 SUMMARY OF NUMBER OF MULTI-COUNTY FARMS SALINAS PAJARO REGION 2016 Source: County Restricted Materials and Operator ID Permits, 2016
County Number of Salinas-Pajaro farms
Fresno 1
Imperial 1
San Benito 20
San Luis Obispo 3
San Mateo 1
Santa Barbara 3
Ventura 3
20 See Don Villarejo, Getting Bigger. Large-scale farming in California and 1978 Directory of
California’s 200 Largest Farm Operators, California Institute for Rural Studies, Inc., March 1980, 104
pp. Mimeograph. 21 Red Book, Red Book Credit Services, Fall 2012 Edition, p. 74. 22 Permit numbers in various county records were matched for Calendar Year 2016.
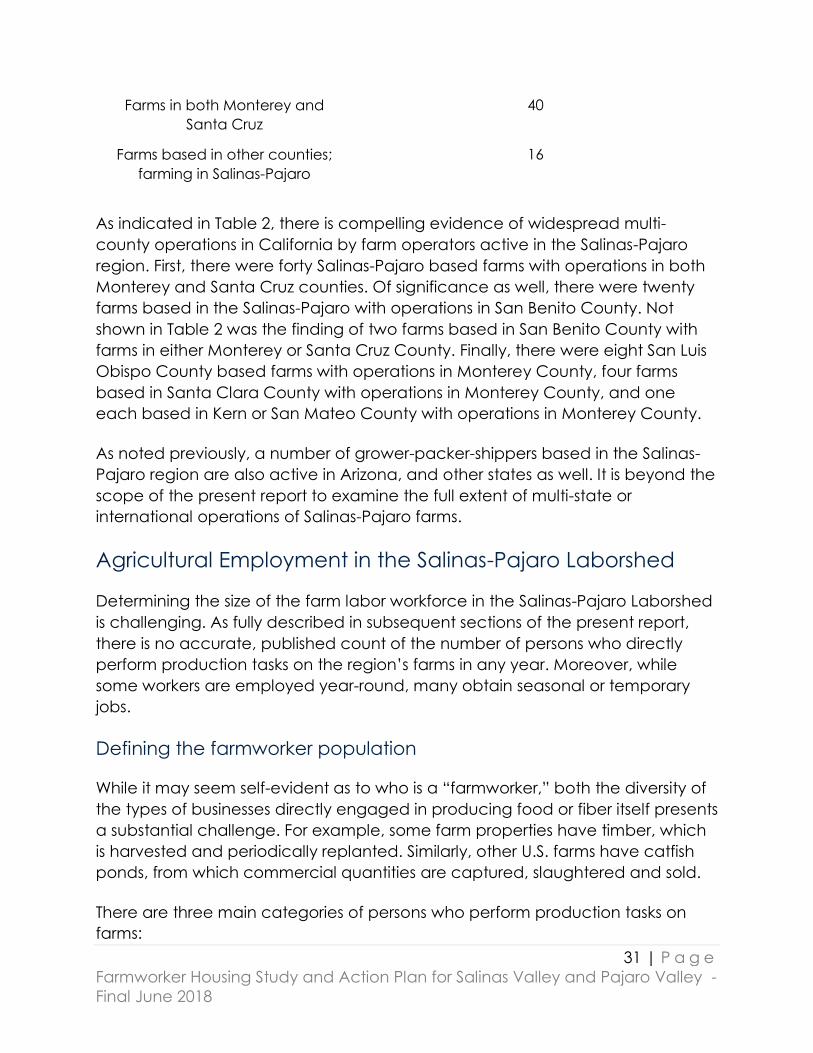
31 | P a g e
Farmworker Housing Study and Action Plan for Salinas Valley and Pajaro Valley -
Final June 2018
Farms in both Monterey and
Santa Cruz
40
Farms based in other counties;
farming in Salinas-Pajaro
16
As indicated in Table 2, there is compelling evidence of widespread multi-
county operations in California by farm operators active in the Salinas-Pajaro
region. First, there were forty Salinas-Pajaro based farms with operations in both
Monterey and Santa Cruz counties. Of significance as well, there were twenty
farms based in the Salinas-Pajaro with operations in San Benito County. Not
shown in Table 2 was the finding of two farms based in San Benito County with
farms in either Monterey or Santa Cruz County. Finally, there were eight San Luis
Obispo County based farms with operations in Monterey County, four farms
based in Santa Clara County with operations in Monterey County, and one
each based in Kern or San Mateo County with operations in Monterey County.
As noted previously, a number of grower-packer-shippers based in the Salinas-
Pajaro region are also active in Arizona, and other states as well. It is beyond the
scope of the present report to examine the full extent of multi-state or
international operations of Salinas-Pajaro farms.
Agricultural Employment in the Salinas-Pajaro Laborshed
Determining the size of the farm labor workforce in the Salinas-Pajaro Laborshed
is challenging. As fully described in subsequent sections of the present report,
there is no accurate, published count of the number of persons who directly
perform production tasks on the region’s farms in any year. Moreover, while
some workers are employed year-round, many obtain seasonal or temporary
jobs.
Defining the farmworker population
While it may seem self-evident as to who is a “farmworker,” both the diversity of
the types of businesses directly engaged in producing food or fiber itself presents
a substantial challenge. For example, some farm properties have timber, which
is harvested and periodically replanted. Similarly, other U.S. farms have catfish
ponds, from which commercial quantities are captured, slaughtered and sold.
There are three main categories of persons who perform production tasks on
farms:

32 | P a g e
Farmworker Housing Study and Action Plan for Salinas Valley and Pajaro Valley -
Final June 2018
1. Self-employed workers such as farmers and ranchers;
2. Hired workers, whether directly employed by farm businesses, or
employed by businesses which provide support services on farms;
3. Unpaid family workers, most often family members of self-employed
farmworkers or, much less often, families of hired farmworkers.
Then, too, there are many persons, whether paid or unpaid, who grow flowers,
crops or raise animals on their home property and who sell to friends, neighbors,
or, possibly, to the public at a roadside table or stand. By definition, a farm is a
place that sells, or intends to sell, just $1,000 of agricultural products in a year. If
such persons have a child or pays a neighbor’s child to help out at a roadside
stand, is that child a farmworker?
There are a number of Federal programs which were created to provide
services to farmworkers: Migrant health, Migrant education, Migrant Head Start,
Migrant legal services, job training, rural housing, and community health service
clinics. The program model, adopted during the 1960s, posited providing grants
to eligible, private, non-profit corporations which had the necessary cultural and
language skills needed to serve a rural workforce which differs in demographic
profile from some of the communities in the regions where farmworkers live. A
summary description of these Federal programs as of 2001 and their
corresponding criteria for eligibility to obtain services is presented in the
following chart.

33 | P a g e
Farmworker Housing Study and Action Plan for Salinas Valley and Pajaro Valley -
Final June 2018
TABLE 3 COMPARISON OF MIGRANT AND SEASONAL DEFINITIONS FOR SERVICE ELIGIBILITY Source: Larson Associate Services, 2001
Category Migrant Head
Start
Migrant
Education
HEP and
CAMP
Migrant
Health
WIA 167 [JTPA
402]
Migrant
Legal
Services
Industries
covered
crop yes yes yes yes yes yes
dairy no yes yes no yes no
poultry no yes yes no yes no
livestock no yes yes no yes no
processing yes yes yes yes no yes
fisheries no yes yes no no no
forestry no yes yes yes no yes
serve seasonal yes no yes yes yes no
migration
definition
moved to
seek farm
work
change
residence one
school district
to another
change
residence
over night
establish
temporar
y abode
not return
home on a
daily basis
only
serve
migrants
income
requirement
< poverty1%
from farm
work 5
no no no sliding
fee scale
< poverty or
70% of lower
living
standard; no
year- round
salary
eligibility
period
24 months 36 months 24 months 24
months
12 of last 24
months
age
birth - 5 yrs 22 yrs or
younger
16 yrs or
older
none employment-
related = 14
or older
none
serve workers
unauthorized
for U.S.
employment
yes yes yes yes no no
At the inception of each such Federal program it was necessary to define the
farmworker community members who would be eligible to obtain the services
on offer. Each Federal program’s grant funding criteria also required grantees to
provide an estimated count of the population served, a primary determinant of
the amount of funds that would be made available. In view of the disparities of
the necessary qualifications for obtaining services, each grantee developed its
own methodology for estimating the size of the eligible population.
Analysis of these conflicting definitions of “farmworkers” and the problem of
developing estimates of the eligible population to be served from available

34 | P a g e
Farmworker Housing Study and Action Plan for Salinas Valley and Pajaro Valley -
Final June 2018
official data sources has attracted the attention of agencies as well as some
scholars of farm labor markets. The farm labor economist, Prof. Philip Martin,
wrote an extensive analysis of this problem under the title Harvest of Confusion,
an apt description [Martin, 1988].
In recent years, especially following the 2002 reform to redefine each and every
type of business in official government statistics throughout North America,23
there have been initiatives to adopt a uniform definition and to link the definition
to this modernized standard of business classification. The basis for adopting this
standard is the definition in the Migrant and Seasonal Agricultural Worker
Protection Act (MSAWPA, 1983), as follows, suitably modified in practice, to
include specific reference to the official classifications used to determine
employment information in each sector of agriculture, namely NAICS:
An agricultural worker is someone who performs agricultural labor on a farm
(data for “farm” and “agricultural labor” are defined by National Industrial
Classification System (NAICS)).
NAICS definitions embrace production of crops (including forest products),
livestock (including aquaculture) and support services for both types of
production (including preparing fresh products for market, such as salad plant
labor).
The Federal Migrant Health program has modestly added various components
of employment in the livestock and related products sectors, as defined above,
to the criteria currently being used to determine eligibility for services provided
by grantees. It is likely that other programs will similarly modify their eligibility
criterion.
Hired farm labor reported by the Census of Agriculture
The quinquennial Census of Agriculture includes several data items pertaining to
farm employment, including a count described therein as “hired farm labor -
workers.” The total number of hired workers in each county is calculated by
simple addition of the reported number of persons on the payroll for each of the
county’s farm operators who separately fill out census forms.
23 The North American Industry Classification System (NAICS) is now the standard basis for
classification of businesses in all official government statistics.

35 | P a g e
Farmworker Housing Study and Action Plan for Salinas Valley and Pajaro Valley -
Final June 2018
There can be some duplication in the number of workers by the Census of
Agriculture. An individual worker who is temporarily employed by a farm
operator may, after concluding work on that farm, find a temporary job on
another farm. Thus, that worker will be enumerated by both farm operators,
having appeared on the payroll of each. For this reason, the census report must
be regarded as an enumeration of the number of jobs, not a count of individual
workers, and we so indicate this fact in Table 3 in which the 2012 census findings
are reported.
Farm operators filled nearly 33,000 jobs during 2012 in Monterey County, and
nearly 17,000 in Santa Cruz County. For the region, farm operators filled nearly
50,000 jobs. Census data include paid family members. Also, some of these jobs,
such as secretaries and bookkeepers, were not production jobs.
TABLE 4 MONTEREY AND SANTA CRUZ COUNTIES: NUMBER OF HIRED FARMWORKERS (JOBS) 2012 Source: 2012 Census of Agriculture. State and County Data, United States Department of
Agriculture. National Agricultural Statistics Service. May 2014. Cf. Table 7. Hired Farm Labor –
Workers and Payroll: 2012. Pp. 297 & 300.
County Number of hired farmworkers (jobs)
Monterey County 32,872
Santa Cruz County 16,705
Total hired farmworkers (jobs) 49,577
An additional limitation of the census reports of the number of workers (jobs) is
that persons employed by non-farmers but who are contracted to provide on-
farm services, are not enumerated. Census reports of “the number of hired
farmworkers” refers exclusively to persons who were directly hired by farm
operators, hereinafter described as direct-hire workers.
Agricultural employment in the Salinas-Pajaro Laborshed reported by
BLS
California’s Employment Development Department reports both statewide and
regional employment in agriculture.24 One of the regional reports is for the eight-
county Central Coast region. But only two of the eight counties pertain to the
24 http://www.labormarketinfo.edd.ca.gov/data/ca-agriculture.html
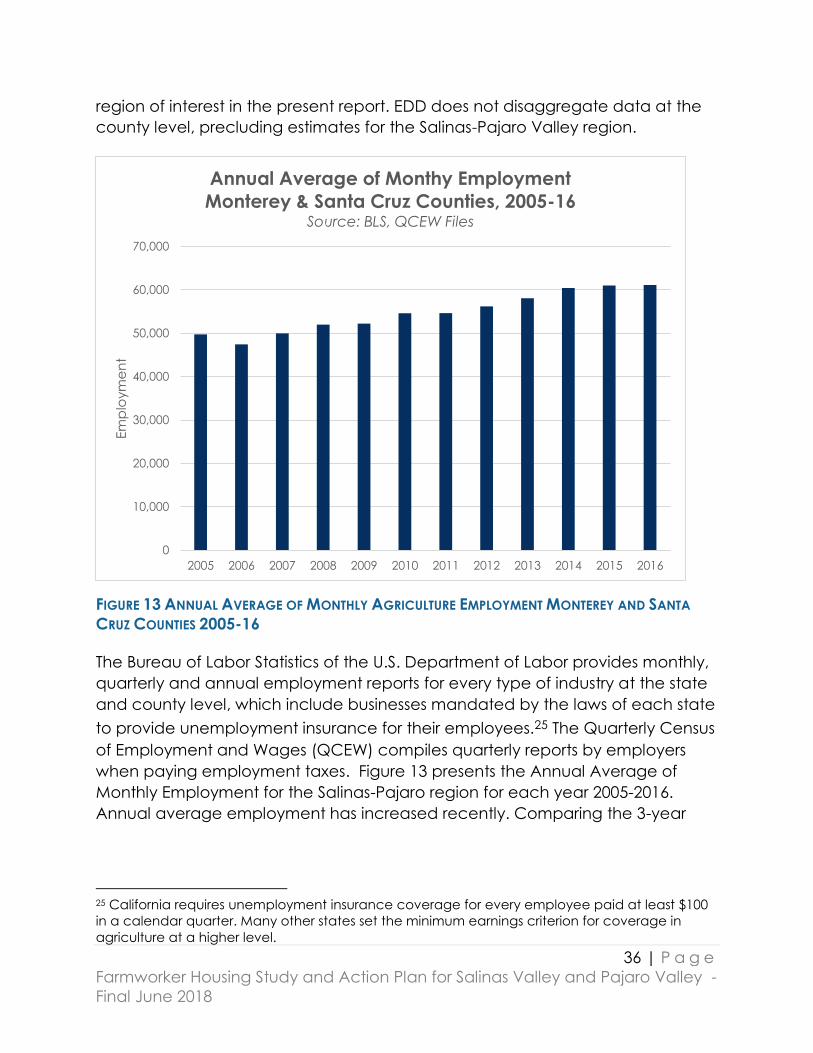
36 | P a g e
Farmworker Housing Study and Action Plan for Salinas Valley and Pajaro Valley -
Final June 2018
region of interest in the present report. EDD does not disaggregate data at the
county level, precluding estimates for the Salinas-Pajaro Valley region.
FIGURE 13 ANNUAL AVERAGE OF MONTHLY AGRICULTURE EMPLOYMENT MONTEREY AND SANTA
CRUZ COUNTIES 2005-16
The Bureau of Labor Statistics of the U.S. Department of Labor provides monthly,
quarterly and annual employment reports for every type of industry at the state
and county level, which include businesses mandated by the laws of each state
to provide unemployment insurance for their employees.25 The Quarterly Census
of Employment and Wages (QCEW) compiles quarterly reports by employers
when paying employment taxes. Figure 13 presents the Annual Average of
Monthly Employment for the Salinas-Pajaro region for each year 2005-2016.
Annual average employment has increased recently. Comparing the 3-year
25 California requires unemployment insurance coverage for every employee paid at least $100
in a calendar quarter. Many other states set the minimum earnings criterion for coverage in
agriculture at a higher level.
0
10,000
20,000
30,000
40,000
50,000
60,000
70,000
2005 2006 2007 2008 2009 2010 2011 2012 2013 2014 2015 2016
Em
plo
ym
en
t
Annual Average of Monthy Employment
Monterey & Santa Cruz Counties, 2005-16Source: BLS, QCEW Files
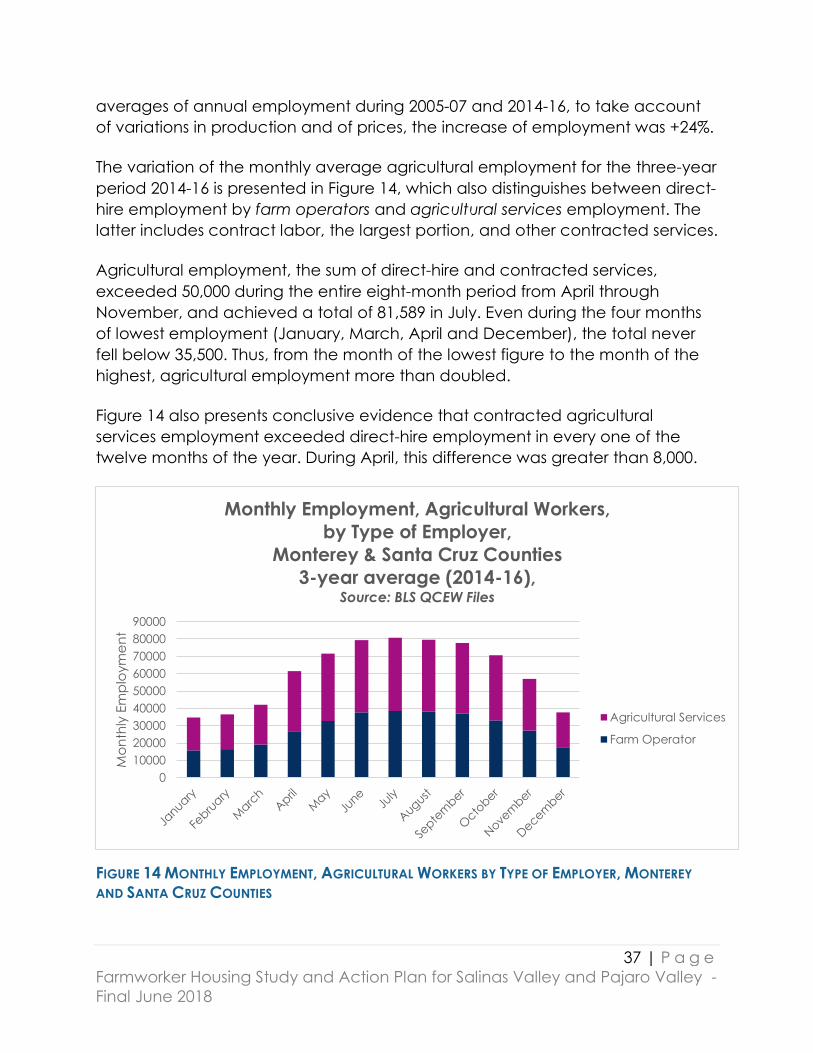
37 | P a g e
Farmworker Housing Study and Action Plan for Salinas Valley and Pajaro Valley -
Final June 2018
averages of annual employment during 2005-07 and 2014-16, to take account
of variations in production and of prices, the increase of employment was +24%.
The variation of the monthly average agricultural employment for the three-year
period 2014-16 is presented in Figure 14, which also distinguishes between direct-
hire employment by farm operators and agricultural services employment. The
latter includes contract labor, the largest portion, and other contracted services.
Agricultural employment, the sum of direct-hire and contracted services,
exceeded 50,000 during the entire eight-month period from April through
November, and achieved a total of 81,589 in July. Even during the four months
of lowest employment (January, March, April and December), the total never
fell below 35,500. Thus, from the month of the lowest figure to the month of the
highest, agricultural employment more than doubled.
Figure 14 also presents conclusive evidence that contracted agricultural
services employment exceeded direct-hire employment in every one of the
twelve months of the year. During April, this difference was greater than 8,000.
FIGURE 14 MONTHLY EMPLOYMENT, AGRICULTURAL WORKERS BY TYPE OF EMPLOYER, MONTEREY
AND SANTA CRUZ COUNTIES
0
10000
20000
30000
40000
50000
60000
70000
80000
90000
Mo
nth
ly E
mp
loym
en
t
Monthly Employment, Agricultural Workers,
by Type of Employer,
Monterey & Santa Cruz Counties
3-year average (2014-16), Source: BLS QCEW Files
Agricultural Services
Farm Operator
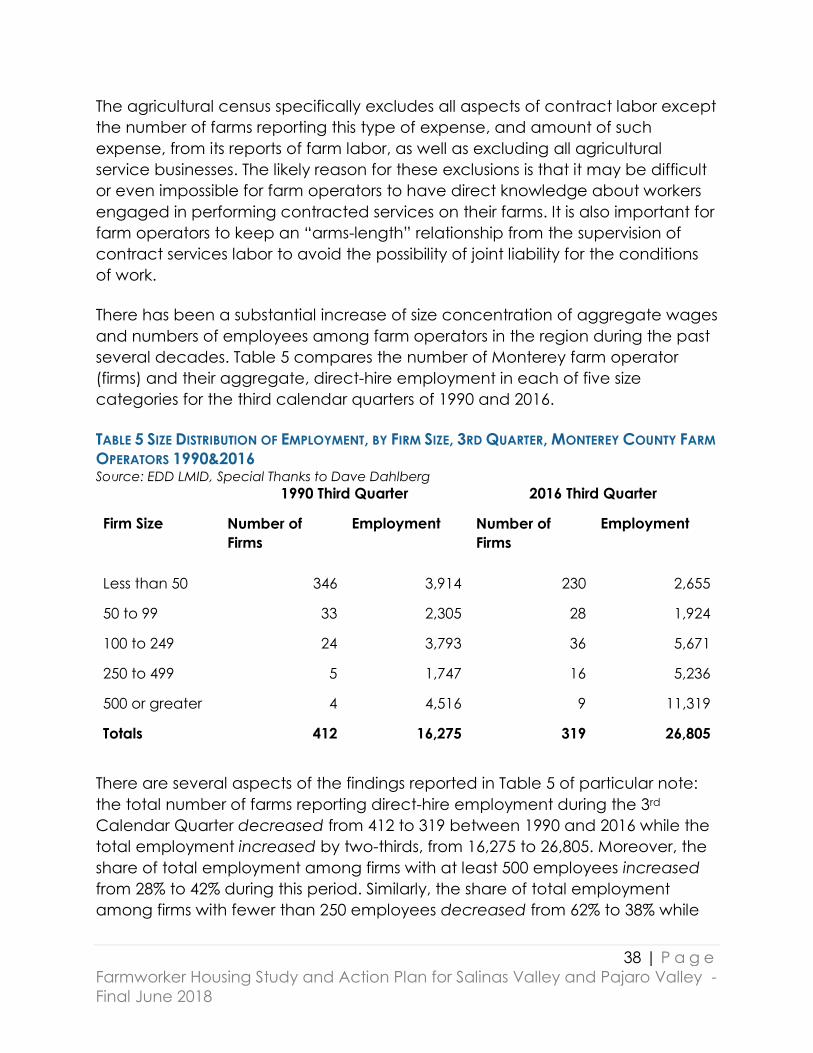
38 | P a g e
Farmworker Housing Study and Action Plan for Salinas Valley and Pajaro Valley -
Final June 2018
The agricultural census specifically excludes all aspects of contract labor except
the number of farms reporting this type of expense, and amount of such
expense, from its reports of farm labor, as well as excluding all agricultural
service businesses. The likely reason for these exclusions is that it may be difficult
or even impossible for farm operators to have direct knowledge about workers
engaged in performing contracted services on their farms. It is also important for
farm operators to keep an “arms-length” relationship from the supervision of
contract services labor to avoid the possibility of joint liability for the conditions
of work.
There has been a substantial increase of size concentration of aggregate wages
and numbers of employees among farm operators in the region during the past
several decades. Table 5 compares the number of Monterey farm operator
(firms) and their aggregate, direct-hire employment in each of five size
categories for the third calendar quarters of 1990 and 2016.
TABLE 5 SIZE DISTRIBUTION OF EMPLOYMENT, BY FIRM SIZE, 3RD QUARTER, MONTEREY COUNTY FARM
OPERATORS 1990&2016 Source: EDD LMID, Special Thanks to Dave Dahlberg
1990 Third Quarter 2016 Third Quarter
Firm Size Number of
Firms
Employment
Number of
Firms
Employment
Less than 50 346 3,914 230 2,655
50 to 99 33 2,305 28 1,924
100 to 249 24 3,793 36 5,671
250 to 499 5 1,747 16 5,236
500 or greater 4 4,516 9 11,319
Totals 412 16,275 319 26,805
There are several aspects of the findings reported in Table 5 of particular note:
the total number of farms reporting direct-hire employment during the 3rd
Calendar Quarter decreased from 412 to 319 between 1990 and 2016 while the
total employment increased by two-thirds, from 16,275 to 26,805. Moreover, the
share of total employment among firms with at least 500 employees increased
from 28% to 42% during this period. Similarly, the share of total employment
among firms with fewer than 250 employees decreased from 62% to 38% while
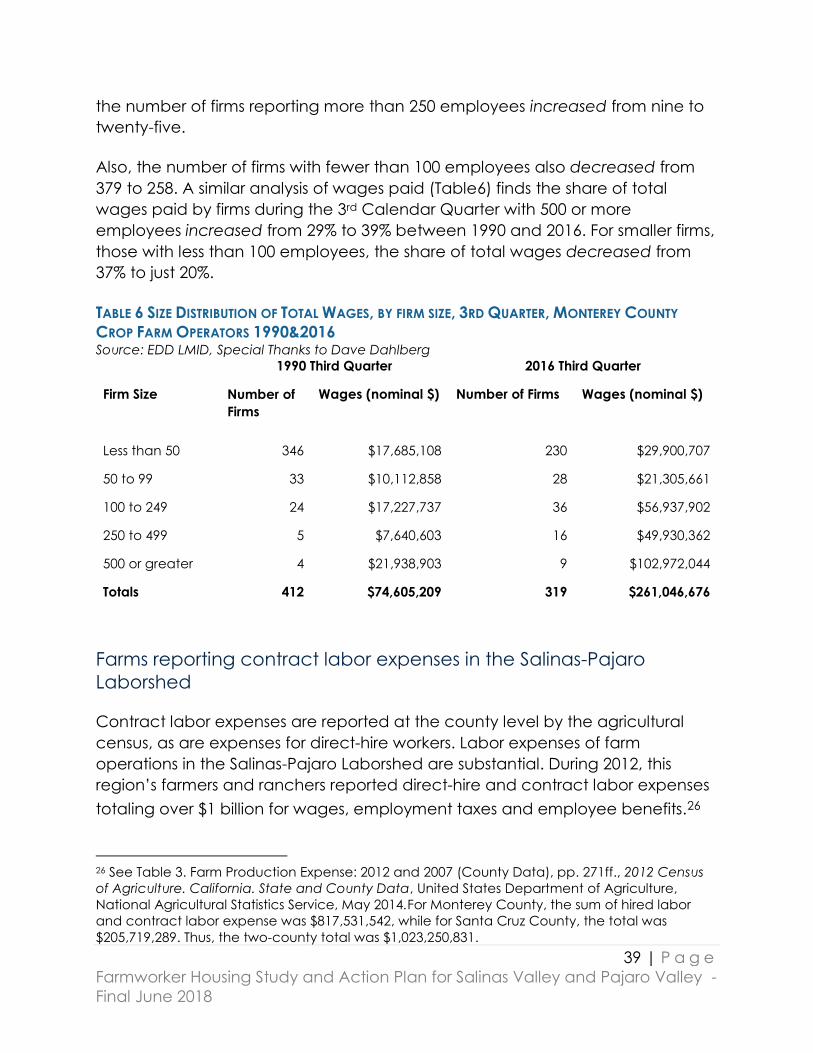
39 | P a g e
Farmworker Housing Study and Action Plan for Salinas Valley and Pajaro Valley -
Final June 2018
the number of firms reporting more than 250 employees increased from nine to
twenty-five.
Also, the number of firms with fewer than 100 employees also decreased from
379 to 258. A similar analysis of wages paid (Table6) finds the share of total
wages paid by firms during the 3rd Calendar Quarter with 500 or more
employees increased from 29% to 39% between 1990 and 2016. For smaller firms,
those with less than 100 employees, the share of total wages decreased from
37% to just 20%.
TABLE 6 SIZE DISTRIBUTION OF TOTAL WAGES, BY FIRM SIZE, 3RD QUARTER, MONTEREY COUNTY
CROP FARM OPERATORS 1990&2016 Source: EDD LMID, Special Thanks to Dave Dahlberg
1990 Third Quarter 2016 Third Quarter
Firm Size Number of
Firms
Wages (nominal $)
Number of Firms Wages (nominal $)
Less than 50 346 $17,685,108 230 $29,900,707
50 to 99 33 $10,112,858 28 $21,305,661
100 to 249 24 $17,227,737 36 $56,937,902
250 to 499 5 $7,640,603 16 $49,930,362
500 or greater 4 $21,938,903 9 $102,972,044
Totals 412 $74,605,209 319 $261,046,676
Farms reporting contract labor expenses in the Salinas-Pajaro
Laborshed
Contract labor expenses are reported at the county level by the agricultural
census, as are expenses for direct-hire workers. Labor expenses of farm
operations in the Salinas-Pajaro Laborshed are substantial. During 2012, this
region’s farmers and ranchers reported direct-hire and contract labor expenses
totaling over $1 billion for wages, employment taxes and employee benefits.26
26 See Table 3. Farm Production Expense: 2012 and 2007 (County Data), pp. 271ff., 2012 Census
of Agriculture. California. State and County Data, United States Department of Agriculture,
National Agricultural Statistics Service, May 2014.For Monterey County, the sum of hired labor
and contract labor expense was $817,531,542, while for Santa Cruz County, the total was
$205,719,289. Thus, the two-county total was $1,023,250,831.
40 | P a g e
Farmworker Housing Study and Action Plan for Salinas Valley and Pajaro Valley -
Final June 2018
The cost of labor in the region was the largest among all categories of
production expenses, representing 39% of total costs.27 In contrast, for all of
California agriculture, hired and contract labor expenses were a smaller
proportion of total production expenses, amounting to 26% of total costs.28 The
difference reflects the fact that major regions of the California’s Central Valley
are devoted to cotton, alfalfa, grain and other crops with relatively small labor
demand.
During 2012, the total contract labor expense in the Salinas-Pajaro Valleys region
was $365 million.29 Only Fresno and Kern counties reported a larger expense for
contract labor in that year.
Farm labor contractors are classified within the Agricultural Services for Crop
Production sector (NAICS 1151) that also includes farm management
companies, crop planting and cultivating firms, custom harvesters, and crop
preparation for marketing, such as preparing fresh produce for marketing. Value
Added produce, such as bagged lettuce, or other salad or fresh vegetable
products, are considered within NAICS 1151. Washing, cutting or chopping are
clearly not a form of processing that alters the fresh character of produce.
When adjusted for inflation,30 the total hired and contract labor expense of the
Salinas-Pajaro Valley region increased by 61% between 1978 and 2012.31 The
rate of increase of employment costs in the region was greater in that period
than in any other crop region of California, except for the North Coast premium
wine grape region. The large increase in real labor costs in the Salinas-Pajaro
Laborshed is, in part, associated with the expansion of specific types of crop
production in the region during this period, such as berries, grapes and fresh
vegetables.
27 Ibid. 28 See Table 4. Farm Production Expense: 2012 and 2007 (State Data), p. 12, 2012 Census of
Agriculture. California. State and County Data, op. cit..The hired labor expense was 16.6% of
costs, for contract labor it was 9.6%. 29 Op. Cit. 30 Adjustment for inflations is based on the GDP Deflator index published annually in Economic
Repot of the President. Appendix B. Statistical Tables. Cf. Table B-3. Quantity and price index for
gross domestic product, and percent changes, 1965-2015. This paper used the index value
37.602 for 1978, and 105.214 for 2012. 31 For 1978, see Table 5. Farm Production Expenses: 1978 and 1974, pp. 321 (Monterey) and 401
(Santa Cruz), 1978 Census of Agriculture. California. State and County Data, U.S. Department of
Commerce, Census Bureau, June 1981; for 2012, op. cit.

41 | P a g e
Farmworker Housing Study and Action Plan for Salinas Valley and Pajaro Valley -
Final June 2018
Less apparent, the amount of contract labor expenditure increased more
rapidly in the Salinas-Pajaro region during the last forty years than in any other
region of the state, except for the San Joaquin Valley. In 1978, contract labor
expenses were just 11% of the Salinas-Pajaro Valleys region total labor costs. By
2012, the contract labor share had increased more than three-fold, to 36%.
The total amount of direct-hire and contract labor expenses for Monterey and
Santa Cruz Counties combined, for each of the six principal Types of Farm, are
presented in Table 7. Also presented, by Type of Farm, is the share of these labor
expense (percent) accounted for by Contract Labor alone.
TABLE 7 EXPENSES: TOTAL LABOR, CONTRACT LABOR, % CONTRACT LABOR BY TYPE OF FARMS,
MILLIONS. MONTEREY AND SANTA CRUZ COUNTIES COMBINED 2012 4-DIGIT NAICS
CLASSIFICATION Source: Custom report requested by Dr. Richard Mines and prepared by USDA’s National
Agricultural Statistics Service, from unpublished findings of the 2012 Census of Agriculture. State
and County Data, Farm Production Expenses.
Type of farm (NAICS) Total Labor (M) Contract Labor (M) Percent
Contract
Oil seed and grains (1111) $0.1 $0 0%
Vegetable and melon (1112) $407.3 $186.6 46%
Fruit and nut (1113) $516.9 $175.0 34%
Greenhouse nursery (1114) $90.0 $2.7 3%
Other crop farms (1119) $1.2 $0.1 6%
Animal (112) $8.3 $0.6 7%
Total $1,023.2 $364.9 36%
There was a large variation in the extent of reliance of contract labor among
the principal types of farms in the region. The proportion of vegetable farm total
labor expense attributed to contractor labor amounted to 46%. For fruit farms,
the proportion was 34%. For each of the remaining four categories of farms, the
share was 7% or less.

42 | P a g e
Farmworker Housing Study and Action Plan for Salinas Valley and Pajaro Valley -
Final June 2018
TABLE 8 NUMBER OF FARMS REPORTING HIRED OR CONTRACT LABOR EXPENSES, MONTEREY AND
SANTA CRUZ COUNTIES, 1978 & 2012 Source: (1) 1978 Census of Agriculture. State and County Data, Table 5. Selected Farm
Production Expenses (County Data), pp. 321 and 401. (2) 2012 Census of Agriculture. State and
County Data, Table 3 Farm Production Expenses (County Data), pp. 271ff.
County, Type of labor expense Farms, 1978 Farms, 2012
Monterey, hired labor 779 634
Santa Cruz, hired labor 550 346
Sub-total, hired labor 1,329 980
Monterey, contract labor 278 368
Santa Cruz, contract labor 128 196
Sub-total, contract labor 406 564
A factor associated with increased total contract labor expense in the Salinas-
Pajaro region during recent years was the sharp increase of the number of
famers who relied on Farm Labor Contractors. As indicated in Table8, the
number of the region’s farm operations reporting direct-hire labor expenses
declined – by about 19% - between 1978 and 2012, but the number reporting
contract labor expenses increased by 39%. In Santa Cruz County alone, the
number of farms reporting contract labor expenses increased by 53%.
Agricultural services employment in the Salinas-Pajaro Laborshed
The Agricultural Services for Crop Production sector in the Salinas-Pajaro Valleys
Region has become concentrated by size during the past quarter century.
TABLE 9 SIZE DISTRIBUTION OF EMPLOYMENT, BY FIRM SIZE, 3RD QUARTER, MONTEREY COUNTY,
AGRICULTURAL SERVICES FOR FARM PRODUCTION, 1990&2016 Source: EDD LMID, Special Thanks to Dave Dahlberg
1990 Third Quarter 2016 Third Quarter
Firm Size Number of Firms Employment Number of
Firms Employment
Less than 50 85 915 74 789
50 to 99 26 1,924 23 1,600
100 to 249 32 5,324 15 2,489
250 to 499 16 5,431 21 7,184
500 or greater 7 5,320 24 28,406
Totals 166 18,914 157 40,468

43 | P a g e
Farmworker Housing Study and Action Plan for Salinas Valley and Pajaro Valley -
Final June 2018
Table 9 presents the comparison of employment by employee firm size of
Monterey County Agricultural Service for Crop and Livestock Production in the
3rd calendar quarter between 1990 and 2016.32
The total employment in this sector has more than doubled, from 18,914 to
40,486 during this period. A measure of the increased size concentration is the
share of total employment accounted for by firms with 500 or greater
employees is that in the 3rd quarter of 1990 such companies had a 28% share. By
the 3rd quarter of 2016, firms of that size had a 70%.
There are no accurate reports of the number of contract workers employed in
either Monterey or Santa Cruz Counties. Years ago, the Census of Agriculture
discontinued queries about contract workers, retaining only the question that
estimated the number of farm operations contract labor services and the total
expense involved among all such farms.33
Employment by farm labor contractors with a principal business address and
with crews in the Salinas-Pajaro Laborshed is reported by the U.S. Department of
Labor’s Bureau of Labor Statistics in the QCEW files, as previously discussed. For
Monterey and Santa Cruz Counties, these reports indicate Annual Average of
Monthly Employment reported by the region’s 70 Farm Labor Contractors was
20,881.34
However, there is compelling evidence that these BLS report fails to accurately
report agricultural employment within the laborshed. The BLS reports described
above are nearly always based on a contractor’s primary business address in
the region. Farm labor contractors, as employers, are usually identified in
employment records with the county in which they have their administrative
office, regardless of where their crews are assigned to jobs. Thus, records of their
employment are only reported as though their employees were working
exclusively in that county.35
32 For 2016, the corresponding NAICS code is 1151; for 1990, Dahlberg and colleagues have
tracked the former Standard Industrial Classification Codes (SIC) which correspond today to
NAICS 151. 33 Farm and ranch participants in the agricultural census of 1974 were asked to report the
number of workers furnished by labor contractors. Cf. 1974 Census of Agriculture. United States
Department of Commerce. Bureau of the Census. April 1977. P. C-16. 34 See BLS QCEW files: 2016.q1-q4 060053 Monterey County and 2016.q1.-q4 060087. 35 Ibid.
44 | P a g e
Farmworker Housing Study and Action Plan for Salinas Valley and Pajaro Valley -
Final June 2018
The root of the confusion is that labor contractors are not working in a “brick and
mortar” industry. Their employees do not regularly work at the same physical
worksite address every work day. Instead, a labor contractor’s crews of farm
laborers may be working at different locations within the region, on different
crop fields, and may also be working in nearby, or even distant, counties.
The failure of BLS QCEW files to accurately report the number of farm labor
contractors active at the county level in each agricultural county in the state
was examined and discussed in a previous report.36 It was also found that the
actual number of contractors active in most counties was systematically larger
than was reported in QCEW files.
If a manufacturer has multiple, fixed-location, work-sites, such as factories, in
multiple counties, in many cases an employer will file separate reports for each
of its facilities in non-contiguous counties. Thus, the separate EDD reports of
employment in each county will usually include data for those work-sites.
In contrast, FLCs are not required to provide separate records of employment,
with employee names and earnings, by county, if they have employees working
for clients in any number of counties because they do not have fixed-location
work-sites. Their crews may move to jobs from county-to-county, on a monthly or
weekly basis. Those FLCs who are based in a “home” county out of the Salinas-
Pajaro Valleys region, but who send crews to work within this region, will not
report employment information attributable there. The administrative burden
that separate county-by-county reporting would require is exceptionally large
and quite possibly beyond the capability of some FLCs.
A serious problem associated with reliance on EDD employment data to
estimate labor contractor employment at the count level is that some FLCs with
principal business addresses in the Salinas-Pajaro Laborshed are known to send
crews to adjacent counties, such as San Benito, San Mateo and Santa Clara
counties. But that employment in other counties is attributed to the Salinas-
Pajaro Laborshed’ reports to EDD, and not to the county where they worked.
An additional problem with reliance on administrative data for FLCs is that a
substantial number of currently active FLCs provide workers to non-farm
businesses as well as to agriculture. It is well-established that some FLCs supply
36 Who’s in Charge? Labor Market Intermediaries in California Employment, Don Villarejo, 102 pp,
March 25, 2003. Cf. Chapter Three. Farm Labor Contractors.
file:///C:/Users/Don%20Villarejo/Downloads/who-is-in-charge_villarejo_public_05-25-03.pdf

45 | P a g e
Farmworker Housing Study and Action Plan for Salinas Valley and Pajaro Valley -
Final June 2018
workers for jobs in motels, hotels, resorts and manufacturing. This raises the
important challenge that employment reported by FLCs likely does not
accurately reflect only jobs in the agriculture sector, and, thus, may overstate
the true figure.
Finally, some FLCs do not report their employment in the NAICS code (115115)
corresponding to Farm Labor Contractors and Crew Leaders. This is related to
the fact discussed above that more than a few FLCs are active in non-farm
businesses as well as in agriculture. In a previous report, it was found that some
report as Crop Production, others as Personnel Supply Agencies, and still others
as Unclassified owing to the delays faced by EDD staff in verifying the accuracy
of the industry code selected by the employer.37
There is are additional sources of information about farm labor contractors.
Labor contractors are required to be licensed by the California Department of
Industrial Relations.38 A complete file of licensed FLCs was obtained and served
as another source of information.39 As presented in Table10, there were a
combined total of 73 licensed FLCs with addresses in the Salinas-Parajo region.40
TABLE 10 REPORTED NUMBER OF FLCS 2016, MONTEREY AND SANTA CRUZ COUNTIES Source: BLS, QCEW Files
Source Monterey County Santa Cruz
County
Annual Average of Quarterly Establishments, BLS
QCEW File (NAICS = 115115)
60 10
Cal-DIR, Active FLC License 66 7
County Agricultural Commissioner Registrants 92 60
Agricultural Commissioner FLCs Registrants in both counties: 36
37 Ibid. 38 The Division of Labor Standards Enforcement administers the licensing program and is
responsible for enforcement. 39 The author wishes to thank Ralph Lightstone for his assistance in obtaining an electronic file of
licensed FLCs. 40 The file of FLC licensees was current as of March 15, 2017. A contractor whose license expired
at any time during 2016 and chose not to renew the license between that date and March 15,
2017, would not have been represented in the DLSE file.

46 | P a g e
Farmworker Housing Study and Action Plan for Salinas Valley and Pajaro Valley -
Final June 2018
All FLCs are also required to register with the Agricultural Commissioner of each
county in which they plan to be active and must pay a registration fee in so
doing. Some FLCs may register in the expectation that their crews may be
needed on short notice, but may not be needed at all. As part of the research
for the present report, copies of the lists of FLCs registered in Monterey and
Santa Cruz Counties were obtained.
There were 92 FLCs active during 2016 in the Monterey County files, and 60 in the
Santa Cruz County file. However, the total of 152 FLCs in the combined files
included a substantial number of FLCs represented in both counties’ files.
Of the 73 licensed farm labor contractors with business addresses in the region,
nearly all were registered with one or the other of the two counties’ Agricultural
Commissioners. However, three were not registered with either county’s
Agricultural Commissioner.
The unduplicated number of licensed FLCs which were active in the Salinas-
Pajaro region during 2016 is estimated to be 118, of which 73 were
headquartered in the region. Thus, 45 were headquartered out of region, some
as far as Arizona.
Only a portion of these 118 FLCs who held active licenses and had addresses
within the Salinas-Pajaro laborshed during 2016 reported employment in the BLS
QCEW files for either Monterey or Santa Cruz County. As indicated in Table10,
just 70 FLCs reported employment in the region. Hence, an estimated 48
reported all of their employment in their “home” counties, even if they had
employees in either or both of Monterey and Santa Cruz Counties.
Of considerable significance, also indicated in Table 10, there were 36 FLCs who
were active in both counties. Nearly all of the bi-county contractors were
headquartered in Monterey County. Only one was based in Santa Cruz County.
The disparity between BLS reports of the number of FLCs active in the region as
compared with Agricultural Commissioner registrations was exceptionally large
for Santa Cruz County for which the QCEW file reports just 10 contractors, but
the Santa Cruz County Agriculture Commissioner records show that 60 licensed
contractors were registered.
As previously indicated, an effort was made to determine which of the FLCs
active in the two-county region were based in other counties, for which the
records of employment were reported only for their “home” county. Equally
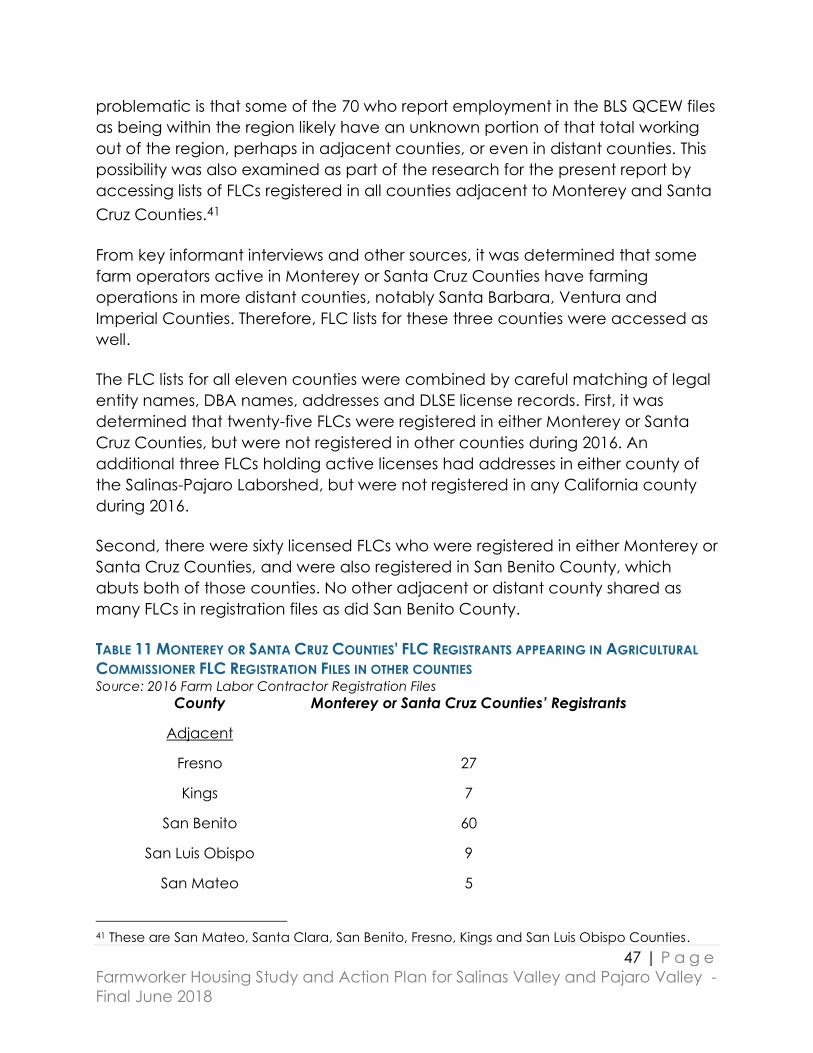
47 | P a g e
Farmworker Housing Study and Action Plan for Salinas Valley and Pajaro Valley -
Final June 2018
problematic is that some of the 70 who report employment in the BLS QCEW files
as being within the region likely have an unknown portion of that total working
out of the region, perhaps in adjacent counties, or even in distant counties. This
possibility was also examined as part of the research for the present report by
accessing lists of FLCs registered in all counties adjacent to Monterey and Santa
Cruz Counties.41
From key informant interviews and other sources, it was determined that some
farm operators active in Monterey or Santa Cruz Counties have farming
operations in more distant counties, notably Santa Barbara, Ventura and
Imperial Counties. Therefore, FLC lists for these three counties were accessed as
well.
The FLC lists for all eleven counties were combined by careful matching of legal
entity names, DBA names, addresses and DLSE license records. First, it was
determined that twenty-five FLCs were registered in either Monterey or Santa
Cruz Counties, but were not registered in other counties during 2016. An
additional three FLCs holding active licenses had addresses in either county of
the Salinas-Pajaro Laborshed, but were not registered in any California county
during 2016.
Second, there were sixty licensed FLCs who were registered in either Monterey or
Santa Cruz Counties, and were also registered in San Benito County, which
abuts both of those counties. No other adjacent or distant county shared as
many FLCs in registration files as did San Benito County.
TABLE 11 MONTEREY OR SANTA CRUZ COUNTIES' FLC REGISTRANTS APPEARING IN AGRICULTURAL
COMMISSIONER FLC REGISTRATION FILES IN OTHER COUNTIES Source: 2016 Farm Labor Contractor Registration Files
County Monterey or Santa Cruz Counties’ Registrants
Adjacent
Fresno 27
Kings 7
San Benito 60
San Luis Obispo 9
San Mateo 5
41 These are San Mateo, Santa Clara, San Benito, Fresno, Kings and San Luis Obispo Counties.
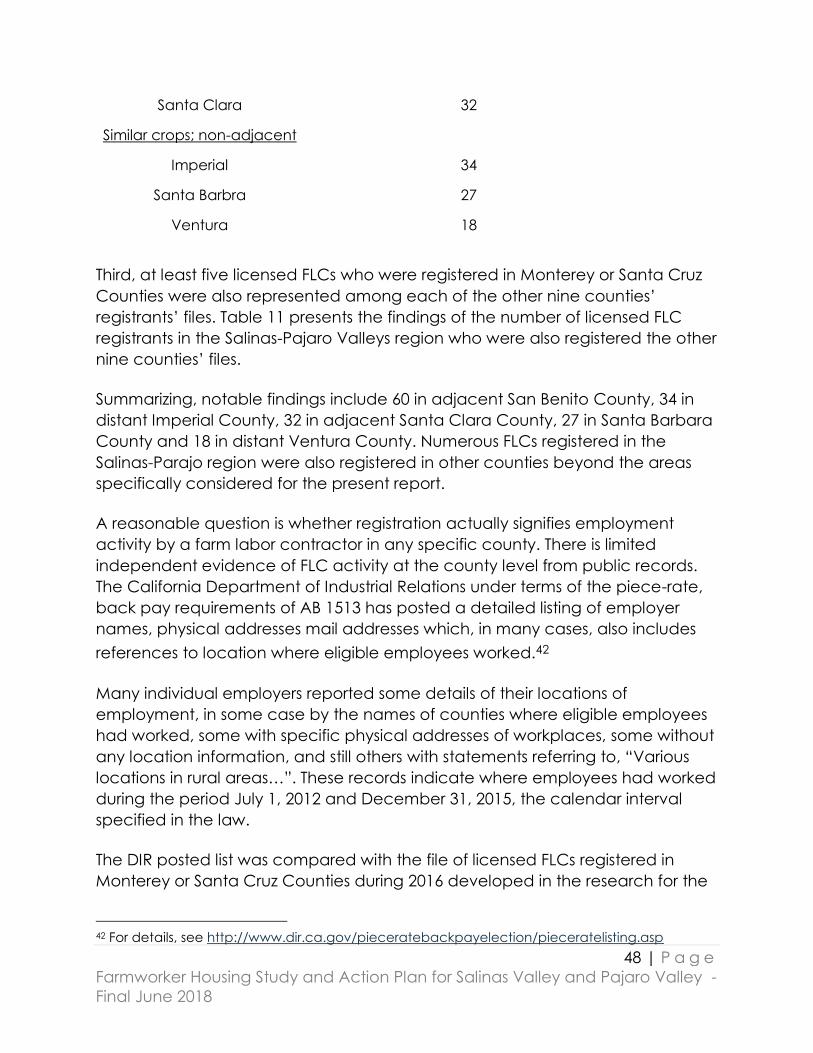
48 | P a g e
Farmworker Housing Study and Action Plan for Salinas Valley and Pajaro Valley -
Final June 2018
Santa Clara 32
Similar crops; non-adjacent
Imperial 34
Santa Barbra 27
Ventura 18
Third, at least five licensed FLCs who were registered in Monterey or Santa Cruz
Counties were also represented among each of the other nine counties’
registrants’ files. Table 11 presents the findings of the number of licensed FLC
registrants in the Salinas-Pajaro Valleys region who were also registered the other
nine counties’ files.
Summarizing, notable findings include 60 in adjacent San Benito County, 34 in
distant Imperial County, 32 in adjacent Santa Clara County, 27 in Santa Barbara
County and 18 in distant Ventura County. Numerous FLCs registered in the
Salinas-Parajo region were also registered in other counties beyond the areas
specifically considered for the present report.
A reasonable question is whether registration actually signifies employment
activity by a farm labor contractor in any specific county. There is limited
independent evidence of FLC activity at the county level from public records.
The California Department of Industrial Relations under terms of the piece-rate,
back pay requirements of AB 1513 has posted a detailed listing of employer
names, physical addresses mail addresses which, in many cases, also includes
references to location where eligible employees worked.42
Many individual employers reported some details of their locations of
employment, in some case by the names of counties where eligible employees
had worked, some with specific physical addresses of workplaces, some without
any location information, and still others with statements referring to, “Various
locations in rural areas…”. These records indicate where employees had worked
during the period July 1, 2012 and December 31, 2015, the calendar interval
specified in the law.
The DIR posted list was compared with the file of licensed FLCs registered in
Monterey or Santa Cruz Counties during 2016 developed in the research for the
42 For details, see http://www.dir.ca.gov/pieceratebackpayelection/pieceratelisting.asp
49 | P a g e
Farmworker Housing Study and Action Plan for Salinas Valley and Pajaro Valley -
Final June 2018
present report.43 There were 44 licensed FLCs registered in Monterey or Santa
Cruz Counties’ Agricultural Commissioners files in DIR’s piece-rate back pay files,
matched by Legal Entity or DBA name as well as physical and mail addresses.
Of that number, 19 listed all counties where employees had worked during the
specified period.
Of the 19 FLCs record that listed specific county names where employees had
worked, nearly all included counties matching those in the 2016 list developed
for the present report. While this is suggestive that FLC registrations coincide with
their own records of where their employees were working, it is by no means
conclusive.
It should be clear from the previous discussion that reasonable accurate
information about FLC employment in the Salinas-Pajaro region is not readily
available from any source. The fact that so many FLCs are presently multi-
county businesses confounds any effort to make estimates based on
administrative data.
H-2A non-immigrant temporary foreign agricultural workers
During the past four years, there has been a substantial increase in the number
of farm laborers brought into the Salinas-Pajaro Laborshed under the Temporary
Foreign Agricultural Worker visa program (H-2A). Farm employers may seek
seasonal employees under strictly controlled conditions which requires the
employer to first seek U.S. residents who are authorized for U.S. employment. If
suitably qualified persons do not fill those jobs, the process for applying for
certification of nonimmigrant workers can proceed.
Among the requirements the employer must meet is the ability to provide
housing for all who obtain the required H-2A visas. The number of H-2A workers is
included in EDD and BLS reports of employment although not marked as such.
Figure 15 presents the most recent tally of the number of Certified H-2A visas
issued for workers employed in the Salinas-Pajaro Laborshed annually between
43 While 2016 followed the end of the period for which employer location records were provided
for the list, it is likely that many employers were likely to still be working at those locations.

50 | P a g e
Farmworker Housing Study and Action Plan for Salinas Valley and Pajaro Valley -
Final June 2018
Federal Fiscal Years 2014 through 2017.44 The number of H-2A workers was more
than 4,300 in FY 2017, up from 636 in FY 2014, and only 268 in FY 2013.
FIGURE 15 TEMPORARY NONIMMIGRANT FOREIGN AGRICULTURAL WORKERS CERTIFIED (H2A)
MONTEREY AND SANTA CRUZ COUNTIES
The number of employers who brought H-2A workers to the Salinas-Pajaro
Laborshed during FY 2017was relatively small, just 24 in all. Most employers with
H-2A workers, 18 out of 24, were licensed farm labor contractors who were also
registered with the respective counties’ Agricultural Commissioners. Just four
were farm operators. The remaining two were labor associations serving multiple
individual livestock producers.
Estimate of the number of agricultural workers in the Salinas- Pajaro
laborshed
The present author has developed an independent method for estimating the
number of individuals who held at least one agricultural job in the Salinas-Pajaro
Laborshed during 2016. The method relies on the 2012 Census of Agriculture
44 The data for Federal Fiscal Year 2017 covers only the period October 1, 2016 through June 30,
2017. When data for the full year becomes available, the number of H-2A workers in FY 2017 will
certainly be larger than indicated in Figure 3.
0
500
1000
1500
2000
2500
3000
3500
4000
4500
5000
FY2013 FY2014 FY2015 FY2016 FY2017
Wo
rke
rs C
ert
ifie
d
Federal Fiscal Year
Temporary Nonimmigrant Foreign Agricultural
Workers Certified (H-2A), Monterey and Santa Cruz Counties
Federal Fiscal Years FY2013-FY2017

51 | P a g e
Farmworker Housing Study and Action Plan for Salinas Valley and Pajaro Valley -
Final June 2018
report of hired labor, the 2016 QCEW report of total wages paid to agricultural
employees, and the National Agricultural Workers Survey (NAWS) estimate of the
average number of employers per crop worker in California during 2013-14. The
computation is described in detail in Appendix I of the present report.
An estimated total of 91,423 unique individuals held at least one agricultural job
in the Salinas-Pajaro Laborshed during 2016. ~ Villarejo, 2018
There is another estimate of the number of individuals employed in the Salinas-
Pajaro laborshed. The second is a published report by Prof. Phil Martin which
relied on an EDD analysis of a very large sample of unique records of wages
earned in 2014 by workers employed by California firms which report in one of
the NAICS sectors comprising agricultural production and support services for
agricultural production. These agricultural sectors were as follows.
1111 Oilseed and grain farming;
1112 Vegetable and melon farming;
1113 Fruit and tree nut farming;
1114 Greenhouse and nursery production;
1119 Other crop farming;
1121 Cattle ranching and farming;
1122 Hog and pig farming;
1123 Poultry and egg farming;
1124 Sheep and goat farming;
1125 Animal aquaculture;
1129 Other animal farming;
1151 Support activities for crop production;
1152 Support activities for animal production;
1153 Support activities for forestry.
The analysis identified those unique employee records, some of which indicated
having had jobs in two or more of all possible NAICS sectors, not just those in the
above listed agricultural sectors, but necessarily included at least one job in one
of those sectors. Each unique employment record was then assigned to a
unique county, based on the employer’s assigned county location.
Assuming that each unique employment record assigned to a county was
associated with a unique individual, it was then possible to determine the
number of individuals who had a job in the agricultural sector in every county.

52 | P a g e
Farmworker Housing Study and Action Plan for Salinas Valley and Pajaro Valley -
Final June 2018
A total of 96,700 unique individuals held at least one agricultural job in the
Salinas-Pajaro Laborshed during 2014. ~ Martin, 2017
These two estimates differ by about 5,277, although they pertain to different
years. Martin’s method rests on the assumption that each unique employment
record is associated with a unique individual.
The present author’s method assumes the distribution of wages between longer-
term jobs and shorter-term jobs in the support services for agricultural
employment sub-sector is the same as in the direct-hire sub-sector, and that the
NAWS finding of the average number of employers per worker throughout
California crop employment applies to all agricultural employment in the
Salinas-Pajaro Laborshed.
San Benito County is arguably part of the Salinas-Pajaro laborshed
There are two findings of the present report that indicate a very close
relationship of agricultural employers of the Salinas-Pajaro region with the supply
of labor for crop production in San Benito County. First, the present report
includes the finding that 60 licensed FLCs active in the Salinas-Pajaro region are
also active in San Benito County (See Table11).
Second, the community of Aromas, a Census Designated Place, is one of only a
very tiny number of places in California that straddles two adjacent counties, in
this case Monterey and San Benito counties. The population of Aromas is very
nearly equally divided between the two counties. By happenstance, the border
of Aromas is just one mile distant from Santa Cruz County. Moreover, the most
Southeast portion of Santa Cruz County is clearly labelled “Aromas” on the
official county Census Tract map.45
There were only 36 FLCs registered in both Monterey and Santa Cruz Counties in
2016. The fact that 60 of the San Benito County FLCs were registered in the
Salinas-Pajaro region suggests that San Benito County’s labor market is as
intimately connected to the Salinas-Pajaro region as is the relationship of the
two counties of that region to one another. Review of those 60 FLCs finds that 40
were headquartered in the Salinas-Pajaro region, and only two were
45 http://gis.co.santa-
cruz.ca.us/map_gallery/pdfs/Map%20Gallery/Cultural%20Resources%20and%20Census/Census%
20Tracts.pdf

53 | P a g e
Farmworker Housing Study and Action Plan for Salinas Valley and Pajaro Valley -
Final June 2018
headquartered in San Benito County. The remaining 18 FLCs were
headquartered on other California counties and Arizona.
This remarkably close relationship of FLCs raises the question of whether a large
portion of the San Benito County agricultural workforce is based in the Salinas-
Pajaro region. In no other county were FLCs from the latter region as dominant
as was the case in San Benito County.
It also appears that San Benito vegetable and berry production is highly
integrated with production of the same crops in the Salinas-Pajaro region. There
is also a close relationship of large-scale farm businesses between San Benito
County and the Salinas-Pajaro region. Sixteen farm operations with substantial
activity in San Benito County also have farm operations in the Salinas-Pajaro
region. Of that number, the majority are based in the Salinas-Pajaro region. As
well, the largest San Benito vegetable grower-packer-shipper also relies on
product from Salinas-Pajaro growers. Similarly, a large Salinas-Pajaro vegetable
grower-packer-shipper has substantial farming operations in San Benito County.
Discussion
The continued growth of farm labor contactor employment in the region, while
direct-hire employment by farm operators has remained relatively constant in
recent years, has been somewhat unexpected. Several prominent contractors
in the region differ little in some aspects from farm operators: one, in fact, is part-
owner of a substantial berry farm and also manages a large salad plant. Other
contactors own or lease the type of machinery one usually associates with
farmers.
Wage rates for FLC employees are reported to differ little from wage rates paid
to direct-hire employees for the same crop and task.46 On the other hand,
regular and year-round direct-hire employees in agriculture often have a
package of non-wage benefits, and some direct-hire seasonal workers may also
have non-wage benefits.47 However, FLC employees usually do not have
comparable non-wage benefits, although there is anecdotal evidence these
practices may be changing.
46 Farm Employers Labor Service. Wage and Benefits Report, July 2015. 47 Ibid.
54 | P a g e
Farmworker Housing Study and Action Plan for Salinas Valley and Pajaro Valley -
Final June 2018
That said, it has been over a quarter-century since the most-recent systematic
study of farm labor contractors in California.48 Given the fact that the support
services sector of the agricultural industry has become the principal employer of
agricultural workers, it is essential to carefully examine this sector anew.
There are two major trends in consumer preferences that have serious
implications for the fresh produce industry. First, annual per capita consumption
of fresh vegetables in the United States between 2000 and 2015 was estimated
to have peaked in 2004 at 204.4 lbs., but was down to 186.7 lbs. in 2015.49 During
the interval between two three-year periods, 2003-05 to 2013-15, the annual
average of per capita consumption declined from 200.5 lbs. +/- 8.0 lbs. down to
185.8 lbs. +/- 2.2 lbs. There was a statistically significant reduction of 14.7 lbs. +/-
5.9 lbs. of fresh vegetables per person in the U.S. during that latter period.
Second, a recent report on consumer compliance with official
recommendations for consumption of fresh fruits and vegetables finds just 12.2%
of U.S. adults met the fruit recommendations and only 9.3% met the fresh
vegetable recommendations. Compliance with the vegetable
recommendation was highest among women (10.9%), among adults older than
50 (10.9%) and among those in the highest income group (11.4%).50 The report
was based on findings among a large sample of U.S. adults, some 319,415
individuals.
In addition, the annual Fresh Trends survey of U.S. consumer households presents
findings of purchasing behaviors for 57 specific fresh fruits or vegetables.51
Consumers were asked only about their direct purchases of each specific item
in a retail outlet, whether supermarket, big-box discount outlet, or other
commercial vendor of fresh produce. About 1,000 households are contacted
each year, and the findings are adjusted according to the U.S. demographic
profile.
The findings of particular interest to this report concerns consumer purchases of
each of several of the fresh products grown in the Salinas-Pajaro region. Figure
48 California Department of Employment Development, Labor Market Information Division, Farm
Labor Contractors in California, California Agricultural Studies, Report 92-2, July 1992, 114 pp. 49 https://www.ers.usda.gov/data-products/food-availability-per-capita-data-system/ 50 S.H. Lee-Kwan, et. al., Disparities in State-Specific Adult Fruit and Vegetable Consumption –
United States, 2015, Mortality and Morbidity Weekly Report, Center for Disease Control and
Preventions, 66(45);1241-1247, November 17, 2017. 51 Fresh Trends, Farm Journal Media (publisher of The Packer), Annual, 2007 through 2017 issues.
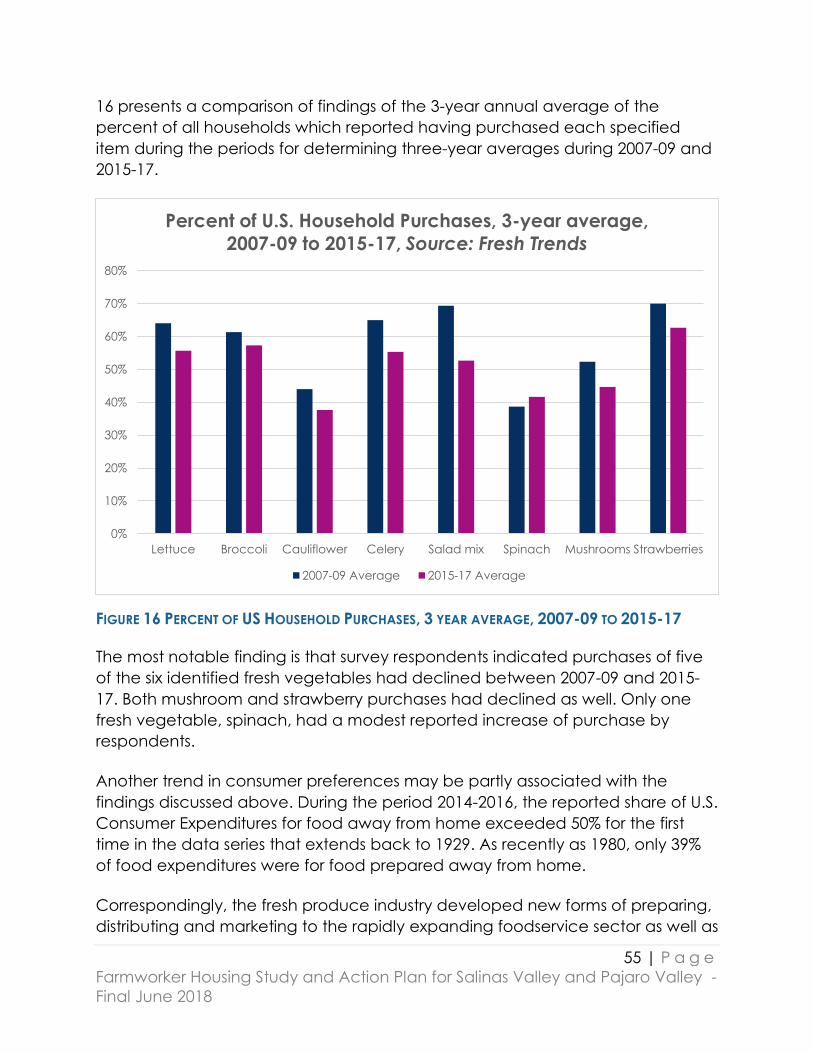
55 | P a g e
Farmworker Housing Study and Action Plan for Salinas Valley and Pajaro Valley -
Final June 2018
16 presents a comparison of findings of the 3-year annual average of the
percent of all households which reported having purchased each specified
item during the periods for determining three-year averages during 2007-09 and
2015-17.
FIGURE 16 PERCENT OF US HOUSEHOLD PURCHASES, 3 YEAR AVERAGE, 2007-09 TO 2015-17
The most notable finding is that survey respondents indicated purchases of five
of the six identified fresh vegetables had declined between 2007-09 and 2015-
17. Both mushroom and strawberry purchases had declined as well. Only one
fresh vegetable, spinach, had a modest reported increase of purchase by
respondents.
Another trend in consumer preferences may be partly associated with the
findings discussed above. During the period 2014-2016, the reported share of U.S.
Consumer Expenditures for food away from home exceeded 50% for the first
time in the data series that extends back to 1929. As recently as 1980, only 39%
of food expenditures were for food prepared away from home.
Correspondingly, the fresh produce industry developed new forms of preparing,
distributing and marketing to the rapidly expanding foodservice sector as well as
0%
10%
20%
30%
40%
50%
60%
70%
80%
Lettuce Broccoli Cauliflower Celery Salad mix Spinach Mushrooms Strawberries
Percent of U.S. Household Purchases, 3-year average,
2007-09 to 2015-17, Source: Fresh Trends
2007-09 Average 2015-17 Average
56 | P a g e
Farmworker Housing Study and Action Plan for Salinas Valley and Pajaro Valley -
Final June 2018
more convenient, ready-to-eat fresh products, such as triple-washed and cut
vegetables, described as the “Value added” and “Fresh cut” segments of the
industry. A walk-through of a modern supermarket’s produce section tells, at a
glance, which type of fresh product has become popular, although young
shoppers likely wouldn’t notice how much had changed from several decades
ago.
These trends in purchases are clearly associated with several major
demographic changes of the past several decades: substantial increase of the
participation of women in the labor force, delayed age of women’s first
childbirth, delayed age of marriage or partner formation, and postponement of
permanent household formation.
The fresh produce industry has successfully reconfigured in the face of declining
demand, supplementing fresh products with Value Added and Fresh Cut
products, as well as developing the organic category into a major component
of the industry. By 2016, organic salad products reportedly achieved 26.6% of
total sales of salad products.
Data issues in administrative reports of agricultural services
employment
For several decades, the USDA survey of agricultural businesses which employ
labor, known to researchers as the farm labor survey and published as Farm
Labor, included statewide employment and average wage information
reported by labor contractors and other providers of on-farm, contracted
services in California and Florida, as well as for the United States. Difficulties in
obtaining statistically reliable results, owing to a very low response rate from the
agency’s employer lists, ultimately led to a decision that the cost of conducting
a survey with statistically reliable results was excessive, and that component of
the survey was discontinued.52 Today, only farm and ranch operators are
included in the survey, and they are only asked to provide information about
their direct-hire employees.
Similarly, the Bureau of the Census quinquennial surveys of all U.S. business
activity, of which the Census of Agriculture is of interest in the present report,
made a serious effort to survey Agricultural Services. There were two attempts to
survey such businesses, the first in 1974, which was ultimately deemed unreliable
52 The survey of agricultural services employment and wages ended in 2011.

57 | P a g e
Farmworker Housing Study and Action Plan for Salinas Valley and Pajaro Valley -
Final June 2018
owing to an inadequately comprehensive mail address file of such businesses. A
second effort in 1978, which included a substantial effort to improve the mail
address file, also resulted in findings which were statistically unreliable. There has
not been any new effort to attempt such a survey again, despite the rapid
increase of employment in that sector.
The rapidly increased role of the Agricultural Services Sector throughout the
nation, although largest in California, suggests it is time to re-visit whether it is
now time to include this sector in both the business surveys and a separate
section of the Census of Agriculture. Total reported wages paid in NAICS 115
during 2016 were $11.7 billion for the U.S. However, the total U.S. wage bill for the
sector is likely greater by an unknown amount because many smaller operations
in most states are exempt from unemployment insurance tax payments
because their payroll was less than the current cutoff.
Conclusions
There has been a significant expansion of agricultural employment in the
Salinas-Pajaro region during the past decade, amounting to about +24%. The
long-term trends indicate that employment costs of agricultural businesses in the
region, when adjusted for inflation, have increased substantially, by +61% in the
past forty years.
Agricultural service businesses are today the largest segment of agricultural
employment in the region, and, for each month of the year, exceed farm and
ranch direct-hire employment. Farm labor contractor employment today
accounts for most agricultural employment within the region during every month
of the year. In part, this is associated with a substantial increase in the number of
farms who rely on contract labor and a simultaneous decrease of farms who rely
on directly hired labor.
The majority of the Salinas-Pajaro region’s farm labor contractors are also active
in other regions of the state, many in adjacent counties, but many in distant
counties with fresh vegetable production, or in counties where berries and/or
winegrapes are grown. Just 24 of the 118 licensed and registered contractors
are active only in Monterey County or Santa Cruz County. The average
contractor active in the region is also active in 3.25 other counties of the state.
One reports registration in eighteen counties, and thirteen are registered in at
least ten or more counties.

58 | P a g e
Farmworker Housing Study and Action Plan for Salinas Valley and Pajaro Valley -
Final June 2018
There is some independent evidence that contractors active in the Salinas-
Pajaro region are, in fact, also active in other counties where they have
registered. It appears likely that many contractors based in the southern San
Joaquin Valley have moved into other parts of the state in recent years. Some
were moving from areas where the five-year drought had severely adversely
affected production, and others were motivated by the long-term substantial
reductions in that region’s vineyard acreage, especially in raisin grapes and
winegrapes.
The impact of H-2A workers on local labor market conditions is presumed to be
insignificant: H-2A workers must be paid at the Adverse Impact Wage Rate
determined regionally. This wage rate is normally higher than the prevailing
wage rate for farm labor jobs. But there may well be other significant labor
market impacts, such as enforcement of an increased pace of work (speed-up),
or other changes of labor processes, as well as displacement of older workers, or
vulnerable sub-groups. Whether there have been significant changes of the
pace of work or of other labor processes when H-2A workers fill jobs formerly
held by non-H-2A workers is largely unknown.
Additionally, the local affordable housing market is adversely impacted by
employers of H-2A workers seeking to gain control of a large portion of the
available affordable housing as well as temporary lodging, such as motels. Such
consequences need to be examined.
It is likely that the only way to obtain reasonably accurate information about
employment of workers in a specific county or region who are employed by
FLCs is the following. First, using all available administrative records, described in
the present report, identify FLCs which likely have crews in the county or region.
Second, conduct interviews with as many of the identified contractors as
possible to obtain information about where their crews are working and how
much employment they attribute to each county. Third, examine H-2A
certification applications for information regarding crops, locations, months of
employment, and specific details regarding housing. Finally, prepare estimates
of the total and regional amounts based on the results of these interviews.
Analysis of Existing Farmworker Housing Inventory in
Santa Cruz and Monterey Counties
The Monterey Bay Region is home to a significant number of housing facilities
designated for year-round, permanent and seasonal, migrant farmworkers

59 | P a g e
Farmworker Housing Study and Action Plan for Salinas Valley and Pajaro Valley -
Final June 2018
although, as demonstrated by this study, not nearly enough to meet demand.
As a result, most farmworkers earning a living from agriculture in the Pajaro and
Salinas Valleys region live, at least part of the year, in the region’s private
housing market and, in some cases, makeshift conditions, such as cars, garages,
tool sheds, and tents. Many are over-paying for their housing, living in squalid,
sub-standard homes, and/or doubling and tripling up with other households in
overcrowded conditions.
From a survey of developer members of the California Coalition for Rural
Housing, a search of the websites of affordable housing development
organizations with properties in the region, and lists provided by the U.S.
Department of Agriculture, we have assembled an inventory of projects and
units that are occupationally-restricted to qualifying farmworkers. This does not
include farmworkers living in other subsidized and use-restricted rental housing
projects, both privately- and publicly-owned, that house any qualifying low-
income household.
According to our analysis, there are 26 year-round housing complexes in Santa
Cruz and Monterey Counties with 1,290 total units and 1,077 units that are
occupationally-restricted to farmworkers. The great majority are in Monterey
County – 19 projects (73 percent) with farmworker 873 units (81 percent). All but
one of the Santa Cruz County properties is in Watsonville. Twenty-two of the
properties are rental apartments. Six are hybrids with 135 out of 347 units (39
percent) restricted to farmworkers. Four of the properties with 275 units, all in
Monterey County, are in cooperative ownership. All projects with year-round
units for farmworkers are listed by place name in Table 12.
TABLE 12 YEAR-ROUND PERMANENT FARMWORKER HOUSING IN SANTA CRUZ AND MONTEREY
COUNTIES
Place County
Total
Units FW Units
Resident
Type
Housing
Type Owner
Owner
Type
Year
Opened
Castroville Monterey 58 15 Family Year-Round MidPen NP 2011
Chualar Monterey 29 29 Family Year-Round HACM PHA 1982
Gonzalez Monterey 36 36 Family Year-Round CHISPA NP 2005
Greenfield Monterey 40 40 Family Year-Round
Pacific
Companies FP 2013
King City Monterey 40 40 Family Year-Round
La Buena
Esperanza Coop 1984
Pajaro Monterey 63 26 Family Year-Round Eden NP 2006
Salinas Monterey 60 60 Family Year-Round San Jerardo Coop 1972
Salinas Monterey 43 43 Family Year-Round CHISPA NP 1984
Salinas Monterey 25 25 Senior Year-Round CHISPA NP 2006
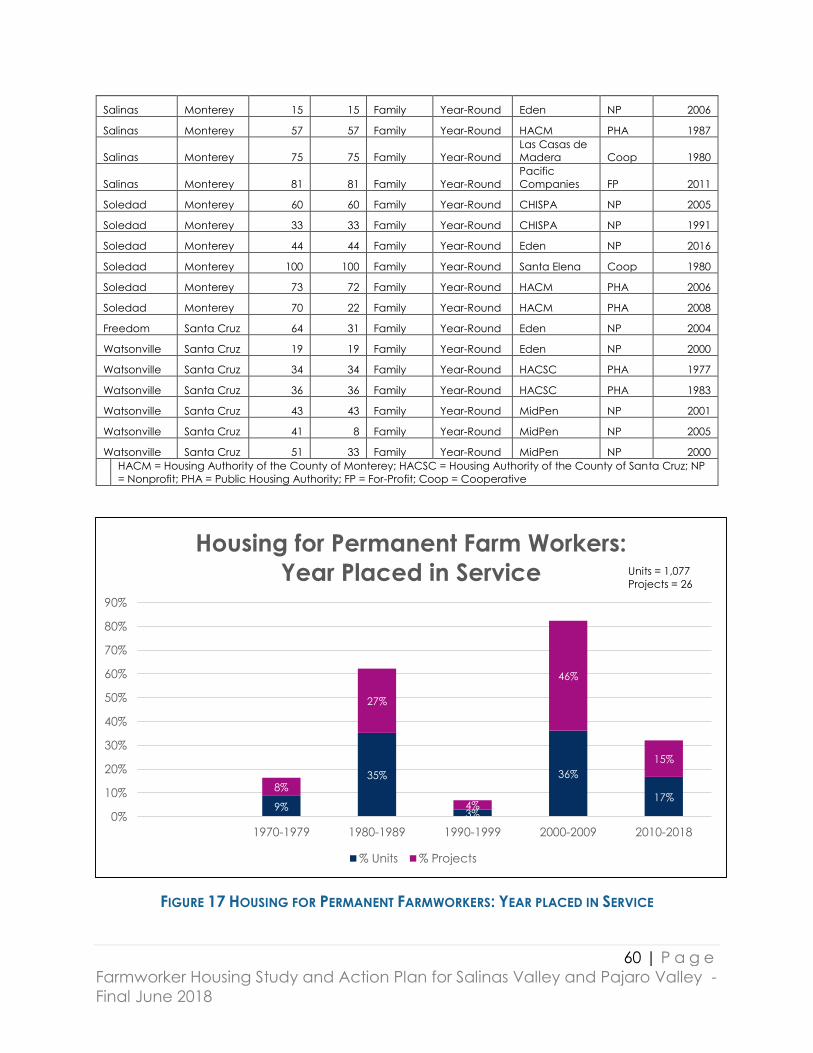
60 | P a g e
Farmworker Housing Study and Action Plan for Salinas Valley and Pajaro Valley -
Final June 2018
Salinas Monterey 15 15 Family Year-Round Eden NP 2006
Salinas Monterey 57 57 Family Year-Round HACM PHA 1987
Salinas Monterey 75 75 Family Year-Round
Las Casas de
Madera Coop 1980
Salinas Monterey 81 81 Family Year-Round
Pacific
Companies FP 2011
Soledad Monterey 60 60 Family Year-Round CHISPA NP 2005
Soledad Monterey 33 33 Family Year-Round CHISPA NP 1991
Soledad Monterey 44 44 Family Year-Round Eden NP 2016
Soledad Monterey 100 100 Family Year-Round Santa Elena Coop 1980
Soledad Monterey 73 72 Family Year-Round HACM PHA 2006
Soledad Monterey 70 22 Family Year-Round HACM PHA 2008
Freedom Santa Cruz 64 31 Family Year-Round Eden NP 2004
Watsonville Santa Cruz 19 19 Family Year-Round Eden NP 2000
Watsonville Santa Cruz 34 34 Family Year-Round HACSC PHA 1977
Watsonville Santa Cruz 36 36 Family Year-Round HACSC PHA 1983
Watsonville Santa Cruz 43 43 Family Year-Round MidPen NP 2001
Watsonville Santa Cruz 41 8 Family Year-Round MidPen NP 2005
Watsonville Santa Cruz 51 33 Family Year-Round MidPen NP 2000
HACM = Housing Authority of the County of Monterey; HACSC = Housing Authority of the County of Santa Cruz; NP
= Nonprofit; PHA = Public Housing Authority; FP = For-Profit; Coop = Cooperative
FIGURE 17 HOUSING FOR PERMANENT FARMWORKERS: YEAR PLACED IN SERVICE
9%
35%
3%
36%
17%8%
27%
4%
46%
15%
0%
10%
20%
30%
40%
50%
60%
70%
80%
90%
1970-1979 1980-1989 1990-1999 2000-2009 2010-2018
Housing for Permanent Farm Workers:
Year Placed in Service
% Units % Projects
Units = 1,077
Projects = 26

61 | P a g e
Farmworker Housing Study and Action Plan for Salinas Valley and Pajaro Valley -
Final June 2018
In Figure 17, it can be seen that 71 percent of the units and 73 percent of the
projects were opened in two decades, from 1980 to 1989 and from 2000 to 2009.
The decade from 2000 to 2009 accounts for the largest share of projects with
restricted farmworker units in the region, nearly half (46 percent). This period
corresponds with the passage of two statewide housing bonds, Proposition 46 in
2002 and Proposition 1C in 2006, which authorized a large infusion of new
funding for the Joe Serna, Jr., Farmworker Housing Grant Program and spawned
an increase in hybrid projects. The last projects placed into service that decade
were in 2006, just before the housing-market crash.
Several pipeline projects were opened in the current decade, in 2011 and 2013.
Exhaustion of Proposition 1C funds for the Serna Program in the early 2010s,
coupled with the slow recovery from the Great Recession, the loss of
redevelopment agency tax increment financing, and declining funding at the
federal level may explain why the pace of farmworker housing production is less
in the decade from 2010 to 2020, to date, than it was in the previous decade.
The age profile of the inventory of year-round housing for permanent
farmworkers also suggests something else of critical significance: nearly half of
all units (47 percent) and 39 percent of all projects are 20 years of age or older.
Some of the older complexes, including some that originated as labor camps or
other housing types and were acquired and reconstructed, may have been
updated and modernized more recently. However, it is likely that the older
inventory will need to be recapitalized and refurbished in the coming years with
replacement of outdated and inefficient energy and water conservation
systems. For some, recapitalization may also create opportunities for
densification.
In addition, we are able to identify five migrant housing facilities in Santa Cruz
and Monterey Counties with 358 units. Four are in current operation and one is
slated to open in the Spring 2018. Two of these facilities, one in each county,
are State of California Office of Migrant Services centers operated by the
Housing Authority of Santa Cruz County and Housing Authority of Monterey
County. They have 183 units for migrant families. Spreckels Crossing is owned
and operated by Tanimura & Antle and was opened in 2016. It has 100 two-
bedroom units capable of housing up to 800 single, unaccompanied workers. In
King City, SCS opened a 218-bed facility on a 5-year use permit. The Nunes
Company is scheduled to open another similar facility with 75 units capable of
accommodating up to 600 employees.

62 | P a g e
Farmworker Housing Study and Action Plan for Salinas Valley and Pajaro Valley -
Final June 2018
TABLE 13 MIGRANT AND SEASONAL HOUSING IN SANTA CRUZ AND MONTEREY COUNTIES
Project Name Place County Units Beds
Resident
Type
Owner
Type
Year
Opened
King City Migrant Center King City Monterey 79 - Family PHA 1998
Buena Vista Migrant Center Watsonville Santa Cruz 104 - Family PHA 1968
Spreckels Crossing Spreckels Monterey 100 800 Single Grower 2016
SCS Facility King City Monterey -- 218 Single FLC 2017
Casa Boronda Boronda Monterey 75 600 Single Grower 2018
We are aware of at least seven projects with 328 units for year-round,
permanent farmworkers that are in the conceptual phase, in the funding
pipeline, or under construction. The Housing Authority of the County of
Monterey is working on two family projects with 102 units in Castroville; MidPen
Housing is developing a 46-unit project that is in Watsonville and Santa Cruz
County; and the Corporation for Better Housing has a funding commitment from
USDA Rural Development for a 64-unit project in Greenfield. In addition, CHISPA
has three rental projects in the works for 232 units, an anticipated half of which
may be financed by Joe Serna, Jr., Farmworker Housing Grant funds that should
become available in 2018 and successive years.
Finally, growers are actively contemplating building additional employee
housing to house H-2A workers and domestic workers. Discussions are underway
in several locations about converting existing commercial and industrial spaces
to temporary housing. For example, the City of King City approved a zoning
change in 2017 to permit temporary conversion of a vacant warehouse building
for housing 218 H-2A workers and recently approved expansion by 100 beds.
Additionally, the City approved a sewer line extension to serve a property just
beyond the city limits to enable renovation of a blighted property for
agricultural employees that will house another 200 workers.
A plan circulated in 2017 by Salinas Valley Housing, LLC, proposed seasonal
housing for approximately 6,000 single, unaccompanied adults in the
unincorporated community of Chualar. Under the plan, a local landowner
would partner with Salinas Valley Housing to build 3- and 4-bedroom apartments
compliant with H-2A requirements About 128 acres of the 306-acre agricultural
parcel would be devoted to the project and the rest would remain in
agricultural use. In addition to sleeping accommodations, the project would
include laundry facilities, common areas with barbeques, outdoor recreation,
and picnic areas. At the time of this writing in 2018, it is uncertain whether the
proposal will move ahead.
63 | P a g e
Farmworker Housing Study and Action Plan for Salinas Valley and Pajaro Valley -
Final June 2018
In conclusion, a scan of Monterey Bay Region housing inventories reveals some
30 housing facilities restricted for occupancy by both year-round, permanent
and seasonal, migrant farmworkers. Additionally, there are even more properties
that are publicly-subsidized and regulated for low-income occupancy. Over 40
percent of the farmworker housing inventory, however, is relatively old and will
likely need capital improvements in the coming years.
That said, this analysis also demonstrates that the pace of farmworker housing
production in the Monterey Bay Region has greatly slowed compared to the
previous decade of the 2000s. The great majority of farmworkers in the Pajaro-
Salinas Laborshed do not live in accommodations set aside for farmworkers, but
in the private market, often in unaffordable, substandard, and overcrowded
conditions. Consequently, there is a continuing need for production of new
housing for the region’s farmworker families and migrant and guest workers.
Site Suitability
Executive Summary
Expanding permanent affordable farmworker housing requires a confluence of
appropriate conditions that enable a developer to successfully obtain financing
to implement the project and programs.
With the demise of Redevelopment funds, the primary financial resources
currently available to affordable housing developers are the California Low-
Income Housing Tax Credit (LIHTC) and Affordable Housing and Sustainable
Communities (AHSC) programs. Nearly all affordable housing developed in the
state relies on one of these two programs. For this reason, these program
standards have been used here as a framework by which to explore site
suitability for farmworker housing development.
The applications, guidelines, and methodologies used in these programs are
rapidly being adopted for use in other state housing finance programs and
have garnered national attention as a model of best practice. Furthermore, the
Salinas Valley and Pajaro Valley have additional competitiveness in these
programs because the tax credit program provides for a farmworker housing
set-aside and both programs also provide rural set-asides. Other considerations
for the identification of ideal sites for the development of affordable housing
projects are also discussed, specifically, the preservation of agricultural land, infill
64 | P a g e
Farmworker Housing Study and Action Plan for Salinas Valley and Pajaro Valley -
Final June 2018
development, infrastructure and services, proximity to current populations, and
other environmental considerations.
The LIHTC and AHSC programs require – through threshold project eligibility and
scoring incentives – that project sites are within strict proximities to specific
resources. Project sites meeting these proximity requirements are considered
‘high-amenity’ and are ultimately most competitive for these funding programs.
Applying preliminary analysis, high amenity parcels within the study area have
been identified. Zoning data has been overlaid on many high amenity parcels
to determine the extent that these sites are appropriately zoned for affordable
housing development.
Using this process, the key findings presented are:
Ten communities within the study area qualify as ‘rural’ and are eligible to
compete for funding under the rural set-asides in LIHTC and AHSC.
Of these ‘rural’ communities, five (5) have parcels that are considered
‘high amenity’ under the current funding requirements of LIHTC and
AHSC.
A total of 2,495 ‘high amenity’ parcels may be identified within these five
(5) communities.
Although there are numerous parcels that meet TCAC and AHSC proximity
requirements and that qualify for rural set-asides, some of these are not currently
identified and targeted for multi-family or mixed-use development under the
local zoning ordinance. Some sites zoned for multi-family or mixed-use
development will not be competitive under these primary funding programs
because they are not proximate to one or more amenities. Under these funding
programs, especially tax credits, and to a lesser extent AHSC, project sites must
garner full maximum points allowable to be competitive.
It should be noted that the differentiation between high amenity sites and sites
with one or more amenities can be very slight. The scoring criteria for each
program should be examined in total. And, although communities may lack
high amenity sites it does not mean that parcels within those communities lack
amenities and/or cannot strategize to compete for LIHTC or AHSC.
The study area is well-situated to increase the number of high amenity parcels
with the requisite zoning by:
Examining existing land use and zoning policies and aligning them with
the TCAC and AHSC proximity requirements.

65 | P a g e
Farmworker Housing Study and Action Plan for Salinas Valley and Pajaro Valley -
Final June 2018
Increasing collaboration amongst affordable housing developers and
municipalities to identify specific parcels that are high amenity or close to
high amenity and examine the opportunities to reduce development
barriers or increase amenities.
Focusing transit investment in rural communities – through transit agencies,
in private contracts, or project-specific -- to increase the number of high
amenity parcels and increase the competitiveness of sites within these
communities.
Including the consideration of TCAC and AHSC proximity requirements in
the region’s comprehensive and integrated planning processes such as
AMBAG’s 2040 Sustainable Communities Strategy and in Housing Element
site identification.
As new state funding becomes available or the region develops new funding
mechanisms for affordable housing, it is important that local jurisdictions work
together to map out suitable sites for farmworker housing. Some of these sites
may not always correlate with TCAC and AHSC criteria but may offer other
advantages to be appropriate for farmworker housing.
A significant barrier expressed by the region’s cities is the lack of available land.
Unincorporated counties are also challenged by the lack of infrastructure.
However, these obstacles could be overcome through city/county
collaboration and establishment of agreements that allow for housing
development on unincorporated county land that is contiguous to a city and
permitted to connect to city infrastructure. This is an example of a win/win
solution that could significantly expand the number of suitable site for
farmworker housing.
Introduction
There is a significant unmet need for housing in California’s coastal communities.
For farmworkers living in Monterey and Santa Cruz Counties, housing has been
especially difficult. According to the numbers cited in the General Plans and
Housing Elements of Santa Cruz and Monterey Counties, there are
approximately 61,500 farmworkers in Santa Cruz and Monterey Counties --
32,872 in Monterey County and 16,705 in Santa Cruz County53.
53 USDA AgCensus 2012. Historically, the farmworker population has been undercounted in the
decennial count. Although the Census reports that overall Census has an undercount of 0.01%,
the undercount for the Hispanic population is approximately 1.5%.

66 | P a g e
Farmworker Housing Study and Action Plan for Salinas Valley and Pajaro Valley -
Final June 2018
The need for additional development of affordable workforce housing is well
documented in the Housing Elements of Monterey and Santa Cruz Counties
(plus the Housing Elements of local jurisdictions). The need for affordable
farmworker housing is exacerbated by the restricted earning power of
farmworkers juxtaposed against the high-cost of housing in the Salinas-Pajaro
study area.
The future development of subsidized housing that is permanently affordable
(deed restricted) for farmworkers and owned/operated by nonprofit housing
developers is constrained by limited sources of available financing. Since
Governor Brown’s elimination of the California’s Redevelopment Program and
the eradication of regional Redevelopment Agencies, the primary sources of
financing for affordable housing in California are Low-Income Housing Tax
Credits (LIHTC) and, to some extent, the newly created, Cap and Trade
program – specifically, Affordable Housing and Sustainable Communities
(AHSC), implemented in 2012 and in their third round of funding. Nearly all
affordable housing developed in the state relies on one of these two programs.
Because these are the primary financing sources available in California and
because these programs are used as a model for other California housing
financing programs, they are explored in greater detail in this report.
Other sections of this report provide further context for site selection and
suitability by also reviewing demographic data to assess where housing might
be located based on where agricultural workers are currently living, how far
they are travelling to work, and the mode of travel they use. Consideration will
also be given to critical site characteristics such as:
The Preservation of Agricultural Land
Infill Development
Infrastructure and Services
Proximity to Current Populations
Environmental Considerations
The purpose of presenting this examination of site suitability criteria is to identify
ideal parcels and areas that have the potential to provide access to resources
and a rich quality of life for residents and will be most competitive for the
primary state and federal sources of financing currently available for the
development of affordable housing.
The emphasis here is placed on permanent multi-family affordable housing units
for rent, but this does not discount the need for strategies regarding

67 | P a g e
Farmworker Housing Study and Action Plan for Salinas Valley and Pajaro Valley -
Final June 2018
opportunities for home ownership or temporary (seasonal) farmworker housing.
The focus on permanent multi-family housing is driven by the local development
constraints54 that curtail residential development and funding requirements that
favor multi-family housing.
Low-Income Housing Tax Credits and the Affordable Housing and Sustainable
Communities Program
This section of the study is intended to provide deeper insight into the prospect
of developing affordable housing for the farmworker population based on site
eligibility requirements under the Low-Income Housing Tax Credits (LIHTC) and
the Affordable Housing and Sustainable Communities Program (AHSC). The
LIHTC program is administered by the California Tax Credit Allocation
Committee (CTCAC) and the AHSC Program is administered by the Strategic
Growth Council (SGC)55 see the chapter on funding for more details about
these programs.
Most farmworker housing in the area, all the projects included in the case studies
presented, and most affordable housing developed across the state use LIHTC
as the primary financing component. Despite changes in federal tax legislation
that may affect the value of tax credits, or the use of other federal housing
finance programs, Low Income Housing Tax Credits – either 9% or 4% -- are often
the central financing component in California’s affordable housing projects.
Although AHSC is a relatively new program, many communities are looking to
this program as a potential resource not only for affordable and farmworker
housing, but also for the development of critical transportation services and
transportation infrastructure.
The applications, guidelines, and methodologies used in these programs are
rapidly being adopted for use in other state housing finance programs and
have garnered national attention as a model of best practice. For example,
California’s Veterans Housing and Homelessness Prevention (VHHP)56, Infill
54 Mac Taylor. California’s High Housing Costs: Causes and Consequences. Legislative Analyst’s
Office. State of California. March 2015. Page 19. 55 SB 732 established the Strategic Growth Council (SGC) in 2008. The SGC is composed of
agency secretaries from the Business Transportation and Housing Agency, the California Health
and Human Services Agency, California Environmental Protection Agency, the California Natural
Resources Agency, the director of the Governor's Office of Planning and Research, and a public
member, appointed by the Governor. 56 http://www.hcd.ca.gov/grants-funding/active-
funding/vhhp/docs/VHHP_Round_4_Proposed_Guidelines.pdf

68 | P a g e
Farmworker Housing Study and Action Plan for Salinas Valley and Pajaro Valley -
Final June 2018
Infrastructure Grant (IIG)57, Section 811 Project Rental Assistance58, and No Place
Like Home (NPLH)59 programs all have varying levels of proximity requirements
demonstrating the project’s location in relation to key amenities, commercial
and employment centers, and transportation.
Isolating affordable housing in remote pockets of communities is no longer best
practice. Aside from general Affirmatively Furthering Fair Housing goals and
laws, immediate proximity to resources and availability of transportation options
that facilitate greater access to other opportunities is critical to providing the
best possible quality of life for residents of affordable housing.
Furthermore, the tax credit program provides for a farmworker housing set-aside
and both programs also provide rural set-asides. Communities in the study areas
qualify for these set-asides and so have additional competitiveness in these
programs and engagement in these programs should be prioritized.
As of January 2018, there are currently $2.689 million in Farmworker Assistance
Tax Credits.60 These tax credits are allocated on a first-come, first-serve
basis. Historically, these tax credits have been undersubscribed, with an annual
allocation of $500,000 that rolls over if unused. Most applications for these
farmworker credits will be matched with the use of 4% federal tax credits61. In
applications using 4 percent or Farmworker Tax Credits, the rural set-asides play
no role in these applications. Applicants are still able to apply for additional 9
percent credits, but this may not offer any true benefit because farmworker
credits hold the same value and operate in essentially the same way as the
standard 9 percent state credits. As this chapter moves further into eligible
areas, it will be important to remember that farmworker credits are not limited to
rural areas.62
The AHSC Program is administered by the State of California Strategic Growth
Council (SGC). SGC coordinates with the California Air Resources Board (ARB) to
ensure that each project will meet the investment goals of AB 35 and SB 535
57 http://www.hcd.ca.gov/grants-funding/nofas/docs/IIG-Guidelines-10.2.2017-FINAL.pdf 58 http://www.calhfa.ca.gov/multifamily/section811/nofa/round-II/1-round-II-nofa.pdf 59 http://www.hcd.ca.gov/grants-funding/active-funding/docs/NPLHGuidelines082519-v1.pdf 60 Personal correspondence with Mark Stivers, Executive Director, California TCAC. January 2018. 61 According to the Local Initiatives Support Corporation (LISC) an organization heavily involved
in tax credit projects, and analysis of the 2017 tax reform bill, tax credits will still be available
albeit at discounted rates due to the reduction of the corporate tax rate. 62 California Code of Regulations, Title 4, Division 17, Chapter 1. California Tax Credit Allocation
Committee Regulations Implementing the Federal and State Low Income Housing Tax Credits
Laws. December 2017. Section 10317: Page 14.

69 | P a g e
Farmworker Housing Study and Action Plan for Salinas Valley and Pajaro Valley -
Final June 2018
(Chapter 830, Statutes 2012) and AB 1550 requirements to maximize benefits to
Disadvantaged and Low-Income Communities.63
Under AHSC, applicants must demonstrate how the project will reduce
greenhouse gas emissions, primarily through the reduction of vehicle miles
traveled. Projects are usually complex and include a mix of project elements
that may include affordable housing development, substantial transportation
components, extensive collaboration between developers and local
government, deep community engagement, and robust community benefits.
Both AHSC and LIHTC have extensive application processes, high thresholds,
strict amenity requirements, and comprehensive planning and engagement
protocols that developers must meet to be awarded. Because these programs’
application processes are so labor intensive, and funds are so limited, these
programs are highly competitive. Only the very top scoring projects are funded
– with many award decisions coming down to a rigorous tie-breaker process.
Fortunately, for rural California, these programs also provide funding set-asides
and priority targeting for projects located in areas defined as rural by the State
of California. As mentioned previously, because of these factors, affordable
housing projects in the Salinas Pajaro study area would be more competitive in
the rural set-aside than they would otherwise be competing in the open
competitive process for statewide applications that includes the Los Angeles
and the Bay Area regions.
The goal of this section of the report is to summarily describe which areas
affordable housing developers should focus on to score well within the
competitive process using a combination of geospatial analysis measuring the
proximity of candidate sites within the data set. For locations where data sets
were not available, a more general analysis has been taken.
Identification of Eligible Areas that Qualify for Financing under AHSC
and LIHTC
This section describes the thresholds and scoring criteria necessary to compete
effectively for two current state funding resources, the Affordable Housing and
Sustainable Communities program and the Low-Income Housing Tax Credit
program.
63 Affordable Housing and Sustainable Communities Program: FY 2016-2017 Program Guidelines.
State of California Strategic Growth Council. Page 4. 2017.

70 | P a g e
Farmworker Housing Study and Action Plan for Salinas Valley and Pajaro Valley -
Final June 2018
Rural and Farmworker Housing Funding Set-Asides
The AHSC program has a ten percent (10%) set-aside for projects in rural areas.
TCAC provides a twenty percent (20%) set-aside of all annual nine percent (9%)
federal credits for projects in rural areas. Both programs determine rural eligibility
under Revenue and Taxation Code 23610.5(j)(5) and Health and Safety Code
50199.20. (See Appendix A: TCAC Rural Methodology). There are three (3)
methodologies for determining a project’s rural status for TCAC and AHSC
applications.64
The Definition of Rural
According to the Memorandum, Methodology for Determining Rural Status of
Project Site for 2018 Applications, published annually by TCAC, dated January
19, 2018:
“Section 50199.21 of the Health and Safety Code defines ‘rural area’ as an area
that satisfies one of three criteria on January 1 of any calendar year.”65 A
project competing in the rural set-aside must demonstrate that the project area
is rural under one of the three methodologies listed under Section 50199.21 of
the Health and Safety Code and detailed in this memo:
1. Non-metropolitan Counties;
2. Rural Housing Service (RHS) Eligible Area; or
3. “Small City Status.”
Identification of Eligible “Rural” Areas in the Study Area
In applying the rural community ‘test’ to the study area of Santa Cruz and
Monterey Counties, the following are the results:
Methodology 1: Non-metropolitan Counties
21 of California’s 58 counties are considered non-metropolitan. Santa Cruz
County and Monterey County do not qualify as non-metropolitan counties.
Methodology 2: Rural Housing Service (RHS) Eligible Area
64 Memorandum. California Tax Credit Allocation Committee. January 19, 2018. 65 Memorandum. California Tax Credit Allocation Committee. January 19, 2018.

71 | P a g e
Farmworker Housing Study and Action Plan for Salinas Valley and Pajaro Valley -
Final June 2018
The following areas in Santa Cruz County and Monterey County are listed as
“Designated Places for Section 515 New Construction Applications” designating
them as a “RHS Eligible Area” by the U.S. Department of Agriculture.
RHS Eligible Areas in Santa Cruz County
The Pajaro Valley area in Santa Cruz County extends north from the southern
Santa Cruz County line to the northern boundary of the Pajaro Valley Water
District. The following areas are considered RHS Eligible Areas by TCAC (of these
three, only Watsonville is in the study area):
1. Ben Lomond (not in study area)
2. Felton (not in study area)
3. Watsonville
RHS Eligible Areas in Monterey County
The Salinas Valley area of Monterey County extends from the Santa Cruz County
boundary in the north south through the Salinas Valley and includes the
following areas (All seven (7) locations are included in the study area):
1. Castroville
2. Chualar
3. Gonzales66
4. Las Lomas
5. Salinas
6. San Lucas
7. Soledad67
Methodology 3: Small City Status
This third methodology is more involved as this process attempts to reconcile the
presence of rural areas in counties that are not designated rural in Step 1 and
do not qualify under Step 2. The process for “rural” determination is as follows:
“A project area may be rural under the Small City Status methodology, provided
that both of the following conditions are met:
1) The project is in an incorporated city having a population of 40,000 or less, or
in an unincorporated area which adjoins a city having a population of 40,000 or
less. The city’s latest population estimate in California Department of Finance
66 Identified as eligible high-need communities for rural rental housing from the FY 2011/2012
Annual Plan supplement to the State of CA, 2010-2015 Consolidated Plan. 67 Identified as eligible high-need communities for rural rental housing from the FY 2011/2012
Annual Plan supplement to the State of CA, 2010-2015 Consolidated Plan.

72 | P a g e
Farmworker Housing Study and Action Plan for Salinas Valley and Pajaro Valley -
Final June 2018
Report E-1: 2016 Population Estimates (“DOF 2016 Population Estimates”), is
included in Exhibit C of this memo. AND
2) The project’s census tract is not designated as an “urbanized area.” Refer to
the 2010 Census Data located at the American FactFinder at the U.S. Census
Bureau website to determine whether a census tract is rural or urbanized. Note: a
census tract designated as either “rural” or “inside urban clusters” is considered
rural. A census tract designated as “inside urbanized area” is not considered
rural.”68
This analysis is done at the census tract level based on the characteristics of
each block within that census tract. As a result, rural determination of a project
area often cannot be accomplished until the project site is determined.
In the Pajaro Valley area of the Santa Cruz County study area, there are no
areas that qualify under Methodology 3.
In Monterey County’s Salinas Valley, potential locations that may include rural
designations under Methodology 3 are:
1. Greenfield
2. King City
Summary of “Rural” Locations within the Salinas Pajaro Valley Study Area
The application of the TCAC rural methodology to the Salinas Pajaro Valley
region indicates that there are ten (10) locales where projects could potentially
apply under the rural set-aside in the LIHTC and AHSC programs. Table 14: TCAC
Methodology for Determining Rural Status and Funding Eligibly lists these
locations. It should be highlighted that Greenfield and King City may include
rural designations, depending on the specific project site.
TABLE 14: TCAC METHODOLOGY FOR DETERMINING RURAL STATUS AND FUNDING ELIGIBILITY
TCAC Methodology for Determining Rural Status
Rural
Santa Cruz County
Watsonville
Monterey County
Castroville
Chualar
Gonzales
Los Lomas
68 Memorandum. California Tax Credit Allocation Committee. January 18, 2017.
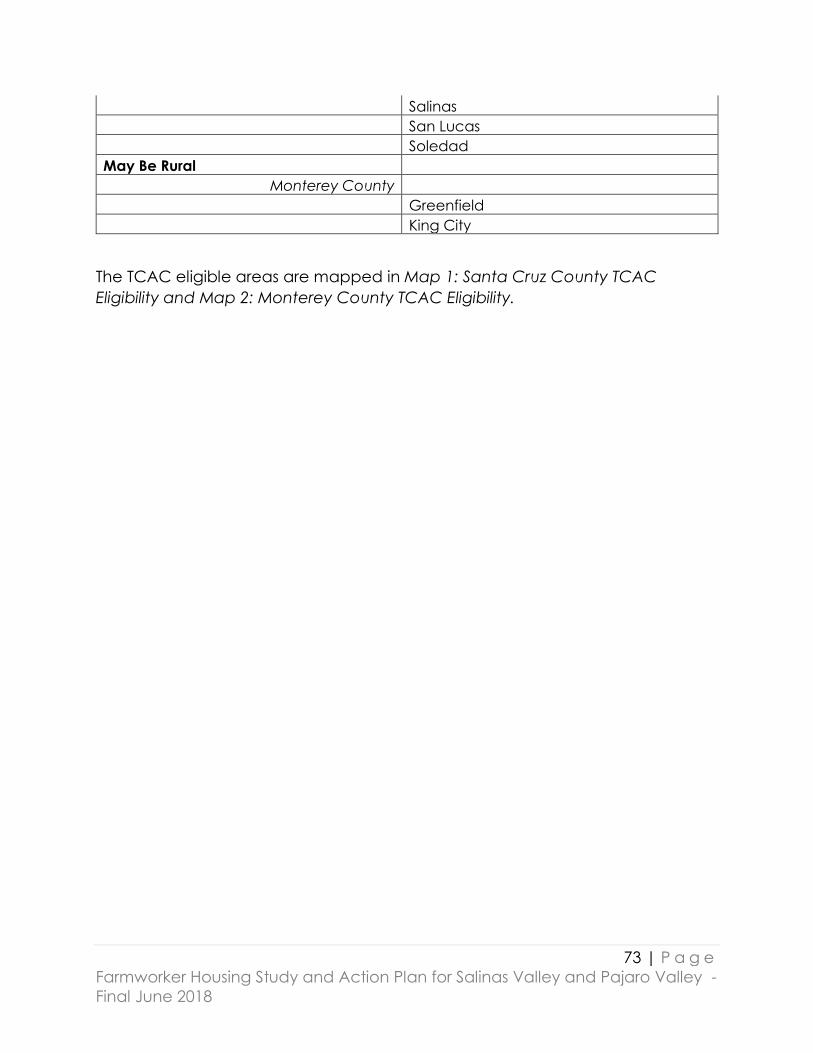
73 | P a g e
Farmworker Housing Study and Action Plan for Salinas Valley and Pajaro Valley -
Final June 2018
Salinas
San Lucas
Soledad
May Be Rural
Monterey County
Greenfield
King City
The TCAC eligible areas are mapped in Map 1: Santa Cruz County TCAC
Eligibility and Map 2: Monterey County TCAC Eligibility.

74 | P a g e
Farmworker Housing Study and Action Plan for Salinas Valley and Pajaro Valley -
Final June 2018
MA
P 1
: SA
NTA
CR
UZ C
OU
NTY
ELIG
IBILITY
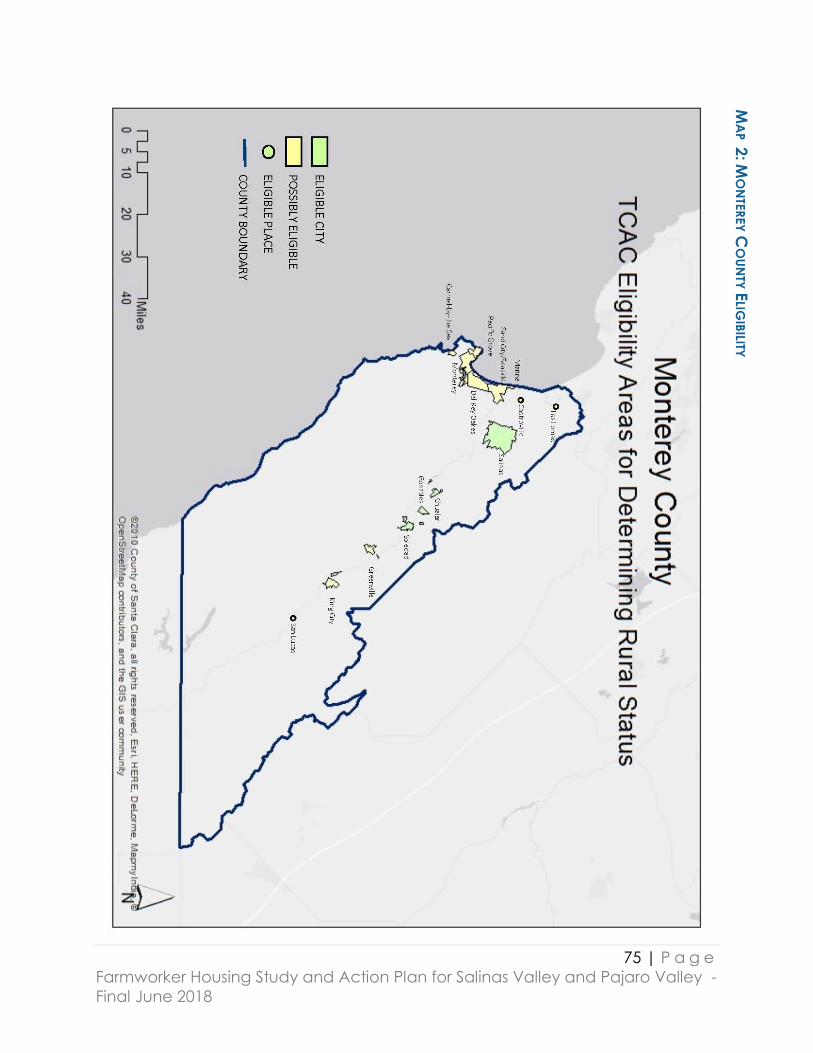
75 | P a g e
Farmworker Housing Study and Action Plan for Salinas Valley and Pajaro Valley -
Final June 2018
MA
P 2
: MO
NTE
REY
CO
UN
TY E
LIGIB
ILITY

76 | P a g e
Farmworker Housing Study and Action Plan for Salinas Valley and Pajaro Valley -
Final June 2018
Specific Site Suitability Criteria for Determining Project Sites
TCAC Proximity Requirements
The following tables, Table 15: TCAC Proximity Requirements – Transit Amenities
and Table 16: TCAC Proximity Requirements – Other Amenities, show the
maximum distance that a resource must be located in relation to the project site
as well as the points garnered for meeting these proximity requirements under
the TCAC LIHTC application.
TABLE 15 TCAC PROXIMITY REQUIREMENTS -- TRANSIT AMENITIES, MAXIMUM POINTS IN EACH
CATEGORY
TCAC Proximity Requirements
Transit Amenities
Description Distance Points
Bus Rapid Transit, Light Rail Station, Commuter Rail Station, Ferry
Terminal, Bus Station, or Public Bus Stop; 30 minute headways (or
at least two departures during each peak period for a commuter
rail station or ferry terminal); Monday through Friday; Density
greater than 25 units per acre 1/3 Mile 7
Bus Rapid Transit, Light Rail Station, Commuter Rail Station, Ferry
Terminal, Bus Station, or Public Bus Stop; 30 minute headways (or
at least two departures during each peak period for a commuter
rail station or ferry terminal); Monday through Friday 1/3 Mile 6
Bus Rapid Transit, Light Rail Station, Commuter Rail Station, Ferry
Terminal, Bus Station, or Public Bus Stop; 30 minute headways (or
at least two departures during each peak period for a commuter
rail station or ferry terminal); Monday through Friday 1/2 Mile 5
Bus Rapid Transit, Light Rail Station, Commuter Rail Station, Ferry
Terminal, Bus Station, or Public Bus Stop (For rural set-aside
projects, full points may be awarded where van or dial-a-ride
service is provided to tenants, if costs of obtaining and
maintaining the van and its service are included in the budget and
the operating schedule is either on demand by tenants or a
regular schedule is provided) 1/3 Mile 4
Bus Rapid Transit, Light Rail Station, Commuter Rail Station, Ferry
Terminal, Bus Station, or Public Bus Stop 1/2 Mile 3
In addition to one of the above:
Transit Passes: One per Low-Income Unit 3
Transit Passes: One per each 2 Low-Incomte Unit 2
Source: 2017 CTCAC Program Guidelines

77 | P a g e
Farmworker Housing Study and Action Plan for Salinas Valley and Pajaro Valley -
Final June 2018
TABLE 16: TCAC PROXIMITY REQUIREMENTS - OTHER AMENITIES – MAXIMUM POINTS IN EACH CATEGORY
TCAC Proximity Requirements
Other Amenities
Urban Rural
Public Park 1/2 Mile 1 Mile 3
3/4 Mile 1.5 Miles 2
Library 1/2 Mile 1 Mile 3
1 Mile 2 Miles 2
Grocery
25,000 SF+ 1/2 Mile 1 Mile 5
1 Mile 2 Miles 4
2 Mile 3 Miles 3
5,000 SF+ 1/4 Mile 1/2 Mile 4
1/2 Mile 1 Mile 3
Weekly Farmers Market 1/2 Mile 2
1 Mile 1
Medical Clinic
Qualifying Provider 40+ Hours Per Week; Medi-Cal/Medicare1/2 Mile 1 Mile 3
1 Mile 1.5 Miles 2
Pharmacy 1/2 Mile 1 Mile 2
1 Mile 2 Miles 1
Source: 2017 CTCAC Program Guidelines
Distance
PointsDescription
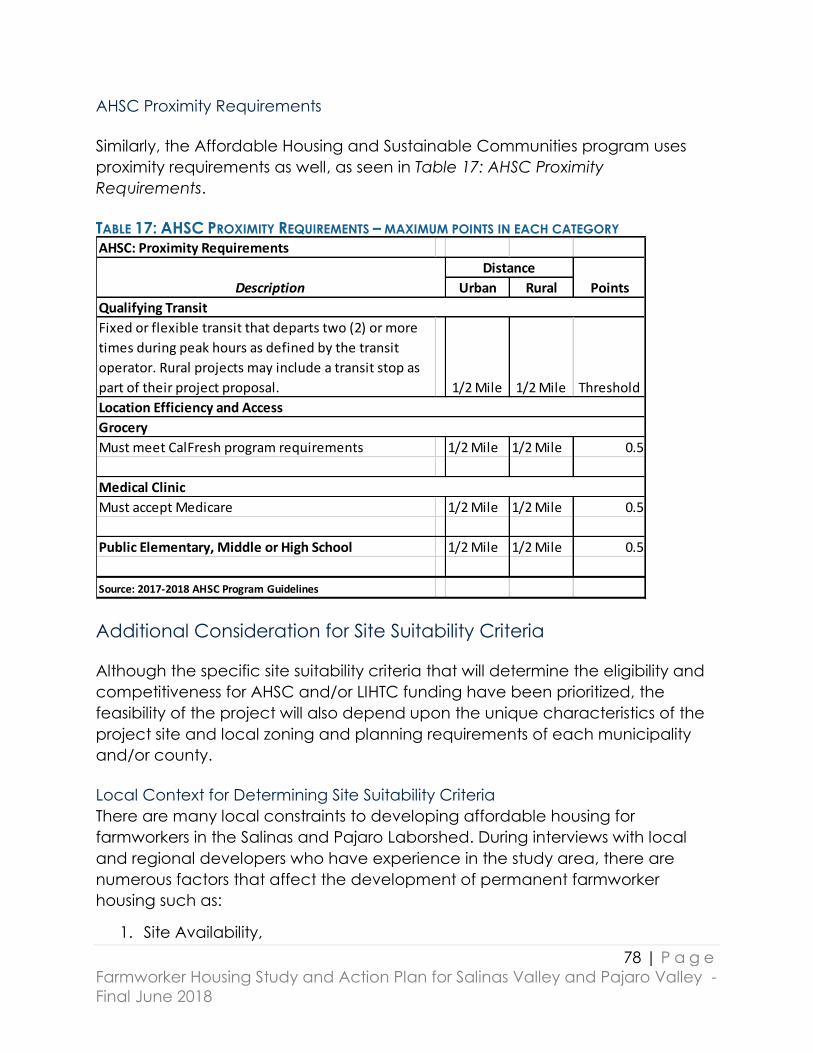
78 | P a g e
Farmworker Housing Study and Action Plan for Salinas Valley and Pajaro Valley -
Final June 2018
AHSC Proximity Requirements
Similarly, the Affordable Housing and Sustainable Communities program uses
proximity requirements as well, as seen in Table 17: AHSC Proximity
Requirements.
TABLE 17: AHSC PROXIMITY REQUIREMENTS – MAXIMUM POINTS IN EACH CATEGORY
Additional Consideration for Site Suitability Criteria
Although the specific site suitability criteria that will determine the eligibility and
competitiveness for AHSC and/or LIHTC funding have been prioritized, the
feasibility of the project will also depend upon the unique characteristics of the
project site and local zoning and planning requirements of each municipality
and/or county.
Local Context for Determining Site Suitability Criteria
There are many local constraints to developing affordable housing for
farmworkers in the Salinas and Pajaro Laborshed. During interviews with local
and regional developers who have experience in the study area, there are
numerous factors that affect the development of permanent farmworker
housing such as:
1. Site Availability,
AHSC: Proximity Requirements
Urban Rural
Fixed or flexible transit that departs two (2) or more
times during peak hours as defined by the transit
operator. Rural projects may include a transit stop as
part of their project proposal. 1/2 Mile 1/2 Mile Threshold
Must meet CalFresh program requirements 1/2 Mile 1/2 Mile 0.5
Must accept Medicare 1/2 Mile 1/2 Mile 0.5
Public Elementary, Middle or High School 1/2 Mile 1/2 Mile 0.5
Source: 2017-2018 AHSC Program Guidelines
Grocery
Medical Clinic
Description
Distance
Points
Qualifying Transit
Location Efficiency and Access
79 | P a g e
Farmworker Housing Study and Action Plan for Salinas Valley and Pajaro Valley -
Final June 2018
2. Site Affordability, and
3. Cost of Construction (including labor).
Site Availability
To be economically feasible, developers of affordable housing typically require
a standard of at least 30 units per development, but usually 40 units and even 60
units is preferred. Potential sites must be large enough to accommodate the
necessary units within the context of zoning requirements like:
1. Minimum Site Area,
2. Minimum Lot Size,
3. Minimum Area per Dwelling Unit,
4. Minimum Site Setbacks,
5. Parking Standards,
6. Density Requirements,
7. Maximum Building Height.
There may be additional standards and requirements necessary that require the
project to conform to planning and zoning regulations specific to multifamily
housing and/or affordable housing requirements. While density bonuses are
available, the additional units afforded to the developer may not be sufficient
to meet the target number of units, or the revenue needed to close the
“funding gap”69 for economic feasibility.
For example, in June of 2007, Santa Cruz County rezoned a total of 26.5 acres to
accommodate lower income housing needs at the state-established default
density of 20 units per acre. Although, this ‘higher’ density may assist in a tax
credit application, it would not be as competitive in an AHSC competition
where even higher density projects – sometimes up to 80 units/acre in urban
areas, and over 30 units/acre in some rural communities -- are rewarded under
the scoring methodology.
Agricultural employers seeking to provide privately-sponsored workforce housing
may need to locate a minimum of three acres to accommodate the
development of a minimum of 60 units in a multi-family project. In 2015-16, as an
example, one employer could find no suitable sites of this size within the City of
Salinas.
69 A funding gap is the amount of money needed to fund the ongoing operations or future development of an affordable housing project that is not currently provided by cash, equity or debt. The funding gap is created when subsidized rents do not generate sufficient income to cover the long term annual expenses associated with the project.

80 | P a g e
Farmworker Housing Study and Action Plan for Salinas Valley and Pajaro Valley -
Final June 2018
Site Affordability
Santa Cruz and Monterey Counties have some of the most expensive real estate
in California. The utilization of undeveloped land for multifamily residential
projects competes with other commercial uses. Developers of affordable
housing compete with other developers for residential and other commercial
parcels that could otherwise be used for multi-family housing projects.
In situations where developers or communities look to rezone commercial land
for multifamily residential use, cost may be prohibitive. The affordability of a
given parcel can be a simple issue of supply and demand. In a March 2015
report commissioned by the State of California Legislative Analyst’s Office,
residential land in the average U.S. metropolitan area was around $20,000 per
acre, compared to over $150,000 in California’s coastal metros.70 In a recent
survey on loopnet.com (a real estate listing tool) there was only one residentially
zoned vacant property listed for sale in the study area -- a 7.67-acre lot for $1.7
million dollars. An examination of the listing indicated that the 7.67-acre lot in
Salinas is still in the process of gaining entitlements to do multi-family housing on
site.
Smaller commercially zoned lots are available between $400,000 and $1,000,000
per acre, however, these lots would still need to be rezoned to allow multi-family
housing under the Mixed Use (MX) or Focused Growth zoning designation for the
project to achieve necessary increased density. Depending on the density of
the development, this would equate to $40,000 to $100,000 per residential unit of
land cost alone -- well above the 15 percent industry average for land costs as a
percentage of development cost.71 Rezoning smaller parcels from a
commercial zoning designation to residential or mixed use can be additionally
difficult because commercially zoned property may be seen as more valuable
than residentially zoned property because it has the potential to provide greater
tax revenue for the jurisdiction.
Cost of Construction
Construction costs are about 20 percent more expensive in California than in
the rest of the country.72 Building costs are up nationwide due to labor
shortages, increased costs of building materials (exacerbated by 2017 disasters
such as the hurricanes and Napa fires), and rising cost indices.73 Use of federal
70 State of California. Legislative Analyst’s Office Report. March 2015. Page13. 71 Affordable Housing Cost Study. State of Washington Department of Commerce. September
2009. Page 18. 72 2017 RSMeans. 73 Turner Construction Cost Index, 4Q 2017.
81 | P a g e
Farmworker Housing Study and Action Plan for Salinas Valley and Pajaro Valley -
Final June 2018
funds also triggers Davis-Bacon prevailing wage rates. Numerous studies have
indicated that application of prevailing wage raises construction costs in rural
areas an average of 25 percent.
Local government development fees, such as impact and mitigation fees, not
only directly add to the cost of a project but can also incur additional costs due
to the increased timeline -- as it takes additional time for evaluation and
determination of the applicability of these fees, as well as possible negotiation
of development agreements. In the case that an affordable housing
development may be eligible for fee waivers, those waivers must be justified
and requested according to the local planning process.
The site suitability criteria above provide the initial due diligence required to
determine if a potential affordable housing site meets the threshold for eligibility
for the LIHTC and AHSC programs. These programs are intentionally designed to
present a model for sustainable growth in California and are indicative of the
direction that state funding resources are moving toward regarding the
allocation of funds to affordable housing development projects. Accordingly,
the local and regional Housing Elements required by the state directly and
indirectly seek to align these considerations when these government entities are
evaluating population and employment growth within the context of housing
need. (Further details on planning alignment and site suitability are provided in
the section on the Intersection of Jobs, Housing, and Transit.)
The identification of ideal sites for the development of affordable housing
projects requires additional consideration such as:
Infill Development
The Preservation of Agricultural Land
Infrastructure and Services
Proximity to Current Populations
Environmental Considerations
Infill
To sustainably grow and meet development needs, California promotes and
prioritizes locating projects in areas that are already developed. In so doing, the
AHSC program guidelines require that all projects are located on an “Infill Site” --
defined as a site with 75 percent of the perimeter adjoining parcels that are
currently developed with qualified urban uses.74
74 In order to qualify as an infill site, the site must also be located in an “urbanized area”
meaning that it fulfills one of the following requirements: a. located within an incorporated city

82 | P a g e
Farmworker Housing Study and Action Plan for Salinas Valley and Pajaro Valley -
Final June 2018
Agricultural land can qualify as an infill site through an exemption on sites
located in previously developed areas or locally designated areas that are
anticipated at sites for urban development in the local general plan. Many
municipalities have incorporated higher density allowances into their planning
and zoning ordinances to encourage development on or near these infill sites.
The Preservation of Agricultural Land
Agricultural land is significant to California and specifically to the economies of
Monterey and Santa Cruz counties. The state of California has very strict
regulations regarding the preservation of agricultural lands and largely prohibits
the loss or conversion of agricultural, working lands, and natural resource lands
for other uses. Because of this, AHSC program guidelines require that a project
site must not be designated as agricultural land according to the Department of
Conservation’s Farmland Mapping and Monitoring Program (FMMP) Tool. The
FMMP can be found at https://maps.conservation.ca.gov/DLRP/CIFF/.
Infrastructure and Services
Preliminary site due diligence includes consultation with public utility providers of
water, sewer, electricity, gas, telephone and cable services, and an assessment
of other public services available in the area. Although utilities have a general
‘obligation to serve’ under state regulations, development in more urbanized
areas typically offers the project more access to established utility infrastructure.
Many utilities – especially those in rural or unincorporated areas -- may be at
capacity and there may be substantial additional cost consideration for tie-ins
and expansion of services. Due to the size of the study area the conditions on
the ground need to be examined on a parcel by parcel basis to determine the
situation for each project site.
The consideration of resources such as schools, health services, grocery stores,
farmers markets, and transit are already threshold requirements for LIHTC and
the AHSC Program.75 Additional services to take into consideration include the
proximity and service area of local nonprofit and public partners offering
necessary or beneficial programming such as food security and nutrition
according to an official City or County map, OR b. located within an urbanized area or urban
cluster as defined by the U.S. Census Bureau at http://www.census.gov/2010census/, OR c. for
unincorporated areas outside an urbanized area or urban cluster, the area shall be within a
designated urban service area that is designated in the local general plan for urban
development and is served by public sewer and water. 75 Applications for the AHSC Program may include the proposed addition of transit services that
meet threshold. These can include vanpools specific to the project, not just transit agency fixed
route services. In the future, perhaps they would include Uber-style services, which is being
examined by some cities in the State.
83 | P a g e
Farmworker Housing Study and Action Plan for Salinas Valley and Pajaro Valley -
Final June 2018
support, childcare and preschool, afterschool programming, workforce
development, or behavioral health services and case management.
Proximity to Current Populations
Many farmworker residents and their families have strong reliance on well-
established support networks, have children enrolled in specific schools, or rely
on culturally appropriate services such as health care providers or specialty
markets. New affordable housing developments should strongly consider
locating in areas where there are currently concentrations of agricultural
workers. For example, according to data collected by the survey instrument, 59
percent of the farmworkers surveyed reside in Salinas (Monterey County) and
Watsonville (Santa Cruz County).
Proximity of Employment
Despite the long distances between the various parts of the study area, most
farmworkers travel a relatively short distance to work. The study survey
demonstrates that two - thirds of those surveyed travel less than 25 miles to work,
and three-quarters of respondents report spending 30 minutes or less traveling to
work. This indicates that the concentrations of farmworkers located in locations
such as the Salinas valley cities (Gonzales, Greenfield, King, Salinas, Soledad)
and Watsonville reside relatively close to their place of employment. Therefore, it
may make sense to prioritize development of housing in these locations to
prevent increased travel time for residents.
Environmental Considerations
The evaluation of potential sites for project development will require California
Environmental Quality Act (CEQA) clearance. In many areas of California, but
especially in coastal areas, CEQA may be used by local interest groups to
prevent or stall housing development. Using federal funds will also require the
project to have National Environmental Policy Act (NEPA) clearance. Preliminary
environmental analysis will identify site characteristics that will influence the final
determination of site selection. Urban or urbanized locations that have already
been “disturbed” or environmentally impacted will not only reduce the necessity
for additional mitigation but will also reduce the possibility of litigation that could
render the project infeasible.
High Amenity Parcels As described above in the site suitability criteria, the Tax Credit Allocation
Committee (TCAC) and the Affordable Housing and Sustainable Communities
(AHSC) programs have provided eligibility requirements that a project site must
possess to be considered for tax credit and greenhouse gas reduction funding
for their respective programs.

84 | P a g e
Farmworker Housing Study and Action Plan for Salinas Valley and Pajaro Valley -
Final June 2018
In summary, the TCAC program rural set-aside, proximity requirements include:
Scoring
o Transit
o Library
o Grocery
o Medical Clinic
o Pharmacy
o Public Park
TCAC projects are scored based upon the number and quality of amenities
near the project site. The current scoring regime is provided above in the site
suitability criteria. Applicants may score a maximum of 15 points for amenities, so
it is not necessary for the project site to score well in all amenity categories, but
they should score well in enough categories to receive the maximum amount of
points possible. Historically, successful applicants have all received maximum
amenity points.
In contrast, all amenities in the AHSC program – including in the Rural
Innovations Project Area (RIPA) -- are threshold requirements and include:
Threshold
o Transit
o Grocery
o Medical Clinic
o School
It should be noted that, under the RIPA set-aside of the AHSC program, an
applicant may choose to include the development of qualifying transit as a
component of their project proposal and funding request. The timing of the
AHSC Notification of Funding Availability (NOFA) and subsequent award,
closing, and groundbreaking dates have intentionally been designed to require
an applicant to receive funding under either AHSC or the 9 percent tax credit,
but never both together. AHSC is often used in conjunction with 4 percent tax
credits. Historically, 9 percent tax credits have been utilized to fund permanent
affordable farmworker housing statewide, and the feasibility of utilizing 4
percent tax credits will have to be determined by the project developers based
upon other funding sources.

85 | P a g e
Farmworker Housing Study and Action Plan for Salinas Valley and Pajaro Valley -
Final June 2018
Using publicly available and proprietary data76, some TCAC and AHSC eligible
parcels have been identified based on the proximity requirements stated in their
current regulations. As stated earlier, the assumption is that these sites will be
competing in the rural set-asides for each program as defined under the shared
TCAC methodology.
Provided in Appendix 1 are two sets of illustrative maps -- the first set identifies
some individual parcels that meet proximity requirements for TCAC eligibility for
the rural set-aside, and the second set identifies individual parcels that meet
proximity requirements for the AHSC rural set-aside and project area. These
maps are intended to provide an overview of the some of the parcels currently
eligible under the current program requirements. For each specific community,
some of the “high amenity” parcels that are properly zoned for multi-family
housing development have been identified. The maps will be refined further by
local jurisdicitons. Program requirements are continually updated by TCAC and
SGC, these maps were prepared according to the current published program
regulations.
The Intersection of Housing, Employment, and Transit
Executive Summary
California Senate Bill 375 requires the integration of housing and regional
transportation planning to engage communities in meeting the state’s
environmental goals. The regional planning association, Association of Monterey
Bay Area Governments (AMBAG), has been tasked with authoring the Regional
Housing Needs Allocation Plan (RHNA), the Metropolitan Transportation Plan
(MTP) and subsequent Sustainable Communities Strategy (SCS). Together, these
plans forecast future growth and present a comprehensive plan of action for
transit investment in the region.
The MTP/SCS elucidates clear and concise goals for transit improvement as well
as performance measures that consider how these transit investments impact
Social Equity and Environmental Justice, Healthy Communities, Environment,
Economic Vitality and Access and Mobility.
76 The proprietary information was obtained under license with Policy Map.
86 | P a g e
Farmworker Housing Study and Action Plan for Salinas Valley and Pajaro Valley -
Final June 2018
Agricultural employment and production affect each of these planning
processes in both subtle and dramatic ways. The Salinas Pajaro Agricultural
Workers Housing Survey (SPAWHS) collected data specific to the housing,
employment, and transit characteristic of the farmworkers revealing that:
• Farmworkers are concentrated in incorporated areas with most of the
survey respondents living in Salinas and Watsonville, and the remainder
residing primarily in incorporated and unincorporated locales along
the 101-corridor in the study area.
• Most farmworkers live near their place of employment and experience
commute times that are in line with the average commute times of the
general population.
• Single vehicles are the primary mode of travel utilized by farmworkers,
with a small percentage using vanpools or accessing public transit.
These findings have significant implications for where housing should be
developed to serve this population and where transit investment should be
focused to meet goals for increased access to public transportation. Further,
transit investments that are aligned with the needs of the agricultural sector
employees will support the performance measures of the SCS and facilitate
funding opportunities that are increasingly targeting transit-oriented
development.
This report concludes that the study area is well-positioned to make the most of
available resources through transit-oriented development in both urban and
rural areas to provide housing and transportation resources to farmworkers in the
region. To effectively prepare for the development of affordable housing for
farmworkers, the region should continue a concerted effort to increase
collaboration amongst affordable housing developers, municipalities, and
employers. Current planning efforts and goal setting have been considerable
and can be leveraged to access affordable housing and transit funding
opportunities.
Introduction
As communities plan for the future, the relationship between housing and
transportation is becoming increasingly critical — especially when considering
how best to meet the complex needs of farmworkers and their families. How
people get to and from work, home, and other resources must be taken into
account for sustainable housing and community planning.
87 | P a g e
Farmworker Housing Study and Action Plan for Salinas Valley and Pajaro Valley -
Final June 2018
Furthermore, the State of California has intentionally integrated transportation
planning and development into affordable housing programs and priorities –
requiring more holistic development planning and increasingly linking housing
resources to transportation components. This can be seen most clearly in transit
amenity requirements of the Low-Income Housing Tax Credit (LIHTC) program,
and the newly developed Affordable Housing and Sustainable Communities
(AHSC) program. This section examines current planning efforts, regional
transportation infrastructure, farmworker needs, and employment data to assess
how best to include transit-oriented development as a critical part of an overall
affordable housing strategy.
Any regional strategy addressing affordable housing will heavily rely upon the
Sustainable Communities Strategy (SCS) as required under SB 375, the
Sustainable Communities and Climate Protection Act of 2008. Under SB 375,
regional governments, in the form of a Metropolitan Planning Organization
(MPO) or similar entity, are required to produce a regional SCS. The MPO for
Monterey and Santa Cruz Counties is the Association of Monterey Bay Area
Governments (AMBAG), which also includes San Benito County. A twenty-four
member Board of Directors comprised of elected officials from each City and
County within the region governs AMBAG.
To better incentivize and enforce this planning requirement, a region must have
a compliant SCS to remain eligible for federal transportation funding via the
state. AMBAG has developed the SCS as a part of the published 2035
Metropolitan Transportation Plan (MTP).77 The 2035 MTP includes a thorough
assessment of the region’s transportation planning efforts and highlights
implementation strategies that have measurable indices.
AMBAG paid particular attention to the rural areas of the AMBAG region by
undertaking a focused study of transportation alternatives in rural areas to help
establish transportation strategies and projects that are coordinated with land
use policies and economic development strategies helping to implement the
2035 MTP/SCS. The “Transportation Alternatives for Rural Areas – A Regional
Study” of April 2017 presents the findings of the Rural Alternative Transportation
Assessment. Rural Study Areas were identified in the following way:
77 Under the Sustainable Communities Act, ARB sets regional targets for GHG emissions reductions from passenger
vehicle use. In 2010, ARB established these targets for 2020 and 2035 for each region covered by one of the
State's metropolitan planning organizations (MPO). ARB will periodically review and update the targets, as needed. The
sustainable communities strategy supports the State of California’s greenhouse gas (GHG) emissions reductions under SB
375. Link to AMBAG 2015 MTP: http://ambag.org/programs-services/planning/metro-transport-plan.
88 | P a g e
Farmworker Housing Study and Action Plan for Salinas Valley and Pajaro Valley -
Final June 2018
Monterey 1 (Pajaro, Los Lomas, Elkhorn, Prunedale, Castroville, Moss
Landing, Boronda),
Monterey 2 (Chaular, Gonzales, Soledad, Greenfield, King), and
Santa Cruz 3 (La Selva, Larken Valley, Pajaro Dunes, Freedom, Corralitos,
Amesti, Interlaken).
The Rural Transportation Task Force, a working group that guided the
development of the study, recommended strategies that could be applied on a
case by case basis to each rural study area: expanded vanpools (transit
sponsored, schoolpools, and employer incentive), mobility hub development,
public/private partnerships with Transportation Network Companies, Expanded
Express Transit Service, and Workforce Housing Developments.
The SCS considers competing land uses for a finite supply of land and details a
concrete strategy to meet the State’s environmental goals as set forth in SB 375.
In summary, under SB 375, an SCS must:
• Identify existing and future land use patterns,
• Identify transportation needs and the planned transportation network,
• Consider statutory housing goals and objectives,
• Identify areas to accommodate long term housing needs,
• Identify areas to accommodate eight-year housing needs,
• Consider resource areas and farmland, and
• Comply with federal law for developing an MTP.
To assess the implications of these policies on the farmworker population the
Salinas Pajaro Agricultural Worker Housing Survey (SPAWHS) collected
demographic data from the respondents regarding:
Where they currently reside,
How far they traveled to their place of employment, and
What mode of travel they utilized to get to their place of employment.
This report examines data from the SPAWHS in relation to the 2035 MTP/SCS to
illustrate that a comprehensive strategy to address the needs of farmworker
housing not only intersect with agricultural employment and regional transit but
are inherently aligned with the planning efforts of the region. This alignment is a
direct result of the prescribed indices that the 2035 MTP/SCS utilizes to track the
performance of its proposed transit investments: Social Equity and Environmental
Justice, Healthy Communities, Environment, Economic Vitality and Access and
Mobility.
89 | P a g e
Farmworker Housing Study and Action Plan for Salinas Valley and Pajaro Valley -
Final June 2018
Social Equity and Environmental Justice
As required by government agencies that receive federal funds, AMBAG has
addressed the Title VI/Environmental Policy and Program elements to, “insure
that when transportation decisions are made, low-income and minority
communities have ample opportunity to participate in the decision-making
process and that they receive an equitable distribution of benefits and not a
disproportionate share of burdens.”78 Central to Title VI compliance is Technical
Analysis that identifies minority, low-income, and underserved communities in
which to direct investments, as well as extensive Community Outreach to these
communities.
In the 2035 MTP, under the Sustainable Communities Strategy, AMBAG has
targeted 90.3 percent of its transportation investments to serve the low-income
populations of the region. This study assumes that 100 percent of the farmworker
population qualifies as low-income according to the State Department of
Housing and Community Development (HCD) based on income thresholds
described in previous sections. As such, farmworkers are among those most likely
to benefit from increased and improved public transportation options. With
region-wide, long-term investment in transportation infrastructure, it makes
strong sense to consider how best to leverage these resources with housing
development for farmworkers.
Through community outreach and engagement with low-income and minority
community members, AMBAG was able to prioritize projects and extended
transportation services to best serve overburdened communities. Also identified
in this outreach was a market for vanpools as an alternative to more traditional
forms of public transportation. Referenced in the MTP is additional research in
support for this demand in AMBAG’s Agricultural Workers Vanpool Program
Study from 2010. The study cites, “The typical farmworker has limited access to a
private automobile and cannot use existing transit to get to work. With some
minor variation among the market areas, an overwhelming majority of surveyed
workers are receptive to a public vanpool program. They also indicated that by
becoming more mobile they would have an opportunity to work in other areas
of the region increasing their ability to be more productive.”
As discussed previously in this report, many state programs require
documentation of ample community engagement processes in the
78 Moving Forward Monterey Bay 2035. Association of Monterey Bay Area Governments. 2014. Appendix H. Page 10.
90 | P a g e
Farmworker Housing Study and Action Plan for Salinas Valley and Pajaro Valley -
Final June 2018
development of projects and planning documents. Again, as AMBAG has
already undertaken community engagement in the development of the MTP
and has made commitments to growing this engagement in the future, these
processes and plans can become critical components of many state funding
applications.
Healthy Communities
As addressed in the 2035 MTP, government agencies are moving towards a
“health in all policies” perspective in which health outcomes are taken into
consideration for all policy and planning. Many federal and state funding
programs have based project requirements on the growing evidence that
directing investments into housing and transportation development can
significantly improve community health outcomes. The intersection of housing
and transportation provides robust opportunities to address community-wide
health impacts for communities’ most underserved populations and farmworkers
are well-positioned to benefit from a health focus on increased access to
transportation.
The MTP seeks to address health outcomes by improving air quality and
facilitating more opportunities to engage in physical activity. The region can
expect reductions in smog-forming pollutants as people use public
transportation and alternative transportation modes more. With improved active
transportation infrastructure, such as sidewalks and bike paths, more people are
likely to engage in healthy physical activity like biking and walking. As
communities connect this infrastructure to public transportation stations and
stops, community members can walk or bike to high quality transit that brings
them to work, school, and other resources. In this ideal scenario, people exercise
more, benefit from cleaner air, and can use individual cars less or not at all.
Not explicitly discussed in the performance measures of the MTP, but central to
federal and state planning and program requirements, is improved health
outcomes through increased access to resources. Poverty and lack of
education are social determinants of health, and access to education and
employment options provide opportunity and economic mobility. Increased
public transportation and active transportation infrastructure address direct
determinants of health by connecting people to healthy food options -- like
grocery stores and farmers markets -- and making it easier to get to and from
health centers, clinics, and other medical appointments. Locating housing in
relationship to transportation routes is one way communities can make sure

91 | P a g e
Farmworker Housing Study and Action Plan for Salinas Valley and Pajaro Valley -
Final June 2018
residents have access to these key resources, even if they are not in the
immediate vicinity of the housing itself.
Environment
Sustainable Communities Strategies assess MTP impacts on the environment
through measuring greenhouse gas reduction, open space, and farmland
preservation. State law generally prohibits the conversion of working or viable
agricultural land to any other purpose. The 2035 MTP, Sustainable Communities
Strategies, and related Housing Elements, all consider the preservation of
farmland, and have not designated these areas for development.
To preserve open space and other natural resources other than agricultural
land, the RNHA Plan focuses development within a region’s incorporated areas
and provides appropriately zoned, viable parcels that comply with counties’
land-use and local zoning planning for more urbanized and infill areas. To meet
RHNA allocation goals, municipalities have looked for opportunities to increase
density for mixed-use and multi-family development on the region’s limited
developable land. Additional zoning overlays and community planning
designations have been used to increase housing supply in proximity to areas of
current development via the use of mixed used development and specific multi-
family zoning designations in various municipalities
As the State of California moves forward with steadfast goals to reduce
greenhouse gas emissions to 1990 levels, as set forth in the California Global
Warming Solutions Act of 2006 (Assembly Bill 32), planning — especially
transportation planning — has placed great weight on the reduction of vehicle
miles traveled (VMT) as a primary way to reduce these emissions. At the height
of the agricultural season in July 2016, this study calculated upwards of 91,500
farmworkers employed in the region, resulting in and estimated 183,000 daily
trips to and from work, totaling millions of VMTs in a single day. To meet the
region’s 2035 goal of a 5 percent reduction in greenhouse gas emissions, mode
shift from single occupancy vehicles to public transportation and ride-share
programs will only become more central to planning and development efforts.
Economic Vitality
Agriculture makes up a sizable portion of the economies of Monterey and Santa
Cruz Counties, and the sector is only projected to grow in the coming years.
92 | P a g e
Farmworker Housing Study and Action Plan for Salinas Valley and Pajaro Valley -
Final June 2018
Agricultural work is dependent on a robust workforce — a workforce that has
great housing and transit needs.
Monterey County has 1.3 million acres of farmland, while Santa Cruz County and
the Salinas Pajaro Valley each have an additional 100,000 acres.79 The 2016
Monterey County Real Farm Crop Value was $4.99 billion, with an estimated
53,700 individuals employed in the sector. Agriculture in Santa Cruz County is not
as prolific as in Monterey County, with most of the county’s agricultural activity
taking place in the Salinas Valley. In 2016, Santa Cruz County Real County Farm
Crop Value was $630 million with an estimated 8,300 individuals employed in the
sector. This report has found these estimates to be conservative, and the true
number of people employed by the sector to be far greater.
Although the Agricultural Census of 2012 reports 61,500 agricultural workers, the
data is limited by the timeframe in which that count took place and is
dependent on data made available by employers that may not reflect the true
variances of farm labor. For example, employment data collected and
presented in this report found that in 2016, peak employment for the month of
July alone was over 80,000 workers. Taking into consideration that there are
individuals working at various times throughout the year, this report estimates
that the true number of farmworkers active in Monterey and Santa Cruz counties
in any given year may be upwards of 91,500.
The 2035 MTP reports that, in 2010 (the base year for the MTP), only 16 percent of
the region’s jobs were located within one-half mile of a transit stop. The
Sustainable Communities Strategies sets the goal that, by 2035, 65 percent of
the region’s jobs will be within one-half mile of a transit stop. To meet this goal, it
will be critical to take into consideration where and how farmworkers get to their
place of employment.
Access and Mobility
The 2035 MTP describes accessibility as a measure of how well a transportation
system provides access to various destinations. Mobility is defined as the
distribution of trips by mode and by travel time. This report looked a data
relevant to the mobility of farmworkers in relation to places of employment.
According to the SPAWHS, 59 percent of the farmworkers surveyed lived in and
around the Cities of Salinas and Watsonville. 84 percent of respondents
reported their place of employment to be within a radius of 50 miles from these
79 USDA AgCensus 2012.
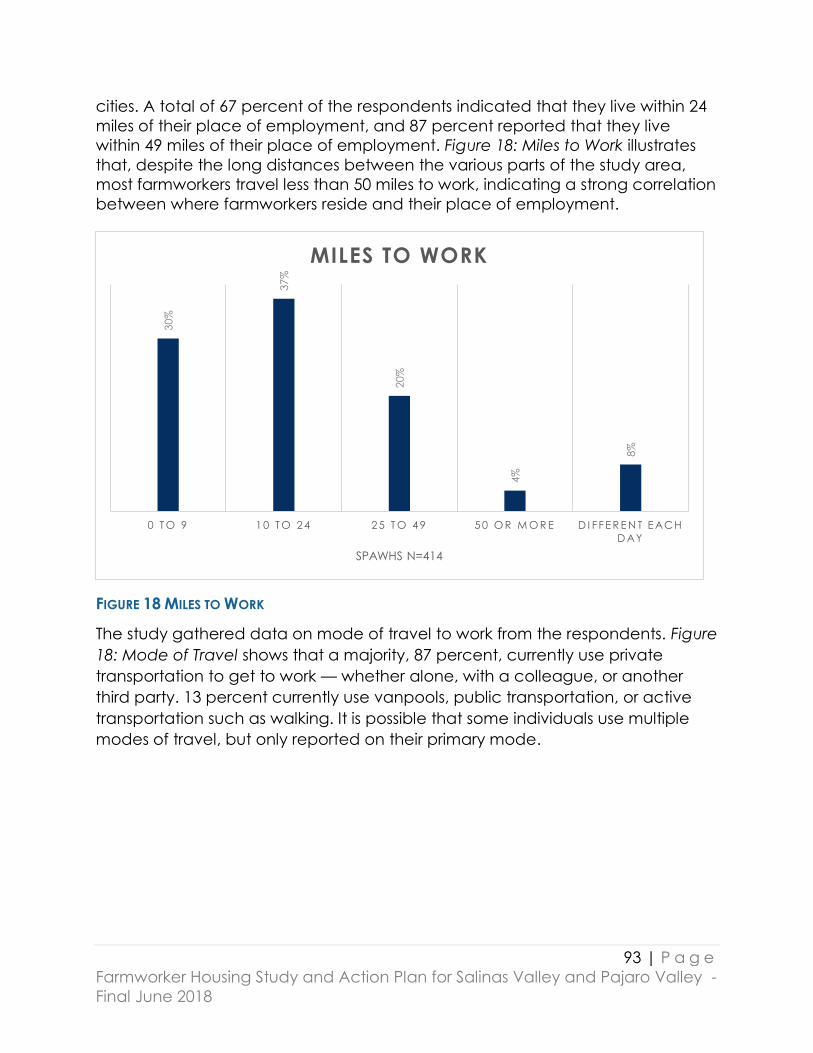
93 | P a g e
Farmworker Housing Study and Action Plan for Salinas Valley and Pajaro Valley -
Final June 2018
cities. A total of 67 percent of the respondents indicated that they live within 24
miles of their place of employment, and 87 percent reported that they live
within 49 miles of their place of employment. Figure 18: Miles to Work illustrates
that, despite the long distances between the various parts of the study area,
most farmworkers travel less than 50 miles to work, indicating a strong correlation
between where farmworkers reside and their place of employment.
FIGURE 18 MILES TO WORK
The study gathered data on mode of travel to work from the respondents. Figure
18: Mode of Travel shows that a majority, 87 percent, currently use private
transportation to get to work — whether alone, with a colleague, or another
third party. 13 percent currently use vanpools, public transportation, or active
transportation such as walking. It is possible that some individuals use multiple
modes of travel, but only reported on their primary mode.
30%
37%
20%
4%
8%
0 T O 9 1 0 T O 2 4 2 5 T O 4 9 5 0 O R M O R E D I F F E R E N T E AC H
D AY
SPAWHS N=414
MILES TO WORK

94 | P a g e
Farmworker Housing Study and Action Plan for Salinas Valley and Pajaro Valley -
Final June 2018
FIGURE 19 MODE OF TRANSPORT
Figure 20: Time to Work illustrates that 77 percent of the farmworkers surveyed
make it to work in 30 minutes or less. Only 7 percent indicate that they spend
more than 60 minutes travelling to their place of employment. This aligns with
general commute times for the region, with U.S. Census data reporting the
average commute time for all workers in Monterey County is 22.5 minutes and
26.2 minutes in Santa Cruz County.
FIGURE 20 TRAVEL TIME TO WORK
56%
17%11% 10%
3% 2% 1%0%
10%
20%
30%
40%
50%
60%
SPAWHS N=387, distribution of 429 responses
(some had more than one)
Distribution of types of transportation to work
16%
21%
18%
22%
15%
7%
0%
5%
10%
15%
20%
25%
1 to 12 mins 15 mins 16 to 29 mins 30 mins 31 to 59 mins 60 or more
SPAWHS N=402
Distribution of Time to get to Work

95 | P a g e
Farmworker Housing Study and Action Plan for Salinas Valley and Pajaro Valley -
Final June 2018
The 2035 MTP includes the goal to maintain the current average commute time
across all modes of travel — including Drive Alone, Carpool, and Transit —
despite the projected population influx of an additional 150,000 people by the
year 2035. It’s unclear what farmworker-specific population growth might be
and how population growth will affect the specific routes farmworkers take to
and from work. However, given the data provided, the assumption can be
made that farmworkers, as part of the general population, will experience transit
changes like those described in the planning reports. Through sustainable and
increased transportation and housing planning, AMBAG aims to keep work
commute times within the current 30 minutes into the near future.
Figure 19: Mode of Travel indicates that only 2 percent of the farmworkers
surveyed use public transit. This is likely due to the lack of availability of public
transportation options to places of employment, or that public transportation
significantly adds to the overall commute time achieved in individual modes of
travel. This report found that 10 percent of the farmworkers surveyed use
vanpools or shuttle services provided by their employer. In total, 12 percent of
the farmworkers surveyed use some form of public transportation or ride-share.
Understanding that those surveyed represent an adequate sample reflecting
the overall farmworker population of the region, 12 percent use of public transit
or rideshare reduces tens of thousands of solo car trips each day and hundreds
of thousands of trips each month.
In 2010, AMBAG published the “Agricultural Workers Vanpool Program Study,”
that addressed farmworker access to transportation and recommended
specific investments in a program for farmworkers that would reduce VMTs,
encourage mode shift, and improve air quality. This study and information
regarding the total population of farmworkers in the counties and the location
of current and proposed access reveal the general impact that the 2035 MTP
will have on the farmworker community. According to the planning documents
of Santa Cruz and Monterey Counties there are approximately 61,500
farmworkers in Santa Cruz and Monterey Counties, 32,872 in Monterey County
and 16,705 in Santa Cruz County80. Historically, the farmworker population has
been undercounted in the decennial count. Although the Census reports that
overall census has an undercount of 0.01 percent, the undercount for the
Hispanic population is approximately 1.5 percent81.
80 USDA AgCensus 2012. 81 Excerpt from the Regional Housing Needs Allocation Plan: 2014-2023: Senate Bill (SB) 375,
passed into state law in 2008, requires the coordination of housing planning with regional
96 | P a g e
Farmworker Housing Study and Action Plan for Salinas Valley and Pajaro Valley -
Final June 2018
In 2014 the Department of Housing and Urban Development publication,
Creating Communities: A Guidebook for Improving Transportation Connections
for Low-Income and Moderate-Income Household in Small and Mid-Size Cities
highlighted the City of Gonzales, an AMBAG municipality. Recommendations in
HUD’s guidebook, highlighting Gonzales as a case-study, included increasing
access to public transportation, establishing subsidized and regulated
vanpooling programs to fill transportation gaps, and pursuing collaborative
efforts among municipalities to access resources through state and federal
transportation and housing programs.
Transit-Oriented Development
As mentioned previously, the relationship between housing development and
transportation access is central to the Low-Income Housing Tax Credit (LIHTC)
Program and even more so in the Affordable Housing and Sustainable
Communities (AHSC) Program. Threshold and scoring criteria based on the
proximity of the housing site to key resources, the location of transit and the
access to resources it provides, and active transportation and mode shift
achieved are now all critical components of applications. Additionally, other
state resources for transit and housing are also focused on transit-oriented and
infill development. Whether in urban, suburban, or rural communities today’s
ideal affordable housing project:
Achieves sustainable land-use through developing dense, multi-family
housing in more urbanized, infill areas
Is located within one half-mile of a transit station or stop or provides a
fixed-route, vanpool service
Is situated in close proximity to resources such as public schools, large-
scale grocery stores, health care providers, and other resources
Provides access to public transportation with service to employment
centers and other key destinations
transportation planning through the MTP/SCS. This in effect entails consistency in growth
forecasts for land use, housing, and transportation purposes. In prior plans, the RHNA and the
MTP were prepared independently and had different timelines and planning periods. SB 375
requires that the RHNA and MTP/SCS process be undertaken together to integrate housing, land
use, and transportation planning to ensure that the state’s housing goals are met and to help
reduce greenhouse gas emissions (GHG) from cars and light duty trucks. The goal of this
integrated planning is to create opportunities for residents of all incomes to have access to jobs,
housing, services, and other common needs by a variety of means, including public transit,
walking, and bicycling.

97 | P a g e
Farmworker Housing Study and Action Plan for Salinas Valley and Pajaro Valley -
Final June 2018
Promotes walking and biking through investment in active transportation
infrastructure like complete sidewalks, bike lanes, sufficient lighting in
outdoor spaces, walking and bike paths, and traffic calming and safety
measures like improved street crossings
In order to create such comprehensive projects, many stakeholders must be
engaged in the process — affordable housing developers, transit agencies,
MPOs, redevelopment successor agencies, cities and counties, elected officials,
local community-based organizations, as well as community members
themselves. The most successful projects demonstrate how strong partnerships
and community engagement helped to shape the project. These complex
project applications also must prove how the project is in line with local planning
efforts by illustrating their alignment with the MTP and SCS as well as Housing
Element and other components of General Plans. Furthermore, developers can
be relieved from certain environmental review requirements under
the California Environmental Quality Act (CEQA) if their new residential and
mixed-use projects are consistent with a regional SCS that meets the established
targets.
The data collected from the 383 respondents of the SPAWHS survey indicated
that 59 percent of the respondents reside in the communities of Salinas and
Watsonville. Fully, 78 percent of the individuals that took part in the survey live in
areas that are currently defined as rural, including both incorporated and
unincorporated locales, utilizing TCAC methodology.
As exhibited in Table 18, Current Location of Survey Respondents, 48 percent of
the respondents indicated that they reside in Salinas and 11 percent currently
reside in Watsonville. Additionally, 19 percent live in areas that may be
considered rural using the Step 3: Small City Status of the TCAC Methodology,
specifically Greenfield and King City. Under the TCAC rural methodology, site
eligibility is determined by the evaluation of the project site address.
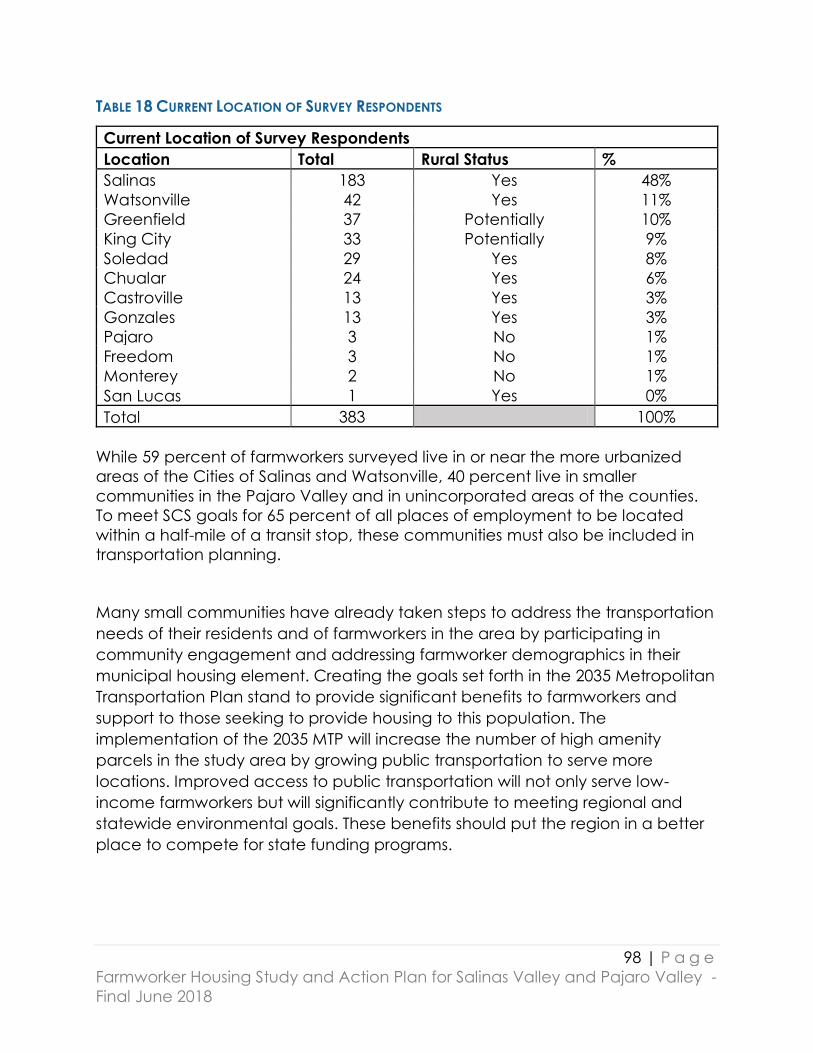
98 | P a g e
Farmworker Housing Study and Action Plan for Salinas Valley and Pajaro Valley -
Final June 2018
TABLE 18 CURRENT LOCATION OF SURVEY RESPONDENTS
Current Location of Survey Respondents
Location Total Rural Status %
Salinas 183 Yes 48%
Watsonville 42 Yes 11%
Greenfield 37 Potentially 10%
King City 33 Potentially 9%
Soledad 29 Yes 8%
Chualar 24 Yes 6%
Castroville 13 Yes 3%
Gonzales 13 Yes 3%
Pajaro 3 No 1%
Freedom 3 No 1%
Monterey 2 No 1%
San Lucas 1 Yes 0%
Total 383 100%
While 59 percent of farmworkers surveyed live in or near the more urbanized
areas of the Cities of Salinas and Watsonville, 40 percent live in smaller
communities in the Pajaro Valley and in unincorporated areas of the counties.
To meet SCS goals for 65 percent of all places of employment to be located
within a half-mile of a transit stop, these communities must also be included in
transportation planning.
Many small communities have already taken steps to address the transportation
needs of their residents and of farmworkers in the area by participating in
community engagement and addressing farmworker demographics in their
municipal housing element. Creating the goals set forth in the 2035 Metropolitan
Transportation Plan stand to provide significant benefits to farmworkers and
support to those seeking to provide housing to this population. The
implementation of the 2035 MTP will increase the number of high amenity
parcels in the study area by growing public transportation to serve more
locations. Improved access to public transportation will not only serve low-
income farmworkers but will significantly contribute to meeting regional and
statewide environmental goals. These benefits should put the region in a better
place to compete for state funding programs.
99 | P a g e
Farmworker Housing Study and Action Plan for Salinas Valley and Pajaro Valley -
Final June 2018
Conclusion
This study has corrected the notion that the majority of farmworkers live in rural
areas in close proximity to their places of employment, or that farmworkers living
in more urbanized areas have long commute times to their workplace. Instead,
this study finds that the average commute time for a farmworker is relatively the
same as that of other workers in the region. This has significant implications for
where housing should be developed to serve this population and provides a
wealth of opportunity to meet goals for increased access to public
transportation. While this may be a daunting scope of work to take on, these
goals align well with many state and federal funding resources for the
development of housing and public transportation.
This report concludes that the study area is well-positioned to:
Make the most of available resources through transit-oriented
development in both urban and rural areas to provide housing and
transportation resources to farmworkers in the region.
To effectively prepare for the development of affordable housing for
farmworkers, the region should continue a concerted effort to increase
collaboration amongst affordable housing developers, municipalities, and
employers.
Increase the number of parcels that meet the proximity requirements for
tax credit projects by implementing proposed transit investments in Very-
Low Income and Low-Income areas of the region.
Leverage existing and contemplated comprehensive and integrated
planning processes by incorporating proposed transit investments into
competitive transit-oriented developments via the competitive funding
process of the Affordable Housing and Sustainable Communities program.
Utilize the existing planning efforts and stated goals and performance
measures to align with key program criteria of Affordable Housing and
Sustainable Communities (AHSC) program such as a reduction of vehicle
miles travelled and mode shift.
Land Use Barriers and Reforms for Farmworker
Housing Development in Santa Cruz and Monterey
Counties
In addition to scarcity of financing and financing fit, which are discussed in the
Section of this report on Development, Management and Financing,

100 | P a g e
Farmworker Housing Study and Action Plan for Salinas Valley and Pajaro Valley -
Final June 2018
impediments to production of affordable housing, including farmworker housing,
are embedded in local land use processes, laws, and regulations. Time-
consuming discretionary reviews, misaligned zoning, imposition of high impact
fees, the necessity of environmental remediation, jurisdictional tensions between
cities and counties, inadequate infrastructure, and other local requirements and
conditions can all delay production and add significant costs to farmworker
housing, in some cases making it infeasible or cost-prohibitive.
A study of five cities (San Francisco, Oakland, San Jose, Redwood City, and Palo
Alto) by the University of California, Berkeley, concluded that discretionary
review processes on residential projects of five or more units in the past three
years caused significant delays.82 Even if the proposed housing was compatible
and in compliance with the underlying zoning, additional local government
scrutiny, including environmental reviews under the California Environmental
Quality Act (CEQA), were often required before a building permit could be
obtained. Uncertainty about whether and when entitlements will be granted,
the carrying costs of delays, the implications for timely assembly of public and
private financing, and increased exposure to community opposition can all
result from redundant or multiple layers of discretionary reviews.
Concern about local barriers that slow down housing production was the
motivation behind several bills passed by the California Legislature and signed
by the Governor in an historic housing package in September 2017. The most
prominent of these was SB 35 by Senator Scott Wiener (D-San Francisco). The bill
creates a streamlined local approval process in jurisdictions that have not met
their State-mandated housing goals as determined by the Regional Housing
Needs Allocation (RHNA) process. In these cases, if projects satisfy a set of
objective criteria, including affordability, density, zoning, and environmental
standards and pay State prevailing wages, they can receive expedited
approval. The streamlining only applies to the income levels, typically lower-
income housing, that are under-produced. For example, if sufficient numbers of
market-rate units are being built, but not low-income units, the project must
consist of at least 50 percent low-income units to qualify for streamlining.
According to a recent evaluation by HCD, not a single city or county in the
Monterey Bay Region met its RHNA goals and all may be subject to SB 35
82 See Getting it Right: Examining the Local Land Use Entitlement Process in California to Inform
Policy and Process, Working Paper February 2018, University of California, Berkeley, Center for
Law, Energy & the Environment.

101 | P a g e
Farmworker Housing Study and Action Plan for Salinas Valley and Pajaro Valley -
Final June 2018
streamlining.83 In fact, only 12 or three percent of California’s 540 or so cities and
counties have satisfied their RHNA obligations.
In this chapter, we discuss some of the major land use impediments in Santa
Cruz and Monterey Counties as identified by local government officials,
affordable housing developers, and agricultural employers. We also discuss
possible land use reforms and actions that can be taken to mitigate or eliminate
existing land use obstacles currently incumbent in county and municipal land
use codes and in the processing of development approvals. We conclude with
innovative land use strategies adopted by some cities and counties in California
that build upon existing zoning and other codes and can be valuable tools for
increasing the supply of farmworker housing.
Land Use Barriers
There are many factors that individually and collectively impede production of
housing, affordable housing, and farmworker housing in local communities. An
analysis of regulatory barriers to agricultural workforce housing in nearby San
Mateo County identified three categories of impediments and
recommendations:
Process Barriers – Issues arising before or after the application review process
and concerning conflicting information, lack of clarity about types of
information required, misunderstandings about the review process and time it
takes to be granted approvals.
Recommendations: Develop comprehensive Farm Labor Housing Guidebook to
explain all application materials and review process; incorporate on-site visits
during review period; increased satellite office hours; additional or reallocated
staff resources.
Technical/Engineering Barriers – Issues relating to uncertainty or disagreements
about how to meet technical standards pertaining to grading, drainage,
building codes, septic systems, and design detail.
Recommendations: Reconsider ways existing grading and drainage
requirements are applied to larger agricultural parcels; evaluate need for
83 See http://www.hcd.ca.gov/community-development/housing-
element/docs/SB35_StatewideDeterminationSummary022518.pdf for a list of Santa Cruz and
Monterey Counties jurisdictions not meeting their RHNA numbers for lower- (very low and low)
and above-moderate-income housing. The City of Santa Cruz is the only jurisdiction in the
Monterey Bay Area subject to the 50 percent rule for streamlining approval.

102 | P a g e
Farmworker Housing Study and Action Plan for Salinas Valley and Pajaro Valley -
Final June 2018
upgrades to existing single-family units when converting them to farmworker
housing; clarify process for converting existing structures to farmworker housing.
Communication Barriers – Issues regarding how information is distributed and
lack of proactive outreach to potential and current applicants, slow response
times, and out-of-date websites.
Recommendations: Update existing website materials and information; deliver
regular outreach workshops; upgrade website maps, such as zoning maps and
developable parcels, to be used as background documents for applicants.
Interviews and electronic communications with local housing, building, and
planning officials from Santa Cruz and Monterey Counties and the Cities of
Soledad, King City, Watsonville, and Salinas, as well as two nonprofit housing
development organizations and two agricultural employers operating in the
study area revealed some of the same barriers mentioned in the San Mateo
County analysis and other barriers. Generally, the barriers cited fall into two
major thematic areas:
1. Lack of available and developable land, and
2. Local bureaucratic and processing obstacles
Lack of Available and Developable Land
Stakeholders in the region echo a common refrain – land is scarce. Whether city
and county officials charged with planning and approving housing or
affordable housing developers and growers seeking to build housing, all can
agree that land scarcity for developing housing is one of the biggest hurdles.
A respondent from the small Salinas Valley city of Soledad bemoaned the high
demand for housing caused by pressures from the North Valley and even the
San Francisco Bay Area, which has resulted in rising home prices beyond the
payment ability of many local residents and overcrowding. Increasingly, the city
is becoming a bedroom community and as a result land pressures have risen.
The inventory of multifamily sites is particularly tight. The last multifamily rental
project developed in the City of Soledad was in 2009. This has been
exacerbated by the dissolution of the City’s redevelopment agency. Rental
housing just does not pencil out for private developers due to the high cost of
the available sites, low rents in this part of the Salinas Valley compared to
communities to the north, and lack of public subsidy, plus delays caused by
established local citizens opposed to rental projects. There are only 200

103 | P a g e
Farmworker Housing Study and Action Plan for Salinas Valley and Pajaro Valley -
Final June 2018
developable acres within the city limits and within that, only four multifamily sites.
Most of the acreage is zoned for single-family residential and industrial; only 20
acres are zoned for high-density residential. Rezoning of industrial and
commercial sites for residential use would raise equity issues as these parcels are
near the freeway, an abandoned mill, train tracks, and away from amenities.
Land just outside of Soledad could be developed, but strong anti-growth
sentiment in the region combined with agricultural land protections, could make
it extremely difficult. The City has agreed with the County not to expand west
of Highway 101 where there is no infrastructure and adopted a Memorandum of
Understanding regarding future growth. Sites to the east are protected by the
Williamson Act; most sites to the north where growth is most likely are owned by
one owner. Vacant land exists to the south, but there has been no residential
development in that part of the city and it is separated by railroad tracks. An
under-utilized industrial park is located there and would require a General Plan
amendment and zoning amendment to become a residential site. Growers are
calling the City inquiring about available sites for H-2A workers housing.
Annexation of developable county land contiguous to the city is one possible
solution, but that has been a long, drawn-out process.
Another related problem is that growers outside of the City limits need housing
for their workers, most of whom live within Soledad, but the growers’ businesses
do not contribute to the City’s tax base and services. In other words, growers
are not supporting the communities that house their workers. The City has a
limited tax base. To address this, growers could voluntarily agree to self-assess
themselves as they do in Napa County. Some think the County should also
contribute to the City.
A possible option for the City of Soledad to promote higher-density
development within its boundaries is lowering parking requirements for
multifamily housing, which is two spaces per unit plus a quarter space for visitor
parking, and offering incentives to get residents out of their cars. They could also
perhaps raise the multifamily building height to three stories. However, as a
general rule, the City would be more likely to provide subsidies and make land-
use concessions for affordable senior housing than farmworker housing because
it receives no tax revenues from agricultural employers and they are capable of
financing housing for their workers without public assistance.
The City of King City has moved proactively to relieve the pressure on its housing
supply from the infusion of H-2A workers by collaborating closely with growers
and farm labor contractors to enable agricultural employee housing. City staff’s
approach has been to meet with agriculture business owners for well over a

104 | P a g e
Farmworker Housing Study and Action Plan for Salinas Valley and Pajaro Valley -
Final June 2018
year, coordinate with other local government agencies, and research what
other communities, including communities outside of California, have done to
address farmworker housing needs.
Through its zoning and land use powers, King City has entitled several employee
housing facilities. In 2017, it made a zoning change to permit a temporary
project to move forward in its First Street Corridor Zone that converted an old
warehouse building for H-2A housing with over 200 beds. Recently, it approved
expansion of this facility by over 100 beds. The City also approved extension of
a sewer line to serve a property outside the City limits and facilitate renovation
of a blighted property that will serve over 200 agricultural employees.
In addition, the City is finalizing a Resolution and Ordinance for action by the
City Council that will make three changes:
Amend the General Plan land use text and map identifying property along
the First Street Corridor with a ‘Dual Land Use’ designation permitting
seasonal employee housing and identifying a maximum density;
Amend the Municipal Code and add a new chapter identifying specific
standards for seasonal employee housing. The standards will include, but
not be limited to, minimum living space per bed, beds per bedroom,
parking standards, interior leisure area, and outdoor open space
requirements; and
Amend the Zoning Ordinance Map making it consistent with the proposed
General Plan Map showing the new Dual Land Use designations.
The City of Watsonville also has limited land area for new residential
development. It is ‘landlocked’, bounded by the Pajaro River on one side and
surrounded by agricultural land on its other sides that is restricted by Measure U,
which limits annexation of county land over the next nine years.84 The Buena
Vista area could be annexed, but there is no infrastructure and services. It is also
in a flight path for Watsonville Airport and, thus, subject to additional land use
restrictions governed by Federal Aviation Administration regulations. The city is
housing the majority of farmworkers working in Santa Cruz County, but the lack
of housing options means that farmworker families are doubling and tripling up
in units in the private market.
On the periphery of the city, 65 acres of unincorporated land around Atkinson
Lane could be annexed (according to the Measure U restrictions). It is buildable
and could accommodate as many as 400 new residential units, 50 percent of
84 Measure U was approved by the voters in 2002 affecting annexations for 25 years.

105 | P a g e
Farmworker Housing Study and Action Plan for Salinas Valley and Pajaro Valley -
Final June 2018
them affordable. However, the Specific Plan for the area completed in 2009
was legally challenged by the Santa Cruz County Farm Bureau, which argued
that the Environmental Impact Report performed for the area did not
adequately analyze the impacts. Ultimately, the County settled with the Farm
Bureau, but the City decided not to adopt the Specific Plan and removed itself
from the lawsuit.
Since then, only about three acres have been approved in this area. The 46-
unit Pippen Orchards Apartments approved in 2014 and under development by
MidPen Housing will provide 20 affordable units in Watsonville and 26 units on a
contiguous parcel in the County. The City has agreed to provide police and
water services for the entire project, while the County agreed to process
building permits and conduct other procedure reviews. Both committed funding
support. Building on a site shared by two jurisdictions is rare and came with
regulatory and bureaucratic challenges. On the other hand, it demonstrates
the promise of city-county cooperation for farmworker housing on land that
straddles both jurisdictions. However, by the end of the development process,
the Local Area Formation Commission required the City of Watsonville to annex
the County parcel into the city.
Most remaining buildable land within Watsonville is on infill sites. Four hundred
units have been entitled on multiple sites in the city in the past few years, usually
in developments of 48-50 units. One of the last large residential developments,
proposing 150 units, is currently in the entitlement process. These projects consist
of a mix of multifamily units for rent and purchase – apartments, condos, and
townhouses, as well as single-family homes. Even though some of these
developments were entitled as ownership projects, about half will be rentals for
approximately 10 years. Several projects under construction are in the
downtown area, including 54 market-rate units approved in 2015 and a 14-unit
rental project nearing completion on Riverside Drive. Local officials are also
working on a Request for Proposals to increase the residential density in the
downtown and want to densify commercial corridors. The City’s inclusionary
housing ordinance, which requires that 15-20 percent of units be affordable,
could ensure that new market-rate projects include affordable units affordable
to farmworkers.
The future in Watsonville, as it is in other cities in the region, is to revise General
Plans and zoning codes to increase residential and commercial densities,
primarily by decreasing parking requirements and increasing building height
and FAR. In the view of one Watsonville official, the answer is not tiny houses,
106 | P a g e
Farmworker Housing Study and Action Plan for Salinas Valley and Pajaro Valley -
Final June 2018
since they cannot be stacked to achieve the greater height and density
footprints needed. The City has a minimum net land area requirement per unit,
but no minimum or maximum unit square footage requirement. For example, in
the highest-density residential zone, each 2-bedroom unit on a parcel of one
acre or more takes up 1,574 square feet of land area no matter what the square
footage of the unit actually is. Increasing the units per acre could help to
produce more units on the same parcel. With a planning staff of only three, it is
difficult to fast-track planning projects but, generally, reviews that lead to issuing
building permits take about one year. Solutions to provide more on-farm
housing would help to relieve overcrowding in cities.
Even in Salinas, the largest city in the region, there is a reported scarcity of
appropriate sites. The sites that are available are difficult to develop with
physical barriers, such as being located within a flood plain. As a result,
development of these sites becomes even more expensive. Another barrier is
that the City Zoning Code does not allow for large employer-owned housing; it
limits agricultural employee housing to 12 units or 36 beds, the same limits that
are specified in California’s Employee Housing Act in agricultural zones. This is, in
part, because of the past challenges with this kind of housing in the region.
However, the extreme housing shortage, further exacerbated by the influx of H-
2A workers, and interest of growers in building housing, has motivated staff to
consider amending the Code to allow for employer-owned housing.
Under the current situation, many H-2A workers live in underperforming
motels/hotels. These facilities are not properly zoned or adequately equipped
to deal with H-2A workers. Many are living up to 10 months in these locations
without proper kitchen facilities to prepare fresh food or any open or recreation
space. Some of these motels/hotels are in very poor condition resulting in code
enforcement actions. Some of the motels/hotels are not properly managed. In
these cases, H-2A workers may be housed with individuals engaged in criminal
activity. This has resulted in multiple public safety service calls.
Labor contractors have begun to buy single-family homes and are filling them
with upwards of 20 people, resulting in code complaints. According to City
Code, only six workers can occupy a single-family home. The pressure to house
H-2A workers is starting to impact stable single-family neighborhoods. Homeless
service providers are also being affected because motels have become
unavailable for emergency shelter since they are fully leased for months at a
time by labor contractors using the rooms for guest workers.
There is a recognition by City staff and their nonprofit housing partners that the
greatest need continues to be affordable housing for domestic farmworkers and

107 | P a g e
Farmworker Housing Study and Action Plan for Salinas Valley and Pajaro Valley -
Final June 2018
their families. While providing housing for H-2A workers can relieve some
pressure on the housing market, the desire is to create housing that can be
converted to a typical multi-family use. The H-2A program could be eliminated
in the future and, therefore, barracks-style housing would be difficult to absorb
into the market. In King City, industrial property was converted to H-2A housing
on a temporary (use permit) basis. This is not currently permitted in Salinas and is
not a viable option. The City has industrial areas with many businesses engaged
in food processing that use ammonia. An ammonia leak could be catastrophic
if located near residents.
There are two concerns, however, with employer-owned and -operated
housing. First is that an employer who is also a landlord could take retaliatory
action against an employee who complains about conditions, or is injured or ill,
and terminate the tenancy. Second, demand for migrant workers could
change over time due to changes in immigration policy and labor needs and
the City wants the kind of housing that can be reintegrated into the community
should that happen. It would be a shame to commit investment in limited sites
for transitional housing for temporary H-2A workers when there is such a large,
unmet need for housing year-round workers.
Salinas is exploring ways to facilitate the production of housing, particularly
affordable housing and is looking at amendments to its Zoning Code to remove
land-use barriers. In addition, the City will undertake a General Plan Update
beginning in 2019. Depending upon the study recommendations, the City may
consider removing barriers to employer-developed and -managed housing if
appropriately designed similar to multi-family housing developments. Anti-
retaliatory legislation to protect residents may also need to accompany
removal of certain barriers. Another option may be to allow some
underperforming motels/hotels to be used for H-2A housing. Improvements
would have to be made to ensure their safety and compatibility in the
community.
Another significant impediment to constructing housing are development
impact fees, which can be crippling. Salinas is beginning to explore how impact
fees are having a chilling effect on housing production. To facilitate affordable
housing, the City provided a 55-year deferral of development impact fees for
three deed-restricted affordable housing projects. Currently, affordable housing
is not treated differently from market-rate housing. Development impact fees
for construction of an Accessory Dwelling Unit are high as well. These fees may
be reviewed in the near future and possibly changed to stimulate small-scale,
private housing production.

108 | P a g e
Farmworker Housing Study and Action Plan for Salinas Valley and Pajaro Valley -
Final June 2018
In the East Alisal neighborhood, where the density rivals San Francisco, the City is
engaged in a grassroots planning process to develop the Alisal Vibrancy Plan. It
began in 2016 and the Plan will likely be completed by the end of 2018.
Depending on the community’s input, there may be some up-zoning along key
commercial corridors promoting ground floor retail and residential above. There
will be some height limitations, however, in areas of the neighborhood within an
Airport Overlay Zone. Moreover, many residents hale from small towns and rural
areas, and may need to see examples of quality affordable housing that
demonstrates greater density can be achieved without sacrificing livability. In
addition, ownership options may be feasible with smaller townhouses and
attached single-family homes with shared courtyards.
Another pathway is for cities to enter Memoranda of Understanding with
surrounding counties to connect agricultural employee housing on the periphery
of cities with city infrastructure and amenities, similar to Tanimura and Antle’s (T
& A) Spreckels Crossing complex in the Spreckels Industrial Park. When the
Nunes Company approached Salinas with its Casa Boronda proposal, the City
did not have the developable parcels of sufficient size to accommodate the
project (75 two-bedroom apartments). Alternatively, the project was built in a
nearby light industrial site in the county. Typically, the City is reluctant to support
county adjacent projects with housing in industrial areas, because if ever
annexed into the City, it would create a non-conforming land use. The City
choseto support the project at the 1144 Madison Lane location because of the
dire need for such housing.
Scarcity of land was also echoed by affordable housing developers with
farmworker housing properties in the region. Much of the land that is offered for
sale in unincorporated county areas is owned by growers. One nonprofit
developer was recently contacted by a grower with 95 acres near Salinas,
which was identified as a potential low-density residential zone in the City’s
Economic Development Element. The site would require a zone change and
other entitlements to allow agricultural housing. The developer and grower were
assured that the zoning change would be considered when the City updates its
General Plan. The property is much larger than the 5-10-acre sites the
organization typically acquires, which can accommodate a 50-75-unit
apartment complex. The cost of the land could range from $5-6 million.
Oftentimes, the parcels are 40 acres or more and growers do not want to parcel
off less than that.
Moreover, cities don’t want to do piecemeal planning in future growth areas
and prefer to see planning at their boundaries performed in a comprehensive

109 | P a g e
Farmworker Housing Study and Action Plan for Salinas Valley and Pajaro Valley -
Final June 2018
manner in a specific plan for a large area. There is a 10-acre parcel currently for
sale near Greenfield, for instance, but to purchase and develop a small parcel,
a developer would likely be forced to be part of a master-planned area subject
to a planning process that could take five years. However, most nonprofit
developers do not have the capital reserves and capacity to bet on land in a
master-planned area that could take many years to come to fruition and have
high carrying costs.
One possible solution to the problem of large parcel sizes is for affordable
housing developers to collaborate together. For example, there is another large
parcel near Fort Ord, some 100-200 acres, that is owned by the University of
California, Santa Cruz. If a group of developers with a presence in the Monterey
Bay Region were to acquire the property, such as CHISPA, Eden Housing,
MidPen Housing, and Mercy Housing California, development of the site might
be financially feasible. In addition, they each bring complementary skills. All
operate multifamily rental housing for farmworkers and CHISPA also develops
entry-level single-family homes.
Another challenge is that designated sites for future development in
unincorporated county areas do not have much infrastructure capacity – sewer
and wastewater facilities, potable water, electricity, and roads. They also are
not competitive for government housing finance programs that heavily weight
proximity to transit, schools, health care, grocery stores, and other amenities. The
Monterey County General Plan, for instance, limits growth in the next 20 years to
areas such as Pajaro, Castroville, Boronda, and Chualar, but the County has not
made significant infrastructure investments in these communities. Affordable
housing developers are not in the business of building sewer and water
treatment facilities and roadways. With limited infrastructure capacity,
expensive mitigation costs must be incurred and competition for the few sites
with adequate infrastructure is intense and land costs are high.
Among Santa Cruz and Monterey County officials, there is also an
acknowledgment that land use restrictions are an impediment and a stated
willingness to investigate and implement new land use tools. Santa Cruz County,
for example, is launching a code modification process and exploring reforms
that will provide greater flexibility and avail more land for farmworker housing.
One of the biggest barriers in their agricultural ordinance is a density standard
for farmworker housing of 20 acres for each unit. This is out of compliance with
the State Employee Housing Act, which allows agricultural employers to site 12
units or 36 beds on the farm for their agricultural employees. Growers,
essentially, have development-by-right to provide farmworker housing on their
110 | P a g e
Farmworker Housing Study and Action Plan for Salinas Valley and Pajaro Valley -
Final June 2018
land, but must apply to the County regarding where the housing is located.
Development rights are separated from use rights.
To promote cluster development on agricultural land, Santa Cruz County is also
revisiting the Subdivision Map Act and County agricultural codes dealing with
agricultural land subdivisions to allow growers who want to parcel land for off-
farm housing to adjust lot boundaries rather than create a new parcel. This
could facilitate consolidation of land in cases where multiple owners with
contiguous sites want to create housing for their employees. Or, in the event the
Land Trust of Santa Cruz County and neighboring growers are willing to set aside
land, lot lines could be adjusted to allow greater clustering and achieve more
units on more acreage. Funders like the California Tax Credit Allocation
Committee will likely want one single-asset owner of the land and housing.
Redefining what a parcel is and aligning smaller parcels under single ownership
will enhance the ability to finance the property. A 12-unit farmworker project
might not be economically viable, but a 36-unit project could be.
Additionally, there are large areas in Santa Cruz County that are zoned for
agriculture, but have not been cultivated, grazed, or used for an agricultural
purpose for a long time. The County would benefit from a wholesale review of
pockets of agricultural land where the soil is of a low quality and non-arable and
the property is near urban services in order to re-designate it for farmworker
housing. While Williamson Act contracts are difficult to get out of, the County
could possibly expedite no-cost cancellations.
In Monterey County, local government officials reiterate many of the land issues
raised by Santa Cruz County staff, city staff, affordable housing developers, and
growers. The California Environmental Quality Act (CEQA) and local land use
laws do not contemplate the distinctions between different kinds of farmworker
housing and between farmworker housing and other kinds of housing. For
example, traffic impacts are analyzed using the same framework as
conventional rental housing. CEQA and County codes need the ability to
distinguish between low-impact farmworker housing, such as seasonal, migrant
dormitories, and permanent, year-round housing. Land regulations also need to
allow larger farmworker housing projects.
Structurally, the layout and design of larger farmworker housing projects are
more and more like conventional multifamily projects. However, land use
regulations at the State and local levels need to provide exemptions for
seasonal, dormitory-style housing when the residents are single adults living only
111 | P a g e
Farmworker Housing Study and Action Plan for Salinas Valley and Pajaro Valley -
Final June 2018
part of the year in the facility. In sites housing H-2A workers and providing
private transport or access to public transit to farms and agricultural processing
worksites, there are typically fewer vehicles on the site and, thus, there is a need
to reduce parking and traffic plan requirements. Sewer, wastewater, and water
consumption is also lower. Impact fees for these services and for schools, parks,
and other amenities should be reduced as well. Housing for senior citizens is
exempt from school impact fees, so why not temporary housing for
unaccompanied-adult farmworkers? And, why not impose commercial impact
fees, which are lower than residential impact fees? Owners could be released
from the obligation to continue renting to farmworkers if demand for this housing
declines in future years.
Year-round housing for farmworkers should be treated similarly. Since there is
such an exigent need in the region for quality farmworker housing 12 months of
the year, then all of the land use incentives available at the local level, such as
density bonuses and shallower set-backs, should be maximized. Processing of
applications and approvals should be a priority and expedited accordingly.
Currently, Monterey County treats modular homes just like stick-built homes in
terms of geologic impact. However, modular homes are lighter and stand-
alone units are more likely to withstand geologic events, such as if the land
‘turned to mush’ – they are resilient and go above and beyond existing building
codes. Once again, the Ventura County strategy of creating codes that allow
pre-approved boilerplate plot plans on viable land was cited as a way to
expedite processing. Modular units should be pre-approved as well along with
conventionally-framed dormitory-style and multifamily housing for farmworkers in
Monterey County. The efficacy of this approach needs to be further
investigated.
Local Processing and Bureaucratic Obstacles
Non-governmental stakeholders interviewed were critical of local government
staff performance, the many bureaucratic chokepoints, and overall long time it
takes to process development approvals. Time is money and delays are costly.
One affordable housing developer stated that there is a great need for
expanded education and mobilization of policy-makers and housing, planning,
and building department staff to help them better understand their own
regulations and become advocates for affordable housing. In its experience,
some of the plan-checkers do not appear motivated to expedite and

112 | P a g e
Farmworker Housing Study and Action Plan for Salinas Valley and Pajaro Valley -
Final June 2018
accelerate approvals. Furthermore, local laws and policies already in place,
such as the streamlining process in Monterey County, and State mandates like
California Density Bonus Law are not being fully implemented. In large part, this
can be attributed to lack of staff capacity and overwhelming workloads.
In the long-run, there is no need to ‘reinvent the wheel’ as long as each
responsible department designates staff that have the expertise and
commitment to housing production and implementation of existing procedures.
Two agricultural employers operating in the region were also critical of local
government bureaucracies – cities, counties, and special districts – which, in
their view, are a major barrier to producing seasonal migrant housing. After
withdrawing from providing on-farm housing or supporting labor camps since
the 1970s, growers are now getting back into the business of building and
operating housing. This has evolved out of necessity in response to labor
shortages resulting from changing immigration policies and greater
enforcement at the federal level.
While the ‘collective inexperience’ of local government officials and agricultural
employers will change over time, there are compelling reasons for developing a
specific set of rules, a coherent, unified approach relevant to the kinds of
dormitory-style accommodations that growers are increasingly providing in the
region. In one case, a grower building a migrant housing facility is suing the
Salinas Union School District because it wants to charge a $200,000 school
impact fee when the residents will typically be single unaccompanied adults
living only part of the year in the facility with no children. The facility should be
treated more like a commercial property than an apartment building for
families. The grower is willing to pay school fees later in the event that families
with children live in the facility.
Furthermore, not only do the residents of these accommodations, typically
foreign workers, not have children but they have few, if any, cars and parking
spaces required by local zoning codes will go unused. Local officials are calling
for standards that far exceed what is required by law and what qualifies as
‘reasonable’ housing. A task force of county and city officials with growers
could get local jurisdictions on the same page so that growers will have more
clarity about project feasibility when deciding to invest time and expense in
exploring sites.
Bureaucratic uncertainty and delays in making sewer and water connections
are also a problem. For instance, the first phase of the Casa Boronda seasonal
(H-2A) housing facility is ready to be opened for 300-400 residents. However, the
sewer study that was submitted to demonstrate that existing systems can handle
113 | P a g e
Farmworker Housing Study and Action Plan for Salinas Valley and Pajaro Valley -
Final June 2018
the increased capacity and gain sewer hook-ups has been delayed at the
county and utility district levels for six months. It appears that no one person is
facilitating the process and advocating for the project. There needs to be a
sense of urgency and clear lines of responsibility, otherwise it can feel to the
applicant/business that projects get lost in the bureaucracy.
The need for greater certainty for farmworker housing applicants could also be
addressed by designing housing templates that can be pre-approved and
expedited as in Ventura County. Agricultural employers do not need financial
incentives or support from public agencies; they are providing housing because
it’s good for their business. What they need most is removal of chokepoints and
accelerated processing.
Finally, one agricultural employer expressed concern that the T & A and Casa
Boronda facilities have established a baseline standard and cost no other
company that isn’t so vertically-integrated can achieve. Everyone wants
farmworkers to do the hard work of harvesting local crops, but no one wants
them in their ‘backyard’. What is needed is semi-barracks-style housing for 8-10
persons sharing a bathroom and kitchen, a prototype that is sparer yet
functional to control costs. Reasonable sewage disposal and water facilities are
needed. One city wanted a recreational area for the 218 men to be
accommodated in a project. In this view of this employer, guest workers do not
need a ‘Club Med’ experience; they are here to work, save money, and return
home.
Besides city and county government administrative and bureaucratic
roadblocks, affordable housing developers face obstacles with special districts,
private utility companies, and the California Coastal Commission. An affordable
housing developer building a new senior complex in the City of Marina
negotiated with the Marina Coast Water District regarding the design of the
water system. The District’s civil engineer wanted a justification why the building
shouldn’t have 47 individual meters built on the street with backflow devices.
The developer requested a variance to build a single master water meter into
the property with a backflow device and sub-meters on the building, saving
several hundred thousand dollars in construction costs, plus long-term savings in
on-going monitoring of a multi-meter system. State legislation in 2017 (SB 7-Wolk)
amended the California Water Code to allow such exemptions for affordable
housing. Ultimately, District staff were convinced to recommend approval of
the variance, although the District will require that the water meter savings be
used to provide resident services. The savings, about $14,000 per year, can be
easily justified because resident services will cost at least that much to deliver. To

114 | P a g e
Farmworker Housing Study and Action Plan for Salinas Valley and Pajaro Valley -
Final June 2018
gain the approval, it took a great deal of effort by the developer’s staff,
engineer, and attorney.
Pacific Gas & Electric presents another challenge. PG&E continues to be very
slow in responding to the above developer’s request for plan reviews, installation
of meters (electric and gas), and other requests. There is an existing PG&E pole
on the property in Marina where the senior complex is being built. The pole
needs to be moved for work to start on the building’s foundation. However, it
can take a long time for crews to be available to perform the work. In another
property in San Benito County, it took two months for a PG&E crew to get out to
the site and install electrical and gas meters.
A third bureaucratic hurdle is for proposed projects in the coastal zone and the
California Coastal Commission’s undue authority over affordable housing
development. CHISPA, for example, has 42 acres in the coastal zone in
Castroville and is proposing 124 apartments and 90 single-family homes. The
Coastal Commission is concerned about seawater intrusion and that the project
will deplete the supply of water for agriculture in the North County. CHISPA has
a ‘will-serve’ letter for water originating in the Salinas Valley Basin in the South
County. The perception is that the Commission’s actions in the Monterey Bay
Region, as in other coastal areas, are strongly influenced by anti-growth interests
and philosophical opposition to new homes, particularly affordable housing.
The County’s coastal plan, adopted in 1982 and not amended since, grants the
Coastal Commission enormous power to deny projects.
Land Use Reforms
In this section we discuss potential land use reforms based upon the data, best
practices research, interviews we conducted with local stakeholders above;
and a recent (January 2018) report by the Monterey Bay Economic Partnership
(MBEP) and Envision Housing. The MBEP report recommends land use and
regulatory changes in the tri-county Monterey Bay Region that could reduce the
cost of producing housing, stimulate production of lower-priced housing types,
and increase housing affordability through the market.85 The Oversight
Committee reviewed the recommendations for proposed reforms to evaluate
them for effectiveness in increasing the supply of housing for farmworkers and
then formulated the proposed actions for the Regulatory Reform section of the
Action Plan
85 See What Realistic Policy Changes Could Improve Housing Affordability in the Monterey Bay
Region?, Monterey Bay Economic Partnership and Envision Housing, January 2018.
115 | P a g e
Farmworker Housing Study and Action Plan for Salinas Valley and Pajaro Valley -
Final June 2018
1. Promote Smaller Units
Many jurisdictions in the region charge flat fees per unit, such as sewer and
water fees, regardless of the square footage of the unit. To reduce disincentives
for production of smaller units, fees could be imposed on a square footage
rather than per unit basis. There are estimates that this change could reduce
the cost of producing smaller units in multifamily infill projects by 3 percent and
stimulate more units. If the lower production costs and increased supply of
smaller units result in lower rents or purchase prices in the private housing market,
this could benefit some farmworkers who are year-round, permanent residents.
On the other hand, farmworker families tend to be larger than non-farmworker
families and smaller units with reduced bedrooms may not be a good fit.
Moreover, many farmworkers will still need public subsidy to afford these units
given low wages and seasonal income.
2. Reduce, Defer, or Waive Developer Impact Fees
Development impact fees are usually paid at multiple stages in the
development and construction process and add to overall cost. Moving these
fees to a later stage in the process and collecting them at one time, such as
when the Certificate of Occupancy is issued, could save approximately 1
percent of the production cost across all housing units. This includes impact fees
for sewer, water, traffic and street improvements, schools, parks, and affordable
housing, as well as permit application, General Plan, and other processing fees.
(Note: One city official points out that State law already requires jurisdictions to
defer impact fees to final inspection upon the request of the developer and that
what is needed is getting the word out to developers.)
A one percent decrease in housing production costs in the private market will
not likely have much benefit for farmworkers. However, in jurisdictions that
impose the same fees on affordable housing as they do for market-rate housing,
fee reductions, fee deferrals during earlier speculative stages of development,
and consolidation of fees at the point of issuance of a Certificate of
Occupancy for farmworker housing would provide significant financial relief.
Better yet would be an idea under consideration by the City of Salinas to defer
certain fees for all affordable multifamily rental housing projects for 55 years,
which is typically the term of affordability required by government housing
finance programs.
Additionally, local impact fees often do not distinguish between conventional
apartments and seasonal, migrant housing. The impacts of the latter on schools
116 | P a g e
Farmworker Housing Study and Action Plan for Salinas Valley and Pajaro Valley -
Final June 2018
will typically be less or negligible because the occupants of the housing will be
single, unaccompanied adults without children. Moreover, especially when the
occupants are H-2A workers, many, although not all, will have only one vehicle
or be carless, and therefore, create less need to mitigate impacts on parking
and traffic. Demand on water, sewer, and other public facilities will also be less
because of the seasonality of the housing. Thus, local officials should explore
how the impact fee load on migrant housing can be reduced or eliminated
given the unique nature of this kind of housing.
3. Enhance Density Bonuses
California density bonus law mandates that local governments, upon the
request of residential developers, increase allowable densities for housing based
on different percentages of units to be offered at different levels of
affordability.86 Sometimes density bonus programs are referred to as ‘incentive
zoning’.
In the chart below, it can be seen that percentage increases in density are
calibrated to percentage increases in total units targeted at different income
levels – generally, the lower the income-targeting, the higher the bonus granted.
The total bonus is capped at 35 percent above the maximum allowable density
for the site. The theory is that multifamily housing developers will not be able to
support lower-rent units absent rent subsidies and still be able to turn a
reasonable profit without increasing the number of market-rate units. The
balance is to establish density bonus levels that will incentivize developers to
request increased density and numbers of income-generating market-rate units
at an attractive rate of return, while still stimulating as many affordable units with
deepest income-targeting as feasible. The affordable units must be deed-
restricted and remain affordable for at least 55 years if for rent and be sold to a
successor low-income owner at an affordable housing price if for ownership.
86 Chapter 4.3, Sections 65915-65918, of the Government Code.
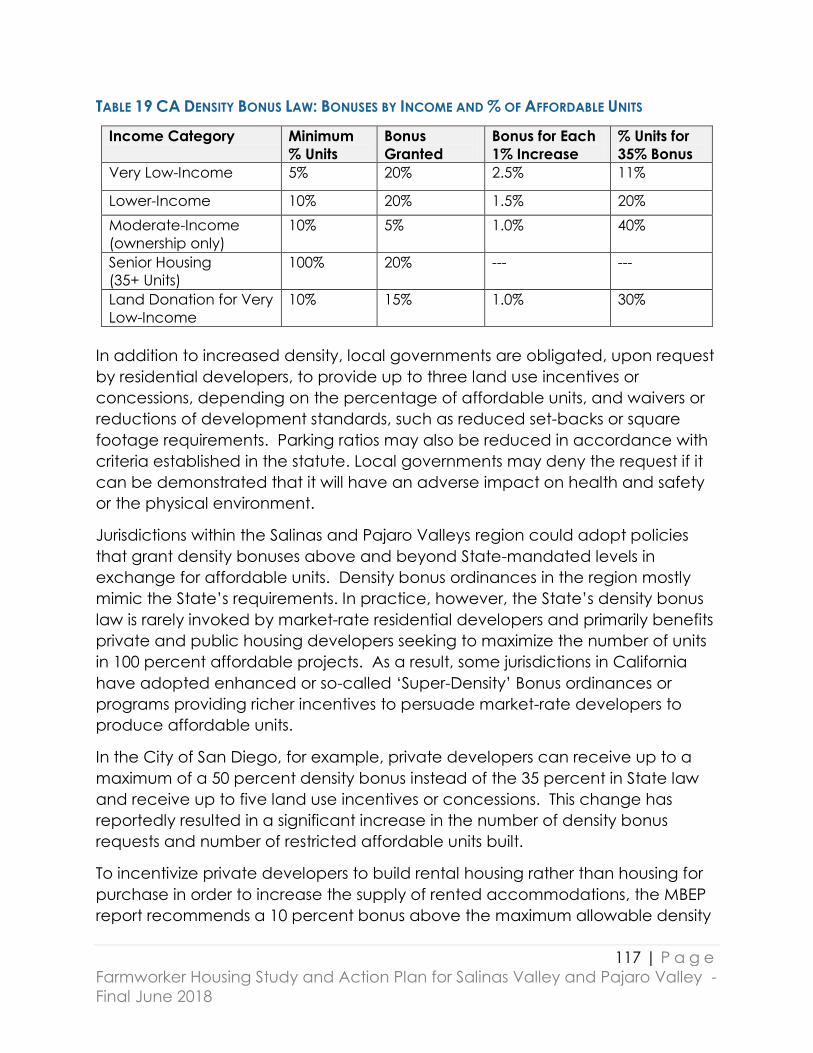
117 | P a g e
Farmworker Housing Study and Action Plan for Salinas Valley and Pajaro Valley -
Final June 2018
TABLE 19 CA DENSITY BONUS LAW: BONUSES BY INCOME AND % OF AFFORDABLE UNITS
Income Category Minimum
% Units
Bonus
Granted
Bonus for Each
1% Increase
% Units for
35% Bonus
Very Low-Income 5% 20% 2.5% 11%
Lower-Income 10% 20% 1.5% 20%
Moderate-Income
(ownership only)
10% 5% 1.0% 40%
Senior Housing
(35+ Units)
100% 20% --- ---
Land Donation for Very
Low-Income
10% 15% 1.0% 30%
In addition to increased density, local governments are obligated, upon request
by residential developers, to provide up to three land use incentives or
concessions, depending on the percentage of affordable units, and waivers or
reductions of development standards, such as reduced set-backs or square
footage requirements. Parking ratios may also be reduced in accordance with
criteria established in the statute. Local governments may deny the request if it
can be demonstrated that it will have an adverse impact on health and safety
or the physical environment.
Jurisdictions within the Salinas and Pajaro Valleys region could adopt policies
that grant density bonuses above and beyond State-mandated levels in
exchange for affordable units. Density bonus ordinances in the region mostly
mimic the State’s requirements. In practice, however, the State’s density bonus
law is rarely invoked by market-rate residential developers and primarily benefits
private and public housing developers seeking to maximize the number of units
in 100 percent affordable projects. As a result, some jurisdictions in California
have adopted enhanced or so-called ‘Super-Density’ Bonus ordinances or
programs providing richer incentives to persuade market-rate developers to
produce affordable units.
In the City of San Diego, for example, private developers can receive up to a
maximum of a 50 percent density bonus instead of the 35 percent in State law
and receive up to five land use incentives or concessions. This change has
reportedly resulted in a significant increase in the number of density bonus
requests and number of restricted affordable units built.
To incentivize private developers to build rental housing rather than housing for
purchase in order to increase the supply of rented accommodations, the MBEP
report recommends a 10 percent bonus above the maximum allowable density

118 | P a g e
Farmworker Housing Study and Action Plan for Salinas Valley and Pajaro Valley -
Final June 2018
for rental units. It also calls for tying Section 8 Housing Choice Vouchers, which
are often under-utilized because of landlord unwillingness to accept vouchers,
to be coupled with these units to provide deeper levels of affordability. The City
of Santa Cruz has experimented with a rental housing density bonus, but like
other bonuses it has been rarely used.
With respect to farmworker housing production, strengthening local density
bonus ordinances and programs could have two important impacts. First, it
would allow affordable multifamily housing developers to increase the
allowable number of farmworker units in their projects. Second, local
governments could require that some percentage of the affordable units in
market-rate rental housing be occupied by farmworkers in exchange for
increased density and other land use benefits. In a relatively low-density, low-
height urban morphology like exists in Santa Cruz and Monterey Counties,
building smaller units may be more politically acceptable than building up.
As with any density bonus program, the program is only as effective as the
quality and constancy of local government monitoring of deed-restricted units
and affordability covenants over time. Unless there is public funding that
requires monitoring, a formal tracking system with a monitoring fee paid by the
property owner, and dedicated staff, local governments may lose sight of the
number and status of affordable units in later years; in other words, whether the
units are affordable to and occupied by lower-income households over the full
lifetime of the project. In California, the term of affordability of Low-Income
Housing Tax Credit and other rental housing programs is typically set at 55 years.
Tracking long-term affordability in ownership units created through a density
bonus program depends on whether continuous owner-occupancy and resale
to an income-qualified household is required after the initial sale. Cities like
Sunnyvale have implemented appropriate systems that monitor owner-
occupancy annually and facilitate restricted resales.
4. Reduce Parking Requirements
According to research, the greatest disincentive to building smaller units in
multifamily projects in the region is parking requirements. Nearly all jurisdictions
require two parking spaces for every modest-sized, one-bedroom apartment, in
addition to visitor parking. Developers, thus, are faced with little choice but to
build fewer but larger apartments that can command higher rents or to build
parking structures above or below ground that can add $20,000 per parking
space to the cost of development. Optional policies include greatly reducing,
or eliminating, parking requirements in core city centers and other areas with

119 | P a g e
Farmworker Housing Study and Action Plan for Salinas Valley and Pajaro Valley -
Final June 2018
parking alternatives, public transit, walkable or bikeable amenities, and car-
sharing opportunities.
For the region’s farmworkers, relaxation of parking requirements could provide
some derivative benefits, but also some challenges. For farmworkers who live in
the area year-round and work in the Pajaro and Salinas Laborshed, reducing the
number of parking spaces in newly constructed, subsidized rental housing
projects could increase the supply of apartments reserved for or affordable to
farmworker families. Older farmworker housing built at a time when land was
plentiful and the availability of onsite and off-site amenities was not a
consideration, such as older USDA Section 514/516 projects and private labor
camps, could be densified with more units and lower parking ratios. Reduced
parking requirements could also result in larger facilities for seasonal migrant
workers combined with potential tie-ins with the CalVans program for
agricultural workers and State Cap and Trade funding for vanpools.
On the other hand, our study found that about three-quarters (73 percent) of
farmworkers surveyed arrived at the farm in private vehicles – 56 percent in their
own car and 17 percent in the vehicle of a friend or relative. The others arrived
via paid rides with a third party, a van, bus, or private vehicle supplied by their
boss, public transport, and walking. It is unknown from our survey, however, how
many farmworker households have more than one car. Moreover, only a small
percentage of interviewees were H-2A visa workers, who employee housing
operators report are less likely than domestic workers to come with cars. Our
assumption is that many lower-wage farmworker households will only be able to
support one vehicle and that parking ratios of 1.5 spaces in new affordable
rental housing projects could accommodate most of these households.
Nonetheless, this needs closer study as too much reduction in parking spaces
could present a challenge to farmworker households that need more than one
vehicle because there are no other options to get to work.87
5. Enable Mixed-Use Development
Another potential reform has to do with encouraging mixed commercial-
residential development in mixed-use zones by reducing commercial space
87 For the majority of farmworkers employed in the Pajaro and Salinas Valleys, the private housing
market in Salinas, Watsonville, and other urban centers is where most find accommodations.
Some crowd into single-family homes and other housing with two, three, or four other
households, each with its own car, creating serious parking issues and traffic. Reduction of
parking requirements for new housing will not solve the parking problem of this population and
their neighbors. Vanpools, however, could help solve the traffic problem. If funding continues,
the CalVan program could help support reduced parking.

120 | P a g e
Farmworker Housing Study and Action Plan for Salinas Valley and Pajaro Valley -
Final June 2018
requirements. In unincorporated parts of Santa Cruz County, 50 percent of the
square footage of a mixed-use development has to be occupied by
commercial uses, yet there may not be sufficient demand and economic
justification for that much commercial space. Construction of new or
reconstruction of existing commercial spaces in unincorporated areas to include
housing for farmworkers could offer a solution for some workers, especially
without school-age children, who wish to live closer to farms, but still have some
commercial amenities. Several mixed-use projects within at least one city in the
Salinas Valley have ground-floor commercial space that has been vacant for
five or more years, with residential on the floors above.
Another strategy is to amend General Plans and zoning codes to permit
seasonal employee housing, including conversions of vacant warehouses and
other under-utilized or unused commercial and industrial spaces, in ‘Dual Land
Use’ zones, as are being designated in King City. Local governments can
identify parcels qualifying for Dual Land Use designation, amend their Zoning
Ordinance Map to conform to their General Plan Map, and amend their
Municipal Code, if needed, to enumerate specific standards for seasonal
agricultural employee housing above and beyond those required by existing
health and safety standards. Such standards may include minimum living space
per bed, beds per bedroom, parking standards, interior leisure areas, and
outdoor open space requirements.
6. Support Accessory Dwelling Units
Many communities have looked to Accessory Dwelling Units (ADUs), also known
as ‘granny flats’ or ‘second units’, to relieve demand pressures in tight rental
housing markets. California legislation in 2016 (SB 229-Wieckowski) sought to
encourage ADUs by removing some barriers and authorizing local agencies to
provide ADUs by ordinance in areas zoned for single-family or multifamily use.
The goal, in particular, is to support single-family homeowners who want to
provide accommodations, beyond close family and friends, to renters unable to
find lodging in traditional apartments.
Despite efforts such as the City of Santa Cruz’s “ADU Manual” issued in 2003, the
opportunity to build ADUs has still not been maximized in the Monterey Bay
Region under California law. Additional measures that could be taken by
jurisdictions include: setting annual production goals, like in the City of Portland,
Oregon; greatly lowering ADU impact fees, including water and sewers since
these properties already have such connections; deferring fees until issuance of
a Certificate of Occupancy, as already prescribed in State law; reducing
parking requirements for ADUs, also in compliance with State law; disseminating
121 | P a g e
Farmworker Housing Study and Action Plan for Salinas Valley and Pajaro Valley -
Final June 2018
information and educating the public; and working with lenders to create
products to finance ADUs.
Whether or not increasing numbers of ADUs will significantly benefit farmworkers
is unknown. In reality, some suburban homeowners will be hesitant to rent to a
farmworker family or one or more unaccompanied adults for a variety of
economic, social, and cultural reasons, not to mention stereotypes about
farmworkers and racial and ethnic prejudices. In a region with a number of
major universities and colleges, owners may prefer students as tenants.
More likely is that homeowners in cities with significant farmworker populations,
like Salinas and Watsonville, and rural communities near farms, will be more
receptive to building or availing existing structures for farmworkers, like a
retrofitted garage or trailer in someone’s backyard.88 It is also possible that ADUs
will help relieve pressures in the regional housing market, thereby, freeing up
apartments for farmworkers, even if ADUs themselves do not provide a direct
solution.
Furthermore, what are the guarantees that ADUs will be truly affordable and
habitable over time? Jurisdictions may condition or favor permits for ADUs based
on willingness to accept Section 8 Housing Choice Vouchers or even to rent to
farmworkers with vouchers, but the great majority of documented farmworkers
(and no undocumented workers) do not receive portable rent subsidies and
Section 8 waiting lists are years-long. Deed-restricting the units for a specified
time period might be an answer, but how many homeowners would agree to
that? Unlike a multifamily project that is occupationally-restricted to
farmworkers and has multiple layers of subsidy, each with its own compliance
requirements, affordable ADUs for farmworkers would require a rigorous local
government inspection and monitoring regime for scattered sites.
7. Zone for Higher Density, Optimize Height Limits
Restrictive zoning designations that limit residential densities in the region,
including heights offer another area for reform. High-density, infill housing that
maximizes land use and creates more environmentally-sustainable development
is strongly favored and rewarded in public policy and housing programs. This is
particularly true in urban cores and corridors with high amenities. However,
88 A recent preliminary analysis of infill housing for the Alisal Vibrancy Plan (eastern third of
Salinas) mapped residentially-zoned properties and identified parcels that might accommodate
a potential of 3,000 ADUs.

122 | P a g e
Farmworker Housing Study and Action Plan for Salinas Valley and Pajaro Valley -
Final June 2018
current zoning in the region is outdated in some communities.
Recommendations include the following:
Higher height limits in urban cores and other dense areas of urbanization
of 3-1 and 5-2, for example, three residential stories over one commercial
story or five residential stories over two commercial stories.
Reduction of upper-story setbacks in downtown areas, thereby, allowing
higher floor area ratios (FARs).
Removal of units-per-acre density limits, instead setting density limitations
based on height, FAR, and parking requirements to encourage more small
units.
Outside of core urban areas, allow residential and commercial uses on
the same street-level, ground floor.
In addition, local authorities should consider the following zoning and height
allowances where they are appropriate:
Allow siting of medium- to large-sized employee housing facilities on city
sites that can accommodate such development, provided the housing
approximates conventional multifamily housing and is convertible to other
residential uses in the event the facility is no longer used for seasonal
migrant workers.
Reduce minimum net land area per unit requirements and instead set
minimum square footage per unit requirements that will encourage more
smaller units.
The adage that the only thing local citizens hate more than urban sprawl is high
density appears to be true in parts of Santa Cruz and Monterey Counties, as it is
in most parts of California. Clearly, local zoning in most of the region’s
jurisdictions does not maximize the carrying capacity of the available sites in
terms of units per acre, nor height and FARs. In some cases, low density limits
may make affordable housing infeasible, especially for the lowest-income
residents when deep subsidies from government sources are unavailable.
Generally, the more units in a development the more ability to spread
development and operating costs across multiple units, including cross-
subsidization of the rents for very-low and extremely-low income farmworkers.
However, updates of the General Plan are currently underway in Salinas and is
scheduled in Watsonville in two years.
8. Relax Restrictions on Agricultural Use of Land
A growing trend in recent years, especially in Monterey County, has been
grower and labor contractor interest in providing seasonal, migrant housing on
123 | P a g e
Farmworker Housing Study and Action Plan for Salinas Valley and Pajaro Valley -
Final June 2018
farms or sites near farms. For decades, the trend has been in the opposite
direction. The number of grower-owned and -operated farmworker housing
facilities licensed by the California Department of Housing and Community
Development, and subject to the Employee Housing Act, has decreased
dramatically since the 1950s.
The surge of H-2A workers into the region has exacerbated the shortage of
affordable housing in cities like Salinas, Watsonville, and elsewhere. Workers are
crowding into motels, mobilehome parks, apartment complexes, and single-
family homes (and worse), and in so doing displacing other low-wage workers
who live year-round in the region and reducing their housing options. The need
for a reliable labor force, grower responsibility to provide housing for imported
labor, pressure from local governments and advocacy groups, and dwindling
supplies of affordable housing options have stimulated grower-initiated seasonal
migrant housing facilities and proposals.
The first of these was the 800-bed Spreckels Crossing built by Tanimura and Antle
(T & A)for its employees in the Spreckels Industrial Park, which was opened in
2016 and provides 100, 2-bedroom, 2-bathroom fully-furnished units capable of
accommodating up to eight persons per unit. The facility was designed to help
T & A meet its responsibility to house foreign workers brought to the county under
the H-2A Program. It is entering its third season of providing housing to domestic
workers instead of H-2A workers. The example of T & A inspired the Casa
Boronda farmworker housing complex being built by the Nunes Company on a
site in Monterey County just outside the City of Salinas. It has permits to house
up to 600 employees in 75 units in six buildings and the first phase is scheduled to
open in the spring 2018. Other growers and farm labor contractors in the Pajaro
and Salinas Laborshed are reaching out to local governments and affordable
housing developers as potential partners and proposing new accommodations
for several thousand seasonal migrant workers.
While our study finds that most agricultural employees working in the Pajaro-
Salinas Valley Laborshed live year-round in the region and need a permanent,
year-round housing solution, the current demand for temporary housing for
seasonal migrant workers is severe. Both needs are linked and both should be
addressed simultaneously. Providing more seasonal, migrant housing options will
help relieve the pressure on the private housing market and providing more
year-round, permanent housing options will relieve the pressure on the need for
seasonal migrant housing.
124 | P a g e
Farmworker Housing Study and Action Plan for Salinas Valley and Pajaro Valley -
Final June 2018
Given limited sites in many of the region’s cities, and the higher cost of land,
exploring how to free up sites for accommodations on appropriate non-
residentially-zoned sites in unincorporated county areas could be explored. The
T & A and Casa Boronda farmworker housing complexes are both built on land
zoned for commercial uses in Monterey County but proximate to the City of
Salinas and urban amenities and services. They show how the judicious and
flexible exercise of local government powers over zoning and the development
approval process can result in a common-sense solution that is a win-win for all
parties.
In the same spirit, but on a limited basis that respects the critical importance of
preserving prime agricultural land and avoiding sprawl, local officials may wish
to revisit how to use agriculturally-zoned land near urban uses for farmworker
housing and encourage growers with marginal land to convey it for housing
farmworkers living part-time or year-round in the community.
Growers already have the capability of providing accommodations for their
workers on the farm as long as the housing does not exceed 12 units or 36 beds.
In accordance with the California Employee Housing Act, California Health and
Safety Code, Section 17021.6(b):
Any employee housing consisting of no more than 36 beds in a group quarters or
12 units or spaces designed for use by a single family or household shall be
deemed an agricultural land use for the purposes of this section. For the purpose
of all local ordinances, employee housing shall not be deemed a use that
implies that the employee housing is an activity that differs in any other way from
an agricultural use. No conditional use permit, zoning variance, or other zoning
clearance shall be required of this employee housing that is not required of any
other agricultural activity in the same zone. The permitted occupancy in
employee housing in a zone allowing agricultural uses shall include agricultural
employees who do not work on the property where the employee housing is
located.
Subsection (c) further exempts such housing from payment of “any business
taxes, local registration fees, use permit fees, or other fees to which other
agricultural activities in the same zone are not likewise subject.” The housing is
subject to “the imposition of local property taxes, fees for water services and
garbage collection, fees for normal inspections, local bond assessments, and
other fees, charges, and assessments to which other agricultural activities in the
same zone are likewise subject”. To increase the amount of housing a grower
can provide on the farm within an agricultural zone would take a statutory
125 | P a g e
Farmworker Housing Study and Action Plan for Salinas Valley and Pajaro Valley -
Final June 2018
change at the State level.89 Santa Cruz County has taken the position that
growers have development-by-right authority to provide housing to their
employees in compliance with State law, but that the County has approval
authority regarding where the housing is sited on the farm.
There are those who feel strongly that growers should not be both employer and
landlord, including some growers. And, most growers, judging from the
declining number of State-licensed employee housing facilities, statewide,
would rather not have to deal with providing housing and having to comply with
the obligations and liabilities of the Employee Housing Act, except perhaps for
their skilled and year-round workers, The intermediary role played by labor
contractors has also insulated growers from the need to provide
accommodations to ensure that farmworkers show up in the fields every day.
That T & A, the Nunes Company, and other growers and labor contractors are
now seeking to develop or co-develop and operate large-scale housing for
their workers is a new trend. Time will tell whether it is sustainable.
Another option for growers, pioneered by winegrape producers in Napa
County, is to dedicate land and/or funding so that public and private nonprofit
organizations can develop and operate the housing for agricultural employees.
As described in the case study of the River Ranch Migrant Housing Center in St.
Helena (see case study below), vintner Joseph Phelps donated the land to the
Napa County Housing Authority and winegrape producers voluntarily decided
to self-assess themselves, first $10 per square acre in cultivation and later $15, to
support the operating costs of River Ranch and two other migrant housing
centers in the county. The Housing Authority contracts management to a
nonprofit organization, California Human Development Corporation. The
centers are open 11 months. While there is no reservation of beds for any one
grower, the centers provide 180 beds that have helped stabilize the supply of
labor and relieve pressures on local housing markets.
In instances where growers are willing to dedicate land in unincorporated
county areas under a narrow set of conditions, Santa Cruz and Monterey
Counties should consider amending their agricultural codes and other county
codes to facilitate the transfer of this property. If, for example, a grower owns
land that is contiguous to and bounded on multiple sides by urban uses, has not
been in cultivation for a specified time period, and has low-quality soil, the land
89 There have been several unsuccessful efforts in the California Legislature to increase the
number of units and beds that can be provided for employees on the farm without triggering a
local zoning change and conditional use permit.

126 | P a g e
Farmworker Housing Study and Action Plan for Salinas Valley and Pajaro Valley -
Final June 2018
could be deeded to the county, annexed by and deeded to a nearby city, or
deeded to a nonprofit developer, public housing agency, or land trust.
Alternatively, it could be conveyed with a long-term lease, say, 99 years. Santa
Cruz and Monterey Counties could perform a wholesale review of pockets of
agricultural land near urban services that have not been in cultivation, grazing,
or other agricultural uses for many years and are not environmentally-
vulnerable.
Several local officials expressed interest in encouraging clustered farmworker
housing in agriculturally-zoned areas where contiguous property owners are
willing to dedicate land. In these special instances, alignment of grower land
and parcelization or, alternatively, modest lot line changes could enable
consolidation of land in joint ownership or new ownership by a single-asset
corporation or social owner, like a community land trust. The consolidation of
land would enable construction of a larger project that would be more
economically viable.
There are various tools available for identifying pockets of agricultural land that
are contiguous to urbanized areas. One tool used by the California Strategic
Growth Council to qualify affordable housing projects and award Greenhouse
Gas Reduction Funds under the Affordable Housing and Sustainable
Communities Program is the Farmland Mapping and Monitoring Program of the
California Department of Conservation. Applicants seeking to develop in rural
areas must refer to these maps to demonstrate that the land to be developed is
not “Prime Farmland, Farmland of Statewide Importance, Unique Farmland,
Farmland of Local Importance, or Grazing Land.” While some affordable
housing developers have taken issue with the maps’ accuracy in capturing sites
that are surrounded by and on the leading edge of urban growth, and better
suited to residential uses, the tool is active and could be employed by county
officials to identify potential sites for farmworker housing.
One issue is whether growers will request a quid pro quo for dedicating,
discounting, or leasing a piece of their land for farmworker housing owned and
operated by another entity. The main incentive for making land available and
enabling such housing will be the stability and dependability of their labor. Even
if the housing is not or cannot be reserved exclusively for employees of the
agricultural employer providing the land because of the presence of public
subsidy and implications for fair housing laws, it will still likely offer a housing
option for some employees and relieve the grower of the headaches of
employee housing development, operation, and compliance. The issue of
127 | P a g e
Farmworker Housing Study and Action Plan for Salinas Valley and Pajaro Valley -
Final June 2018
whether a preference or priority for employees of a particular grower or group
of growers contributing to the project is permissible should be further explored.
Conversations with growers in Monterey County who are voluntarily developing
seasonal migrant housing for their own employees on land they own or have
acquired without any public subsidy strongly suggest that growers could see
disposition of land as a value-added proposition benefiting their businesses.
That has been the experience in Napa County. Alienation and dedication of
land could also be taken as a charitable deduction, depending on whether
there is an appropriate structure for the donation. Research could examine
possible tax relief and land use and regulatory concessions on other land
holdings of the grower that may be offered in exchange.
Another issue is the intersection of the Williamson Act for growers who have had
contracts with local jurisdictions for property tax reductions.90 The findings that
need to be made by a city council or county board of supervisors to support a
request for contract cancellation pivot strongly on whether there is a justifiable,
exigent public purpose to be served, that there is no other land that can
achieve the purpose, and that removal of the land from agricultural use will not
cause further loss of agricultural land. It is plausible that a grower alienating a
marginal piece of agriculturally-zoned land for farmworker housing contiguous
to an urbanized area could fit this description. In this instance, local officials
should consider amending the contract and waiving the cancellation fee for
that portion of the land. Legal counsels will need to look more carefully at
whether this is feasible under the terms and conditions of each contract.
Finally, on the borders between cities and unincorporated county areas that are
zoned for agriculture, city and county officials, and Local Area Formation
Commissions, should explore ways to accelerate annexations and zoning
approvals in the case of farmworker housing. While cities and counties can
execute joint powers agreements, like in the case of Pippins Orchards
Apartments in Watsonville and Santa Cruz County, for projects that straddle the
boundary between the two jurisdictions, ultimately LAFCO required the City to
annex the County property..
9. Prioritize and Streamline Administrative Processing of Farmworker Housing
90 For answers to key questions relating to the Williamson Act, see
http://www.conservation.ca.gov/dlrp/lca/basic_contract_provisions/Pages/contract_cancellati
ons.aspx#what%20is%20the%20cancellation%20fee.
128 | P a g e
Farmworker Housing Study and Action Plan for Salinas Valley and Pajaro Valley -
Final June 2018
Similar to the findings in the aforementioned San Mateo County analysis of
impediments to farmworker housing, our interviews with non-governmental
stakeholders involved in the development and operation of housing for this
population in Santa Cruz and Monterey Counties expressed frustration with
administrative roadblocks and long delays at the county and city levels.
Insufficient knowledge of local regulations, misinformation and
miscommunication, redundant layers of reviews, changing personnel, and
seeming lack of responsibility for timely and expedited review of land use
approvals were all mentioned by respondents to our interviews. The slow pace
of approvals causes development uncertainty and additional carrying costs.
Several interviewees cited an approach recently launched by Ventura County
to shorten the approval process for farmworker housing, as well as accessory
dwelling units, built on parcels that meet certain size and zoning criteria in the
unincorporated county. At the end of 2017, the County unveiled three standard
building plan prototypes for 700, 900, and 1,200 square foot single-family homes
with one, two, and three bedrooms.91 They were designed by engineers in the
County Building and Safety Division. County officials anticipate that the
availability of pre-approved plans could cut the processing time in half, from
one year to six months. Property owners will still need to meet other site
conditions, but they won’t have to submit the building plans for approval since
regulators have already determined that they comply with state and local
building codes, including structural, seismic, and safety codes. The plans must
be used without modification. Besides reducing the costs associated with
delays, there will be no need to hire architects to design the units. It is
anticipated that county fees will decrease substantially for landowners using the
standard plans.
Farmworker Housing Floor Plans, Ventura County, California
91 For an information fact sheet on Standard Plans, see http://colabvc.org/wp-
content/uploads/2017/12/Standard-Plans-for-ADUs-and-Farmworker-Housing-Combined.pdf.
Since the plan prototypes were made available near the close of 2017, it is still too early to know
whether they are encouraging more housing applications with less processing time and cost.

129 | P a g e
Farmworker Housing Study and Action Plan for Salinas Valley and Pajaro Valley -
Final June 2018
700 ft2, 1 Bedroom, 1 Bath 900 ft2, 2 Bedroom, 1 Bath
1,200 ft2, 3-Bedroom, 2 Bath
In the future, Ventura County may also develop pre-approved plans for other
building prototypes. Some would like the County to adopt a larger single-family
prototype up to 1,800 square feet. Adopting the pre-approved plans was an
Action in their Housing Element. Growers would like to see plans for housing
single unaccompanied adults, such as barracks-style, pre-fabricated models.
There are builders operating in Oregon, Washington, and Idaho that offer
130 | P a g e
Farmworker Housing Study and Action Plan for Salinas Valley and Pajaro Valley -
Final June 2018
standard plans for farmworker dorms/barracks. Officials in Santa Cruz and
Monterey Counties could also consider developing standard building plan
prototypes for different farmworker housing models that are compliant with state
and local building codes and can be processed in a fraction of the time of a
standard non-farmworker unit.
Modular units, for example, are currently treated just like stick-built, site-built
housing, but are lighter and, in some cases, more durable and resilient in
situations where soil is unstable. This housing could also be considered for pre-
approval as it is often the quickest and least expensive way to provide
accommodations for farmworkers.
Another pragmatic way to expedite farmworker housing projects is to delink
small parcels suitable for this kind of housing from large master-planned areas
requiring specific plans that could take many years to develop. It is
understandable that cities and counties would want to have a long-range plan
and vision for areas on their common borders where future growth is likely to
occur. However, the prospect that a small parcel that is developable and
appropriate now for farmworker housing will be caught up in a prolonged
planning and CEQA process is too risky for most affordable housing developers,
especially nonprofit organizations with limited capital reserves. City and county
officials should consider the cost-benefit of tying up these parcels in master-plan
processes for many years compared to providing relief for farmworkers in the
short-term.
Besides modifying existing codes and planning processes as previously discussed
in this chapter, local governments could consider the following administrative
actions to accelerate the approval of farmworker housing applications in the
pipeline and improve overall customer service:
Designate a specific point-person or ombudsperson who is responsible
both for shepherding the proposal as well as advocating for it. This is
especially needed in larger and better-resourced jurisdictions where
multiple personnel ‘touch’ the application at multiple stages of review.
Streamline and eliminate redundant and unnecessary discretionary
reviews for all housing types that cause costly delays and discourage
project applications.
For year-round, permanent farmworker housing proposed on sites zoned
for high-density multifamily residential, and that meets all of the conditions
of the underlying zoning, allow development-by-right in order to fast-track
these applications and avoid case-by-case local approvals and site-

131 | P a g e
Farmworker Housing Study and Action Plan for Salinas Valley and Pajaro Valley -
Final June 2018
specific plans, conditional use permits, and other reviews that add time
and cost.
Develop a comprehensive Farmworker Housing Guidebook to explain the
application materials, what information is required of applicants, and the
review process, including the responsible departments at each stage of
the process and estimated processing times.
As in Ventura County, develop farmworker housing templates that are
pre-approved and can be quickly expedited, provided the housing
complies with the underlying zoning, building codes, and environmental
standards.
Conduct on-site visits during the review period as needed.
Ensure website materials and information are up-to-date, such as zoning
maps and maps of developable parcels for housing identified in Housing
Elements and other land inventories.
Conduct periodic outreach and education workshops to stakeholders
and the public on the need for farmworker housing, how farmworker
housing compares and contrasts with other forms of housing, farmworker
housing best practices, and financing and land incentives offered by the
jurisdiction.
Expand training of city and county staff about State and local land use
codes and regulations and foster a mindset that is about collaborative
problem-solving.
10. Remove Impediments in Coastal Zone Review and Regulations
Currently, there is legislation (AB 2754) proposed to clarify that on-going and
routine agriculture activities are not deemed development and are therefore
not subject to a Coastal Development Permit. Local Farm Bureau staff note that
many instances when repairing a gate or crop rotation has come under scrutiny
of the Coastal Commission staff for a development permit. The original intent of
the California Coastal Zone Conservation Act when passed in 1972 was to
exempt regular agricultural activities from those permits. If this legislation or
something similar is passed and signed, perhaps it could lead to further steps to
allow farmworker housing on agricultural coastal lands subject to ongoing
agriculture activities.
A recurring issue for coastal counties with large-scale agricultural producers with
operations on the coastal littoral is the availability of protected land under the
California Coastal Act, enacted in 1976. Coastal zones in California coastal
counties are quite variable in terms of geographical footprint and, in some
areas, extend considerably inland.
132 | P a g e
Farmworker Housing Study and Action Plan for Salinas Valley and Pajaro Valley -
Final June 2018
We know of only one active farmworker housing project built in recent years in a
coastal zone area in a Central Coast county, the Lachen Tara Apartments in
Avila Beach in San Luis Obispo County in 2008. It has 29 rent-restricted low-
income units, four of which are set aside for farmworkers. Avila Beach is an
urbanized place which underwent a massive environmental remediation effort
to clean up serious water and underground pollutants in the late 1990s and did
a major make-over of its commercial and nearby residential area.
In Monterey County, CHISPA owns 42 acres in the coastal zone in Castroville and
is proposing 124 apartments and 90 single-family homes. The organization has a
‘will-serve’ letter from the water district. The initial reaction from the Coastal
Commission has been negative because of seawater intrusion and over-
drafting, as well as a priority for water use for agriculture in the North County.
However, the water source will be from the Salinas Valley Basin to the south and
will not deplete water supplies for agriculture from the North County Water Basin.
While a final decision has not been rendered, the expectation is that the
Commission will likely deny development rights based on past opposition to new
residential development, especially low-income housing.
In addition, the North Monterey County Local Coastal Plan was adopted nearly
40 years ago in 1982 and has not been updated since. It gives the Coastal
Commission enormous control over affordable housing. If local authorities revisit
the Plan and make modifications as needed, the Commission might no longer
have ministerial authority to block affordable housing projects and Monterey
and Santa Cruz Counties will have greater discretion to approve affordable
housing with low environmental impacts that serves a dire need to house
agricultural employees working in the coastal zone.
Both Santa Cruz and Monterey Counties could explore the extent to which they
can affect Coastal Commission authority and reviews of low-impact farmworker
housing, both on- and off-farm, in coastal areas under the Commission’s
jurisdiction. Legislation introduced in the California Legislature in 2018, AB 2797
(Bloom), if adopted, would clarify that a density bonus, incentive or concession,
waiver or reduction of development standards and parking ratios granted by a
city or county to a housing project in the coastal zone shall not be a basis for a
finding that the project is inconsistent with the California Coastal Act.
Other Local Land Use Approaches and Innovations
In addition to modifying and tweaking existing zoning and other land use codes,
California cities and counties are increasingly adopting more proactive
mandates and overlays through their zoning powers in urban infill and new-
133 | P a g e
Farmworker Housing Study and Action Plan for Salinas Valley and Pajaro Valley -
Final June 2018
growth areas. In the following section, we discuss three land use strategies that
may be considered by jurisdictions in Santa Cruz and Monterey Counties to
stimulate more affordable and farmworker housing: Inclusionary Housing,
Affordable Housing Overlay Zones, and Public Benefit Zoning.
1. Strengthen Inclusionary Housing Programs
One of the major land use tools not fully discussed in the MBEP report, which is
roughly used by about a third of California jurisdictions, is Inclusionary Housing,
also known as Inclusionary Zoning or Mixed-Income Zoning. As indicated in
Table 22 below, we believe there are around 10 jurisdictions in the Monterey Bay
Region that have elements of an inclusionary housing policy.
Unlike when a local government grants a State-mandated density bonus to a
private developer voluntarily agreeing to include affordable units, inclusionary
housing ordinances are voluntarily adopted by local governments and place
affordable housing mandates on private residential developers.92 As previously
mentioned, the incidence of developers requesting density bonuses under the
State’s density bonus law is low, and thus fewer affordable units have been
stimulated than anticipated. Inclusionary housing programs, in contrast, place
the decision to include affordable units in the hands of local governments. It is a
‘sticks-and-carrots’ approach.
Below, we discuss how an inclusionary housing program can be a vehicle for
generating new revenue for a local housing trust fund. However, its real power is
in its capacity to not only produce affordable housing through the private
market, in some cases without subsidy, but, just as importantly, create integrated
communities that achieve social and economic inclusion of lower-income
households and address fair housing and regional equity goals.
In a traditional inclusionary housing program, local governments require
developers to build affordable units in new apartment projects or homeowner
subdivisions, often in new growth areas and on infill sites, as a condition of
gaining development rights. The percentage of units to be built, the
affordability levels targeted, the number of years the units must remain
affordable, and many other conditions are established in the ordinance. In
many programs, local governments, at their discretion, can offer alternative
compliance methods on a project-by-project basis, such as building the units
off-site on another parcel, dedicating land to the local government or a
92 In a few cases, like the City of Folsom, localities have been compelled to adopt inclusionary
housing programs because of court rulings finding that their land use policies are discriminatory
and in violation of fair housing laws and California Housing Element law.
134 | P a g e
Farmworker Housing Study and Action Plan for Salinas Valley and Pajaro Valley -
Final June 2018
nonprofit organization that can accommodate a comparable number of
affordable units, or making a payment to the local government in lieu of
building.
To make inclusionary housing adoption and implementation both more
financially and politically palatable, local governments typically offer
developers ‘sweeteners’, such as increased density above and beyond what is
required in State law, parking and design concessions, expedited processing,
and fee waivers and deferrals. Some jurisdictions make it quite easy for
developers to opt out of building the units. In fact, since two lower court rulings
in 2009 that limited local government powers to impose inclusionary
requirements and the demise of redevelopment in 2012, many cities and
counties have weakened their inclusionary programs and moved to a ‘fee-first’
system. In other words, paying an in-lieu fee is no longer a default option, but
the main compliance method, in many ways indistinguishable from a housing
impact fee. (Note: See Financing Section below for discussion of housing
impact fees.)
Most market-rate developers will not want to build, own, and operate the
inclusionary units and, instead, will seek to offload these responsibilities and
partner with a nonprofit housing development organization that knows how to
cobble together subsidized financing and manage affordable housing for the
long-term. The nonprofit developer may even produce more affordable units
than would have resulted if the market-rate developer had built them, either on
the same site or a nearby site.
Another variation is for the market-rate developer to build the inclusionary units
integrated within a market-rate development and then lease or deed
ownership of them to a nonprofit organization that will take on long-term
operational responsibility. From the outside, the affordable units should be
indistinguishable from the market-rate units, although local governments may
allow these units to be somewhat smaller and less amenity-rich in the inside. This
would be somewhat similar to the old Turnkey Program operated by the U.S.
Department of Housing and Urban Development in the 1960s when Public
Housing Authorities would contract out construction of units to private builders
who would then ‘turn the key’ over to the Authority upon completion. In this
scenario, local governments and nonprofits would have to be vigilant to assure
quality and avoid the problems that arose in this program because of shoddy
and delayed construction.
According to a study by the Nonprofit Housing Association of Northern California
and California Coalition for Rural Housing in 2006, about 170 jurisdictions in the
state reported having inclusionary housing programs. A deeper review of each
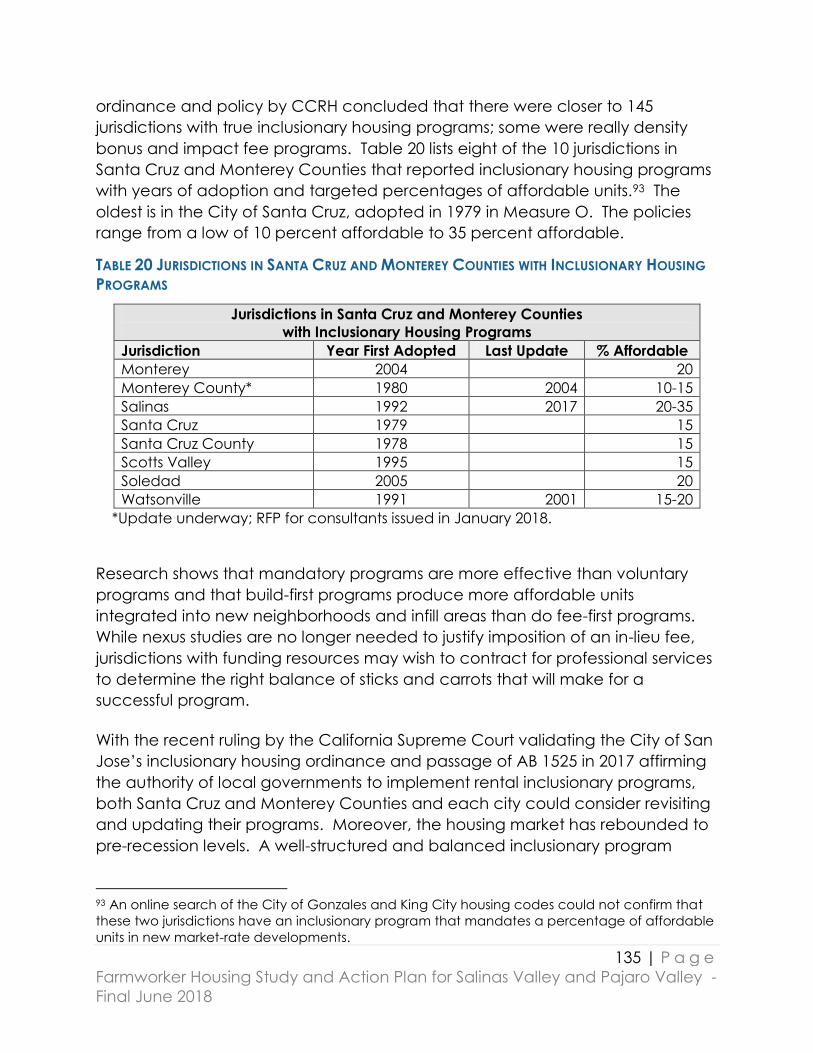
135 | P a g e
Farmworker Housing Study and Action Plan for Salinas Valley and Pajaro Valley -
Final June 2018
ordinance and policy by CCRH concluded that there were closer to 145
jurisdictions with true inclusionary housing programs; some were really density
bonus and impact fee programs. Table 20 lists eight of the 10 jurisdictions in
Santa Cruz and Monterey Counties that reported inclusionary housing programs
with years of adoption and targeted percentages of affordable units.93 The
oldest is in the City of Santa Cruz, adopted in 1979 in Measure O. The policies
range from a low of 10 percent affordable to 35 percent affordable.
TABLE 20 JURISDICTIONS IN SANTA CRUZ AND MONTEREY COUNTIES WITH INCLUSIONARY HOUSING
PROGRAMS
Jurisdictions in Santa Cruz and Monterey Counties
with Inclusionary Housing Programs
Jurisdiction Year First Adopted Last Update % Affordable
Monterey 2004 20
Monterey County* 1980 2004 10-15
Salinas 1992 2017 20-35
Santa Cruz 1979 15
Santa Cruz County 1978 15
Scotts Valley 1995 15
Soledad 2005 20
Watsonville 1991 2001 15-20
*Update underway; RFP for consultants issued in January 2018.
Research shows that mandatory programs are more effective than voluntary
programs and that build-first programs produce more affordable units
integrated into new neighborhoods and infill areas than do fee-first programs.
While nexus studies are no longer needed to justify imposition of an in-lieu fee,
jurisdictions with funding resources may wish to contract for professional services
to determine the right balance of sticks and carrots that will make for a
successful program.
With the recent ruling by the California Supreme Court validating the City of San
Jose’s inclusionary housing ordinance and passage of AB 1525 in 2017 affirming
the authority of local governments to implement rental inclusionary programs,
both Santa Cruz and Monterey Counties and each city could consider revisiting
and updating their programs. Moreover, the housing market has rebounded to
pre-recession levels. A well-structured and balanced inclusionary program
93 An online search of the City of Gonzales and King City housing codes could not confirm that
these two jurisdictions have an inclusionary program that mandates a percentage of affordable
units in new market-rate developments.

136 | P a g e
Farmworker Housing Study and Action Plan for Salinas Valley and Pajaro Valley -
Final June 2018
could be used to stimulate production of more low-income housing for rent and
purchase, including units restricted or affordable to farmworkers living year-
round in local communities.
2. Adopt Affordable Housing Opportunity Overlay Zones
Another strategy adopted by cities and counties in California is known as a
Housing Overlay Zone (HOZ) or Affordable Housing Overlay Zone.94 These zones
are incentive-rich districts with layers of incentives added onto existing zoning
ordinances to encourage developers to build housing, especially affordable
housing. Incentives often used to stimulate production of affordable housing
projects include:
Increased density bonus
Increased allowable heights
Lower parking requirements
By-right zoning or administrative project approval
Streamlined permitting
Allowing housing in locations not zoned for residential uses
Impact fee waivers
Lower parking requirements
HOZs offer a number of advantages to local governments and developers:
Avoidance of General Plan and Zoning Amendments: HOZs do not
require the rezoning of land. They create an additional set of
development options that land owners can choose to exercise at their
discretion. In locations not currently zoned for residential development,
HOZs can enable housing construction without going through a lengthy
process of amending existing plans and zoning.
No Additional Cost to Cities and Counties: HOZs do not require additional
expenditures of financial and human resources than would be necessary
without overlays.
Customizable to Local Conditions: HOZs can be tailored to meet the
development needs and desired character of individual neighborhoods
and districts.
Flexible Menu: Incentives can be matched to the needs of developers to
reduce their costs while leveraging the most public gains. They can be
94 As for as we know, the following jurisdictions, all of which are located in expensive coastal
counties, have HOZ policies or policies that include major elements of an HOZ: Alameda,
Buellton, Burlingame, Capitola, Goleta, Los Gatos, Menlo Park, Novato, Orange County, San
Mateo, and Tiburon.
137 | P a g e
Farmworker Housing Study and Action Plan for Salinas Valley and Pajaro Valley -
Final June 2018
used instead of or as a complement to density bonus and inclusionary
housing programs.
Compliance with Regional Housing Needs Allocation (RHNA): HOZs offer
jurisdictions a tool to meet their RHNA obligations for providing their fair
share of the regional housing need without having to rezone large
amounts of land for residential uses.
More Politically Acceptable: Because HOZs are an incentive-based
approach, they avoid some of the challenges and limitations associated
with mandatory inclusionary housing, impact fees, or in lieu fee policies.
To stimulate more farmworker housing in the Pajaro-Salinas Valley Laborshed,
and other areas of the two counties, an innovative strategy would be to create
Farmworker Housing Overlay Zones. These hyper-rich incentive districts, if
carefully structured, could encourage both for-profit and nonprofit developers
to produce housing for agricultural workers. Nonprofit developers may be more
inclined to set aside farmworker units in projects that are 100 percent affordable,
while for-profit developers might see an advantage in including farmworker units
in market-rate developments.
County and local governments, working in partnership, would identify the
geographic areas of the HOZs, the amount of farmworker units required for
projects to qualify for HOZ incentives, the package of incentives to offer to
qualifying projects, and the extent of exemptions from discretionary project-
level approvals. Jurisdictions could also award funding preferences to projects
built in these districts.
In the event developers are hesitant to commit to long-term reservation of units
for farmworkers given the cyclical nature of agricultural labor demand, the HOZ
could allow the farmworker units to float. This means that:
if a unit is vacated by a qualified farmworker and the owner cannot fill the unit
with another qualified farmworker within a specified waiting period, say, six
months, or if the current occupant of a unit no longer performs qualified farm
work, then the owner must make diligent efforts, including expanded outreach,
to fill the next vacant unit with a farmworker.
As a last resort, if the owner absolutely cannot maintain the number of
farmworker units required over a specified longer time period, the units could be
‘decommissioned’ for an extended period, but only upon a finding by local
government that there is no imminent need for as many units to remain in
restricted farmworker use. Vacant units that cannot be filled with farmworkers,
instead, can be filled with other low-income occupants. The management
138 | P a g e
Farmworker Housing Study and Action Plan for Salinas Valley and Pajaro Valley -
Final June 2018
challenges, however, of certifying the farmworker status of existing and
prospective occupants and mixing and matching farmworker units is something
that nonprofit developers would have a much greater capacity and appetite
for than for-profit developers.
3. Capture Land Value Increases through Public Benefit Zoning
Like inclusionary zoning, Public Benefit Zoning (PBZ), sometimes called ‘Land
Value Recapture’, can be used to generate new local revenue for affordable
housing and is discussed in elsewhere in this report. And like an inclusionary
housing program, it can be a powerful tool for leveraging production of
affordable housing by market-rate developers in exchange for land use
concessions.
The difference is primarily in the justification. Inclusionary housing is, in many
ways, about creating inclusive communities where affordable units are built in
new growth areas simultaneously with market-rate units to better achieve social
and economic integration. PBZ, on the other hand, operates on the premise
that land values are created, in large part, by public actions such as zoning
designations and changes. Land values are also created by value-enhancing
externalities like public investment in nearby roads, sewer, water, and electrical
infrastructure, and schools, parks, hospitals, and transit. Therefore, when a land
owner sells the property at a market price or moves to develop it, some of the
value of the land imputed to public action should be ‘recaptured’ and
contribute to community betterment, including affordable housing.
Upzonings from less intensive to more intensive land uses, such as from
agricultural to residential, or single-family to multifamily residential, are the most
obvious instances where public action confers increased land values on current
owners through no actions of their own. The same can be said for increased
density from reduction of set-backs, unit sizes, FARs, parking, and open space
requirements, and increases in height. The tool of “tiers” of additional
density/height has been utilized in San Francisco, with layering of additional
requirements for each additional tier. The City also requires developers in areas
rezoned from industrial to residential to produce more affordable housing than
what is obligated under the City’s inclusionary housing ordinance.
For farmworker housing, public benefit zoning can be used whenever land with
agricultural, industrial, or commercial zoning designations is upzoned to
residential, or when a single-family residential zone is rezoned to multi-family
residential. Agriculturally-zoned land that is contiguous to an urbanized area, is

139 | P a g e
Farmworker Housing Study and Action Plan for Salinas Valley and Pajaro Valley -
Final June 2018
not being used for agriculture, and has poor soil quality, could be a strong
candidate for conversion to residential purposes, especially farmworker housing.
Old warehouses and shopping centers could be converted to mixed-used sites
that include farmworker housing.
When the land is undeveloped, or under-utilized, and its highest and best use is
for housing, local governments can exercise their police powers to extract
considerable benefits from land owners to recover some of the value they
created in the land. These benefits can include a commitment from the owner
or successor owner to build affordable housing for farmworkers, deed a piece of
land for farmworker housing, or pay an in-lieu fee into a local housing trust
earmarked for farmworker housing. In effect, PBZ can be used much like an
inclusionary housing program.
Conclusion
This chapter has identified key land use regulatory and processing barriers noted
by local government officials, affordable housing developers, agricultural
employers and regional leaders. Setting aside the big question of politics, it also
proposes a multitude of actions Santa Cruz and Monterey Counties and local
cities could undertake using their own land use powers to contribute to solving
the housing problems faced by area farmworkers. Some of these actions
involve procedural and code reforms and are already under consideration in
some jurisdictions in the region. Others build on the edifice of what already
exists and enable additional local powers that, if adopted and implemented,
would be at the cutting-edge of innovation.
There are many land use actions within the province of county and city
governments that singly or in combination could help to encourage and
facilitate the development of housing for both seasonal, migrant workers and
year-round, permanent workers. Most of these actions are not a substitute for
public financial investment that will also be needed to deliver affordable homes,
especially for year-round residents who work in agriculture. Strategically
targeted land use reforms coupled with increased funding, however, will open
the door for greater farmworker housing opportunities.
The Study Oversight Committee reviewed the research and formulated the
following suggestions for the Regulatory Reform section of the Action Plan:

140 | P a g e
Farmworker Housing Study and Action Plan for Salinas Valley and Pajaro Valley -
Final June 2018
Objective: Change regulations to remove barriers, streamline processing, and reduce
costs for the development of farmworker housing.
R1. Update Zoning: Promote and fund the update of restrictive and outdated zoning
designations that limit residential densities, height, setbacks, and Floor-Area-
Ratios (FARs), especially in urban cores and corridors, and identify and eliminate
unnecessary or redundant discretionary reviews that cause costly delays and
discourage applicants.
R2. Remove Barriers – Employer-Sponsored Housing: Identify and eliminate barriers
for the development of employer-sponsored housing while ensuring that the
development is built to allow for future conversion to multi-family should the
employer sell the property.
R3. CA Coastal Commission Obstacles: Remove impediments to farmworker housing
within areas subject to the California Coastal Commission through update of
Local Coastal Plans and reform the regulations governing the exemption of
agriculture activities and permits set by the California Coastal Act.
R4. SB 2 Funded Streamlining: Apply for SB 2 funding to update zoning and revise
other regulations to streamline production of farmworker housing and other
housing types.
R5. Priority Processing: Allow for priority processing of by-right, year-round,
permanent farmworker housing projects that meet underlying zoning
requirements.
R6. Ombudsman Assistance: Fund and designate a point-person or ombudsperson
responsible for shepherding farmworker housing project applications through the
local government approval process and advocating for them. Best practice
includes an ombudsman in San Mateo County for farmworker housing.
R7. Template Plans: Design and develop pre-approved plans and adopt modified
development-by-right for farmworker housing, including dormitory-style, modular,
and multifamily prototypes proposed on agricultural parcels meeting specified
site and zoning criteria in unincorporated areas. Best practice includes a recent
approach adopted in Ventura County.
R8. Development Impact Fees: Encourage local jurisdictions to consider adopting
ordinances that waive development impact fees for affordable farmworker
housing.
R9. Fee Deferral: Support local jurisdictions in establishing development fee deferral
programs for affordable and workforce housing and implement the program
when requested by the developer.
141 | P a g e
Farmworker Housing Study and Action Plan for Salinas Valley and Pajaro Valley -
Final June 2018
R10. Fees – Smaller Units: Incentivize smaller, less expensive units by charging
developer impact fees based on unit square footage rather than per unit and
reducing minimum net land area per unit requirements.
R11. Parking Requirements: Encourage local jurisdictions to allow for greater flexibility
in the provision of parking for affordable farmworker housing, where appropriate.
R12. Mixed Use Requirements: Provide greater flexibility in the ratio of residential and
commercial space in mixed-use districts or zones to allow for more space that is
residential.
R13. Density Bonus: Educate local jurisdictions about the application of state-density
bonus to facilitate affordable farmworker housing and encourage the
development of an enhanced or super-density bonus where appropriate.
R14. Outreach: Conduct outreach and education workshops to stakeholders and the
public so that potential applicants and local communities better understand the
rules and regulations governing farmworker housing.
R15. Collaboration: Encourage local jurisdictions to proactively collaborate with
affordable housing developers and develop solutions that remove site-specific
land use barriers whenever possible.
R16. Staff Training: Expand training of city and county staff and local elected officials
about State and local land use laws and regulations and foster can-do
collaborative mindset.
The Salinas Pajaro Agricultural Workers Housing Survey
(SPAWHS)
Executive Summary Within the complex agricultural system of the Salinas Pajaro Laborshed, we
made a purposive effort to choose a representative sample of employers rather
than attempt a random sampling. Once we completed our lists of employers,
we called selected employers to seek their permission to interview a
representative sample of employees. In the case of unwillingness to participate
or inability to contact the employers, we contacted employers from alternate
employer lists in the same type/crop/size category so as to maintain the
representative nature of the selection. More importantly, we implemented a
careful and systematic quota sampling technique to assure a representative
sample of workers. We trained our interviewers to make sure that the final

142 | P a g e
Farmworker Housing Study and Action Plan for Salinas Valley and Pajaro Valley -
Final June 2018
selection of workers included the proper share of different crops, type and size
of employers, and areas of the region. In addition, the interviewers were
directed to choose appropriate proportions according to several demographic
categories including sex, age, indigenous language and H-2A status. We were
successful in interviewing 420 workers across all the employers and came close
to fulfilling our targeted quotas. (See Appendix 1 for list of targets vs actuals.)
Demographics of the Interviewees
In order to represent the farmworker population, our survey aimed to include
more men than women. Of the total, 235 (59%) surveys were completed with
men and 162 (41%) with women. About half of the interviewees were living with
a spouse currently employed as a farmworker. And, men and women were
relatively evenly distributed across age groups. A relatively high proportion of
the interviewees (three quarters) were married.
The interviewee farmworkers are 92% immigrants. No effort was made to select
interviewees by place of birth. However, (consistent with other surveys of
California farmworkers) almost 90% of the interviewees were born in Mexico, 3%
in Central America and about 8% in the United States. Almost two thirds of the
interviewees came from just four states in Mexico: Oaxaca, Michoacán, Jalisco
and Guanajuato.
The sample was targeted to gather half of our sample below the age of 35 years
and half above. Because of this, the group reflected faithfully the relatively
young average age (median 36.5 years in the SPAWHS) found in other surveys of
California farmworkers. The mostly settled immigrant interviewees had been in
the country for an average of about 15 years. The US born workers --mostly the
children of farmworkers -- averaged only 26 years of age.
The clear majority of the immigrant farmworker interviewees have very few years
of schooling, having only complete primary school. Most of the small number of
US born have completed high school.
About one fifth of the interviewees were follow-the-crop migrants who had
spent time outside the two county area to do farm work. These migrants tend
to rent rooms (without kitchens) rather than apartments and houses more than
the settled workers. About half of these migrants come alone to the two-county
area while the others bring close family members with them. The most common
destinations for those who migrate were Yuma, Oxnard and Huron. Of the

143 | P a g e
Farmworker Housing Study and Action Plan for Salinas Valley and Pajaro Valley -
Final June 2018
migrants who responded to this question, 80% say that they would prefer to
have a permanent home in the two counties.
Demographics of other members of the Household
There were 223 households with a parent and minor child living with them. These
223 households had 528 minor children (about equally divided by gender).
There were 31 single mothers in the population with a total of 73 minor children
(with approximately half boys and half girls) living with them.
While the interviewee farmworkers are 92% immigrants, the majority (60%) of the
rest of the household residents are US born. Almost half are US born children.
The immigrant family members had been on average in the US for a long period
of time. This was true even for the relatively few child immigrants. But it is worth
repeating that almost all of the children of immigrants (93%) were born in the US.
Among US born family members, education rates are relatively high with most
adults having finished high school. Among the immigrant family member adults,
like the interviewees, most had only finished primary school. There were almost
no children working in the fields from these families. But, about three quarters of
adult household members were farmworkers.
Types of housing:
Most farmworkers live with others (largely other farmworkers) who are outside
their family budgetary unit. Non-related adult men and women, and non-
related families were all common “joint tenants”. For the entire set of dwellings,
the “extra” residents add an average of 3.2 people per dwelling. Overall, the
residences averaged over 7 people per dwelling when both family and “joint”
residents were combined.
Sometimes, owners or renters will rent out one or more of the rooms (or other
spaces95) in their house or apartment. Twenty-eight percent of owners and 18%
of renters rent or sublease to joint dwellers. Many people were reported as
sleeping outside of bedrooms, of these 79% were adults and 21% were children.
95 These spaces may be garages, lean-tos, travel trailers or other livable units. A lean to is a structure with a
single pitch roof attached to some other structure, like a tree or a wall, etc. It usually has one side open but
not always. Travel trailers are not RVs. They are trailers used for vacation type travel. RVs may be one type
of other liveable space. So may a garden shed, an old car, a camper shell, a play house. etc

144 | P a g e
Farmworker Housing Study and Action Plan for Salinas Valley and Pajaro Valley -
Final June 2018
Most of these non-bedroom sleepers take their rest in the living room or the
garage.
About 15% of the dwellings report that they have extra people sleeping with
them for a peak season in their dwelling. Very few of the respondents (17 of the
total) say that they live in a house subsidized by a public or private agency.
The total number of people per room was calculated by counting all rooms in
the residence except kitchens and bathrooms and dividing the household
population by the number of these rooms. This population reports stunningly
high rates above the severely crowded condition of 2.0 people per room. This is
true of almost all the subgroups of the population. Another way to measure
crowdedness is using the number of people per bathroom. Again, severe
crowdedness was found for the farmworkers with averages for most groups at
above 5 people per bathroom.
Among the respondents about two fifths live in houses, 30% in apartments and
19% in rented rooms (without kitchens) either in houses or apartments. Another
12% live in other types of dwellings, 89% were renters and 11% owners. However,
a quarter of the owners own mobile homes not houses.
For the owner occupied dwellings, we calculated a mortgage paid per room.
The median mortgage paid per room in the 29 houses that reported data is $320
per month and for the mobile homes it was $190 per month.
In order to determine the monthly rental cost per person, we created a rent per
person variable. For this, the total rent paid was divided by the number of
people per dwelling. Across all renters, the mean is $217 per month and the
median is $185 per month per person.
The variables related to utility payments – electricity, gas, water -- were
challenging to analyze since there were many methods of payment: paying
separately for each, paying two or more together and including certain
payments included in the rent. Despite this obstacle, it was possible to
determine that a large proportion of the population pays a substantial amount
for all three of the utilities -- a mean range of $120 to $179 per month.
Unfortunately, many of the costs were impossible to calculate with any certainty
due to conflicting answers to questions. Many of the respondents had utilities
included in rent but due to overlapping categories clear calculations were
difficult. Those people (81% are men) who are living by themselves (almost half
report living in rooms) rarely pay for utilities directly. Only 7% of these people
pay for utilities compared to 40% for those who live in families.
145 | P a g e
Farmworker Housing Study and Action Plan for Salinas Valley and Pajaro Valley -
Final June 2018
The analysis of the payment for garbage, telephone service, cable service and
internet is contaminated by overlapping reporting by the respondents. Probably
the most interesting element of the responses to these questions is the number or
proportion of dwellings that have each of the services. The data from these
questions are useful in that they show that large numbers have telephone, cable
and internet service but the information about payments for these is not
useable.
A substantial number of respondents complained of some problem with basic
housing conditions that they experience in their current dwelling. Out of those
who responded, 188 complained about one or more conditions. In addition, an
open-ended question was asked about complaints in dwellings where they had
lived in the previous two years. There were 56 complaints registered about these
dwellings. Also, when asked if the owner responded when repairs were
necessary, 50 people responded that the owner took too long to fix the problem
or did not fix it.
When asked about reducing expenditures on food or medicine due to the high
cost of housing, fully 60% (215) of those that responded, responded affirmatively.
Most (58%) respondents (211) said that they had heard of community programs
to reduce rent.
Most farmworkers in the Salinas-Pajaro Laborshed go to work in their own car or
in the car of a friend or relative. And, despite the long distances between the
different parts of the study area, most farmworkers travel a relatively short
distance to work. About two thirds travel less than 25 miles to work, and about
three quarters report spending 30 minutes or less to get to work. It is a minority
that have to travel far or take a long time to get to work. In most farmworker
surveys, one finds high and frequent payments for rides to work from third
parties. But, in this survey, most people pay for the gas for either their own or a
friend or relative’s car. The interviewees report that they are paying about $40
per week to get to work. The number of interviewees with a driver’s license is
substantial. Many seem to have benefited from AB 60 which went into effect for
undocumented workers in 2015. Of the 215 that have licenses, 102 (or 47%) got
them since 2015.
The data we obtained about travel to the store, clinic and school was not
satisfactory. Those who responded about travel to the clinic and store did not
report long trips.
The majority of the workers in our sample do not work all year in agriculture. The
median of months worked is about 7.5. The workers who choose to follow the

146 | P a g e
Farmworker Housing Study and Action Plan for Salinas Valley and Pajaro Valley -
Final June 2018
crops (FTC) and travel to Huron, Yuma, Oxnard or elsewhere are able to work
more months per year. Among the FTC migrants, 44% work all year, while only
20% of the non-migrants obtain year round employment.
With respect to longevity with the current employer, the median is 4 years.
However, almost a quarter of the workers have been with their employer for 8
years or more. Also, those who follow the crops, though they work more months
per year, are less likely to have a long term employer.
The median annual income of the households studied is about $25,000, an
amount that may be insufficient to make ends meet for many families in the
expensive Salinas-Pajaro Laborshed.
Twenty-six percent of respondents worked on an organic or a mixed farm. We
did not select workers on the basis of task. So, it is interesting to note that almost
half of the workers report that they are harvesters, about 16% packers, many do
unskilled pre-harvest tasks and many do skilled work such as machine operation
or irrigation.
Median hourly wages were $12.79 while the mean was $13.64 per hour. Very
few differences emerged among the different groups with regard to hourly
wages. Apparently, grapes pay a bit less than vegetables and unskilled pre-
harvest work is paid less than other tasks. There were no significant differences
based on age, sex, or years in the United States.
Of the 357 farmworkers who were born in Mexico or Central America, many
have assets in their home country. Seventy-four (or about one fifth) own a
house in their home country and 26 own a plot of land to build a house. Twenty-
six own land to plant crops and 19 have a car or truck in their native land.
Assets in the US are limited. Only 41 of the 357 foreign born respondents own the
place they live. But, 223 own a car. Of the 31 US born in our sample, only 2 own
the place where they live and fewer than half or 14 have cars.
Methods: Surveys and Interviews
Our study addressed a number of important questions with respect to the
current and projected demand for agricultural worker housing for workers living
in the Salinas-Pajaro “Laborshed.” Because much of the information regarding
recent developments is anecdotal, more in-depth and empirical research was
necessary. The assessment was designed to reveal current housing conditions
among farmworkers, identify demand for particular types of housing in the
Salinas and Pajaro Valley region.

147 | P a g e
Farmworker Housing Study and Action Plan for Salinas Valley and Pajaro Valley -
Final June 2018
The most important method for obtaining answers to questions regarding
housing for farmworkers is to gather first-hand data. In this case, we asked
workers in the Salinas Pajaro Laborshed, employers in the study area and other
stakeholders both within and outside the region. We collected primary data
using three different tools.
• Agricultural worker Surveys: goal of 400 total. Completed 406
o The agricultural worker surveys provide information on:
worker characteristics (year-round, seasonal, migrant),
composition of households and families,
current housing conditions,
affordability issues and
other data requested by stakeholders and agencies.
• Employer interviews: goal of 30 total. Completed 66.
o The employer interviews address:
proposed changes to crop acreages and potential
mechanization,
direct hires vs. contractors, and need for H-2A workers and
other information requested by stakeholders and agencies.
• Stakeholder interviews: goal of 15 total. Completed 21.
o In depth interviews were held with various other key informants who
have particular knowledge on agricultural housing.
Farmworker Survey
We carried out an employer-based, face-to-face survey with 406 selected
farmworkers who are employed in the Salinas Pajaro Laborshed. The survey
instrument was developed with CIRS staff, Dr. Rick Mines and a subcommittee of
the Oversight Committee. There were 11 revisions before the survey instrument
was completed and approved for use. This included several pre-tests and
careful review of the Spanish translations of technical terms that would be
appropriate for the age and region of origin of the farmworkers to be
interviewed. The full instrument is in Appendix 4 in both Spanish and English.
Sampling Frame
Within the complex agricultural system of the Salinas Pajaro Laborshed, we
made a purposive effort to choose a representative sample of employers rather
than attempt a random sampling. Reviewing the sampling universe in the
region, we determined that a purposive, systematic targeted sample would

148 | P a g e
Farmworker Housing Study and Action Plan for Salinas Valley and Pajaro Valley -
Final June 2018
actually be more representative than a random sample. So we developed such
a sample frame to gather information on where farmworkers currently live,
under what conditions, how much they pay for housing and their preferences
for housing type and location, among other data requested by partners. It is
essential to understand that our sampling was not a convenience sample to
facilitate data collection, nor a true random sample, but instead a systematic
effort to achieve representativeness. Our strategy required great rigor in its
application.
The Sampling Universe
We started by creating a universe list of employers of all types in the Laborshed.
In the universe of agricultural employers in the Salinas Pajaro Laborshed, we
identified and worked from a list of 1,500 individual employers. This included
farmers who directly hire workers (both open-field farmers and nurserymen),
packing house managers, labor contractors and custom farm operators. We
used data from multiple sources to create the universe list and to arm the list
with sufficient data to allow us to take a representative sample. These data
sources included lists of employers on crop association lists, Agricultural
Commissioner restricted materials permit and Operator ID files, lists of Farm Labor
Contractors from the California State Department of Industrial Relations, Division
of Labor Standards Enforcement farm labor contractor licensing, California
Department of Food and Agriculture, Pest Exclusion Branch nursery licensing
program, U.S. Department of Labor’s Wage and Hour Division farm labor
contractor registration files, county agricultural commissioner production data,
US Census data and other sources, including private lists of farm employers.
All FLC and Grower data from the agencies were obtained during the first
months of 2017. At that time, only data for 2016 was available, owing to data
processing delays at agencies which receive registration information from
employers or their agents. For example, the FLC license records from DLSE were
dated 3/15/17. What this administrative delay by agencies means is that lists
used to identify employers during 2017, when interviews were conducted, were
based on information valid for 2016 or the earliest months of 2017, not for all of
2017. Since FLC licenses expire during random months of the year, and newly
licensed FLCs are approved as well all of the time, it was not possible to have a
fully accurate, up-to-date list when interviews were initiated. Since we sampled
employers using the strata of geography, crop, and type of employer
differences we were able to ensure all were represented in the sample.

149 | P a g e
Farmworker Housing Study and Action Plan for Salinas Valley and Pajaro Valley -
Final June 2018
We strove to include each category of employer according to its share of the
labor market and included the various distinct agro-geographic zones and crop
groups of the Laborshed. Within each category of employer, we further
differentiated by size of employer and then randomly chosen from within the
various size strata. Given that we had a limited number of employer interviews
to complete, we included in our selection as representative a sample as
possible with regard to employer type, crop and size. We made lists of first,
second and third choices of employers to interview in each subcategory and in
this way if some employers refused an interview, we still retained the
representativity of the selections.
Sampling Workers
Once we completed our lists of chosen employers, we asked the City of Salinas
to send letters of introduction to all of them (1600) in early 2017 explaining the
survey and asking for participation. Following this, we called selected employers
to seek their permission to interview a representative sample of employees. In
the case of unwillingness to participate or inability to contact the employers, we
contacted employers from the alternate employer list in the same
type/crop/size category so as to maintain the representative nature of the
selection. We were successful in interviewing 406 workers across all the
employers.
There are several subgroups of workers that routinely slip through an effort at
random sampling. These include women, migrants, short term workers, those
that don’t speak Spanish, and young unaccompanied males. Our target
sampling method assured participation of members of these groups. Unless
there is a systematic effort to include all of these groups, they may not be
represented. Therefore, the sampling began with a review of the Census data,
National Agricultural Workers Survey data and other survey data to determine
the proportion of the different demographics composing the agricultural labor
force.
Once the categories of workers were determined, a selection sheet was
created with target numbers of interviews for each category. The CIRS survey
team manager was in close contact throughout the survey period with each of
the surveyors and kept an ongoing count of targeted individuals after each
interview (see Appendix 1). As one can see from the selection sheet, there were
many overlapping categories; for example, a respondent could be a long-term,
young, and indigenous woman. The interview team continued interviewing until
all the goals in the second column were fulfilled.
150 | P a g e
Farmworker Housing Study and Action Plan for Salinas Valley and Pajaro Valley -
Final June 2018
All interviews were conducted in person. When employers gave permission, the
interviewers went to the workplace (field, transportation hub, or packing facility)
to speak briefly about the study and collect contact information to arrange to
conduct the interviews outside of the workplace at a mutually convenient time.
About a third of the farmworkers interviewed were identified elsewhere, in
places such as churches, community centers, and gathering places.
Due to the national atmosphere around increased immigration enforcement,
there were some concerns at the beginning of the summer 2017 about potential
cooperation with the study. California Assemblymember Anna Caballero taped
Public Service Announcements that were released to Spanish-language media
to assure the community about the integrity of the study and the secure
confidentiality of the data collected. The interviewers encountered no
problems with farmworkers refusing to be interviewed because of security
concerns. A large factor in their confidence and comfort level is likely
attributable to the personal qualities of the interviewers, who established good
rapport with the people they were seeking to interview.
The farmworkers were informed that all information was confidential. They were
handed a bilingual card with a statement about confidentiality, that no
information about legal status would be requested, and Dr. Rick Mines’ phone
number for any questions. The surveys took from 30 to 60 minutes. The
farmworkers were compensated for their time with twenty dollars cash.
All the interviews were checked for completion and accuracy by the CIRS
survey manager and the tabulation of the overlapping target sampling scheme
was closely watched to make sure that the goal of representativity was
achieved.
Employer Interviews
A survey of agricultural employers in the Salinas Pajaro Laborshed was also
conducted as part of this assessment. In order to obtain a complete overview
of the agricultural employment landscape within the region, the survey included
growers, farm management companies, packer shippers, processors and farm
labor contractors working in the Salinas Pajaro Laborshed. This series of interviews
provided insight from the employers’ perspective into the composition of the
workforce, where they live, and what type of housing they live in, how they are
hired, what work they do, and more. The employer interviews provided data on
changing demand for workers and challenges to being successful in the region.
We obtained employer information including: current and projected acreage in

151 | P a g e
Farmworker Housing Study and Action Plan for Salinas Valley and Pajaro Valley -
Final June 2018
various crops; wages and benefits; production techniques, including density of
plantings and mechanization; current and projected labor requirements,
including permanent and seasonal employees; current and projected use of
farm labor contractors and vineyard management companies; reasons for
direct vs. indirect hire; and current and projected provision of farmworker
housing. We also asked employers about potential farmworker housing models
that they would like to see implemented in the area.
We completed 66 telephone and in-person interviews with agricultural
employers in the Salinas Pajaro Laborshed. The interview process permits more
probing and open-ended responses resulting in more complete information
than that obtained in a mail or online survey and results in more responses. One
goal of the interviews was to solicit the views of employers about the status and
availability of farm labor and farm labor housing in the Laborshed.
Stakeholder interviews
The project also interviewed 21 other respondents who are active in the industry
and could give us insights into the perceived housing needs of workers. Key
informants were identified with the assistance of the Oversight Committee. These
stakeholders included employers not included in our selection process – both
farmers and farm labor contractors -- farmworker advocates, housing
developers, housing managers, land use planners, service providers, lawyers
and academics.
These interviews explored a range of issues, including perceived demand for
additional farmworker housing, perceptions of the type of housing currently
available and statements on the needs and recommendations for improving
farmworker housing.
Recruitment, Training, and Supervision of worker interviewers:
The interviewers were recruited in May and June 2017 through flyers distributed
by Oversight Committee members to their contacts, including community
colleges, universities, and community organizations. Announcements were
posted on City and County websites and Facebook pages. In June, twenty
interviewers were hired and trained. They were male and female, ranging in age
from 20 to 60 years of age. All were native Spanish speakers and local residents
with knowledge of different areas of the Pajaro and Salinas Valleys. Some had
connections with multi-lingual speakers of indigenous languages to assist with
translations.

152 | P a g e
Farmworker Housing Study and Action Plan for Salinas Valley and Pajaro Valley -
Final June 2018
The interviewers were thoroughly trained by Dr. Rick Mines, an experienced
farmworker survey expert, and CIRS survey manager, Ildi Carlisle-Cummins. In
addition to training the surveyors in how to complete the forms, there was also a
section on ethics in social science research that met the NIH standards96. The
interviewers were accompanied for at least two interviews by either Dr. Mines or
Ms. Carlisle-Cummins to be certain that the interviews were properly
implemented. Interviewers were required to review their interviews within 24
hours of implementation to check for, and correct, any recording errors. The
survey manager did not pay the interviewer for the interviews until they were
correctly completed. CIRS staff oversaw the entire survey process in
collaboration with Dr. Rick Mines. The training manual used is included in
Appendix 3.
Analysis of the Data
Demographics of the Interviewees
The SPAWHS captured a representation of both men and women among the
farmworker interviewees. Twenty-three H-2A workers97 (all men) were excluded
from this analysis because of their unique situation. There is a separate report of
survey results about them at the end of this section. As a result of this exclusion,
there were 397 interviewees, including 235 men (59%) and 162 women (41%) in
the primary sample.
Many of these households are composed of married couples both of whom are
farmworkers. Of the 235 men, 139 (59%) live with their wives and 103 of these
wives are also farmworkers. Of the 162 women interviewees 108 (66%) live with
their husbands and 94 of these husbands are also farmworkers. So, in sum, 197
of the 397 (or roughly half of the interviewees) live with a spouse or companion
who is also a farmworker.
These male and female respondents were distributed relatively evenly across
age groups. There were no women less than 18 and a lower proportion of them
were above 60 years of age (see Figure 21).
96 https://www.niehs.nih.gov/research/resources/bioethics/whatis/index.cfm 97 H-2A is a visa program for agricultural workers who are allowed into the US temporarily without their
families.

153 | P a g e
Farmworker Housing Study and Action Plan for Salinas Valley and Pajaro Valley -
Final June 2018
FIGURE 21 DISTRIBUTION OF PARTICIPANTS BY GENDER AND AGE
Thirteen percent of the sample were indigenous Mexicans.98 Some indigenous
interviewees who would have self-identified as indigenous may have been
missed. There were no follow up questions seeking this information. In observing
the community there is a distinct impression that the universe of farmworkers has
a higher percentage of indigenous than the surveyors were able to identify (see
Figure 22).
98 Of those interviewed, most could communicate in Spanish but spoke their native language much better.
We found some translation services were available in clinics and social service centers especially for Triqui
and Mixteco speakers.
3
33
104
72
22
0
23
80
50
10
L T 1 8 1 8 T O 2 5 2 6 T O 3 9 4 0 T O 5 9 6 0 O R M O R E
SPAWHS N=397
DISTRIBUTION OF INTERVIEWEES BY GENDER
BY AGE GROUPSmen
women

154 | P a g e
Farmworker Housing Study and Action Plan for Salinas Valley and Pajaro Valley -
Final June 2018
FIGURE 22 SELF-IDENTIFIED INDIGENOUS WORKERS
Almost 90% of the interviewees were born in Mexico and about 8% born in the
US. These “locally” born were mostly second generation children of Mexican
immigrant farmworkers. There were also 3% Central Americans. Almost two
thirds of all farmworkers in the Salinas Pajaro Laborshed come from four Mexican
states: Oaxaca, Michoacán, Jalisco and Guanajuato (see Figures 23 and 24).
FIGURE 23 INTERVIEWEES BY COUNTRY OF BIRTH
14
17
11
9
M I X T E C O T R I Q U I Z AP O T E C O O T R O
SPAWHS N=397
DISTRIBUTION OF 51
SELF-IDENTIFIED INDIGENOUS
89%
3% 8
%
M E X I C O C E N T R AL AM E R I C A U S
SPAWHS N=388
DISTRIBUTION OF INTERVIEWEES BY COUNTRY OF
BIRTH

155 | P a g e
Farmworker Housing Study and Action Plan for Salinas Valley and Pajaro Valley -
Final June 2018
FIGURE 24 DISTRIBUTION OF INTERVIEWEES BY PLACE OF BIRTH IN MEXICO
About three quarters of farmworkers we interviewed are married, a proportion
considerably higher than the California average of about 50%99. In the age
groups, 26 to 59 a full 80% are married (see Figures 25 and 26). Only 34% of those
18 to 25 are married while 82% of those 40 to 59 are. A considerable proportion
of these are not living with their spouses who may be in Mexico.
99 https://www.mercurynews.com/2007/09/12/california-marks-marriage-milestone-majority-are-unwed/
21%
19%
14%
10%
26%
8%
3%
SPAWHS N=389
DISTRIBUTION OF MEXICAN BORN BY STATE OF
BIRTH

156 | P a g e
Farmworker Housing Study and Action Plan for Salinas Valley and Pajaro Valley -
Final June 2018
FIGURE 25 INTERVIEWEES BY MARRIAGE STATUS
FIGURE 26 MARRIAGE STATUS OF 3 AGE GROUPS
The median age of immigrant farmworker interviewees is 37 years for women
and 36 years for men. One can see from Figure 7 below that, on average, the
73%
22%
4%
2%
M AR R I E D S I N G L E D I V O R C E D WI D O W
SPAWHS N=392
DISTRIBUTION OF INTERVIEWEES BY MARRIAGE
STAUS
64%
18%
7%
35%
79% 82%
2%
2%
8%
0%
0% 3
%
1 8 T O 2 5 ( 5 5 ) 2 6 T O 3 9 ( 1 8 4 ) 4 0 T O 5 9 ( 1 1 9 )
SPAWHS N=358
DISTRIBUTION OF MARRIAGE STATUS BY 3 AGE
GROUPS
Single Married Divorced Widow
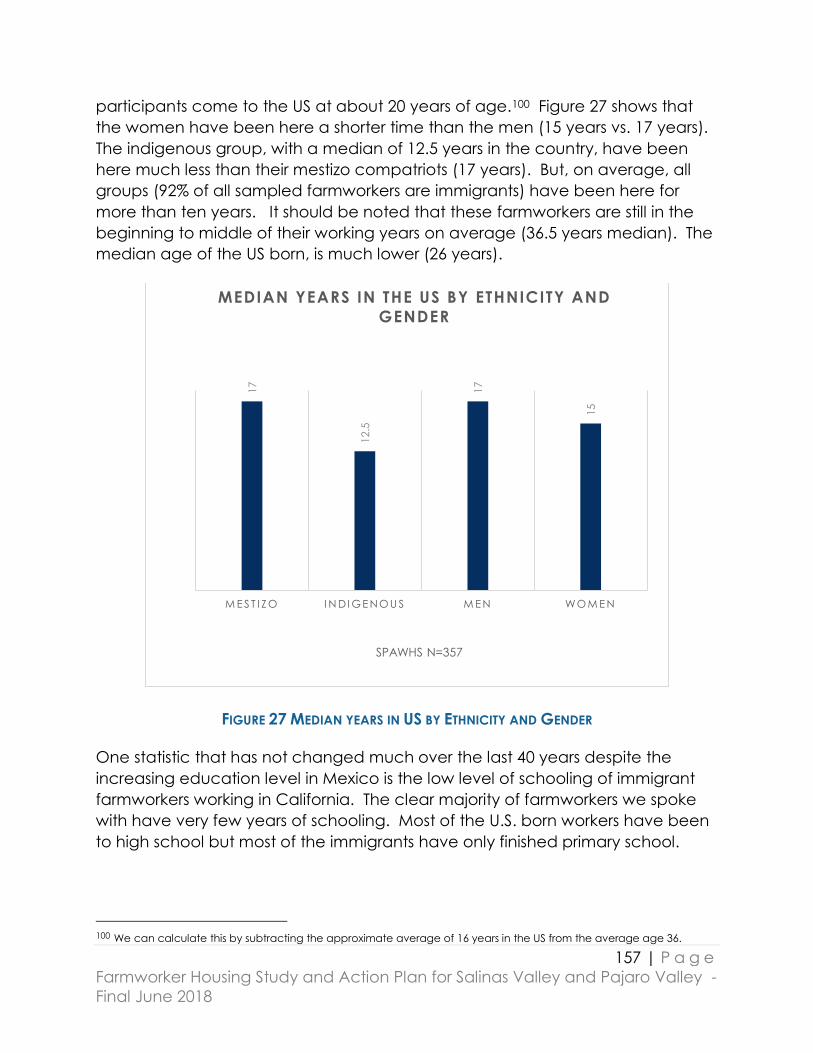
157 | P a g e
Farmworker Housing Study and Action Plan for Salinas Valley and Pajaro Valley -
Final June 2018
participants come to the US at about 20 years of age.100 Figure 27 shows that
the women have been here a shorter time than the men (15 years vs. 17 years).
The indigenous group, with a median of 12.5 years in the country, have been
here much less than their mestizo compatriots (17 years). But, on average, all
groups (92% of all sampled farmworkers are immigrants) have been here for
more than ten years. It should be noted that these farmworkers are still in the
beginning to middle of their working years on average (36.5 years median). The
median age of the US born, is much lower (26 years).
FIGURE 27 MEDIAN YEARS IN US BY ETHNICITY AND GENDER
One statistic that has not changed much over the last 40 years despite the
increasing education level in Mexico is the low level of schooling of immigrant
farmworkers working in California. The clear majority of farmworkers we spoke
with have very few years of schooling. Most of the U.S. born workers have been
to high school but most of the immigrants have only finished primary school.
100 We can calculate this by subtracting the approximate average of 16 years in the US from the average age 36.
17
12.5
17
15
M E S T I Z O I N D I G E N O U S M E N WO M E N
SPAWHS N=357
MEDIAN YEARS IN THE US BY ETHNICITY AND
GENDER

158 | P a g e
Farmworker Housing Study and Action Plan for Salinas Valley and Pajaro Valley -
Final June 2018
The indigenous interviewees average less than a primary education level or 4.5
years (see Figures 8 and 9).
FIGURE 28 YEARS OF SCHOOLING -- INTERVIEWEES
Again, one can see clearly in Figure 9 that most of the U.S. born have
completed high school (57%) while most of the immigrants have only completed
primary school (53%).
4.5
7.3
6.6
11.1
M E X I C O
I N D I G E N O U S
( 4 9 )
M E X I C O
M E S T I Z O ( 2 9 0 )
C E N T R AL
AM E R I C A ( 1 1 )
U S - B O R N ( 3 1 )
SPAWHS N=381
AVERAGE YEARS OF SCHOOLING
BY IMMIGRANTS AND US-BORN
INTERVIEWEES

159 | P a g e
Farmworker Housing Study and Action Plan for Salinas Valley and Pajaro Valley -
Final June 2018
FIGURE 29 DISTRIBUTION OF EDUCATION BY PLACE OF BIRTH
Definitions of the Household Units
“Two-thirds of America's households are also classified as families, according to
the latest figures from the U.S. Census Bureau.
Those two terms -- household and family -- are often used interchangeably, but
the Census Bureau draws a careful distinction:
• A household consists of one or more persons living in the same house,
condominium or apartment. They may or may not be related.
• A family has two or more members who live in the same home and are related
by birth, marriage or adoption.
Think of it this way: All families are also households, but not all households are
families.” (Thomas, 2012)
In this report a different total sample number is used for different purposes
depending on the quality of the data for the question at hand. For many of the
analyses there were a total of 397 in the sample (all the interviewees, except the
8%
18%
27%
7%
17%
6%
14%
3%
0%
0%
6%
0%
15%
21%
45%
12%
SPAWHS N=388
DISTRIBUTION OF EDUCATION CATEGORIES
BY PLACE OF BIRTH FOR INTERVIEWEES
immigrant (355) US born(33)
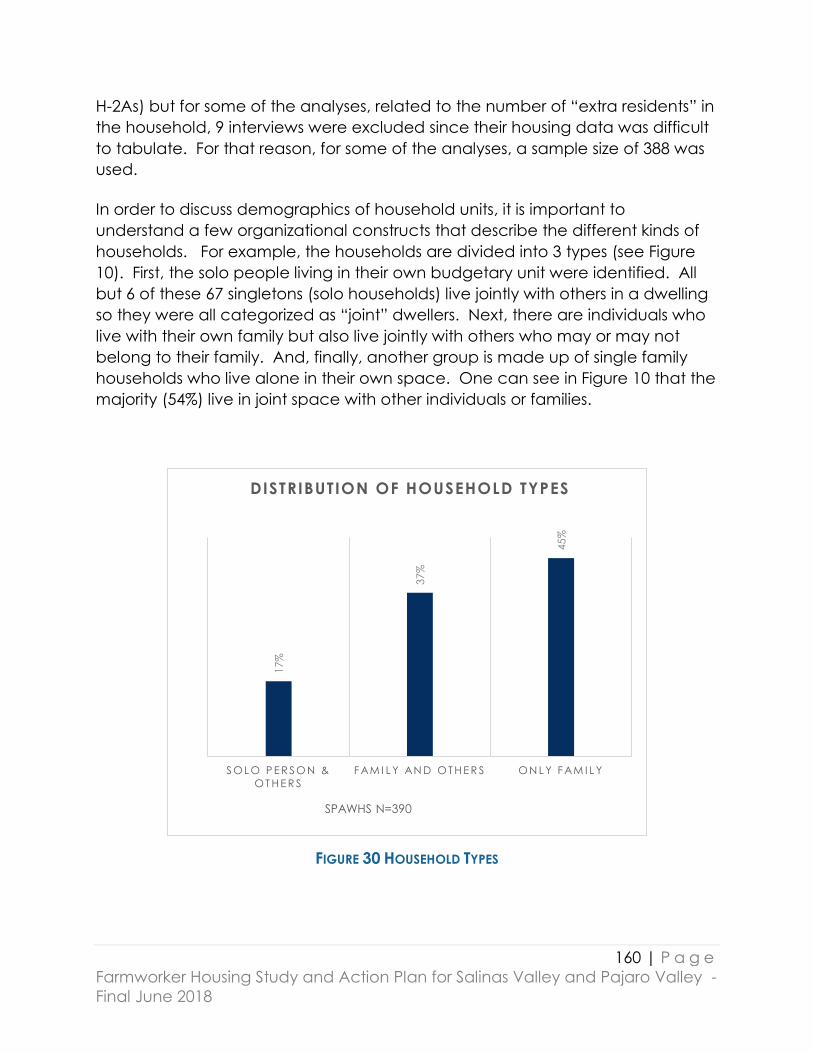
160 | P a g e
Farmworker Housing Study and Action Plan for Salinas Valley and Pajaro Valley -
Final June 2018
H-2As) but for some of the analyses, related to the number of “extra residents” in
the household, 9 interviews were excluded since their housing data was difficult
to tabulate. For that reason, for some of the analyses, a sample size of 388 was
used.
In order to discuss demographics of household units, it is important to
understand a few organizational constructs that describe the different kinds of
households. For example, the households are divided into 3 types (see Figure
10). First, the solo people living in their own budgetary unit were identified. All
but 6 of these 67 singletons (solo households) live jointly with others in a dwelling
so they were all categorized as “joint” dwellers. Next, there are individuals who
live with their own family but also live jointly with others who may or may not
belong to their family. And, finally, another group is made up of single family
households who live alone in their own space. One can see in Figure 10 that the
majority (54%) live in joint space with other individuals or families.
FIGURE 30 HOUSEHOLD TYPES
17%
37%
45%
S O L O P E R S O N &
O T H E R S
F AM I L Y AN D O T H E R S O N L Y F AM I L Y
SPAWHS N=390
DISTRIBUTION OF HOUSEHOLD TYPES

161 | P a g e
Farmworker Housing Study and Action Plan for Salinas Valley and Pajaro Valley -
Final June 2018
Other Definitions Used
Parents with Children: Households with parents and children were identified.
Families with parents (223 of the 397) and single mother families (of which there
are 31) were identified.
Follow the Crop Migrants: People who leave the target counties to work
elsewhere were identified as “follow the crop migrants” (FTC).
Shuttle Migrants: Those who leave the target counties for 6 months or more were
identified as “shuttle migrants”.
Associated Household Members: There is also a category of the population
described from data that excludes the interviewees and is made up only of the
other members of these families/household units. As with the interviewee data,
the categories of migrants, joint households, two parent households and single
mother households are also used to analyze the data.
Indigenous: People from home towns in Mexico where the Native American
language is still spoken rather than native Spanish speakers. (self-identified)
Immigrants: People included in this study who were not born in the US.
Adult: 18 years of age or older.
In addition, there are data reported on income level, crops and tasks, and
location of residence in the two-county area.
Household Units--Who are household members?
This section will primarily describe household or family members of the workers
who were interviewed but who were not interviewed themselves (associated
household members). The figures and population discussed in this section will
refer to these family/ household unit members unless otherwise indicated. The
data on associated household members differs from the data on interviewed
workers.101
101 The term household and family are used interchangeably in this report. Both are defined as
the budgetary unit. Namely, if a group of people (overwhelmingly blood relatives) share the
budget they are counted as a family or household. Those outside the family (budgetary) unit
that reside in the same living space or dwelling are called “joint dwellers.”

162 | P a g e
Farmworker Housing Study and Action Plan for Salinas Valley and Pajaro Valley -
Final June 2018
Ninety-two percent of the farmworkers interviewed are immigrants. But 59% of
family members that live in their households are U.S. born. Fully 48% of the family
members in these households are U.S. born children under the age of 18. The
household members over 25 are predominantly immigrants (see Figure 11
below).
FIGURE 31 DISTRIBUTION OF ASSOCIATED FAMILY MEMBERS BY PLACE OF BIRTH AND AGE
The 432 immigrant associated family members for which there is information
have been in the country a long time given their age. The median length of
time in the United States for those few children born abroad is ten years. For
those who are older, it is logical that the older they are, the longer they have
been in the country (see Figure 12 below). Among the households headed by
an immigrant only 7% of the children under 18 were born abroad and 93% are
US born. This is a very settled immigrant group of farmworkers.
3% 6
%
17%
12%
2%
48%
6%
4%
0%
0%
L E S S T H AN 1 8 1 8 T O 2 5 2 6 T O 3 9 4 0 T O 5 9 6 0 O R M O R E
DISTRIBUTION OF FAMILY MEMBERS BY PLACE OF
BIRTH AND AGE GROUPS
Immigrant US born
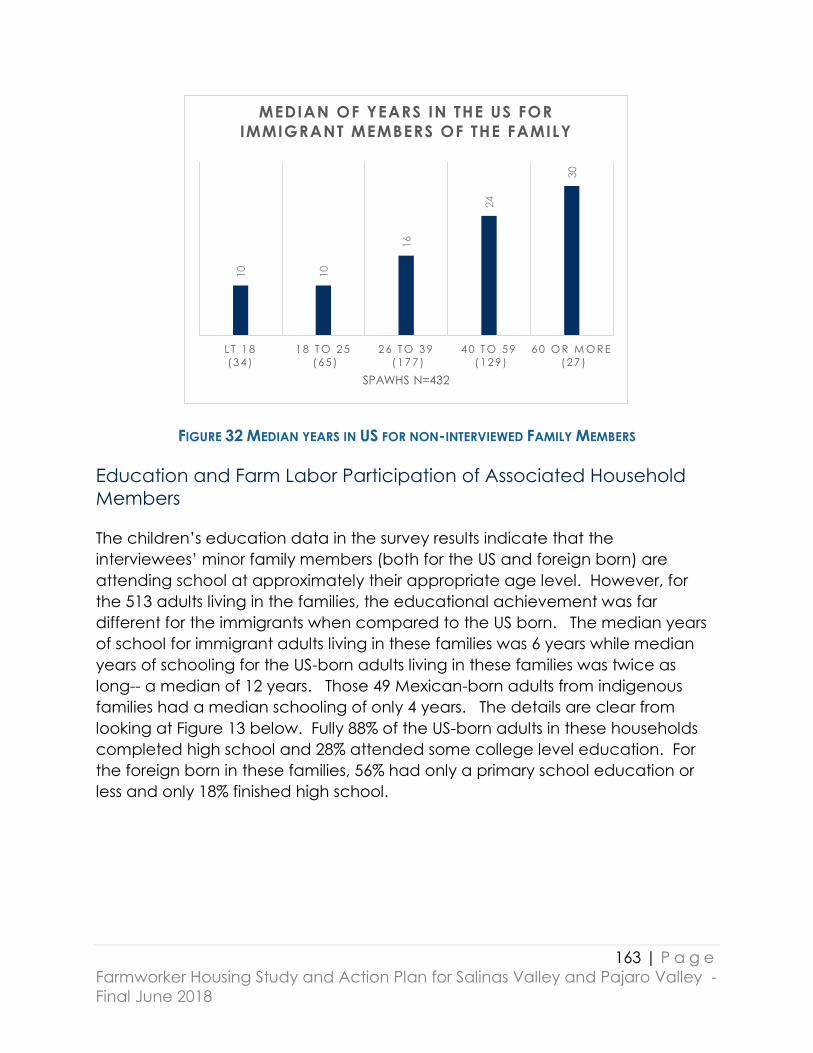
163 | P a g e
Farmworker Housing Study and Action Plan for Salinas Valley and Pajaro Valley -
Final June 2018
FIGURE 32 MEDIAN YEARS IN US FOR NON-INTERVIEWED FAMILY MEMBERS
Education and Farm Labor Participation of Associated Household
Members
The children’s education data in the survey results indicate that the
interviewees’ minor family members (both for the US and foreign born) are
attending school at approximately their appropriate age level. However, for
the 513 adults living in the families, the educational achievement was far
different for the immigrants when compared to the US born. The median years
of school for immigrant adults living in these families was 6 years while median
years of schooling for the US-born adults living in these families was twice as
long-- a median of 12 years. Those 49 Mexican-born adults from indigenous
families had a median schooling of only 4 years. The details are clear from
looking at Figure 13 below. Fully 88% of the US-born adults in these households
completed high school and 28% attended some college level education. For
the foreign born in these families, 56% had only a primary school education or
less and only 18% finished high school.
10
10
16
24
30
L T 1 8
( 3 4 )
1 8 T O 2 5
( 6 5 )
2 6 T O 3 9
( 1 7 7 )
4 0 T O 5 9
( 1 2 9 )
6 0 O R M O R E
( 2 7 )
SPAWHS N=432
MEDIAN OF YEARS IN THE US FOR
IMMIGRANT MEMBERS OF THE FAMILY
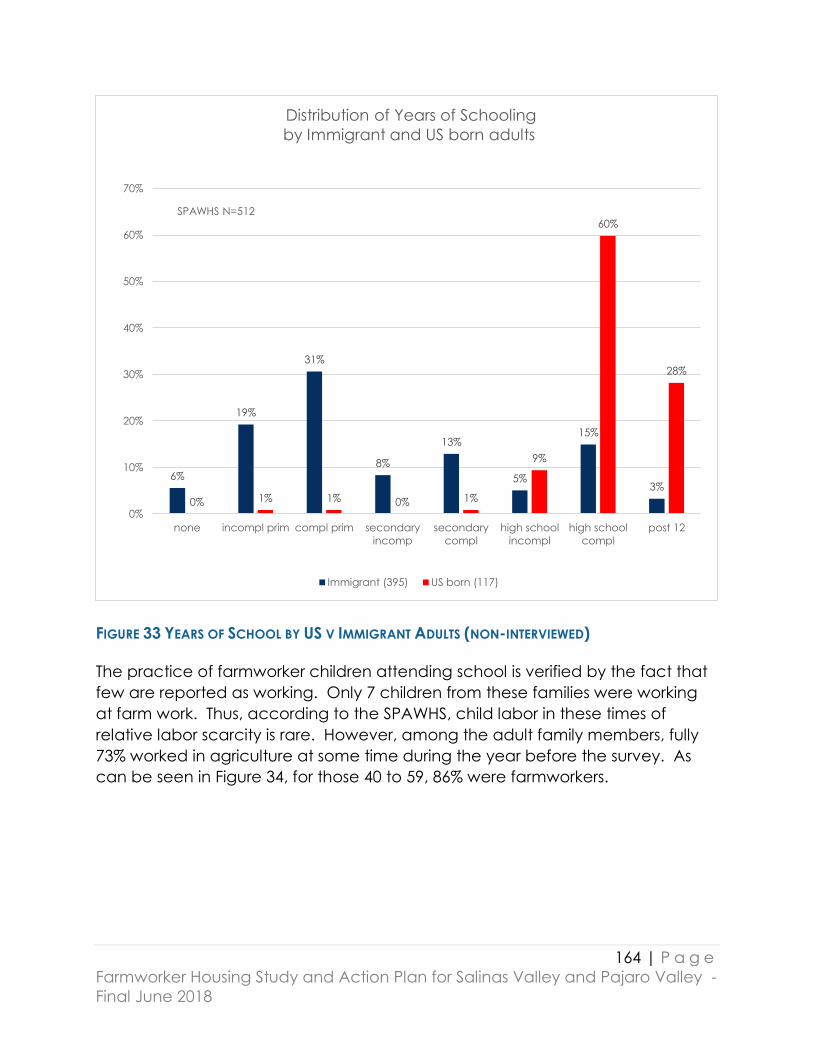
164 | P a g e
Farmworker Housing Study and Action Plan for Salinas Valley and Pajaro Valley -
Final June 2018
FIGURE 33 YEARS OF SCHOOL BY US V IMMIGRANT ADULTS (NON-INTERVIEWED)
The practice of farmworker children attending school is verified by the fact that
few are reported as working. Only 7 children from these families were working
at farm work. Thus, according to the SPAWHS, child labor in these times of
relative labor scarcity is rare. However, among the adult family members, fully
73% worked in agriculture at some time during the year before the survey. As
can be seen in Figure 34, for those 40 to 59, 86% were farmworkers.
6%
19%
31%
8%
13%
5%
15%
3%
0% 1% 1% 0% 1%
9%
60%
28%
0%
10%
20%
30%
40%
50%
60%
70%
none incompl prim compl prim secondary
incomp
secondary
compl
high school
incompl
high school
compl
post 12
SPAWHS N=512
Distribution of Years of Schooling
by Immigrant and US born adults
Immigrant (395) US born (117)
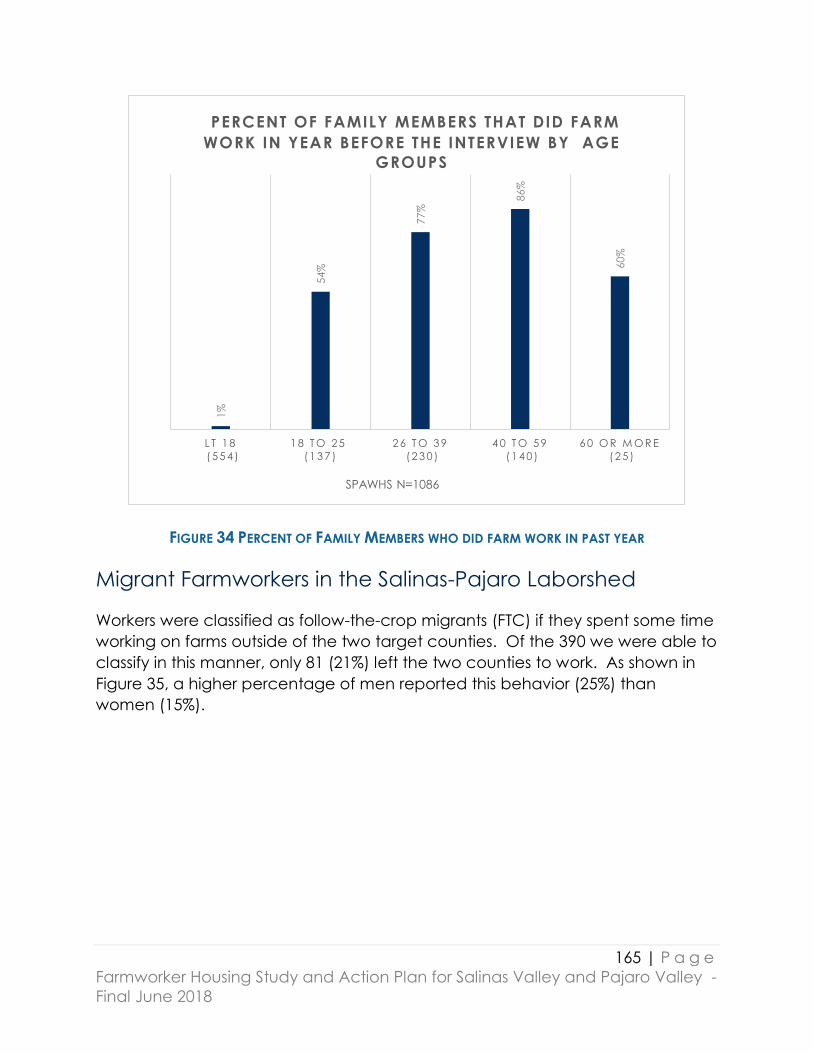
165 | P a g e
Farmworker Housing Study and Action Plan for Salinas Valley and Pajaro Valley -
Final June 2018
FIGURE 34 PERCENT OF FAMILY MEMBERS WHO DID FARM WORK IN PAST YEAR
Migrant Farmworkers in the Salinas-Pajaro Laborshed
Workers were classified as follow-the-crop migrants (FTC) if they spent some time
working on farms outside of the two target counties. Of the 390 we were able to
classify in this manner, only 81 (21%) left the two counties to work. As shown in
Figure 35, a higher percentage of men reported this behavior (25%) than
women (15%).
1%
54%
77%
86%
60%
L T 1 8
( 5 5 4 )
1 8 T O 2 5
( 1 3 7 )
2 6 T O 3 9
( 2 3 0 )
4 0 T O 5 9
( 1 4 0 )
6 0 O R M O R E
( 2 5 )
SPAWHS N=1086
PERCENT OF FAMILY MEMBERS THAT DID FARM
WORK IN YEAR BEFORE THE INTERVIEW BY AGE
GROUPS

166 | P a g e
Farmworker Housing Study and Action Plan for Salinas Valley and Pajaro Valley -
Final June 2018
FIGURE 35 GENDER OF FTC MIGRANTS
As one can see by comparing the bars in Figure 36, migrants, unsurprisingly, tend
to live in rooms, apartments and motels and rather than in houses when
compared to non-migrants.
25%
15%
75%
85%
M E N ( 5 7 ) WO M E N ( 2 4 )
SPAWHS N=390
FOLLOW-THE-CROP MIGRANTS BY
GENDER OF INTERVIEWEE
migrant nonmigrant
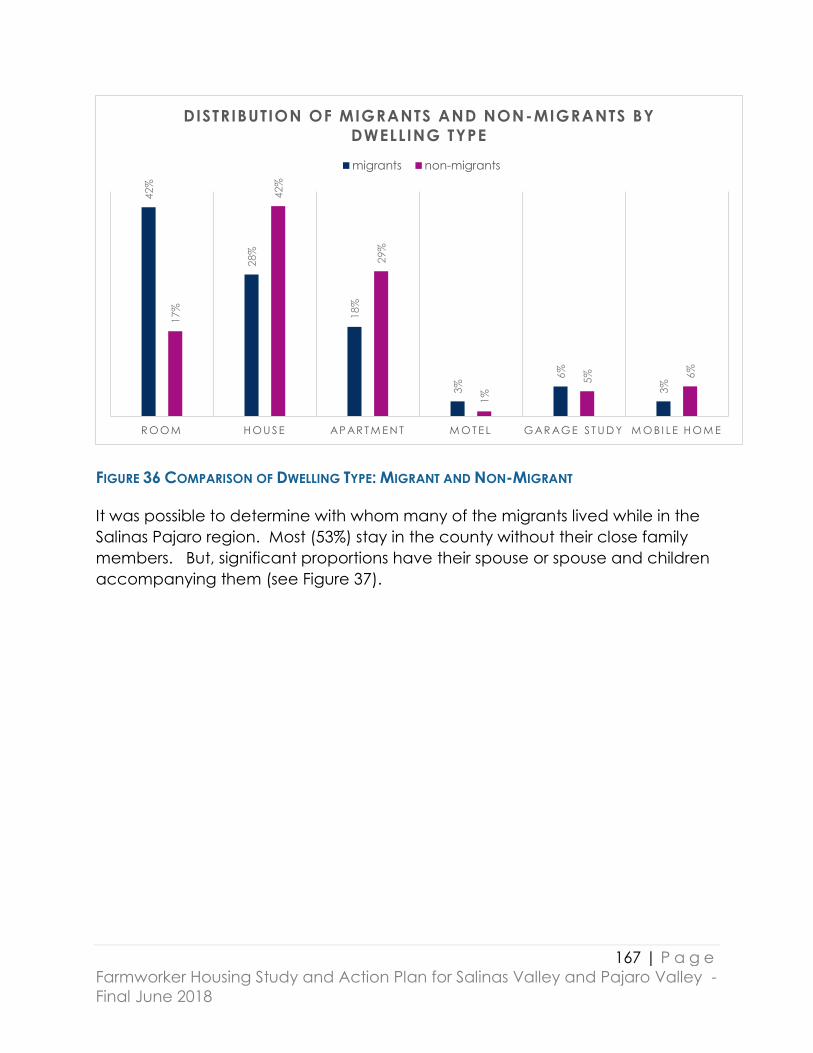
167 | P a g e
Farmworker Housing Study and Action Plan for Salinas Valley and Pajaro Valley -
Final June 2018
FIGURE 36 COMPARISON OF DWELLING TYPE: MIGRANT AND NON-MIGRANT
It was possible to determine with whom many of the migrants lived while in the
Salinas Pajaro region. Most (53%) stay in the county without their close family
members. But, significant proportions have their spouse or spouse and children
accompanying them (see Figure 37).
42%
28%
18%
3%
6%
3%
17%
42%
29%
1%
5% 6%
R O O M H O U S E AP AR T M E N T M O T E L G AR AG E S T U D Y M O B I LE H O M E
DISTRIBUTION OF MIGRANTS AND NON-MIGRANTS BY
DWELLING TYPE
migrants non-migrants
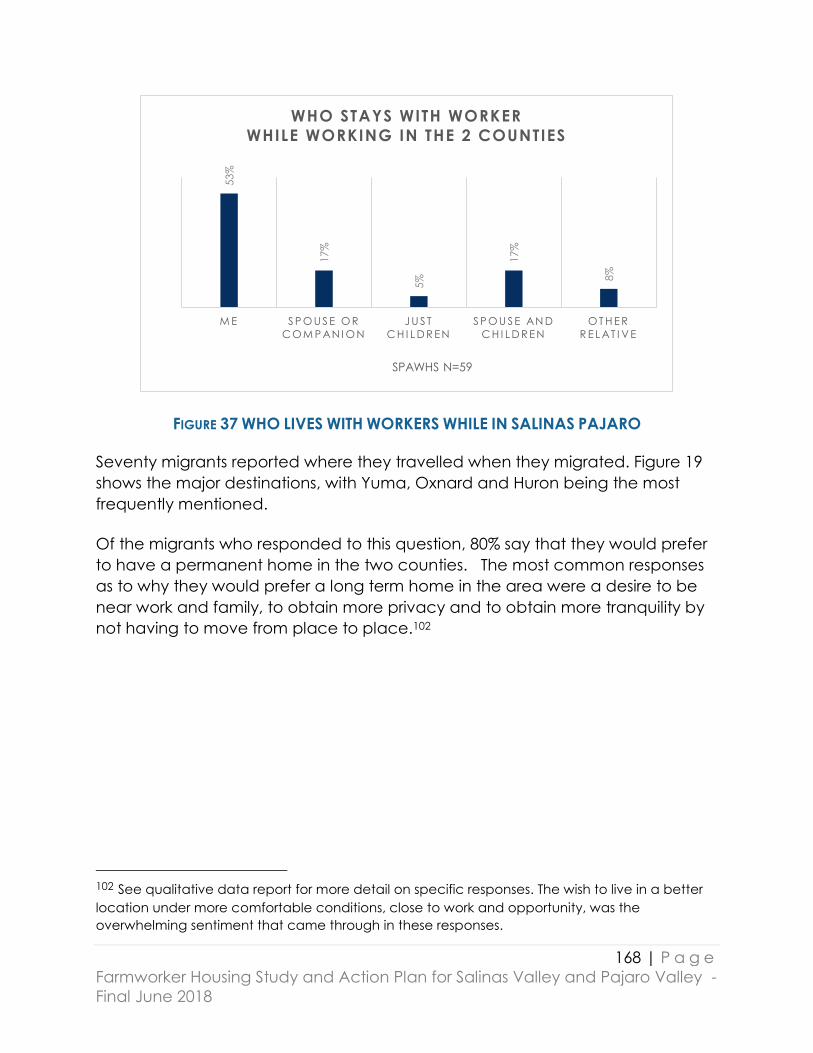
168 | P a g e
Farmworker Housing Study and Action Plan for Salinas Valley and Pajaro Valley -
Final June 2018
FIGURE 37 WHO LIVES WITH WORKERS WHILE IN SALINAS PAJARO
Seventy migrants reported where they travelled when they migrated. Figure 19
shows the major destinations, with Yuma, Oxnard and Huron being the most
frequently mentioned.
Of the migrants who responded to this question, 80% say that they would prefer
to have a permanent home in the two counties. The most common responses
as to why they would prefer a long term home in the area were a desire to be
near work and family, to obtain more privacy and to obtain more tranquility by
not having to move from place to place.102
102 See qualitative data report for more detail on specific responses. The wish to live in a better
location under more comfortable conditions, close to work and opportunity, was the
overwhelming sentiment that came through in these responses.
53%
17%
5%
17%
8%
M E S P O U S E O R
C O M P AN I O N
J U S T
C H I L D R EN
S P O U S E AN D
C H I L D R EN
O T H E R
R E L AT I V E
SPAWHS N=59
WHO STAYS WITH WORKER
WHILE WORKING IN THE 2 COUNTIES
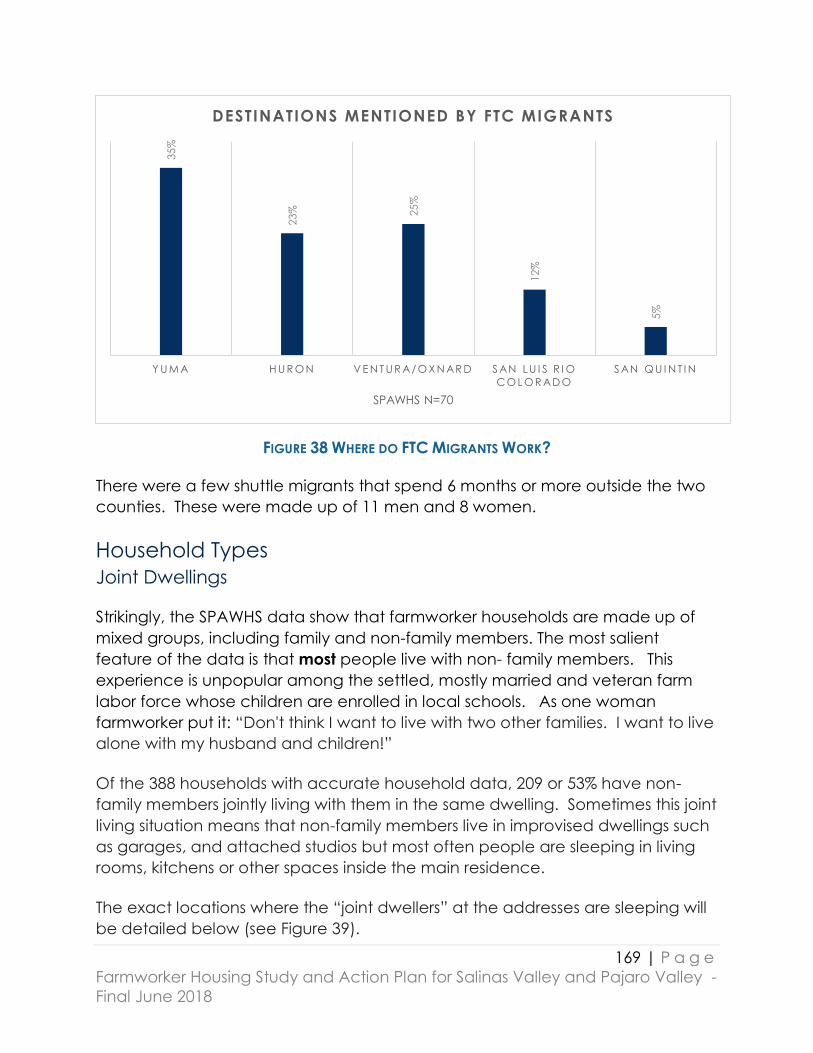
169 | P a g e
Farmworker Housing Study and Action Plan for Salinas Valley and Pajaro Valley -
Final June 2018
FIGURE 38 WHERE DO FTC MIGRANTS WORK?
There were a few shuttle migrants that spend 6 months or more outside the two
counties. These were made up of 11 men and 8 women.
Household Types
Joint Dwellings
Strikingly, the SPAWHS data show that farmworker households are made up of
mixed groups, including family and non-family members. The most salient
feature of the data is that most people live with non- family members. This
experience is unpopular among the settled, mostly married and veteran farm
labor force whose children are enrolled in local schools. As one woman
farmworker put it: “Don't think I want to live with two other families. I want to live
alone with my husband and children!”
Of the 388 households with accurate household data, 209 or 53% have non-
family members jointly living with them in the same dwelling. Sometimes this joint
living situation means that non-family members live in improvised dwellings such
as garages, and attached studios but most often people are sleeping in living
rooms, kitchens or other spaces inside the main residence.
The exact locations where the “joint dwellers” at the addresses are sleeping will
be detailed below (see Figure 39).
35%
23% 25%
12%
5%
Y U M A H U R O N V E N T U R A/ O X N AR D S AN L U I S R I O
C O L O R AD O
S AN Q U I N T I N
SPAWHS N=70
DESTINATIONS MENTIONED BY FTC MIGRANTS

170 | P a g e
Farmworker Housing Study and Action Plan for Salinas Valley and Pajaro Valley -
Final June 2018
Table 21 shows that many non-family members lived at the 209 addresses which
we call “joint dwellings” that share the space with the family of the interviewee.
It was most common to have adult men living in these joint dwellings. There was
a mean of 3.4 additional household members per dwelling where these “extra”
men live. Adult women were next with a mean of 2.0 additional household
members in the “joint” residences where they lived. And, it was also common to
have either boys or girls outside of one’s family living at the same address. For
the entire set of 388 addresses the “extra” or “joint” residents add an average of
3.2 people per dwelling. Overall, the dwellings averaged over 7 people per
dwelling when both family and “joint” residents are combined.
TABLE 21 AVERAGE NUMBER OF NON-FAMILY RESIDENTS IN DWELLING Average Non-family Residents in Dwellings
Group Mean of all
Dwellings
Mean of
Dwellings where
Group is Present
Total
adult men (185) 1.6 3.4 631
adult women (156) 0.8 2.0 314
boys (91) 0.4 1.8 165
girls (77) 0.4 2.0 147
All Groups 3.2 1257
SPAWHS=388
There is evidence that many of these 209 joint households had parents and
children living in them as “joint family” dwellers. Of the 209, 112 had both adults
and children living together at the same address as “extra” or “joint” residents.
TABLE 22 TOTAL NUMBER OF RESIDENTS IN DWELLINGS
Numbers of all residents at the Dwellings men women
Younger than 18 Family members 321 298
Extra Residents 165 147
18 or older Family members 501 455
Extra Residents 631 314
Total 2,832 total residents 1,618 1,214
Adding up all the family members and extra residents together for whom there
are sex and age data in the survey, it is clear from Table 22 and Figure 39 that
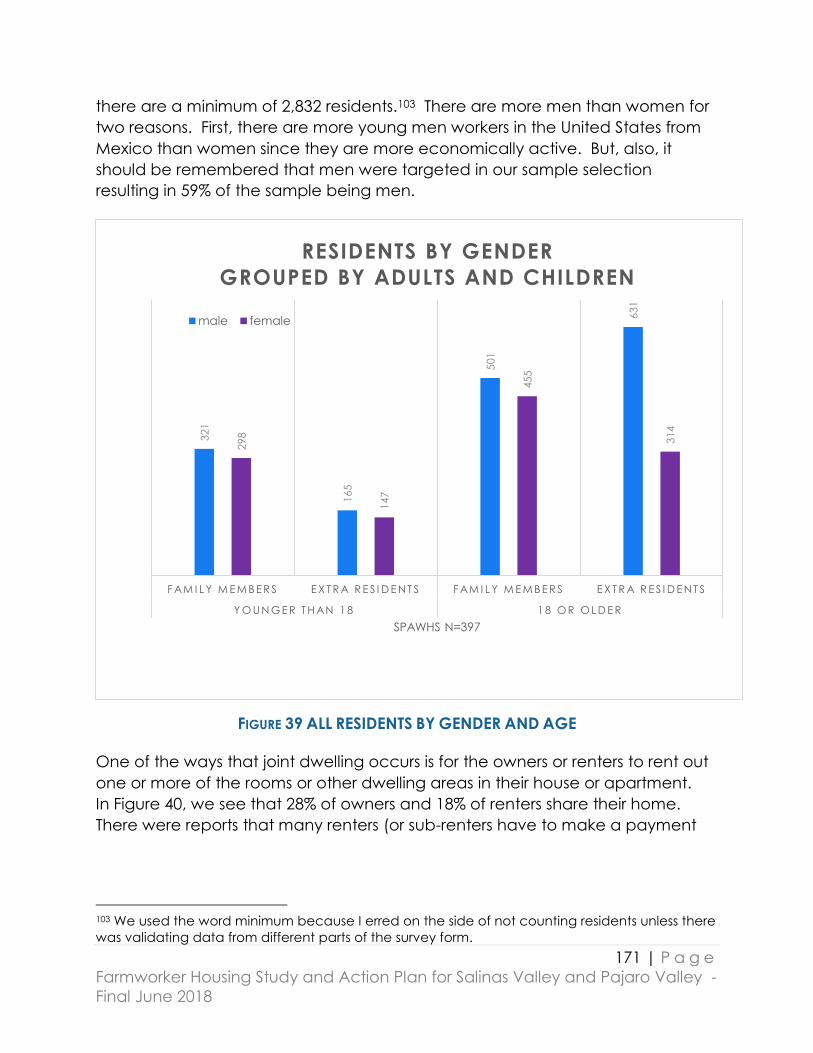
171 | P a g e
Farmworker Housing Study and Action Plan for Salinas Valley and Pajaro Valley -
Final June 2018
there are a minimum of 2,832 residents.103 There are more men than women for
two reasons. First, there are more young men workers in the United States from
Mexico than women since they are more economically active. But, also, it
should be remembered that men were targeted in our sample selection
resulting in 59% of the sample being men.
FIGURE 39 ALL RESIDENTS BY GENDER AND AGE
One of the ways that joint dwelling occurs is for the owners or renters to rent out
one or more of the rooms or other dwelling areas in their house or apartment.
In Figure 40, we see that 28% of owners and 18% of renters share their home.
There were reports that many renters (or sub-renters have to make a payment
103 We used the word minimum because I erred on the side of not counting residents unless there
was validating data from different parts of the survey form.
321
165
501
631
298
147
455
314
F AM I L Y M E M B E RS E X T R A R E S I D E N T S F AM I L Y M E M B E RS E X T R A R E S I D E N T S
Y O U N G E R T H AN 1 8 1 8 O R O L D E R
SPAWHS N=397
RESIDENTS BY GENDER
GROUPED BY ADULTS AND CHILDREN
male female
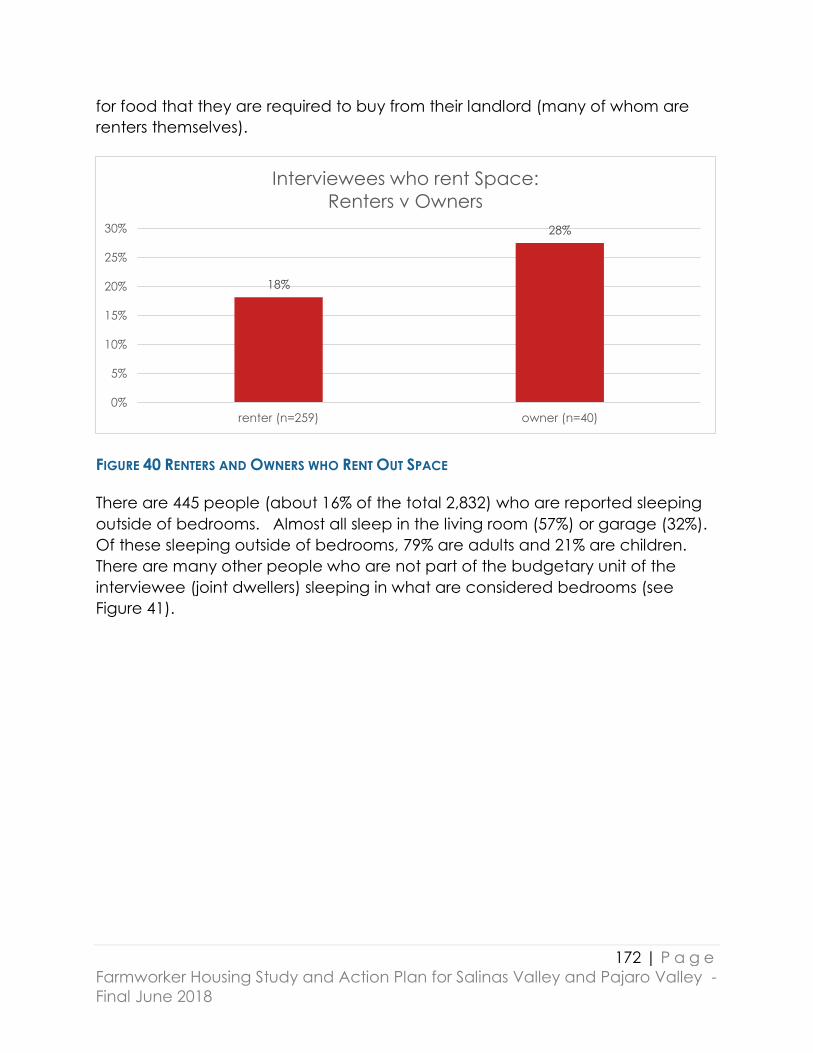
172 | P a g e
Farmworker Housing Study and Action Plan for Salinas Valley and Pajaro Valley -
Final June 2018
for food that they are required to buy from their landlord (many of whom are
renters themselves).
FIGURE 40 RENTERS AND OWNERS WHO RENT OUT SPACE
There are 445 people (about 16% of the total 2,832) who are reported sleeping
outside of bedrooms. Almost all sleep in the living room (57%) or garage (32%).
Of these sleeping outside of bedrooms, 79% are adults and 21% are children.
There are many other people who are not part of the budgetary unit of the
interviewee (joint dwellers) sleeping in what are considered bedrooms (see
Figure 41).
18%
28%
0%
5%
10%
15%
20%
25%
30%
renter (n=259) owner (n=40)
Interviewees who rent Space:
Renters v Owners

173 | P a g e
Farmworker Housing Study and Action Plan for Salinas Valley and Pajaro Valley -
Final June 2018
FIGURE 41 PEOPLE SLEEPING OUTSIDE BEDROOMS
Fifteen percent (60) of the households report that people sleeping in the
dwelling increases for some part of the year. Forty-one seasonal residents (more
than two thirds of these) arrive in the March to May period and leave in the
October to December period. There are a few households that have extra
people doubling up at their dwellings in the spring and winter.
There were 223 households with a parent and minor child living with them. These
223 households had 528 minor children. Of the households with parents and
children living together, there were 31 single mothers with a total of 73 minor
children (half boys and half girls) living with them.
Further findings about housing As can be seen in Figure 42, most of the respondents live in a house, apartment
or a rented room within one of these. Only 10% live in a garage, a studio (often
improvised outside a building), a mobile home, or in a motel.
57.1%
32.1%
6.1%2.9%
0.9% 0.7% 0.2%0.0%
10.0%
20.0%
30.0%
40.0%
50.0%
60.0%
living room garage improvised hallway closet kitchen dining room
SPAWHS N=168 Dwellings, 445 Residents
Distribution of People sleeping outside of
bedrooms
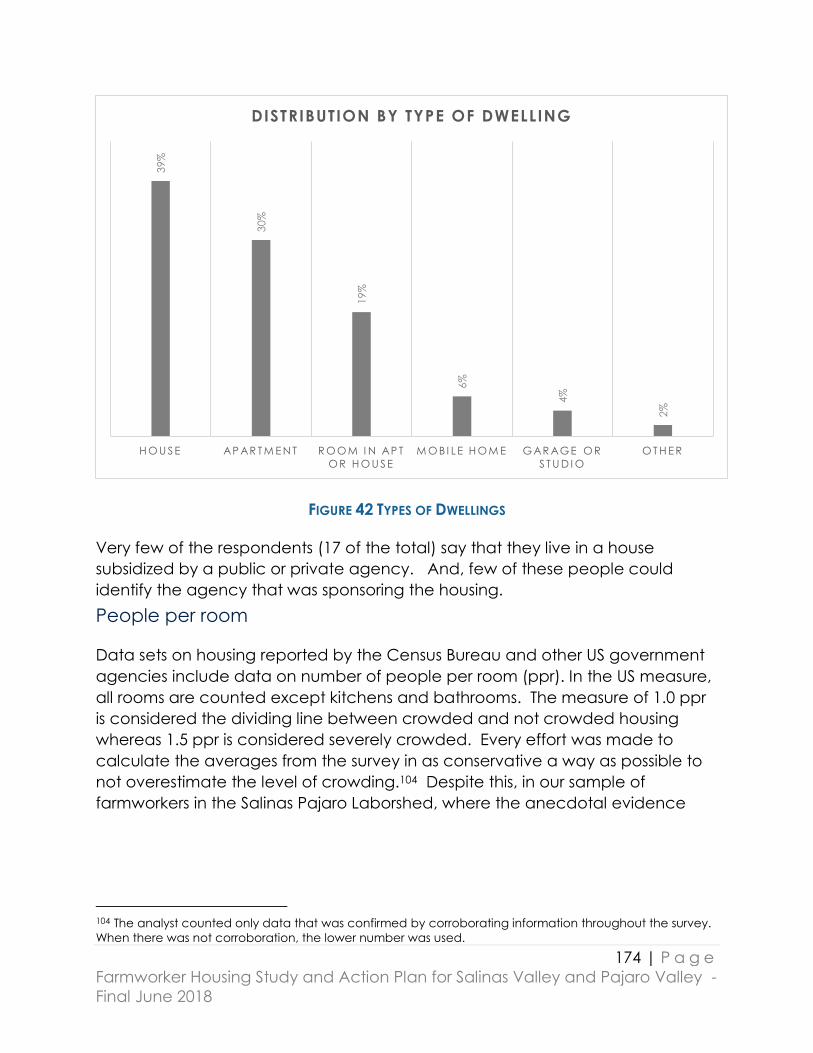
174 | P a g e
Farmworker Housing Study and Action Plan for Salinas Valley and Pajaro Valley -
Final June 2018
FIGURE 42 TYPES OF DWELLINGS
Very few of the respondents (17 of the total) say that they live in a house
subsidized by a public or private agency. And, few of these people could
identify the agency that was sponsoring the housing.
People per room
Data sets on housing reported by the Census Bureau and other US government
agencies include data on number of people per room (ppr). In the US measure,
all rooms are counted except kitchens and bathrooms. The measure of 1.0 ppr
is considered the dividing line between crowded and not crowded housing
whereas 1.5 ppr is considered severely crowded. Every effort was made to
calculate the averages from the survey in as conservative a way as possible to
not overestimate the level of crowding.104 Despite this, in our sample of
farmworkers in the Salinas Pajaro Laborshed, where the anecdotal evidence
104 The analyst counted only data that was confirmed by corroborating information throughout the survey.
When there was not corroboration, the lower number was used.
39%
30%
19%
6%
4%
2%
H O U S E AP AR T M E N T R O O M I N AP T
O R H O U S E
M O B I LE H O M E G AR AG E O R
S T U D I O
O T H E R
DISTRIBUTION BY TYPE OF DWELLING
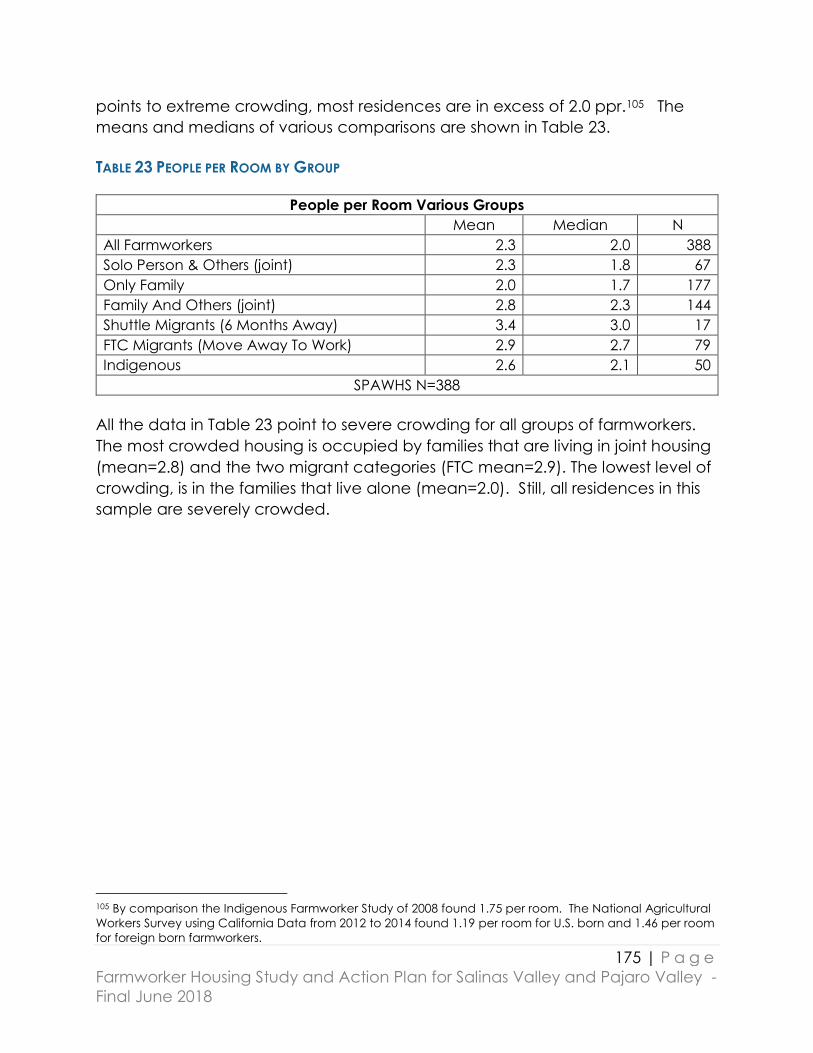
175 | P a g e
Farmworker Housing Study and Action Plan for Salinas Valley and Pajaro Valley -
Final June 2018
points to extreme crowding, most residences are in excess of 2.0 ppr.105 The
means and medians of various comparisons are shown in Table 23.
TABLE 23 PEOPLE PER ROOM BY GROUP
People per Room Various Groups
Mean Median N
All Farmworkers 2.3 2.0 388
Solo Person & Others (joint) 2.3 1.8 67
Only Family 2.0 1.7 177
Family And Others (joint) 2.8 2.3 144
Shuttle Migrants (6 Months Away) 3.4 3.0 17
FTC Migrants (Move Away To Work) 2.9 2.7 79
Indigenous 2.6 2.1 50
SPAWHS N=388
All the data in Table 23 point to severe crowding for all groups of farmworkers.
The most crowded housing is occupied by families that are living in joint housing
(mean=2.8) and the two migrant categories (FTC mean=2.9). The lowest level of
crowding, is in the families that live alone (mean=2.0). Still, all residences in this
sample are severely crowded.
105 By comparison the Indigenous Farmworker Study of 2008 found 1.75 per room. The National Agricultural
Workers Survey using California Data from 2012 to 2014 found 1.19 per room for U.S. born and 1.46 per room
for foreign born farmworkers.

176 | P a g e
Farmworker Housing Study and Action Plan for Salinas Valley and Pajaro Valley -
Final June 2018
FIGURE 43 DISTRIBUTION OF NUMBER OF PPR
Another way of presenting this extreme crowdedness is by showing the
proportions by levels of crowdedness (see Figure 43 above). Only 7% of
residences sampled exhibit uncrowded conditions (<1 ppr) and over two-thirds
(67%) show conditions of severe crowdedness (>1.5 ppr).
One can see from Figure 24 below that the crowding is a function of the number
of people sleeping at a given address.
FIGURE 44 MEAN AND MEDIAN OF PPR BY PEOPLE SLEEPING AT ADDRESS
7%
26% 2
9%
10%
10%
19%
SPAWHS N=388
DISTRIBUTION OF NUMBER OF PEOPLE PER ROOM
1.6
1.9
2.2 2
.5
3.9
1.0
1.7
2.0 2
.3
3.4
1 T O 3 4 T O 5 6 T O 7 8 T O 1 1 1 2 O R M O R E
SPAWHS N=388
MEAN AND MEDIAN PEOPLE PER ROOM BY NUMBER OF
PEOPLE SLEEPING AT THE ADDRESS
Mean Median

177 | P a g e
Farmworker Housing Study and Action Plan for Salinas Valley and Pajaro Valley -
Final June 2018
Another measure of crowdedness used sometimes is the number of people per
bathroom. Again, extreme crowdedness was found for the farmworker sample.
By this measure, crowdedness was worse (almost 7 people per bathroom) for
the indigenous workers and the families living jointly with others.
TABLE 24 NUMBER OF PEOPLE PER BATHROOM
People per Bathroom
Mean Median N
All 5.2 4.5 383
Indigenous 6.9 6 49
Solo Person & Others 5.1 4 66
Only Family 4.0 4 175
Family And Others 6.8 6 142
SPAWHS N=388
Descriptions of Dwellings: Rent or Mortgage
We grouped the dwellings where rent or a mortgage was paid into 6 groups. It
is possible that the category for those who are relegated to a single room (in
apartment or house) is undercounted since interviewers may have missed some
of these examples and just recorded the respondents as apartment dwellers. In
addition to the code in survey question (C2)106, several room-dwellers were
added using notes put on the questionnaires by the interviewers, but in some
cases no note may have been taken. Several of the 391 respondents covered
in this section paid nothing for housing but lived at a church, sponsoring rancher
or with relatives.
Figure 45 shows that about two fifths of participants live in houses, 30% in
apartments and 19% in rooms either in houses or apartments. Another 12% live
in other types of dwellings.
106 C2 In what type of dwelling have you lived most of the time in the last 3 months?

178 | P a g e
Farmworker Housing Study and Action Plan for Salinas Valley and Pajaro Valley -
Final June 2018
FIGURE 45 DISTRIBUTION BY TYPE OF DWELLING
The population of households who pay either mortgage or rent can be divided
between 89% renters and 11% owners. However, a quarter of the owners have
mobile homes not houses. Only 31/357 or 8.7% of those not living in mobile
homes are owners. Those few who live on the land of the boss, either pay rent
or have free housing.
TABLE 25 RENT OR OWN BY TYPE OF DWELLING
Rent or Own by Type by Type of Dwelling
N=381
house apartment room in
apt or
house
mobile
home
garage or
studio
other Total Total
%
renter 122 114 71 10 14 6 337 88%
owner 31 0 0 11 0 0 42 11%
live on
farm
0 0 0 2 0 0 2 1%
Total 153 114 71 23 14 6 381 100
%
39%
30%
19%
6%4%
2%
0%
5%
10%
15%
20%
25%
30%
35%
40%
45%
house apartment room in apt or
house
mobile home garage or
studio
other
Distribution by Type of dwelling

179 | P a g e
Farmworker Housing Study and Action Plan for Salinas Valley and Pajaro Valley -
Final June 2018
For the dwellings with owners, mortgage paid per room was calculated. It is
challenging to classify the dwellings by studio, 1 bedroom, etc. from the survey
data. Only rooms used for the ppr calculations reported above were counted--
no kitchens or bathrooms were counted. The mortgage costs for the mobile
homes are much lower. Please see below a special section on mobile homes
since these dwellings clearly demonstrate special circumstances. The median
mortgage per room in the 29 houses that reported data is $320. Of course, we
do not have a real market measure of the quality of the houses.
TABLE 26 MORTGAGE COST PER ROOM Mortgage Paid per Room
type Mean Median N Std Dev
mobile homes $164.17 $190 5* 126.332
houses $331.93 $320 29 167.806
SPAWHS N=397
*Only 3 of these mobile home owners report a true mortgage. The other two seem to be reporting rent for the location
as mortgage.
In order to take some measure of the rent cost per person, a rent per person
variable was developed to measure the cost for renters. The rent paid was
divided by the number of people living in the dwellings. Those who reported
cost for the whole structure were separated from those who reported cost only
for the rooms they occupied. Again, since there were no quantitative data
collected on the quality of housing or details about the type, the rents are
reported in dollar cost per room. Across all renters, the mean is $217 and the
median is $185.
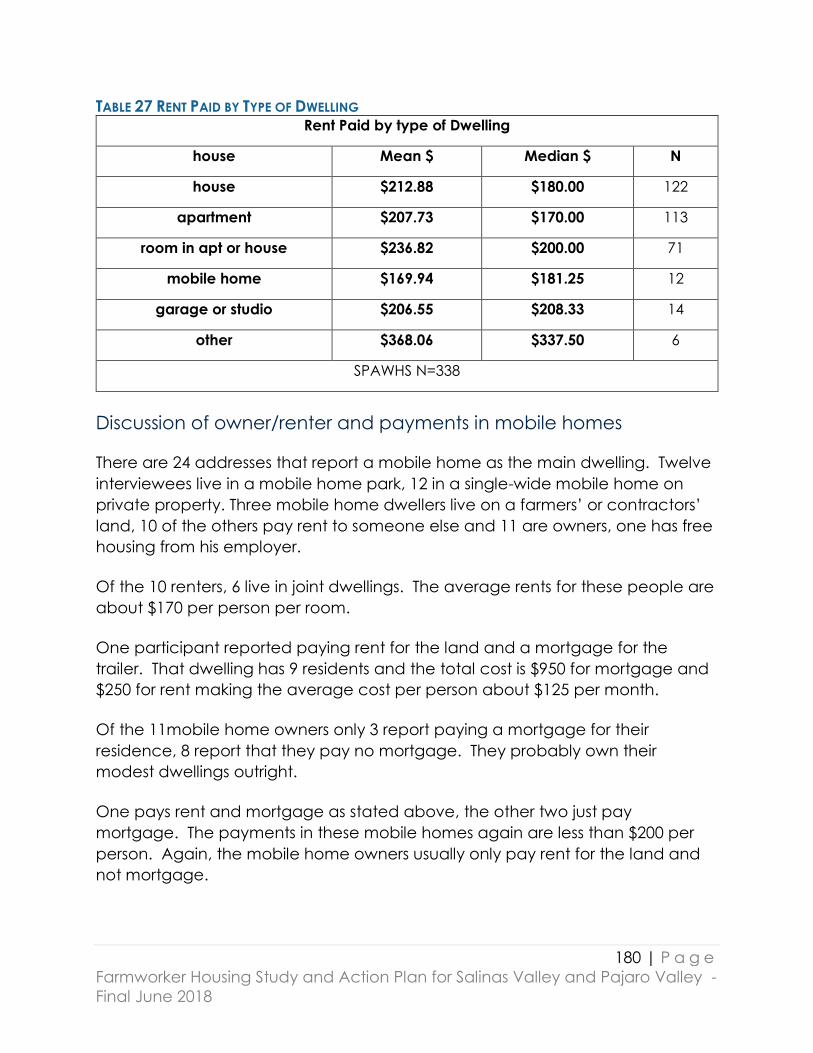
180 | P a g e
Farmworker Housing Study and Action Plan for Salinas Valley and Pajaro Valley -
Final June 2018
TABLE 27 RENT PAID BY TYPE OF DWELLING Rent Paid by type of Dwelling
house Mean $ Median $ N
house $212.88 $180.00 122
apartment $207.73 $170.00 113
room in apt or house $236.82 $200.00 71
mobile home $169.94 $181.25 12
garage or studio $206.55 $208.33 14
other $368.06 $337.50 6
SPAWHS N=338
Discussion of owner/renter and payments in mobile homes
There are 24 addresses that report a mobile home as the main dwelling. Twelve
interviewees live in a mobile home park, 12 in a single-wide mobile home on
private property. Three mobile home dwellers live on a farmers’ or contractors’
land, 10 of the others pay rent to someone else and 11 are owners, one has free
housing from his employer.
Of the 10 renters, 6 live in joint dwellings. The average rents for these people are
about $170 per person per room.
One participant reported paying rent for the land and a mortgage for the
trailer. That dwelling has 9 residents and the total cost is $950 for mortgage and
$250 for rent making the average cost per person about $125 per month.
Of the 11mobile home owners only 3 report paying a mortgage for their
residence, 8 report that they pay no mortgage. They probably own their
modest dwellings outright.
One pays rent and mortgage as stated above, the other two just pay
mortgage. The payments in these mobile homes again are less than $200 per
person. Again, the mobile home owners usually only pay rent for the land and
not mortgage.
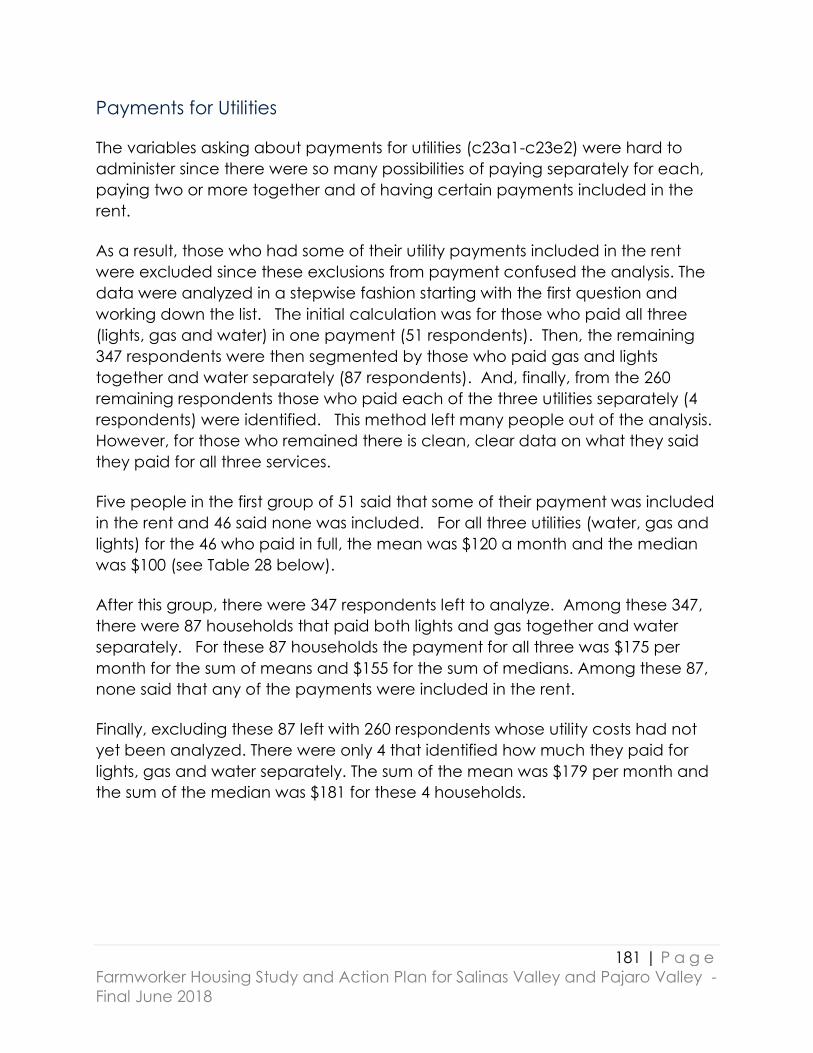
181 | P a g e
Farmworker Housing Study and Action Plan for Salinas Valley and Pajaro Valley -
Final June 2018
Payments for Utilities
The variables asking about payments for utilities (c23a1-c23e2) were hard to
administer since there were so many possibilities of paying separately for each,
paying two or more together and of having certain payments included in the
rent.
As a result, those who had some of their utility payments included in the rent
were excluded since these exclusions from payment confused the analysis. The
data were analyzed in a stepwise fashion starting with the first question and
working down the list. The initial calculation was for those who paid all three
(lights, gas and water) in one payment (51 respondents). Then, the remaining
347 respondents were then segmented by those who paid gas and lights
together and water separately (87 respondents). And, finally, from the 260
remaining respondents those who paid each of the three utilities separately (4
respondents) were identified. This method left many people out of the analysis.
However, for those who remained there is clean, clear data on what they said
they paid for all three services.
Five people in the first group of 51 said that some of their payment was included
in the rent and 46 said none was included. For all three utilities (water, gas and
lights) for the 46 who paid in full, the mean was $120 a month and the median
was $100 (see Table 28 below).
After this group, there were 347 respondents left to analyze. Among these 347,
there were 87 households that paid both lights and gas together and water
separately. For these 87 households the payment for all three was $175 per
month for the sum of means and $155 for the sum of medians. Among these 87,
none said that any of the payments were included in the rent.
Finally, excluding these 87 left with 260 respondents whose utility costs had not
yet been analyzed. There were only 4 that identified how much they paid for
lights, gas and water separately. The sum of the mean was $179 per month and
the sum of the median was $181 for these 4 households.
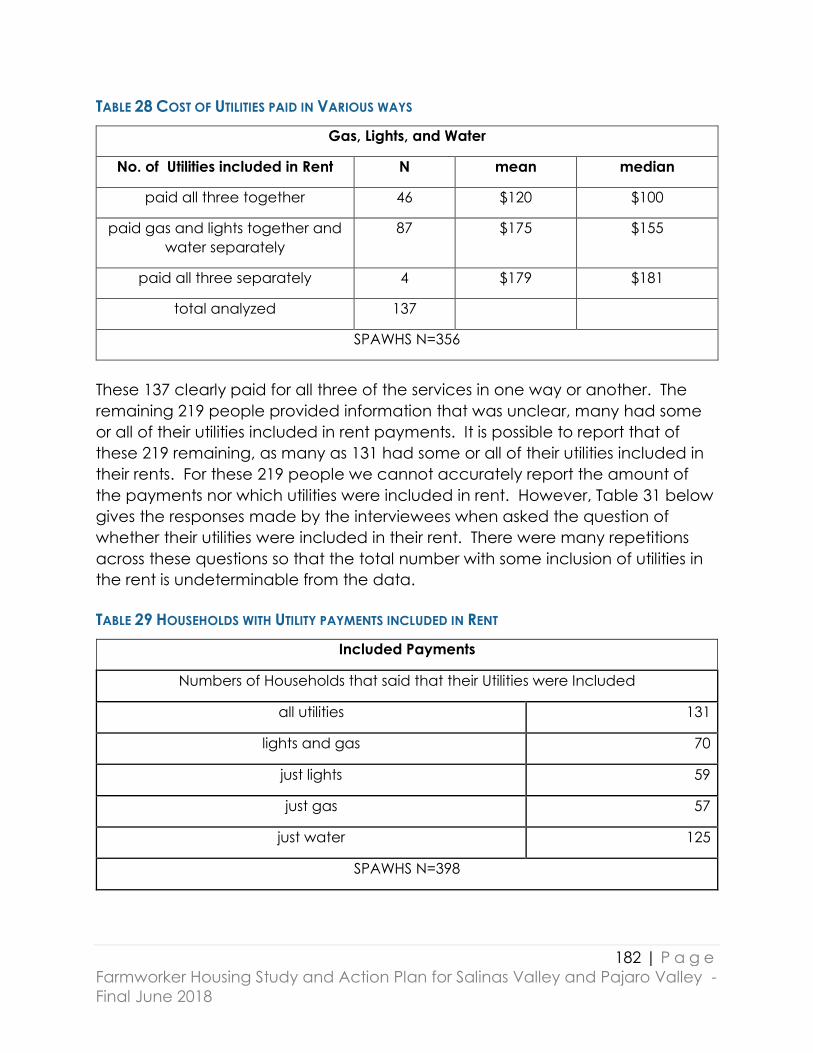
182 | P a g e
Farmworker Housing Study and Action Plan for Salinas Valley and Pajaro Valley -
Final June 2018
TABLE 28 COST OF UTILITIES PAID IN VARIOUS WAYS
Gas, Lights, and Water
No. of Utilities included in Rent N mean median
paid all three together 46 $120 $100
paid gas and lights together and
water separately
87 $175 $155
paid all three separately 4 $179 $181
total analyzed 137
SPAWHS N=356
These 137 clearly paid for all three of the services in one way or another. The
remaining 219 people provided information that was unclear, many had some
or all of their utilities included in rent payments. It is possible to report that of
these 219 remaining, as many as 131 had some or all of their utilities included in
their rents. For these 219 people we cannot accurately report the amount of
the payments nor which utilities were included in rent. However, Table 31 below
gives the responses made by the interviewees when asked the question of
whether their utilities were included in their rent. There were many repetitions
across these questions so that the total number with some inclusion of utilities in
the rent is undeterminable from the data.
TABLE 29 HOUSEHOLDS WITH UTILITY PAYMENTS INCLUDED IN RENT
Included Payments
Numbers of Households that said that their Utilities were Included
all utilities 131
lights and gas 70
just lights 59
just gas 57
just water 125
SPAWHS N=398

183 | P a g e
Farmworker Housing Study and Action Plan for Salinas Valley and Pajaro Valley -
Final June 2018
Overall, these numbers show that a substantial group of farmworkers (137) pays
a substantial amount for all three of the utilities (a mean range of $120 to $179).
Unfortunately, it’s not possible to calculate with any certainty the amounts paid
by the others (219).
The data do show that those people (81% are men) who are living by
themselves (almost half report living in rooms) rarely pay for utilities directly. Only
7% do so compared to 40% for those who live in families. For Figure 27, the
numbers of the segmented groups that clearly paid for the utility services were
divided by the total number in the whole group. The purpose of Figure 27 is to
show that comparatively fewer solo persons paid for utilities. The exact
proportions are not calculable.
FIGURE 46 UTILITY PAYMENTS BY RESIDENCE
Payment and use of garbage, telephone, cable and internet service
The analysis of the payment for garbage, telephone service, cable service and
internet is contaminated by overlapping reporting by the respondents. Probably
the most interesting element of the responses to these questions is the number or
proportion of dwellings that have each of the services (see Table 32 below).
7%
41% 40%
0%
5%
10%
15%
20%
25%
30%
35%
40%
45%
Solo person & others (n=67) only family (n=177) family and others (n=146)
SPAWHS N=390
Percent that paid all utilities
by dwelling type

184 | P a g e
Farmworker Housing Study and Action Plan for Salinas Valley and Pajaro Valley -
Final June 2018
TABLE 30 PAYMENTS FOR GARBAGE AND COMMUNICATIONS SERVICES
Numbers and Payments by Tenants and Numbers where Service Included in Rent for
Garbage and Communication Services
Service
Number of
Dwellings
that Paid for
Service
Number of
Dwellings
where
Service was
included in
Rent
(unreliable) (unreliable)
Mean Paid for
Service among
those who paid
Median paid for
service among
those who paid
garbage 101 205 $64 $51
telephone 316 10 $91 $80
cable 146 49 $61 $55
internet 102 52 $39 $40
SPAWHS N=397
The data on the payment for garbage was contaminated by joint payments for
water. The vast majority of respondents (306) report having garbage pickup
service. Most report that it is included in the rent. The overwhelming majority
(336) report telephone service but their payment information is tainted by their
reporting of joint payments for telephone, cable and internet. Cable service is
reported by the majority (195) and many (49) seem to have it included in rent.
The data on this payment again is unreliable because it is unclear whether
payments overlap with telephone and/or internet. Finally, a surprising number
(154) report having internet access with a substantial number (52) reporting it
being included in the rent. However, the data on costs reported for this are also
unreliable.
The data from these questions are useful because they show that high numbers
have telephone, cable and internet service. However, he information about for
the cost of these services is not reliable due to cross contamination of the report
of payments.
Complaints about condition of dwellings
A substantial number of respondents complained of some problem with many of
the basic housing conditions that they experience in their current dwelling. Out
of the 398 respondents between 188 complained about one or more of the

185 | P a g e
Farmworker Housing Study and Action Plan for Salinas Valley and Pajaro Valley -
Final June 2018
following conditions. There were multiple complaints from many respondents
(see Table 31 below). In addition, an open-ended question (C27) was asked
about complaints in dwellings where they had lived in the previous two years.
There were 56 complaints registered about these dwellings (see Table 34 below).
TABLE 31 COMPLAINTS ABOUT CONDITIONS IN HOUSING
Respondents who complained of problems with the following issues
mold 59
plumbing 47
leaks 42
bathroom malfunction 50
noise 58
unsafe conditions 49
inadequate heat 59
insects 63
rodents 37
TABLE 32 PROBLEMS WITH PREVIOUS DWELLINGS
Problem with Previous Dwellings Number of complaints
very small space, overcrowded 9
noise 8
rats, insects 8
bad roommates, neighbors 7
parking problems 6
bad physical conditions 6
rude, unreasonable landlord 5
rent increases 2
plumbing 2
leaking 2
dangerous location 1
total 56

186 | P a g e
Farmworker Housing Study and Action Plan for Salinas Valley and Pajaro Valley -
Final June 2018
When asked if they had complained to someone, most said they just
complained to management. Only one said that a complaint to the city
resulted in a solution to the problem. Also, when asked if the owner responded
to requests when repairs were necessary, 50 people responded that the owner
took too long to fix the problem or did not fix it.
When asked if they had to reduce their expenditures on food or medicine
because of the high cost of housing in the last 12 months, fully 60% (215) of those
that responded to the question responded in the affirmative.
When asked if they had heard of community programs that can help reduce
rent, most 58% of those that responded (211) said that they had.
Transportation
The data in this section of the survey showed that, perhaps surprisingly, most
farmworkers in the Salinas Pajaro Laborshed go to work in their own car or in the
car of a friend or relative. Figure 47, shows the data that almost three quarters
arrive at work in this fashion. Despite the seemingly ubiquitous buses and vans
seen throughout the valley, the workers apparently either prefer or must get to
work on their own. It is worth mentioning that driving through the region
especially during harvest season, one sees more private vehicles than buses
parked in agricultural fields.
56%
17%
11%
10%
3%
2%
1%
SPAWHS N=387, DISTRIBUTION OF 429 RESPONSES
(SOME HAD MORE THAN ONE)
DISTRIBUTION OF TYPES OF TRANSPORTATION
TO WORK
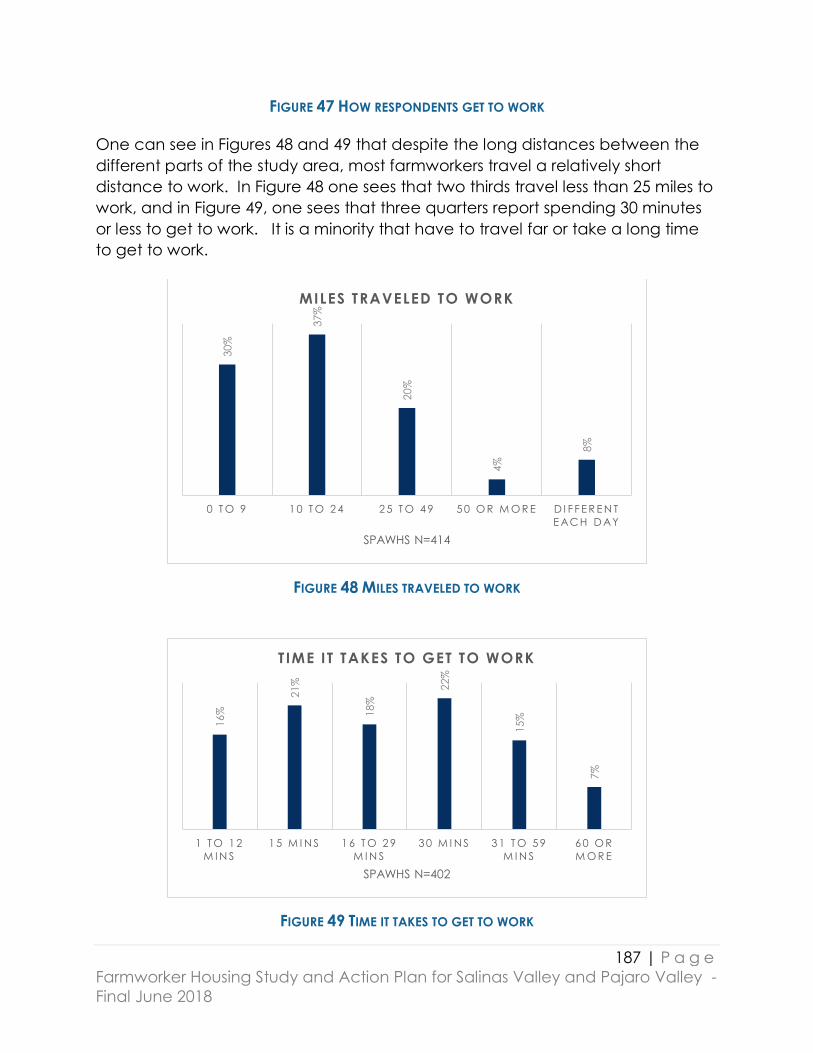
187 | P a g e
Farmworker Housing Study and Action Plan for Salinas Valley and Pajaro Valley -
Final June 2018
FIGURE 47 HOW RESPONDENTS GET TO WORK
One can see in Figures 48 and 49 that despite the long distances between the
different parts of the study area, most farmworkers travel a relatively short
distance to work. In Figure 48 one sees that two thirds travel less than 25 miles to
work, and in Figure 49, one sees that three quarters report spending 30 minutes
or less to get to work. It is a minority that have to travel far or take a long time
to get to work.
FIGURE 48 MILES TRAVELED TO WORK
FIGURE 49 TIME IT TAKES TO GET TO WORK
30%
37%
20%
4%
8%
0 T O 9 1 0 T O 2 4 2 5 T O 4 9 5 0 O R M O R E D I F F E R E N T
E AC H D AY
SPAWHS N=414
MILES TRAVELED TO WORK
16%
21%
18%
22%
15%
7%
1 T O 1 2
M I N S
1 5 M I N S 1 6 T O 2 9
M I N S
3 0 M I N S 3 1 T O 5 9
M I N S
6 0 O R
M O R E
SPAWHS N=402
T IME IT TAKES TO GET TO WORK

188 | P a g e
Farmworker Housing Study and Action Plan for Salinas Valley and Pajaro Valley -
Final June 2018
In most farmworker surveys, data show workers make high payments for rides to
work from third parties. But, in this survey, most people pay for the gas in their
own or in a relative’s or friend’s car. It appears that the payments are a bit high
for the distances traveled if people are traveling to work in groups. Interestingly,
the payments to third party drivers do not appear to be higher than the cost of
gas for one’s own or a friend’s or relative’s car. Table 33 shows that people are
paying about $40 per week to get to work.107
TABLE 33 COST TO TRAVEL TO WORK PER WEEK
Payment per Week to get to Work
type of ride Mean Median N
third party $41.26 $30.00 39
own car $43.83 $40.00 215
friend or
relative $35.03 $35.00 58
boss's car $33.60 $36.00 5
boss's van or
bus $46.00 $40.00 5
public
transportation $41.67 $30.00 3
The number of interviewees with drivers’ licenses is substantial. Many seem to
have benefited from AB 60108 which went into effect for undocumented workers
in 2015. Of the 215 that have licenses, 102 (or 47%) had gotten them since 2015.
Of these, 90 said that it changed their life. Most said that it improved job options
and made them feel more secure (see Figure 50).
107 Unfortunately, it is not clear from the question whether more than the person riding in the
vehicle is included in the calculation of gas prices paid. 108 Assembly Bill 60 in the California legislature requires the Department of Motor Vehicles to issue
an original driver license to applicants unable to submit proof of legal presence in the US.
Applicants under AB 60 must meet all other qualifications for licensure and must provide
satisfactory proof of identity and California residency.
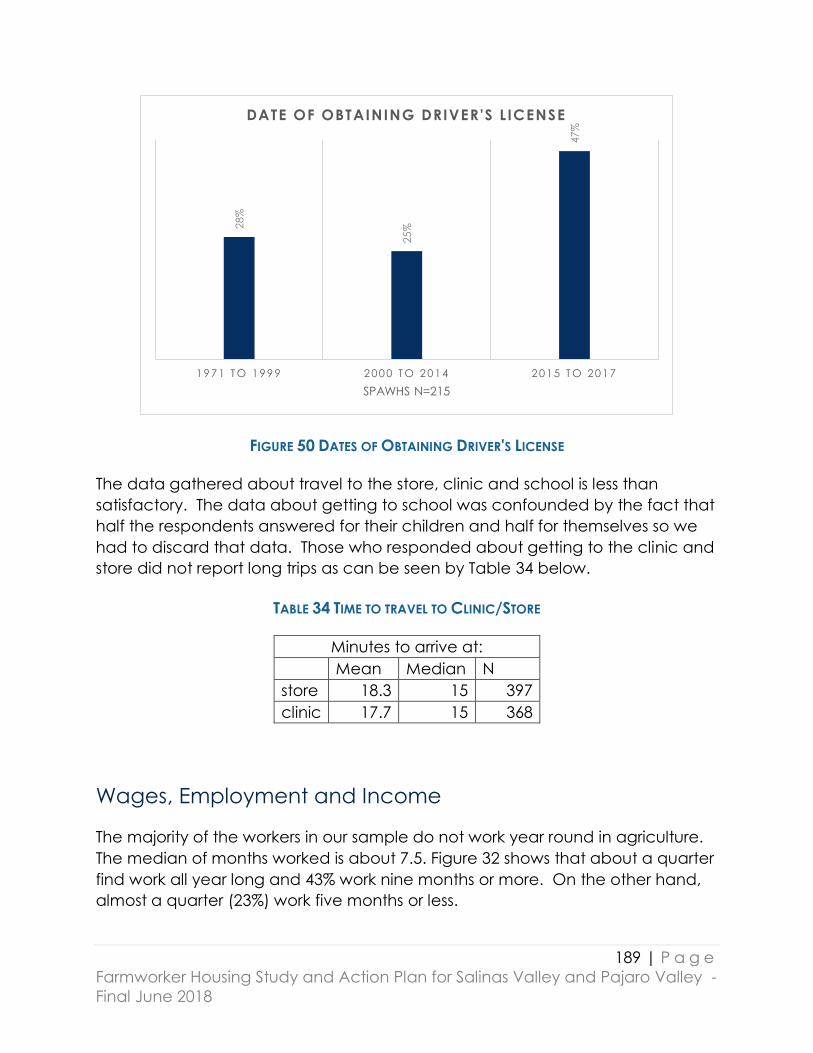
189 | P a g e
Farmworker Housing Study and Action Plan for Salinas Valley and Pajaro Valley -
Final June 2018
FIGURE 50 DATES OF OBTAINING DRIVER'S LICENSE
The data gathered about travel to the store, clinic and school is less than
satisfactory. The data about getting to school was confounded by the fact that
half the respondents answered for their children and half for themselves so we
had to discard that data. Those who responded about getting to the clinic and
store did not report long trips as can be seen by Table 34 below.
TABLE 34 TIME TO TRAVEL TO CLINIC/STORE
Minutes to arrive at:
Mean Median N
store 18.3 15 397
clinic 17.7 15 368
Wages, Employment and Income
The majority of the workers in our sample do not work year round in agriculture.
The median of months worked is about 7.5. Figure 32 shows that about a quarter
find work all year long and 43% work nine months or more. On the other hand,
almost a quarter (23%) work five months or less.
28%
25%
47%
1 9 7 1 T O 1 9 9 9 2 0 0 0 T O 2 0 1 4 2 0 1 5 T O 2 0 1 7
SPAWHS N=215
DATE OF OBTAINING DRIVER'S LICENSE

190 | P a g e
Farmworker Housing Study and Action Plan for Salinas Valley and Pajaro Valley -
Final June 2018
FIGURE 51 MONTHS WORKED IN AGRICULTURE IN PAST 12 MONTHS
As seen in Figure 52, workers who are able to follow the crops (FTC) and travel to
Huron, Yuma, Oxnard or elsewhere are able to work more months per year.
Among the FTC migrants, 44% work all year, while only 20% the non-migrants
who stay in Salinas all year obtain year round employment.
FIGURE 52 MONTHS WORKED IN AGRICULTURE BY MIGRATION STATUS
7%
14%
18%
17%
17%
26%
O N E T O
T H R E E
F O U R T O F I V E S I X T O S E V E N E I G H T N I N E T O
E L E V E N
T WE L V E
SPAWHS N=395
T IME WORKED IN AGRICULTURE
IN THE LAST 12 MONTHS
5%
12% 15%
11%
12%
44%
7%
15%
19%
19%
19%
20%
1 T O 3 4 T O 5 6 T O 7 8 9 T O 1 1 1 2
SPAWHS N=394
MONTHS OF AGRICULTURE WORK IN THE LAST YEAR
BY MIGRATION STATUS
FTC migrant (81) nonmigrant (313)

191 | P a g e
Farmworker Housing Study and Action Plan for Salinas Valley and Pajaro Valley -
Final June 2018
With respect to longevity working for the current employer, the median is 4
years. However, almost a quarter of the respondents have been with their
employer for 8 years or more (see Figure 53). Also, those who follow the crops,
though they work more months per year, are less likely to have a long-term
employer. In Figure 54 we see that almost 3 times as many non-migrants as
migrants (27% vs. 10%) have kept the same employer for 8 years or more.
FIGURE 53 YEARS WORKED FOR CURRENT EMPLOYER
FIGURE 54 YEARS WORKED FOR CURRENT EMPLOYER BY MIGRATION STATUS
24% 25% 26%
24%
O N E Y E AR T WO T O T H R E E F O U R T O S E V E N E I G H T O R M O R E
SPAWHS N=393
YEARS WORKED FOR CURRENT EMPLOYER
28%
29%
34%
10%
24%
24%
25% 2
7%
1 Y E AR 2 T O 3 4 T O 7 8 O R M O R E
SPAWHS N=392
YEARS WORKED FOR CURRENT EMPLOYER
BY MIGRATION STATUS
FTC migrant (80) nonmigrant (312)

192 | P a g e
Farmworker Housing Study and Action Plan for Salinas Valley and Pajaro Valley -
Final June 2018
Consistent with the data on months worked per year, about three quarters of
the workers consider that they work seasonally rather than all year for their
employer.
FIGURE 55 SELF-IDENTIFIED EMPLOYMENT TYPE
It is difficult to obtain income information from farmworkers since many don’t
have a firm notion of the exact amount they earn either as an individual or as a
family. However, the survey data appears believable and is consistent with the
wages and the months worked reported. The median income levels of the
households or families is about $25,000, which may be insufficient to provide for
the needs of families in the expensive Salinas-Pajaro Laborshed. Figure 56 shows
that only 23% of the families make $37,500 per year or more. Figure 57
demonstrates that income varies directly with size of household. For example,
for the households with just one person (the dark blue), 67% earn less than
$25,000 while in the households of 6 or more (bright green tab) 59% earn more
than $25,000 (see Figure 57). However, a careful examination of Figure 57 shows
that many of the larger families have low incomes. For example, 11% of the
families with 4 to 5 people (green tab) earn less than $15,000 per year.
28%
72%
0%
10%
20%
30%
40%
50%
60%
70%
80%
all year seasonally
SPAWHS N=380
workers by type of employment
(self Identified)
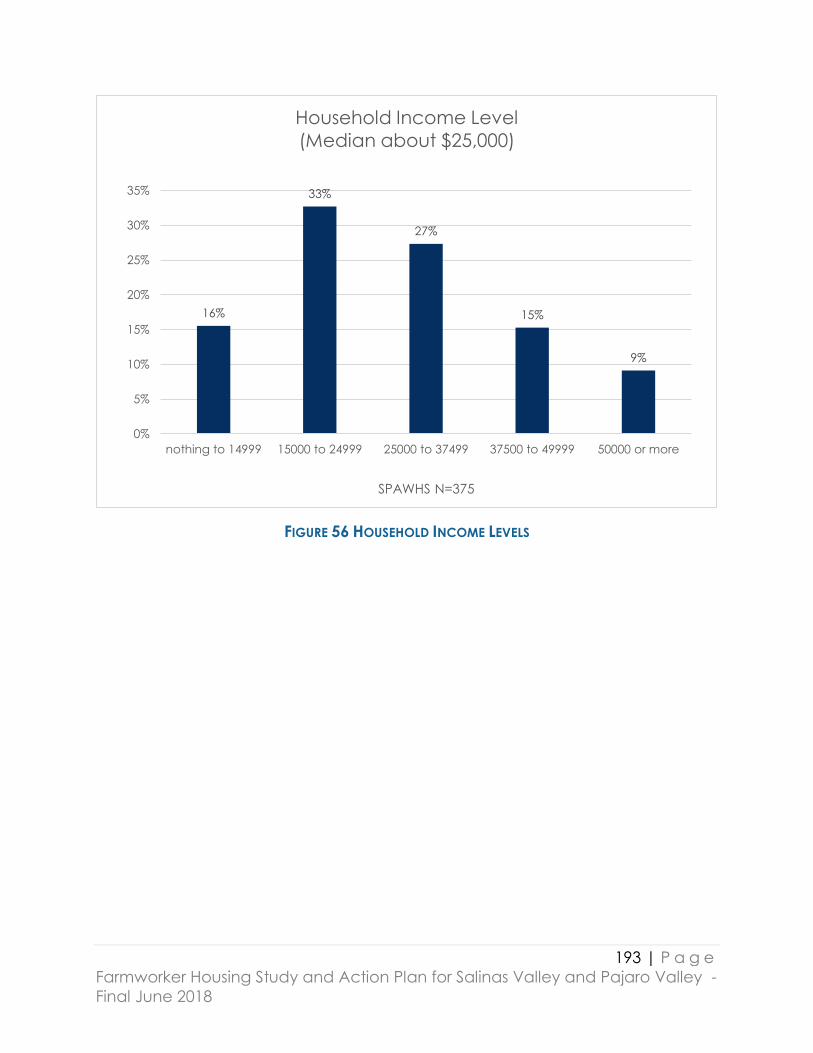
193 | P a g e
Farmworker Housing Study and Action Plan for Salinas Valley and Pajaro Valley -
Final June 2018
FIGURE 56 HOUSEHOLD INCOME LEVELS
16%
33%
27%
15%
9%
0%
5%
10%
15%
20%
25%
30%
35%
nothing to 14999 15000 to 24999 25000 to 37499 37500 to 49999 50000 or more
SPAWHS N=375
Household Income Level
(Median about $25,000)
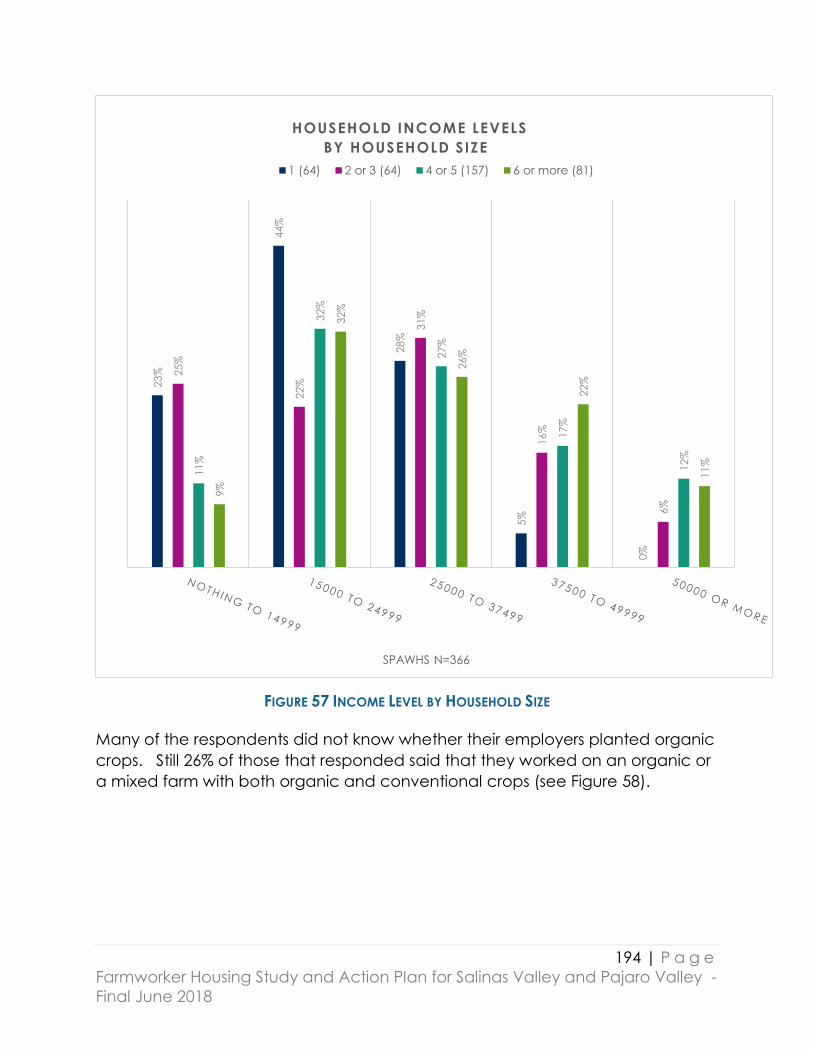
194 | P a g e
Farmworker Housing Study and Action Plan for Salinas Valley and Pajaro Valley -
Final June 2018
FIGURE 57 INCOME LEVEL BY HOUSEHOLD SIZE
Many of the respondents did not know whether their employers planted organic
crops. Still 26% of those that responded said that they worked on an organic or
a mixed farm with both organic and conventional crops (see Figure 58).
23%
44%
28%
5%
0%
25%
22%
31%
16%
6%
11%
32%
27%
17%
12%
9%
32%
26%
22%
11%
SPAWHS N=366
HOUSEHOLD INCOME LEVELS
BY HOUSEHOLD SIZE
1 (64) 2 or 3 (64) 4 or 5 (157) 6 or more (81)
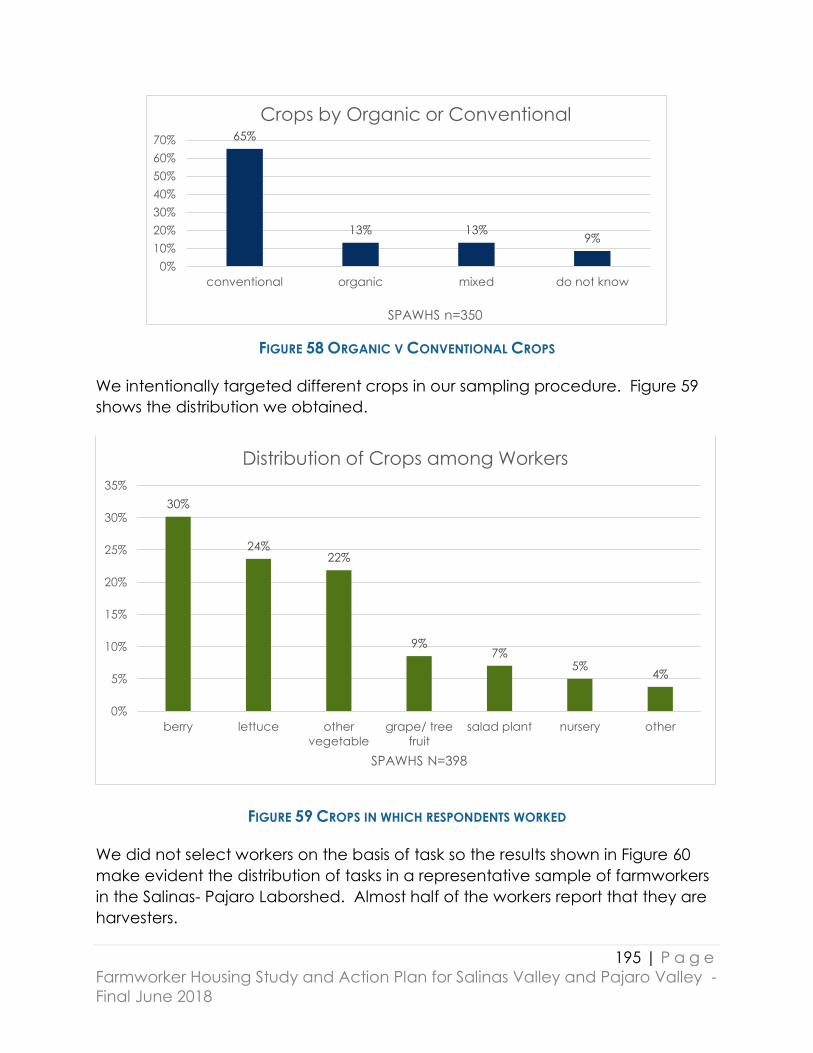
195 | P a g e
Farmworker Housing Study and Action Plan for Salinas Valley and Pajaro Valley -
Final June 2018
FIGURE 58 ORGANIC V CONVENTIONAL CROPS
We intentionally targeted different crops in our sampling procedure. Figure 59
shows the distribution we obtained.
FIGURE 59 CROPS IN WHICH RESPONDENTS WORKED
We did not select workers on the basis of task so the results shown in Figure 60
make evident the distribution of tasks in a representative sample of farmworkers
in the Salinas- Pajaro Laborshed. Almost half of the workers report that they are
harvesters.
65%
13% 13%9%
0%
10%
20%
30%
40%
50%
60%
70%
conventional organic mixed do not know
SPAWHS n=350
Crops by Organic or Conventional
30%
24%22%
9%7%
5%4%
0%
5%
10%
15%
20%
25%
30%
35%
berry lettuce other
vegetable
grape/ tree
fruit
salad plant nursery other
SPAWHS N=398
Distribution of Crops among Workers

196 | P a g e
Farmworker Housing Study and Action Plan for Salinas Valley and Pajaro Valley -
Final June 2018
FIGURE 60 TASKS DONE BY RESPONDENTS
In Figure 61, the 11 task categories were collapsed down to 5 categories to
demonstrate the concentration of different tasks by crop, nursery or salad plant
in one figure. One piece of information that is revealed by this figure is that 98
out 396 (or one quarter) of all the workers were berry harvesters. The lettuce
and vegetable workers included many skilled workers and many field packers
and unskilled pre-harvest workers as well. The grape and tree fruit workers
(mostly grape) had a large proportion of pruners and tyers of the grape canopy.
46%
16%
6%
6%
6%
4%
4%
4%
3%
3%
1%
SPAWHS N=385
DISTRIBUTION OF TASKS BY WORKERS
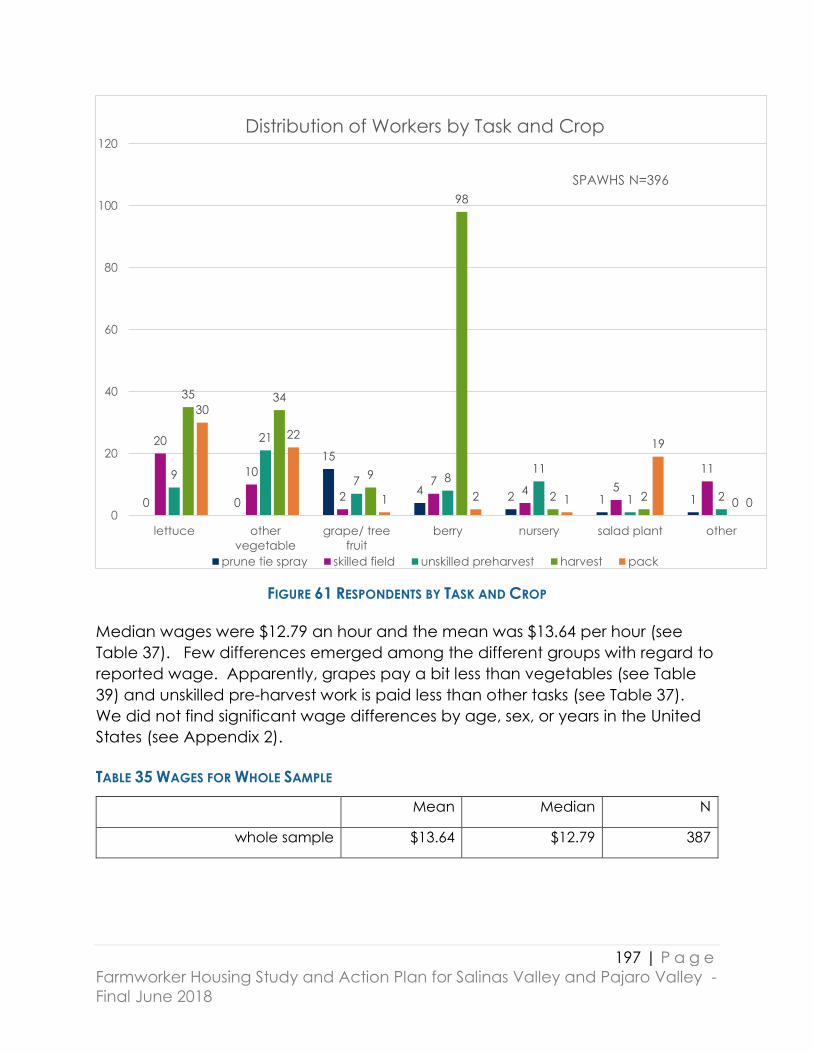
197 | P a g e
Farmworker Housing Study and Action Plan for Salinas Valley and Pajaro Valley -
Final June 2018
FIGURE 61 RESPONDENTS BY TASK AND CROP
Median wages were $12.79 an hour and the mean was $13.64 per hour (see
Table 37). Few differences emerged among the different groups with regard to
reported wage. Apparently, grapes pay a bit less than vegetables (see Table
39) and unskilled pre-harvest work is paid less than other tasks (see Table 37).
We did not find significant wage differences by age, sex, or years in the United
States (see Appendix 2).
TABLE 35 WAGES FOR WHOLE SAMPLE
Mean Median N
whole sample $13.64 $12.79 387
0 0
15
42 1 1
20
10
2
74 5
119
21
7 811
1 2
35 34
9
98
2 20
30
22
1 2 1
19
00
20
40
60
80
100
120
lettuce other
vegetable
grape/ tree
fruit
berry nursery salad plant other
SPAWHS N=396
Distribution of Workers by Task and Crop
prune tie spray skilled field unskilled preharvest harvest pack

198 | P a g e
Farmworker Housing Study and Action Plan for Salinas Valley and Pajaro Valley -
Final June 2018
TABLE 36 WAGES BY CROP
Mean Median N
lettuce $13.73 $12.79 91
other vegetable $13.02 $12.50 85
grape tree fruit $11.93 $11.50 34
berry $14.63 $14.00 116
nursery $12.51 $12.44 20
salad plant $14.40 $12.77 28
TABLE 37 WAGES BY TASK
task Mean Median N
prune tie spray $12.36 $12.00 23
skilled field $13.77 $13.13 55
unskilled preharvest $11.84 $11.50 58
harvest $14.32 $13.60 176
pack $13.66 $12.78 73
Assets of households
Of the 357 farmworkers who were born in Mexico or Central America, many
have assets in their home country. Seventy-four (or about one fifth) own a
house in their home country and 26 others own a plot of land to build a house.
Twenty-six own land to plant crops and 19 have a car or truck in their native
land.
TABLE 38 ASSETS OF FOREIGN BORN RESPONDENTS IN HOME COUNTRIES own a house 74
have land to plant 30
have land to build a house 26
own a car in home country 19
have a business 8
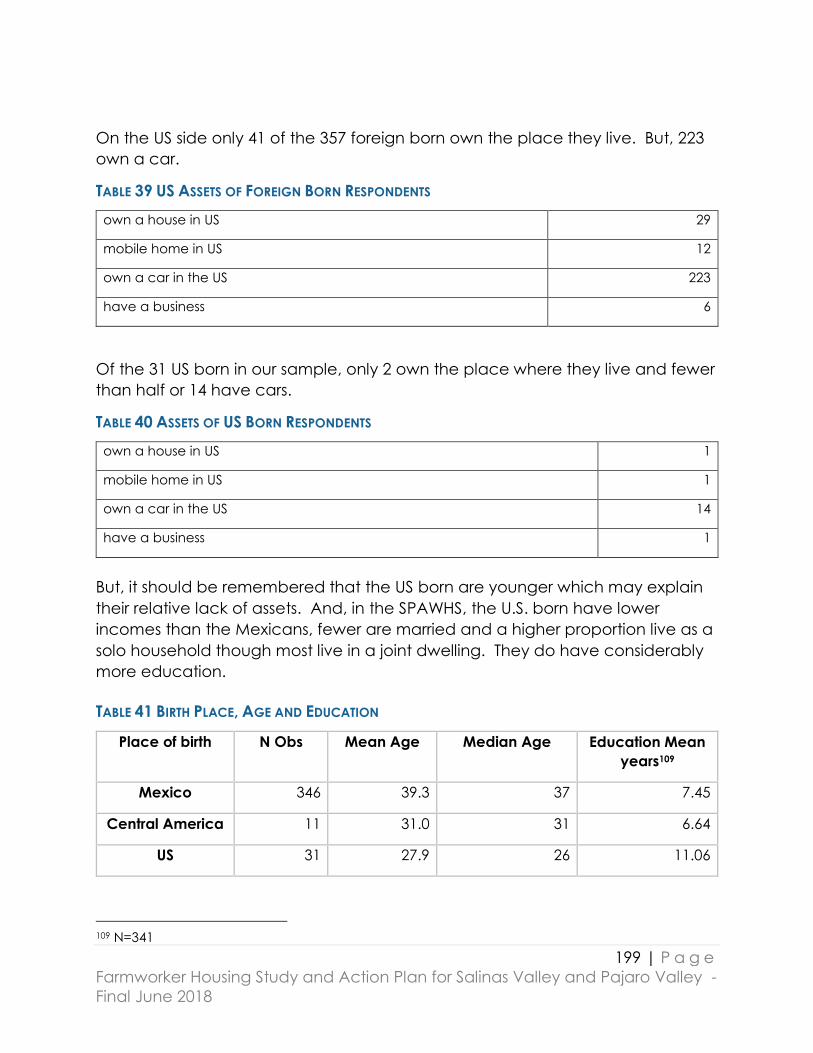
199 | P a g e
Farmworker Housing Study and Action Plan for Salinas Valley and Pajaro Valley -
Final June 2018
On the US side only 41 of the 357 foreign born own the place they live. But, 223
own a car.
TABLE 39 US ASSETS OF FOREIGN BORN RESPONDENTS
own a house in US 29
mobile home in US 12
own a car in the US 223
have a business 6
Of the 31 US born in our sample, only 2 own the place where they live and fewer
than half or 14 have cars.
TABLE 40 ASSETS OF US BORN RESPONDENTS
own a house in US 1
mobile home in US 1
own a car in the US 14
have a business 1
But, it should be remembered that the US born are younger which may explain
their relative lack of assets. And, in the SPAWHS, the U.S. born have lower
incomes than the Mexicans, fewer are married and a higher proportion live as a
solo household though most live in a joint dwelling. They do have considerably
more education.
TABLE 41 BIRTH PLACE, AGE AND EDUCATION
Place of birth N Obs Mean Age Median Age Education Mean
years109
Mexico 346 39.3 37 7.45
Central America 11 31.0 31 6.64
US 31 27.9 26 11.06
109 N=341
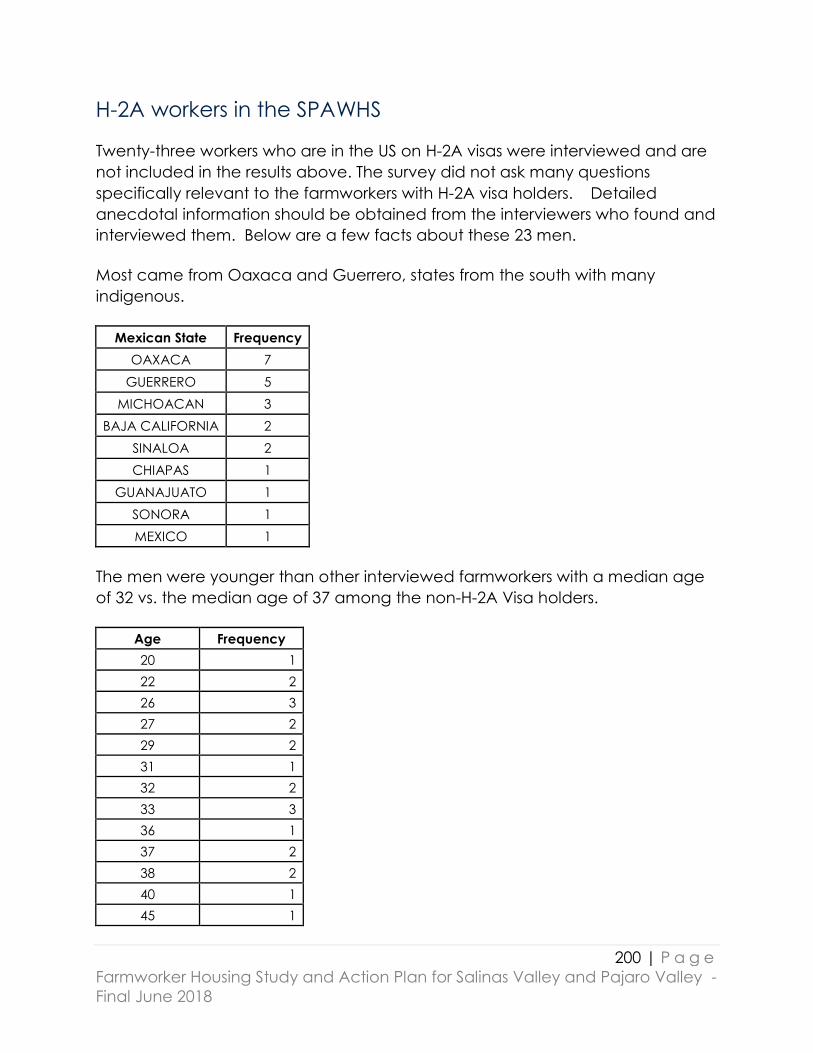
200 | P a g e
Farmworker Housing Study and Action Plan for Salinas Valley and Pajaro Valley -
Final June 2018
H-2A workers in the SPAWHS
Twenty-three workers who are in the US on H-2A visas were interviewed and are
not included in the results above. The survey did not ask many questions
specifically relevant to the farmworkers with H-2A visa holders. Detailed
anecdotal information should be obtained from the interviewers who found and
interviewed them. Below are a few facts about these 23 men.
Most came from Oaxaca and Guerrero, states from the south with many
indigenous.
Mexican State Frequency
OAXACA 7
GUERRERO 5
MICHOACAN 3
BAJA CALIFORNIA 2
SINALOA 2
CHIAPAS 1
GUANAJUATO 1
SONORA 1
MEXICO 1
The men were younger than other interviewed farmworkers with a median age
of 32 vs. the median age of 37 among the non-H-2A Visa holders.
Age Frequency
20 1
22 2
26 3
27 2
29 2
31 1
32 2
33 3
36 1
37 2
38 2
40 1
45 1

201 | P a g e
Farmworker Housing Study and Action Plan for Salinas Valley and Pajaro Valley -
Final June 2018
Years of School Frequency
0 2
3 3
6 4
8 1
9 7
12 6
Most were married. Also, they had a higher median of education (9years) than
other foreign born farmworkers.
Most lived in motels but some were located in houses.
type of dwelling Frequency
house 4
room 1
motel 16
other 1
Twenty out of 23 reported having a cell telephone with a median monthly
payment of about $50. The lowest payment was $40 and the highest $92.
Payment for phone Frequency
$40.00 2
$45.00 1
$50.00 7
$55.00 2
$58.00 1
$60.00 2
$65.00 1
$67.00 1
$70.00 2
$92.00 1
civil Frequency
single 4
married 19
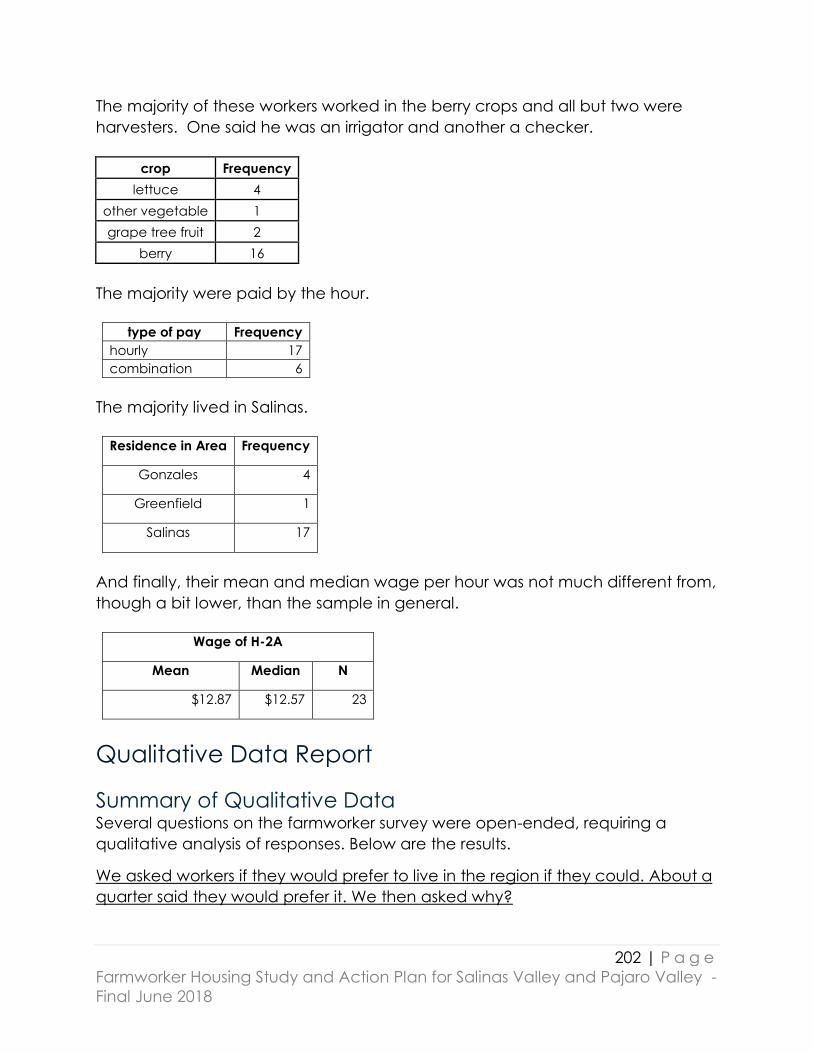
202 | P a g e
Farmworker Housing Study and Action Plan for Salinas Valley and Pajaro Valley -
Final June 2018
The majority of these workers worked in the berry crops and all but two were
harvesters. One said he was an irrigator and another a checker.
crop Frequency
lettuce 4
other vegetable 1
grape tree fruit 2
berry 16
The majority were paid by the hour.
type of pay Frequency
hourly 17
combination 6
The majority lived in Salinas.
Residence in Area Frequency
Gonzales 4
Greenfield 1
Salinas 17
And finally, their mean and median wage per hour was not much different from,
though a bit lower, than the sample in general.
Wage of H-2A
Mean Median N
$12.87 $12.57 23
Qualitative Data Report
Summary of Qualitative Data Several questions on the farmworker survey were open-ended, requiring a
qualitative analysis of responses. Below are the results.
We asked workers if they would prefer to live in the region if they could. About a
quarter said they would prefer it. We then asked why?

203 | P a g e
Farmworker Housing Study and Action Plan for Salinas Valley and Pajaro Valley -
Final June 2018
By far, the most common reason stated among those respondents who
preferred to live in the region was to be close to where there is work,
acknowledging that there is more work in the coastal counties than in other
locations in California. There was a common assertion that living in the region
would provide a better life for themselves and their families, and allow them to
keep their family together – to not be separated
The wish to live in a better location under more comfortable conditions, close to
work and opportunity, was the overwhelming sentiment that came through in
these responses.
We asked workers if they have any problems in the place where they have lived
most of the time in the last 3 months. About half of respondents responded with
affirmative responses to this question.
Of these the largest number of complaints had to do with poor maintenance,
especially problems with bathrooms and kitchens. These ranged from the
complete lack of a bathroom and/or kitchen to leaking pipes, appliances that
did not work and dangerous conditions. There were a lot of leaky pipes that had
impacts on floors and caused leaks to rooms below. Many respondents were
afraid for their safety and more commonly the safety of their children. And
many stated they did not have any place to park in their neighborhood. Three
respondents stated that they lacked refrigerators. There were complaints about
rats, spiders, insects and mold.
There were a number of complaints in these responses and most of them were
related to poor maintenance and crowded conditions.
We asked workers what kind of housing would meet the needs of them and their
families, there were some very specific wishes.
“A bedroom for everyone.”
“A small but sturdy house with a yard for my children.”
A large number of answers focused around children being safe, having space
to run, being close to resources and having their own rooms. None of the
respondents thought they needed more than 4 bedrooms. All they wanted were
bedrooms, bathrooms, kitchens with appliances that work, a living room, and a
place to be outside. There was diversity in answers with regard to type of
housing. Some respondents prefer apartments, most prefer houses and one said
he would like to buy a low-income condo.
The responses to this question showed that workers want to live in clean, well
maintained residences with safe spaces for themselves and their children.

204 | P a g e
Farmworker Housing Study and Action Plan for Salinas Valley and Pajaro Valley -
Final June 2018
Employer Interviews Of the sixty-six employers interviewed, there were 62 complete data sets. The
employers were selected as representative of the entire population in the
Salinas-Pajaro laborshed.
There is a clear divide among employers who were interviewed. There were
employers who were engaged in the issue of worker housing and had clearly
thought about it and how it might relate to their labor issues and there were
others – more than half – who did not engage around worker housing. A very
few of the employers who did not hire H-2A workers had any knowledge of the
conditions or type of housing in which their workers lived.
The majority of employers noted that they were facing a labor shortage but very
few correlated this with a housing crisis. While most employers noted that there
was a housing shortage, there were very few who had ideas or suggestions
about how to solve this issue. Many employers thought the shortage was due to
unnecessary regulations, coastal zone limitations, county zoning and an overall
lack of support from government.
Stakeholder Interviews There was great diversity among the 21 stakeholders interviewed. Because of
this diversity and the varied focus of stakeholders, it was challenging to pull out
themes from the interviews. However, some overriding perceptions were clear in
the responses. A primary idea expressed was that workers were frequently
victims of the current policies in effect at all levels of government. About half of
the stakeholders expressed concern about the cost of housing and how to pay
for it. There was overall agreement that farmworker housing is currently
crowded. NIMBYism was mentioned with regard to how neighbors can influence
planners to stop farmworker housing in their neighborhood. Opinions on the H-
2A visa program were divergent. Most convergence in this group focused
around the cost of housing, challenges for funding housing and reducing
crowdedness. The expectation is that building more housing for workers will
reduce crowded conditions. But the cost is high and there are not a lot of
options for funding while developers and growers also must struggle with
bureaucracy to complete plans.
Qualitative Survey Results: These data a presented in both graphic and verbal ways. Word clouds are
simple visualizations of data, in this case text from interviews, that convey results
at a glance. Word clouds are simple to interpret: the more a word appears in
textual data the bigger and bolder it appears in the word cloud. There are

205 | P a g e
Farmworker Housing Study and Action Plan for Salinas Valley and Pajaro Valley -
Final June 2018
various shapes and configurations of word clouds below as needed to highlight
either the clear strength of one word in the collection of interviews or the lack of
clarity in the text where there are many words of similar importance all
appearing the same size.
Several questions on the farmworker survey were open-ended, requiring a
qualitative analysis of responses. Below are the results.
We asked workers if they would prefer to live in the region if they could. About a
quarter said they would prefer it. We then asked why?
By far, the most common
reason stated among those
respondents who preferred
to live in the region was to
be close to where there is
work, acknowledging that
there is more work in the
coastal counties than in
other locations in California.
There was also a theme
related to work and
opportunity and a
perception that this region
was one in which there is
more opportunity.
However, among the other respondents, there was a common assertion that
living in the region would provide a better life for themselves and their families,
and allow them to keep their family together – to not be separated. Other
responses focused on the wish to stop moving, to live in a stable location, to
provide a safe place for children and to have a comfortable and private place
to live without being forced to live with other people (outside the immediate
family).
The wish to live in a better location under more comfortable conditions, close to
work and opportunity, was the overwhelming sentiment that came through in
these responses.
We asked workers if they have any problems in the place where they have lived
most of the time in the last 3 months. About half of respondents responded with
affirmative responses to this question.
FIGURE 62 WHY LIVE IN AREA?
206 | P a g e
Farmworker Housing Study and Action Plan for Salinas Valley and Pajaro Valley -
Final June 2018
A substantial number of respondents complained of some problem with many of
the basic housing conditions that they experience in their current dwelling. Out
of the 397 respondents 188 complained about one or more conditions. In
addition, an open-ended question was asked about complaints in dwellings
where they had lived in the previous two years. There were 56 complaints
registered about these dwellings. Also, when asked if the owner responded
when repairs were necessary, 50 people responded that the owner took too
long to fix the problem or did not fix it.
Of these the largest number of complaints had to do with poor maintenance,
especially problems with bathrooms and kitchens. These ranged from the
complete lack of a bathroom and/or kitchen to leaking pipes, appliances that
did not work and dangerous conditions. There were a lot of leaky pipes that had
impacts on floors and caused leaks to rooms below. Many respondents were
afraid for their safety and more commonly the safety of their children. And
many stated they did not have any place to park in their neighborhood. Three
respondents stated that they lacked refrigerators. There were complaints about
rats, spiders, insects and mold. Some examples are below.
“In the house where I lived the floor of the bathroom began to break and the
person in charge of the house told me that I had to pay for the repair of the
entire bathroom to be able to continue living there. That is the reason why I was
asked to leave.”
“The garage is small, we have nowhere to store things and the owners did not
adapt a place for storage. In the garage we do not have a kitchen, nor a
bathroom, and we cannot demand these from the owners for fear of being run
off, since we have not found another place to rent.”
“The owner of the house does not want to fix the water and we never have
water for the toilet, but he gets very angry when we complain and we have not
run to other places because we are many. There is never water and the carpet
always smells ugly because it is wet.”
“I live in a dirty apartment where there are many rats because of the old walls
and also cockroaches the owner does not do anything for all we tell him. Now I
am the one who sets traps or poison but it is dangerous for me because of my
children and the rats disgust me because they die anywhere in the house and
they are very large.”
There were a number of complaints in these responses and most of them were
related to poor maintenance and crowded conditions.
We asked workers what kind of housing would meet the needs of them and their
families, there were some very specific wishes.

207 | P a g e
Farmworker Housing Study and Action Plan for Salinas Valley and Pajaro Valley -
Final June 2018
It was interesting, despite the obvious need, that only a few workers mentioned:
“A bedroom for everyone.” “A small but sturdy house with a yard for my
children.”
In fact, a large number of answers focused around children being safe, having
space to run, being close to resources and having their own rooms. None of the
respondents thought they needed more than 4 bedrooms. All they wanted were
bedrooms, bathrooms, kitchens with appliances that work, a living room, and a
place to be outside. There was diversity in answers with regard to type of
housing. Some respondents prefer apartments, most prefer houses and one said
he would like to buy a low-income condo.
“The house that my family wants is a humble house with a yard, but private with
no more than my family. Safer.”
“A house where you have more space … children have their space, where we
have all the services especially to wash clothes.”
“A place that has all the services such as potable water, kitchen, three
bedrooms, living room, 2 bathrooms, room for children to play, parking lot,
garage, which is close to work and public services…”
“I am temporarily living in the Church but I have the need to find a refuge to live
because my husband was deported to Mexico and I am alone. At this moment I
am working but my concern is that it will happen when the season ends and I do
not know what is going to happen and when I can no longer be in the Church.”
The responses to this question showed that workers want to live in clean, well
maintained residences with safe spaces for themselves and their children.
Employer Interviews Of the sixty-six employers interviewed, there were 62 complete data sets. This
report is on those 62 complete interviews. In the end, the makeup of employers
was:
20 farm labor contractors
44 growers
2 both FLC and grower
The employers were selected as representative of the entire population in the
Salinas-Pajaro laborshed. The process of selection was described in the Methods
section of this report. Interviews took place from March through August, 2017.
There is a clear divide among employers who were interviewed. There were
employers who were engaged in the issue of worker housing and had clearly
thought about it and how it might relate to their labor issues and there were

208 | P a g e
Farmworker Housing Study and Action Plan for Salinas Valley and Pajaro Valley -
Final June 2018
others – more than half – who did not engage around worker housing. A very
few of the employers who did not hire H-2A workers had any knowledge of the
conditions or type of housing in which their workers lived.
The majority of employers noted that they were facing a labor shortage but very
few correlated this with a housing crisis. While most employers noted that there
was a housing shortage, there were very few who had ideas or suggestions
about how to solve this issue. Many employers thought the shortage was due to
unnecessary regulations, coastal zone limitations, county zoning and an overall
lack of support from government.
Primary challenges to success In a majority of cases employers viewed the labor shortage as the main
challenge to success. Only one employer – an FLC -- stated that he had enough
workers but not enough work. Other challenges mentioned included weather,
cost of inputs and regulations. But, by far, employers saw the shortage of labor
as their biggest challenge.
FIGURE 63 CHALLENGES FOR EMPLOYERS
Suggestions for improving housing problem Less than half of the employers interviewed stated ideas or made suggestions for
improving the housing shortage. By far the most common suggestion was to
build more affordable housing and worker specific housing. However, there
were no specifics outlined for how to get this done. And there was some minimal
agreement that more housing needs to be built for single men and H-2A
workers. A clear theme in all of these interviews is the assumption that there will
be fewer stable, local workers and more temporary guest workers in the area.
One employer suggested building more government-owned labor camps and
several suggested reducing barriers for growers to build on their land. There was
not specificity with regard to why growers felt they were not able to build on
their land. However, one employer stated that the paperwork was so onerous it
would probably take “5-6 years to get through all the paperwork to build a labor
camp.” This same employer believes that some of the growers may have

209 | P a g e
Farmworker Housing Study and Action Plan for Salinas Valley and Pajaro Valley -
Final June 2018
properties where housing could be built if there was some flexibility in the
permitting process.
FIGURE 64 IMPROVING HOUSING
What are the perceived barriers to building worker housing? When we asked employers to tell us what the major barriers are that they
perceive with regard to housing, the local government permitting process and
“regulations” were mentioned. One grower stated: “the city says no! The city
has to authorize housing of H-2As within the city. Labor is hard to find and
housing is the major obstacle.” And another stated “Get the City off our backs.”
Notably a couple growers stated that there was a 10 acre limit of land for
building housing and that there should be an exemption to this rule for farmers.
Another stated that his boss’s application to build housing was stalled at the
county level. So both city and county governments were seen as barriers by the
employer respondents to successfully addressing the housing shortage among
farmworkers.
Aside from the government, some growers specifically mentioned NIMBYism as a
barrier to housing development for workers. One employer gave an example.
She wanted to house H-2A workers in an incorporated town location near a
particular shopping center. But, the neighbors, “mostly 2nd generation people of
Mexican origin” objected. The proposed houses were single family dwellings, not
apartments or dense developments. But due to pressure from these potential
neighbors, the City would not allow the development of worker housing in this
neighborhood. In another location, near a different shopping center, “the
neighbors have not complained.” This employer stated that there is less
opposition in zip code 93905 than in 93906. She thinks the neighbors are afraid
of H-2A workers. Several employers believe that the City sides with the existing
residents.

210 | P a g e
Farmworker Housing Study and Action Plan for Salinas Valley and Pajaro Valley -
Final June 2018
Two employers specifically mentioned gang activity among farmworker
communities as a rationale for NIMBYism.
What are some of the solutions employers see for the housing crisis? Almost half of employers suggested solutions to the current housing crisis for
workers. There were many suggestions made about what the primary issues
were limiting housing and how they could be solved but there was not a lot of
recurrence among employers’ suggestions. In fact, there was divergence of
opinion over who should supply housing and whether or not this was the
responsibility of anyone other than the employee. For example, four growers
said more housing needs to be built at low cost and assistance needs to be
provided for both builders and residents.
One grower said government needs to provide workforce housing but some
other employers viewed this assistance with respect to housing as a “handout”
and stated said that “handouts” need to be ended. Expounding on this theme,
two employers discussed incentive among workers. One said workers needed
more incentive and the other said that workers were actually dis-incentivized by
assistance programs. These comments on assistance and incentive were broad
but were relayed in the context of workforce housing.
Some few employers were keen to build on their land but didn’t see any way
that would happen since they also perceived too many regulations and barriers
to this activity. There was some discussion of zoning restrictions at the county
level.
There did not seem to be much agreement on this topic across the board. So
while employers agree that more housing needs to be built, there was not
agreement on who would build it, where it would be built or how much growers
would take responsibility for it. There was also divergence in who the workers
were who needed housing. Primarily, housing was discussed for single males.
Conspicuous by its absence was a discussion of housing for workers and their
families. In fact, only one employer mentioned that he would like to see better
housing for the families of employees who worked for him.

211 | P a g e
Farmworker Housing Study and Action Plan for Salinas Valley and Pajaro Valley -
Final June 2018
The word cloud at left
is indicative of this
spread of opinions.
When asked if they
would be willing to
work on housing
solutions, about a sixth
(9) of the employers
stated that they were
willing to work on
solutions or that they
already had ideas for
solutions. Those who
were willing were
enthusiastic. One stated that she would do “anything” to help worker housing
get approved for production, a couple stated they would like to build housing
on their property, and one suggested employers – including himself -- contribute
to a trust fund for farmworker housing. The remaining employers interested in
seeking and contributing to solutions were interested in working in a
collaborative solution-seeking team.
What do employers know about where their workers live? Less than a third of employers stated with certainty the types of housing where
their workers live. Of these, most knew the general geographic location and a
very few stated that they knew the housing type. Many more could state the
geographic location -- such as Salinas, Watsonville and Greenfield -- but did not
know the types of residences or the quality or crowdedness of housing. Nor did
they make statements about affordability.
Those employers who are on the record as providing housing to their workers,
with the exception of one, stated that they provided motel/hotel rooms for H-2A
workers. Only one of the employers interviewed offered housing to their year
round, local employees. None stated that they offered housing for families.
A portion of the employers who commented on where their workers live, stated
that the cost of housing and/or the housing shortage were serious issues that
impacted their ability, as employers, to be successful. Only four employers
mentioned that their workers live in crowded conditions.
Perhaps the most interesting aspect of the knowledge employers verbalized
about their workers and housing is the fact that it appears to be very limited.
FIGURE 65 HOUSING SOLUTIONS
212 | P a g e
Farmworker Housing Study and Action Plan for Salinas Valley and Pajaro Valley -
Final June 2018
Unless the employers provide housing, they do not seem to know what type of
housing their workers live in nor who they live with. They did not offer insight into
the conditions under which workers live.
However, some employers know first-hand that housing is expensive and stated
that they themselves struggled to pay rent. One employer was aware that some
workers live in non-traditional housing like garages and “little makeshift shacks.”
Stakeholder Interviews Of the 25 stakeholders contacted, 21 agreed to interviews. There was great
diversity among the 21 stakeholders interviewed. These are identified here.
3 planners
3 “other” growers/grower shippers
3 labor advocates
2 lawyers
2 farmworker advocates
2 trade associations
1 farm labor housing manager
1 farm labor housing developer
1 FLC
1 FLC organization
1 academic
1 UC extension
Because of this diversity and the varied focus of stakeholders, it was challenging
to pull out themes from the interviews. However, some overriding perceptions
were clear in the responses. A primary idea expressed was that workers were
frequently victims of the current policies in effect at all levels of government.
Under this umbrella of “victimization” stakeholders mentioned exploitation of
workers across the board. There were mentions of how workers are recruited
and paid, migration challenges, physical demands of the work and
displacement of workers through development choices.
Tied to this concept of victimization, was the pride some interviewees expressed
when describing charitable programs in existence to support farmworkers.
Conditions at work were more commonly discussed than conditions away from
work. As a result, this limits our ability to gain a clear understanding of how
stakeholders across disciplines view housing conditions of farmworkers. In
addition, for every view there was a counter view presented. Because of this
intense diversity, word clouds do not provide any clarity from these interviews.
213 | P a g e
Farmworker Housing Study and Action Plan for Salinas Valley and Pajaro Valley -
Final June 2018
About half of the stakeholders expressed concern about the cost of developing
more housing and how to pay for it. Acknowledgement that farmworker housing
is not a money-making proposition, one stakeholder suggested instituting a
surcharge per box of produce to start a housing trust fund. Another stated that
developers simply don’t want to build affordable housing. There was also a
suggestion that building affordable housing and getting funds to do so would
“work better” in urban areas than in rural areas.
There was overall agreement that farmworker housing is currently crowded. This
was the primary condition stakeholders commented on. However, there were
some stakeholders who did not see any harm in crowding, stating that “three
families per apartment is a good idea.” She felt this was much better than the
shacks on the outskirts of town workers had previously lived in and the even
more crowded and expensive housing many workers face. There was some
discussion of the “warehousing”110 of workers and how this was not a viable
solution. One stakeholder stated that he was “struck by housing crowding”
noting that apartments on Laurel Street in Salinas are jammed to the point that
school buses fill up at this one stop.
NIMBYism came up among this group but not as frequently as it did with the
employers. The focus of these speakers was really on how neighbors can “spook
planners” into refusing a farmworker housing project in their neighborhood.
However, planners interviewed stated that farmworker housing is a priority and
projects are moved to the front of consideration.
And finally, in this group when H-2A was mentioned, again, there was
divergence of opinion. There was concern among some stakeholders over
abuses in the system and passing over of domestic workers but there was also
criticism about the program itself and its burdensome requirements.
Clearly stakeholders’ views and perceptions were widely contradictory. Most
convergence in this group focused around the cost of housing, challenges for
funding housing and reducing crowdedness. The expectation is that building
more housing for workers will reduce crowded conditions. But the cost is high
and there are not a lot of options for funding while developers and growers also
must struggle with bureaucracy to complete plans.
110 By this, stakeholders were referring to the packing of workers into houses, dormitories or motels
in such a way as to create a space similar to a warehouse but filled with residents rather than
products.
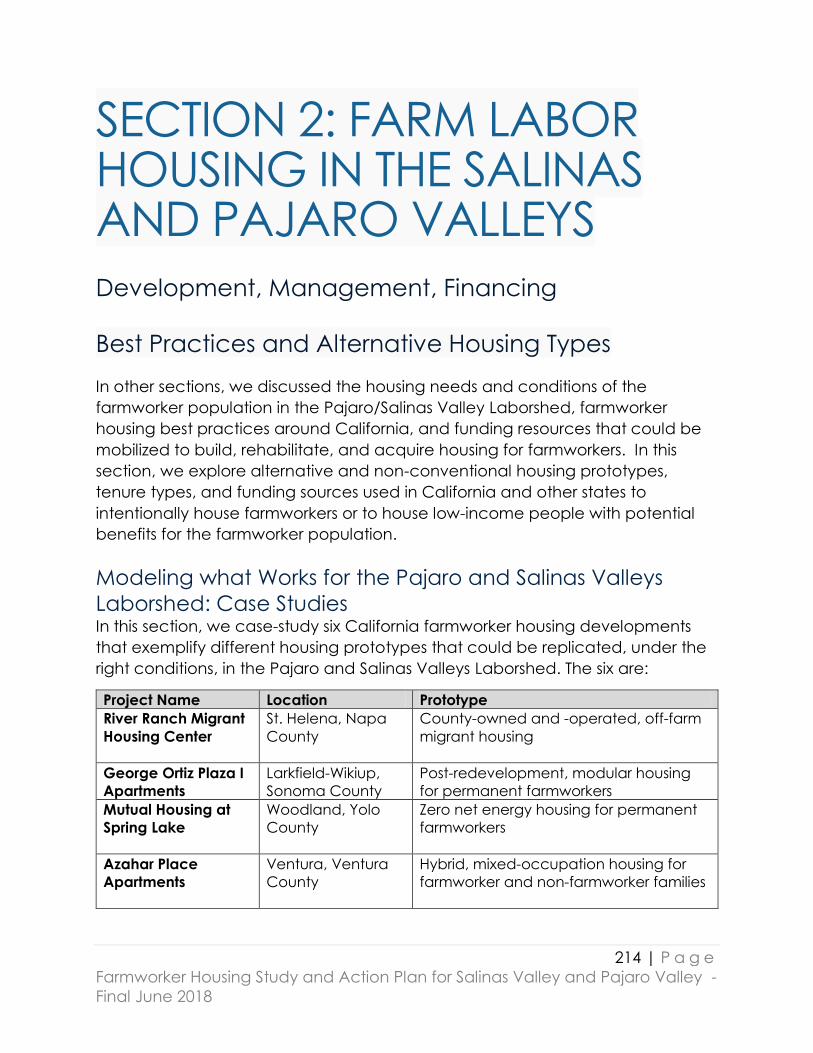
214 | P a g e
Farmworker Housing Study and Action Plan for Salinas Valley and Pajaro Valley -
Final June 2018
SECTION 2: FARM LABOR HOUSING IN THE SALINAS AND PAJARO VALLEYS
Development, Management, Financing
Best Practices and Alternative Housing Types
In other sections, we discussed the housing needs and conditions of the
farmworker population in the Pajaro/Salinas Valley Laborshed, farmworker
housing best practices around California, and funding resources that could be
mobilized to build, rehabilitate, and acquire housing for farmworkers. In this
section, we explore alternative and non-conventional housing prototypes,
tenure types, and funding sources used in California and other states to
intentionally house farmworkers or to house low-income people with potential
benefits for the farmworker population.
Modeling what Works for the Pajaro and Salinas Valleys
Laborshed: Case Studies In this section, we case-study six California farmworker housing developments
that exemplify different housing prototypes that could be replicated, under the
right conditions, in the Pajaro and Salinas Valleys Laborshed. The six are:
Project Name Location Prototype
River Ranch Migrant
Housing Center
St. Helena, Napa
County
County-owned and -operated, off-farm
migrant housing
George Ortiz Plaza I
Apartments
Larkfield-Wikiup,
Sonoma County
Post-redevelopment, modular housing
for permanent farmworkers
Mutual Housing at
Spring Lake
Woodland, Yolo
County
Zero net energy housing for permanent
farmworkers
Azahar Place
Apartments
Ventura, Ventura
County
Hybrid, mixed-occupation housing for
farmworker and non-farmworker families
215 | P a g e
Farmworker Housing Study and Action Plan for Salinas Valley and Pajaro Valley -
Final June 2018
Desert Gardens
Apartments
Indio, Riverside
County
Intergenerational housing for active and
retired farmworkers
Aliso Village East
Santa Paula,
Ventura County
Employer-owned and
-operated on-farm housing
The developments were selected by a committee of housing practitioners
working in Santa Cruz and Monterey Counties. The starting point was a survey
conducted by the California Coalition for Rural Housing (CCRH) asking member
organizations to identify their occupationally-restricted farmworker housing and
key property characteristics. From this, a list over 80 properties in coastal and
interior counties was assembled. Each of the six properties represents a unique
housing type. The Committee also considered project size, location, population,
and year of completion. The advantage of case-studying CCRH-member
organizations is that they have been developing and operating farm labor
housing for four decades and, critically, were willing to provide access to key
financial and operational information.
The information for each case study was derived via three steps. First, CCRH
prepared and administered two online questionnaires from September to
November 2017, one customized for operators of year-round, permanent
housing and the other for migrant, seasonal housing. In some cases, more than
one informant was needed to complete the questions, for example, a project
manager who had been involved on the development side and a property
manager more familiar with the current resident population and operation of
the property. Second, we followed up with phone interviews of respondents
from November 2017 to January 2018 to probe more deeply on key themes and
incomplete or unanswered questions. Finally, we combined responses from the
questionnaires and phone interviews with information from pro forma
development and operating budgets supplied by respondents and online
sources like news reports. Respondents were asked to review the final draft.

216 | P a g e
Farmworker Housing Study and Action Plan for Salinas Valley and Pajaro Valley -
Final June 2018
Aliso Village East Santa Paula, Ventura County
THE LIMONEIRA COMPANY
A Commitment to Workforce Housing
Aliso Village East Quick Facts
Location: Santa Paula, Ventura County
Developer/Owner: The Limoneira Company
Placed into Service: 2015
# Units: 68 # Farmworker Units: 68 Rental Units Studio 1-Bd 2-Bd 3-Bd 4-Bd
Unit Mix 0 0 32 32 4
Square Footage 0 0 1000 1200 1600
COMMUNITY PROFILE
The Limoneira Ranch, established in 1893, is a visually coherent district comprised
of approximately 1,600 acres of citrus and avocado orchards. These orchards
are separated by windrows of eucalyptus and poplar trees. They extend into
steep-walled ravines. Located in the western Santa Clara Valley, the ranch is
surrounded by an agricultural district made up of smaller farms ranging from 20
to 150 acres in size.
Photo: Limoneira Workforce Housing – Home Ranch

217 | P a g e
Farmworker Housing Study and Action Plan for Salinas Valley and Pajaro Valley -
Final June 2018
The community is 99% Hispanic. The homes are surrounded by agriculture. Most
tenants work in the field and packinghouse.
“There is a huge need for farmworker housing. Vacancy in our County is very low.
I currently have over 200 applications on my waiting list. A lot of families live in a
bedroom and share homes with other families.” Rosie Castillo, property manager,
Limoneira
The company operates approximately 3,200 acres of cropland in Ventura
County, a small part of its total of 11,000 acres in production. The ranch is
comprised of some mixed fruit and nut crops but the principal production is
lemons and avocados. In fact, Limoneira is North America’s largest lemon
producer and the top domestic supplier of avocados in the US. Limoneira also
has the oldest continuously operated citrus packing business in the country.
Limoneira Company provides housing to employees at below market rates.
Employees have the option to remain in their homes after retirement.
A variety of employee housing types have been built over time and are
managed by Limoneira. With a total of 258 units, 233 are occupationally
restricted to farmworkers. An inventory of all units shows larger houses are
available for foremen and supervisors, clustered housing and courtyard housing
have been built for workers, and in 2017, existing mobile homes were used for H-
2A workers.
DESCRIPTION OF
HOUSING
Aliso Village is a
development of
Limoneira Company
designed to provide
68 updated, modern
homes to the
Limoneira workforce.
Aliso Village is located
north of Foothill Road
and immediately east
of Aliso Canyon Road
near the City of Santa
Paula. Rows of
identical farmworker housing are located along the ravine and along private
Photo Courtesy of Limoneira Company
218 | P a g e
Farmworker Housing Study and Action Plan for Salinas Valley and Pajaro Valley -
Final June 2018
roads. Limoneira Ranch - Aliso Village, is a contributor to a National Register of
Historiclaces eligible agricultural historic district and an individually NRHP eligible
property as determined by San Buenaventura Research Associates in the 1996
Santa Clara Valley Phase V Survey111. Landscape features include a small park
and barbecue area, grassy play areas for children, numerous mature
ornamental trees and small vegetable gardens maintained by individual
workers. Rents for all units are based on market rental prices, and employees
receive a 40% discount below the market prices. Limoneira property
management reviews rental studies to determine comparable market rental
prices. Ventura County has one of the highest rental prices in the US, but Santa
Paula has the lowest rental prices in Ventura County.
MOVE TO MANUFACTURED HOUSING
In the 1930s when Aliso Village was originally built, it was comprised of single stick
built homes. More housing was needed in the 1960s and stucco homes were
added. Behind the stucco homes, 25-30 acres of avocados were removed with
the goal of developing a new modular home community. It took a long time to
pass all the regulatory hurdles (about 8 years) but these units were eventually
approved. The main development was completed in 2015 with three additional
units added in 2016.
The modular homes are on cement foundations. The majority of them are 2-
bedroom, 1,000 square feet, and 3-bedroom 1,200 square feet arranged in a
circular area. Apartments were not considered on the ranch. Workers and
employers wanted to maintain the single-family homes that had been
historically built and wanted to provide more open space for residents.
AMENITIES
68 units
Manufactured housing
o Altered to meet county heritage standards
o Stuccoed exteriors
o Redesigned windows and doors to fit in with existing historical
housing
Picnic area
Playgrounds
Close to hospitals, churches, schools and shopping
111 Ventura County Cultural Heritage Survey Phase V: Western Santa Clara Valley. July, 1996. San
Buenaventura Research Associates. 627 East Pleasant Street, Santa Paula CA 93060
219 | P a g e
Farmworker Housing Study and Action Plan for Salinas Valley and Pajaro Valley -
Final June 2018
Free bus services
o School bus
o On-call service
FINANCING
The total cost of the project was $8.5 million (including 8 units in another area).
Funding for the project was provided by the Limoneira Company. The project’s
initial planning began in 2008. Owing to various delays due to reviews, including
Cultural Heritage Board reviews, and a drop in the housing market, the project
was not completed until 2015.
LESSONS LEARNED:
There are benefits and drawbacks for employer-provided housing. Limoneira
has overcome them due primarily to their size and willingness to invest. In this
case, they kept costs down by choosing modular housing units.
1. Not all employers will have the finances or space for worker housing.
2. This employer has been dedicated to providing housing since startup and
this is an important aspect of the model.
3. Challenges occurred during planning and costs increased but the
employer sees the value in a sustainable workforce.
4. Unlike housing non-profits, Limoneira is just starting to improve amenities for
children living in their units. While they have provided recreational
facilities, there are not specific on-site programs for children of
farmworkers. They have found that this is an important factor for their
tenants.

220 | P a g e
Farmworker Housing Study and Action Plan for Salinas Valley and Pajaro Valley -
Final June 2018
Azahar Place Apartments
Ventura, Ventura County
Hybrid Housing for Farmworkers and Non-Farmworkers
Azahar Place Apartments Quick Facts
Location: Ventura, Ventura County
Developer/Owner: Cabrillo Economic Development Corporation
Placed into Service: 2012
# Units: 60 # Farmworker Units: 30
Rental Units Studio 1-Bd 2-Bd 3-Bd 4-Bd
Unit Mix 0 4 15 36 5
Square Footage 0 730 1120 1160 1580
Unit Rent 0 $894 $1035 $1243 $1387
COMMUNITY PROFILE
Azahar Place is a 60-unit apartment complex in east Ventura in Ventura County.
It includes 30 farmworker apartments. The County is the tenth most productive
agricultural county in the U.S. in terms of gross value of agricultural production.
However, land is very expensive, so crop selection has gravitated to primarily
labor-intensive crops, such as berries and vegetables. It is also a high-income
area with one of the highest costs of housing, ranking tenth in the nation
according to one list.1 This exacerbates the need for affordable farmworker
housing which increasingly must meet the need for an agricultural labor force
that is relatively stable and lives year-round in the county. Most farmworkers
reside in nearby Oxnard, which is more affordable, although many still live in and
around Ventura.
Production of new homes for farmworkers has been inhibited by several factors.
The infrastructure in the unincorporated county is very poor, which is a major
obstacle to building housing closer to production areas. Furthermore, Ventura
County is the birthplace of SOAR (Save Our Agricultural Resources), which was
passed by voters in 1998 to preserve the county’s agricultural heritage and open
spaces and was recently renewed until 2050. It is an important political force.
The County adopted guidelines for orderly development that call for
development to occur within the cities and established communities.
Fortunately, through the efforts of House Farmworkers (HFW)!, a project of the Ag
Futures Alliance since 2004, the housing needs of farmworkers have been

221 | P a g e
Farmworker Housing Study and Action Plan for Salinas Valley and Pajaro Valley -
Final June 2018
placed front and center by a coalition of progressive growers, labor activists,
and community and environmental advocates who have advocated together
before the County Board of Supervisors and the various City Councils. The
common perception is that the County and cities have not done enough to
house farmworkers and, as a result, it is harder now for local politicians and
citizens to be openly opposed. However, that does not necessarily mean the
NIMBY factor has disappeared. While SOAR supporters should theoretically
support higher-density farmworker housing in cities, that is not always the case
and local attempts to slow the approval process and make development more
expensive must still be overcome. According to one farmworker advocate, “I
suppose in one sense we have made a lot of progress…the status of
farmworkers has improved. They are no longer at the absolute bottom of the
totem pole.”2 But, NIMBYism is always present.
DEVELOPMENT HISTORY
Cabrillo Economic Development Corporation (CEDC), a long-time community-
based developer of farmworker housing based in Ventura, worked on the
Azahar Place project for many years. The City of Ventura had a growth control
process that exempted affordable housing, the Residential Growth
Management Program (RGMP). CEDC originally had an agreement to
purchase the entire site and build a 100 percent affordable development,
222 | P a g e
Farmworker Housing Study and Action Plan for Salinas Valley and Pajaro Valley -
Final June 2018
including rental and for-sale homes. The City committed funding to the project.
However, after intense neighborhood opposition, the City withdrew the funding
and CEDC transferred its agreement to a local market-rate developer, Ron
Hertel.
Under the RGMP, projects competed every two years in what one respondent
called a “beauty contest”. Hertel proposed several “vanilla” market-rate
projects, which did not obtain allocations. Then CEDC proposed to Hertel that
they pitch a mixed-income community on 23 acres of the original site. The Citrus
Place Master Plan was to include detached single-family homes for market-rate
buyers and 120 homes to be developed by CEDC – 60 affordable apartments
and 60 entry-level condos. The project was submitted and obtained allocations.
Ultimately, the market crashed and CEDC was able to move forward only with
Azahar Place, the 60 apartments on a 5.13-acre parcel, but not with the 60
condos.
As occurred previously, there was major opposition to the project. CEDC tried to
mollify the concerns of the neighbors, but they were still unhappy. So, to offset
their complaints and objections, CEDC sought to mobilize many more supporters
to attend and testify at hearings, especially those who had a personal
connection with individual council members. They evaluated the council
members and made a plan for how to lobby each one effectively, either one-
on-one or at the hearings or both. House Farmworkers!, through its Ventura City
Committee with support from HFW Task Force members, as well as CLUE (Clergy
& Laity United for Equity), CAUSE (Coastal Alliance United for a Sustainable
Environment), and the United Farmworkers Union organized their members to
attend meetings of the Design Review Committee, Planning Commission, and
City Council to speak in support of the project. Among the leadership of these
groups were many who were well-connected politically. It also helped that it
was part of a mixed-income development with an influential market-rate
developer.
Another obstacle was that the project needed an easement from a
neighboring apartment complex to hook up to the public sewer. The owner
refused to agree to the easement and it took the City filing an eminent domain
case that was challenged through the appellate level before sewer access was
obtained.
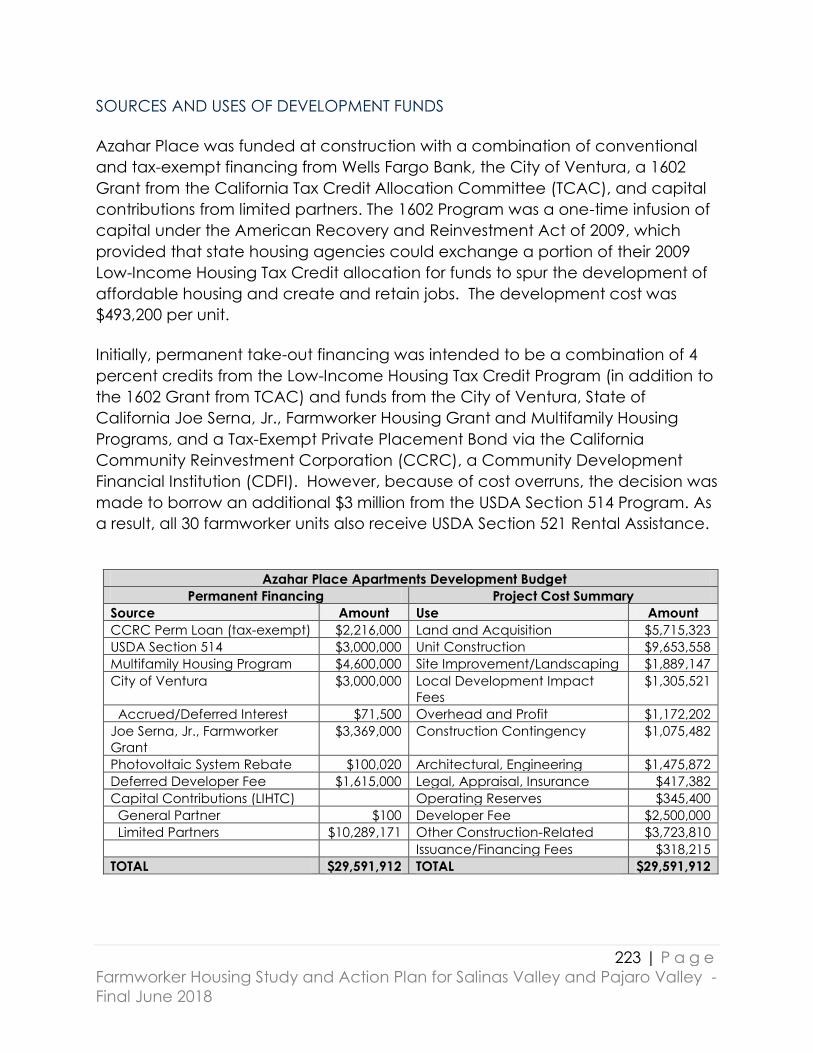
223 | P a g e
Farmworker Housing Study and Action Plan for Salinas Valley and Pajaro Valley -
Final June 2018
SOURCES AND USES OF DEVELOPMENT FUNDS
Azahar Place was funded at construction with a combination of conventional
and tax-exempt financing from Wells Fargo Bank, the City of Ventura, a 1602
Grant from the California Tax Credit Allocation Committee (TCAC), and capital
contributions from limited partners. The 1602 Program was a one-time infusion of
capital under the American Recovery and Reinvestment Act of 2009, which
provided that state housing agencies could exchange a portion of their 2009
Low-Income Housing Tax Credit allocation for funds to spur the development of
affordable housing and create and retain jobs. The development cost was
$493,200 per unit.
Initially, permanent take-out financing was intended to be a combination of 4
percent credits from the Low-Income Housing Tax Credit Program (in addition to
the 1602 Grant from TCAC) and funds from the City of Ventura, State of
California Joe Serna, Jr., Farmworker Housing Grant and Multifamily Housing
Programs, and a Tax-Exempt Private Placement Bond via the California
Community Reinvestment Corporation (CCRC), a Community Development
Financial Institution (CDFI). However, because of cost overruns, the decision was
made to borrow an additional $3 million from the USDA Section 514 Program. As
a result, all 30 farmworker units also receive USDA Section 521 Rental Assistance.
Azahar Place Apartments Development Budget
Permanent Financing Project Cost Summary
Source Amount Use Amount
CCRC Perm Loan (tax-exempt) $2,216,000 Land and Acquisition $5,715,323
USDA Section 514 $3,000,000 Unit Construction $9,653,558
Multifamily Housing Program $4,600,000 Site Improvement/Landscaping $1,889,147
City of Ventura $3,000,000 Local Development Impact
Fees
$1,305,521
Accrued/Deferred Interest $71,500 Overhead and Profit $1,172,202
Joe Serna, Jr., Farmworker
Grant
$3,369,000 Construction Contingency $1,075,482
Photovoltaic System Rebate $100,020 Architectural, Engineering $1,475,872
Deferred Developer Fee $1,615,000 Legal, Appraisal, Insurance $417,382
Capital Contributions (LIHTC) Operating Reserves $345,400
General Partner $100 Developer Fee $2,500,000
Limited Partners $10,289,171 Other Construction-Related $3,723,810
Issuance/Financing Fees $318,215
TOTAL $29,591,912 TOTAL $29,591,912

224 | P a g e
Farmworker Housing Study and Action Plan for Salinas Valley and Pajaro Valley -
Final June 2018
RESIDENT CHARACTERISTICS: MIXING FARMWORKER AND NON-FARMWORKER
FAMILIES
All 30 of the occupationally-restricted units are for active, retired, and disabled
farmworkers. Currently, there are about 248 residents of whom 67 are children
under the age of 18. There is only one householder in each of the units working
in agriculture, typically, the head-of-household. They must earn at least $5,752
annually from qualified agricultural work, which is recertified each year, to be
eligible to live in a farmworker unit. The rents for the farmworker units are
controlled by the Section 514 Program and set aside for families earning
between 30-50 percent of the Area Median Income (AMI). All of the current
occupants have incomes at 30 percent of AMI or less. Rents on the non-
farmworker units are controlled by the LIHTC Program and set aside for families
with incomes up to 60 percent of AMI.
From inception, Azahar Place was designed to be a hybrid project with a few
units reserved for farmworkers supported by the Joe Serna, Jr., Farmworker
Housing Grant Program and most available to any low-income family. That had
the benefit of both operational flexibility and access to a grant from the State to
help with development costs.
However, the later addition of USDA Rural Development (RD) funds to fill a gap
in the development cost changed the original resident mix. RD required that at
least half of the units be restricted to farmworkers.
Moreover, RD restricts units only to documented workers, imposes more
strenuous conditions on farmworker income, requires households whose
farmworker status changes to vacate, and does not allow designated
farmworker units to “float” within a hybrid project. If floating were possible, a
family could remain in the unit and the first unit vacated by a non-farmworker
could then be filled with a farmworker. Absent that option, the household must
either move to a vacant non-farmworker unit in the project, if one exists, or
move entirely from Azahar Place.
RD’s treatment of project hybridity has been inconsistent. Reportedly, RD offices
in other states have never permitted and approved hybrid Section 514/516
projects, while in California RD has supported multiple hybrid projects. Recently,
it appears that RD is taking a more conservative approach nationwide and in
California, rewarding only projects that ensure 100 percent farmworker
occupancy regardless of RD’s percentage of the total development cost.
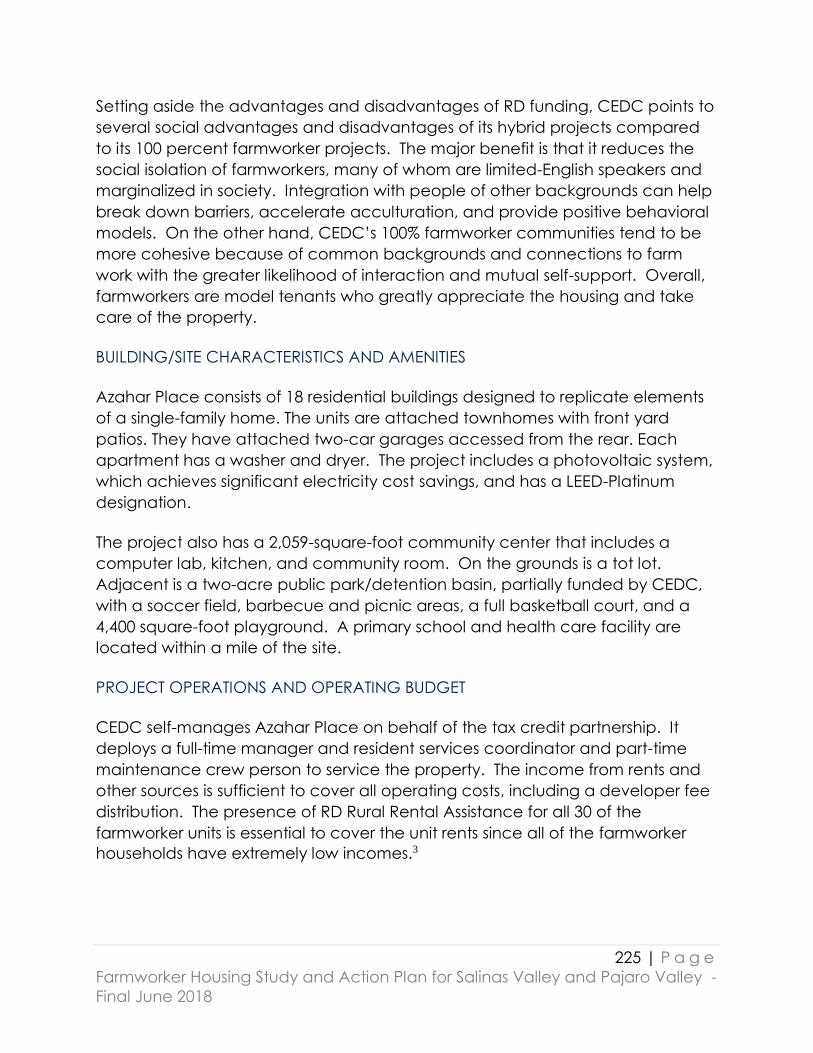
225 | P a g e
Farmworker Housing Study and Action Plan for Salinas Valley and Pajaro Valley -
Final June 2018
Setting aside the advantages and disadvantages of RD funding, CEDC points to
several social advantages and disadvantages of its hybrid projects compared
to its 100 percent farmworker projects. The major benefit is that it reduces the
social isolation of farmworkers, many of whom are limited-English speakers and
marginalized in society. Integration with people of other backgrounds can help
break down barriers, accelerate acculturation, and provide positive behavioral
models. On the other hand, CEDC’s 100% farmworker communities tend to be
more cohesive because of common backgrounds and connections to farm
work with the greater likelihood of interaction and mutual self-support. Overall,
farmworkers are model tenants who greatly appreciate the housing and take
care of the property.
BUILDING/SITE CHARACTERISTICS AND AMENITIES
Azahar Place consists of 18 residential buildings designed to replicate elements
of a single-family home. The units are attached townhomes with front yard
patios. They have attached two-car garages accessed from the rear. Each
apartment has a washer and dryer. The project includes a photovoltaic system,
which achieves significant electricity cost savings, and has a LEED-Platinum
designation.
The project also has a 2,059-square-foot community center that includes a
computer lab, kitchen, and community room. On the grounds is a tot lot.
Adjacent is a two-acre public park/detention basin, partially funded by CEDC,
with a soccer field, barbecue and picnic areas, a full basketball court, and a
4,400 square-foot playground. A primary school and health care facility are
located within a mile of the site.
PROJECT OPERATIONS AND OPERATING BUDGET
CEDC self-manages Azahar Place on behalf of the tax credit partnership. It
deploys a full-time manager and resident services coordinator and part-time
maintenance crew person to service the property. The income from rents and
other sources is sufficient to cover all operating costs, including a developer fee
distribution. The presence of RD Rural Rental Assistance for all 30 of the
farmworker units is essential to cover the unit rents since all of the farmworker
households have extremely low incomes.3
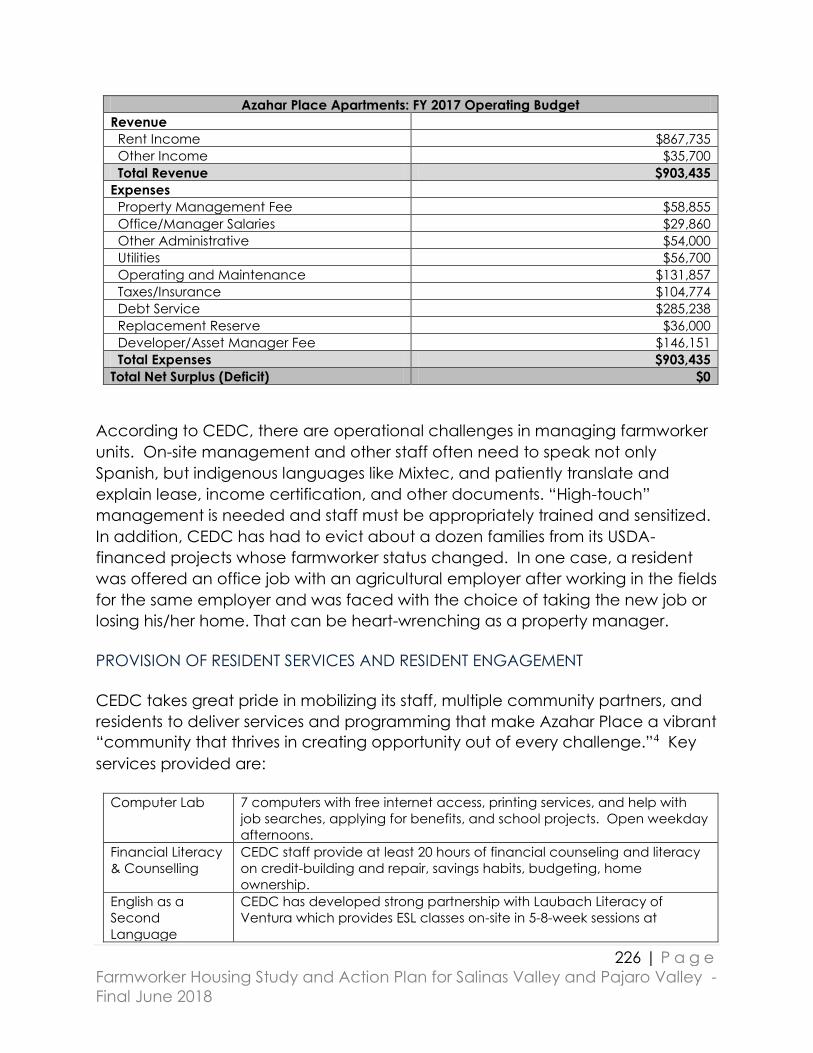
226 | P a g e
Farmworker Housing Study and Action Plan for Salinas Valley and Pajaro Valley -
Final June 2018
Azahar Place Apartments: FY 2017 Operating Budget
Revenue
Rent Income $867,735
Other Income $35,700
Total Revenue $903,435
Expenses
Property Management Fee $58,855
Office/Manager Salaries $29,860
Other Administrative $54,000
Utilities $56,700
Operating and Maintenance $131,857
Taxes/Insurance $104,774
Debt Service $285,238
Replacement Reserve $36,000
Developer/Asset Manager Fee $146,151
Total Expenses $903,435
Total Net Surplus (Deficit) $0
According to CEDC, there are operational challenges in managing farmworker
units. On-site management and other staff often need to speak not only
Spanish, but indigenous languages like Mixtec, and patiently translate and
explain lease, income certification, and other documents. “High-touch”
management is needed and staff must be appropriately trained and sensitized.
In addition, CEDC has had to evict about a dozen families from its USDA-
financed projects whose farmworker status changed. In one case, a resident
was offered an office job with an agricultural employer after working in the fields
for the same employer and was faced with the choice of taking the new job or
losing his/her home. That can be heart-wrenching as a property manager.
PROVISION OF RESIDENT SERVICES AND RESIDENT ENGAGEMENT
CEDC takes great pride in mobilizing its staff, multiple community partners, and
residents to deliver services and programming that make Azahar Place a vibrant
“community that thrives in creating opportunity out of every challenge.”4 Key
services provided are:
Computer Lab 7 computers with free internet access, printing services, and help with
job searches, applying for benefits, and school projects. Open weekday
afternoons.
Financial Literacy
& Counselling
CEDC staff provide at least 20 hours of financial counseling and literacy
on credit-building and repair, savings habits, budgeting, home
ownership.
English as a
Second
Language
CEDC has developed strong partnership with Laubach Literacy of
Ventura which provides ESL classes on-site in 5-8-week sessions at

227 | P a g e
Farmworker Housing Study and Action Plan for Salinas Valley and Pajaro Valley -
Final June 2018
beginning and intermediate levels. Linkages to advanced ESL in
partnership with Ventura and Oxnard Community College counselors.
Employment
Development
Via partnerships with Employment Development Department, Center for
Employment Training, Community Action of Ventura, California State
University, Channel Islands, and CEDC-trained staff, residents coached
on resume-building, learn new trades, e.g., auto mechanics and
computers, and are connected with potential employers.
Child Care and
Youth Programs
20 hours a week of child care via partnership with Bob Borrego Child
Care Center located within 5 miles of Azahar where income-qualified
parents may enroll their children for free.
Youth Tutoring Offer Homework Club where students from California State University,
Channel Islands, provide free tutoring to students grades 1-12 at least
twice a week for 3 hours.
Health Wellness
and Awareness
Via partnership with Clinicas Del Camino Real, health fair held twice a
year on-site offering free health screening, e.g., diabetes testing, body
and mass testing, women’s clinic, and blood drive, for residents and
local community. Ventura County Public Assistance gives free 6-week
nutrition class.
Legal Assistance Through monthly meetings, residents connected with El Concilio de
Oxnard, Mexican Consulate, and Ventura County Public Assistance,
which provide pro bono legal aide.
Lessons Learned
There are distinct advantages of mixed-occupation, hybrid projects that are
favored by many affordable housing developers and operators and some
disadvantages:
1. In terms of financial packaging, including restricted farmworker units in a new
multifamily affordable housing project can leverage grant-funding from the
Joe Serna, Jr., Farmworker Housing Grant Program to fill important gaps in
development costs.5 Passage of AB 571 (D-E. Garcia) in 2017 will now allow
the State’s Farmworker Housing Tax Credit Assistance Program to be used in
hybrid projects where at least 50 percent of the units are restricted to
farmworkers.
2. Unlike in other states, the California office of USDA Rural Development (RD)
has allowed use of the Section 514/516 Program in hybrid projects over the
last 10 years or more, providing a critical additional source of low-interest
loans and grants and long-term operating subsidy from Section 521 Rural
Rental Assistance. However, under current RD administration, it appears that
hybrid projects are now discouraged and at a competitive disadvantage,
nationwide.
228 | P a g e
Farmworker Housing Study and Action Plan for Salinas Valley and Pajaro Valley -
Final June 2018
3. Sponsors of hybrid projects will need to weigh the economic advantages of
using the Section 514/516 Program, which opens up eligibility for Section 521
rental subsidies, versus the more strenuous farmworker status and citizenship
requirements imposed by the Program that limit sponsor flexibility to fill units
with non-farmworkers or undocumented farmworkers.
4. Allowing some units to house non-farmworkers and to float is a way to ensure
full occupancy and stable rental income when there are insufficient numbers
of eligible farmworkers to fill the units.
5. Mixed-occupation housing also enables farmworker households who are no
longer working in agriculture or whose income from agriculture has declined
below threshold eligibility levels to remain in their units or to move to non-
farmworker units in the same project when they become vacant.
6. Housing operators believe there are social advantages to not isolating
farmworkers and integrating them into a diverse environment with
households having different occupational, racial, ethnic, cultural, and
linguistic backgrounds. This may also reduce NIMBY opposition at the
proposal stage.

229 | P a g e
Farmworker Housing Study and Action Plan for Salinas Valley and Pajaro Valley -
Final June 2018
Desert Gardens Apartments
Indio, Riverside County
Intergenerational Mixing of Active and Retired Farmworkers
Desert Gardens Apartments Quick Facts Location: Indio, Riverside County
Developer/Owner: Coachella Valley Housing Coalition
Placed into Service: 1998
# Units: 88 # Farmworker Units: 87 Rental Units Studio 1-Bd 2-Bd 3-Bd 4-Bd
Unit Mix 12 24 20 23 8
Square Footage 487 559 775 1020 1150
Unit Rent $610 $650 $695 $745 $805
COMMUNITY PROFILE
The 88-unit Desert Gardens Apartments was built in the City of Indio in 1998.
Together with the neighboring city of Coachella, Indio anchors a heavily
agricultural region in what is known as the Eastern Coachella Valley. The Eastern
Coachella Valley provides 50% of the country's fruits and vegetables and the
local agricultural industry can employ up to 12,000 workers per crop season.
The Eastern Coachella Valley is also one of the poorest areas of California. In
1982, Coachella Valley Housing Coalition (CVHC) was formed by community
and business activists and leaders to help address the lack of decent housing for
farmworkers and other low-income families living in the Coachella Valley.

230 | P a g e
Farmworker Housing Study and Action Plan for Salinas Valley and Pajaro Valley -
Final June 2018
CVHC obtained its first grant of $10,000 from the Aetna Foundation and hired its
first executive director.
DEVELOPMENT HISTORY
Most projects for permanent farmworkers allow former farmworkers to reside in
the property. These may be households that began their tenancies as a
farmworker and later retired or became disabled or were once active
farmworkers but not at the start of their tenancy. Desert Gardens is unique in
that it explicitly reserves 36 of the 88 units for retired farmworkers, although
retired farmworkers can also live in a non-reserved unit.
The site where Desert Gardens sits is next to the infamous Fred Young Labor
Camp, a labor camp built in the 1930s and originally designed to temporarily
house single migrant farmworkers. At that time, the camp consisted of one-
room wooden shacks. Over time, families began to move into the units. In the
1960s, USDA demolished the shacks and replaced them with 253 700 sq. ft.
cinder block units. However, the site was mismanaged and, in 2007, upon the
urging of USDA, CVHC assumed responsibility for the camp and began a multi-
phase effort to completely refurbish the complex and create a multi-use
community with farmworker housing, senior and family rental housing, single-
family home ownership, and commercial development.
The reason this is significant is that Desert Gardens was proffered by CVHC to
USDA in the 1990s, before it took possession of the Fred Young Labor Camp, as a
way to provide alternative accommodations for elderly households who had
been living in the camp for decades and had raised their families there. Even
then, the idea was that eventually the camp would be replaced with larger
units that could accommodate families. USDA suggested that CVHC make
Desert Gardens an intergenerational project, 36 units for retired farmworkers and
52 for active farmworkers. However, it took about five years before USDA would
approve sufficient funding to allow the project to proceed to construction.
The project concept and proposal were supported by a broad group of citizens
groups, advocates, growers, residents, and the CVHC Board of Directors. There
was no community opposition. For elderly farmworker residents of Fred Young,
Desert Gardens offered the opportunity to significantly upgrade the quality of
their housing and live in modern apartments near their children and
grandchildren.
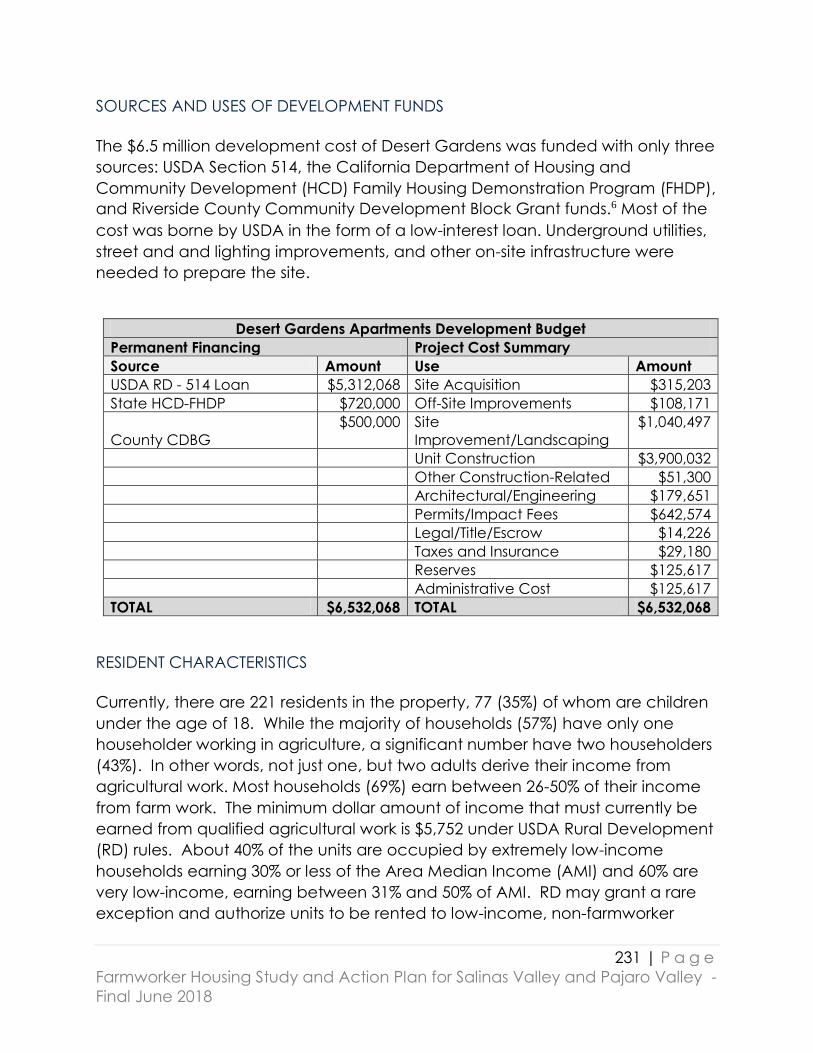
231 | P a g e
Farmworker Housing Study and Action Plan for Salinas Valley and Pajaro Valley -
Final June 2018
SOURCES AND USES OF DEVELOPMENT FUNDS
The $6.5 million development cost of Desert Gardens was funded with only three
sources: USDA Section 514, the California Department of Housing and
Community Development (HCD) Family Housing Demonstration Program (FHDP),
and Riverside County Community Development Block Grant funds.6 Most of the
cost was borne by USDA in the form of a low-interest loan. Underground utilities,
street and and lighting improvements, and other on-site infrastructure were
needed to prepare the site.
Desert Gardens Apartments Development Budget
Permanent Financing Project Cost Summary
Source Amount Use Amount
USDA RD - 514 Loan $5,312,068 Site Acquisition $315,203
State HCD-FHDP $720,000 Off-Site Improvements $108,171
County CDBG
$500,000 Site
Improvement/Landscaping
$1,040,497
Unit Construction $3,900,032
Other Construction-Related $51,300
Architectural/Engineering $179,651
Permits/Impact Fees $642,574
Legal/Title/Escrow $14,226
Taxes and Insurance $29,180
Reserves $125,617
Administrative Cost $125,617
TOTAL $6,532,068 TOTAL $6,532,068
RESIDENT CHARACTERISTICS
Currently, there are 221 residents in the property, 77 (35%) of whom are children
under the age of 18. While the majority of households (57%) have only one
householder working in agriculture, a significant number have two householders
(43%). In other words, not just one, but two adults derive their income from
agricultural work. Most households (69%) earn between 26-50% of their income
from farm work. The minimum dollar amount of income that must currently be
earned from qualified agricultural work is $5,752 under USDA Rural Development
(RD) rules. About 40% of the units are occupied by extremely low-income
households earning 30% or less of the Area Median Income (AMI) and 60% are
very low-income, earning between 31% and 50% of AMI. RD may grant a rare
exception and authorize units to be rented to low-income, non-farmworker
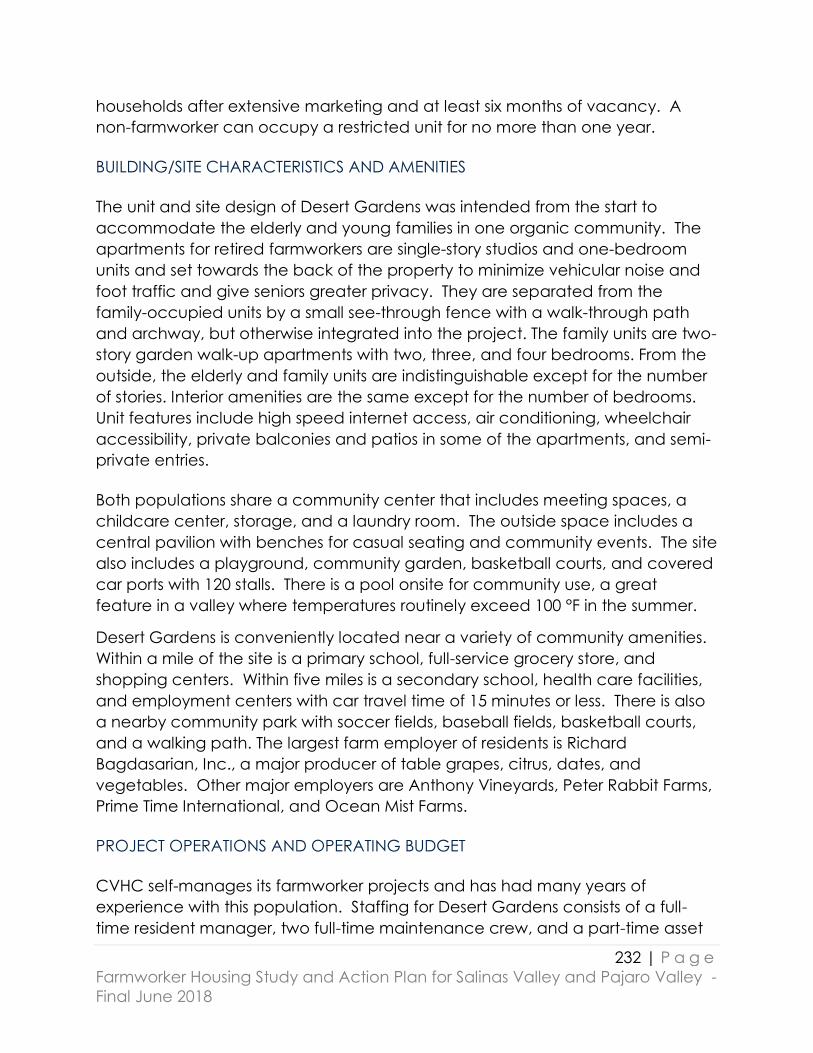
232 | P a g e
Farmworker Housing Study and Action Plan for Salinas Valley and Pajaro Valley -
Final June 2018
households after extensive marketing and at least six months of vacancy. A
non-farmworker can occupy a restricted unit for no more than one year.
BUILDING/SITE CHARACTERISTICS AND AMENITIES
The unit and site design of Desert Gardens was intended from the start to
accommodate the elderly and young families in one organic community. The
apartments for retired farmworkers are single-story studios and one-bedroom
units and set towards the back of the property to minimize vehicular noise and
foot traffic and give seniors greater privacy. They are separated from the
family-occupied units by a small see-through fence with a walk-through path
and archway, but otherwise integrated into the project. The family units are two-
story garden walk-up apartments with two, three, and four bedrooms. From the
outside, the elderly and family units are indistinguishable except for the number
of stories. Interior amenities are the same except for the number of bedrooms.
Unit features include high speed internet access, air conditioning, wheelchair
accessibility, private balconies and patios in some of the apartments, and semi-
private entries.
Both populations share a community center that includes meeting spaces, a
childcare center, storage, and a laundry room. The outside space includes a
central pavilion with benches for casual seating and community events. The site
also includes a playground, community garden, basketball courts, and covered
car ports with 120 stalls. There is a pool onsite for community use, a great
feature in a valley where temperatures routinely exceed 100 °F in the summer.
Desert Gardens is conveniently located near a variety of community amenities.
Within a mile of the site is a primary school, full-service grocery store, and
shopping centers. Within five miles is a secondary school, health care facilities,
and employment centers with car travel time of 15 minutes or less. There is also
a nearby community park with soccer fields, baseball fields, basketball courts,
and a walking path. The largest farm employer of residents is Richard
Bagdasarian, Inc., a major producer of table grapes, citrus, dates, and
vegetables. Other major employers are Anthony Vineyards, Peter Rabbit Farms,
Prime Time International, and Ocean Mist Farms.
PROJECT OPERATIONS AND OPERATING BUDGET
CVHC self-manages its farmworker projects and has had many years of
experience with this population. Staffing for Desert Gardens consists of a full-
time resident manager, two full-time maintenance crew, and a part-time asset

233 | P a g e
Farmworker Housing Study and Action Plan for Salinas Valley and Pajaro Valley -
Final June 2018
manager and resident services coordinator. Eighty-four of the 87 farmworker
units receive Section 521 Rural Rental Assistance. Anticipated operating
revenue and expenses for FY 2018 are indicated below:
Desert Gardens Apartments: FY 2018 Operating Budget
Revenue
Rent Income $739,140
Laundry Income $16,200
Other Income $5,943
Vacancy and Contingency Allowance ($14,783)
Transfer from Reserve $107,213
Total Revenue $853,713
Expenses
Maintenance and Operations $149,809
Utilities $136,109
Management Fee $63,984
Other Administrative $97,667
Taxes and Insurance $16,076
Debt Service $194,805
Reserves Transfer and Asset
Management Fee
$86,700
Annual Capital Budget $107,213
Total Expenses $852,362
Total Net Surplus (Deficit) $1,351
According to CVHC, farmworkers moving into an apartment complex that
comes with restrictions or systems that they are not used to can cause
adjustment issues. For example, some residents had potted plants on patios that
were overcrowded and hanging from porch ceilings and back walls. CVHC
does not allow that. Some residents have never used modern appliances like
dishwashers.
INTERGENERATIONAL SERVICES AND PROGRAMMING: SOCIAL AND
INTERPERSONAL BENEFITS
A central component of Desert Gardens is the intentionality of mixing older
retired farmworker households with younger active farmworker households.
CVHC offers a variety of services and programming to residents on site that are
targeted to children, adults, and the elderly, some of which cross over and
involve residents of all ages. A STEM Summer Camp program is offered to
school-age kids where children receive supplemental education in science,
technology, engineering, and math. Kids can also attend a Summer Tennis
Camp. Brunch-time community readings are held for senior poets while children
are at school. Third-party entities provide pre-school-age child care services on

234 | P a g e
Farmworker Housing Study and Action Plan for Salinas Valley and Pajaro Valley -
Final June 2018
site during the work week and operate an Adult High School Charter program.
Services are funded via foundation grants and use of volunteers from the
property and the community.
Many of the services and programs that management organizes are designed
to increase interaction between children and seniors. For example, book-
reading classes are held where children and seniors are invited to couple
together and read to each other. Some seniors volunteer in the after-school
program. Older adults lead and teach children how to perform mariachi music
and ballet folklorico and make tamales. Although there is currently no child
care provided onsite by outside parties, there are lots of examples of informal
child care arrangements as grandparents tend to children while parents are at
work or away during leisure hours. Events around holidays and gift-giving
exchanges bring together the entire community and create a sense of inclusion
and connection.
The community garden is the activity perhaps most valued by older retired
farmworkers. Residents get an assigned plot for their own use. The garden is a
place where seniors can often be found each day tending their crops and
producing fruits and vegetables that are used to supplement their household
pantries and share with their family and neighbors. Often, children join their
grandparents and neighbors in the garden and are taught basic gardening
skills. All of the produce is grown in boxes elevated above ground so that the
elderly do not have to stoop down.
The success of Desert Gardens is an inspiration for a non-farmworker community
CVHC is currently developing in the Apple Valley, the first phase of which will be
for senior citizens and the second for families. The projects will be sited on two
separate, but contiguous parcels.
LESSONS LEARNED
Desert Gardens Apartments demonstrates the efficacy of a common-sense
approach that is uniquely fitted to the cultural and social conditions and
preferences of multi-generational farmworker families.
1. Retired farmworkers have much to contribute toward child care, child-
rearing, and mentoring of the children of active farmworker families.
2. Likewise, children and their parents offer older adult farmworkers the
conditions for elder care and a sense of value and worth as these residents
age in place.

235 | P a g e
Farmworker Housing Study and Action Plan for Salinas Valley and Pajaro Valley -
Final June 2018
3. Sharing common spaces between seniors and children involves some
creative juggling, but use of facilities during the morning, afternoon, and
evening ensures that the property is fully utilized and abuzz with activity
during most waking hours, making for a village-like environment.

236 | P a g e
Farmworker Housing Study and Action Plan for Salinas Valley and Pajaro Valley -
Final June 2018
George Ortiz Plaza I Apartments Larkfield-Wikiup, Sonoma County
Post-Redevelopment Modular Construction
George Ortiz Plaza I Apartments Quick Facts
Location: Larkfield-Wikiup, Sonoma County
Developer/Owner: Phoenix Development Company; Integrity Housing; California Human
Development Corporation
Placed into Service: 2017
# Units: 30 # Farmworker Units: 29
Rental Units Studio 1-Bd 2-Bd
Unit Mix 0 0 30
Square Footage 0 0 840
Unit Rent 0 0 $594-991
COMMUNITY PROFILE
The Larkfield-Wikiup area is an unincorporated part of Sonoma County about
five miles north of Santa Rosa, the county seat and largest city in the county. In
2010, the area had a population of 8,884, just over a fifth (22.3 percent) of Latino
or Hispanic descent (U.S. Bureau of the Census). Due to the strong need for
farm labor, there is a large population of permanent, year-round farmworkers
who labor in the region’s fields, many in the county’s world-famous wine
industry. The County’s 2014 Housing Element noted that there were 2,672
children from year-round agricultural workers in the county school system during
2012-13 with one of the largest concentrations in the north county. A 2015
survey by the Sonoma County Health Department found that nearly 90 percent
of the 300 farmworkers surveyed were living in the county on a permanent, year-
round basis and 70 percent had families.
The housing market in Sonoma County is one of the least affordable in the state,
ranking ninth in 2017 according to one list7. The average percent of monthly
wage spent on housing was 73.2%. The Sonoma County Health Department
study found that farmworkers were spending up to 60% of income for rent and
identified housing as a critical need.
The current political environment encourages affordable housing production. In
2014, the County declared a housing emergency and County Supervisors set a
goal of building 2,200 new units by 2025. In November 2016, the County
approved a funding package of nearly $4 million to accelerate four low-income
housing projects, including $510,000 for Ortiz Plaza I, the first farmworker project
in the County. Unfortunately, the devastating fires in November 2017 have
237 | P a g e
Farmworker Housing Study and Action Plan for Salinas Valley and Pajaro Valley -
Final June 2018
greatly exacerbated the existing housing crisis, destroying about 5,130 dwelling
units and displacing many low-income and farmworker residents.
DEVELOPMENT HISTORY
George Ortiz Plaza I, named after the founder and long-time director of the
Santa Rosa-based California Human Development Corporation (CHDC), is the
first of a two-phase farmworker housing project. The second phase consisting of
22 units just south of the current site is scheduled to begin construction in 2018.
Phase one began in 2009. Originally, the project was to be built in Healdsburg
to the north, which had earmarked redevelopment funds. In addition, CHDC
secured a $2 million grant and $1 million low-interest loan under USDA’s Section
514/516 Program. However, when California redevelopment agencies were
dissolved in 2012, the redevelopment funds were lost and the project was put on
hold.
Fortunately, USDA was able to reserve the funds for CHDC until it could secure
other financing. When the Larkfield-Wikiup property, which had been zoned for
affordable housing in 2010, became available, CHDC purchased the 1.78- acre
site. One obstacle to be overcome, however, was community opposition.
While the project was receiving strong support from many stakeholders, there
was considerable pushback from neighbors. The neighbors submitted a 9-page
rebuttal with over 100 signatures questioning the process that was used to zone
the land as affordable housing five years earlier and raising issues with the
proposed development. These issues included too high density, potential noise
and light pollution, impacts on traffic and local schools, and fears about
increases in crime, vandalism, and gang activity.
CHDC held several community meetings to discuss details of the project design
and made accommodations to address some of these issues, such as the height
of the project’s lampposts. It challenged other assertions. Many of the same
concerns were raised by neighbors when the permitted use of the property was
approved and had been addressed at that time. The fear that crime would
increase, particularly from the presence of unsupervised minors, was unfounded
because CHDC planned to offer after-school programs that had worked
effectively to engage minors in other farmworker projects.
In February 2015, the project received unanimous conditional approval on
preliminary design review from the County’s design review committee, prelude
to a second design review that would occur prior to final plan approval.
Notwithstanding neighbor concerns, the project received final plan approval in
238 | P a g e
Farmworker Housing Study and Action Plan for Salinas Valley and Pajaro Valley -
Final June 2018
2016 and began construction in June of that year. Rent-up began in phases at
the end of July and beginning of August 2017 with temporary Certificates of
Occupancy.
SOURCES AND USES OF DEVELOPMENT FUNDS
Ortiz Plaza I is a good example of how the loss of redevelopment agency tax
increment financing, while detrimental to many projects in California, was able
to be offset by other financing. The development team, CHDC together with
general partners Phoenix Development Company and Integrity Housing,
cobbled together nearly $11 million to cover the costs of land acquisition,
construction, and permanent financing at a $365,074 per unit cost.
The complicated financing structure included financing from a wide array of
government, nonprofit, business, and private sources. In addition to previously-
mentioned USDA funds, the financing included a 30-year, deferred payment,
forgivable loan from Sonoma County Community Development Commission
(CDC) federal Community Development Block Grant Program funds; federal
and state low-income housing tax credits purchased by City Real Estate
Advisors; tax-exempt bonds purchased by the California Housing Finance
Agency; and contributions from Mary Soiland (the former property owner),
American Ag Credit, the Sonoma County Community Foundation’s Mayflower

239 | P a g e
Farmworker Housing Study and Action Plan for Salinas Valley and Pajaro Valley -
Final June 2018
Fund, Paul Hobbs Winery Fund, and Anonymous Fund, the Sonoma County
Grape Growers Foundation, and Jackson Family Wines and Enterprises.
Construction financing was provided primarily by Exchange Bank. The principal
permanent lenders are USDA and the California Community Reinvestment
Coalition (CCRC), a Community Development Financial Institution (CDFI). The
Sonoma County Permit and Resource Management Department deferred
entitlement fees and expedited permitting.
It should also be noted that Ortiz Plaza I included tax credit equity from both the
Federal Low-Income Housing Tax Credit Program, as well as the State
Farmworker Housing Tax Credit Assistance Program. The latter commitment of
$982,967 was the first use of this credit in many years. The federal credits were
from the 4 percent program, not the 9 percent program more commonly used
in farmworker housing projects. This is because of the presence of California
Department of Housing and Community Development (HCD) Multifamily
Housing Program funds (MHP), which are only allowed for use with 4 percent
credits.
Some of the donations from agricultural interests, like the original owners of the
property, the Jackson Family Fund, and Sonoma County Winegrowers
Association, helped pay for a portion of a 2,793 square foot community center
that will benefit Phases I and II and land purchase for Phase II.
Permanent Financing Project Cost Summary
Source Amount Use Amount
CCRC $2,250,000 Land and Acquisition $1,605,100
USDA - RHS 514/516 $3,000,000 Construction Costs $5,218,129
Sate HCD - MHP $516,000 Construction Contingency $230,784
Sonoma County CDC $510,000 Architectural/Engineering $332,750
MK Old Redwood (Mary
Soiland)
$250,000 Construction/Permanent
Financing
$617,787
American Ag Credit $100,000 Legal Fees, Appraisals $149,374
Deferred Developer Fee $623,130 Reserves $253,684
Tax Credit Equity $3,338,020 Other Costs $1,129.542
Developer Fee $1,050,000
TOTAL $10,587,150 TOTAL $10,587,150
CONSTRUCTION METHOD USING MANUFACTURED HOUSING COMPONENTS
To reduce construction costs and accelerate construction, CHDC and its
development partners opted to use factory-built manufactured and modular
components supplied and installed by Jeff Luchetti Construction.8 The
overwhelming majority of year-round, permanent farmworker housing in
California is stick-built and site-built. All the units were assembled in nearby
240 | P a g e
Farmworker Housing Study and Action Plan for Salinas Valley and Pajaro Valley -
Final June 2018
Windsor as pods – two pods affixed together to create one apartment and then
two apartments stacked on top of each other to create a two-story structure.
The project consists of four buildings, three buildings of eight units and one of
four units.
In retrospect, the cost savings were debatable. One of the major issues was that
the county building department had never dealt with manufactured multifamily
housing. The initial inspection and certification of the units while they were
being manufactured did not reveal that aspects of the construction and
assembly were noncompliant with county standards. Moreover, the building
contractor, who was also the manufacturer of the units, did not do its due
diligence in working with the county. As a result, after the project was built, the
county demanded that 20 percent of the walls be opened and the underneath
flooring to inspect the physical connections of the wiring and plumbing. CHDC
tried to reason with the county and engage a mediator, but to no avail. This
caused time and cost overruns, adding an extra two months and considerable
new expense.
According to CHDC, the cost and time savings of using manufactured or
modular components, absent the dust-up with the county building department,
would probably have justified the building prototype. A lot about the
construction method made it much faster, particularly since the winter of 2016-
17 was exceptionally rainy. However, the supplier is no longer building this
product and CHDC is not planning to use manufactured housing in Phase II.
RESIDENT CHARACTERISTICS
Eligibility to reside in Ortiz Plaza I is subject to the rules for qualified agricultural
work and income in Title 7, Subtitle B, Chapter XXXV, Part 3560 of the federal
Code of Regulations. This section governs the USDA Section 514/516 Program.
Currently the minimum amount of income that must be earned from farm work
in a 12-month period is $5,752, which is annually recertified.
According to property management staff, all 29 farmworker-restricted units
have just one farmworker householder. Most are working year-round in the more
than 1,000 wineries in Sonoma County and environs. Currently, there are 93
residents, 33 of whom are children under the age of 18. Seven of the households
are extremely low income (30 percent of Area Median Income (AMI)), four are
very low-income (40 percent of AMI), and 19 are at 50% of AMI. All 29 of the
241 | P a g e
Farmworker Housing Study and Action Plan for Salinas Valley and Pajaro Valley -
Final June 2018
farmworker-restricted units receive USDA RHS Section 523 rental assistance,
which limits tenant rents to no more than 30% of household income.
Originally, the plan was to reserve 11 of the units for extremely low-income
households, the kind of deep targeting favored by government funding
agencies. However, CHDC was able to fill only seven of the ELI units at initial
occupancy, mostly with retired farmworkers. CHDC found that in a higher-cost
area like Sonoma County farmworker incomes tend to exceed the ELI level,
especially in the current environment of labor shortages. A 2012 market study
revealed that the average farmworker was making $10-11 dollars per hour, but
in 2017 the average farmworker made $18 per hour. Critically, CHDC was able
to get an exception for the first year from USDA, the California Tax Credit
Allocation Committee, and the Sonoma County CDC and transfer four of the
units for occupancy by households at 50 percent of AMI.
BUILDING/SITE CHARACTERISTICS AND AMENITIES
The 30 2-bedroom, 11/2-bathroom units are clustered in four buildings. Each unit
comes equipped with a refrigerator, stove/microwave, dishwasher, and central
heat. Onsite facilities include a community center with laundry facilities, a
management office, kitchen, covered patio, BBQ/picnic area, a playground,
community gardens, and a teen recreational area. The project also meets
green building standards, including solar orientation, use of recycled building
materials, water-conserving fixtures and landscaping, and energy star-rated
appliances. The site is located within one mile of a primary school, secondary
school, transition station, health facilities, a full-service grocery store, and
shopping. Employment is located generally within a 15-minute drive from the
project.
PROJECT OPERATIONS AND OPERATING BUDGET
The cash flow projections for Year 1 of Ortiz Plaza show operating income of
$547,372, expenses of $244,073, and net operating income of $303,299 to pay
for debt service on a first and second mortgage and asset management,
administrative partner, and deferred developer fees.
More than half the rental income will be from rental subsidies and most of the
remaining income from tenant contributions to restricted rents. The rent roll for
December 2017 shows tenant contributions to rent of $18,798, an average of
$627 per household. Operating expenses are mostly for ‘residential expenses’,

242 | P a g e
Farmworker Housing Study and Action Plan for Salinas Valley and Pajaro Valley -
Final June 2018
which includes the staff costs of a full-time onsite manager, maintenance crew
person, and asset manager, and one part-time resident services coordinator.
About 12 percent of operating costs (net of debt service and partnership fees)
are for annual replacement reserves.
Long-term projections show project viability for 30 years with the continuing flow
of USDA rental assistance.9 As Phase II is built out, the expectation is that
additional economies of scale will be achieved and stable income.
George Ortiz Plaza I: FY 2017 Operating Budget
Revenue
Restricted Rental Income $246,264
Subsidy Income $313,152
Other Income $16,755
Vacancy Allowance ($28,799)
Total Revenue $547,372
Expenses
Residential Expenses $209,270
Real Estate Taxes $6,303
Replacement Reserves $28,500
Debt Service $259,690
Asset Management, Administrative Partner, Deferred Developer
Fees
$43,609
Total Expenses $547,372
Total Net Surplus (Deficit) $0
PROVISION OF RESIDENT SERVICES AND RESIDENT ENGAGEMENT
CHDC is a 50-year old organization originally created to provide a full range of
services to help farmworkers escape poverty via education, job training, and
improved social conditions. It is essentially a social services organization with a
housing development component rather than a housing development
organization with a social services component. Given CHDC’s location just five
miles from Ortiz Plaza I and its mission, it is well-suited to deliver comprehensive
in-house social services to Ortiz Plaza I.
Since the project just began to rent up, CHDC is still figuring out what social
services to provide. Most tenants are young couples in their 20s and 30s with 1-3
children. It is already offering workforce development at its office and wants to
offer this onsite on weekends. In 2018, the hope is to deliver English as a Second
Language, citizenship, financial literacy, computer, and education and nutrition
classes, health services outreach, and mentoring programs. A grant from the

243 | P a g e
Farmworker Housing Study and Action Plan for Salinas Valley and Pajaro Valley -
Final June 2018
U.S. Department of Labor will allow for purchase of computers, furnishings for the
community center, and equipment for the children’s play area and BBQ. CHDC
will also receive Community Services Block Grant funds from the Sonoma County
CDC to expand services, such as small business development and financial
literacy, as a result of the fire. CHDC does not provide child care, but wants to
work with a third party. The plan is to create a residents’ council in 2018 to
formalize resident input into property operations.
LESSONS LEARNED
1. Despite the loss of redevelopment funds since 2012, it is still possible to build
year-round, permanent farmworker housing using a combination of federal,
state, and local public and private resources. In the case of Ortiz Plaza 1, it
was critically important that the Sonoma County CDC, local growers and
foundations, and CDFIs step up to provide the initial capital for land
acquisition and predevelopment which had been previously available from
redevelopment agencies.
2. In addition to construction and permanent financing from a multiplicity of
sources, including tax credit equity from the federal Low-Income Housing Tax
Credit Program and California Farmworker Housing Tax Credit Assistance
Program, the critical component was the commitment of USDA Section
514/516 loans and grants and accompanying Section 523 Rental Assistance
to keep tenant contributions to rent at no more than 30% of household
income.
3. Use of manufactured and modular components to expedite construction
time and reduce materials and labor costs has the potential to lower overall
development costs. However, it is essential that the supplier, contractor,
developer, and local government work closely together to ensure in
advance that the components and installation comply with local building
codes. As a general rule, the building contractor and manufacturer should
not be the same party.
4. In a high-cost area like Sonoma County, with a severe shortage of
agricultural labor, filling units reserved for extremely low-income (ELI)
households can be challenging since farmworkers may be able to command
higher wages. Some growers may opt to hire foreign workers through the H-
2A Program at lower wages. The volatility of farm labor demand, supply, and
wages suggests that developers not over-promise the number of ELI units
they can deliver, unless funding agencies are willing to be flexible and allow
ELI units to be temporarily occupied by higher-wage households.

244 | P a g e
Farmworker Housing Study and Action Plan for Salinas Valley and Pajaro Valley -
Final June 2018
Mutual Housing at Spring Lake
Woodland, Yolo County
Zero Net Energy Housing for Permanent Farmworkers
Mutual Housing at Spring Lake Quick Facts
Location: Woodland, Yolo County
Developer/Owner: Mutual Housing California
Placed into Service: 2015
# Units: 62 # Farmworker Units: 61
Rental Units Studio 1-Bd 2-Bd 3-Bd 4-Bd
Unit Mix 0 12 20 22 8
Square Footage 0 709 929 1390 1515
Unit Rent 0 $894 $1035 $1243 $1387
COMMUNITY PROFILE
Mutual Housing at Spring Lake is not only the first permanent, year-round housing
for farmworkers in the City of Woodland, but the first certified zero net energy
multifamily rental complex for any population in the U.S.10 This highly-lauded
project consisting of 62 apartments and townhouses opened in 2015 and has
been heralded for its innovative, energy-efficient design and commitment to
sustainability. In December 2017, it was selected by the United Kingdom-based
organization, World Habitat, as one of two United Nations Habitat Award-
winning projects in the world. In 2018, construction is anticipated on Phase II, an
additional 39 homes for farmworkers with even more advanced energy and
water-efficiency features.
245 | P a g e
Farmworker Housing Study and Action Plan for Salinas Valley and Pajaro Valley -
Final June 2018
The City of Woodland is the county seat of Yolo County and the economic hub
of diverse agricultural, food manufacturing, warehousing, and distribution
facilities for a large region in Northeastern California. Several food processing
and tomato canning operations there employ a large portion of the local
farmworker population and year-round farm employment has been increasing
in the county overall.
While Yolo County is estimated to be home to 6,340 agricultural workers
employed in the fields and processing plants, a majority of whom live in the
community year-round, there is a large unmet need for affordable housing,
especially as rents have increased over time. Rental costs in this part of
California increased by 3.5 percent a year from 2011 to 2016 due to increasing
demand. The local housing authority has more than 10,000 applicants on its
waiting list for public housing and nearly 4,500 applicants waiting for federal
rental subsidies. The shortage means that low-wage agricultural workers struggle
to find rental housing within their payment ability.
The City of Woodland Housing Element calls for more agricultural worker housing
and more energy-efficient housing. Additionally, City policies require new
planning areas to designate land for multifamily, higher-density housing. Under
the City’s inclusionary or mixed-income housing ordinance, market-rate housing
developers building single-family residential projects of fewer than 50 units,
where the City determines it is infeasible to build on-site affordable units, must
pay an in-lieu fee to the City to satisfy the developer’s affordable housing
obligation.
DEVELOPMENT HISTORY
In 2010, Mutual Housing California (Mutual Housing), a Sacramento-based
nonprofit housing development organization, surveyed agricultural workers at
their workplaces in Woodland about their housing concerns. The results revealed
that the biggest problems people experienced were high rents and high utility
bills. Much of the housing available was seasonal, but many of the workers lived
in the area year-round, often in unsuitable dwellings. This highlighted the need
for permanent affordable housing.
Mutual Housing set upon meeting these needs by purchasing the project site on
one of the few multifamily plots of land remaining in a new master-planned
subdivision in Woodland. Previously, the organization had been alerted by local
legal service attorneys that the then owner was proposing a rezone of the site
for single-family housing for higher-income families, claiming there were no

246 | P a g e
Farmworker Housing Study and Action Plan for Salinas Valley and Pajaro Valley -
Final June 2018
willing buyers of multifamily zoned parcels. Building at the site was necessary to
ensure economically inclusive development. Mutual Housing was able to
convince elected officials to resist the rezoning request in favor of its proposed
development and to provide partial funding through the City’s housing trust
fund supported by payments from single-family home builders.
To achieve greater sustainability and to lower residents’ utility bills, Mutual
Housing aimed not only to build affordable homes, but zero net energy homes.
In the early predevelopment phase, it implemented a comprehensive
community outreach and engagement plan in partnership with the largest
Catholic Church in the city, Holy Rosary Church. Many of their members were
agricultural workers. The church’s service coordinator had a great relationship
with congregants and other organizations that served farmworkers. The church
hosted workshops on its site to which congregants and the community at large
were invited to learn about Mutual Housing, discuss the features they would like
to see in the apartments. The feedback helped shape and inform the efforts of
the design team.
As the property was under construction, homeowners surrounding the property
were growing concerned about the type of housing being built, whether it
would exacerbate traffic and school crowding and whether the housing was for
migrant or year-round workers. Mutual Housing California spoke to individual
homeowners and, after rent-up, hosted an open house event for all neighbors to
meet their new neighbors and on-site staff. Homeowners who attended were
able to ask questions and get clarity on the type of housing and mission of
Mutual Housing. They were also able to tour an apartment and learn about
building and site amenities on the property. The need to communicate with and
address concerns of neighbors has continued post-construction as parking,
exterior light, and other issues have surfaced.
SOURCES AND USES OF DEVELOPMENT FUNDS
Mutual Housing at Spring Lake was developed with a combination of federal,
state, and local government financing and a conventional bank loan from
CitiBank. Government sources included a USDA Section 514 Farmworker
Housing Program loan, federal and state Low-Income Housing Tax Credits, a
grant from the Joe Serna, Jr., Farmworker Housing Program, and City of
Woodland funds from its Housing Trust Fund. Housing Trust Fund dollars were
generated through the city’s inclusionary housing program in-lieu fee on single-
family home construction. The total development cost was $22,303,406 or
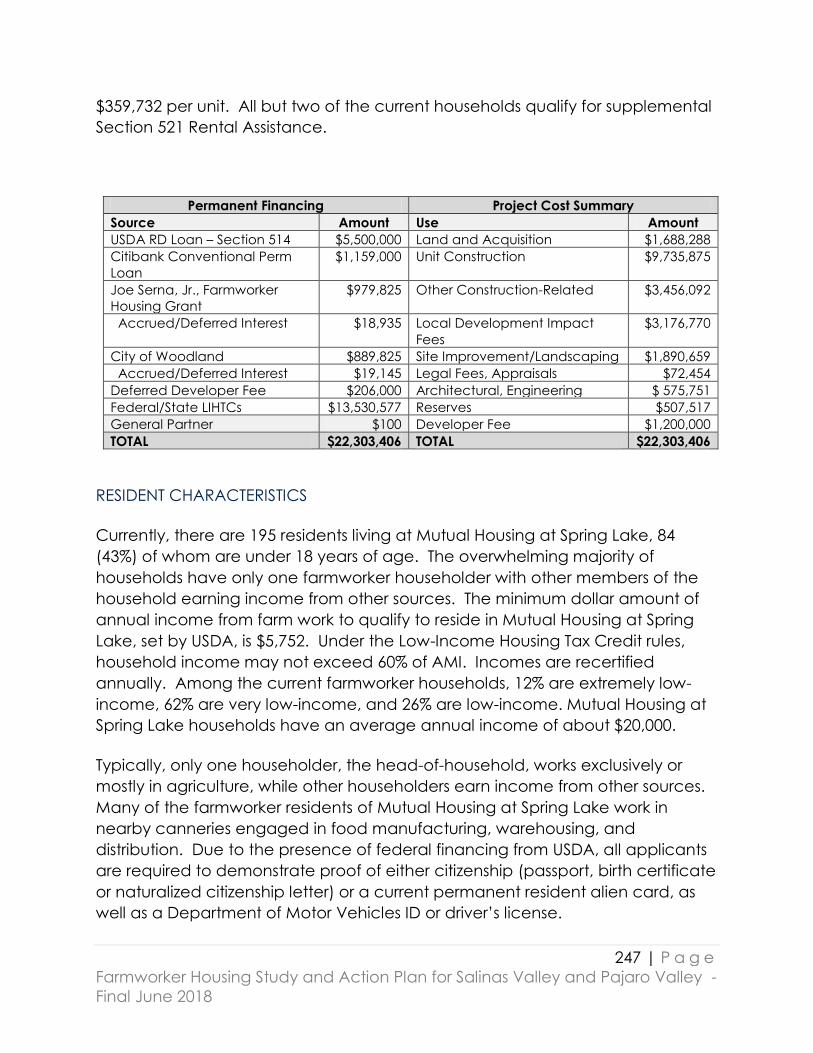
247 | P a g e
Farmworker Housing Study and Action Plan for Salinas Valley and Pajaro Valley -
Final June 2018
$359,732 per unit. All but two of the current households qualify for supplemental
Section 521 Rental Assistance.
Permanent Financing Project Cost Summary
Source Amount Use Amount
USDA RD Loan – Section 514 $5,500,000 Land and Acquisition $1,688,288
Citibank Conventional Perm
Loan
$1,159,000 Unit Construction $9,735,875
Joe Serna, Jr., Farmworker
Housing Grant
$979,825 Other Construction-Related $3,456,092
Accrued/Deferred Interest $18,935 Local Development Impact
Fees
$3,176,770
City of Woodland $889,825 Site Improvement/Landscaping $1,890,659
Accrued/Deferred Interest $19,145 Legal Fees, Appraisals $72,454
Deferred Developer Fee $206,000 Architectural, Engineering $ 575,751
Federal/State LIHTCs $13,530,577 Reserves $507,517
General Partner $100 Developer Fee $1,200,000
TOTAL $22,303,406 TOTAL $22,303,406
RESIDENT CHARACTERISTICS
Currently, there are 195 residents living at Mutual Housing at Spring Lake, 84
(43%) of whom are under 18 years of age. The overwhelming majority of
households have only one farmworker householder with other members of the
household earning income from other sources. The minimum dollar amount of
annual income from farm work to qualify to reside in Mutual Housing at Spring
Lake, set by USDA, is $5,752. Under the Low-Income Housing Tax Credit rules,
household income may not exceed 60% of AMI. Incomes are recertified
annually. Among the current farmworker households, 12% are extremely low-
income, 62% are very low-income, and 26% are low-income. Mutual Housing at
Spring Lake households have an average annual income of about $20,000.
Typically, only one householder, the head-of-household, works exclusively or
mostly in agriculture, while other householders earn income from other sources.
Many of the farmworker residents of Mutual Housing at Spring Lake work in
nearby canneries engaged in food manufacturing, warehousing, and
distribution. Due to the presence of federal financing from USDA, all applicants
are required to demonstrate proof of either citizenship (passport, birth certificate
or naturalized citizenship letter) or a current permanent resident alien card, as
well as a Department of Motor Vehicles ID or driver’s license.

248 | P a g e
Farmworker Housing Study and Action Plan for Salinas Valley and Pajaro Valley -
Final June 2018
ACHIEVING ZERO NET ENERGY
Mutual Housing at Spring Lake was built with sustainable features for energy-
efficiency, water and resource conservation, and indoor air quality. The
residents benefit from an all-electric Zero Net Energy design and the opportunity
for conservation-minded households to have their utility costs be as low as the
utility company’s monthly administrative fee (approximately $10). A suite of
high-performance materials, equipment, and construction methods contribute
to high levels of efficiency and sustainability:
Highly-efficient lighting
Improved insulation
Insulation-enhancing framing
details on doors and windows
Precision-engineered windows
Innovative heat exchanger and
pump system for domestic hot
water, heating, and cooling
Low-flow plumbing
Advanced mechanical ventilation, in-
take filters, fans
Tight-fitting duct work
Reduced air infiltration
Water-efficient landscaping and
irrigation
Sustainable wood products
Natural and environmentally
friendly flooring and finishes
Construction waste
management/71% diversion to
recycling
Thermostatic shower shut-off
valves
Energy-efficient appliances
249 | P a g e
Farmworker Housing Study and Action Plan for Salinas Valley and Pajaro Valley
Final June 2018
The Photovoltaic system was designed to produce about 334,000 kilowatt hours
annually resulting in approximately $60,000 in savings to residents and the owner.
The water-saving components, together with resident education, have resulted
in 40% less water use in Mutual Housing at Spring Lake than in other similar
apartment complexes. The buildings exceeded California’s energy conservation
requirements at the time of construction by 36-40%. The energy produced at
Mutual Housing at Spring Lake offsets an estimated 235 metric tons of
greenhouse gas emission. The cost of these energy-efficient measures above
minimum requirements was $511,000 and the Photovoltaic system added
$975,000 for a total incremental cost of $1.5 Million to reach Zero Net Energy.
Energy-Efficiency and Solar Rebates totaling $400,000 resulted in a net 9%
incremental cost premium over the minimum code requirements.
ZNE certification is based on an estimate that a building has the potential on an
annual basis to produce an amount of renewable energy on site roughly equal
to the amount of energy consumption. It doesn’t mean, however, that
production will always equal consumption. If residents or common areas use
more energy than expected or the PV system under-produces, then the building
will not achieve ZNE. In 2016, the first full year of operations, Mutual Housing at
Spring Lake consumed approximately 25% more electricity than it generated.
Solar electricity generation closely matched the energy model, while
consumption exceeded it. Energy usage within each of the 62 homes varied
widely due to resident needs and behaviors, with hot water usage and
electronics being the largest contributors to over-consumption. 2017 was much
the same.
Critically important to the realization of ZNE will be continuing resident
education. Upon moving in, residents are presented with an English- or Spanish-
version Residents Green Guide, like a user manual, that details in words and
illustrations how best to use the green features, such as energy monitors,
thermostats, shower valves, and air conditioning and heating systems to
maximum efficiency. Individual and group trainings are also offered.
BUILDING/SITE CHARACTERISTICS AND AMENITIES
A community building and outdoor recreation area are located at the center of
the community, with community gardens scattered throughout. The main
activity room features a large art piece, a mural that celebrates the aspirations
of the agricultural worker community. The community building also features a
computer learning lab and space for resident activities, such as financial
education, leadership training, home-buyer preparation, health education, and
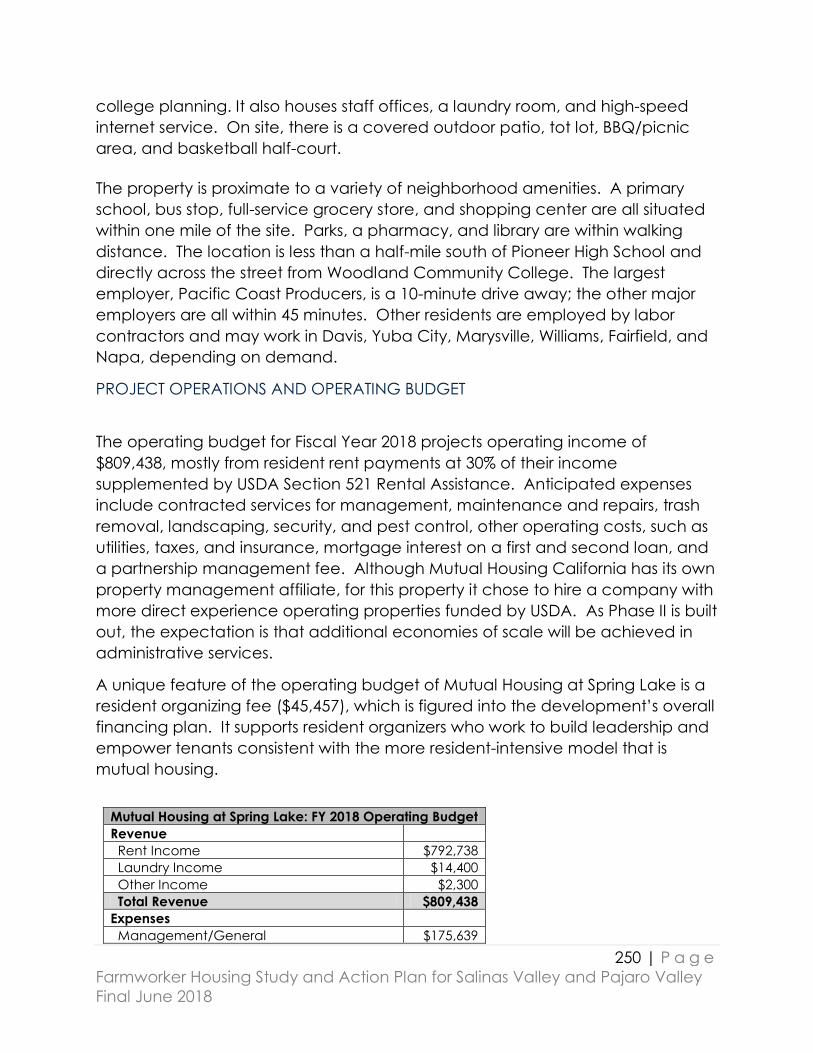
250 | P a g e
Farmworker Housing Study and Action Plan for Salinas Valley and Pajaro Valley
Final June 2018
college planning. It also houses staff offices, a laundry room, and high-speed
internet service. On site, there is a covered outdoor patio, tot lot, BBQ/picnic
area, and basketball half-court.
The property is proximate to a variety of neighborhood amenities. A primary
school, bus stop, full-service grocery store, and shopping center are all situated
within one mile of the site. Parks, a pharmacy, and library are within walking
distance. The location is less than a half-mile south of Pioneer High School and
directly across the street from Woodland Community College. The largest
employer, Pacific Coast Producers, is a 10-minute drive away; the other major
employers are all within 45 minutes. Other residents are employed by labor
contractors and may work in Davis, Yuba City, Marysville, Williams, Fairfield, and
Napa, depending on demand.
PROJECT OPERATIONS AND OPERATING BUDGET
The operating budget for Fiscal Year 2018 projects operating income of
$809,438, mostly from resident rent payments at 30% of their income
supplemented by USDA Section 521 Rental Assistance. Anticipated expenses
include contracted services for management, maintenance and repairs, trash
removal, landscaping, security, and pest control, other operating costs, such as
utilities, taxes, and insurance, mortgage interest on a first and second loan, and
a partnership management fee. Although Mutual Housing California has its own
property management affiliate, for this property it chose to hire a company with
more direct experience operating properties funded by USDA. As Phase II is built
out, the expectation is that additional economies of scale will be achieved in
administrative services.
A unique feature of the operating budget of Mutual Housing at Spring Lake is a
resident organizing fee ($45,457), which is figured into the development’s overall
financing plan. It supports resident organizers who work to build leadership and
empower tenants consistent with the more resident-intensive model that is
mutual housing.
Mutual Housing at Spring Lake: FY 2018 Operating Budget
Revenue
Rent Income $792,738
Laundry Income $14,400
Other Income $2,300
Total Revenue $809,438
Expenses
Management/General $175,639
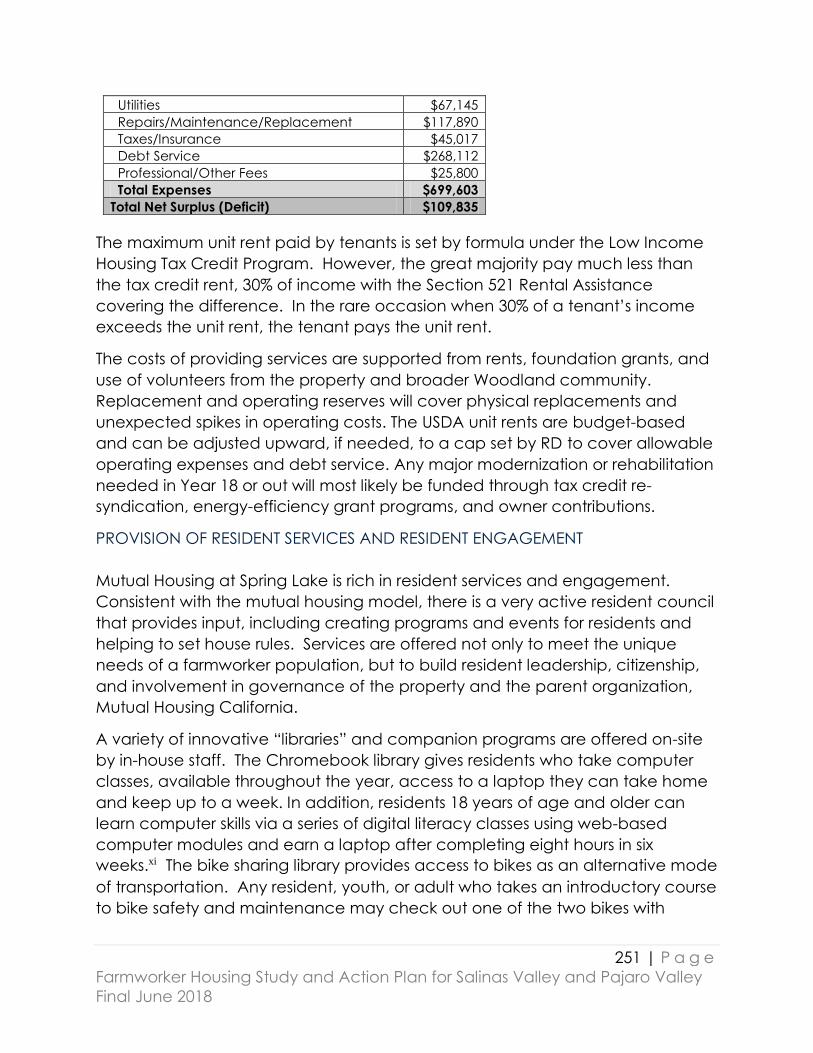
251 | P a g e
Farmworker Housing Study and Action Plan for Salinas Valley and Pajaro Valley
Final June 2018
Utilities $67,145
Repairs/Maintenance/Replacement $117,890
Taxes/Insurance $45,017
Debt Service $268,112
Professional/Other Fees $25,800
Total Expenses $699,603
Total Net Surplus (Deficit) $109,835
The maximum unit rent paid by tenants is set by formula under the Low Income
Housing Tax Credit Program. However, the great majority pay much less than
the tax credit rent, 30% of income with the Section 521 Rental Assistance
covering the difference. In the rare occasion when 30% of a tenant’s income
exceeds the unit rent, the tenant pays the unit rent.
The costs of providing services are supported from rents, foundation grants, and
use of volunteers from the property and broader Woodland community.
Replacement and operating reserves will cover physical replacements and
unexpected spikes in operating costs. The USDA unit rents are budget-based
and can be adjusted upward, if needed, to a cap set by RD to cover allowable
operating expenses and debt service. Any major modernization or rehabilitation
needed in Year 18 or out will most likely be funded through tax credit re-
syndication, energy-efficiency grant programs, and owner contributions.
PROVISION OF RESIDENT SERVICES AND RESIDENT ENGAGEMENT
Mutual Housing at Spring Lake is rich in resident services and engagement.
Consistent with the mutual housing model, there is a very active resident council
that provides input, including creating programs and events for residents and
helping to set house rules. Services are offered not only to meet the unique
needs of a farmworker population, but to build resident leadership, citizenship,
and involvement in governance of the property and the parent organization,
Mutual Housing California.
A variety of innovative “libraries” and companion programs are offered on-site
by in-house staff. The Chromebook library gives residents who take computer
classes, available throughout the year, access to a laptop they can take home
and keep up to a week. In addition, residents 18 years of age and older can
learn computer skills via a series of digital literacy classes using web-based
computer modules and earn a laptop after completing eight hours in six
weeks.xi The bike sharing library provides access to bikes as an alternative mode
of transportation. Any resident, youth, or adult who takes an introductory course
to bike safety and maintenance may check out one of the two bikes with

252 | P a g e
Farmworker Housing Study and Action Plan for Salinas Valley and Pajaro Valley
Final June 2018
helmets (?) on hand. The bike safety and maintenance course is conducted on
a one-on-one basis.
Other on-site program services offered by in-house staff and off-site
organizations include:
Martial Arts – Through a staff volunteer, martial arts classes are conducted
three times a week and all residents are invited to attend these classes.
Parents and youth learn the basics of martial arts and exercise. The class
ranges between 10-15 attendees.
Green Leaders – The Green Leaders Program operates year-round and is
conducted by an AmeriCorps VISTA. It helps 3-4 residents each year
increase awareness of green-related practices, such as recycling, energy-
saving tips, and chemical-free, natural cleaning supplies, and train their
neighbors.
Lending Circles – In partnership with Mission Asset Fund, lending circles
have been created to provide short-term, small loans and help build
credit. The program targets residents 18 years of age and older, can last
anywhere from 6-12 months, and has had 14 participants.
Emergency Food – The Emergency Food Assistance Program is run by the
Yolo Food Bank. Canned goods and fresh vegetables and fruits are
dropped off once a month and residents pick up their portion. About 25
households use the service monthly and two resident volunteers help with
distribution.
At Woodland Community College, residents can participate in the High
School Equivalency Program (HEP) offered by Sacramento State
University. Classes are three times a week and last about seven months.
Three residents from Mutual Housing at Spring Lake have already
graduated and received their high school equivalency certificate from
this program and four other residents have just started the program. The
program is specifically for agricultural families and funded through USDA.
LESSONS LEARNED
1. Mutual Housing at Spring Lake is testimony to how a comprehensive strategy of
neighborhood and citizen outreach and engagement, conducted intentionally and
proactively at the earliest stages, can help demystify farmworker housing, reduce
opposition, and build acceptance.
2. Mutual Housing at Spring Lake, judging by the international, national, and state
plaudits it has received, demonstrates that affordable housing, including for low-wage
farmworkers, can be a platform for cutting-edge innovation and lead the way in the

253 | P a g e
Farmworker Housing Study and Action Plan for Salinas Valley and Pajaro Valley
Final June 2018
incorporation of energy-efficient, green design and construction to meet California’s
strenuous Zero Net Energy (ZNE) goals for multifamily housing.
3. Operating a ZNE community as it was originally designed is just as important
as the design and development process. Keeping equipment operating
efficiently and continued resident education around electricity consumption
and behavior are key components of a successful ZNE community.
4. While some energy-conscious residents have already realized utility cost
savings, time will tell whether the additional, and often cost-prohibitive, upfront
costs of ZNE design and construction will be offset by resident and property
savings in the aggregate.
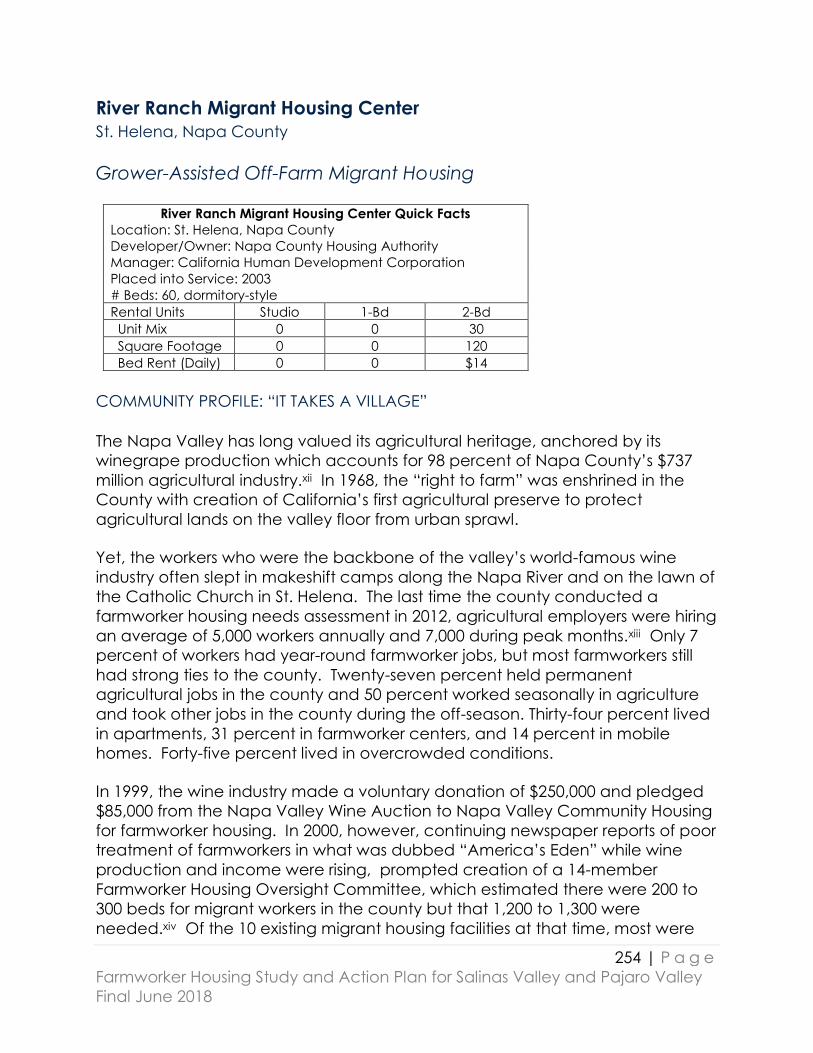
254 | P a g e
Farmworker Housing Study and Action Plan for Salinas Valley and Pajaro Valley
Final June 2018
River Ranch Migrant Housing Center
St. Helena, Napa County
Grower-Assisted Off-Farm Migrant Housing
River Ranch Migrant Housing Center Quick Facts
Location: St. Helena, Napa County
Developer/Owner: Napa County Housing Authority
Manager: California Human Development Corporation
Placed into Service: 2003
# Beds: 60, dormitory-style
Rental Units Studio 1-Bd 2-Bd
Unit Mix 0 0 30
Square Footage 0 0 120
Bed Rent (Daily) 0 0 $14
COMMUNITY PROFILE: “IT TAKES A VILLAGE”
The Napa Valley has long valued its agricultural heritage, anchored by its
winegrape production which accounts for 98 percent of Napa County’s $737
million agricultural industry.xii In 1968, the “right to farm” was enshrined in the
County with creation of California’s first agricultural preserve to protect
agricultural lands on the valley floor from urban sprawl.
Yet, the workers who were the backbone of the valley’s world-famous wine
industry often slept in makeshift camps along the Napa River and on the lawn of
the Catholic Church in St. Helena. The last time the county conducted a
farmworker housing needs assessment in 2012, agricultural employers were hiring
an average of 5,000 workers annually and 7,000 during peak months.xiii Only 7
percent of workers had year-round farmworker jobs, but most farmworkers still
had strong ties to the county. Twenty-seven percent held permanent
agricultural jobs in the county and 50 percent worked seasonally in agriculture
and took other jobs in the county during the off-season. Thirty-four percent lived
in apartments, 31 percent in farmworker centers, and 14 percent in mobile
homes. Forty-five percent lived in overcrowded conditions.
In 1999, the wine industry made a voluntary donation of $250,000 and pledged
$85,000 from the Napa Valley Wine Auction to Napa Valley Community Housing
for farmworker housing. In 2000, however, continuing newspaper reports of poor
treatment of farmworkers in what was dubbed “America’s Eden” while wine
production and income were rising, prompted creation of a 14-member
Farmworker Housing Oversight Committee, which estimated there were 200 to
300 beds for migrant workers in the county but that 1,200 to 1,300 were
needed.xiv Of the 10 existing migrant housing facilities at that time, most were
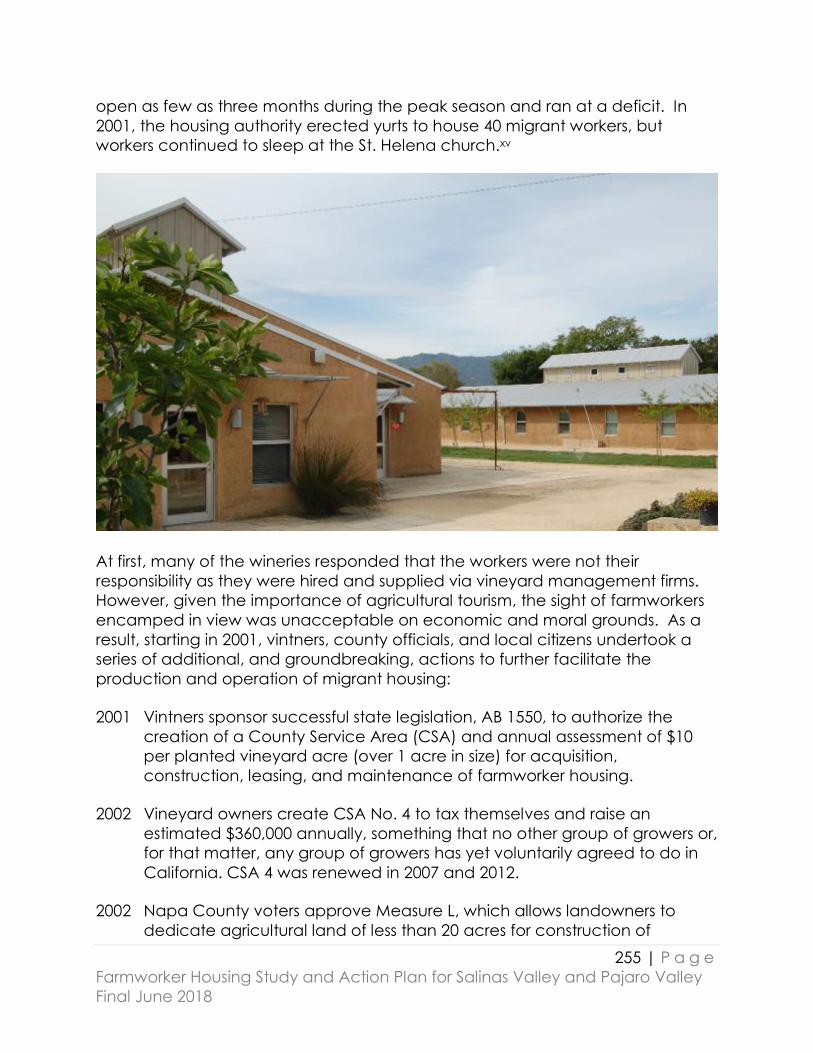
255 | P a g e
Farmworker Housing Study and Action Plan for Salinas Valley and Pajaro Valley
Final June 2018
open as few as three months during the peak season and ran at a deficit. In
2001, the housing authority erected yurts to house 40 migrant workers, but
workers continued to sleep at the St. Helena church.xv
At first, many of the wineries responded that the workers were not their
responsibility as they were hired and supplied via vineyard management firms.
However, given the importance of agricultural tourism, the sight of farmworkers
encamped in view was unacceptable on economic and moral grounds. As a
result, starting in 2001, vintners, county officials, and local citizens undertook a
series of additional, and groundbreaking, actions to further facilitate the
production and operation of migrant housing:
2001 Vintners sponsor successful state legislation, AB 1550, to authorize the
creation of a County Service Area (CSA) and annual assessment of $10
per planted vineyard acre (over 1 acre in size) for acquisition,
construction, leasing, and maintenance of farmworker housing.
2002 Vineyard owners create CSA No. 4 to tax themselves and raise an
estimated $360,000 annually, something that no other group of growers or,
for that matter, any group of growers has yet voluntarily agreed to do in
California. CSA 4 was renewed in 2007 and 2012.
2002 Napa County voters approve Measure L, which allows landowners to
dedicate agricultural land of less than 20 acres for construction of

256 | P a g e
Farmworker Housing Study and Action Plan for Salinas Valley and Pajaro Valley
Final June 2018
temporary farmworker housing and 40 acres for year-round farmworker
housing and authorizes up to five dormitory-style camps to provide
temporary shelter for up to 300 farmworkers.
2003 60-bed River Ranch Migrant housing center opened in St. Helena.
2006 Calistoga and Mondavi Migrant housing centers built in 1950s and 1960s
and later conveyed to the Napa County Housing Authority are
completely refurbished. New dormitory wings added in each center with
30 bedrooms housing two persons each. State funding from Joe Serna,
Jr., Farmworker Housing Grant Program with local matching funds from
County Affordable Housing Trust Fund and CSA No. 4. 120 twin beds
bought by Napa Valley Vintners, a nonprofit trade association.
2011 Napa Valley Farmworker Foundation, the first of its kind in the U.S., is
formed by vintners and agricultural interests to raise funds to support
education and professional development for vineyard workers and their
families (although not used at the centers). Over $3 million raised.
2017 Winegrape producers vote overwhelmingly to extend annual assessment
for another five years and gradually raise the rate from $10 to $15 per
acre in planted grape production.
2017 After failed attempts in 2015 and 2016 to win operating funds in the State
budget, Napa County successfully sponsors AB 317 (Curry) in the State
Legislature to provide a continuous annual earmark of up to $250,000 in
matching funds for the three migrant housing centers from the proceeds
of SB 2, the Building Homes and Jobs Act.xvi
DEVELOPMENT HISTORY
Opened in May 2003, River Ranch Migrant Center was the first center enabled
by and built after the passage of AB 1550 and Measure L. While vintner tax
assessments from AB 1550 would provide ongoing gap funding to cover any
deficits in center operating costs, construction could not start until county voters
modified the county's Agricultural Lands Preservation Initiative and reduced the
minimum acreage allowed for production of farmworker housing on
agriculturally-zoned land. Once that was achieved, vintner Joseph Phelps was
able to donate eight acres for the new facility.
Measure L reduced the minimum acreage requirement to two acres or more
and authorized up to five centers in the county with dormitory-style buildings,

257 | P a g e
Farmworker Housing Study and Action Plan for Salinas Valley and Pajaro Valley
Final June 2018
each capable of housing 60 workers.xvii While there was no organized
opposition and it passed with 71% voter approval, Measure L allows land to
revert to its original agricultural use if the camps close to assuage concerns
about agricultural land preservation.
The 60-bed River Ranch center was built by the Napa County Housing Authority
at a cost of $3.4 million or about $56,700 a bed. Since the center was located in
the unincorporated county with no connections to existing sewer and water
systems, a well and septic system had to be built. Day-to-day management
was sub-contracted to the California Human Development Corporation
(CHDC), which had previously managed the Mondavi and Calistoga migrant
centers. Together they have 180 beds. CHDC management of all three sites
facilitates staggering and synchronization. Currently, each is open 11 months;
when one closes the other two remain open. River Ranch closes at the end of
December and reopens in February.
SOURCES AND USES OF DEVELOPMENT FUNDS
The $3.4 million development cost of River Ranch Migrant Center was borne by
three sources: $1.2 million in Napa County redevelopment tax increments; $1.56
million from the State Joe Serna, Jr., Farmworker Housing Grant Program; and
$645,775 from the Napa Valley Wine Auction. Given the very low incomes of the
prospective residents, the absence of debt financing and dedication of land
made the project financially feasible without the need for payment of debt
service from bed rents.
RESIDENT CHARACTERISTICS
River Ranch operates like a hotel with a lodger fee per bed per night. All
residents are single unaccompanied adults, almost all men. Occasionally, a
father and son or other relative may share a room. Only one year did the
center accommodate women for one night. A small number of women can be
accommodated in a separate wing in three staff apartments with their own
shower and toilet.
To be eligible, residents must present a recent paycheck stub showing that a
substantial portion of income is earned from qualifying agricultural employment.
In practice, however, some residents have not yet begun working or have not
yet been paid when moving in and the lodging agreement grants a 30-day
grace period to provide a stub. In some cases, the pay stub may be from a

258 | P a g e
Farmworker Housing Study and Action Plan for Salinas Valley and Pajaro Valley
Final June 2018
previous employer or labor contractor. Although it reportedly never happens,
failure to present a pay stub after 30 days is legal cause for compelling a lodger
to move out. Among current lodgers, 25 percent have extremely low incomes
(0-30 percent of AMI), 50 percent are very low income (31-50 percent of AMI),
and 25 percent are low income (51-80 percent of AMI).
While it is possible that a lodger’s income from agriculture after initial
occupancy could decline, according to CHDC, the system is self-regulating. The
manager knows the residents intimately and strictly monitors compliance. The
living conditions are spartan enough that lodgers are self-selecting and
motivated to make as much money from agriculture as possible to send home.
Labor contractors only bring in farmworkers. And, even though some of the
men take construction and other kinds of work, the great majority of income is
still from farm labor.
Generally, about 65 percent of lodgers live year-round or most of the year in
Napa County, 30% come from outside of the county, and 5 percent from
outside of the country. Some of those living in the county move to other
centers, like Mondavi and Calistoga, when River Ranch closes in order to stay in
the area until work starts again and they can move back to the center. In other
words, it is possible to spend the entire year in the county moving among the
three centers. In contrast to the State’s Office of Migrant Services centers, there
is no requirement that lodgers be families and live more than 50 miles from the
center. Rarely do workers originate from other states; most are arranged by
farm contractors from other parts of California, like Madera and Fresno Counties.
Even rarer are individuals migrating back and forth from Mexico.
There is no screening for immigration and citizenship as there are no federal
funds involved. However, because of the presence of the State funding, lodgers
cannot be limited just to those working in Napa County vineyards and living
year-round or most of the year in the county.
BUILDING/SITE CHARACTERISTICS AND AMENITIES
The residential quarters of River Ranch are arranged in two wings, 15 rooms per
wing measuring approximately 10 by 12 feet, each room with separate beds
(not bunks) and a small closet space. Each wing has its own shared shower and
bathrooms. There are no kitchenettes in the room, but instead a commercial
kitchen and dining room where lodgers receive three meals. There are also staff
living quarters. In addition to communal dining facilities, the center offers a
multi-purpose room, laundry, storage space, a mini-library, and literacy
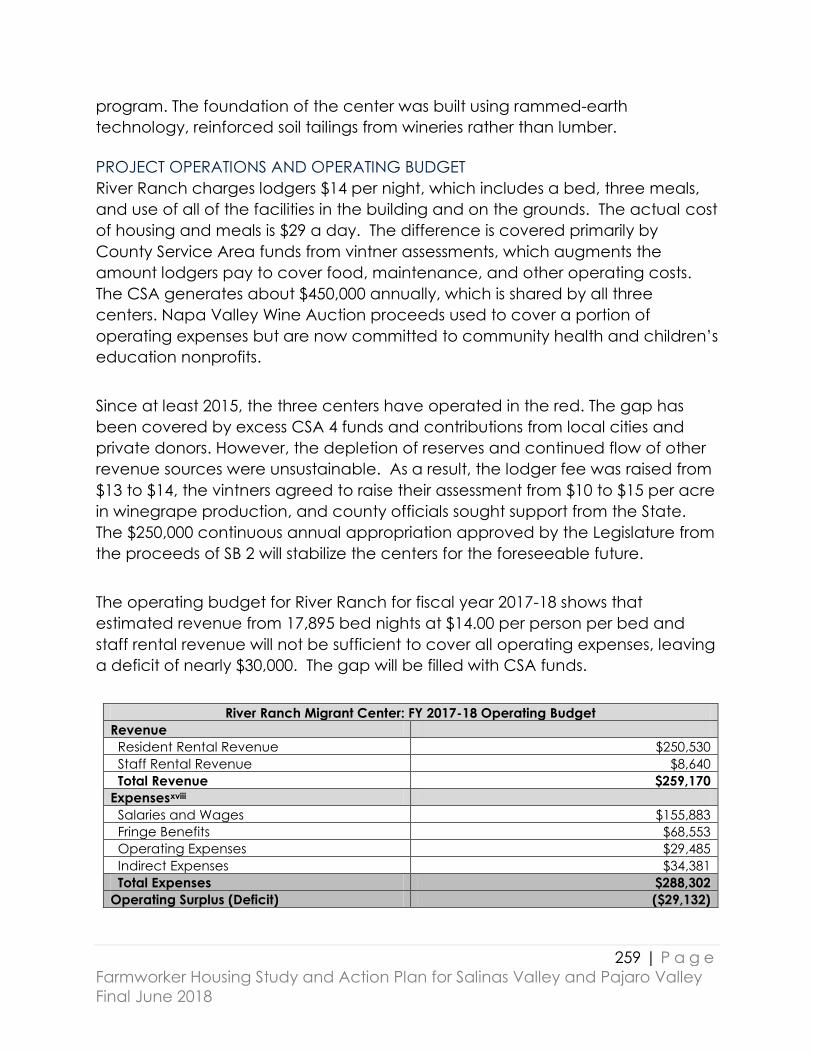
259 | P a g e
Farmworker Housing Study and Action Plan for Salinas Valley and Pajaro Valley
Final June 2018
program. The foundation of the center was built using rammed-earth
technology, reinforced soil tailings from wineries rather than lumber.
PROJECT OPERATIONS AND OPERATING BUDGET
River Ranch charges lodgers $14 per night, which includes a bed, three meals,
and use of all of the facilities in the building and on the grounds. The actual cost
of housing and meals is $29 a day. The difference is covered primarily by
County Service Area funds from vintner assessments, which augments the
amount lodgers pay to cover food, maintenance, and other operating costs.
The CSA generates about $450,000 annually, which is shared by all three
centers. Napa Valley Wine Auction proceeds used to cover a portion of
operating expenses but are now committed to community health and children’s
education nonprofits.
Since at least 2015, the three centers have operated in the red. The gap has
been covered by excess CSA 4 funds and contributions from local cities and
private donors. However, the depletion of reserves and continued flow of other
revenue sources were unsustainable. As a result, the lodger fee was raised from
$13 to $14, the vintners agreed to raise their assessment from $10 to $15 per acre
in winegrape production, and county officials sought support from the State.
The $250,000 continuous annual appropriation approved by the Legislature from
the proceeds of SB 2 will stabilize the centers for the foreseeable future.
The operating budget for River Ranch for fiscal year 2017-18 shows that
estimated revenue from 17,895 bed nights at $14.00 per person per bed and
staff rental revenue will not be sufficient to cover all operating expenses, leaving
a deficit of nearly $30,000. The gap will be filled with CSA funds.
River Ranch Migrant Center: FY 2017-18 Operating Budget
Revenue
Resident Rental Revenue $250,530
Staff Rental Revenue $8,640
Total Revenue $259,170
Expensesxviii
Salaries and Wages $155,883
Fringe Benefits $68,553
Operating Expenses $29,485
Indirect Expenses $34,381
Total Expenses $288,302
Operating Surplus (Deficit) ($29,132)
260 | P a g e
Farmworker Housing Study and Action Plan for Salinas Valley and Pajaro Valley
Final June 2018
Contracting the management of all three county migrant centers to the Santa
Rosa-based CHDC enables the County to achieve significant economies of
scale and cost savings. The Napa County Housing Authority’s administrative
overhead costs would be too high to operate the centers and provide
competitive lodging fees within the payment ability of farmworkers. Its labor
costs, including employee pensions and other benefits, for management,
maintenance, and cooks are much more expensive than CHDC’s. Moreover,
CHDC can consolidate regional property management supervision, fiscal
management, maintenance, and acquisition of food, equipment, and supplies
under one roof and deploy staff and resources to all three centers more
efficiently than if each center was run separately. One full-time resident
manager and a part-time maintenance person are deployed to River Ranch.
Since the Great Recession, when so many homes that rented out garages and
sheds in backyards for living space went into foreclosure, the farmworker centers
have realized increased occupancy and maintained that ever since (averaging
96% occupancy over the course of the year). In 2017, there was a serious labor
shortage. After the end of the harvest, some lodgers leave chasing other work
or go home, thereby reducing the number of lodgers sometimes to as low as
40.xix When they reopen in February, the center begins to fill up. The centers
help to stabilize the labor force by keeping employees in place during the dead
months. By-products of the labor shortage are that workers are receiving higher
wages and growers are keeping workers on payrolls longer to perform
restoration work from the October 2017 fires, weeding, and general clean-up so
they will be around at the beginning of the new year.
PROVISION OF RESIDENT SERVICES AND RESIDENT ENGAGEMENT
CDHC provides limited social services. The residents are overwhelmingly mono-
lingual Spanish-speakers. Services include literacy programs and English-as-a-
Second-Language. These are funded primarily by donations from the Napa
Valley Farmworker Committee. The Committee consists of business
representatives, vintners, farmworker advocates, religious leaders, and others. It
oversees the annual Cinco de Mayo golf tournament, which generates about
$50,000, and writes small grant proposals to fund services and operations.xx
CHDC also operates a vocational training program for day laborers in St. Helena
open to lodgers. While job sites and some shopping are located within a 10-
minute drive, most other services, such as health care, transit, and a full-service
grocery store are 30 minutes or more away. There is no organized residents’
council, but lodgers give direct input to the site manager and a tenant position

261 | P a g e
Farmworker Housing Study and Action Plan for Salinas Valley and Pajaro Valley
Final June 2018
exists on the Napa Valley Housing Commission, an advisory body to the Housing
Authority.
LESSONS LEARNED
1. While Napa County has not solved its migrant housing problem, the initiative
of local vintners, together with county and city officials, business and religious
leaders, and farmworker advocates exemplifies what can be achieved
when all parties pull together to meet migrant housing needs.
2. Even with a land dedication and no debt financing, the margin for operating
off-farm migrant housing can be quite small given the low incomes and
seasonality of migrant work. One thing to consider is whether or not to offer
food service, which is expensive and a cost that is difficult to control,
especially if other high-quality, reasonably-priced food service is located
nearby.
3. Creation of a taxing district buoyed by a modest fee per cultivated acre, or
some other form of grower self-assessment, can be the critical piece of
funding that enables migrant housing centers to operate in the black. Funds
raised can also leverage government and private contributions for the
development and replacement costs of migrant housing.
4. Although the employment verification process used in River Ranch and the
other Napa County centers appears to be working, operators of off-farm
migrant housing may wish to impose more frequent screening when there
are farm labor shortages and scarcity of other housing options.
5. Off-farm migrant housing using the River Ranch model has certain
operational advantages over other models. Unlike on-farm, grower-owned
migrant housing, off-farm migrant housing owned by public and private
nonprofit agencies is eligible for government grants and charitable donations
and meets the needs of multiple growers. Unlike the State OMS centers,
there is no requirement that lodgers be families and live beyond 50 miles from
the center.
6. Retaining a mission-driven, nonprofit organization like CHDC with a
commitment to farmworkers to run multiple migrant centers can result in cost
savings and efficiencies.

262 | P a g e
Farmworker Housing Study and Action Plan for Salinas Valley and Pajaro Valley
Final June 2018
Evaluation of alternative housing types
In sections above we have discussed the housing needs and conditions of the
farmworker population in the Pajaro/Salinas Valley laborshed, farmworker
housing best practices around California, and funding resources that could be
mobilized to build, rehabilitate, and acquire housing for farmworkers. In this
section, we explore alternative and non-conventional housing prototypes,
tenure types, and funding sources used in California and other states to
intentionally house farmworkers or to house low-income people with potential
benefits for the farmworker population.
Tiny Houses
Housing providers are exploring innovative ways to provide affordable housing
for farmworkers that include RVs and tent camps. In counties where land is
expensive tiny houses may be one of a suite of solutions. However the houses
must be part of a community development that provides resources and
amenities.
Challenges
Where land is expensive or not readily available, second unit ordinances have
been proven to assist in the development of affordable housing alternatives.
Because loans for tiny houses are a barrier to their development as individual
units, being second units makes them easier to finance.
Where this is not a choice, tiny house communities can be built clustered in a
similar way growers use mobile homes. Permitting for tiny homes is not
standardized and the definition of what is a minimum habitable structure is
inconsistent. In housing policy, there is no definition suitable for tiny homes.
Tiny Houses as Farmworker Housing Solution
HAWAII
The state of Hawaii is considering legislation that will have an impact on tiny
houses. Two bills are being touted as providing a way to deliver affordable
housing, more food production, and lower transportation costs while creating
safer housing alternatives on agricultural land. Legislation has been introduced
by Rep. Cindy Evans that would allow for “tiny homes” — houses that are less
than 500 square feet — to be built on agriculturally-zoned land for farmworkers.
263 | P a g e
Farmworker Housing Study and Action Plan for Salinas Valley and Pajaro Valley
Final June 2018
House Bill 2 112 is specific to Hawaii Island. A second bill, House Bill 1373 113, would
authorize counties to provide zoning exemptions for tiny houses. In July 2017,
although passed through the state legislature, HB2 was vetoed by the governor.
HB1373 is still in the legislature after introduction and amendment, no vote has
been taken.
NORTH CAROLINA
There is currently a Tiny Home Project on a North Carolina farm, Wildwoods Farm 114. It is in the development stages but elements of the project include:
Sites for tiny homes on farm
Open to farmworkers or apprentices
$250 lot rental
$45 for shared water, electric and sewer
o Reduced cost for self-contained solar units
TEXAS
Based in Austin, TX, Mobile Loaves and Fishes has been working on a tiny house
village called Community First. This year Community First should be at capacity
with housing for more than 200 residents. There are retrofitted RVs, tiny houses
and canvas-sided cottages available that serve primarily as bedrooms. The
residents share everything else in the community including modern communal
kitchens, laundry and bathroom facilities. There is a dog park on site. Other
amenities include onsite volunteer nurses, a market garden, chickens, goats, a
fish farm and an art gallery. There is an outdoor movie theater and an income-
generating bed and breakfast. The community cost $14.5 million to develop and
was privately funded. About half of the homes were paid for through a home
sponsorship program by individual donors (Brooks, 2016).
BRITISH COLUMBIA
In Canada, micro-home communities, as they are called, are receiving national
attention and several successful ones have been built.
Bluegrass Meadows Micro Village was created as a cluster of small houses with
shared community spaces for laundry and dining. At Bluegrass Meadows, a 320-
square-foot home might have a kitchen/living space, a loft for overnight guests
and a bedroom adequate for a queen size bed. Thirty tiny homes were built in
112 https://legiscan.com/HI/text/HB2/2017 113 https://legiscan.com/HI/bill/HB1373/2017 114 http://wildwoodsfarmnc.com/tiny-house-village/

264 | P a g e
Farmworker Housing Study and Action Plan for Salinas Valley and Pajaro Valley
Final June 2018
Bluegrass Meadows between in 2016. They range in size from 250-500 square
feet. The homes are affordable, with list prices at approximately $46,000
Canadian (Haynes, 2016).
Another micro-home development in BC is proposing a tiny house co-op that
will include a five-acre farm. Several other BC municipalities are exploring the
option of micro-home communities but they still face barriers to development
due to uneven regulations and bureaucracy.
URBAN CALIFORNIA
Berkeley
UC Berkeley students are building a house for $25,000. The project is called
THIMBY for Tiny House in My Backyard. The design for the house is energy
efficient with solar panels and a storage battery, gray water recycling and a
unique toilet. The living space includes a loft bed with space below for cooking,
working and showering and comfortably fits one or two residents. The space
footprint is equal to two
parking spaces, end to end.
THIMBY is being built at UC
Richmond Field Station for a
tiny house competition held
by the Sacramento MUD. The
goal is to build a showcase of
efficient design at a low cost.
THIMBY is built on wheels and
is easily moved. One of the
benefits described by the
THIMBY team is the ability to
quickly make an affordable
living space for a burgeoning
population without forcing
out existing residents (Hall,
2016).
One of the barriers to success
of tiny house communities in
California is that, as far as the
State is concerned, these
City of Santa Cruz
Accessory Dwelling Unit (ADU)
Development Program “The City of Santa Cruz's ADU Development
program provides opportunities for additional
affordable rental housing, while providing
homeowners a chance to supplement mortgage
payments. The program has received recognition
nationwide and is the recipient of awards
including League of California Cities 2004 Helen
Putnam Award for Excellence and the
Environmental Protection Agency 2004 National
Award for Smart Growth Achievement Policies
and Regulations. The program works implement
the development of well-designed ADUs while
helping to minimize the impact of population
growth on the community by providing more
rental housing in the developed core and
promoting infill development and sustainable
land-use patterns. Through the ADU Development
Program, the City of Santa Cruz offers technical
and financial assistance including an ADU manual
detailing the development process, relevant
zoning, design standards, building codes and
showcases of ADU prototype designs."

265 | P a g e
Farmworker Housing Study and Action Plan for Salinas Valley and Pajaro Valley
Final June 2018
structures are not explicitly legal. Legislation on these structures has not kept up
with reality.
Fresno
Defining a tiny house is the first step to making tiny houses legal residences. Tiny
houses are easy to build but not as easy to site or permit since they cross over
into various categories in traditional housing. In November 2015, Fresno became
the first city in the US to include “tiny houses on wheels” in the building code. As
the entire development code was being updated a section on backyard
cottages was written to include tiny houses as long as they meet all of the
requirements laid out.
The requirements are a bit unusual because they equate tiny houses to RVs and
require a CA DMV license. Thus in Fresno housing code, tiny houses must be
towable but they can’t move on their own power. They need to be highway
legal while looking like conventional houses. The size must be greater than 100
square feet of living space including cooking, sleeping and toilet facilities. These
regulations are a step forward in defining tiny houses and allowing small
structures to be lived-in within a single family home neighborhood. Other
California counties are using the Fresno law as a template for moving forward in
the recognition of tiny houses.
The State of California has adopted building codes from the International Code
Council that reduced the required size for a habitable room from 120 square
feet to 70 square feet. These codes went into effect in January 2017 and are
seen as another step forward in the acceptance of tiny houses.
Other Alternatives for Farmworkers
California Human Development—Mobile Housing
California Human Development (CHD) is a non-profit organization located in
Santa Rosa, CA. It works with community members in Northern California
counties to fight poverty. One way the organization has chosen to do this is
through the development of farmworker housing.
CHD has two farmworker housing projects in development: a mobile housing
initiative and an apartment complex built from prefab units. (The second is
discussed in the case studies section of this report.)
266 | P a g e
Farmworker Housing Study and Action Plan for Salinas Valley and Pajaro Valley
Final June 2018
FARMWORKER MOBILE HOUSING
CHD is working to create a group of 10 recreational vehicles (RV) that travel
together following the migrant stream in Northern California. These RVs will move
along with workers in Sonoma, Lake, San Joaquin and the Northern Sacramento
Valley. They will set up camp during peak harvest on growers’ properties or in
public RV parks nearby to provide housing for up to six workers in each RV. This
set of 10 RVs would be a pilot project and more would be added as needed.
CHD believes that in creating this alternative housing, they will be able to
provide a safe, clean place for workers to sleep, shower and cook meals.
Washington Growers League – Tents for Cherry Harvesters
The tents provided through this initiative were developed to specific guidelines
and approved by the Washington State Department of Community Trade and
Economic Development under two specific Washington State codes.115
Approved tents are only allowed for cherry harvesters and their accompanying
family members. Employers hiring H-2A workers for this task are prohibited from
using tents to house workers brought in by the H-2A Program.116 Tents are not
approved for housing workers of any other crops and can only be used for
cherry harvest workers for up to one week before through one week after the
cherry harvest, which is typically about six weeks.
Tents are approximately 14' x 24' and are provided with seven folding cots each.
The cost per tent with cots is $12 per night, including delivery, set-up and
removal. Once a grower has established a facility and is ready to rent tents, the
grower must sign a rental contract with the Washington Growers League.
WGL, at a time agreed with the grower, delivers and sets up the tents and
folding cots tent pads. The growers provide these cement tent pads as well as
central eating, bathing, and toilet facilities. At the end of the season, WGL
cleans and sanitizes the tents and cots and removes them for storage until the
following season.
The grower is responsible for maintaining the tents while they are in use.
“The use of approved tents evolved from a multi-agency and organization effort
to address the unique challenges of housing cherry harvest workers. The effort
115 alternative structures (WAC 246-359-600), and Temporary Worker Housing Construction Standard
(Chapter 246-359 WAC).
116 RCW 70.114A.110(2).
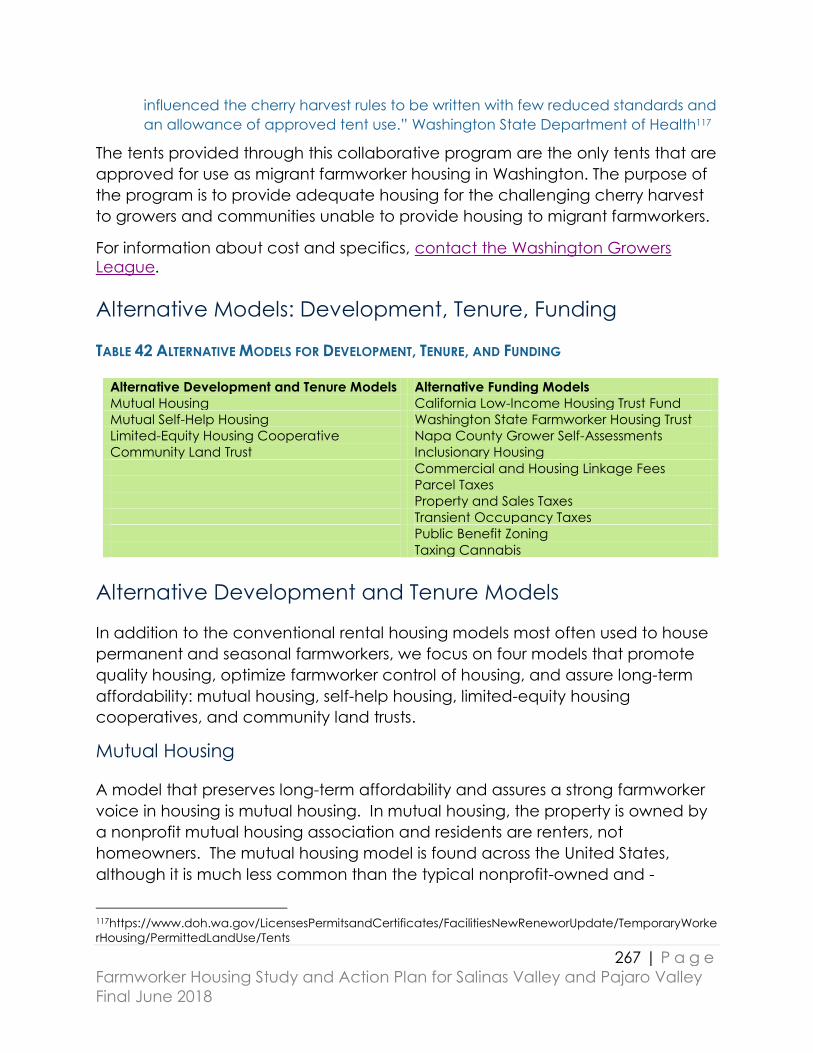
267 | P a g e
Farmworker Housing Study and Action Plan for Salinas Valley and Pajaro Valley
Final June 2018
influenced the cherry harvest rules to be written with few reduced standards and
an allowance of approved tent use.” Washington State Department of Health117
The tents provided through this collaborative program are the only tents that are
approved for use as migrant farmworker housing in Washington. The purpose of
the program is to provide adequate housing for the challenging cherry harvest
to growers and communities unable to provide housing to migrant farmworkers.
For information about cost and specifics, contact the Washington Growers League.
Alternative Models: Development, Tenure, Funding
TABLE 42 ALTERNATIVE MODELS FOR DEVELOPMENT, TENURE, AND FUNDING
Alternative Development and Tenure Models Alternative Funding Models
Mutual Housing California Low-Income Housing Trust Fund
Mutual Self-Help Housing Washington State Farmworker Housing Trust
Limited-Equity Housing Cooperative Napa County Grower Self-Assessments
Community Land Trust Inclusionary Housing
Commercial and Housing Linkage Fees
Parcel Taxes
Property and Sales Taxes
Transient Occupancy Taxes
Public Benefit Zoning
Taxing Cannabis
Alternative Development and Tenure Models
In addition to the conventional rental housing models most often used to house
permanent and seasonal farmworkers, we focus on four models that promote
quality housing, optimize farmworker control of housing, and assure long-term
affordability: mutual housing, self-help housing, limited-equity housing
cooperatives, and community land trusts.
Mutual Housing
A model that preserves long-term affordability and assures a strong farmworker
voice in housing is mutual housing. In mutual housing, the property is owned by
a nonprofit mutual housing association and residents are renters, not
homeowners. The mutual housing model is found across the United States,
although it is much less common than the typical nonprofit-owned and -
117https://www.doh.wa.gov/LicensesPermitsandCertificates/FacilitiesNewReneworUpdate/TemporaryWorke
rHousing/PermittedLandUse/Tents

268 | P a g e
Farmworker Housing Study and Action Plan for Salinas Valley and Pajaro Valley
Final June 2018
operated rental housing solution for lower-income households. The difference is
in the level of resident involvement in governance of the organization and
control over day-to-day operations of each property, as well as the intense
focus on resident empowerment and leadership development.
In this model of affordable rental housing, at least 51 percent of the board of
directors of the mutual housing association 118 is composed of current, past, and
future residents of the association’s individual mutual housing properties or
communities. Residents also play a major role in governance of their homes
through participation in property-specific resident councils. In cases where
some or all of the properties or units are occupationally-restricted to
farmworkers, or incidentally occupied by farmworkers, farmworkers could serve
in a governing role.
Mutual Housing California located in Sacramento is the best example of a
mutual housing association in the state that also provides farmworker housing.
Residents take a key role in overseeing their properties and developing
programs through site-specific resident councils. These councils, working
together with management, develop house rules, review financial reports, plan
and evaluate resident activities, attract outside organizations to host on-site
programs, orient new residents, and educate to prevent infractions of rules.
Councils and issue-specific site committees provide leadership in the
identification of resident and community needs and in raising resources to fill
those needs. These include youth development programs, education and
economic development resources, safety and security programs, and
recreational facilities.
Mutual Housing California’s team of community organizers provides leadership
development support to resident leaders who are active in increasing the
participation of other residents. Their social work team, under the direction of an
MSW professional, identifies service programs to support vulnerable individuals.
They do this by conducting regular one-on-one meetings with residents to learn
their stories, their challenges, and their strengths and talents. The job of the
organizers is to help residents recognize and actively use their own assets to
improve their own lives, life within their mutual housing community, and life in
their greater neighborhood and society.
118 The parent nonprofit that developed the property and has a continuing ownership
interest and day-to-day operational responsibility.

269 | P a g e
Farmworker Housing Study and Action Plan for Salinas Valley and Pajaro Valley
Final June 2018
Mutual Housing at Spring Lake in Woodland, completed in 2015, exemplifies the
mutual housing model and its utility for farmworkers (see Case Study). Sixty-one
of the 62 units are occupationally-restricted to farmworkers. It is the first certified
zero net energy rental property for any population in the U.S. There is a very
active residents’ council that is involved in creating programs and events for
residents and helping to set house rules. Programs include a Green Leaders
Program to help residents adopt green-related practices and train their
neighbors; martial arts and exercise classes; lending circles to provide short-term
small loans and build credit; ‘libraries’ where residents can borrow laptops and
bikes while learning computer skills and bike safety and maintenance; and high
school equivalency courses at a nearby community college.
Mutual Self-Help Housing
Originated by the American Friends Service Committee in the Tulare County
community of Goshen in 1964 to provide affordable homeownership for
farmworkers, the mutual self-help housing model has helped more than 20,000
very low-income families become homeowners in rural and small towns
throughout California. At the national level, more than 50,000 self-help homes
have been built.
Mutual self-help housing allows groups of typically 10 to 12 families working
together for the better part of a year to build each other’s homes with
construction supervision provided by a nonprofit housing organization.
Generally, families commit about 40 hours per week of family labor in the
evenings, weekends, and non-work days. The self-help or ‘sweat-equity’
component of the labor can reduce the cost of a single-family home by 10-25
percent.
In qualified rural communities, the USDA Section 502 Direct Loan Program can
be used to help cover the construction costs of the home. Upon completion,
the loan is converted to a permanent mortgage with interest rates as low as one
percent and amortization up to 38 years. The dollar value of the family’s sweat
equity serves in lieu of a down payment on the loan. In many cases, families
pay less to own their new home than they paid to rent their previous home.
While the Section 502 Direct Loan Program is not occupationally-restricted to
farmworkers, Self-Help Enterprises in Visalia and Coachella Valley Housing
Coalition in Indio used the Section 502 Direct Loan Program in a mutual self-help
housing subdivision together with the Joe Serna, Jr., Farmworker Housing
Program to produce occupationally-restricted homes for farmworkers. The
additional Serna grant, along with other funding, helped reduce the cost of
270 | P a g e
Farmworker Housing Study and Action Plan for Salinas Valley and Pajaro Valley
Final June 2018
owning to a level that could be afforded by extremely low-income farmworkers
with incomes at or below 30 percent of Area Median Income.119
A key element of the mutual self-help housing model is the grant support for a
nonprofit housing organization to recruit and train owner-builders and manage
the construction process. In USDA-eligible rural areas, organizations may be
awarded a Section 521 Self-Help Housing Technical Assistance Grant to pay the
cost of a construction supervisor and other staff. The California Self-Help Housing
Program, which is now subsumed within the CalHome Program, was created to
provide an additional resource for construction supervision, especially in
communities not eligible for USDA assistance, also known as ‘urban self-help’.
CalHome funds can also be used for site acquisition, site development, and
predevelopment costs associated with a mutual self-help housing program (see
section on Funding Resources).
Limited-Equity Housing Cooperative
A limited-equity housing cooperative designated for farmworkers is a
democratically- controlled homeownership model that restricts the appreciation
rate of the units and preserves affordability. Members of the cooperative own a
share in a cooperative corporation, rather than owning their unit outright.
Generally, they pay an amount up front to become a member of the
cooperative and gain occupancy rights and a monthly carrying charge
representing their pro rata share of the interest and principal on a ‘blanket’
mortgage, if the project was debt-financed, and other operating costs.
Under California law, the value of membership shares in a limited-equity housing
cooperative can increase no more than 10 percent per year. Members can
also receive credit for board-approved capital improvements to their unit.
Upon departure from the cooperative, residents may take a limited equity pay-
out which is typically tied to an index, like the Consumer Price Index, and is
much less than the maximum 10 percent – closer to 3 percent -- to ensure that a
successor low-income occupant can afford to buy into the cooperative.
Depending on the cooperative, the unit shares will either be sold back to the
cooperative, which will then sell them to a new cooperator, or be sold directly
by the current occupant to a new occupant with the cooperative’s approval.
119 Cabrillo Economic Development Corporation in Ventura was able to achieve
homeownership for higher-income farmworkers without the self-help component using a USDA
Section 514 loan with Serna funds to produce contractor-built, multifamily townhouses for
purchase in a development that also includes occupationally-restricted rental units.
271 | P a g e
Farmworker Housing Study and Action Plan for Salinas Valley and Pajaro Valley
Final June 2018
The advantage of a limited-equity cooperative for a farmworker is that the entry
costs and ongoing occupancy costs will usually be much less than acquiring
and maintaining a fee-simple multi-family or single-family home. For a low-wage
farmworker, this may be the only way to become an owner in California and
gain some of the rights of owning. Rights in common with fee-simple ownership
include the deductibility of mortgage interest and property tax payments,
equity recapture upon sale, and the possibility of modifying the unit. The main
difference is that residents are limited in terms of sale or transfer of the unit and
do not have unfettered access to 100 percent of the equity from market
appreciation.
A research report by Bandy and Wiener in 2002 included case studies of four of
the state’s 11 farmworker cooperatives and concluded that the cooperative
model can be a viable and effective way to address farmworker housing
needs.120 All four were in Monterey County. A subsequent report by Bandy in
2004 identified training needs and recommendations for providing ongoing,
back-up support for those cooperatives.121 The absence of an umbrella
organization, like a mutual housing association, to deliver comprehensive and
continuing technical assistance to farmworker cooperators on governance,
property management, leadership development, and cooperative principles
has been a major drawback for farmworker cooperatives in California.
The Monterey Bay Area has been a laboratory for limited-equity farmworker
housing cooperatives for 40 years. The first cooperative in California and first
financed by USDA in the U.S. was San Jerardo just outside of Salinas, which was
completed in 1979 and inspired five other cooperatives in the county. It was
developed by the Central Coast Counties Community Development
Corporation (CCCDC). The project involved relocation of farmworkers from a
sold labor camp, acquisition and rehabilitation of another labor camp, and
reconstruction of 60 units with financing from the USDA Section 515 Rural Rental
Housing Program, Joe Serna, Jr., Farmworker Housing Grant Program, and USDA
rental assistance. The Santa Elena Cooperative was a 100-space mobilehome
park in Soledad purchased and rehabilitated by farmworkers in 1980. Other
farmworker cooperatives were new construction projects, such as the 40-unit La
120 See California’s Farmworker Housing Cooperatives: Lessons on Farmworker Ownership and
Management, California Coalition for Rural Housing for the University of California Center for
Cooperatives, October 2002. 121 See Farmworker Cooperative Housing: Training Needs Assessment, California Coalition for
Rural Housing for the University of California Center for Cooperatives, September 2004.

272 | P a g e
Farmworker Housing Study and Action Plan for Salinas Valley and Pajaro Valley
Final June 2018
Buena Esperanza in King City (1982) and 75-unit Las Casas de Madera (1982) in
Salinas.
Community Land Trust
A community land trust (CLT) is a nonprofit organization that acquires property
and retains it for community purposes in perpetuity. CLTs can be used for many
types of development (including agriculture, commercial, and retail), but for
residential projects are primarily used to ensure long-term housing affordability
by owning the land on which the housing is built for non-market use and leasing
it to residents. The CLT model was first pioneered by the Institute for Community
Economics in the 1960s as a way to rehouse African American sharecroppers in
the South displaced from farms because of mechanization. There are now over
200 CLTs throughout the US, the majority in small towns and rural areas. It is
considered to be one of the best models for developing permanently
affordable homeownership opportunities in regions of escalating land prices
(Greenstein, 2005).
The land trust model could work well for farmworker housing specifically in Santa
Cruz and Monterey Counties where property values are escalating rapidly and
there is a history of environmental land trusts and housing cooperatives. The
Monterey county Agricultural Land Trust (MCALT) was founded in 1984 and to
date, landowners have partnered to protect more than 25,000 acres of
productive agricultural land. The Land Trust of Santa Cruz County (LTSCC) was
established in 1978 and has preserved 14,000 acres. Its mission is to work
collaboratively with landowners, resource agencies, and conservation
organizations to preserve wetland habitats, ranches, and prime agricultural
lands in the Pajaro Valley.
A CLT can be used in conjunction with a limited-equity cooperative, mutual
housing, or other housing models. It is also possible for a CLT to facilitate a
dedicated use of agricultural land for farmworker housing. This model of
creating an easement on agricultural land would assure proximity of workers to
agriculture, separate the land and housing decision-making from both the
farmer and the farmworker, and create an enduring source of farmworker
housing. Local farmworker housing advocates may wish to explore with MCALT
and LTSCC whether this would be possible within the scope of their existing legal
documents or require amendments or a new organization.
Farm employers can participate in this model by donating or selling land at a
reduced price to a CLT or making a cash donation. The CLT would preserve the
affordability of the homes developed on this land in perpetuity. Preferences
273 | P a g e
Farmworker Housing Study and Action Plan for Salinas Valley and Pajaro Valley
Final June 2018
could be made for that employer’s workers in some or all of the units, provided
that there is no public subsidy that precludes such preferences and there is no
violation of fair housing rules. Ideally, there would be funding to offset the losses
to the owner. For example, agricultural land trusts may levy fees on developers
to set aside in a fund to purchase development rights from growers with a goal
of maintaining land in production. The same funding mechanism could be used
for a CLT for farmworker housing.
This unique type of CLT places natural resources in a Commons122 with a charter
based on principles of sustainable stewardship and use. The land is held in trust
by a democratically-governed, regionally-based, open-membership, nonprofit
corporation. Through an inheritable and renewable long-term lease, CLTs take
land out of the speculative market and enable multiple uses such as affordable
housing, agriculture, recreation, and open space.
The CLT can act as the developer of the land or lease land to a developer to
build single-family or multi-family homes for purchase, or in some cases for rent,
by lower-income households. When the unit is owned, the CLT retains an option
to purchase any improvements based on a formula in the land lease that allows
the current owner some equity while preserving affordability for the next owner.
The way resale agreements are structured on the buildings guarantees that the
land value of the site is never included in future sales and the land can never be
alienated from the CLT.
Action Plan from Oversight Committee – Housing Types Objective: Promote alternative farmworker housing tenure and development prototypes
that have worked in Monterey Bay Region, California, and other parts of the nation.
H1. Family Housing Priority: Prioritize the construction of permanent, year-round
housing for farmworker families.
H2. Intergenerational: Facilitate the development of intergenerational farmworker
housing for multiple generations of farmworkers (retirees, working adults, and
children) to create opportunities for mutual self-reliance, such as provision of
childcare and elder care. Best practice includes the Desert Gardens
Apartments in Indio.
H3. Services: Incentivize housing that incorporates wrap-around services to
strengthen families, transfer new skills, and build leadership.
H4. Accessory Units: Facilitate the development of Accessory Dwelling Units (ADUs)
by considering the reduction of ADU impact and permit fees, disseminating
122 Commons are properties or resources owned by an entire community.

274 | P a g e
Farmworker Housing Study and Action Plan for Salinas Valley and Pajaro Valley
Final June 2018
public information, and establishing lender products for ADU new construction
and rehabilitation.
H5. Seasonal: Facilitate private sector development of farmworker housing with
unrestricted funding sources to allow flexibility in providing housing for seasonal,
migrant, or any other farmworker regardless of documentation.
H6. Energy Efficiency: Support housing projects, both new construction and
rehabilitation, which integrate energy efficiency, water conservation, and other
green elements that reduce operational costs to sustain the project over time.
Best practice includes the Mutual Housing at Spring Lake in Woodland.
H7. New Technologies: Educate the local International Code Councils and Building
Officials to streamline the approval of new building technologies, such as
modular construction as alternative to traditional stick-built, which have the
potential to more efficiently and economically scale up housing production.
Best practice includes George Ortiz Plaza I in Santa Rosa.
H8. Emergency Housing: Investigate and pilot the use of innovative emergency
housing types for seasonal, migrant farmworkers such as mobile homes.
H9. H-2A Worker Lodging: Collaborate with other jurisdictions to develop a model
ordinance for the temporary use of motels/hotels and other structures for H-2A or
other seasonal farmworkers.
H10. Housing Cooperatives: Support the development of new housing cooperatives
or assist residents of existing housing, such as labor camps and mobile home
parks, to convert their housing to limited-equity cooperatives as an affordable
alternative to renting and fee-simple ownership.
H11. Mutual Housing: Support resident-controlled mutual housing and mutual housing
associations, which empower tenants to be leaders and activists in the
governance and operation of their homes.
275 | P a g e
Farmworker Housing Study and Action Plan for Salinas Valley and Pajaro Valley
Final June 2018
Alternative Funding Models
In this section, we discuss innovative strategies states, counties, and cities have
adopted to generate additional revenue from new and non-traditional sources
and capitalize dedicated funding pools, generally called Housing Trust Funds, to
support affordable housing, including farmworker housing.
According to the Housing Trust Fund Project of the Center for Community
Change there were 45 housing trust funds in California in 2016.123 Most of these
housing trusts are programs of local government and the funds are embedded
within local government budgets. Some of these have operated fairly
independently, but most have not. Local government trust funds are often
authorized by legislation, ordinance, resolution, or voter initiative as are the
revenue streams that are deposited within the housing trust.
In a few cases, housing trusts are separate, nonprofit organizations like the
Ventura County Housing Trust Fund, San Luis Obispo County Housing Trust Fund,
Housing Trust Fund of Santa Barbara County, and Housing Trust Silicon Valley. The
Monterey Bay Housing Trust (MBHT) was formed in 2016 through a collaboration
of the Monterey Bay Economic Partnership (MBEP) and Housing Trust Silicon
Valley (HTSV). MBEP is the local contact responsible for security and deploying
local investments and working with developers to submit loan applications that
meet MBEP and HTSV criteria. HTSV committed to leverage locally-raised funds
by a 4:1 ratio and manages all aspects of loan origination, credit decision, and
loan-servicing processes. Initial funding for the MBHT includes the cities of
Salinas, Santa Cruz, Gonzales, and Watsonville; County of Monterey; United Way
Monterey County; Packard Foundation; and South Swell Ventures. Workforce
housing is a priority of the MBEP Housing Initiatives, but there is no specific set-
aside for farmworker housing in the MBHT funds.
HEART (Housing Endowment and Regional Trust) of San Mateo County is unique
in that it is a joint-powers authority (JPA) formed by the county and cities.
Private housing trusts can be receptacles for funds received and transferred by
local governments, as well as funds from other public and private sources, like
foundations and donors.
123 See https://housingtrustfundproject.org/wp-content/uploads/2017/01/HTFunds-in-the-US-
2016.pdf.
276 | P a g e
Farmworker Housing Study and Action Plan for Salinas Valley and Pajaro Valley
Final June 2018
Some trust funds have been initially capitalized in whole or part by existing
general fund revenues. For example, in 2012, voters approved the creation of a
Housing Trust Fund in San Francisco. The City originally committed $20 million,
increasing to $50 million over time, from general fund revenue captures of so-
called ‘boomerang’ funds generated by former redevelopment agency tax
increments, a small portion of the city’s transient occupancy tax, and an
increase in business license fees.
To ensure that revenue streams are continuous and relatively dependable, they
are usually tied to dedicated taxes, fees --such as impact or mitigation fees--
and exactions on regularly recurring transactions in the market that have a
nexus to housing. In some cases, loan repayments and private contributions
have been deposited in trust funds. Typical revenue sources include:
recordation fees, real estate transfer taxes, parcel taxes, commercial/industrial
linkage fees, inclusionary housing or zoning in-lieu fees, transient occupancy
taxes (TOT) on users of hotels, motels, vacation rentals and, increasingly,
Airbnb124 and other home-sharing arrangements.
Some governments have combined their restricted housing programs with these
funds to create a ‘one-stop shop’ for housing programs. Some communities
have addressed housing issues regionally and pooled county and city
governments’ resources together with private sector resources to create a
countywide housing trust fund. Some employers have agreed to assessments on
their business activities in order to raise funds for the housing trust.
Below, we describe two state housing trust funds that earmark funds for
farmworker housing and seven local funding sources that have been used to
capitalize local housing trust funds in California. Four of these sources are for
affordable housing, in general, but can be targeted to farmworker housing. It is
also worth discussing the potential for revenue from taxes or self-assessments on
local cannabis production.
124 In February 2018, the Government of British Columbia and Airbnb reached an agreement to
collect 11 percent in taxes on Airbnb rentals to fund affordable housing and tourism initiatives,
an estimated $16 million Canadian annually for housing. The Government will introduce
legislation to authorize the tax. Home-sharing licensing fees and business permits are also a
potential funding source.
277 | P a g e
Farmworker Housing Study and Action Plan for Salinas Valley and Pajaro Valley
Final June 2018
California’s New State Housing Trust Fund: The ‘Permanent Source’
Recent passage in the California Legislature of SB 2 (Atkins), the Building Homes
and Jobs Act, is an example of a state housing trust fund capitalized by a non-
traditional revenue source, a $75 per document recordation fee on real estate
transactions, not including home sales, capped at $225 per transaction. Most
states have something that can be called a housing trust fund, according to the
Housing Trust Fund Project. SB 2 is the first trust fund in California dedicated solely
to affordable housing production and preservation.
By statute, 10 percent of the anticipated $250 million in annual proceeds are
earmarked for farmworker housing starting in Year 2 of the program – 2019 – or
about $25 million. It is anticipated that most of the funds will be used to
replenish the Joe Serna, Jr., Farmworker Housing Grant Program. Some of these
funds, according to California Department of Housing and Community
Development officials, will likely be used to update and refurbish the State’s
migrant housing centers. And, up to $250,000 is earmarked, if needed, for
operating support for three migrant housing centers in Napa County.
In addition, SB 3, the Veterans and Affordable Housing Bond Act of 2018, if
approved by California voters in November 2018, will provide $300 million for the
State’s Local Housing Trust Fund Matching Grant Program. This program was first
funded in 2002 with $25 million under Proposition 46 and enabled by AB 1891
(Diaz) to provide matching grants (dollar for dollar) to local housing trust funds
that are funded on an ongoing basis from private contributions or public sources
not otherwise restricted in use for housing; in other words, new non-housing funds
dedicated for housing. Proposition IC in 2006 created the Affordable Housing
Innovation Fund and authorized up to $100 million for local housing trust funds.
To encourage new local trusts in smaller counties like Santa Cruz and Monterey
(under 425,000 people), the regulations require that HCD target funds and
specify terms and conditions through the NOFA process.125 Currently, this
program has no funding.
State Farmworker Housing Trust Fund: The Case of Washington State
The Washington State Farmworker Housing Trust was a nonprofit organization
founded in 2003 through the leadership of U.S. Senator Patty Murray who
brought together representatives of growers, advocates, developers, and other
125 See Title 25, Subchapter 2.5, Section 7156, of the Health and Safety Code,
http://www.hcd.ca.gov/grants-funding/active-no-funding/lhtf/docs/Text_of_Regulations.doc.

278 | P a g e
Farmworker Housing Study and Action Plan for Salinas Valley and Pajaro Valley
Final June 2018
community stakeholders and challenged them to come up with a strategy to
solve the housing problems of farmworkers. She helped mediate the different
interests and secured federal funds to ensure a launch of the fund.126 The Trust’s
mission was to create a more sustainable agricultural community in the state by
securing and investing resources to address all types of housing and housing-
related needs of farmworkers.
A major impetus for creating the Trust was recognition of the need for worker
housing on the part of both the Washington Growers League and United
Farmworkers and the working relationships that existed among key staff
members and leadership of the two organizations. Both had grown tired of
filling their filing cabinets full of complaints and numerous fights. The Trust,
therefore, became a strong coalition of diverse interests governed by a broad-
based board, four representatives from each sector. The founders felt it was
essential to get all members to agree on common principles.127
The Cedar River Group, an organization that specializes in facilitation,
mediation, and negotiation, was asked to provide support for the coalition. It
staffed the Trust’s Board of Trustees, performed a national study of best
practices, created a strategic plan to dramatically increase housing for
farmworkers and their families, and helped the board work with state legislators
and Congress to increase funding and raise dollars from private and
philanthropic sources. In 2005, the Trust and Cedar River Group joined with the
Office of Rural and Farmworker Housing to perform a statewide needs
assessment on a county-by-county basis for both permanent and seasonal
housing needs.
As far back as the 1990s, there had been loans and grants for affordable
housing through the Washington State Housing Trust Fund and set asides for
seasonal farmworker housing. In the 2005 session of the Legislature, the Trust and
its allies successfully increased the State Housing Trust Fund from $80 million to
$100 million per biennium and doubled the goal for money to be dedicated to
farmworker projects. In addition, a $2.5 million infrastructure matching fund was
created to encourage the development of seasonal housing sponsored by
growers. In 2006, the Trust secured $3 million in additional state funding for
farmworker projects. The Cedar River Group helped secure more than $2 million
in private, philanthropic, and federal funding to increase the capacity of rural
126Ibid. 127 Personal Communication with Brien Thane, former Executive Director of the Trust, February 18,
2017.

279 | P a g e
Farmworker Housing Study and Action Plan for Salinas Valley and Pajaro Valley
Final June 2018
housing providers to create and manage high-quality farmworker housing
projects. Monterey Bay Region farmworker housing advocates and officials
should consider creating a similar regional trust.
Unfortunately, the Farmworker Housing Trust did not survive the economic
downturn in 2008 and closed its doors in 2011 due to lack of sustainable funding
to run the organization. However, farmworker housing advocates have
continued to have success getting funding from the Washington State Housing
Trust Fund.
Grower Self-Assessments: The Case of Napa County Vintners
Napa County developed an innovative model for funding the production and
ongoing operating costs of seasonal, migrant worker housing (see Case Study
on the River Ranch Migrant Housing Center). The model should be explored for
possible replication in Santa Cruz and Monterey Counties for both year-round,
permanent, and seasonal, migrant housing for workers in the Pajaro and Salinas
Valleys. As far as we know, winegrape producers in Napa County are the only
group of agricultural producers in California and the country to voluntarily agree
to self-tax to fund workforce housing.128
Growers in Napa agreed to assess themselves a fee per acre to fund migrant
housing centers for workers who live in the county or come into the county from
other areas to work in the vineyards. In the four years from 1995 to 1999, vintners
voluntarily paid in more than $250,000 to fund farmworker housing. In 2001,
three major grower groups (Napa Valley Vintners, Napa Valley Grapegrowers,
and Napa County Farm Bureau) pushed State legislation to create a taxing
district for a self-imposed $10 per acre vineyard assessment, specifically to be
used for farmworker housing. Known as County Service Area (CSA) 4, every
vineyard owner in the county is assessed this supplement to their property tax.
Faced with the expiration of the assessment on June 30, 2017, the Napa County
Board of Supervisors sent vote-by-mail ballots to every winegrape grower with
more than one acre in cultivation asking them whether they wished to renew
the $10-per-acre assessment through the end of 2017 and increase the
assessment up to $15 per acre over a 5-year period. The expectation was that
the increase would be phased in starting with a $1-per-acre hike in 2018. On July
128 Absent a voluntary compact by growers, local governments could impose a tax or fee on
producers, although that would require voter approval and the campaign for a ballot measure
would likely be contentious and expensive.
280 | P a g e
Farmworker Housing Study and Action Plan for Salinas Valley and Pajaro Valley
Final June 2018
11, the overwhelming vote of the growers for the extension and increase of the
assessment was certified by the Supervisors. To extend the time period of the
assessment district and increase the amount, however, State legislation was
required and on July 17 SB 240 by Senator Bill Dodd (Napa) was signed by the
Governor.
Since 2002 when the assessment first went into effect, it has generated more
than $7 million, about $450,000 annually. To date, the fees have funded three
dormitory-style farmworker housing centers owned by the Napa County Housing
Authority and operated by the California Human Development Corporation.
The centers provide lodging with a total of 180 beds, as well as meals, laundry,
and recreational facilities. Like all migrant housing centers in the state, they are
only open to workers part of the year. Unlike the 24 centers operated by the
Office of Migrant Services, the Napa centers are open 11 months and the
months when they are closed are staggered such that two of the centers will
always be open when the third center is closed. In addition to the fees paid by
growers, tenants pay $14 a day in rent to help cover operating expenses.
In recent years, however, the centers have operated at a loss, which has been
covered by excess CSA 4 funds and contributions from local cities and private
donors. After several years of failed attempts to get appropriations from the
State budget, Napa County was successful in winning an annual earmark of up
to $250,000, if needed, in operating support for the centers from the proceeds of
SB 2. Together with the increased grower assessment, the expectation is that the
centers will operate in the black for the foreseeable future.
Inclusionary Housing: Fostering Social and Economic Inclusion
Inclusionary Housing (IH), also known as Inclusionary Zoning or Mixed-Income
Zoning, has been an affordable housing strategy used by California localities
since the mid-1970s, when Orange County, the City of Irvine, and the City of
Petaluma adopted their policies. The goal of IH is to leverage a locality’s land
use powers to compel or encourage private residential developers proposing a
new rental apartment project, multi-family condos, or single-family
homeownership subdivision to build or facilitate the production of affordable
housing. There is no prima facie reason why a local government couldn’t
require that some of these units be occupied by farmworkers.
A strong IH policy, however, is not just about production; it’s about social and
economic inclusion. It’s about providing opportunities for lower-income families
281 | P a g e
Farmworker Housing Study and Action Plan for Salinas Valley and Pajaro Valley
Final June 2018
and families of color to live in new growth and in-fill locations with high-quality
facilities and services. Growing communities, especially in coastal counties with
severe shortages of affordable housing and dwindling supplies of buildable
land, are most likely to adopt these policies. In our study area, the following
jurisdictions are known to have IH policies: Santa Cruz, Scotts Valley, Watsonville,
Santa Cruz County, Marina, Salinas, Soledad, and Monterey County.
While there are many variations from jurisdiction to jurisdiction, most IH policies
impose mandates on private residential developers requiring them to build a
specified percentage of affordable units alongside their market-rate units. Most
policies also provide default or alternative compliance options if a developer
cannot or elects not to build the units on site. These include building the units off-
site, partnering with a nonprofit housing organization to build the units, land
dedications, and in-lieu fee payments into a local housing trust fund. Within this
framework, policies may provide considerable discretion to local officials to
negotiate terms and conditions on a project-by-project basis. Some policies are
voluntary and encourage private developers to build the units through
incentives, such as density bonuses, concessions on project design, parking, and
fees, and expedited processing.129
Arguably, California is the epicenter of IH in the U.S. According to a 2007 study,
there were about 170 jurisdictions within the state that had an IH ordinance or
policy.130 In the past 10 years, however, changing economic, legal, and political
conditions in the state have slowed the rate of growth of new policies and
caused some localities to repeal, amend, or suspend their existing policies. The
four most significant factors affecting IH implementation have been:
The Great Recession – The implosion of the housing market and downturn
in the economy starting in 2007 brought housing production to a virtual
standstill. As a result, some localities repealed, suspended, or relaxed their
inclusionary requirements.
Palmer Case – A lower court decision in Palmer v. the City of Los Angeles
in 2009 opined that the City’s inclusionary housing policy was in violation
of the State’s Costa-Hawkins rent control law because it restricted rents on
129 A 2007 study of IH programs in California by the Nonprofit Housing Association of Northern
California and California Coalition for Rural Housing, Affordable Housing by Choice: Trends in
California Inclusionary Housing Programs, found, however, that voluntary programs are less likely
to produce as high a volume of affordable units as mandatory programs. 130 The number of IH programs was based on self-reporting by local government officials. A
closer review of each policy by the California Coalition for Rural Housing after publication
concluded that there were more like 145 true IH policies in the state.

282 | P a g e
Farmworker Housing Study and Action Plan for Salinas Valley and Pajaro Valley
Final June 2018
inclusionary units. This caused localities around the state to suspend their
rental inclusionary programs. Some localities were able to devise ‘work-
arounds’ by offering richer incentives or by increasing nexus fees to
encourage developers to opt for building the units instead of feeing out.
Patterson Case – Another lower court decision in Building Industry
Association v. City of Patterson in 2009 concluded that the City had not
shown a clear nexus between the amount of its in-lieu fee per unit and the
impact of a new market-rate subdivision on housing affordability in the
city. Consequently, some localities with financial means commissioned
nexus studies to determine and justify their in-lieu fees, sometimes resulting
in higher fees than previously existed.
Demise of Redevelopment – The closure of redevelopment agencies
starting in 2012, and loss of about $1 billion annually in tax increments for
affordable housing, combined with the factors previously mentioned,
have convinced some localities to move from a build-first IH policy to a
fee-out policy. In other words, the in-lieu fee is no longer the default
option if developers cannot or will not build the units, but the first and
sometimes only way private developers need comply with local
affordable housing requirements.
That said, more recent economic, legal, and legislative developments have
now created the best environment for IH in the past 10 years. First, the economy
has rebounded and State legislation, SB 35 (Wiener), that passed in 2017 should
make it easier for private developers to accelerate and increase housing
construction. Second, the U.S. Supreme Court in 2016 declined to hear a
California Supreme Court decision in Building Industry Association v. City of San
Jose, which upheld the City’s IH policy and its authority to impose inclusionary
requirements under its police powers without a nexus study. And, third, AB 1505
(Bloom), passed in 2017, affirmed that cities and counties may require below-
market rents on new inclusionary units without violating Costa-Hawkins.
The City of Salinas updated their IH ordinance in June 2017. In January 2018, the
County of Monterey issued a Request for Proposals for consultants to assist them
to update their program, which began in the 1980s and has been updated
several times. The City of Santa Cruz and the County of Santa Cruz are
scheduled to consider approval of updates to their inclusionary housing
ordinances this spring/summer.
Given these more propitious conditions, all jurisdictions in Santa Cruz and
Monterey Counties should consider IH as a strategy and adopt new policies or
283 | P a g e
Farmworker Housing Study and Action Plan for Salinas Valley and Pajaro Valley
Final June 2018
update, expand, and strengthen existing policies. While studies have shown
that the best way to guarantee affordable housing is to mandate production by
private market-rate developers, the in-lieu fee option could infuse new revenue
into local housing trust funds. If the fee is calculated to cover the replacement
cost of a subsidized unit, it would help leverage other funding for an affordable
housing developer to build the inclusionary units or even persuade private
developers to build the affordable units as their first option. When updating their
ordinances, local authorities could require that a portion of the units be
occupationally-restricted to farmworkers.
Commercial and Housing Linkage Fees: Creating a Jobs-Housing
Balance
Linkage fee programs have been adopted by cities around the country and in
California to generate new revenue for affordable housing from commercial,
industrial, and market-rate residential developers. They have the potential to
generate millions of dollars in Santa Cruz and Monterey Counties that could
assist in developing farmworker housing.
Commercial and industrial linkage fees are charged to mitigate the affordable
housing impacts from new employees working in these new spaces. The theory is
that commercial and industrial development, while creating jobs and economic
growth, also create pressures on local housing markets resulting in housing
scarcity and price increases. Lower-wage workers, in particular, may be priced
out of the market and forced into long and costly commutes, which clogs
highways, increases air pollution, and may weaken communities and families.
Responsible companies should share in the benefits of the communities where
they locate and the economic and social costs of doing business in these
communities. One estimate is that there are about two dozen locally-adopted
commercial/industrial linkage fee programs in California, usually in large cities
such as Los Angeles, San Francisco, and Oakland.
Housing linkage fees, perhaps more commonly known as “housing impact fees,”
are charged on new market-rate residential developments in order to help pay
for an increase in affordable housing demand associated with the hiring of
workers employed to provide the goods and services needed by renters and
buyers living in newly built homes. Recently, because of the constraints on IH
previously mentioned, a number of communities have converted traditional IH
programs to those based on a housing linkage fee or impact fee.
284 | P a g e
Farmworker Housing Study and Action Plan for Salinas Valley and Pajaro Valley
Final June 2018
In 2014, the Association of Bay Area Governments completed a study of San
Francisco and the four surrounding counties.131 It found that 13 cities had
commercial linkage fees and 16 cities had residential linkage fees. Most of these
cities had adopted the fees recently, partly in response to the Palmer case,
which precluded rental units subject to IH policy. Another analysis by the Non-
Profit Housing Association of Northern California found that among Bay Area
jurisdictions that replaced traditional on-site, performance-based IH programs
with impact fees, all adopted impact fees were less than the in-lieu fees of their
prior IH program. While the in-lieu fees had been a default option for developers
opting not to build the affordable units and were based on the cost of providing
alternative affordable units, the impact fees were based on a nexus study. Most
cities chose to set their impact fee well below the maximum fee suggested by
their nexus studies to avoid possible legal challenges.
The most recent linkage fee program was approved by the Los Angeles City
Council in December 2017. It is expected to generate $104.4 million annually
and finance construction or preservation of between 1,699 and 1,767 units of
affordable housing per year. Commercial developers will pay $3 to $5 per
square foot for new projects. Residential developers will pay between $8 and
$15 per square foot.
In 2015, the City of Salinas commissioned a Housing Impact Fee Nexus Study and
Commercial Linkage Fee Study to quantify the increase in demand for
affordable housing that accompanies new residential and commercial
development. With respect to the housing nexus study, researchers calculated
the affordability gap caused by growth in the number of jobs and household
demand for affordable housing created by an increase in the supply of three
building types: low-density single-family homes, small lot single-
family/townhomes, and apartments.132 The study completed in January 2016
proposed impact fees ranging from $13 to $20 per unit per square foot
depending on housing type. In March 2017, the study was updated. The revised
fee schedule of $12 per square foot for ownership units and $2 per square foot
for rental units was adopted by the City Council in June 2017.
The commercial linkage fee study completed in January 2016 looked at four
types of non-residential development: (1) Office/Research and
131 See Grounded Solutions, https://inclusionaryhousing.org/designing-a-policy/program-
structure/linkage-fee-programs. 132 See Housing Impact Fee Nexus Study, City of Salinas, January 2016.
https://www.cityofsalinas.org/sites/default/files/pdf/temporary/Nexus%20Study%20(Residential%
20%20%26%20Commercial)%202-12-16.pdf.
285 | P a g e
Farmworker Housing Study and Action Plan for Salinas Valley and Pajaro Valley
Final June 2018
Development/Medical Offices, (2) Retail/Restaurant/Personal Services; (3)
Hotels; and (4) Warehouse/Industrial Buildings.133 It estimated the number of
employees per type and incomes, total housing affordability gap for employees
needing assistance, and commercial linkage fee by dividing the total
affordability gap by the number of square feet in new non-residential
development. The study calculated maximum fees ranging from $36 per square
foot for warehouse/industrial space, to $46 for office/R&D/medical offices
space, to $47 for hotel space, to a high of $95 for retail/restaurant/personal
services space. The Study did not move forward for City Council consideration.
Jurisdictions within Santa Cruz and Monterey Counties, particularly those housing
workers from the Pajaro/Salinas Labor shed, may wish to adopt new housing
and commercial linkage fees or increase their existing fees to address the critical
need for farmworker housing. Some will argue that linkage fees will discourage
new development. However, even fees set as a modest percentage of the
maximum fee needed to fill affordability gaps for each type of residential or
commercial space, as in the case of the recently adopted linkage fees in Los
Angeles, could generate meaningful revenue, assuming growth in new housing
and commercial development.
Special Taxes
Parcel Taxes: Taxing Land Rather than Development
Some elected officials and advocates have proposed parcel taxes for
affordable housing as an alternative to linkage or impact fees. In an Op-Ed
column in the Los Angeles Times on July 19, 2017, Tax Land, Not Development,
three UCLA professors proposed a flat tax of $3 per day on every parcel in the
city instead of the proposed linkage fee on new residential and commercial
development that was later adopted by the Los Angeles City Council in
December 2017. The argument they made was that a universally-applied
parcel tax would raise many times more than the estimated $100 million
annually from linkage fees on new development given that there isn’t that
much new development in the city beyond infill, without Redevelopment. The
parcel tax would equal $1,100 a year per property owner and, based on about
785,000 parcels, generate about $860 million annually.
133 See City of Salinas Nexus Studies Overview and Summary February 2016,
http://www.cityofsalinas.org/sites/default/files/pdf/temporary/Final%202_12%20-
Overview%20and%20Summary.pdf.
286 | P a g e
Farmworker Housing Study and Action Plan for Salinas Valley and Pajaro Valley
Final June 2018
It is unknown how many California jurisdictions have parcel taxes for affordable
housing, but it is uncommon. They require super-majority (two-thirds) approval
of those voting in the election, a very heavy lift. Most parcel tax measures that
have been approved are targeted to school spending. Some are for special
districts to pay for fire protection, libraries, parks, water, lighting, transit, and
other physical infrastructure upgrades. Few are for social services.134 Unlike
property taxes, which are based on property values, parcel taxes are typically
an assessment based on the characteristics of the parcel. These can include
taxing based on the square footage of the parcel or dwelling unit or a flat rate
per parcel.
In terms of farmworker housing, local authorities could, in theory, create a taxing
district for farmworker housing and apply the tax to all parcels or just agricultural
parcels. In some sense, this would not be too different than the taxing district
winegrape growers voluntarily created in Napa County based on acreage in
production. The advantage of a parcel tax over a linkage or impact fee is that
it is not dependent on the vicissitudes of new development, which can be quite
variable from year to year, and could raise more revenue. The disadvantage is
that it will require a super-majority vote of the electorate, rather than a majority
vote of the local governing board, and will likely be opposed by both the
development community and property owners.
Property and Sales Taxes: Taxing Real Estate and Retail Transactions
In a few instances, voters have approved increases in property taxes to repay
the proceeds from general obligation affordable housing bonds, as well sales
tax increases to fund affordable housing. The most recent examples were
successful super-majority votes for three measures in the San Francisco Bay Area
in November 2016:
Alameda County, Measure A1 – $580 million general obligation
affordable housing bond to finance construction and rehabilitation of
8,500 affordable rental units, loans for moderate-income homebuyers,
and upgrades to existing low-income housing. To repay the bonds,
property taxes were set to increase by a rate of $12.50 per $100,000 of
assessed property value in 2017 and continue to increase in subsequent
years not to exceed $13.90 per $100,000 of assessed property value. The
tax expires in 2040.
134 The City of Davis is considering a parcel tax to help pay for homeless services on the June
2018 ballot. See http://www.sacbee.com/news/local/article191155814.html.
287 | P a g e
Farmworker Housing Study and Action Plan for Salinas Valley and Pajaro Valley
Final June 2018
Santa Clara County, Measure A – $950 million general obligation
affordable housing bond measure to create and preserve an estimated
5,000 affordable housing units. It authorized a $12.66 increase in the
assessed value of taxable property to pay debt service on the bonds
during the first fiscal year after sale of the first series of bonds. Over the life
of the bond, the increase will range from $10.76 to $12.66.
San Mateo County, Measure K – Extends a half-cent sales tax on retail
transactions and uses through 2043 to help fund affordable housing for
families, seniors, veterans, and people with disabilities. The proceeds will
also pay for emergency preparedness services, neighborhood and school
safety, and combat human trafficking and sexual exploitation of children.
It is expected to raise $85 million annually.
These three election campaigns were expensive, but two of them (Alameda
and San Mateo Counties) passed by considerable margins above the two-thirds
minimum threshold. Santa Cruz and Monterey Counties are exploring the
political will and popular support for similar campaigns to support affordable
housing, including addressing the lack of decent and affordable housing for the
region’s farmworkers.
Transient Occupancy Taxes: Housing for Tourism Workers and Communities
Many vacation and business destinations in California impose Transient
Occupancy Taxes (TOTs) on hotels, motels, vacation rentals, and other
accommodations. As of 2009, about 400 California cities, roughly 85 percent of
the approximately 480 cities in California, imposed a TOT on visitors to their city.
Sixty California cities levied a TOT that exceeded 10 percent.135 Since 2009, there
have been 115 local ballot measures to create TOTs or increase the percentage
– 76 passed and 39 failed, a 66 percent success rate. There have been six TOT
ballot measures in Santa Cruz and Monterey Counties since that time – five
passed and one failed (Capitola). The most recent measures were in Soledad
(12% TOT) and Watsonville (11% TOT) in 2016, both of which passed. Most
measures sought TOTs of 11 or 12 percent; some as high as 16 percent.
Some jurisdictions earmark a portion of TOTs for affordable housing. The
justification is that employees in these accommodations are typically low-wage
earners and that demand for low-cost housing by these workers creates pressure
on local housing markets that should be borne by the lodging industry and
135 See https://ballotpedia.org/Hotel_taxes_in_California.
288 | P a g e
Farmworker Housing Study and Action Plan for Salinas Valley and Pajaro Valley
Final June 2018
visitors. In the case of home-sharing companies, like Airbnb, units that were
previously rented to local residents are now rented to short-term visitors at much
higher rates and with fewer headaches than long-term tenancies. In some
communities, this has resulted in tenant displacement, increasing competition
for a shrinking supply of affordable rentals, and price appreciation.
Some California communities that have recently expanded or amended existing
TOTs, created new TOTs, or are considering changes to their TOTs for housing
are:
City of Healdsburg: In 2016, the citizens of this Sonoma County city, faced
with a growing vacation rental home market, passed Measure S with a
two-thirds vote increasing their existing TOT from 14 percent to 16 percent,
with the additional 2 percent dedicated to affordable housing programs
and services. In calendar year 2017, it generated $585,000 for housing.
City of Mammoth Lakes: This resort community in the Eastern High Sierra
increased its TOT by 1 percent in 2002 with the additional revenue
dedicated to affordable housing. The city’s current community housing
action plan calls for a local tax initiative to increase the percentage of
the TOT for housing to 2 percent.
City of Redwood City: City officials are proposing a 12 percent TOT on top
of what homeowners charge for their short-term rentals with platforms like
Airbnb collecting the taxes and remitting them periodically to the city. An
estimated $400,000 would be generated annually and dedicated to an
affordable housing fund.
City of Oakland: A study by Community Economics and East Bay Housing
Organizations in 2015 recommended that the city impose a 14 percent
TOT and that 11 percent of it be directed into the City’s Affordable
Housing Trust Fund.136
Sonoma County: In 2016, voters in Sonoma County passed Measure L to
increase the existing TOT from 9 percent to 12 percent, raising about $4
million annually for a variety of tourism, agriculture, and infrastructure
needs, including workforce housing for families and veterans.
Tourism is a $700 million industry in Santa Cruz County and generates $14.5
million in local taxes (based on 2000 numbers).137 In 2013/14, TOTs from the cities
136 See The Impact of Short Term Rentals on Affordable Housing in Oakland: A Report and
Recommendations, Community Economics and East Bay Housing Organizations, December
2015. 137 See http://www.santacruz.org/press/facts-stats-faqs.
289 | P a g e
Farmworker Housing Study and Action Plan for Salinas Valley and Pajaro Valley
Final June 2018
of Santa Cruz, Watsonville, Capitola, Scotts Valley, and the unincorporated
county totaled over $15.5 million. If just one percent of that total were
dedicated to affordable housing, over $1.55 million would have been available
to house farmworkers. If the total amount of existing TOT were increased by 1-2
percent with 100 percent of the increase dedicated to affordable housing, as
other localities have done, over $1.56 to $1.58 million would become available
annually to improve the housing conditions of farmworkers.
A similar case can be made for Monterey County. The TOT in Monterey County is
low relative to other jurisdictions, 10.5 percent, and does not include an earmark
for housing. In fiscal year 2015-2016, it generated over $22.8 million. An increase
to 11 percent or 12 percent, which is increasingly the norm, could raise $1.1 to
$3.3 million annually for affordable housing, including farmworker housing.
Unlike a parcel tax, discussed above, linkage (or impact) fees and TOT fees can
be adopted by a majority vote of city councils or county boards of supervisors
without a super-majority vote of the electorate.
Public Benefit Zoning: Harnessing the Public Share of Land Value
Increases
Public Benefit Zoning (PBZ), also known as Land Value Recapture, is a strategy
that has been used in some European countries to generate benefits for
affordable housing from increases in land values due to public actions. In the
United Kingdom it is known as Betterment Taxation and in Spain as Plus Valia.
The idea is that the market price of land is imputed, in large part, to nearby
public-sector investments in value-enhancing externalities, such as new schools,
hospitals, parks, sewer and water systems, transit, and other public and
community facilities and services that increase land prices through no action of
land owners. In addition, plan and zoning changes, such as ‘up-zoning’ the
intensity of land from agricultural to residential use or single-family to multifamily
residential use, will increase the income-generative potential of the land and its
market value. In either instance, the land owner experiences an ‘unearned’
windfall upon development and/or sale of the land that is not shared with the
public sector for the public good.
According to a study by Calavita and Wolfe (2014) for the East Bay Housing
Organizations, PBZ is one of several local government strategies that seek to

290 | P a g e
Farmworker Housing Study and Action Plan for Salinas Valley and Pajaro Valley
Final June 2018
capture development value.138 The others include: incentive zoning/density
bonuses, housing overlay zones, tax increment financing, community benefits
agreements, and special assessment districts. What distinguishes PBZ from these
other methods is that they extract benefits from the development process, such
as commitments to build affordable housing, in exchange for developer
incentives like higher density, or capture the incremental value of improvements
made on the land for affordable housing. In contrast, PBZ attempts to capture
the additional land value created through public action to compel land owners
to either build affordable homes, dedicate land for affordable housing, or pay a
portion of their land value gains for affordable housing.
Calavita and Wolfe cite the examples of San Francisco, Santa Monica, Culver
City, and Berkeley as cities that have incorporated elements of land value
recapture in their policies. San Francisco, for instance, created a tiered
approach that links increased density with increased value. Baseline impact
fees are charged for projects that remain at current height based on the
assumption that there will be no increment in value resulting from government
action. A second and third tier of public benefit zoning fees are triggered for
approvals for additional stories above baseline.
Moreover, the city requires that in areas rezoned from industrial to residential
more affordable housing must be produced than is obligated under the city’s
inclusionary housing ordinance. The plan also provides greater flexibility for
meeting affordable housing goals. If the affordable units are produced on-site,
a lower percentage is required than if they are built off-site, or if land is
dedicated, or if rents are targeted to a higher-income population.
In lower-density counties like Santa Cruz and Monterey, height incentives like in
San Francisco may not be the best way to incentivize public benefits. However,
allowances for developers to build more units to the acre through smaller-unit
construction will increase the number of income-generating units on sites and
increase land values. In exchange for this concession and others, like parking
reductions, jurisdictions can leverage affordable units for farmworkers.
Additionally, when a plan or zoning change confers additional value on the
land, such as through conversion of agricultural or industrial land to residential
uses, local authorities can recapture the increased value by requiring inclusion
of affordable units on the site or increasing the percentage of affordable units
138 See Calavita, Nico, and Wolfe, Marian, White Paper on the Theory, Economics and Practice
of Public Benefit Zoning, prepared for East Bay Housing Organizations, et.al., November 2014.

291 | P a g e
Farmworker Housing Study and Action Plan for Salinas Valley and Pajaro Valley
Final June 2018
required when the units are built off-site, land is dedicated in lieu of building, or
a higher-income population is targeted. Jurisdictions can also allow land owners
to make a cash contribution to a local housing trust fund sufficient to subsidize
replacement units. In the instance of agricultural land conversions, there is a
strong case for leveraging new farmworker housing in exchange for increased
land value.
Taxing Cannabis: New Source of Revenue for Farm Labor
Housing?
The legalization of recreational cannabis in California via passage of Proposition
64, the Adult Use of Marijuana Act, in November 2016, presents potential new
opportunities for generating revenue for farmworker housing because of the
increased need for labor and nexus to both agriculture and employee housing.
The legal market is expected to earn $5.1 billion in California in 2018. Agricultural
economists predict consolidation as large corporate interests begin to
monopolize commercial production of cannabis and marginalize small
producers. There is also an expectation that growing employment in
recreational and medical marijuana will increase pressure on local housing
markets. Already, a developer has approached the City of Greenfield with a
proposal to develop 324 units to house medical cannabis workers, the possibility
of recreational cannabis workers later on, and other low-income residents in the
community.139
At the same time as Proposition 64 was approved, voters in many other cities
and counties in California voted on and approved local ordinances to tax the
cultivation, manufacture, distribution, and sales of medical and, conditionally,
recreational cannabis.140 Quite a few of these measures were in Santa Cruz and
Monterey Counties in 2016-17and passed with impressive super-majority votes:
Santa Cruz County. Santa Cruz County is known as one of California’s
“cannabis capital”s and was one of the first areas in the state to license
medical cannabis dispensaries when they were legalized in 1996. In
November 2014, voters approved Measure K and, two years later,
Measure E in November 2016 imposing cannabis business taxes. The
County’s tax for both cultivation and manufacturing started at 5 percent
139 City of Greenfield, City Council Memorandum, December 6, 2017, pp. 85-87. 140 Most of these ballot measures did not address the sale of recreational marijuana directly
because they did know whether Proposition 64 would pass. However, with passage of
Proposition 64, in many cases, these ordinances now also apply to recreational cannabis.
292 | P a g e
Farmworker Housing Study and Action Plan for Salinas Valley and Pajaro Valley
Final June 2018
in 2018, will rise to 6 percent in 2020, and then to 7 percent in 2022,
capped at a maximum of 10 percent of gross receipts.
Monterey County. Measure Y was approved by voters by a large margin –
74 percent to 26 percent. It imposed a permanent tax on all commercial
cannabis business activity, such as cultivation, processing, manufacturing,
distribution, and selling, excluding personal medical marijuana cultivation.
It imposes taxes on three groups of commercial activity:
o Nursery Cultivation – Initial tax rate of $2 per square foot of
authorized canopy through June 30, 2020. Beginning on July 1,
2020, tax rate increases each fiscal year by $1.50 per square foot of
authorized canopy, not to exceed maximum tax rate of $5 per
square foot per year. Beginning on July 1, 2022 and each year
thereafter, amount of tax will increase based on Consumer Price
Index (CPI).
o Non-Nursery Cultivation – Initial tax rate of $15 per square foot of
canopy effective until June 30, 2020 and, then, will increase each
succeeding July 1 by $5.00 until a maximum rate of $25 per square
foot is reached. Thereafter, on each succeeding July 1, tax will
increase by the CPI.
o Non-Cultivation Commercial Cannabis – Tax based on annual gross
receipts starting at 5 percent until June 30, 2020 and, then,
increasing each succeeding July 1 by 2.5 percent until maximum
rate of 10 percent is reached. There will be no annual CPI
adjustment on gross receipts tax.
Santa Cruz. Like in Santa Cruz County, the City of Santa Cruz was one of
the first jurisdictions to license medical cannabis dispensaries. In
November 2014 in Measure L and, in November 2016 in Measure E,
cannabis business taxes were extended to all cannabis businesses
operating in the city. In Chapter 5.07 of the City of Santa Cruz Municipal
Code and Ordinance No. 2017-22, the tax increased from 7 percent of
gross receipts to 8 percent of gross receipts, effective January 1,
2018. The tax can rise up to 10 percent.
Gonzales. Measure W imposed authorized the city to charge an initial tax
of $15 per square foot of space dedicated to cannabis cultivation with
the ability to raise this tax up to a maximum of $25 per square foot after
three years. In 2020, the cultivation tax will be subject to annual CPI
adjustments. It also establishes an initial tax rate of 5 percent on the
293 | P a g e
Farmworker Housing Study and Action Plan for Salinas Valley and Pajaro Valley
Final June 2018
annual gross receipts of manufacturers that can be raised to a maximum
of 15 percent on gross receipts after three years.
Greenfield. With passage of Measure O, the city imposes a tax on all for-
profit and nonprofit cannabis cultivation businesses of $15 per square foot
of canopy space until June 30, 2020. Every year thereafter, the tax will
increase by $5 per square foot, not to exceed $25 per square foot. On
July 1, 2023, the tax will be increased annually according to the CPI. For
nursery cannabis cultivation, operators will pay $2 per square foot of
canopy space until June 30, 2020. Every year thereafter, the tax will
increase by $1.50 per square foot, not to exceed $5 per square foot.
Starting on July 1, 2023, the tax will increase annually according to the
CPI. The city will impose a general tax of $5 on gross receipts per fiscal
year on all other types of cannabis businesses. Beginning July 1, 2020, the
tax rate will increase by 2.5 percent per year, not to exceed 10 percent
per year.
King City. Measure J imposes a tax on medical and recreational
marijuana cultivation businesses at a rate of $25 per square foot for the
first 5,000 square feet and $10 per square foot thereafter for cultivation.
The tax may not exceed $5 per square foot for nurseries; $30,000 each for
manufacturing and testing facilities. The tax is subject to an annual CPI-
based adjustment. The tax for both cultivation and nursery operations
starts at an initial rate of $5 per square foot for the first 5,000 square feet
and $2.50 per square foot for additional space.
Salinas. For both for-profit and nonprofit cultivation businesses, Measure L
authorizes the city to impose a general tax of $15 per square foot of
canopy area. After three years, the tax rate automatically increases to
$25 per square foot of canopy area and is automatically adjusted based
on the CPI. For marijuana dispensaries, manufacturing, and delivery
businesses, the city imposes a tax rate of 5 percent of gross revenues.
After three years, this tax rate automatically increases to 10 percent of
gross revenue.
Watsonville. Measure L taxes marijuana cultivation at a maximum rate of
$20 per square foot per year of canopy area and maximum rate of 2.5
percent of gross receipts from the manufacture or processing of cannabis.
From the sale of cannabis, the city imposes a tax of a maximum of 10
percent on gross receipts.
Whether applied as a tax on gross receipts or a tax based on canopy square
footage, or both, revenue from cannabis business activity can potentially
provide an additional infusion of funding for affordable housing. Generally, at
294 | P a g e
Farmworker Housing Study and Action Plan for Salinas Valley and Pajaro Valley
Final June 2018
least in the early years since legalization, Cannabis taxation measures have
been quite popular, passing with huge margins, and it may be likely that many
jurisdictions in agricultural areas would be receptive to earmarking a portion of
existing tax proceeds or an increment in tax proceeds for farmworker housing.
Looking at gross receipts in the City of Santa Cruz and Santa Cruz County since
2014, for example, one can see the potential if a modest percentage of this
amount were dedicated to farmworker housing. From inception in late 2014,
$7.6 million have been contributed, more than $6.7 million into the county’s
general fund and $934,008 into the city’s general fund.
On the other hand, cannabis taxation is not a panacea and should not be seen
as a substitute for adopting other local strategies that may be more politically
difficult. Cannabis receipts can be quite variable from year-to-year and there
are still significant questions about federal intervention and the impacts of
legalization and taxation on marijuana pricing and consumer behavior.141 Some
jurisdictions have yielded below-expected returns and have seen decreases in
revenue in recent years.
Conclusion
In this chapter, we have discussed alternative development and funding
strategies for farmworker housing as a departure from the conventional building
and financing paradigms that have dominated. The four alternative
development types and nine funding types discussed, two of them state housing
trust funds and seven of them local revenue sources to capitalize local housing
trust funds, offer additional tools for developing and funding homes for
farmworkers that are within the control of local authorities and citizens. All of the
funding streams represent efforts to direct non-housing dollars from taxes and
fees on transactions happening in the private market.
In terms of development and tenure strategies, the traditional ways we have
built housing for farmworkers, especially year-round, permanent rental housing,
will likely continue to predominate. Generally, both local communities and
farmworkers aspire to the conventional building and tenure types. While mutual
housing in rental tenure is only as participatory and time-consuming as residents
make it, mutual self-help housing, cooperative housing, and community land
trusts create ownership, can be very demanding, and are not for everyone.
141 For an understanding of potential pitfalls of taxing cannabis at the state level, which can also
occur at the local level, see https://itep.org/wp-content/uploads/marijuanaissuesreport.pdf.

295 | P a g e
Farmworker Housing Study and Action Plan for Salinas Valley and Pajaro Valley
Final June 2018
And, government and private lenders and grantors tend to favor and have a
higher comfort level with the conventional, normative forms of housing.
In terms of funding strategies, none of the sources discussed, alone or even in
combination, will be sufficient to build or preserve housing for farmworkers
without significant federal and state funding. They are not a substitute for a
robust federal and state government role. Nonetheless, they can fill the gaps in
the predevelopment, development, and post-development periods. They are a
flexible source of local discretionary funds that can be used for the hard costs of
land acquisition and preparation and home construction, as well as the soft
costs of staff and outside professionals needed to make a deal work. And, as in
the case of the Napa Valley migrant housing centers, these funds can be used
to cover operating cost shortfalls, make repairs and improvements, pay for
services, and even subsidize rents.
As long as the federal government and State of California continue to provide
financing through existing programs that have been proven to work, although
insufficient to cover all the costs of development and operation, the alternative
funding streams described in this chapter will continue to be supplemental but
important strategies to demonstrate local commitment and fill funding gaps.
FINANCING FARMWORKER HOUSING Housing producers have used a multiplicity of funding sources to build,
rehabilitate, acquire, and operate safe, decent, and affordable homes for
farmworkers. Many farmworkers are housed incidentally in rent-restricted
affordable housing projects because they are low income. Others are housed
intentionally in affordable housing that is occupationally-restricted to qualifying
farmworkers. This housing is typically produced by private affordable housing
developers and public housing authorities. Growers and labor contractors also
provide a variety of on-farm accommodations for their year-round and seasonal
workers.

296 | P a g e
Farmworker Housing Study and Action Plan for Salinas Valley and Pajaro Valley
Final June 2018
Through a review of over 80 farmworker rental housing projects in California142,
as well as information from the California Tax Credit Allocation Committee
(TCAC) on funded and pending Low-Income Housing Tax Credit (LIHTC)
projects143, we were able to identify a broad range of funding sources deployed
by developers to finance and operate farm labor housing, which are listed and
reviewed in this section. The frequency of use of these sources is quite variable,
with some rarely deployed, while others are found in many projects. Most
affordable housing finance programs are restricted to low-income households,
which may include farmworkers. Some of these programs are occupationally-
restricted just to farmworkers. Often these programs are layered with other
affordable housing finance programs that serve low-income households writ
large.144
In this section, we describe the federal and state funding sources most
frequently used in farmworker housing projects in California and that also hold
the most promise for housing production for farmworkers in the Pajaro and
Salinas Laborshed. This includes existing state programs that are currently
inactive because of lack of funding but may be replenished in the coming years
due to legislation passed by the California Legislature and signed by Governor
Jerry Brown in September 2017. We describe this legislation – SB 2, the Building
Homes and Jobs Act, and SB 3, the Veterans and Affordable Housing Bond Act
of 2018 – in the section under State Housing Funding Resources. Local funding
sources that may be generated by local governments for farmworker housing
are also discussed.
We begin with the federal programs and conclude with state programs in the
order listed below. Some federal programs are both federally- and state-
administered, such as the Community Development Block Grant Program and
HOME Investment Partnerships Program. These are described under Federal
Housing Funding Resources. Other federal programs are state-administered
only, such as the Federal Low-Income Housing Tax Credit Program and Tax-
142 We surveyed 13 organizational members of the California Coalition for Rural Housing that own
and operate year-round, permanent farmworker housing. They identified 83 projects with
4,041units that were occupationally-restricted in whole or part. 143 The TCAC database is a good resource for viewing staff reports of funded projects and
applications of pending projects, with detailed information on the applicant, the project, the
financing, proforma development costs, and operating budget.
http://www.treasurer.ca.gov/serp_new.asp?cx=001779225245372747843%3Acrby_i19opu&cof=F
ORID%3A11&ie=UTF-8&q=usda+rhs+514 144 Note we do not list programs that finance non-housing activities, such as infrastructure
improvements (e.g., sewer and water systems), green retrofits, and resident services.

297 | P a g e
Farmworker Housing Study and Action Plan for Salinas Valley and Pajaro Valley
Final June 2018
Exempt Private Activity Bonds. For our purposes, the 9 percent credit under the
Federal and State Low-Income Housing Tax Credit Programs and 4 percent
credit under the Federal Low-Income Housing Program in combination with Tax-
Exempt Private Activity Bonds are discussed under State Housing Funding
Resources.
Federal USDA Section 514/516 Farm Labor Housing
USDA Section 521 Rural Rental Assistance
USDA Section 502 Direct Loan/Section 523 Mutual
Self-Help Housing Technical Assistance
HUD Community Development Block Grant
HUD HOME Investment Partnerships
Federal Home Loan Bank Board Affordable
Housing Program
State HCD Joe Serna, Jr., Farm Worker Housing Grant
HCD California Self-Help Housing Program
HCD CalHome
HCD Multifamily Housing Program
TCAC Federal and State Low-Income Housing Tax
Credits
HCD Farm Worker Housing Tax Credit Assistance
SGC Affordable Housing and Sustainable
Communities Program
USDA = U.S. Department of Agriculture
HUD = U.S. Department of Housing and Urban Development
HCD = California Department of Housing and Community Development
TCAC = California Tax Credit Allocation Committee
SGC = California Strategic Growth Council

298 | P a g e
Farmworker Housing Study and Action Plan for Salinas Valley and Pajaro Valley –
Final 2018
Federal Housing Funding Resources
U.S. Department of Agriculture Rural Development
Since the 1960s, the Rural Housing Service (RHS) of USDA Rural Development
(RD) has administered several housing assistance programs that have been
used in California and around the country to produce housing for farmworkers.
We focus on three mainstay programs.
1. Section 514/516 Farm Labor Housing Loans and Grants is USDA’s one
occupationally-restricted farmworker housing production program.
2. Section 521 Rural Rental Assistance is a rental subsidy typically used to
help cover the operating costs of Section 514/516 housing.
3. Section 502 Direct Loan Program is a program for low-income rural
borrowers. When used in a Mutual Self-Help Housing Program for owner-
builders, the Section 502 loan covers the construction costs and is
converted to a long-term mortgage upon completion of construction.
While Section 502 does not require farmworker occupancy, many self-
help homes in California were built by active or former farmworkers and, in
some cases (described later), were farm-worker restricted at initial
occupancy due to State program requirements. Construction supervision
for Section 502-financed mutual self-help housing subdivisions is typically
provided by a nonprofit organization receiving a Section 523 Mutual Self-
Help Housing Technical Assistance Grant.
Section 514/516 Farmworker Housing Loans and Grants
Purpose: Created in 1962 and 1966, respectively, the Section 514 Loan and
Section 516 Grant Programs often work in tandem to finance housing for year-
round, permanent and seasonal, migrant farmworkers. Occupants must be
domestic farmworkers with a majority of their income deriving from qualified
farm work or retired and/or disabled farmworkers and have very low to
moderate incomes and be a U.S. citizen or permanent resident.
Governing Authority: Title V, Section 514 and 516 of the Housing Act of 1949; 42
U.S.C., Chapter 8A, Subchapter III, 1484 and 1486.

299 | P a g e
Farmworker Housing Study and Action Plan for Salinas Valley and Pajaro Valley –
Final 2018
Eligible Activities: Construction, rehabilitation, acquisition, and
acquisition/rehabilitation of housing that is occupationally-restricted to
farmworkers, including purchasing and improving land, purchasing household
furnishings, and paying construction loan interest.145 Housing activities may be
financed in urban, suburban, or rural areas, as long there is a demonstrated
need.
Eligible Applicants: Associations of farmworkers and nonprofit organizations,
most state and local government entities, and federally-recognized tribes.
Farmers, associations of farmers, and family farm corporations are also eligible to
receive loans, but not grants. Applicants must demonstrate that they cannot
obtain commercial credit with terms and conditions that would enable them to
house low-income tenants and have sufficient qualifications and experience to
develop and operate the housing.
Loan/Grant Terms and Conditions: Loans made for up to 33 years at a 1 percent
fixed rate. Loan funds are also available for on-farm labor housing funded on a
first-come, first-serve basis. Grants are needs-based and cannot exceed 90
percent of project cost. The total amount of a loan and grant award may not
exceed $3 million.
Current Status: The Section 514/516 Program has been subject to steady cuts
over the past 25 years, as have most Rural Housing Service (RHS) programs.
Since FY 2014, funding has held relatively stable, around $23.9 million in loans
and $8.3 million in grants per annum. The expectation, however, is that funding
in Fiscal Year 2018 will be reduced. In 2016, RHS made nine awards for rental
housing projects in four states, six of them for $18 million in California ($3 million
each). Funds will be used to develop 361 units in Woodland, Bakersfield, Ukiah,
McFarland, Greenfield, and Calexico.
While the great majority of Section 514/516 projects in the U.S. are employer-
owned and -managed and located on-farm, the great majority of units are
owned and operated by nonprofit organizations and located off-farm,
especially in Western states like California.146 Most off-farm projects receive
Section 521 Rental Assistance (RA), though only about 1 percent of on-farm
projects receive RA, nationwide. California has 118 off-farm projects with 6,825
145 A complete list of eligible activities can be found at 7 CFR 3560.53. 146 See USDA Section 514/516 Farmworker Housing: Existing Stock and Changing Needs, Housing
Assistance Council, Washington, D.C., October 2006, p. 1.
300 | P a g e
Farmworker Housing Study and Action Plan for Salinas Valley and Pajaro Valley –
Final 2018
units and only four on-farm projects with 12 units.147 This supports the observation
that growers, generally, do not want to be in the business of building and
operating housing for their employees, especially when it takes borrowing from
government loan program that come with mandated responsibilities, restrictions,
and oversight. The off-farm units house both year-round, permanent farmworkers
and seasonal, migrant farmworkers and 65 percent of them receive RA.
The Section 514/516 Program has certain restrictions that present challenges for
some developer/operators. The main restriction is that tenants must be
documented citizens or legal residents. In comparison, the mainstay State
farmworker housing program, the Joe Serna, Jr. Farmworker Housing Grant
Program (hereafter referred to as Serna), does not require proof of citizenship or
legal residence.
Another challenge has been the reluctance of Rural Development (RD) to allow
hybrid or blended projects. The overwhelming majority of Section 514/516
projects are 100 percent restricted to farmworkers, but an increasing number of
developer/operators, for financial and other reasons, prefer mixed-occupation
projects. While there is nothing in the Section 514/516 statute requiring exclusive
occupancy by farmworkers, the willingness of state and local RD offices to allow
hybridity has been quite idiosyncratic – supported by some offices and not by
others. The competition in recent years has not allowed applicants to receive full
points unless all units are restricted, even when other financing in the project
does not have such restrictions.
In hybrid projects, a major hurdle has been the level of control RD has wanted to
exercise over the whole property related to rents and budgeted expenses. In
some cases, RD has requested that sponsors have two operating budgets, one
for the Section 514/516 units and one for all others, or split the parcel.148 In one
case where the USDA units were 20 percent of the project, the owner and RD
agreed that the owner could submit modified budgets and reports reflecting
only the Section 514/516 unit revenue and 20 percent of the operating
147 Information provided by USDA Rural Development, California State Office, April 19, 2017. The
four on-farm projects are located in Riverdale, Point Reyes Station, Merced, and Hughson. 148 Generally, the California RD office has been more open to hybrid projects than in other states
over the past 10 years or so. Self-Help Enterprises (Visalia) has developed five hybrid projects and
People’s Self-Help Housing (San Luis Obispo) has developed one. Both organizations report it
took considerable support from RD district office staff and negotiations to convince RD to agree
to these projects.

301 | P a g e
Farmworker Housing Study and Action Plan for Salinas Valley and Pajaro Valley –
Final 2018
expenses.149 The Section 514/516 units are typically “floaters”, meaning the
restrictions are not tied to specific units. Farmworkers can be accommodated in
any of the units or move to another unit in the project when it is vacated if they
need to upsize or downsize as their household size changes.
Pajaro/Salinas Valley Fit: Section 514/516 loans and grants can be used
anywhere in Monterey and Santa Cruz Counties where there is a demonstrated
need for farmworker housing. The average size of projects funded in California
in 2016 was 60 units, although much smaller Section 514/516 projects can be
found in the state.
One advantage of the Section 514 Program for the Pajaro/Salinas Valley
laborshed is that it can make low-interest loans to profit-motivated entities, such
as growers, to build, rehabilitate, acquire, or acquire and rehabilitate small-
scale, on-farm housing. It is the only housing program, federal or state, that
makes loans directly to growers. In areas where no other credit is available with
terms and conditions that could reasonably enable a grower to provide
housing, the loans can be made with interest rate at 1 percent. In areas where
other credit is available, growers may still be able to obtain a Section 514 loan
under some circumstances at an interest rate based on the cost of federal
borrowing. However, as of April 2017, only four of the 122 USDA farm labor
housing projects in California were on on-farm. Section 516 grants for
farmworker housing are only made to nonprofit organizations, public agencies,
and federally-recognized tribes.
A distinct disadvantage of Section 514/516 financing, given the large number of
undocumented workers in the region, is that project sponsors must inquire about
and monitor legal status. Also, the program has strenuous farmworker income
requirements that must be strictly enforced. Sponsors report gut-wrenching
situations where they have had to evict tenants because of changes in legal or
farmworker status. In a diverse economy like Monterey and Santa Cruz
Counties, when other jobs may periodically become available in the
construction, service, tourism, and other sectors, the amount of farm income
may decrease below threshold.150
149 The 68-unit Canyon Creek Apartments developed by People’s Self-Help Housing in Paso
Robles designates 14 units for farmworkers. 150 In one instance reported by the Cabrillo Economic Development Corporation in Ventura
County, a farmworker had to decide between moving from the fields to an office job within the
same agricultural employer and losing his housing or staying in the fields and keeping his home.

302 | P a g e
Farmworker Housing Study and Action Plan for Salinas Valley and Pajaro Valley –
Final 2018
Fortunately, there is strong local public and private nonprofit capacity in the
area to access and use this program. According to RD, in April 2017, there were
10 USDA farm labor housing projects in Monterey County with 506
occupationally-restricted farmworker units and three projects in Santa Cruz
County with 89 units – a total of nearly 600 units in the two counties. Most, with
the exception of 30 migrant units in King City, are year-round housing for
permanent farmworkers.151 The Santa Cruz and Monterey County Housing
Authorities, CHISPA, and EDEN Housing (which took over the South County
Housing rental inventory when it went out of business), all operate farmworker
housing with RD funding. The Corporation for Better Housing received an RD
award of $3 million in July 2016 to build 64 farmworker units in Greenfield.
Section 521 Rural Rental Assistance
Purpose: The Section 521 Rural Rental Assistance Program was created in 1978 to
further reduce the rental payments of low-income households living in USDA-
financed multifamily rental housing, Section 514/516 Farm Labor Housing and
Section 515 Rural Rental Housing, to no more than 30 percent of household
income. Unlike HUD’s Section 8 Housing Choice Voucher Program, USDA Rental
Assistance (RA) is not portable and can only be project-based when the
underlying financing is from the two aforementioned RHS programs.
Governing Authority: Title V of the Housing Act of 1949; Code of Federal
Regulations, 7 CFR 3560-Subpart F.
Eligible Activities: Section 521 RA reduces the rental payment of low- and very
low- income households, the elderly, and persons with disabilities to 30 percent
of adjusted monthly household income. It is targeted to households whose
incomes are so low they cannot even afford the below-market rent or “basic
rent” set in Section 514/516 and Section 515 projects, which is computed based
on the owner’s operating costs.
Eligible Applicants: Generally, requests for RA are initiated by the owners of
Section 514/516- and Section 515-financed rental properties. In some cases,
tenants may petition an owner to make such a request to Rural Development
151 The King City Migrant Center, operated by the Monterey County Housing Authority, is one of
two California Department of Housing and Community Development Office of Migrant Services
migrant housing centers in the Pajaro/Salinas Valley laborshed. The Buena Vista Migrant Center
in Watsonville, operated by the Santa Cruz County Housing Authority, does not have USDA
Section 514/516 funding.
303 | P a g e
Farmworker Housing Study and Action Plan for Salinas Valley and Pajaro Valley –
Final 2018
(RD) and can appeal directly to RD if the owner denies the request. There are
no geographic restrictions when RA is used in connection with a Section 514/516
project.
Loan/Grant Terms and Conditions: RD and the project owner execute a one-
year contact in newly constructed or existing housing in which RD commits to
make payments to the owner on behalf of the tenant that will cover the
difference between the unit basic rent and 30 percent of the household’s
adjusted gross income. The commitment is for a designated number or
percentage of units and may be renewed and increased each year if funds are
available. In other words, the funds are not guaranteed for the life of the
project and are subject to Congressional appropriations. In new projects, 95
percent of assisted tenants must have very low incomes below 50 percent of the
Area Median Income. In existing projects, 75 percent of assisted tenants must
have very low incomes.
Current Status: Like other RHS programs, appropriations for Section 521 Rural
Rental Assistance have declined over the last three decades and there is far
more demand than availability. Funding levels have hovered around $1.4 billion
dollars annually the last several years and increased as a share of total RHS
appropriations as other programs have seen cuts. However, given increased
operating costs, funding levels fall well short of meeting the need to renew
existing rental assistance contracts and execute new contracts. The
expectation is that the program will experience additional cuts in future years,
though less than other RHS programs.
Generally, priority is given to renewals of expiring contracts or as an incentive to
encourage owners of existing projects to remain in the programs rather than
prepay their USDA mortgage or mature out of the mortgage as many will within
the next 5 to 10 years.152 However, of the 361 units awarded Section 514/516
funds in California in 2016, 355 of the units received one-year commitments of
RA.
152 Mortgages on thousands of Section 515 Rural Rental Housing units have been prepaid over
the years in ‘hot’ housing markets in California and other parts of the country and will mature out
of their 50-year mortgages in the coming years. When this occurs, USDA rental subsidies are lost,
rents increase, and tenants are displaced. The overwhelming majority of these projects are
owned by profit-motivated owners, especially in California. While Section 514/516 projects can
also prepay and mature out, most of these are owned by nonprofit organizations and,
consequently, fewer of these have been lost.
304 | P a g e
Farmworker Housing Study and Action Plan for Salinas Valley and Pajaro Valley –
Final 2018
Pajaro/Salinas Valley Fit: Most Section 514/516 farm labor housing units in
California receive additional Section 521 RA, when available, because
farmworker incomes are so low and often seasonal. In fact, new permanent,
year-round farmworker housing in the state typically can support little to no
debt-financing. In a high-cost region like the Central Coast, commitments of RA
will be critical to demonstrate project financial feasibility and cover operating
costs while reducing rents within the payment ability of prospective tenants.
Section 502 Direct Loan/Section 523 Mutual Self-Help Technical
Assistance Grant
Purpose: The Section 502 Direct Loan Program, USDA’s mainstay single-family
home program since 1949, makes loans for home purchase by low- and very
low-income borrowers. Since 1962, it has been the principal loan product for
mutual self-help housing where groups of 10-12 families build their own homes for
the better part of a year under the supervision of a community-based nonprofit
organization, reducing construction costs and earning “sweat equity”. Over
20,000 homes have been built in California using this method. To pay for the
construction supervision and training of self-help participants, organizations
receive grants under the Section 523 Mutual Self-Help Housing Technical
Assistance Grant Program.
Governing Authority: Section 502 Direct Loan – Title V, Section 502 of the Housing
Act of 1949; 42 U.S.C., Chapter 8A, Subchapter III, 1471, et seq. Section 523
Mutual Self-Help Technical Assistance Grant – Title V, Section 523 (b)(1)(A) of the
Housing Act of 1949; 42 U.S.C. 1490(c)(B).
Eligible Activities: Section 502 Direct Loan Program – Build, repair, renovate, or
relocate a home, or purchase and prepare sites, including water and sewage
facilities. Section 523 Mutual Self-Help Technical Assistance Grant Program –
Payment of salaries, rent, and office expenses of participating technical
assistance organizations.
Activities are limited to USDA-defined rural areas.153 While not occupationally-
restricted to farmworkers, in a state like California where so many of the rural
153 In the 2014 Farm Bill, Congress grandfathered in communities with populations up to 35,000 as
of the 2010 U.S. Census. The rural population limit for certain other non-housing programs of RD is
50,000. See http://www.treasurer.ca.gov/ctcac/2016/methodology.pdf for the definition of rural
for purposes of USDA housing programs and the Low-Income Housing Tax Credit Program in
305 | P a g e
Farmworker Housing Study and Action Plan for Salinas Valley and Pajaro Valley –
Final 2018
poor have farmworker backgrounds, a very high percentage of borrowers are
current or former agricultural employees. Some projects in the state have
combined Section 502 Direct Loans with Joe Serna, Jr. Farmworker Housing
Grants to enable very low- and extremely low-income farmworkers to afford the
ongoing debt service costs of owning the homes they built. In a few instances,
the two programs have been combined to enable farmworkers to purchase
contractor-built homes.
Eligible Applicants: Section 502 Direct Loan Program – Generally, low- and very
low-income households that demonstrate repayment ability and, in the case of
mutual self-help, willingness to build their own homes. They must also lack
decent, safe, and sanitary housing, be unable to obtain other credit at
reasonable terms and conditions, agree to be the owner-occupant of the
property on a permanent basis, and be a legal citizen or resident.
Section 523 Mutual Self-Help Housing Technical Assistance Grant – Government-
sponsored nonprofit organizations, private nonprofit organizations, and
federally-recognized tribes.
Loan/Grant Terms and Conditions: The Section 502 note rate is fixed based on
the current market rates at loan approval or closing, whichever is less. The
interest rate actually paid by the individual homeowner can be as low as 1
percent, based on the household’s adjusted gross income. The rate may be
adjusted downward to 1 percent or upward to the note rate depending on
changes in household income. There is a partial recapture of the subsidy upon
sale or non-occupancy.154 The mortgage is amortized over a 33-year period up
to 38 years for very low-income borrowers. The maximum loan amount is subject
to the loan limits set by Rural Development for the county in which the property
is located, as well as the borrower’s repayment ability.
California. Go to https://eligibility.sc.egov.usda.gov/eligibility/welcomeAction.do and type in
the property address to determine eligible locations in Santa Cruz and Monterey Counties. 154 There is no resale deed restriction on Section 502 Direct loans that limits when and who the
borrower can sell to. However, there is a subsidy recapture mechanism. Generally, the amount
of recapture due is the lesser of either the amount of the subsidy received or the portion of value
appreciation subject to recapture, which is computed by taking the current market value less
the original amount of prior liens and subordinated affordable housing products, the balance to
be paid off on the Section 502 loan, and reasonable settlement costs.

306 | P a g e
Farmworker Housing Study and Action Plan for Salinas Valley and Pajaro Valley –
Final 2018
When coupled with mutual self-help, the Section 502 loan pays for the
construction costs and is later converted to a long-term mortgage upon
possession of the home, with the household’s sweat equity effectively serving in
lieu of a down payment. In addition to costs incurred during the construction
phase, the loan is used to pay the nonprofit organization back for its cost of
purchasing and preparing the land.
With respect to Section 523, grant sizes are limited by the amounts available per
state and projected production. Each applicant or existing grantee proposes its
own budget and number of units to be built. The regulations, generally, cap the
allowed technical assistance cost per unit at 15 percent of the appraised value
of the completed home.
Current Status: Both the Section 502 Direct Loan Program and Section 523
Mutual Self-Help Housing Technical Assistance Grant Program have enjoyed
bipartisan support over many decades because of their “boot-straps”
philosophy. The Obama Administration proposed for several years to zero out
the Section 523 Program, but the funds were preserved by Congress. In FY 2017,
Congress appropriated $1 billion for Section 502 Direct and $30 million for
Section 523, both slightly up from FY 2016. The programs, however, will likely
experience cuts in future budgets. In recent decades, successive
administrations have sought to reduce the Direct Loan program in favor of the
Guaranteed Program, which is less costly to the federal government but serves a
higher-income population.155
In the past five years, 887 Section 502 self-help loans have been approved in
California for a total of $133.4 million. On average, RD approves about $25
million per year in self-help loans for the current group of 10 active Section 523
mutual self-help housing grantees in the state. RD’s priority is to mostly approve
renewals of existing Section 523 grantees. The largest grant in California is for $6
million to produce 215 units.
Pajaro/Salinas Valley Fit: There has not been a Section 502 mutual self-help
housing subdivision developed in the area since 2009 when CHISPA completed
the Vineyard Green subdivision in Greenfield. CHISPA attempted to build
155 The Guaranteed Loan Program differs from the Direct Loan Program in that USDA provides a
90 percent loan note guarantee to approved conventional lenders to reduce the risk of
extending 100 percent loans to eligible rural homebuyers, instead of making a below-market-
interest-rate loan directly to the buyer. It tends to serve a higher-income population and has not
been used in association with mutual self-help housing in California.

307 | P a g e
Farmworker Housing Study and Action Plan for Salinas Valley and Pajaro Valley –
Final 2018
another subdivision in Greenfield using the self-help housing program, but could
not attract enough interested families to form a cohort of 10.156 South County
Housing, which was also a Section 523 construction supervision grantee working
in nearby Santa Clara and San Benito Counties, went out of business during the
Great Recession.157
That said, nonprofit housing organizations still do operate self-help housing
programs in other expensive coastal counties, like Mendocino, San Luis Obispo,
Santa Barbara, and Ventura Counties. And, in some areas of the state like the
San Joaquin and Coachella Valleys, nonprofits have used the mutual self-help
housing method to enable very low- and extremely low-income farmworkers to
become owners by leveraging Section 502 Direct Loans with Joe Serna, Jr.,
Farmworker Housing Grant Program funds.
The feasibility of Section 502 Direct in the Pajaro and Salinas Valleys will be
dependent on finding a match between the locations of farmworkers proximate
to jobs and the availability, developability, and cost of land in those locations.
The maximum loan limits for the Program in Santa Cruz and Monterey Counties
(effective January 17, 2018) are $543,720 and $492,200, respectively, while the
median price of an existing home listed at the end of 2017, according to Zillow,
was $827,000 and $795,000, respectively.158 This means that buying an existing
home would be way out of the range of a lower-income borrower approved for
a Section 502 direct loan.
By building a new, modest home with a mutual self-help component, it is
possible that homeownership for low-income farmworkers could be achieved
156 According to CHISPA, there are three major reasons why self-help housing has been difficult
to administer in Monterey County. For one, younger couples have smaller families and are not
as willing to put in the hours on weekends away from their children to build their own homes as
previous generations of self-helpers. Smaller family size also means that there is not an older
child who can take care of the younger children when the parents are building. Secondly, there
is not enough subsidy as there once was to make it worthwhile for a family to build. Third, some
families are hesitant to participate because there is a perception that they will not get the full
benefits of homeownership for a long time due to the deed restrictions. Alternatively, CHISPA
has found that it can package Section 502 Direct loans for purchase of homes built by its
subsidiary construction company with an interest rate of about 3.25 percent and mortgage
payments that are not much higher than if the home were built via self-help. 157 When South County Housing went out of business, Eden Housing in Hayward took possession
of its multifamily housing inventory, including its properties in the Monterey Bay Area. Its Section
523 grant has been transferred to the Community Services Development Corporation in Hollister. 158 See https://www.zillow.com/santa-cruz-county-ca/home-values and
https://www.zillow.com/monterey-county-ca/home-values.

308 | P a g e
Farmworker Housing Study and Action Plan for Salinas Valley and Pajaro Valley –
Final 2018
with a combination of a Section 502 Direct loan and a grant from the Joe Serna,
Jr., Farmworker Housing Grant Program (discussed later). While Section 523
Mutual Self-Help Housing Technical Assistance Grant funding is limited, and
renewals of existing grantees are favored, new grantees have been approved
in recent years in California.
U.S. Department of Housing and Urban Development While the U.S. Department of Housing and Urban Development (HUD) mostly
focuses on the nation’s large and middle-sized urban centers, many of its
programs have assisted rural communities to build, rehabilitate, acquire, and
operate housing for rural low-income households. The Public Housing Program,
Section 8 Program, Section 202/811 Program, Federal Housing Administration,
and many other programs have invested in or stimulated investment by private
parties in rural America. A lesser known program, the Self-Help Homeownership
Opportunity Program or SHOP helps rural organizations acquire and prepare
land for mutual self-help housing.159 We will focus, here, on the two HUD
programs that have most assisted developers of farm labor housing: Community
Development Block Grant and HOME.
Community Development Block Grant Program
Purpose: For more than 40 years, the Community Development Block Grant
(CDBG) Program has been the lifeblood of housing, community, and economic
development in local communities around the country. CDBG was created in
the Housing and Community Development Act of 1974 to consolidate about 20
different HUD categorical programs into one lump sum “block grant” to be
allocated on a formula basis to states, cities, counties, and other units of local
government to meet a large variety of community development needs
principally benefitting low- and moderate-income persons. Activities must meet
one of the following national objectives: benefit low- or moderate-income
persons, prevent or eliminate slums or blight, address community development
needs having a particular urgency because they pose a serious or imminent
threat to the health or welfare of the community.
159 Administered by the Washington, D.C.-based Housing Assistance Council, SHOP has helped
some California self-help housing organizations acquire and prepare land for use with the
Section 502 Direct Loan/Section 523 Mutual Self-Help Housing Technical Assistance Grant
Program, although it is unknown whether any of the units were restricted to farmworkers. The
most recent SHOP grant in California was made to Self-Help Enterprises in June 2017 for 27 units.

309 | P a g e
Farmworker Housing Study and Action Plan for Salinas Valley and Pajaro Valley –
Final 2018
Governing Authority: Federal Authority: Housing and Community Development
Act of 1974, as amended (42 USC 5301, et seq.); Omnibus Budget Reconciliation
Act of 1981, Public Law 97-34, and 24 CFR Part 570, Subpart I. State Authority:
Health and Safety Code Section 50825, et seq.; California Code of Regulations
(Title 25, Section 7050-7126); OMB Uniform Guidance at 2 CFR Part 200 (TPL).
Eligible Activities: Over a 1-, 2-, or 3-year period, not less than 70 percent of
CDBG funds must be used for activities that benefit low- and moderate-income
persons with incomes not exceeding 80 percent of the county median income
adjusted for household size. Funds can be used for programs and projects,
including the acquisition and rehabilitation of affordable housing, but not
generally for new construction. CDBG can also be used for acquisition,
rehabilitation, and new construction of public facilities, infrastructure
improvements in support of housing, provision of public services, such as child
care, health care, and job training, and planning and technical assistance.
Eligible Applicants: Large cities and counties, also known as Entitlement
Communities, receive multi-year commitments of CDBG from HUD on a formula
basis that considers the extent of poverty, population, housing overcrowding,
age of housing, and other metrics. Entitlement Communities consist of central
cities of Metropolitan Statistical Areas (MSAs); metropolitan cities with
populations of at least 50,000; and qualified urban counties with a population of
200,000 or more, excluding the populations of entitlement cities. There Is also a
competitive set-aside for federally-recognized tribes administered by HUD.
Under the Small Cities Program, states receive annual commitments of CDBG for
distribution to cities and counties not qualifying as Entitlement Communities,
typically small cities, rural cities, and non-metropolitan counties. The California
Department of Housing and Community Development (HCD) runs this Program
in California.
Loan/Grant Terms and Conditions: Assistance is in the form of grants made to
local governments that, in turn, use CDBG funds to deliver housing programs
and services, such as making housing rehabilitation and first-time homebuyer
grants or loans to low-income households, and providing housing counseling.
Grants are also made by local governments to nonprofit organizations to build,
rehabilitate, and acquire affordable housing and provide or upgrade housing-
related infrastructure.
310 | P a g e
Farmworker Housing Study and Action Plan for Salinas Valley and Pajaro Valley –
Final 2018
Current Status: Over the past 10 years, Congress has cut the overall
appropriation for CDBG, resulting in a 34 percent grant reduction for HCD to
award to eligible local jurisdictions in California. The Trump Administration, in its
“skinny” budget for FY 2018, proposed to completely eliminate the program.
Congress did not go along, but it is probable further attempts to cut the
program will be made in future budgets.
At the State level, HCD initiated a program redesign process in 2017, effective
for the 2018 Notice of Funding Availability (NOFA) cycle, which will streamline the
Department’s workload to reflect budgetary shortages and address low
expenditure rates by local government grantees and high levels of unspent
program income. One possible change may be limiting the number of jurisdictions
that can apply each year.
Pajaro/Salinas Valley Fit: Several jurisdictions within Santa Cruz and Monterey
Counties are considered non-entitlement and could apply for Small Cities CDBG
funds on a competitive basis from the California Department of Housing and
Community Development to support the construction of new housing or the
acquisition and rehabilitation of existing housing or other structures for
occupancy by farmworkers. CDBG funds can also be used for housing-related
infrastructure, such as sewer and water improvements, as well as public facilities
and services benefiting the area’s farm labor population. Non-entitlement
communities currently eligible to compete in the Small Cities CDBG Program are:
Santa Cruz County, and the Cities of Capitola, Scotts Valley, Carmel-by-the Sea,
King City, Marina, Pacific Grove, and Soledad.160
Entitlement communities, like the City of Santa Cruz, City of Watsonville, City of
Salinas, City of Monterey, and County of Monterey in cooperation with the Cities
of Sand City, Greenfield, and Gonzalez, could also dedicate all or a portion of
their direct CDBG allocations from the U.S. Department of Housing and Urban
Development for farmworker housing.
HOME Investment Partnerships Program
Purpose: Somewhat analogous to the CDBG Program, the HOME Investment
Partnerships Program was created in 1990 in the Cranston-Gonzalez National
160 See http://hcd.ca.gov/financial-assistance/community-development-block-grant-
program/docs/2015_nofas/appendix-a-non-entitlement-cdbg-lowmod-poverty-need-data-
2015.pdf for a list of all non-entitlement jurisdictions in California.

311 | P a g e
Farmworker Housing Study and Action Plan for Salinas Valley and Pajaro Valley –
Final 2018
Affordable Housing Act to provide block grants of federal funds on a formula
basis directly to states, cities, counties, and other units of local government for a
variety of housing projects and programs. A portion of these funds is earmarked
for loans to State-certified Community Housing Development Organizations
(CHDOs) for housing projects. Like CDBG, it was intended to be a relatively
flexible source of funding that allows states and local communities to prioritize
and address their most important housing needs. Unlike CDBG, HOME is
designed exclusively to create affordable housing opportunities.
Governing Authority: Federal Authority: Title II of the Cranston-Gonzalez National
Affordable Housing Act; Title 24, Subtitle A, Part 22 of the Federal Code of
Regulations. State Authority: Title 25, Division 1, Chapter 7, Subchapter 17, of the
California Code of Regulations.
Eligible Activities: Generally, building, buying, and/or rehabilitating affordable
housing for rent or homeownership or providing direct tenant-based rental
assistance to low-income people, typically for no more than a 2-year period.
Loans made to CHDOs may be used to acquire, rehabilitate, or build housing for
rent or that is owned, sponsored, or developed by the CHDO. Funds may also
be used to provide direct financial assistance to purchasers of housing
produced by a CHDO with HOME funds. CHDO set-aside funds may not be
used for tenant-based rental assistance or homeowner rehabilitation.
Eligible Applicants: Jurisdictions eligible to receive a direct allocation from HUD
are states and large cities and counties, also known as Participating Jurisdictions
(PJs). States are automatically eligible and receive either a formula allocation
or $3 million, whichever is greater. Local jurisdictions eligible for at least $500,000
under the formula ($335,000 in years when Congress appropriates less than $1.5
billion for HOME) also can receive an allocation. The formula allocation
considers the relative inadequacy of each jurisdiction's housing supply, its
incidence of poverty, its fiscal distress, and other factors. Smaller jurisdictions not
qualifying to receive a formula allocation can join with neighboring jurisdictions
whose combined allocation meets the threshold or compete in the State HOME
Program, which is administered by the California Department of Housing and
Community Development.
At least 15 percent of a PJ’s annual allocation must be set aside for affordable
housing activities to be undertaken by CHDOs. CHDOs are locally-based,
private nonprofit organizations whose purpose is to develop affordable homes.

312 | P a g e
Farmworker Housing Study and Action Plan for Salinas Valley and Pajaro Valley –
Final 2018
Loan/Grant Terms and Conditions: HOME funds are awarded annually as
formula grants to participating jurisdictions (PJs). The program’s flexibility allows
states and local governments to use funds for grants, direct loans, loan
guarantees or other forms of credit enhancements, or rental assistance or
security deposits. HOME's requirement that participating jurisdictions provide a
25 percent match for every HOME dollar helps to mobilize additional community
resources in support of affordable housing.
Current Status: The HOME Program, like the CDBG Program, has faced cuts at
the federal level. In recent years, reports of mismanagement have exposed the
program to calls for reforms and, in some cases, deep cuts and defunding. The
Trump Administration’s “skinny” budget proposal for FY 2018 contemplated
elimination of HOME. While it is unlikely Congress will completely zero out the
program, the program is probably more vulnerable than CDBG and cuts are
anticipated.
Pajaro/Salinas Valley Fit: Given the HOME Program’s singular focus on affordable
housing, its flexibility, and the CHDO set-aside, the program has been used more
frequently than CDBG in developing farmworker housing in California. There are
16 State HOME Program-eligible jurisdictions in Santa Cruz and Monterey
Counties, including both counties.
Monterey County Sand City
Monterey County Seaside
Carmel Soledad
Greenfield Santa Cruz County
King City Santa Cruz County
Marina Capitola
Monterey, City of Scotts Valley
Pacific Grove Watsonville
The State of California certified CHDO list (updated November 2017) certifies the
following nonprofit organizations to work in State HOME-eligible jurisdictions
within Santa Cruz and Monterey Counties: CHISPA, Eden Housing, Habitat for
Humanity Monterey Bay, MidPen Housing, and People’s Self-Help Housing. Three
of them are also CHDOs certified by the City of Salinas. Collectively, these
organizations have vast experience, having built, acquired, and rehabilitated
about 25,000 affordable housing units, including using HOME funds from
Participating and Non-Participating Jurisdictions to produce housing layered

313 | P a g e
Farmworker Housing Study and Action Plan for Salinas Valley and Pajaro Valley –
Final 2018
with funding from federal and state programs requiring or advantaging projects
with units occupied by farmworker s.
Federal Home Loan Bank
Affordable Housing Program
Purpose: The Affordable Housing Program (AHP) of the Federal Home Loan Bank
(FHLB) facilitates the development of affordable rental housing and
homeownership opportunities for lower-income households by making
competitive grants available to member banks in each region of the Federal
Home Loan Bank System. Annually, each FHLB is required by law to contribute
10 percent of its net income for the preceding year. Grants to member banks
are, in turn, used to finance their affordable housing initiatives, meet their
community investment goals, and develop lending partnerships with housing
developers and government agencies.
Governing Authority: 12 U.S.C. 1421 et seq., Public Law 72-304 (1932), Federal
Home Loan Bank Act.
Eligible Activities: Finance the construction, rehabilitation, or acquisition of
owner-occupied housing by or for very low-, low-, and moderate-income
households. Finance the construction, rehabilitation, or acquisition of rental
housing in which at least 20 percent of the units are occupied by, and
affordable to, very low-income households.
Eligible Applicants: Each FHL Bank is authorized to operate two AHP programs.
The AHP Competitive Application Program awards grants to bank members on
behalf of a nonprofit sponsor for production of rental or owner-occupied
housing. The AHP Homeownership Set-Aside Grant Program awards grants to
bank members who then provide these funds to households for down payment
or closing cost assistance, rehabilitation assistance, or counseling towards the
purchase or rehabilitation of an owner-occupied home. Applicants proposing
projects in areas designated as ‘rural’ by USDA Rural Development, the Farm
Credit Bureau, state government program guidelines, or other similar sources
can receive 5 points out a 100-point scoring system.
Loan/Grant Terms and Conditions: AHP is awarded to nonprofit developers in
the form of a grant. In 2016, the maximum subsidy amount for the Competitive
Program was $30,000 per unit or 10 percent of the annual competitive AHP

314 | P a g e
Farmworker Housing Study and Action Plan for Salinas Valley and Pajaro Valley –
Final 2018
allocation ($3 million per project). There is a 15-year retention period for
maintaining deed restrictions in rental projects. There is a 5-year retention period
for ownership units. Under certain circumstances, such as when development
costs are less than anticipated or fewer restricted units are produced, members
and project sponsors or owners may be required to repay AHP subsidies
Current Status: Since 1990 through 2015, AHP funds have supported more than
778,000 households, ranging from rental and owner-occupied housing in both
urban and rural areas, to special-needs households, including individuals with
disabilities and the elderly. Banks have awarded over $5.1 billion through AHP,
with more than half of the households supported qualifying as very low-
income.161
A significant number of farmworker housing projects around the state have used
AHP to access no-cost gap financing. In the 2017 round of AHP, the Federal
Home Loan Bank of San Francisco awarded $60,287,700 in grants in California
through 18 member banks. Seventy-seven projects with 5,117 units were
awarded. One project in Monterey County was funded – the 90-unit Moon
Gate Plaza, developed by MidPen Housing. None were funded in Santa Cruz
County. Two farmworker projects were funded, the 68-unit Kendrea Terrace in
McFarland and the 68-unit Villa Hermosa Apartments, Phase II, in Indio.
Pajaro/Salinas Valley Fit: The Affordable Housing Program (AHP) is a tremendous
asset for any farmworker housing project where the goal is to cobble together
as much non-debt financing as possible to support rents that will be within the
payment ability of very low-wage farmworkers. AHP grants have been awarded
to projects in Santa Cruz and Monterey Counties, most recently in 2017, and
successfully used to underwrite farmworker housing projects around the state.
The program works well with any of the funding sources that are typically
deployed to finance farmworker housing production and awards extra points for
projects located in rural areas.
State Housing Funding Resources Most observers agree that the 2017 State legislative session was the most prolific
session for affordable housing finance, land use, and planning in memory,
perhaps ever. Among the 15 bills in the housing package approved by the
161 See http://www.fhlb-of.com/ofweb_userWeb/pageBuilder/affordable-housing-programs-33.
315 | P a g e
Farmworker Housing Study and Action Plan for Salinas Valley and Pajaro Valley –
Final 2018
Legislature and Governor in September 2017 are measures that authorize more
than $5 billion for construction, rehabilitation, and acquisition of affordable
housing over the next five years or more, require local governments to expedite
affordable housing approvals, and restore the ability of local governments to
implement rental inclusionary housing programs.
On the financing front, the two most important bills are SB 2 (Atkins), the Building
Homes and Jobs Act, and SB 3 (Beall), the Veterans and Affordable Housing
Bond Act of 2018:
SB 2 – Building Homes and Jobs Act
After decades of discussion and years of legislative attempts to create a
‘permanent source’ of revenue for affordable housing, the 2017 Legislature was
finally able to achieve the two-thirds vote needed in both houses to pass SB 2.
The funding source is a $75 per document recording fee on real estate
transactions, not including home sales162, up to a maximum of $225 per
transaction. The estimate is that about $250 million will be generated annually.
In year one, starting in 2018, 50 percent of the proceeds must be allocated to
local governments for planning for the streamlining of housing development
projects and 50 percent to the California Department of Housing and
Community Development (HCD) for programs targeting homelessness. In year
two, 70 percent of proceeds will be allocated directly to local governments for
housing activities using the methodology for allocating HUD Community
Development Block Grants (CDBG). Thirty percent will be allocated to HCD and
the California Housing Finance Agency. Twenty percent of the total funds are to
be used for home ownership and 10 percent for farmworker housing, an
estimated $25 million annually.
Most likely, the State-administered funds for farmworker housing will be run
through the Joe Serna, Jr., Farmworker Housing Grant Program, although it is
possible that some funds will be used to upgrade State-owned migrant housing
centers according to HCD. Local governments may also use all or a portion of
the funds they receive directly or through the competitive program for non-
entitlement jurisdictions for farmworker housing. The competitive grant program
162 The language in SB 2 says: “The fee …. shall not be imposed on any real estate instrument,
paper, or notice recorded in connection with a transfer subject to the imposition of a
documentary transfer tax as defined in Section 11911 of the Revenue and Taxation Code or on
any real estate instrument, paper, or notice recorded in connection with a transfer of real
property that is a residential dwelling to an owner-occupier.”
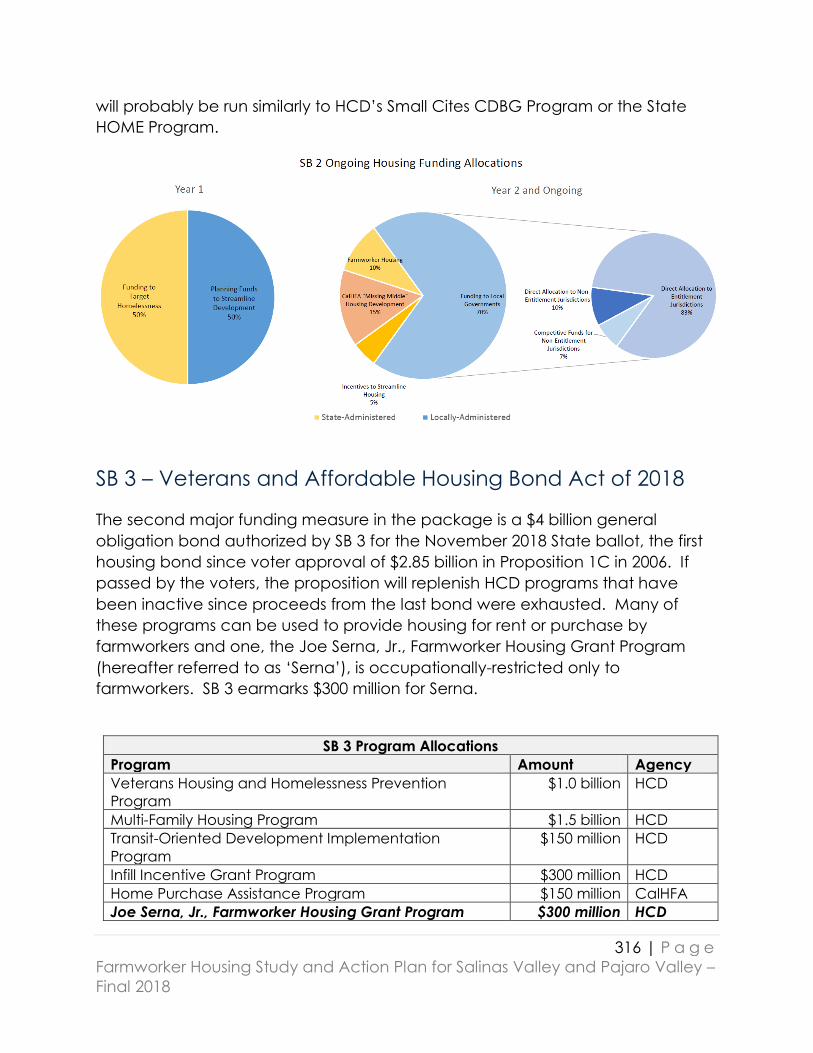
316 | P a g e
Farmworker Housing Study and Action Plan for Salinas Valley and Pajaro Valley –
Final 2018
will probably be run similarly to HCD’s Small Cites CDBG Program or the State
HOME Program.
SB 3 – Veterans and Affordable Housing Bond Act of 2018
The second major funding measure in the package is a $4 billion general
obligation bond authorized by SB 3 for the November 2018 State ballot, the first
housing bond since voter approval of $2.85 billion in Proposition 1C in 2006. If
passed by the voters, the proposition will replenish HCD programs that have
been inactive since proceeds from the last bond were exhausted. Many of
these programs can be used to provide housing for rent or purchase by
farmworkers and one, the Joe Serna, Jr., Farmworker Housing Grant Program
(hereafter referred to as ‘Serna’), is occupationally-restricted only to
farmworkers. SB 3 earmarks $300 million for Serna.
SB 3 Program Allocations
Program Amount Agency
Veterans Housing and Homelessness Prevention
Program
$1.0 billion HCD
Multi-Family Housing Program $1.5 billion HCD
Transit-Oriented Development Implementation
Program
$150 million HCD
Infill Incentive Grant Program $300 million HCD
Home Purchase Assistance Program $150 million CalHFA
Joe Serna, Jr., Farmworker Housing Grant Program $300 million HCD

317 | P a g e
Farmworker Housing Study and Action Plan for Salinas Valley and Pajaro Valley –
Final 2018
Local Housing Trust Fund Matching Grant Program $300 million HCD
CalHome Program $300 million HCD
Total $4 billion
California Department of Housing and Community
Development
The State of California’s commitment to meeting the housing needs of
farmworkers dates back five decades with the creation of the Office of Migrant
Services (OMS) in 1965. Housed in the California Department of Housing and
Community Development (HCD), there are currently 24 OMS housing centers
with 1,894 units for migrant farmworkers. Two of these centers are in our study
area, the King City Migrant Center in King City (79 2-bedroom units) and Buena
Vista Migrant Center in Watsonville (104 beds).
To qualify as a migrant worker, farmworker households must earn a specified
minimum annual income from farm work and have lived outside of a 50-mile
radius from the center for at least three months prior to moving in. Generally,
centers are open for six months (180 days) during peak harvest season – from
April/May to October/November – depending on the cropping patterns in the
area.
Since the 1970s, HCD has also administered a variety of housing assistance
programs that create permanent housing for farmworkers who are year-round
residents of communities in California. These financing programs fall into three
categories: 1) only fund farmworker-restricted units; 2) award extra points for
inclusion of farmworker-restricted units while also targeting other populations; or
3) do not restrict or favor farmworkers, but are used in combination with
programs that do.
Joe Serna, Jr. Farmworker Housing Grant Program (currently
inactive)
Purpose: Since 1978, the Joe Serna, Jr. Farmworker Housing Grant Program has
been California’s mainstay program for financing the new construction,
rehabilitation, and acquisition of year-round rental and owner-occupied
housing for qualified agricultural workers and, to a lesser extent, housing for

318 | P a g e
Farmworker Housing Study and Action Plan for Salinas Valley and Pajaro Valley –
Final 2018
migrant, seasonal workers163, with a priority for lower-income households. Serna
was created initially to help leverage USDA Section 514/516 funding.
Governing Authority: Health and Safety Code Section 50515.5-50517.11
Eligible Activities: Development costs of rental or homeownership housing for
qualified agricultural workers, including land acquisition, site development,
construction, rehabilitation, design services, operating and replacement
reserves, repayment of predevelopment loans, provision of access for the
elderly or disabled, relocation, homeowner counseling, and other reasonable
and necessary costs.
Eligible Applicants: Serna is limited to local government agencies, nonprofit
corporations, cooperative housing corporations, limited partnerships where all
the general partners are nonprofit mutual or public benefit corporations, and
federally-recognized Indian tribes. To reside in a unit designated for occupancy
by a farmworker, at least one householder must earn, or prior to retirement or
disability, have earned a substantial portion of his or her income from qualified
agricultural employment. “Substantial” means at least of half of the household’s
adjusted income.
Loan/Grant Terms and Conditions: Assistance is provided in the form of loans
and grants to support the development or rehabilitation of various types of
projects. Serna funds must be at least 100 percent matched from other
sources.
Homeowner Grants: For rehabilitation or new home construction, monthly
housing costs should not exceed 35 percent of monthly net income. Lien
restrictions are required for 20 years. If the unit is sold to a non-farmworker buyer
before completing the 10th year, the full grant amount must be repaid under
most circumstances. Between the 10th and 20th anniversaries, the grant is
forgiven at a rate of 10 percent per completed year. The grant is fully forgiven
after 20 years. A change in the farmworker status of the borrower after loan
closing does not affect the terms and conditions of the grant.
163 For the California definition of an “agricultural employee”, see Health and Safety Code
Section 50517.5(g)(1) and Labor Code Section 1140.4(b). To conform to a change made in the
definition of an agricultural employee in the Section 514/516 program, AB 702, in 2010,
expanded the State definition to include any person who works on or off the farm in the
processing of any agricultural commodity until it is shipped for distribution.
319 | P a g e
Farmworker Housing Study and Action Plan for Salinas Valley and Pajaro Valley –
Final 2018
Rental Construction Grants or Loans: Lien restrictions for assisted units are
required for 55 years. Loans are only made in conjunction with low-income tax
credit financing.164 For lower-income households, rents are fixed at 30 percent
of 60 percent of the area median income (AMI); for low-income households, 30
percent of 50 percent of AMI; and for extremely low-income households, 30
percent of 30 percent of AMI. In projects where Serna accounts for at least 25
percent of the total development cost, the number of units restricted to
occupancy by agricultural households is, generally, proportional to the percent
of program funds awarded to the total development cost, but no less than 50
percent of the units.
Rental Rehabilitation Grants or Loans: Lien restrictions for assisted units are
required for 55 years. Loans are only made in conjunction with low-income tax
credit financing. Rent levels and the number of dedicated farmworker units are
calculated in the same ways as for rental construction projects.
Current Status: The Joe Serna, Jr. Farmworker Housing Grant Program is the
oldest of the State’s housing assistance programs for production of permanent,
year-round homes for low-income households. Since 1978, it has financed
12,938 units of occupationally-restricted farmworker housing, 19 percent of them
(2,476 units) for homeownership.165 It has made $224 million in grants and loans,
85 percent of which was for multifamily rental housing. Under Propositions 46
and 1C, more than five non-Serna dollars were leveraged for each one dollar of
Serna.
For many years, Serna was continuously appropriated through the State’s
General Fund. In 2002 and, then again, in 2006, the funding vehicle was shifted
to allocations of general obligation bond proceeds generated by Propositions
46 and 1C, respectively.
Proposition 1C funds were exhausted in 2010. Since then, no new Serna
commitments have been made. Efforts from 2014 to 2016 to restore funds
through the budget and other revenue sources were unsuccessful. However, in
the 2017 legislative session, passage of SB 2 (Atkins) could provide about $25
164 State legislation in the mid-1990s authorized HCD to use Serna funds to make loans, typically
low-interest, deferred payment loans, for purposes of increasing basis for Federal and State Low-
Income Housing Tax Credits. The first LIHTC-Serna project in California was the 80-unit Moonridge
I Apartments in Half Moon Bay in San Mateo County, opened in 1999. 165 Numbers provided by Russ Schmunk, former Assistant Deputy Director, Financial Services
Division, California Department of Housing and Community Development, April 19, 2016.

320 | P a g e
Farmworker Housing Study and Action Plan for Salinas Valley and Pajaro Valley –
Final 2018
million annually for the program (10% of annual proceeds). SB 3 (Beall)
authorizes $300 million for the program in the event California voters pass a $4
billion housing bond on the November 2018 ballot. Both bills will generate millions
of additional dollars for programs that can be leveraged with Serna for rental
and homeownership housing.166
Pajaro/Salinas Valley Fit: Should new funding emerge, the Serna program would
be a strong fit for the county. It is a grant that can also be structured as a loan
to leverage Federal and State Low-Income Housing Tax Credits. It is a flexible
source of funding that can be used to cover a large spectrum of development
and rehabilitation costs. It can be used in connection with100 percent
occupationally-restricted housing and hybrid housing. It can be used for
multifamily rental housing and single-family housing for ownership. It is not
limited to rural communities and can be used anywhere in the county where
there is a demonstrable need for farmworker housing. And, it does not require
proof of legal citizenship or residence.
California Self-Help Housing Program (currently inactive)
Purpose: Adopted in 1978, the California Self-Help Housing Program (CSHHP)
makes grants to local government agencies and nonprofit housing corporations
to provide technical assistance to low- and moderate-income families building
their own homes. It was created to supplement the USDA Section 523 Mutual
Self-Help Housing Technical Assistance Grant Program in so-called “rural” self-
help subdivisions, but also to be used in non-USDA subdivisions, known as
“urban” self-help. When used in concert with the Joe Serna, Jr. Farmworker
Housing Grant Program, homes can be built and debt-serviced within the
payment ability of very low- and extremely low-income farmworkers.
Governing Authority: Health and Safety Code Section 50693-50698
Eligible Activities: Training and supervising low- and moderate-income self-help
homebuilders, reducing the mortgage costs to the participant by writing down
the principle or deferring all or a portion of the payments until the housing is sold
166 AB 71 (Chiu) would have increased the State Low-Income Housing Tax Credit Program by
$300 million annually, including $25 million for the Farmworker Housing Tax Credit Assistance
Program, but did not pass. Reportedly, Chiu is planning to reintroduce this idea in the 2018
session.

321 | P a g e
Farmworker Housing Study and Action Plan for Salinas Valley and Pajaro Valley –
Final 2018
or refinanced, and writing down the development costs of the participant’s
home.
Eligible Applicants: Local government agencies and nonprofit housing
corporations.
Loan/Grant Terms and Conditions: Although mortgage and development
assistance are eligible activities, most CSHHP funds have been used to support
technical assistance. Technical assistance grants of $200,000 annually were
awarded to qualified nonprofit self-help housing organizations.
Current Status: For many years, CSHHP was continuously appropriated through
the State’s General Fund. In 2000, CalHome was created to consolidate HCD’s
homeownership programs under one program and CSHHP was subsumed within
the new program. In 2002 and, then again, in 2006, the funding vehicle was
shifted to allocations of general obligation bond proceeds generated by
Propositions 46 and 1C, respectively. CSHHP funds authorized by the two bonds
were used to pay for technical assistance, while CalHome funds were used for
mortgage and development assistance. According to HCD, $17.7 million in
technical assistance grants were awarded via CSHHP and 1,615 units were
assisted.167
Since the funds were exhausted, no new CSHHP commitments have been
made. Efforts from 2014 to 2016 to restore funds through the State budget and
other revenue sources were unsuccessful. Passage of SB 2 in the 2017 legislative
session, on the other hand, could provide some new resources for self-help since
20% of the revenues, an estimated $50 million annually are supposed to be used
for homeownership. SB 3 would provide $300 million for the CalHome Program
(discussed next).
Pajaro/Salinas Valley Fit: In the event funding for the California Self-Help Housing
Program is restored, this program would enable CHISPA, if it decided to restart its
self-help housing program, Habitat for Humanity of the Monterey Bay, and other
nonprofit housing organizations operating in the area to provide technical
assistance to groups of low-income homebuilders. Combined with additional
grant funding from the Joe Serna, Jr. Farmworker Housing Grant Program, single-
family homes could possibly be produced for purchase by low-income
farmworkers.
In the absence of CSHHP, rural areas of the Santa Cruz and Monterey Counties,
such as Castroville, Pajaro, and Corralitos, can still apply for USDA’s Section 523
167 Schmunk, California Department of Housing and Community Development, April 19, 2016.

322 | P a g e
Farmworker Housing Study and Action Plan for Salinas Valley and Pajaro Valley –
Final 2018
Mutual Self-Help Housing Technical Assistance Grant Program in concert with
USDA’s construction and mortgage loan product, the Section 502 Direct Loan
Program. The advantage of CSHHP is that it can be used anywhere in the
county and does not require determination of participants’ citizenship and legal
residence.
CalHome (currently inactive)168
Purpose: Created in 2000, CalHome is the California Department of Housing and
Community Development’s (HCD) omnibus homeownership program. It was
designed to be a flexible funding source supporting a variety of homeownership
programs and projects to enable low- and very low-income households to
become or remain homeowners. It has been used in concert with the Joe
Serna, Jr. Farmworker Housing Grant Program to support production of
occupationally-restricted housing for very low- and extremely low-income
farmworker homebuyers.
Governing Authority: Chapter 6 (commencing with Section 50650) of Part 2 of
Division 31, Health and Safety Code
Eligible Activities: For homeownership projects, predevelopment, site
development, and site acquisition for new construction, rehabilitation and
acquisition/rehabilitation of site-built housing, and rehabilitation, repair, and
replacement of manufactured homes. For homeownership programs, down
payment assistance, mortgage financing, homebuyer counseling, and
technical assistance for self-help.
Eligible Applicants: Local public agencies and nonprofit corporations.
Loan/Grant Terms and Conditions: CalHome is a versatile loan and grant
program that can be used by grantees for a large variety of activities. Grants
can be made to local public agencies and nonprofit developers to make
deferred-payment loans to first-time homebuyers for down payment assistance,
including manufactured homes not on permanent foundations, to existing
homeowners for home rehabilitation, to self-help builders for mortgage and
technical assistance, and for housing counseling.
CalHome also makes direct, forgivable loans to nonprofit developers to assist
development projects involving multiple ownership units, including single-family
168 Although there have been no new funds for CalHOME since voter approval of Proposition 1C
in 2006, HCD is planning to issue a Notice of Fund Availability early in 2018 for about $30 million in
disencumbered CalHOME awards for disaster relief in counties affected by the 2017 fires.

323 | P a g e
Farmworker Housing Study and Action Plan for Salinas Valley and Pajaro Valley –
Final 2018
subdivisions, as well as loans for real property acquisition, site development,
predevelopment, construction period expenses of homeownership
development projects, or permanent financing for mutual housing and
cooperative developments.
Project loans to developers may be forgiven as they convert into deferred
payment loans to individual homeowners.
Assistance to individual households is in the form of deferred-payment loans
payable upon sale or transfer of the homes, when they cease to be owner-
occupied, or at maturity. CalHome does not lend directly to individuals, but
through local government agencies and nonprofit organization intermediaries.
Current Status: In 2002 and, then again, in 2006, CalHome was funded through
sale of general obligation bonds authorized by Propositions 46 and 1C. Both
Propositions 46 and 1C had separate allocations for CalHome and the California
Self-Help Housing Program (CSHHP) ($10 million in each bond), although CSHHP
technical assistance was run through the CalHome Program. The bond
authorized by SB 3 does not distinguish between the CalHome Program and
CSHHP. During the period from 2003 through fund exhaustion in the early 2010s,
the program made $578 million in loans and grants and leveraged $746 million
to assist 20,735 units.
Since then, no new CalHome commitments have been made, with the
exception of special drought-related disaster relief assistance provided in 2016
and additional disaster-relief funds anticipated in 2018. Efforts from 2014 to 2016
to restore funds through the State budget and other revenue sources were
unsuccessful. However, as mentioned previously, passage of SB 2 in 2017 could
generate about $50 million annually for homeownership programs at the state
and local levels. SB 3 earmarks $300 million in one-time funding specifically for
CalHome in addition to $150 million for the California Housing Finance Agency’s
homeownership assistance program and other programs that can potentially
support homeownership activities.
Pajaro/Salinas Valley Fit: The CalHome Program offers local governments and
nonprofit housing organizations invaluable assistance to address a wide array of
homeownership needs through multiple interventions. There is increasing interest
in redressing the great gap in minority homeownership in California exacerbated
by the Great Recession and the decline in the state’s overall homeownership
rate to the lowest level in decades. Should CalHome be reactivated, along with
the Joe Serna, Jr. Farmworker Housing Grant Program, it would greatly enhance
the ability of local nonprofits and governments in Santa Cruz and Monterey

324 | P a g e
Farmworker Housing Study and Action Plan for Salinas Valley and Pajaro Valley –
Final 2018
Counties to achieve affordable homeownership for farmworkers living year-
round in the two counties.
Multifamily Housing Program (currently inactive)
Purpose: The Multifamily Housing Program (MHP), like the CalHome Program,
was created in 1999 to consolidate pre-existing programs and serve as the
California Department of Housing and Community Development’s main
program for assisting with the new construction, rehabilitation, and preservation
of permanent and transitional rental housing for lower-income households. It is
also known as MHP-General. A sub-program of MHP, MHP-Supportive Housing,
provides funding for production of housing units with supportive services for
people who are currently homeless, moving from shelters or transitional housing,
or have a specified disability.
Governing Authority: Chapter 6.7 of Part 2 of Division 31 commencing with
Section 50675 of the Health and Safety Code.
Eligible Activities: New construction, rehabilitation, or acquisition and
rehabilitation of permanent or transitional rental housing, and conversion of
nonresidential structures to rental housing. Projects are not eligible if
construction has commenced as of the application date, or if they are receiving
9 percent Federal Low-Income Housing Tax Credits. Funds can be used only for
permanent financing for post-construction activity and filling financing gaps
resulting from deep income-targeting and affordability. Post-construction
activities include taking out construction loans used to cover project
development costs, the costs of child care, after-school care, and social service
facilities integrally linked to the assisted housing units, real property acquisition,
refinancing to retain affordable rents, necessary on-site and off-site
improvements, reasonable fees and consulting costs, and capitalizing a project
operating reserve.
Eligible Applicants: Local public entities, for-profit and nonprofit corporations,
limited-equity housing cooperatives, individuals, Indian reservations and
Rancherias, and limited partnerships in which an eligible applicant or an affiliate
of an applicant is a general partner. Applicants or their principals must have
successfully developed at least one affordable housing project.
Loan/Grant Terms and Conditions: In the last NOFA issued in November 2015,
loan amounts were limited to $7 million per project. The maximum loan amount
325 | P a g e
Farmworker Housing Study and Action Plan for Salinas Valley and Pajaro Valley –
Final 2018
per "restricted" unit was a function of unit size, location, and affordability level.
Generally, more expensive projects with total development costs in excess of
$400,000 per unit are subject to greater scrutiny and justification. Loans have a
55-year term and bear simple interest at the rate of 3 percent per year. For the
first 30 years, annual interest payments are required in the amount of 0.42
percent of the outstanding principal loan balance. The annual payment
amount for the next 25 years is set by HCD in year 30 and is the minimum
amount necessary to cover HCD's monitoring costs. Unpaid principal and
accrued/deferred interest are due at the end of the loan term.
In the November 2015 NOFA, the geographic distribution of funds for projects in
rural areas was changed from 10 to 20 percent of the total funds made
available to ensure more rural projects were produced. By statute, MHP can
only be used with 4 percent Low-Income Housing Tax Credits. This has
disadvantaged some rural areas where 4 percent credits, unlike 9 percent
credits, do not yield enough equity and there is a lack of other funding
resources to make up the difference and produce units within the payment
ability of the rural poor. Some farmworker housing developers have made this
work, however, by layering in grant funds from the Joe Serna, Jr., Farmworker
Housing Grant Program. Farmworkers are considered a “special-needs”
population169. As a result, farmworker projects are awarded additional points in
competitive scoring.
Current Status: Initially funded via appropriations from the State’s General Fund,
in 2002 and, then again, in 2006, the funding vehicle was shifted to allocations of
general obligation bond proceeds generated by Propositions 46 and 1C,
respectively. Since 2000, MHP-General has made nearly $1.2 billion in loans and
produced 22,162 units.170 MHP-General bond funds leveraged $3.6 billion in
other funding.
After exhaustion of MHP bond funds, and given MHP’s popularity and the great
need, the Legislature and Governor agreed to appropriate $100 million for the
program in the FY 2014/2015 State budget – the last time significant dollars were
provided for housing in the General Fund. The most recent NOFA was published
in November 2015. There is currently no funding; however, funds for the
Multifamily Housing Program could possibly be generated from SB 2 and $1.5
169 See California Code of Regulations, Title 25, Division 1, Chapter 7, Subchapter 4, Section
7301(r). 170 Schmunk, California Department of Housing and Community Development, April 19, 2016.

326 | P a g e
Farmworker Housing Study and Action Plan for Salinas Valley and Pajaro Valley –
Final 2018
billion will be available for MHP if the housing bond authorized in SB 3 is
approved by the voters in November 2018.
Pajaro/Salinas Valley: The Multifamily Housing Program offers project sponsors an
invaluable tool for covering development costs, filling the gaps needed to
produce more deeply-targeted low-income units, and capitalizing operating
reserves. Should MHP be reactivated, the point-scoring preferences the
program gives to projects housing farmworkers as a special-needs population
would favor such development in in Santa Cruz and Monterey Counties. In
addition, MHP has worked very well in combination with the Joe Serna, Jr.,
Farmworker Housing Grant Program. Reactivation of this program would further
enable local developers to produce year-round farmworker housing.
California Tax Credit Allocation Committee The California Tax Credit Allocation Committee (TCAC) has played a major role
in financing farmworker housing both through its administration of the Federal
and State Low-Income Housing Tax Credit Programs (General Tax Credit
Program) and the Farmworker Housing Tax Credit Assistance Program. We will
discuss only those elements of the General Tax Credit Program that facilitate
production of farmworker housing.
Federal and State Low-Income Housing Tax Credit Programs
Purpose: Since authorization in the Federal Tax Reform Act of 1986, the Federal
Low-Income Housing Tax Credit (LIHTC) Program has been the nation’s major
stimulus to production of rental housing for low-income households. It consists of
two different credits, a 9 percent credit and a 4 percent credit. Recognizing the
extremely high cost of developing rental housing in California, the State Low-
Income Housing Tax Credit Program was enacted a year later in 1987 to
augment the Federal credit. The State program does not stand alone, but
instead, supplements the Federal program and mirrors it with certain exceptions.
Governing Authority: Section 252 of Public Law No. 99-514, as amended, and
Chapter 658, California Statutes of 1987, as amended, and Chapter 1138,
California Statutes of 1987, as amended. Internal Revenue Code (“IRC”) Section
42 provides for state administration of the Federal program. California Health
and Safety (H & S) Code Sections 50199.4 through 50199.22, and California
Revenue and Taxation (R & T) Code Sections 12205, 12206, 17057.5, 17058,
23610.4 and 23610.5 establish the California State program and designate the

327 | P a g e
Farmworker Housing Study and Action Plan for Salinas Valley and Pajaro Valley –
Final 2018
California Tax Credit Allocation Committee (“CTCAC”) as the Housing Credit
Agency to administer both programs.
Eligible Activities: Construction, substantial rehabilitation, acquisition and
rehabilitation, and re-syndication of rental housing for low-income households.
Credits are used to generate private equity prior to or during project
construction.
Eligible Applicants: A tax credit investor can be a corporation or syndicator that
connects private investors seeking a strong return on investments with
developers seeking cash for a qualified LIHTC project. Typically, developers do
not have the tax liability that would benefit from the tax credits so they create a
limited partnership to own the property and they take on the role of general
partner with a .01 percent interest in the partnership. The tax credit investor
becomes the 99.99 percent limited partner with proportionate rights to the
project’s profits, losses, depreciation, and tax credits. Developers may be
nonprofit or for-profit corporations, but on order to receive a property tax
exemption, a nonprofit entity must be part of the general partnership and be
performing a specific set of duties in monitoring the partnership.
Loan/Grant Terms and Conditions: The amount of credit for which a project may
be eligible is calculated by determining the eligible basis – subtracting non-
depreciable costs, such as land, permanent financing, rent reserves, marketing
costs, and making other adjustments based on the project’s location and the
percentage of units or square footage that will be restricted to low-income
households. This amount, the qualified basis, is multiplied times the applicable
federal tax credit rate. A project's final (placed-in-service) tax credit allocation is
based on actual project sources and uses of funds, the financing shortfall, and
the applicable federal rate. The project is required to meet its low-income
commitments for a 15-year initial ‘compliance period’ and, in California, a
subsequent ‘extended use period’ up to 55 years.
Current Status: Many farmworker rental housing projects in California have
relied on Federal and State tax credits, often combined with the USDA 514/516
Program, Section 515 Rural Rental Housing Program, and Section 521 Rural
Rental Assistance Program, the HUD HOME and CDBG Programs, HCD Joe
Serna, Jr. Farmworker Housing Grant and Multifamily Housing Programs, and
other funders.

328 | P a g e
Farmworker Housing Study and Action Plan for Salinas Valley and Pajaro Valley –
Final 2018
By statute in California, 20 percent of the 9 percent Federal tax credits for any
calendar year have to be set aside for projects in rural areas as defined in
Health and Safety Code Section 50199.21. The 4 percent credit program does
not have a rural set-aside. All projects located in eligible census tracts defined
by this section must compete in the rural set-aside and are not eligible to
compete in the program’s other geographic set-asides with some exceptions.
Within the rural set-aside, there is a USDA Rural Housing Service (RHS) and HOME
Program apportionment. During each reservation cycle, 14 percent of the rural
set-aside is available for new construction projects which have a funding
commitment from USDA Section 514/516171 or Section 515 or HOME of at least $1
million. All projects meeting the RHS and HOME program apportionment
eligibility requirements must compete under the RHS and HOME program
apportionment. Projects that are unsuccessful under the apportionment may
then compete within the general rural set-aside. A search of the TCAC
website172 reveals, from 2009 to 2017, 46 projects funded in whole or part by the
Section 514/516 Program that were awarded credits or are currently under
review but not yet awarded credits, most of which are 100 percent
occupationally-restricted to farmworkers. The projects have about 2,200
farmworker units, an average of 48 units per property.
Legislative efforts since 2015 to increase the State Low-Income Housing Tax
Credit by $300 million, including $25 million for the Farmworker Housing
Assistance Tax Credit Program (also known as State Farmworker Credits), have
enjoyed broad legislative support. However, the Governor has opposed any
new tax credits not offset by an equivalent revenue increase.
Effective in 2018, TCAC is implementing a new strategy of incentivizing siting of 9
percent family projects in ‘high-opportunity’ census tracts in order to further fair
housing goals and increase residential integration. Sponsors proposing projects
in ‘highest’ or ‘high’ resource tracts will be awarded eight out of 15 amenity
points.173 The methodology used to determine and map areas of opportunity,
171 It is important to note that because Section 514/516 projects are not restricted to rural
communities, some projects with Section 514/516 commitments will not be eligible to compete in
the Rural Set-Aside. Instead, they will have to compete in the general geographic region or
utilize 4 percent credits with tax-exempt bonds. 172http://www.treasurer.ca.gov/serp_new.asp?cx=001779225245372747843%3Acrby_i19opu&cof
=FORID%3A11&ie=UTF-8&q=usda+rhs+514 173 Under the previous scoring scheme before the creation of opportunity areas, applicants
needed to be awarded all 15 amenity points to be competitive. Under the new scheme,
applicants in highest- or high-resource areas will automatically receive eight points and will have
329 | P a g e
Farmworker Housing Study and Action Plan for Salinas Valley and Pajaro Valley –
Final 2018
however, has been strongly challenged by some, especially developers working
in rural areas. This is because large swaths of Rural California, including many
majority-farmworker communities, are deemed ‘low’ opportunity and may be
disadvantaged in a competition with other rural communities. Part of the
problem is that rural census tracts cover large geographic areas and often mask
pockets of opportunity where rural people live and want to continue to live.
At the Federal level, proposals in 2017 to cut the corporate tax rate by more
than half created uncertainty and volatility in the credit markets, with some
institutional investors pulling out of deals or willing to pay much less for credits.
The final deal passed by Republicans and signed by the President in December
2017 reduces the corporate tax rate from 35 percent to 21 percent.
Expectations are that the price corporate investors will now be willing to pay for
tax credits will decline by about 25 percent, resulting in less equity for affordable
rental housing production. Fortunately, a House proposal to eliminate Private
Activity Bonds, which together with 4 percent tax credits help finance over
20,000 units annually in California each year, was eliminated in the final tax bill.
Pajaro/Salinas Valley Fit: The Federal Low-Income Housing Tax Credit Program is
foundational to the construction of almost all affordable housing in the U.S. All
affordable housing developments in the region housing farmworkers as part of
the general low-income population should access either the 9 percent or 4
percent federal tax credits as well as state tax credits.
The exhaustion of the Joe Serna, Jr. Farmworker Housing Grant Program in the
early 2010s made financing occupationally-restricted farmworker housing in
California more challenging. Some experienced developers, nonetheless, were
still able to build farmworker housing by marshaling federal and state tax credits
with other federal, state, and local government sources and non-governmental
sources, most recently the 30-unit George Ortiz Plaza I outside of the City of
Santa Rosa (see case study inprevious section).174 Now, with expectation of the
to be awarded another seven from other amenities to be competitive. While TCAC disagrees,
this may result in awards to projects in highest- or high-resource tracts that are less amenity-rich
than projects in lower-resource tracts. In addition, it will likely be easier for these projects to
reach the maximum amenity points needed compared to projects in lower-resource tracts. 174 George Ortiz Plaza I completed construction and was opened in the summer of 2017. It used
a combination of 4 percent Federal Low-Income Housing Tax Credits, State of California
Farmworker Housing Assistance Tax Credits, a USDA Section 514/516 loan (1 percent for 33
years), a first mortgage from the California Community Reinvestment Corporation (5 percent for
35 years), a small loan from American AgCredit, a County of Sonoma deferred-payment

330 | P a g e
Farmworker Housing Study and Action Plan for Salinas Valley and Pajaro Valley –
Final 2018
first new money for the Serna Program since 2006 from SB 2 and SB 3, there will
be new opportunities for producing farm labor housing in combination with
federal and state tax credits in the Pajaro and Salinas Valleys. Project sponsors
may elect to apply for both Serna and USDA Section 514/516 funds.
Furthermore, the fact that California’s Low-Income Housing Tax Credit Program
has a 20 percent rural set-aside and, within that a 14 percent set-aside for USDA
Rural Housing Service (RHS) projects, increases the prospect of successfully
winning credits for projects that combine Serna and Section 514/516 in rural
communities. In fact, the lower price investors are willing to pay for credits after
the 2017 federal tax legislation may necessitate applying for both programs to
help offset the reduced amount of credit.
In the event a proposed farmworker housing project cannot qualify within the
rural set-aside because the population size of the locality disqualifies it under the
TCAC rural definition, the project can still compete for 9 percent tax credits
within the Central Coast geographic apportionment or less competitive 4
percent tax credits in combination with Section 514/516 financing, as in the
example of George Ortiz Plaza I. In any tax credit scenario, sponsors would
need to evaluate the upside of Section 514/516, which may include a
commitment of Section 521 Rural Rental Assistance, against the downside of
more restrictive occupancy requirements.
One new element to factor in is the impact of TCAC’s Opportunity Maps in
Santa Cruz and Monterey Counties starting in 2018. Whole cities like Watsonville
and Salinas, as well as large parts of the Pajaro and Salinas Valleys show up on
the maps as low-resource areas and will be disadvantaged relative to 9 percent
family projects in areas such as the Monterey Peninsula, the City of Santa Cruz,
and the Santa Cruz Mountains. Generally, however, these are areas where land
prices will be the highest and commutes to agricultural jobs will be the
longest.175 Some parts of the Salinas Valley south of Salinas and north of San Luis
Obispo County do appear as high-resource areas and could present
opportunities for new farmworker housing.
construction loan, and contributions from the Sonoma Grape Growers and California Human
Development Corporation, the project sponsor. 175 The current regulations provide for a 10 percent threshold basis limit increase in highest- and
high-resource tracts to, hopefully, offset some of the additional cost of developing in these
areas. Beginning in 2019, TCAC is contemplating a tiebreaker increase to favor these projects.

331 | P a g e
Farmworker Housing Study and Action Plan for Salinas Valley and Pajaro Valley –
Final 2018
Farmworker Housing Assistance Tax Credit Program
Purpose: To stimulate production of farmworker housing, the California
Legislature in 1996 created the Farmworker Housing Assistance Tax Credit
Program, modelled after a similar program in Oregon. The program was
established as a separate credit from the Federal and State Low-Income
Housing Tax Credit (LIHTC) Programs, which until that time had awarded credits
to few farmworker housing projects. It has a recurring, annual credit allocation
of $500,000.
Governing Authority: Division 31, Part 1, Chapter 3.6, Section 50199.20(c) of the
Health and Safety Code; Paragraph (4) of subdivision (g) of Sections 12206,
17058, and 23610.5 of the Revenue and Taxation Code; Subdivision (h) of
Section 50199.7 of the Health and Safety Code.
Eligible Activities: Construction, substantial rehabilitation, acquisition and
rehabilitation, and re-syndication of rental housing for low-income households.
Credits are used to generate private equity prior to or during project
construction.
Eligible Applicants: A tax credit investor can be a corporation or syndicator that
connects private investors seeking a strong return on investments with
developers seeking cash for a qualified LIHTC project. Developers create a
limited partnership to own the farmworker property and they take on the role of
general partner with a .01 percent interest in the partnership. The tax credit
investor becomes the 99.99 percent limited partner with rights to 99.99 percent
of the available profits, losses, depreciation, and tax credits. Developers may
be nonprofit or for-profit corporations.
Loan/Grant Terms and Conditions: Applicants may request farmworker credits
for eligible farmworker projects in combination with 9 percent or 4 percent
Federal tax credits or they may request farmworker credits alone. If requesting 4
percent credits for use with tax-exempt private activity bond financing and
farmworker credits, applicants may apply over-the-counter on a first-come-first-
serve basis, provided they have a bond allocation from the California Debt Limit
Allocation Committee in excess of 50 percent of the project’s basis. If multiple
applications for farmworker credits are received requesting 9 percent or 4
percent credits, or farmworker credits alone, TCAC Regulation Section 10317(h)
prescribes how applicants will be ranked. Applicants apply in the California Tax
Credit Allocation Committee’s (TCAC) competitive rounds using TCAC
application documents.

332 | P a g e
Farmworker Housing Study and Action Plan for Salinas Valley and Pajaro Valley –
Final 2018
Projects awarded farmworker credits must comply with all TCAC regulatory
requirements. Beyond the ability to receive State farmworker credits without
Federal tax credits, farmworker credit program requirements are identical to all
other Low-Income Housing Tax Credit Program requirements. Farmworker credit
allocation information is located in TCAC Regulation Section 10317.
Current Status: Over the years, legislative changes have been made to improve
the broader LIHTC program. In 2008, State legislation eliminated the Farmworker
Housing Assistance Tax Credit Program as a separate program and, instead,
established an annual set-aside of State Low-Income Housing Tax Credits for
farmworker housing (State Farmworker Credits). Nonetheless, State Farmworker
Credits had been undersubscribed until recently. From 2008 to 2016, only one
project was awarded State Farmworker Credits, the George Ortiz Plaza I project
in 2015. In 2017, however, two projects were awarded credits, Camellia Place II
and Mutual Housing at Spring Lake II.176 There is an estimated $2.7 million in tax
credits available for 2018.177 The annual allocation of $500,000 accrues each
year and is cumulative.
Until passage of AB 571 (E. Garcia) in 2017, several fiscal and policy constraints
had often been cited as contributing to underutilization: 1) the program
required that 100 percent of the units in a project receiving farmworker credits
must be restricted to farmworkers even though these credits typically financed
much less than 100 percent of the units; 2) applicants had found no apparent
competitive advantage to applying for State farmworker credits over State 9
percent program credits in the Rural Set-Aside, which availed higher dollar
amounts and the possibility of receiving a 130 percent basis boost for projects
built in certain locations178; and 3) the 4 percent program has been
undersubscribed in California because it does not provide a deep enough
subsidy to produce the rents that can be afforded by low-wage farmworkers in
176 George Ortiz Plaza I was awarded $2,674,687 in 4 percent Federal tax credits and $668,234 in
State Farmworker Credits. Camellia Place II was awarded $165,557 in 4 percent Federal tax
credits and $668,087 in State Farmworker Credits. Mutual Housing at Spring Lake II was awarded
$806,990 in 9 percent Federal tax credits and $2,689,968 in 9 percent State tax credits. TCAC
decided to exchange the 9 percent State tax credits for an equal amount of State Farmworker
Credits since the project was eligible for both. 177 According to the California Tax Credit Allocation Committee, an estimated $5,047,118 in tax
credits rolled over from FY 2016 to FY 2017 and $2,189,063 of unused credit rolled over from FY
2017 to FY 2018. The annual increment of $500,000 increased the available credit in FY 2018 to
$2,689,063. 178 Under the broader LITHC program in California, applicants can receive a 130 percent boost
over qualified basis by building a project in a Qualified Census Tract (QCT) or Difficult to Develop
Area (DDA).
333 | P a g e
Farmworker Housing Study and Action Plan for Salinas Valley and Pajaro Valley –
Final 2018
rural communities without significant other non-debt financing and rental
assistance.
With AB 571, the occupancy requirement was reduced from 100 percent to 50
percent. The bill also conformed the farmworker credit with the broader LIHTC
program and incentivizes use of 4 percent credits by: 1) allowing these projects
to get both the 130 percent basis boost in a Qualified Census Tract (QCT) or
Difficult to Develop Area (DDA) and the farmworker credit; and 2) making
qualified farmworker housing projects eligible for State LIHTCs of 75 percent
instead of 13 percent of the qualified basis of the building over four years.
Previously, applicants for farmworker credits had to forego both of these
benefits available to developers in the General LIHTC Program.
Pajaro/Salinas Valley Fit: The Farmworker Housing Assistance Tax Credit Program,
now known as the State Farmworker Credit, can be used to produce
farmworker housing in the Pajaro and Salinas Valleys region in combination with
9 percent or 4 percent Low-Income Housing Tax Credits or alone. Within the 9
percent program, the Rural Set-Aside and RHS and HOME apportionment
advantage farmworker projects. Outside of the Rural Set-Aside, farmworker
projects may compete in the Central Coast geographic apportionment,
although competition may be fiercer.
With passage of AB 571, layering on additional State Farmworker Credits has
become more appealing. Although the amount of credit statewide is small, the
bill increased the amount of credits that farmworker tax credit projects can
receive in order to make the credits more valuable and allow greater
leveraging of bonding authority. If located in a QCT/DDA area179, the amount
of federal credit can be increased by an additional 30 percent. Developers
applying for 4 percent federal credits can receive State farmworker credits
worth 75 percent of the project’s eligible basis over four years (previously 13
percent over four years).
Since the 4 percent credit is not capped and is much less competitive than the
9 percent credit, sponsors working in the Pajaro and Salinas Valleys region may
wish to replicate the experience of George Ortiz Plaza I near Santa Rosa and
179 2018 Metropolitan and non-metropolitan Qualified Census Tracts (QCTs) and Difficult
Development Areas (DDAs) in Santa Cruz and Monterey Counties can be viewed at
https://www.huduser.gov/portal/datasets/qct.html#2018.
334 | P a g e
Farmworker Housing Study and Action Plan for Salinas Valley and Pajaro Valley –
Final 2018
layer State Farmworker Credits with USDA Section 514/516, Serna, and 4 percent
credits.
Affordable Housing and Sustainable Communities Program
Purpose: Established in 2014, the Affordable Housing and Sustainable
Communities (AHSC) Program was created to help implement the State’s
overall climate investment efforts to reduce greenhouse gas emissions (GHG) as
mandated in 2006 by Assembly Bill 32, California’s landmark climate change
mitigation strategy.
Funded by the Greenhouse Gas Reduction Fund (GGRF) of the state’s Cap and
Trade Program, AHSC is designed to reduce GHG by funding projects that
encourage low-carbon transportation mode shifts measured by reductions in
vehicle miles travelled (VMT), from fewer and shorter auto trips. It recognizes that
production of affordable housing for lower-income households near transit and
services is an important way to reduce vehicular use. The GGRF is capitalized by
proceeds from auctions of carbon emission permits to large industries. AHSC is
allocated 20 percent of the proceeds. It is administered by the Strategic Growth
Council (SGC) and implemented by the California Department of Housing and
Community Development (HCD)
Governing Authority: Division 44, Part 1 of the Public Resources Code (PRC)
(commencing with Section 75200).
Eligible Activities: Affordable Housing Development (AHD) and Housing-Related
Infrastructure (HRI) for new construction or substantial rehabilitation of affordable
housing. At least 50 percent of AHSC funds must be for affordable housing and
10 percent of AHSC is targeted to projects in rural communities. Other eligible
uses include Sustainable Transportation Infrastructure (STI), Transportation-
Related Amenities (TRA), and Eligible Program Costs (PGM), such as Active
Transportation Programs and Transit Ridership Programs. Funds cannot be used
for parking.
Eligible Applicants: Cities, counties, and subdivisions of cities and counties, such
as a public housing authority, redevelopment successor agency, transit agency
or transit operator, Regional Transportation Planning Agency (RTPA), local
Transportation Commission, Congestion Management Agency, Joint Powers
Authority (JPA), school district, facilities district; University/Community College
District; an affordable housing developer or program operator; or a federally-
recognized American Indian Tribe.
335 | P a g e
Farmworker Housing Study and Action Plan for Salinas Valley and Pajaro Valley –
Final 2018
Loan/Grant Terms and Conditions: The maximum AHSC Program loan or grant
award, or combination thereof, is $20 million with a minimum award of at least
$1 million. Loan terms are based on HCD’s Multifamily Housing (MHP) Program
financing as set forth in 25 CCR 7308. For affordable housing developments not
receiving 9 percent Low-Income Housing Tax Credits, $80,000 per restricted unit
may be added to the base amount for loan limit calculation purposes. AHSC
also relies on HCD’s Uniform Multifamily Regulations (UMRs). Loans are based on
a 30-year amortization schedule.180
Homeowner Grants: For homeownership affordable housing developments,
program assistance is made available to facilitate sales to qualified first-time
homebuyers. The total first-time homebuyer grant amount is $50,000 per
restricted unit.181
Rental Rehabilitation/Construction Grants or Loans: The total Housing-Related
Infrastructure Capital Project grant amount is $35,000 per residential unit in the
proposed affordable housing development and $50,000 per restricted unit.182
Current Status: The Affordable Housing and Sustainable Communities program
released a NOFA for the third round of funding in the fall 2017. The application
process is extensive and relatively complicated – applicants are encouraged to
begin planning and forming partnerships between housing and transportation
developers early on. Technical assistance is available through the State for
projects located within or benefiting a CalEnviroScreen-designated
Disadvantaged Community (DAC)183 or other low-income community as
defined by AB 1550 (Gomez)184.
AHSC is one of several California Climate Investment programs funded by Cap
and Trade auction proceeds, which are held quarterly. Auctions in 2016 and
the early part of 2017 resulted in far less funding than originally projected and
caused speculation regarding the future stability of the program. However,
following resolution of a pending court case and passage of AB 398 (E-Garcia)
in July 2017 extending the Cap and Trade regime until 2030, auction proceeds
have increased.
180 For more information, see page 14 of the 2017 Draft Guidelines. 181 For more information, see page 15 of the 2017 Draft Guidelines. 182 For more information, see page 14-15 of the 2017 Draft Guidelines. 183 See https://oehha.ca.gov/calenviroscreen/report/calenviroscreen-30. 184 AB 1550 was passed by the Legislature in 2017 to increase the percent of funds for projects
located in disadvantaged communities from 10 to 25 percent and require an additional 10
percent or more of funds for investments in low-income communities and households outside of
DACs. See https://leginfo.legislature.ca.gov/faces/billNavClient.xhtml?bill_id=201520160AB1550.
336 | P a g e
Farmworker Housing Study and Action Plan for Salinas Valley and Pajaro Valley –
Final 2018
Eligible projects are submitted under three project types based on the level of
transit available in the project area, or whether the project is considered rural
under Section 50199.21 of the Health and Safety Code.185 Transit-Oriented-
Development (TOD) projects are defined by High-Quality Transit with service
every 15 minutes by rail or dedicated bus rapid transit. Interconnectivity Projects
(ICP) cannot be served by High- Quality Transit, but must meet qualifying transit
requirements. Rural Innovation Project Area (RIPA) projects are held to the
same standards as ICP, but must be located within rural areas. All projects must
be within a ½ mile of a transit stop or station and within proximity to jobs, schools,
grocery stores, and other resources. Funds can be used to develop or extend
transit service and create flexible transit, such as vanpools.
Pajaro/Salinas Valley Fit: Watsonville, Castroville, and Salinas all contain areas of
Disadvantaged Communities or DACs. TOD and ICP Projects located in these
regions would be more competitive under the AHSC program. Additionally,
there may be some other low-income communities as defined by AB 1550 that
would also be eligible for this set-aside, which would increase the region’s
overall competitiveness. Furthermore, the DAC/AB1550 identification also
qualifies project applicants in these areas for State-provided technical
assistance.
Watsonville, Castroville, Chualar, Gonzales, Las Lomas, Salinas, San Lucas, and
Soledad qualify as TCAC/AHSC rural and would be eligible to compete under
the RIPA set-aside. It is also possible that King City and Greenfield would qualify
as well. In these cases, the DAC or AB1550 community status may help in
prioritizing SGC/HCD’s ultimate selection of the project in the case of a tie but
would not actually bear weight on the competitiveness of the project, as the
RIPA set-aside operates separately from the DAC set-aside. Although SGC and
HCD are bound by the results of the scoring process, these State agencies do
their best to make sure that awarded projects are equitably distributed across
geographic regions. Because the central coast – and specifically the Pajaro
and Salinas Valleys region -- have not been awarded projects in past rounds of
AHSC, it is likely that SGC and HCD would work especially closely with project
applicants from this region to help ensure their success in the program.
185 To determine rural eligibility, see
http://www.treasurer.ca.gov/ctcac/2016/methodology.pdf https://leginfo.legislature.ca.gov/faces/billNavClient.xhtml?bill_id=201520160AB1550.
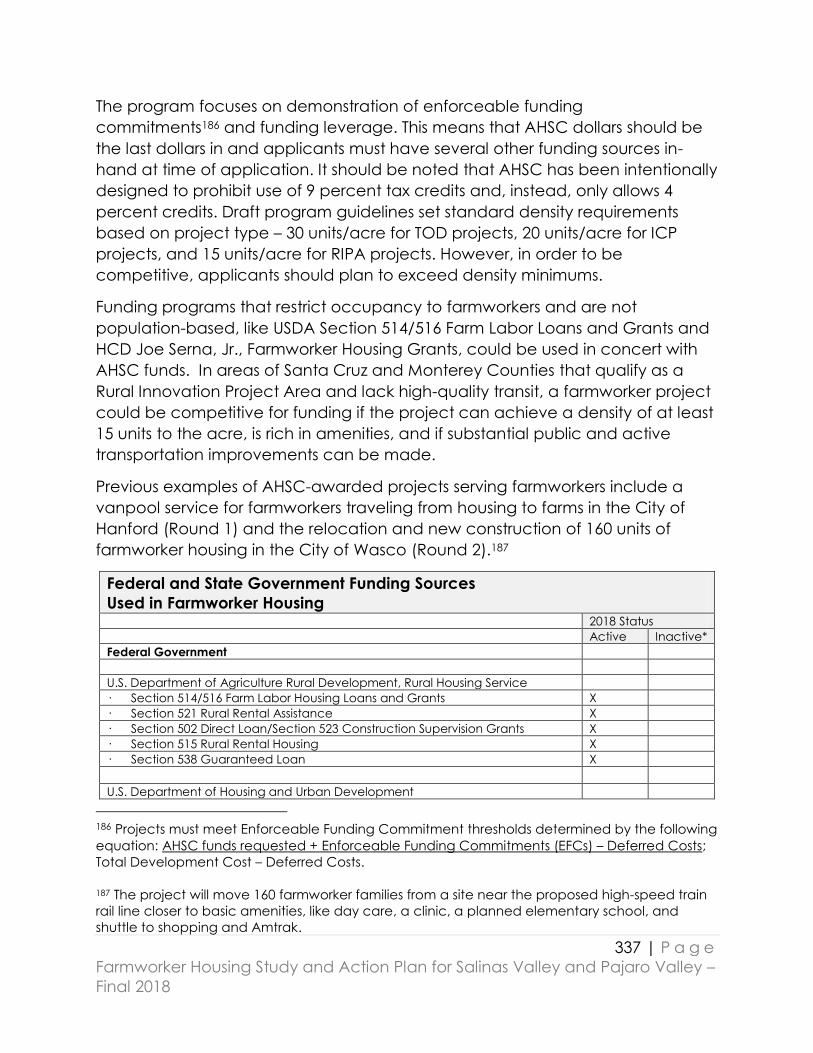
337 | P a g e
Farmworker Housing Study and Action Plan for Salinas Valley and Pajaro Valley –
Final 2018
The program focuses on demonstration of enforceable funding
commitments186 and funding leverage. This means that AHSC dollars should be
the last dollars in and applicants must have several other funding sources in-
hand at time of application. It should be noted that AHSC has been intentionally
designed to prohibit use of 9 percent tax credits and, instead, only allows 4
percent credits. Draft program guidelines set standard density requirements
based on project type – 30 units/acre for TOD projects, 20 units/acre for ICP
projects, and 15 units/acre for RIPA projects. However, in order to be
competitive, applicants should plan to exceed density minimums.
Funding programs that restrict occupancy to farmworkers and are not
population-based, like USDA Section 514/516 Farm Labor Loans and Grants and
HCD Joe Serna, Jr., Farmworker Housing Grants, could be used in concert with
AHSC funds. In areas of Santa Cruz and Monterey Counties that qualify as a
Rural Innovation Project Area and lack high-quality transit, a farmworker project
could be competitive for funding if the project can achieve a density of at least
15 units to the acre, is rich in amenities, and if substantial public and active
transportation improvements can be made.
Previous examples of AHSC-awarded projects serving farmworkers include a
vanpool service for farmworkers traveling from housing to farms in the City of
Hanford (Round 1) and the relocation and new construction of 160 units of
farmworker housing in the City of Wasco (Round 2).187
Federal and State Government Funding Sources
Used in Farmworker Housing 2018 Status
Active Inactive*
Federal Government
U.S. Department of Agriculture Rural Development, Rural Housing Service
· Section 514/516 Farm Labor Housing Loans and Grants X
· Section 521 Rural Rental Assistance X
· Section 502 Direct Loan/Section 523 Construction Supervision Grants X
· Section 515 Rural Rental Housing X
· Section 538 Guaranteed Loan X
U.S. Department of Housing and Urban Development
186 Projects must meet Enforceable Funding Commitment thresholds determined by the following
equation: AHSC funds requested + Enforceable Funding Commitments (EFCs) – Deferred Costs;
Total Development Cost – Deferred Costs.
187 The project will move 160 farmworker families from a site near the proposed high-speed train
rail line closer to basic amenities, like day care, a clinic, a planned elementary school, and
shuttle to shopping and Amtrak.
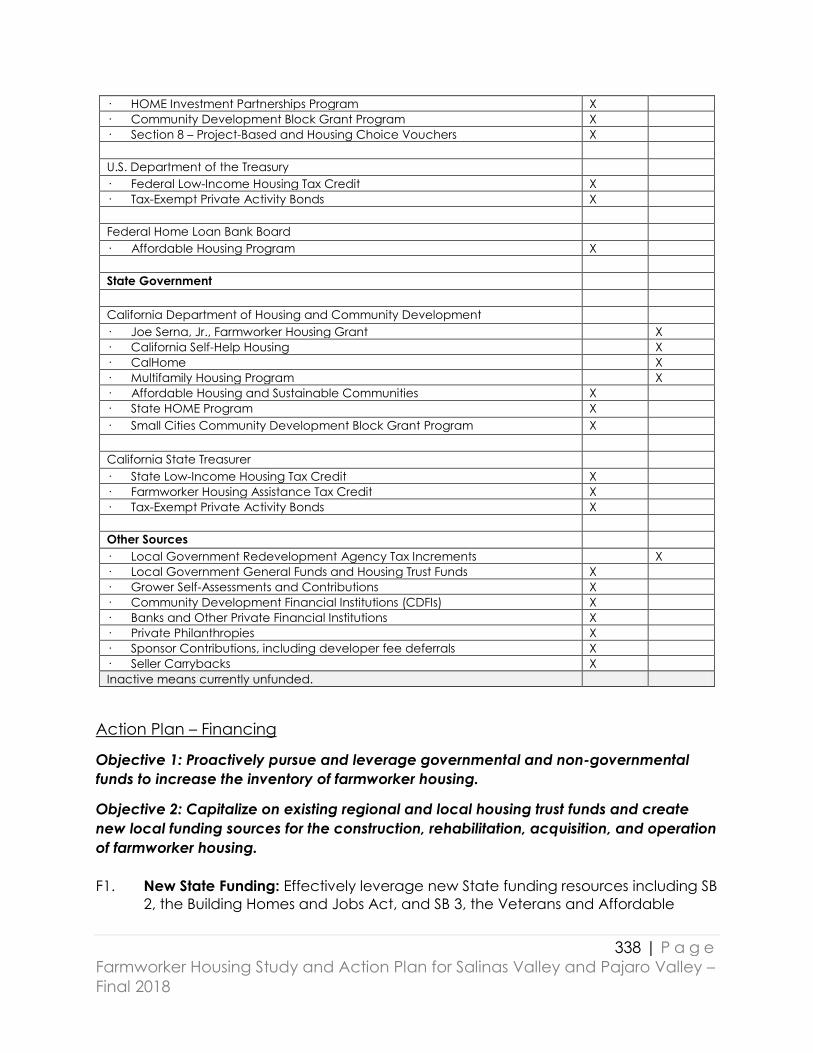
338 | P a g e
Farmworker Housing Study and Action Plan for Salinas Valley and Pajaro Valley –
Final 2018
· HOME Investment Partnerships Program X
· Community Development Block Grant Program X
· Section 8 – Project-Based and Housing Choice Vouchers X
U.S. Department of the Treasury · Federal Low-Income Housing Tax Credit X
· Tax-Exempt Private Activity Bonds X
Federal Home Loan Bank Board · Affordable Housing Program X
State Government California Department of Housing and Community Development · Joe Serna, Jr., Farmworker Housing Grant X
· California Self-Help Housing X
· CalHome X
· Multifamily Housing Program X
· Affordable Housing and Sustainable Communities X
· State HOME Program X · Small Cities Community Development Block Grant Program X California State Treasurer · State Low-Income Housing Tax Credit X
· Farmworker Housing Assistance Tax Credit X
· Tax-Exempt Private Activity Bonds X
Other Sources · Local Government Redevelopment Agency Tax Increments X
· Local Government General Funds and Housing Trust Funds X
· Grower Self-Assessments and Contributions X
· Community Development Financial Institutions (CDFIs) X
· Banks and Other Private Financial Institutions X
· Private Philanthropies X
· Sponsor Contributions, including developer fee deferrals X
· Seller Carrybacks X
Inactive means currently unfunded.
Action Plan – Financing
Objective 1: Proactively pursue and leverage governmental and non-governmental
funds to increase the inventory of farmworker housing.
Objective 2: Capitalize on existing regional and local housing trust funds and create
new local funding sources for the construction, rehabilitation, acquisition, and operation
of farmworker housing.
F1. New State Funding: Effectively leverage new State funding resources including SB
2, the Building Homes and Jobs Act, and SB 3, the Veterans and Affordable

339 | P a g e
Farmworker Housing Study and Action Plan for Salinas Valley and Pajaro Valley –
Final 2018
Housing Bond Act of 2018, if approved by voters in November 2018, to finance
new permanent, affordable farmworker housing.
F2. Expedite SB 2 funds: Advocate that the California Department of Housing and
Community Development (HCD) expedite processing of SB 2 funding and
develop reasonable program guidelines to facilitate development of affordable
farmworker housing.
F3. State Bond: Outreach to local residents and advocate for the passage of the
Veterans and Affordable Housing Bond in November 2018 as a source for
affordable farmworker housing for the Region.
F4. Santa Cruz County Bond: Continue collaboration among Santa Cruz County
stakeholders to include a local housing bond measure on the ballot in November
2018 and effectively campaign for its passage.
F5. Monterey County Bond: Continue efforts among Monterey County stakeholders
to initiate a local housing bond for the November 2020 election.
F6. Ag Business Funding: Facilitate the creation of alternative funding mechanisms
by convening agricultural representatives interested in sharing resources to build
and operate farmworker housing both for year-round, permanent and
seasonable, migrant housing. Best practice includes the Napa self-assessment of
wine grape growers.
F7. Inclusionary Housing: Update and strengthen local Inclusionary Housing
Programs as a mechanism to provide additional affordable housing units that
could be targeted for farmworkers.
F8. Linkage Fees: Explore the development of Commercial/Industrial Linkage Fee
Programs to ensure there is a jobs-housing balance and/or fit to meet the
affordable housing needs of new employees and local residents.
F9. Loal Funding: Maximize local funding resources to be in the best possible
competitive position to leverage conventional non-local grants, investor equity,
and low-cost financing for production and preservation of farmworker housing.
F10. Competitive Parcels: Pro-actively market parcels within jurisdictions that would
likely be competitive under existing State-administered housing programs, such
as the Federal and State Low-Income Housing Tax Credit Programs.
F11. Local/Federal Funds: Commit federal pass-through funds, such as Community
Development Block Grant and Home Investment Partnership grants, to the
production and preservation of farmworker housing.

340 | P a g e
Farmworker Housing Study and Action Plan for Salinas Valley and Pajaro Valley –
Final 2018
F12. Parcel Taxes: Explore Parcel Taxes for affordable housing (including farmworker
housing) that would tax land rather than new development.
F13. Transient Occupancy Taxes: Explore an increase to Transient Occupancy Taxes
on hotels, motels, vacation rentals, and other accommodations in the Monterey
Bay Region to support affordable housing for service workers and farmworkers.
F14. Cannabis Taxes: Explore allocating a portion of Cannabis Business Taxes to foster
affordable housing production including funding of planning staff to shepherd
projects through the process.
F15. Federal/State Funds: Aggressively apply for Federal and State housing finance
programs that are occupationally-restricted or advantage farmworker housing,
namely USDA Section 514/516 Farm Labor Housing coupled with USDA Section
521 Rural Rental Assistance and California Joe Serna, Jr., Farmworker Housing
Grant, State Farmworker Housing Tax Credit, and Multifamily Housing Program.
F16. Support USDA Programs: Advocate for the continuation and expansion of USDA
Section 514/516 Farm Labor Housing Program and USDA Section 523 Rural Rental
Assistance Program.
F17. USDA Funds: Educate affordable housing providers about successful strategies to
couple USDA Section 523 Rural Rental Assistance and USDA Section 514/516
Farm Labor Housing Programs to help fund affordable farmworker housing.
F18. USDA Regulations: Reform the USDA Section 514/516 Farm Labor Housing loans
and grants to allow projects that include both farmworker and non-farmworker
units. Best practices include the Nuevo Amanecer Apartments in Pajaro and
Azahar Place Apartments in Ventura.
F19. Mutual Self-Help: Reintroduce the Mutual Self-Help Housing method of sweat
equity and owner-building of single-family homes under the supervision of local
nonprofit housing organizations using a combination of USDA Rural Development
Section 502 Direct Loan and Section 523 Technical Assistance Grants with State
Joe Serna, Jr., Farmworker Housing Grant Program funds to produce affordable
homeownership opportunities for farmworkers.
341 | P a g e
Farmworker Housing Study and Action Plan for Salinas Valley and Pajaro Valley –
Final 2018
Farmworker Housing Demand and Regional
Organizational Capacity
Executive Summary
California’s Housing Crisis is felt deeply among farmworkers, who overwhelmingly
live in overcrowded housing conditions and pay rents that far exceed 30
percent of their income. Recent housing legislation and a pending bond vote in
California will increase resources and facilitate the construction of additional
affordable housing units in the State. The question remains, however, if these
changes will be enough to meet the growing need for farmworker housing in
the region.
The capacity assessment of the existing providers of affordable housing in the
Salinas Pajaro Valley study area considered the following:
an approximation of demand for the permanent affordable farmworker
housing units needed in the region to alleviate current conditions of
critical overcrowding now and into the future,
a summation of the farmworker housing gap, and
a review of the organizations that are currently active in developing and
managing affordable housing in the region and the ability of those
organizations to fill that gap.
A demand model was created to calculate the total housing units needed of all
types, based on target People Per Dwelling (PPD), and total permanent
affordable farmworker housing based on current rate that farmworkers access
subsidized housing. Key findings of the demand model were:
An additional 45,560 units of farmworker housing are needed to alleviate
critical overcrowding in farmworker households that are occupied at 7.00
PPD to the average PPD of 3.23 in Monterey County and the average PPD
2.60 in Santa Cruz County.

342 | P a g e
Farmworker Housing Study and Action Plan for Salinas Valley and Pajaro Valley –
Final 2018
A total of 5,373 units of permanent affordable farmworker housing are
needed to maintain the present “access rate”188 of 7.6 percent of
farmworkers to subsidized housing.
To accommodate future growth, we extrapolated the Low Income and Very
Low-Income housing allocations designated by the Association of Monterey Bay
Area Governments (AMBAG) in the Regional Housing Needs Allocation (RHNA)
plan and found that:
When the present “access rate” of 7.6 percent applied to the RHNA
allocation of 2,438 units of future need for the study are, we calculated
that 177 units will need to be accessed by farmworkers to maintain the
current rate of access.
To calculate the housing gap for affordable rental housing gap, we surveyed
the existing affordable farmworker housing stock and compared it with the
results of the demand model as follows:
Adding 5,372 of current demand and 177 units of future demand yields an
overall demand for affordable farmworker housing of 5,549 units.
Accounting for 1,244 units currently in the regional inventory the housing
gap for affordable farmworker rental housing gap was found to be 4,305.
It should be noted that the numbers presented are intended to provide a
“range” of supply and demand. Additional factors could increase or decrease
the findings.
Determining the capacity of the regional housing development and
management organizations (non-profit, for-profit, and housing authorities) to
address the housing gap for affordable farmworker housing we found that:
An assessment of the regional housing development organizations,
currently active in the region, structure, development experience, units
under management, staffing, and budget reveal that there is the
knowledge and expertise to address the housing gap for affordable
farmworker housing,
188 Calculated by the research team based on survey results. Number does not account for
existing stock and demand for home ownership. As stated previously, 11% of farmworkers are
home owners.

343 | P a g e
Farmworker Housing Study and Action Plan for Salinas Valley and Pajaro Valley –
Final 2018
However, projecting the number of units that these organizations, and
others, can reasonably develop over the next ten years based on
historical rates of development and in anticipation of increased funding
and reduction of development barriers, we calculated that an additional
930 units could possibly be constructed, far short of the 4,305 units
necessary.
The non-profit, for-profit, and housing authorities examined all possess the
experience, flexibility, and expertise to continue to build affordable housing units
for farmworkers. However, as discussed in other sections of the report, project
feasibility is constrained by adequate availability of land, cost of land, cost of
construction, funding resources, and governmental regulations. The ability to
address the housing gap is not solely dependent upon the capacity of the local
organizations but required significant improvement in the conditions that restrict
the development of affordable housing.
Introduction
California’s Housing Crisis is felt deeply among farmworkers who overwhelmingly
live in overcrowded housing conditions and pay rents that far exceed 30
percent of their income. Recent housing legislation and a pending bond vote in
California will increase resources and facilitate the construction of additional
affordable housing units in the State. The question remains, however, if these
changes will be enough to meet the growing need for farmworker housing in
the region.
In this report the demand model for permanent affordable farmworker housing
units needed is presented with an assessment of the existing providers of this
type of housing currently active in the region. Permanent farmworker housing
can be defined as housing restricted to those defined as agricultural workers in
the region.
Each year, the California Department of Housing and Community
Development (HCD) provides a memorandum on State Income Limits.
These limits are used, among other things, to determine which household
income meets eligibility requirements for affordable housing programs.
Income limit categories include:
Extremely Low-Income Households (ELI), those earning less than 30% of the
County Median Income;
344 | P a g e
Farmworker Housing Study and Action Plan for Salinas Valley and Pajaro Valley –
Final 2018
Very Low-Income Households (VLI), those earning between 30% and 50% of the
County Median Income;
Low-Income Households (LI), those earning between 50% and 80% of the County
Median Income;
Moderate-Income Households (MI), those earning between 80% and 120% of the
County Median Income.
In 2017, the Area Median Income (AMI) for Monterey County was $68,700 and
$87,000 for Santa Cruz County. Data collected by the Salinas Pajaro Agricultural
Workers Housing Survey (SPAWHS) finds the median hourly wage for farmworkers
is $12.79 per hour – a median income of about $25,000 – if an individual is
employed year around. However, according to the SPAWHS the average
farmworker was employed for 7.5 month and would earn approximately$15,000
during that timeframe.
The State Income Limits published by HCD in June of 2017 indicate that for a
family of four the income limits for VLI were $40,700 for Monterey County and for
Santa Cruz County they were $50,400. This leaves even households with two full-
time farmworkers189 somewhat the 50% upper limit of Very Low-Income
Households. These numbers indicate that a large majority of farmworker
households meet income eligibility requirements for affordable housing either
Extremely Low, Very Low, or Low-Income with the majority being Very-Low
Income Households. For the purposes of assessing housing need the assumption
was made that all farmworker households would qualify for some form of
subsidized housing.
Based on projected growth over an eight-year planning period, HCD calculates
the number of additional housing units each region will need to produce, called
a Regional Housing Needs Assessment. MPOs are then responsible for allocating
the portion of the Assessment that each participating jurisdiction is responsible
for producing – which is called the Regional Housing Needs Allocation (RHNA)
Plan.
AMBAG’s 2014-2023 RHNA Plan allocates a total of 4,155 units of Very Low and
Low-Income housing to Monterey and Santa Cruz Counties -- 2,941 units and
1,214 units respectively.190 Table 45: RHNA for Very Low and Low-Income Housing
Units by Location illustrates how these numbers are allocated across the
communities in the Salinas- Pajaro Valley study area. Within the specific study
189 According to SPAWHS data the median of months worked was approximately 7.5 months. 190 Regional Housing Needs Allocation Plan: 2014-2023. Page 15.
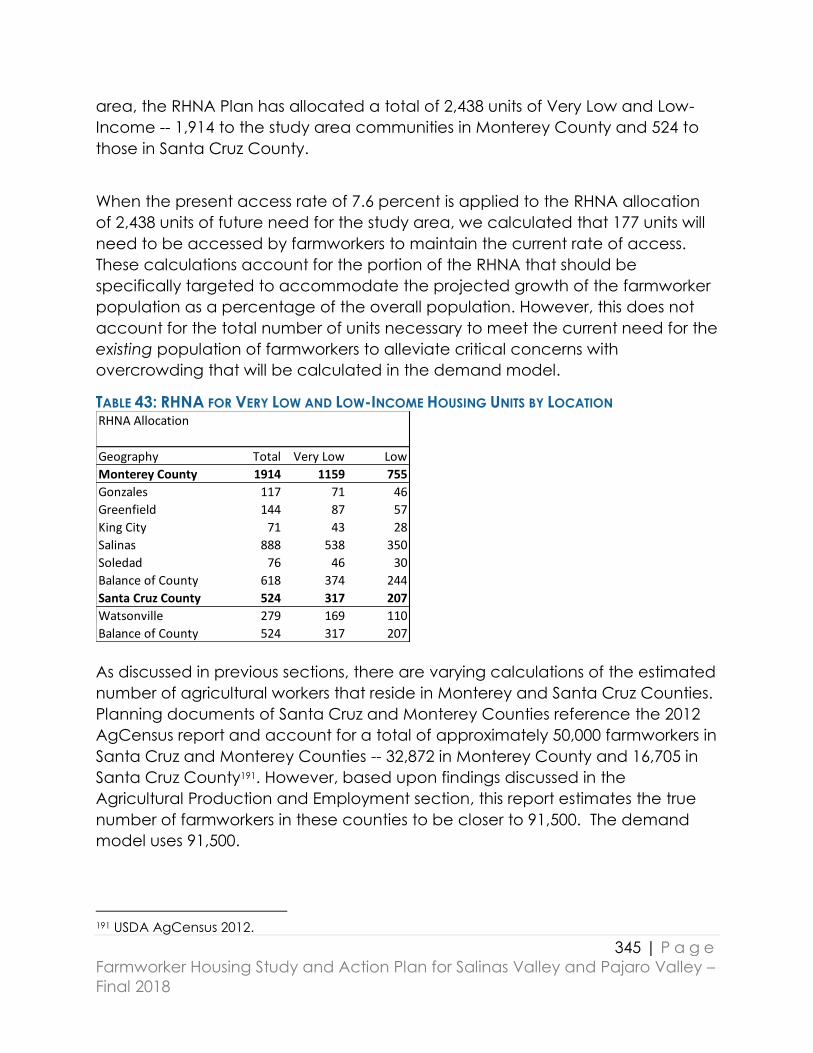
345 | P a g e
Farmworker Housing Study and Action Plan for Salinas Valley and Pajaro Valley –
Final 2018
area, the RHNA Plan has allocated a total of 2,438 units of Very Low and Low-
Income -- 1,914 to the study area communities in Monterey County and 524 to
those in Santa Cruz County.
When the present access rate of 7.6 percent is applied to the RHNA allocation
of 2,438 units of future need for the study area, we calculated that 177 units will
need to be accessed by farmworkers to maintain the current rate of access.
These calculations account for the portion of the RHNA that should be
specifically targeted to accommodate the projected growth of the farmworker
population as a percentage of the overall population. However, this does not
account for the total number of units necessary to meet the current need for the
existing population of farmworkers to alleviate critical concerns with
overcrowding that will be calculated in the demand model.
TABLE 43: RHNA FOR VERY LOW AND LOW-INCOME HOUSING UNITS BY LOCATION
As discussed in previous sections, there are varying calculations of the estimated
number of agricultural workers that reside in Monterey and Santa Cruz Counties.
Planning documents of Santa Cruz and Monterey Counties reference the 2012
AgCensus report and account for a total of approximately 50,000 farmworkers in
Santa Cruz and Monterey Counties -- 32,872 in Monterey County and 16,705 in
Santa Cruz County191. However, based upon findings discussed in the
Agricultural Production and Employment section, this report estimates the true
number of farmworkers in these counties to be closer to 91,500. The demand
model uses 91,500.
191 USDA AgCensus 2012.
RHNA Allocation
Geography Total Very Low Low
Monterey County 1914 1159 755
Gonzales 117 71 46
Greenfield 144 87 57
King City 71 43 28
Salinas 888 538 350
Soledad 76 46 30
Balance of County 618 374 244
Santa Cruz County 524 317 207
Watsonville 279 169 110
Balance of County 524 317 207

346 | P a g e
Farmworker Housing Study and Action Plan for Salinas Valley and Pajaro Valley –
Final 2018
Demand Model Data and Assumptions
Total Farmworker Population including Minor Children
To estimate the total number of affordable farmworker housing units needed, it
is necessary to understand not only how many farmworkers need housing, but
also how many farmworker families – including spouses and children – must also
be considered. The following calculations use data collected in the SPAWHS.
1. Farmworker labor force
As discussed previously, this report accounts for a farmworker population
of 91,500. As nearly 90% of all farmworkers in Monterey and Santa Cruz
Counties reside and work within the study area, the full number of 91,500
will be used. This number will be used here as the most accurate account
of the greatest possible need for which housing may need to be
provided.
2. Household make-up of the farmworker labor force
The SPAWHS study has identified that 50 percent of farmworkers currently
cohabitate with a spouse or partner that is also a farmworker, 23 percent
cohabitate with a non-farmworker spouse, and 27 percent of farmworkers
are single.
According to the SPAWHS, each farmworker has approximately 1.36 minor
children living with them.
In addition to spouses and children, the SPAWHS reports an average of 3.2
additional individuals in the household. These individuals may be parents,
extended family, friends, or coworkers.
3. Percentage of the farmworker labor force that permanently reside in the
region
According to the U.S. Department of Labor’s National Agricultural Workers
Survey (NAWS) 17 percent of all farmworkers in the United States are
classified as migrant, and an estimated 83 percent of farmworkers
classified as permanent. The SPAWHS finds that within the study area, 20
percent identify as migrant workers that “follow the crop.” Of these, 80
percent reported that they would rather have a permanent place of
residence in the region.
347 | P a g e
Farmworker Housing Study and Action Plan for Salinas Valley and Pajaro Valley –
Final 2018
To prepare for the greatest possible housing need, and because most
respondents are either permanent or would prefer to be permanent if
given access to housing options, calculations in this section assume all
housing units produced will be permanent.
Note: While these assumptions are broad they are not meant to indicate that
there is an insurmountable number of units needed but rather to establish a
general sense of the upper limits of the current and future need. The additional
application of adjustments for migrant workers and affordable housing access
rate will temper the total numbers as we move through the extrapolation
exercise.
4. Total number of individuals in farmworker households
Applying the percentage from the survey, this study has identified that 50
percent, or 45,750 farmworkers, are married to another farmworker and 23
percent, or 21,045 live with a non-farmworker spouse for a total of 73
percent, or 66,795 married farmworkers. 27 percent, or 24,705 farmworkers
are single.
We are assuming the high-end goal is to have housing available to all
farmworkers and their families.
Applying the factor of 1.36 minor children per farmworker, the total of
farmworkers and minor children is 124,440.
Adding the 21,045 non-farmworker spouses to this, the total number of
individuals in farmworker households is 236,985 as seen in Table 44:
Estimated Total Population Including Minor Children.

348 | P a g e
Farmworker Housing Study and Action Plan for Salinas Valley and Pajaro Valley –
Final 2018
TABLE 44: ESTIMATED TOTAL POPULATION INCLUDING MINOR CHILDREN
Demand for Permanent Farmworker Housing
To estimate the total number of affordable farmworker housing units needed it is
also necessary to understand the demand – taking into consideration how likely
farmworkers will be to access subsidized affordable housing and how many
individuals will live in each home. Using census data and data collected by the
SPAWHS, estimated demand has been calculated in the following way:
1. Current people per dwelling in farmworker households
The SPAWHS has found that there is an average of 7.00 People Per
Dwelling (PPD) in farmworker households in both Monterey and Santa Cruz
Counties
2. Current people per dwelling in Hispanic households
Most farmworkers in the region are Hispanic/Latino, and often
Hispanic/Latino households consist of more people than the regional
average.
The average Hispanic PPD for Monterey County is 4.38, and 4.33 in Santa
Cruz County192.
3. Regional average of people per dwelling
The average PPD in Monterey County is 3.23 and 2.60 in Santa Cruz
County.
4. Renters vs, Owners
192 It should be noted that the numbers presented in the Hispanic PPD ratio include farmworker households and non-
farmworker households, which may contribute to the increase in Hispanic PPD over the Average PPD.
Total Farmworker (FW) Population Including Minor Children
Married
FW w/FW Spouse 50% 45,750
FW w/Non-FW Spouse 23% 21,045
Single
All Single FW 27% 24,705
Total Married and Single 91,500
Migrant Adjustment 0% -
Permanent FW Residents 91,500
Minor Children per FW 1.36 124,440
Non- FW Spouse of FW Adjustment 23% 21,045
Total Including Minor Children 236,985

349 | P a g e
Farmworker Housing Study and Action Plan for Salinas Valley and Pajaro Valley –
Final 2018
According to SPAWHS, approximately 11 percent of farmworkers are
homeowners and 89 percent are renters.
TABLE 45: RANGE OF HOUSING DEMAND IN EACH COUNTY
Demand for Permanent Affordable Subsidized Farmworker
Housing
As discussed in the previous section, it is assumed that 100 percent of
farmworkers in the region meet income eligibility requirements for affordable
housing. The SPAWHS data indicates that 7.6 percent of farmworker households
currently access subsidized housing.
The SPAWHS survey did not inquire as to why some farmworkers do not access
subsidized housing. However, this estimate may account for those farmworkers
who meet income eligibility requirements, but do not qualify for other reasons or
who have other housing preferences.
This report assumes that the rate that farmworkers access subsidized housing will
remain proportionately the same into the future. To calculate the specific
number of affordable rental units needed, the access rate of 7.6 percent was
applied to the total number of rental units demanded at each PPD level and
provided in Table 46: Farmworker Affordable Housing Demand.
The purpose of the demand model is to calculate the number of permanent
affordable housing units required to bring the current PPD of 7.00 down to the
Farmworker Range of Housing Demand based on People Per Dwelling (PPD)
Demand
Total Number of Individuals 236,985 Renters Owners
Monterey County 156,410 89% 11%
At Current PPD 7.00 22,344 19,886 2,458
At Hispanic PPD 4.38 35,710 31,782 3,928
At Average PPD 3.23 48,424 43,098 5,327
Santa Cruz County 80,575 89% 11%
At Current PPD 7.00 11,511 10,245 1,266
At Hispanic PPD 4.33 18,609 16,562 2,047
At Average PPD 2.60 30,990 27,581 3,409
Both Counties 236,985 89% 11%
At Current PPD 33,855 30,131 3,724
At Hispanic PPD 54,319 48,344 5,975
At Average PPD 79,415 70,679 8,736
Renters vs. Owners

350 | P a g e
Farmworker Housing Study and Action Plan for Salinas Valley and Pajaro Valley –
Final 2018
levels of the Average PPD in each county. While this exercise could have
suggested bringing the current PPD down to the Hispanic PPD of each county it
was intended to create a greater understanding of the upper limits of the
current need.
TABLE 46: FARMWORKER AFFORDABLE HOUSING DEMAND IN MONTEREY AND SANTA CRUZ COUNTY
Current Housing Stock
There are currently 25 permanent farmworker-restricted housing projects in the
Salinas- Pajaro study area, with a total of 1,244 units. These units range in size
from studios to 2 and 3-bedroom apartments, townhomes, and single-family
residences. Additional information about these developments can be found in
the section of this report “Current Housing Stock.”
Most of the permanent farmworker housing units in the study area are owned
and/or managed by the following organizations:
1. Community Housing Improvement Systems and Planning Association –
CHISPA (Non-profit)
2. Eden Housing (Non-profit)
3. MidPen Housing Corporation (Non-profit)
4. Pacific Companies (For-Profit)
5. Housing Authority of Monterey County (HACM)
6. Housing Authority of Santa Cruz County (HASCC)
There are also four co-op projects in the inventory that are self-managed. Each
of the organizations has an in-house property management group, and the
Farmworker Affordable Housing Demand
Monterey County Access Rate Rental
At Current PPD 7.60% 1,511
At Hispanic PPD 7.60% 2,415
At Average PPD 7.60% 3,275
Santa Cruz County
At Current PPD 7.60% 779
At Hispanic PPD 7.60% 1,259
At Average PPD 7.60% 2,096
Both Counties
At Current PPD 7.60% 2,290
At Hispanic PPD 7.60% 3,674
At Average PPD 7.60% 5,372

351 | P a g e
Farmworker Housing Study and Action Plan for Salinas Valley and Pajaro Valley –
Final 2018
housing authorities manage their own properties and contract with third-party
management companies.
Of the 1,244 units currently in the inventory, 939 are in Monterey County and 305
are in Santa Cruz County. Table 47: Permanent Affordable Farmworker Housing
Gap illustrates the housing gap at different level of PPD.
TABLE 47: PERMANENT AFFORDABLE FARMWORKER HOUSING GAP
DEMAND FOR SEASONAL FARMWORKER HOUSING
The analysis of the agricultural workforce showed about 18,300 migrant non-
permanent workers or about twenty percent of the estimated 91,443 total of
agricultural workers. The data indicates a significant increase in the number of
employees of labor contractors and a decrease in direct-hire employees of
growers. The number of H-2A visa workers registered for the study area
increased from 268 in FY 2013 to more than 4,600 in FY 2017. The current
agricultural labor shortage is expected to continue, and therefore an increase in
H-2A (or similar program) and farm labor contractor hiring could potentially
continue beyond present levels.
Table 13, Migrant and Seasonal Housing in Santa Cruz and Monterey Counties,
identifies five facilities with 183 units in public sector sponsored facilities and
1,618 beds in privately sponsored facilities. The three private facilities were
developed within the past three years, to assist employers with complying with
the H-2A program requirement to provide housing for the workers. In the past
few years, employers have rented motels and other buildings to adapt to
dormitory-style accommodations. Even if there is no further increase in the
Affordable Housing Gap
Monterey County Demand Supply Gap
At Current PPD 1,511 939 572
At Hispanic PPD 2,415 939 1,476
At Average PPD 3,275 939 2,336
Santa Cruz County Demand Supply Gap
At Current PPD 779 305 474
At Hispanic PPD 1,259 305 954
At Average PPD 2,096 305 1,791
Both Counties Demand Supply Gap
At Current PPD 2,290 1,244 1,046
At Hispanic PPD 3,674 1,244 2,430
At Average PPD 5,372 1,244 4,128

352 | P a g e
Farmworker Housing Study and Action Plan for Salinas Valley and Pajaro Valley –
Final 2018
annual number of H-2A visa workers in the Salinas-Pajaro Valley, there could be
a need to develop facilities with 2,500 beds as an alternative to motels to
address the demand for accommodations of seasonal housing.
Regional Development Organizational Capacity
Regional Development Organizational Capacity
Developer Capacity, as discussed here, examines key organizational
characteristics — such as mission, history, and number of staff — as well as
number of units under management, development capacity, financing
capacity, and current project pipeline. However, how developers can meet the
housing needs of farmworkers in the region is not solely an issue of organizational
capacity. Revisited here are previous sections of this study addressing other
issues that affect developers’ ability to meet housing need — such as land
availability, site suitability, cost of construction, access to funding, and
regulatory barriers.
Further discussed here is:
The regional development organizations currently active in the area,
The current farmworker housing activity of these organizations,
The current permanent affordable farmworker housing project pipeline,
Capacity of development staff in each organization for new projects
A projection, based on the traditional production cycle of farmworker
housing, estimating the number of units that these organization could, in
theory, construct in the next 10 years.
Regional Development Organizations
The following is a description of the primary not-for-profit and for-profit
organizations that develop and manage affordable housing projects in the
Salinas-Pajaro Valley study area.
The three (3) not-for-profit organizations that are profiled in the Appendix are:
1. Community Housing Improvement Systems and Planning Association
(CHISPA)
a. CHISPA Housing Management, Inc.
b. Central Coast Residential Builders
2. Eden Housing
a. Eden Housing Management, Inc.
353 | P a g e
Farmworker Housing Study and Action Plan for Salinas Valley and Pajaro Valley –
Final 2018
b. Eden Housing Resident Services, Inc.
3. MidPen Housing Corporation
a. MidPen Property Management Corporation
b. MidPen Resident Services Corporation
The organizations listed above manage the existing not-for-profit housing stock
that is restricted in whole, or in part, to farmworkers in the Salinas Pajaro Valley
study area. A list of farmworker restricted properties is provided in Table 12: Year
Round Permanent Farmworker Housing in Santa Cruz and Monterey Counties.
The one (1) for profit organization profiled here is
1. The John Stewart Company
a. The John Stewart Company Property Management
b. The John Stewart Company Resident Services
The John Stewart Company (John Stewart) is a privately-owned company and
financial information on their organization is not public. However, with over 1,000
employees and 20,000 residential units under management, they are an
important participant in the regional affordable housing market. The
organization is very prolific and has a substantive presence in the Monterey and
Santa Cruz Counties managing multiple properties for the Housing Authority of
the County of Monterey. Although the John Stewart does not currently manage
farmworker restricted housing, they are an example of an organization that
could easily, based on their experience with federal and state funding
resources, transition into farmworker housing development and management.
There are also two public housing agencies active in farmworker housing that
will be profiled:
1. Housing Authority of the County of Monterey
2. Housing Authority of the County of Santa Cruz County
The housing authorities operate a total of four (4) properties consisting of 204
units of farmworker housing providing a much-needed resource. The housing
authorities administer the U.S. Housing and Urban Development Section 8
Housing Choice Voucher Program.
Information on the not-for-profit organizations was gathered through interviews
and correspondence with the Executive Directors of the organizations, review of
354 | P a g e
Farmworker Housing Study and Action Plan for Salinas Valley and Pajaro Valley –
Final 2018
the IRS Form 990s where applicable (filed annually by not-for-profit
organizations), and from their websites:
a. CHISPA: www.chispahousing.org
b. Eden Housing: www.edenhousing.org
c. MidPen Housing: www.midpen-housing.org
d. The John Stewart Company: www.jsco.net
There are additional non-profits and for-profit agencies that are active in both
counties: EAH Housing, Mercy Housing, the Pacific Companies, and Alliance
Residential. These additional organizations could decide to engage further in
development in the region if sites and funding were available.
Current Farmworker Housing Activity
CHISPA is currently working on three prospective farmworker housing projects.
The projects, located in the City of Gonzales, City of Castroville, and the East
Garrison of Fort Ord are currently in various stages of predevelopment. The
financing for these projects have been identified and are currently in
deliberation. Additionally, the project programs are still in draft form and may
change as entitlement, feasibility, design, and funding are finalized. In all, a total
of 313 units are under consideration with a portion of those allocated to
farmworkers based upon funding source and feasibility. Not all these projects
may be dedicated to farmworkers and may be available to the general
population.
MidPen Housing does not have any new farmworker housing projects in their
pipeline however they do have projects in their pipeline for general affordable
housing. The organization has proposed a demolition/rehabilitation of a farm
labor camp that was previously rehabilitated into family rental units. The
feasibility is currently restrained by density limitations that constrain the feasibility
of the project which is currently limited to 18 units, MidPen proposed to increase
the building height and density of the project.
Eden Housing acquired their current farmworker housing stock from South
County Housing Corporation in 2015. They are currently working on rehabilitating
their three (3) farmworker housing projects in the region, and future activity in
the Salina-Pajaro Valley study area is conceptual at this point and they have not
formally announced a specific project.

355 | P a g e
Farmworker Housing Study and Action Plan for Salinas Valley and Pajaro Valley –
Final 2018
The Housing Authority of Santa Cruz County does not have any new farmworker
housing projects currently planned. However, they do have an open Request for
Proposals (RFP) for Project Based Housing Vouchers (PBC) that could assist
affordable housing developers to develop additional housing projects.
The Housing Authority of Monterey County does not have any new farmworker
housing projects currently planned but their development entity, Monterey
County Housing Development Corporation, is currently active in developing
affordable housing rental units.
Limits to Capacity
The non-profit and for-profit companies, along with housing authorities all
possess the experience, flexibility, and expertise to continue to build affordable
housing units for farmworkers. It should be noted that the Housing Authority of
Monterey County has a development arm while the Housing Authority of Santa
Cruz County currently does not. However, they are constrained by adequate
availability of land, cost of land, cost of construction, funding resources, and
governmental regulations. Funding resources and government regulations are
discussed in greater detail in other sections.
It is also important to note that each of these organizations also develops other
types of affordable housing in the region that are not restricted to the
farmworker population. Each organization’s resources must be distributed over
their entire portfolio of current and future projects. Although this study focuses on
the need for farmworker-restricted units of permanent affordable housing,
farmworkers qualify for other forms of subsidized housing and these farmworkers
have the same needs as other community members. Investments in senior
housing, permanent supportive housing, family and youth housing, and other
forms of affordable housing models can and should also serve farmworkers in
the region.
Each organization has a robust development staff focused on developing new
projects in the study area plus staff adequate to manage and maintain them,
such as maintenance, management, services, and accounting. Developing
new projects is a complex, time-consuming, and labor-intensive process, with
each project taking three to five years from concept to construction. When new
funding is available, such as that anticipated by SB2/SB3, Development sections
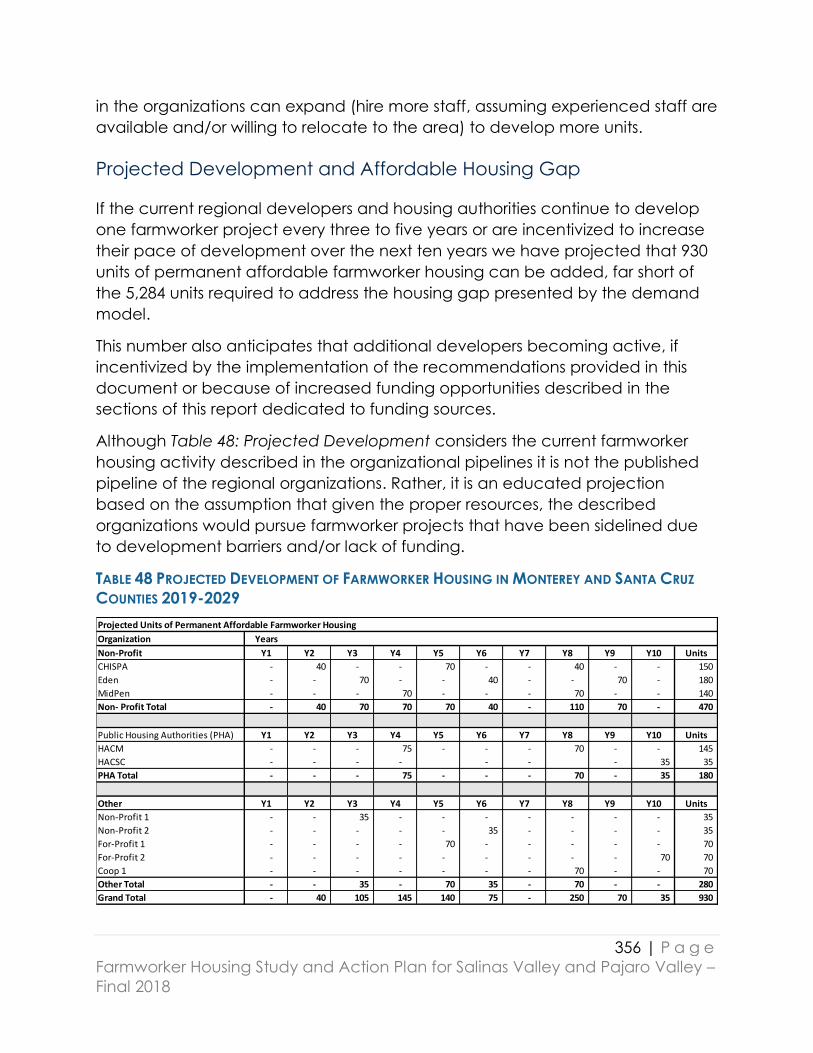
356 | P a g e
Farmworker Housing Study and Action Plan for Salinas Valley and Pajaro Valley –
Final 2018
in the organizations can expand (hire more staff, assuming experienced staff are
available and/or willing to relocate to the area) to develop more units.
Projected Development and Affordable Housing Gap
If the current regional developers and housing authorities continue to develop
one farmworker project every three to five years or are incentivized to increase
their pace of development over the next ten years we have projected that 930
units of permanent affordable farmworker housing can be added, far short of
the 5,284 units required to address the housing gap presented by the demand
model.
This number also anticipates that additional developers becoming active, if
incentivized by the implementation of the recommendations provided in this
document or because of increased funding opportunities described in the
sections of this report dedicated to funding sources.
Although Table 48: Projected Development considers the current farmworker
housing activity described in the organizational pipelines it is not the published
pipeline of the regional organizations. Rather, it is an educated projection
based on the assumption that given the proper resources, the described
organizations would pursue farmworker projects that have been sidelined due
to development barriers and/or lack of funding.
TABLE 48 PROJECTED DEVELOPMENT OF FARMWORKER HOUSING IN MONTEREY AND SANTA CRUZ
COUNTIES 2019-2029
Projected Units of Permanent Affordable Farmworker Housing
Organization Years
Non-Profit Y1 Y2 Y3 Y4 Y5 Y6 Y7 Y8 Y9 Y10 Units
CHISPA - 40 - - 70 - - 40 - - 150
Eden - - 70 - - 40 - - 70 - 180
MidPen - - - 70 - - - 70 - - 140
Non- Profit Total - 40 70 70 70 40 - 110 70 - 470
Public Housing Authorities (PHA) Y1 Y2 Y3 Y4 Y5 Y6 Y7 Y8 Y9 Y10 Units
HACM - - - 75 - - - 70 - - 145
HACSC - - - - - - - 35 35
PHA Total - - - 75 - - - 70 - 35 180
Other Y1 Y2 Y3 Y4 Y5 Y6 Y7 Y8 Y9 Y10 Units
Non-Profit 1 - - 35 - - - - - - - 35
Non-Profit 2 - - - - - 35 - - - - 35
For-Profit 1 - - - - 70 - - - - - 70
For-Profit 2 - - - - - - - - - 70 70
Coop 1 - - - - - - - 70 - - 70
Other Total - - 35 - 70 35 - 70 - - 280
Grand Total - 40 105 145 140 75 - 250 70 35 930
357 | P a g e
Farmworker Housing Study and Action Plan for Salinas Valley and Pajaro Valley –
Final 2018
Conclusion
The demand model presented in this report was designed to provide a regional
analysis of the total number of permanent affordable farmworker housing units
needed to address the substantial overcrowding of farmworker households. The
demographics and living conditions of the farmworker population have been
described in detail in other parts of this report.
However, in the application of that data into the design of the housing demand
model we would like to highlight some substantive results:
We have calculated the total number of individuals in farmworker
households to be 280,173. At an occupancy of 7.00 we estimate
that these households occupy 33,855 units of housing of all types
and tenures.
The demand for rental units at the Current PPD of 7.00, is 30,131. To
move that number to the average Hispanic PPD of both counties
48,344 are required, and to move that number to the average PPD
of both counties 70,679 units are required.
Farmworkers current access subsidized at a rate of 7.6 percent and
applying that rate to the demand for rental units yields a total of
5,372 units of affordable housing demand.
Given the present inventory of 1,244 units the housing gap for
affordable rental units is currently 4,128 units.
Application of 7.6 percent to the RHNA to account for future growth
adds a modest 177 units to account for regional growth through
2023.
The net result is 4,305 units are necessary to meet the current
requirements of 4,128 and the 177 units of future growth.
While there is considerable organizational capacity to develop farmworker
housing in the region there is little expectation that the 4,128 units would be
developed under current conditions. We project that with moderate changes to
development barriers and an increase in funding resources that an additional
930 units could be constructed by existing organizations that are familiar with
the region leaving 3,200 units of demand that would need to be addressed by
other strategies such as Accessory Dwelling Units and agricultural employers
developing housing.
To meet that challenge the region would need to implement many of the
strategies and recommendations that are presented in other chapters of this
report that are focused on funding, leveraging planned investment, and

358 | P a g e
Farmworker Housing Study and Action Plan for Salinas Valley and Pajaro Valley –
Final 2018
reducing barriers to development specific to farmworkerhousing. Additionally,
existing units may be moving out of affordability, and there is still a demand for
market rate housing and home ownership.
This research found that the estimated number of unique individual workers
employed in agriculture in the region during 2016 was 91,433. It is clear from the
primary data collected in the survey phases of this study that farmworker
housing in the Salinas-Pajaro Laborshed needs to be drastically increased.
Farmworker housing in the region is severely crowded. In assessing the needs
based on survey data, an astounding 45,560 additional units of farmworker
housing are needed to alleviate critical overcrowding in farmworker households.
Based upon income levels and housing costs, farmworkers need subsidized
housing. The survey determined that 7.6% of farmworkers currently access
subsidized housing. Just to maintain that 7.6% “access rate,” a total of 5,372 units
of permanent affordable subsidized farmworker housing are needed.
Study data demonstrates that the preponderance of workers are year-round
residents. 75% of those surveyed are married, often living in households with
minor children born in the United States. Although frequently the focus has been
on providing housing for temporary farmworkers, the data is clear that the most
significant need is for permanent farmworker family housing.
While there is new funding in the State of California for affordable housing
including resources specifically targeted to farmworkers, the demand will not be
met with what is currently available. Therefore, this action plan is focused on
what we can collectively do to quickly produce affordable farmworker housing
with a focus on permanent farmworker families.
Goal: Produce 5,300 permanent, affordable farmworker housing units over the
next five years to stabilize the agriculture workforce in the Salinas and Pajaro
Valley Region.

359 | P a g e
Farmworker Housing Study and Action Plan for Salinas Valley and Pajaro Valley –
Final 2018
SOLUTIONS AND ACTION PLAN DRAFT ACTION PLAN – APRIL 2018
Overview
This research found that the estimated number of unique individual workers employed
in agriculture in the region during 2016 was 91,433. It is clear from the primary data
collected in the survey phases of this study that farmworker housing in the Salinas-Pajaro
Laborshed needs to be drastically increased.
Farmworker housing in the region is severely crowded. In assessing the needs based on
survey data, an astounding 33,159 additional units of farmworker housing are needed
to alleviate critical overcrowding in farmworker households.
Based upon income levels and housing costs, farmworkers need subsidized housing.
The survey determined that 7.6% of farmworkers currently access subsidized housing.
Just to maintain that 7.6% “access rate,” a total of 4,393 units of permanent affordable
subsidized farmworker housing are needed.
Study data demonstrates that the preponderance of workers are year-round residents.
75% of those surveyed are married, often living in households with minor children born in
the United States. Although frequently the focus has been on providing housing for
temporary farmworkers, the data is clear that the most significant need is for
permanent farmworker family housing.
While there is new funding in the State of California for affordable housing including
resources specifically targeted to farmworkers, the demand will not be met with what is
currently available. Therefore, this action plan is focused on what we can collectively
do to quickly produce affordable farmworker housing with a focus on permanent
farmworker families.
360 | P a g e
Farmworker Housing Study and Action Plan for Salinas Valley and Pajaro Valley –
Final 2018
Oversight Committee Recommendations
Goal: Produce 3,500 permanent, affordable farmworker housing units over the next
five years to stabilize the agriculture workforce in the Salinas and Pajaro Valley Region.
Housing Types
Objective: Promote alternative farmworker housing tenure and development prototypes
that have worked in Monterey Bay Region, California, and other parts of the nation.
H1. Family Housing Priority: Prioritize the construction of permanent, year-round
housing for farmworker families.
H2. Intergenerational: Facilitate the development of intergenerational farmworker
housing for multiple generations of farmworkers (retirees, working adults, and
children) to create opportunities for mutual self-reliance, such as provision of
childcare and elder care. Best practice includes the Desert Gardens
Apartments in Indio.
H3. Services: Incentivize housing that incorporates wrap-around services to
strengthen families, transfer new skills, and build leadership.
H4. Accessory Units: Facilitate the development of Accessory Dwelling Units (ADUs)
by considering the reduction of ADU impact and permit fees, disseminating
public information, and establishing lender products for ADU new construction
and rehabilitation.
H5. Seasonal: Facilitate private sector development of farmworker housing with
unrestricted funding sources to allow flexibility in providing housing for seasonal,
migrant, or any other farmworker regardless of documentation.
H6. Energy Efficiency: Support housing projects, both new construction and
rehabilitation, which integrate energy efficiency, water conservation, and other
green elements that reduce operational costs to sustain the project over time.
Best practice includes the Mutual Housing at Spring Lake in Woodland.
H7. New Technologies: Educate the local International Code Councils and Building
Officials to streamline the approval of new building technologies, such as
modular construction as alternative to traditional stick-built, which have the
potential to more efficiently and economically scale up housing production.
Best practice includes George Ortiz Plaza I in Santa Rosa.
H8. Emergency Housing: Investigate and pilot the use of innovative emergency
housing types for seasonal, migrant farmworkers such as mobile homes.
361 | P a g e
Farmworker Housing Study and Action Plan for Salinas Valley and Pajaro Valley –
Final 2018
H9. H-2A Worker Lodging: Collaborate with other jurisdictions to develop a model
ordinance for the temporary use of motels/hotels and other structures for H-2A or
other seasonal farmworkers.
H10. Housing Cooperatives: Support the development of new housing cooperatives
or assist residents of existing housing, such as labor camps and mobile home
parks, to convert their housing to limited-equity cooperatives as an affordable
alternative to renting and fee-simple ownership.
H11. Mutual Housing: Support resident-controlled mutual housing and mutual housing
associations, which empower tenants to be leaders and activists in the
governance and operation of their homes.
Suitable Sites
Objective: Collaborate among jurisdictions to identify appropriate locations for
farmworker housing within cities and unincorporated counties to facilitate development
of farmworker housing.
S1. Map Sites: Map appropriate sites for farmworker housing in collaboration with
local jurisdictions in the region and streamline the approval processes whenever
possible.
S2. Zoning: Encourage local jurisdictions to evaluate current General Plan and
zoning based upon housing funding criteria and, when appropriate, re-zone
properties to create additional sites for affordable, farmworker housing.
S3. City-County Agreements: Establish agreements between counties and cities that
allow for contiguous, unincorporated county land to connect to city
infrastructure to facilitate development of farmworker housing.
S4. Agriculture Zoning: Relax restrictions on the residential use of agriculturally-zoned
land in unincorporated county areas that restrict on-farm residential
development.
S5. Overlay Zones: Promote the establishment of Affordable Housing Overlay Zones
in ‘high-opportunity’ areas within Monterey County that include a bundle of
effective and flexible incentives to encourage developers to build affordable
and farmworker housing.
S6. On-farm Housing: Encourage on-farm employee housing.
S7. Ag Land: Incentivize growers with marginal agricultural land contiguous to and
surrounded by urban uses to dedicate, discount, or lease land for farmworker
housing, including no-cost release from Williamson Act contracts.
362 | P a g e
Farmworker Housing Study and Action Plan for Salinas Valley and Pajaro Valley –
Final 2018
S8. Assembling Parcels: Enable property owners with contiguous sites appropriate
for farmworker housing to parcellate the land or create new lot lines to
accommodate larger, more economically feasible projects.
S9. Land Trusts: Encourage existing land trusts or the creation of new land trusts that
build and preserve farmworker housing on land that is leased from the trust and
held in restricted affordability in perpetuity.
S10. Transit Strategies: Support the implementation of appropriate strategies identified
in AMBAG’s regional study of Transportation Alternatives for Rural Areas, such as
expanded vanpools, mobility hub development, public/private partnerships with
Transportation Network Companies, Expanded Express Transit Service, and
Workforce Housing Developments.
S11. Transit: Coordinate with regional transit agencies to provide better access
between housing sites and agricultural workplaces.
Financing
Objective 1: Proactively pursue and leverage governmental and non-governmental
funds to increase the inventory of farmworker housing.
Objective 2: Capitalize on existing regional and local housing trust funds and create
new local funding sources for the construction, rehabilitation, acquisition, and operation
of farmworker housing.
F1. New State Funding: Effectively leverage new State funding resources including SB
2, the Building Homes and Jobs Act, and SB 3, the Veterans and Affordable
Housing Bond Act of 2018, if approved by voters in November 2018, to finance
new permanent, affordable farmworker housing.
F2. Expedite SB 2 Funds: Advocate that the California Department of Housing and
Community Development (HCD) expedite processing of SB 2 funding and
develop reasonable program guidelines to facilitate development of affordable
farmworker housing.
F3. State Bond: Outreach to local residents and advocate for the passage of the
Veterans and Affordable Housing Bond in November 2018 as a source for
affordable farmworker housing for the Region.
F4. Santa Cruz County Bond: Continue collaboration among Santa Cruz County
stakeholders to include a local housing bond measure on the ballot in November
2018 and effectively campaign for its passage.
F5. Monterey County Bond: Continue efforts among Monterey County stakeholders
to initiate a local housing bond for the November 2020 election.
363 | P a g e
Farmworker Housing Study and Action Plan for Salinas Valley and Pajaro Valley –
Final 2018
F6. Ag Business Funding: Facilitate the creation of alternative funding mechanisms
by convening agricultural representatives interested in sharing resources to build
and operate farmworker housing both for year-round, permanent and
seasonable, migrant housing. Best practice includes the Napa self-assessment of
wine grape growers.
F7. Inclusionary Housing: Update and strengthen local Inclusionary Housing
Programs as a mechanism to provide additional affordable housing units that
could be targeted for farmworkers.
F8. Linkage Fees: Explore the development of Commercial/Industrial Linkage Fee
Programs to ensure there is a jobs-housing balance and/or fit to meet the
affordable housing needs of new employees and local residents.
F9. Local Funding: Maximize local funding resources to be in the best possible
competitive position to leverage conventional non-local grants, investor equity,
and low-cost financing for production and preservation of farmworker housing.
F10. Competitive Parcels: Pro-actively market parcels within jurisdictions that would
likely be competitive under existing State-administered housing programs, such
as the Federal and State Low-Income Housing Tax Credit Programs.
F11. Local/Federal Funds: Commit federal pass-through funds, such as Community
Development Block Grant and Home Investment Partnership grants, to the
production and preservation of farmworker housing.
F12. Parcel Taxes: Explore Parcel Taxes for affordable housing (including farmworker
housing) that would tax land rather than new development.
F13. Transient Occupancy Taxes: Explore an increase to Transient Occupancy Taxes
on hotels, motels, vacation rentals, and other accommodations in the Monterey
Bay Region to support affordable housing for service workers and farmworkers.
F14. Cannabis Taxes: Explore allocating a portion of Cannabis Business Taxes to foster
affordable housing production including funding of planning staff to shepherd
projects through the process.
F15. Federal/State Funds: Aggressively apply for Federal and State housing finance
programs that are occupationally-restricted or advantage farmworker housing,
namely USDA Section 514/516 Farm Labor Housing coupled with USDA Section
521 Rural Rental Assistance and California Joe Serna, Jr., Farmworker Housing
Grant, State Farmworker Housing Tax Credit, and Multifamily Housing Program.
F16. Support USDA Programs: Advocate for the continuation and expansion of USDA
Section 514/516 Farm Labor Housing Program and USDA Section 523 Rural Rental
Assistance Program.

364 | P a g e
Farmworker Housing Study and Action Plan for Salinas Valley and Pajaro Valley –
Final 2018
F17. USDA Funds: Educate affordable housing providers about successful strategies to
couple USDA Section 523 Rural Rental Assistance and USDA Section 514/516
Farm Labor Housing Programs to help fund affordable farmworker housing.
F18. USDA Regulations: Reform the USDA Section 514/516 Farm Labor Housing loans
and grants to allow projects that include both farmworker and non-farmworker
units. Best practices include the Nuevo Amanecer Apartments in Pajaro and
Azahar Place Apartments in Ventura.
F19. Mutual Self-Help: Reintroduce the Mutual Self-Help Housing method of sweat
equity and owner-building of single-family homes under the supervision of local
nonprofit housing organizations using a combination of USDA Rural Development
Section 502 Direct Loan and Section 523 Technical Assistance Grants with State
Joe Serna, Jr., Farmworker Housing Grant Program funds to produce affordable
homeownership opportunities for farmworkers.
Regulatory Reform
Objective: Change regulations to remove barriers, streamline processing, and reduce
costs for the development of farmworker housing.
R1. Update Zoning: Promote and fund the update of restrictive and outdated zoning
designations that limit residential densities, height, setbacks, and Floor-Area-
Ratios (FARs), especially in urban cores and corridors, and identify and eliminate
unnecessary or redundant discretionary reviews that cause costly delays and
discourage applicants.
R2. Remove Barriers – Employer-Sponsored Housing: Identify and eliminate barriers
for the development of employer-sponsored housing while ensuring that the
development is built to allow for future conversion to multi-family should the
employer sell the property.
R3. CA Coastal Commission Obstacles: Remove impediments to farmworker housing
within areas subject to the California Coastal Commission through update of
Local Coastal Plans and reform the regulations governing the exemption of
agriculture activities and permits set by the California Coastal Act.
R4. SB 2 Funded Streamlining: Apply for SB 2 funding to update zoning and revise
other regulations to streamline production of farmworker housing and other
housing types.
R5. Priority Processing: Allow for priority processing of by-right, year-round,
permanent farmworker housing projects that meet underlying zoning
requirements.

365 | P a g e
Farmworker Housing Study and Action Plan for Salinas Valley and Pajaro Valley –
Final 2018
R6. Ombudsman Assistance: Fund and designate a point-person or ombudsperson
responsible for shepherding farmworker housing project applications through the
local government approval process and advocating for them. Best practice
includes an ombudsman in San Mateo County for farmworker housing.
R7. Template Plans: Design and develop pre-approved plans and adopt modified
development-by-right for farmworker housing, including dormitory-style, modular,
and multifamily prototypes proposed on agricultural parcels meeting specified
site and zoning criteria in unincorporated areas. Best practice includes a recent
approach adopted in Ventura County.
R8. Development Impact Fees: Encourage local jurisdictions to consider adopting
ordinances that waive development impact fees for affordable farmworker
housing.
R9. Fee Deferral: Support local jurisdictions in establishing development fee deferral
programs for affordable and workforce housing and implement the program
when requested by the developer.
R10. Fees – Smaller Units: Incentivize smaller, less expensive units by charging
developer impact fees based on unit square footage rather than per unit and
reducing minimum net land area per unit requirements.
R11. Parking Requirements: Encourage local jurisdictions to allow for greater flexibility
in the provision of parking for affordable farmworker housing, where appropriate.
R12. Mixed Use Requirements: Provide greater flexibility in the ratio of residential and
commercial space in mixed-use districts or zones to allow for more space that is
residential.
R13. Density Bonus: Educate local jurisdictions about the application of state-density
bonus to facilitate affordable farmworker housing and encourage the
development of an enhanced or super-density bonus where appropriate.
R14. Outreach: Conduct outreach and education workshops to stakeholders and the
public so that potential applicants and local communities better understand the
rules and regulations governing farmworker housing.
R15. Collaboration: Encourage local jurisdictions to proactively collaborate with
affordable housing developers and develop solutions that remove site-specific
land use barriers whenever possible.
R16. Staff Training: Expand training of city and county staff and local elected officials
about State and local land use laws and regulations and foster can-do
collaborative mindset.

366 | P a g e
Farmworker Housing Study and Action Plan for Salinas Valley and Pajaro Valley –
Final 2018
Regional Forum – April 19, 2018
On April 19, 2018, a Regional Forum on the Study results and the draft Action
Plan was held in downtown Salinas, CA at the CSUMB@Salinas City Center. The
Forum was attended by more than 200 people, The consultant team of
California Institute for Regional Studies presented the data from an analysis of
agricultural workers in the region and surveys of 420 farmworkers, 65 employers,
and 32 stakeholders during harvest 2017. The California Coalition for Rural
Housing described their research on best practices in the western US: case
studies, sites, financing strategies, alternative types of housing, and effective
regulatory reforms.
Jennifer Seeger, Assistant Deputy Director of the Division of Financial Assistance,
California Department of Housing and Community Development, spoke about
new state funding from SB 2 and other programs with specific earmarks for
farmworker housing.
Salinas Mayor Joe Gunter opened the Forum and Salianas Council Member
Gloria de la Rosa made closing remarks and introduced Assembly member
Anna Caballero, who made wrap-up comments.
Spanish interpretation was available. The presentations were projected in English
and in Spanish. The Forum schedule and Action Plan were available in Spanish.
In breakout discussion sessions, attendees discussed the 60 potential actions in
the Draft Action Plan in the areas of suitable sites, financing, regulatory reforms,
and housing types. Based on feedback at the Forum, the Action Plan was
revised and was further reviewed by the Oversight Committee at a follow-up
meeting on May 16, 2018. Responsibilities and timeline were identified in the
refined Action Plan discussed by the Oversight Committee.
Forum attendees included the mayors of Watsonville and Gonzales, Monterey
County Supervisor Luis Alejo; staff from the counties of Santa Clara, San Mateo,
Monterey and Santa Cruz; farmers and labor contractors from the region and
Ventura County; members of the Study’s Oversight Committee; surveyors of the
farmworkers; staff from Sacramento’s CA State Office of Monitor Advocate for
farmworkers, farmworker advocates such as the Center for Community
Advocacy; United Way Monterey County staff and board members; US
Department of Agriculture, and Monterey County Agriculture Commissioner.
Forum participants agreed that continuing regional collaboration was key to
implementation of the Action Plan.
A video of the impressions of three of the surveyors who conducted surveys of
farmworkers during the harvest of 2017 was shown at the Forum. Attendees
were invited to record brief videos of their vision for farmworker housing. These

367 | P a g e
Farmworker Housing Study and Action Plan for Salinas Valley and Pajaro Valley –
Final 2018
videos plus recordings of the Forum presentations and report on the breakout
session discussion are posted on Youtube.
The United Way Monterey County and Monterey County Association of Realtors
sponsored the costs of the Forum lunch and refreshments.
Appendix 11 contains copies of the Forum Schedule, the presentations, the
handouts (Executive Summary, Info-graphics, and Action Plan) in English and
Spanish, public comments received, the list of people registered for the Forum,
the comments made at the breakout sessions, and the revised Action Plan.
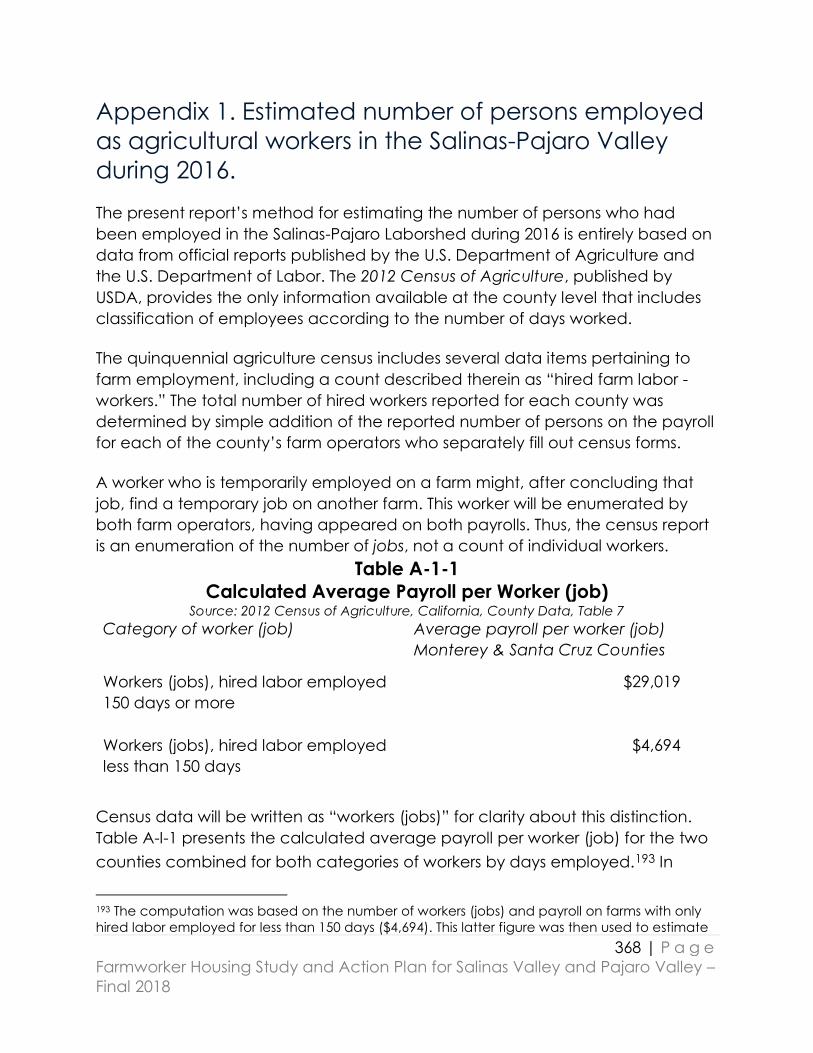
368 | P a g e
Farmworker Housing Study and Action Plan for Salinas Valley and Pajaro Valley –
Final 2018
Appendix 1. Estimated number of persons employed
as agricultural workers in the Salinas-Pajaro Valley
during 2016.
The present report’s method for estimating the number of persons who had
been employed in the Salinas-Pajaro Laborshed during 2016 is entirely based on
data from official reports published by the U.S. Department of Agriculture and
the U.S. Department of Labor. The 2012 Census of Agriculture, published by
USDA, provides the only information available at the county level that includes
classification of employees according to the number of days worked.
The quinquennial agriculture census includes several data items pertaining to
farm employment, including a count described therein as “hired farm labor -
workers.” The total number of hired workers reported for each county was
determined by simple addition of the reported number of persons on the payroll
for each of the county’s farm operators who separately fill out census forms.
A worker who is temporarily employed on a farm might, after concluding that
job, find a temporary job on another farm. This worker will be enumerated by
both farm operators, having appeared on both payrolls. Thus, the census report
is an enumeration of the number of jobs, not a count of individual workers.
Table A-1-1
Calculated Average Payroll per Worker (job) Source: 2012 Census of Agriculture, California, County Data, Table 7
Category of worker (job) Average payroll per worker (job)
Monterey & Santa Cruz Counties
Workers (jobs), hired labor employed
150 days or more
$29,019
Workers (jobs), hired labor employed
less than 150 days
$4,694
Census data will be written as “workers (jobs)” for clarity about this distinction.
Table A-I-1 presents the calculated average payroll per worker (job) for the two
counties combined for both categories of workers by days employed.193 In
193 The computation was based on the number of workers (jobs) and payroll on farms with only
hired labor employed for less than 150 days ($4,694). This latter figure was then used to estimate
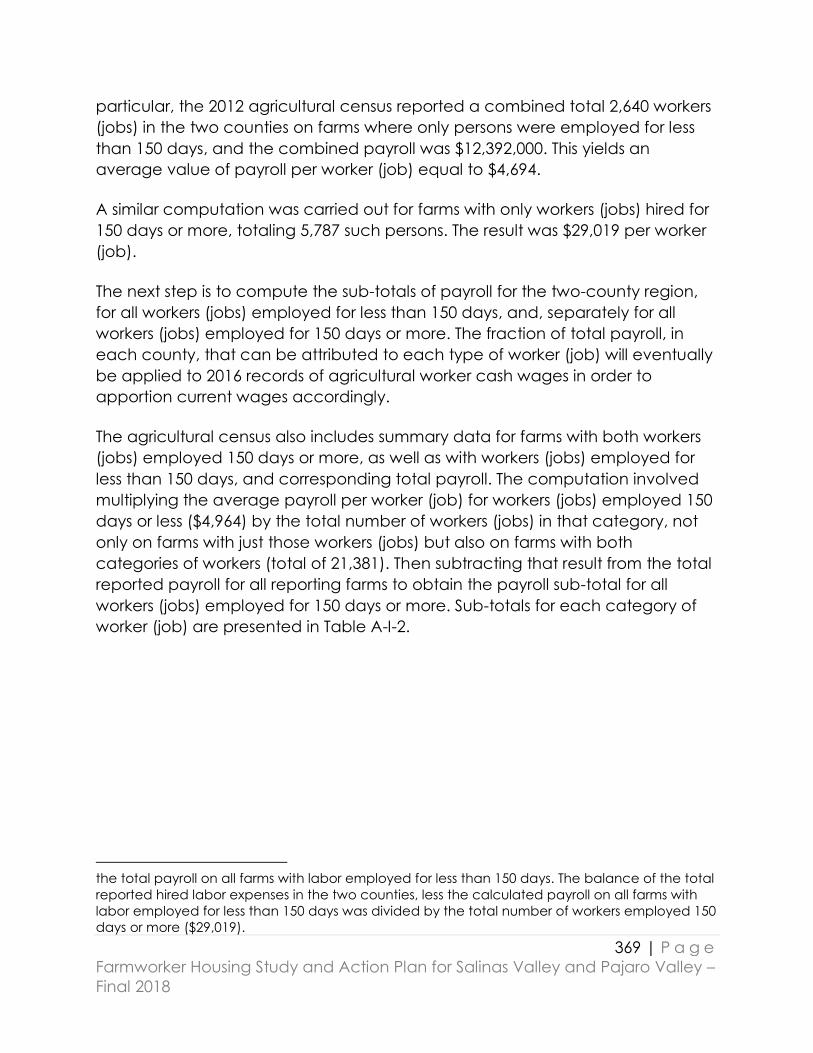
369 | P a g e
Farmworker Housing Study and Action Plan for Salinas Valley and Pajaro Valley –
Final 2018
particular, the 2012 agricultural census reported a combined total 2,640 workers
(jobs) in the two counties on farms where only persons were employed for less
than 150 days, and the combined payroll was $12,392,000. This yields an
average value of payroll per worker (job) equal to $4,694.
A similar computation was carried out for farms with only workers (jobs) hired for
150 days or more, totaling 5,787 such persons. The result was $29,019 per worker
(job).
The next step is to compute the sub-totals of payroll for the two-county region,
for all workers (jobs) employed for less than 150 days, and, separately for all
workers (jobs) employed for 150 days or more. The fraction of total payroll, in
each county, that can be attributed to each type of worker (job) will eventually
be applied to 2016 records of agricultural worker cash wages in order to
apportion current wages accordingly.
The agricultural census also includes summary data for farms with both workers
(jobs) employed 150 days or more, as well as with workers (jobs) employed for
less than 150 days, and corresponding total payroll. The computation involved
multiplying the average payroll per worker (job) for workers (jobs) employed 150
days or less ($4,964) by the total number of workers (jobs) in that category, not
only on farms with just those workers (jobs) but also on farms with both
categories of workers (total of 21,381). Then subtracting that result from the total
reported payroll for all reporting farms to obtain the payroll sub-total for all
workers (jobs) employed for 150 days or more. Sub-totals for each category of
worker (job) are presented in Table A-I-2.
the total payroll on all farms with labor employed for less than 150 days. The balance of the total
reported hired labor expenses in the two counties, less the calculated payroll on all farms with
labor employed for less than 150 days was divided by the total number of workers employed 150
days or more ($29,019).

370 | P a g e
Farmworker Housing Study and Action Plan for Salinas Valley and Pajaro Valley –
Final 2018
Table A-1-2
Estimated Payroll Sub-totals per Type of Worker (job) Source: 2012 Census of Agriculture, California, County Data, Table 7
Author’s Computation
Category of worker (job) Payroll, Monterey County & Santa
Cruz County
Sub-Total, Hired Labor, less than
150 days
$100,361,118
Sub-Total, Hired Labor, 150 days or
more
$557,978,882
Estimated Total, Hired Labor $658,340,000
Published report, Census of
Agriculture
$658, 320,000
From Table A-I-2, an estimated 85% of total payroll for hired labor in the two-
county Salinas-Pajaro region during 2012 was for workers (jobs) employed 150
days or more. Similarly, an estimated 15% of total payroll was for workers
employed less than 150 days.
At this point, a new hypothesis is suggested: the proportion of total cash wages
for all agricultural workers (jobs) in the two-county region during 2016 for each
category of workers (jobs) follows the same shares as determined for directly
hired workers (jobs) as during 2012. There is no independent measure of whether
this hypothesis is correct. However, the figures obtained and used in the
determination of this paper’s estimate of the number of individuals working in
the region’s agriculture can be compared with other independent estimates.
As is discussed in this report, there is at least one other estimate in the published
literature. Other colleagues have also made estimates using their own preferred
methods, and these can be considered in discussing the findings of the present
report.

371 | P a g e
Farmworker Housing Study and Action Plan for Salinas Valley and Pajaro Valley –
Final 2018
The U.S. Department of Labor’s Quarterly Census of Employment and Wages
(QCEW) provides a record of cash wages and salaries paid to employees of all
agricultural businesses in California for 2016. The summary for agricultural
employment is comprised of crop production (NAICS 111), animal and animal
product production (NAICS 112), and support services for crop, animal and
other types of farm production (NAICS 115).
However, the results derived in Tables A-I-1 and A-I-2 were developed from 2012
Census of Agriculture findings for NAICS 111 and NAICS 112. There is no reason to
suggest that changes in employment and compensation between 2012 and
2016 were similar to those in NAICS 115. For that reason, it proved necessary to
separately develop two estimates: one for the former two categories, and one
for the latter.
During 2016, the total cash wages paid for agricultural worker employment in
Monterey County was reported by the QCEW files was $1,908,767,000. For Santa
Cruz County, the corresponding total was $298,418,000. For purposes of
developing an estimate of the number of individual workers, the QCEW files for
each of the three NAICS codes were also downloaded for the computation
discussed next.
Table A-I-3
Estimated Cash Wages, Sub-totals per Type of Worker (job)
Monterey & Santa Cruz Counties, 2016 Source: BLS, QCEW Files, 2016, Agricultural Workers
Category of worker (job) Payroll Sub-total,
NAICS 111 & 112
Payroll Sub-total,
NAICS 115
Hired Labor, less than 150 days $152,115,984 $184,359,932
Hired Labor, 150 days or more $845,721,016 $1,024,988,068
Table A-I-3 presents the sub-totals of 2016 cash wages allocated to both
categories of workers (jobs) in the two-county region in which the proportions
were determined as previously described: 15% for hired labor, less than 150 days,
and 85% for hired labor, 150 days or more. It is important to note that these
payroll figures include data for support services for crop and livestock
production, such as contact labor and preparation of produce for market
which includes salad plants, as well as data for employees directly hired labor
by farm operators.

372 | P a g e
Farmworker Housing Study and Action Plan for Salinas Valley and Pajaro Valley –
Final 2018
The final steps of estimating the number of individual workers involve dividing the
total cash wages paid to all workers in each category by the corresponding
average cash earnings per worker (job) to derive the total number of jobs in
each job category. Once the total number of jobs is determined, the result is
then divided by the average number of employers per worker to obtain the
estimated total number of individual workers in the Salinas-Pajaro Laborshed.
Before proceeding, it is necessary to adjust the payroll per worker (job)
presented in Table A-I-1 to take two factors into account in making estimates of
the average cash earnings per worker (job). First, the payroll figures reported by
the agricultural census include employment taxes (social security, Medicare,
unemployment insurance), workers compensation premium payments and
other cash employment benefits.194 Second, some employers, faced with
periods of labor shortage, offered increased salaries and wages in an effort to
attract or retain employees. In addition, increases in the California minimum
wage between 2012 and 2016 forced all employers to make adjustments of
wages.195
The adjusted estimated cash earnings per worker (job) in each job category for
Monterey and Santa Cruz counties combined are presented in Table A-I-4. Both
adjustments discussed above have been taken into account.
The findings reported in Tables A-I-3 and A-I-4 make it possible to calculate the
estimated number of jobs in each NAICS code and for each category of worker
(job). The resulting findings are presented in Table A-I-5.
194 An estimated 85% of payroll was assumed to represent employer costs. 195 Both factors were taken into account, separately for the two-county region, by computing
the ratio of Average Annual Pay (nominal) for the combined NAICS 111 & 112 and, separately
for NAICS 115 during 2016 with that for 2012 as reported by BLS QCEW. For NAICS 111 &112, the
ratio was $35,033/$30,104 = 1.1637; for NAICS 115, the ratio was $36,999/$28,503 = 1.2981.
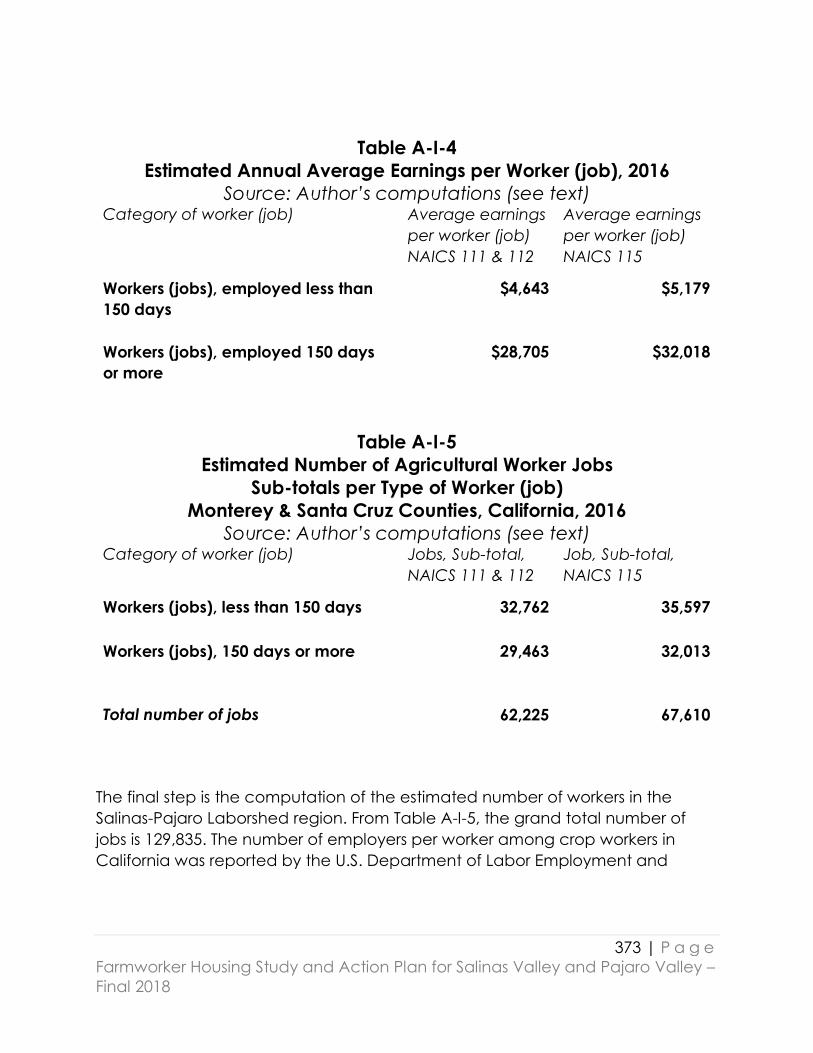
373 | P a g e
Farmworker Housing Study and Action Plan for Salinas Valley and Pajaro Valley –
Final 2018
Table A-I-4
Estimated Annual Average Earnings per Worker (job), 2016
Source: Author’s computations (see text) Category of worker (job) Average earnings
per worker (job)
NAICS 111 & 112
Average earnings
per worker (job)
NAICS 115
Workers (jobs), employed less than
150 days
$4,643
$5,179
Workers (jobs), employed 150 days
or more
$28,705 $32,018
Table A-I-5
Estimated Number of Agricultural Worker Jobs
Sub-totals per Type of Worker (job)
Monterey & Santa Cruz Counties, California, 2016
Source: Author’s computations (see text) Category of worker (job) Jobs, Sub-total,
NAICS 111 & 112
Job, Sub-total,
NAICS 115
Workers (jobs), less than 150 days 32,762 35,597
Workers (jobs), 150 days or more
29,463
32,013
Total number of jobs
62,225 67,610
The final step is the computation of the estimated number of workers in the
Salinas-Pajaro Laborshed region. From Table A-I-5, the grand total number of
jobs is 129,835. The number of employers per worker among crop workers in
California was reported by the U.S. Department of Labor Employment and

374 | P a g e
Farmworker Housing Study and Action Plan for Salinas Valley and Pajaro Valley –
Final 2018
Training Administration’s National Agricultural Workers Survey (NAWS) to have
been 1.42 farm employers per worker during FYs 2013-14.196
Therefore, the present report estimates the number of individuals who were
employed as agricultural workers for at least some portion of calendar year 2016
was 91,433. As can easily be inferred from Table A-I-5, slightly more than half of
all agricultural jobs in the region were estimated to have been fewer than 150
days duration.
196 Cf. Table 14. Hired Crop Worker Employment Characteristics, California Estimate, Five Time
Periods. Row 45 of the Table. Public Data, Fiscal Years 1989-2014.

375 | P a g e
Farmworker Housing Study and Action Plan for Salinas Valley and Pajaro Valley –
Final 2018
Appendix 2: Site Suitability
Tax Credit Allocation Committee (TCAC) Rural Eligible High
Amenity Parcels The preliminary identification of some high amenity parcels within the study area
was completed utilizing graphic interface spatial analysis. High amenity parcels
were identified based on their cumulative proximity, from high amenity to
highest amenity, to the following classes:
Transit
Transit, Grocery
Transit, Grocery, Library
Transit, Grocery, Library, Clinic
Data for schools and pharmacies was difficult to access. To account for the
location of pharmacies, the assumption was made that pharmacies are
widespread in larger communities in numerous retail locations, and many
hospitals and community-based clinics also have pharmacies available.
Two levels of analysis were conducted on the TCAC eligible parcels -- the first
level of analysis identified the high amenity parcels based on the classes
described above, and the second layer of analysis examined zoning
designations for the cities of Watsonville and Salinas, and the community of
Castroville. This provided the projected number of high amenity sites and
allowed comparison against the number of these high amenity parcels that
were appropriately zoned for high density or multi-family use.
The spatial analysis revealed that likely five of the ten “rural” communities
possessed parcels classified as the highest amenity of parcels. However, within
those five communities, it is estimated that there are approximately 2,495 TCAC
High Amenity parcels.
376 | P a g e
Farmworker Housing Study and Action Plan for Salinas Valley and Pajaro Valley –
Final 2018
TCAC HIGH AMENITY PARCELS BY PARCEL
When zoning is overlaid on the amenity parcel map, it appeared that some of
the most competitive parcels may not be adequately zoned for affordable
housing development. Furthermore, many parcels identified for affordable
housing development and zoned for such uses, are not high amenity and would
not qualify for either AHSC or LIHTC funding.
Location Highest Amenity Parcels (#)
Castroville 108
Chualar 0
Gonzalez 0
Greenfield 0
King City 323
Sam Lomas 0
Salinas 349
San Lucas 0
Soledad 196
Watsonville 1519
Total Parcels 2495
TCAC Eligibility
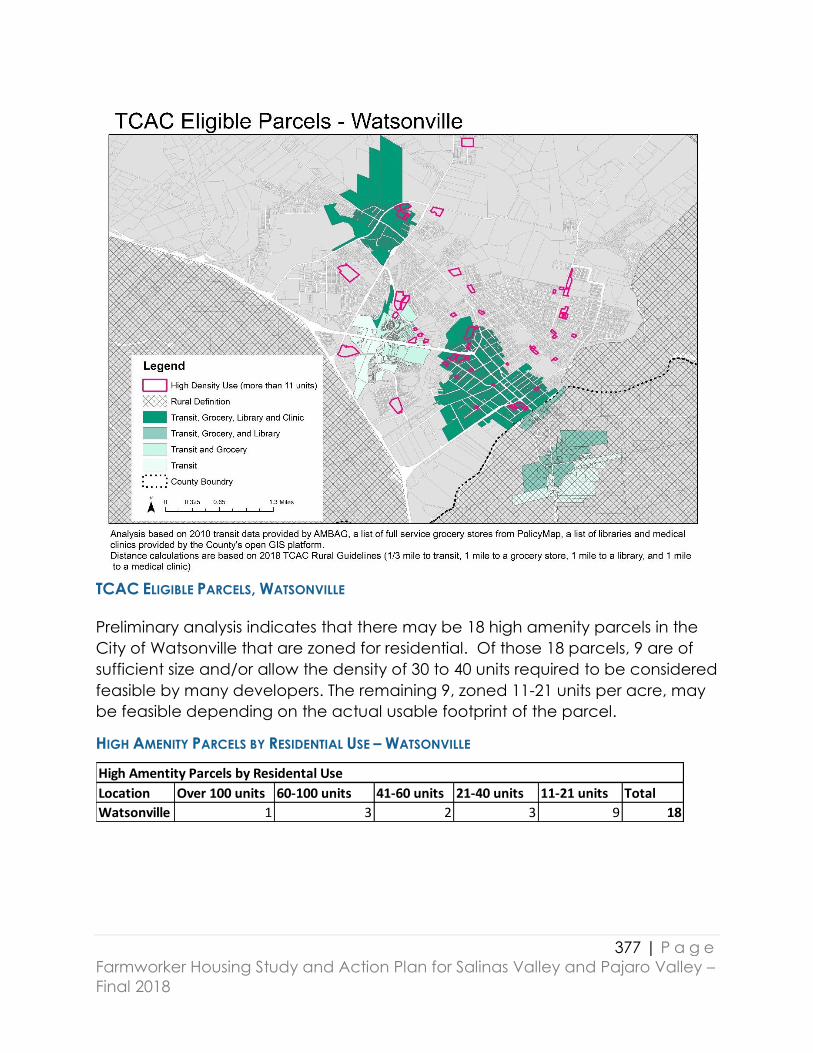
377 | P a g e
Farmworker Housing Study and Action Plan for Salinas Valley and Pajaro Valley –
Final 2018
TCAC ELIGIBLE PARCELS, WATSONVILLE
Preliminary analysis indicates that there may be 18 high amenity parcels in the
City of Watsonville that are zoned for residential. Of those 18 parcels, 9 are of
sufficient size and/or allow the density of 30 to 40 units required to be considered
feasible by many developers. The remaining 9, zoned 11-21 units per acre, may
be feasible depending on the actual usable footprint of the parcel.
HIGH AMENITY PARCELS BY RESIDENTIAL USE – WATSONVILLE
High Amentity Parcels by Residental Use
Location Over 100 units 60-100 units 41-60 units 21-40 units 11-21 units Total
Watsonville 1 3 2 3 9 18
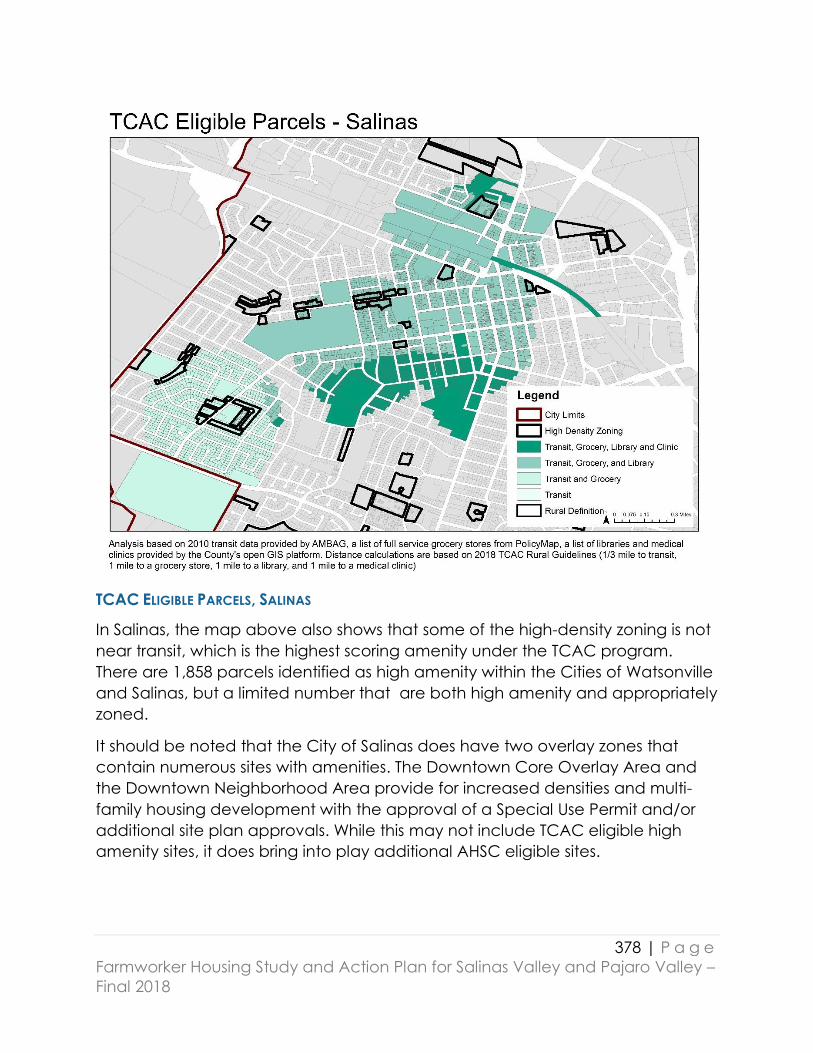
378 | P a g e
Farmworker Housing Study and Action Plan for Salinas Valley and Pajaro Valley –
Final 2018
TCAC ELIGIBLE PARCELS, SALINAS
In Salinas, the map above also shows that some of the high-density zoning is not
near transit, which is the highest scoring amenity under the TCAC program.
There are 1,858 parcels identified as high amenity within the Cities of Watsonville
and Salinas, but a limited number that are both high amenity and appropriately
zoned.
It should be noted that the City of Salinas does have two overlay zones that
contain numerous sites with amenities. The Downtown Core Overlay Area and
the Downtown Neighborhood Area provide for increased densities and multi-
family housing development with the approval of a Special Use Permit and/or
additional site plan approvals. While this may not include TCAC eligible high
amenity sites, it does bring into play additional AHSC eligible sites.
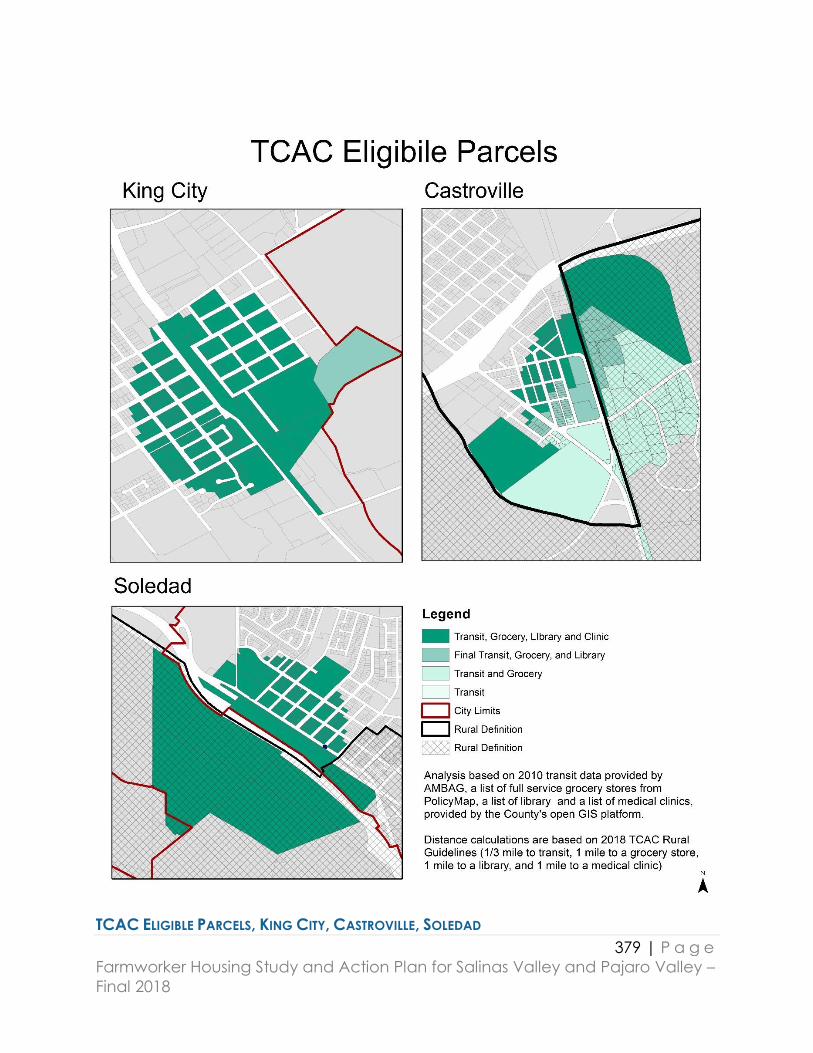
379 | P a g e
Farmworker Housing Study and Action Plan for Salinas Valley and Pajaro Valley –
Final 2018
TCAC ELIGIBLE PARCELS, KING CITY, CASTROVILLE, SOLEDAD
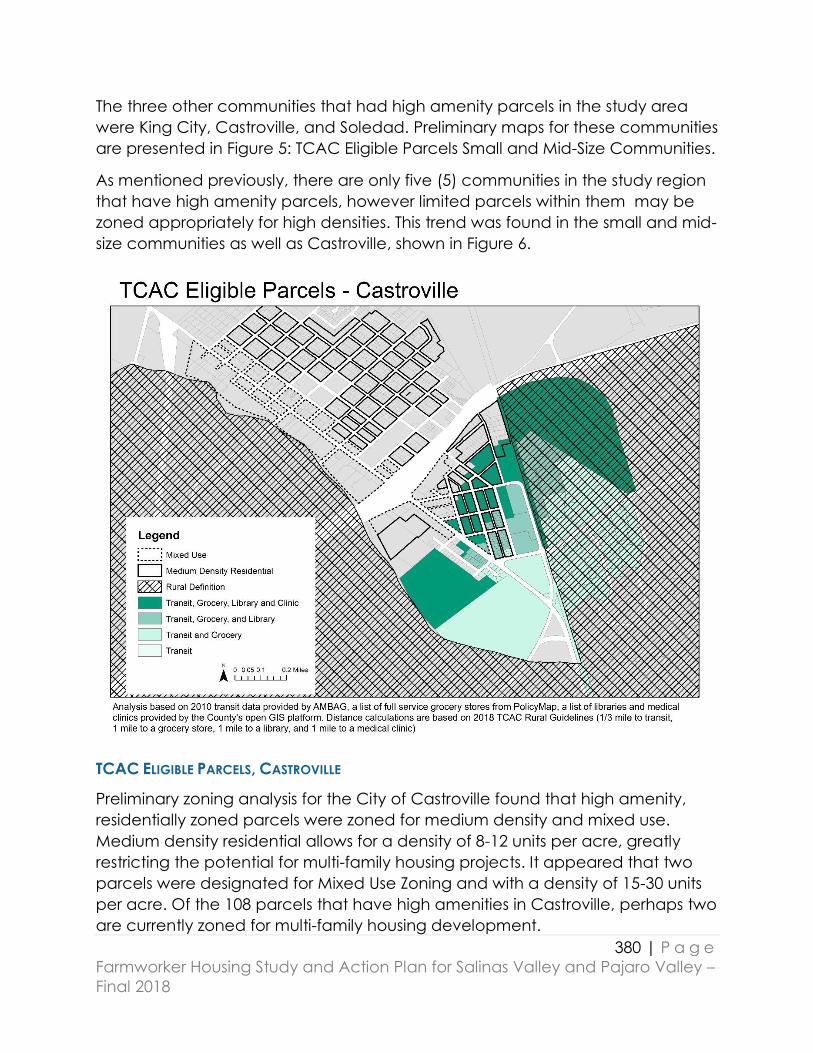
380 | P a g e
Farmworker Housing Study and Action Plan for Salinas Valley and Pajaro Valley –
Final 2018
The three other communities that had high amenity parcels in the study area
were King City, Castroville, and Soledad. Preliminary maps for these communities
are presented in Figure 5: TCAC Eligible Parcels Small and Mid-Size Communities.
As mentioned previously, there are only five (5) communities in the study region
that have high amenity parcels, however limited parcels within them may be
zoned appropriately for high densities. This trend was found in the small and mid-
size communities as well as Castroville, shown in Figure 6.
TCAC ELIGIBLE PARCELS, CASTROVILLE
Preliminary zoning analysis for the City of Castroville found that high amenity,
residentially zoned parcels were zoned for medium density and mixed use.
Medium density residential allows for a density of 8-12 units per acre, greatly
restricting the potential for multi-family housing projects. It appeared that two
parcels were designated for Mixed Use Zoning and with a density of 15-30 units
per acre. Of the 108 parcels that have high amenities in Castroville, perhaps two
are currently zoned for multi-family housing development.

381 | P a g e
Farmworker Housing Study and Action Plan for Salinas Valley and Pajaro Valley –
Final 2018
HIGH AMENITY PARCELS AND ZONING - CASTROVILLE
King City and Soledad may also have 519 high amenity parcels. We did not
overlay the zoning parcels for these communities as we feel that the results
demonstrated in the examination of the City of Watsonville, the City of Salinas,
and Castroville provide insight into the general trend that although there are
numerous parcels that are classified as high amenity, few of these parcels are
zoned for high density residential use as defined in those communities’ zoning
ordinances.
Further, King City qualifies as rural under the “small cities” methodology and the
determination of rural for projects in this community will be determined by the
specific address of the development project.
Affordable Housing and Sustainable Communities (AHSC) Rural
Innovations Project Area (RIPA) Eligible High Amenity Parcels
The identification of high amenity parcels according to AHSC and RIPA within
the study area was completed utilizing graphic interface spatial analysis. High
amenity parcels were identified based on their cumulative proximity, from high
amenity to highest amenity, to the following classes:
Transit
Transit, Grocery
Transit, Grocery, Schools
Transit, Grocery, Schools, Clinic
The AHSC program requires that the amenities associated with the project
development be located within one-half mile of the Project Area Map (PAM).
The PAM integrates the project site, amenities, and transit line data points into a
consolidated map that allows you to extend one-half mile from the data points
to create a bubble or buffer.
Using the same process as above, two levels of analysis were applied to the
AHSC eligible parcels. The first level of analysis identified high amenity parcels
based on the classes described above, and the second layer of analysis
assessed the zoning designations for the Cities of Watsonville, Salinas, and
Castroville. Together, this analysis provided a total number of high amenity sites
Location Medium Density Residential Mixed Use
Castroville 98 2
High Amentity, Residental and Mixed Use Zoning
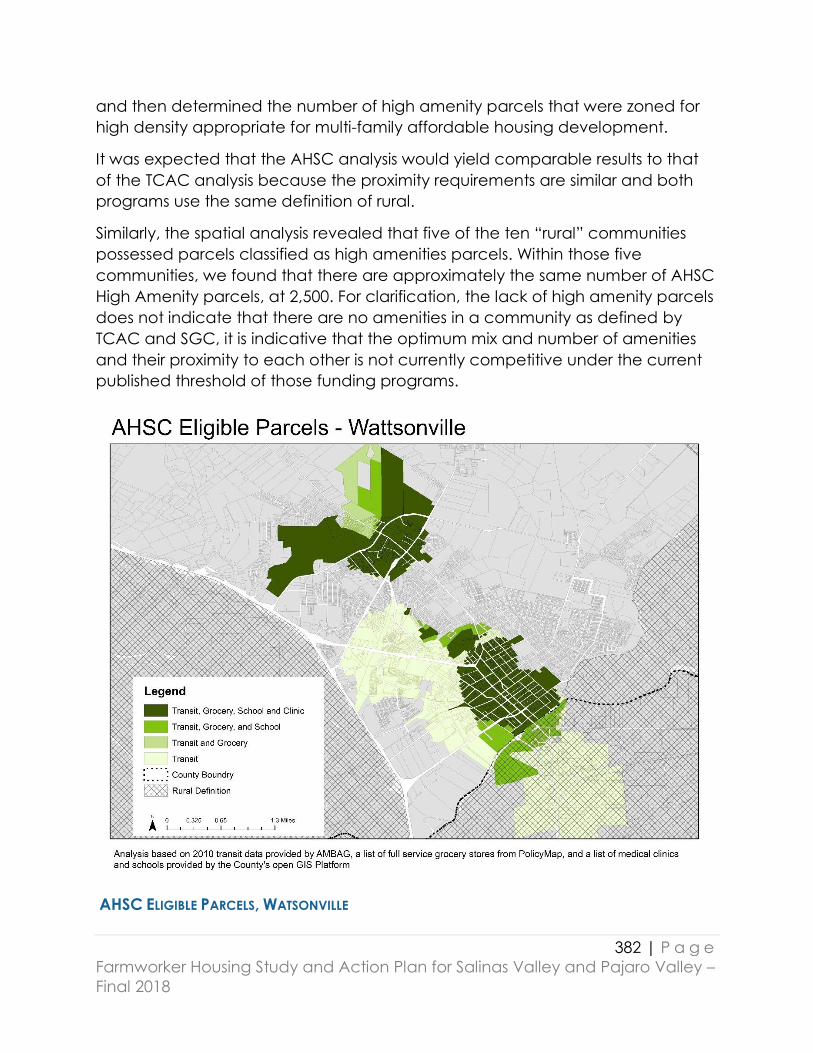
382 | P a g e
Farmworker Housing Study and Action Plan for Salinas Valley and Pajaro Valley –
Final 2018
and then determined the number of high amenity parcels that were zoned for
high density appropriate for multi-family affordable housing development.
It was expected that the AHSC analysis would yield comparable results to that
of the TCAC analysis because the proximity requirements are similar and both
programs use the same definition of rural.
Similarly, the spatial analysis revealed that five of the ten “rural” communities
possessed parcels classified as high amenities parcels. Within those five
communities, we found that there are approximately the same number of AHSC
High Amenity parcels, at 2,500. For clarification, the lack of high amenity parcels
does not indicate that there are no amenities in a community as defined by
TCAC and SGC, it is indicative that the optimum mix and number of amenities
and their proximity to each other is not currently competitive under the current
published threshold of those funding programs.
AHSC ELIGIBLE PARCELS, WATSONVILLE
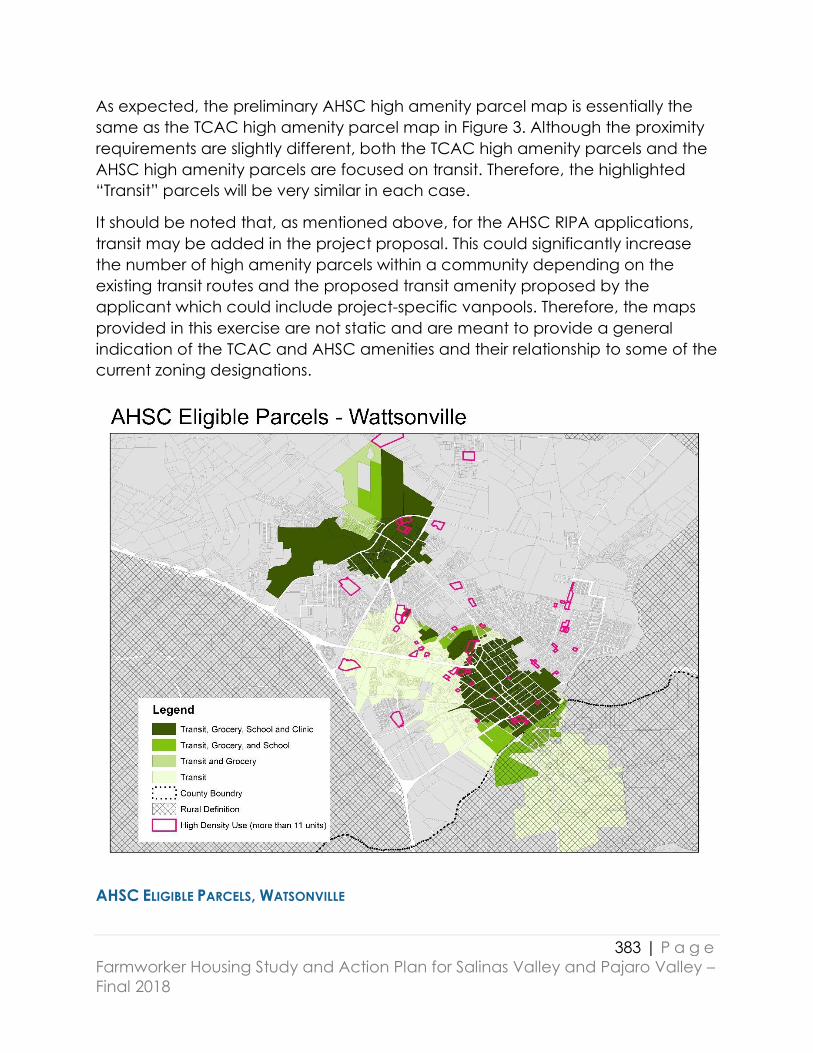
383 | P a g e
Farmworker Housing Study and Action Plan for Salinas Valley and Pajaro Valley –
Final 2018
As expected, the preliminary AHSC high amenity parcel map is essentially the
same as the TCAC high amenity parcel map in Figure 3. Although the proximity
requirements are slightly different, both the TCAC high amenity parcels and the
AHSC high amenity parcels are focused on transit. Therefore, the highlighted
“Transit” parcels will be very similar in each case.
It should be noted that, as mentioned above, for the AHSC RIPA applications,
transit may be added in the project proposal. This could significantly increase
the number of high amenity parcels within a community depending on the
existing transit routes and the proposed transit amenity proposed by the
applicant which could include project-specific vanpools. Therefore, the maps
provided in this exercise are not static and are meant to provide a general
indication of the TCAC and AHSC amenities and their relationship to some of the
current zoning designations.
AHSC ELIGIBLE PARCELS, WATSONVILLE
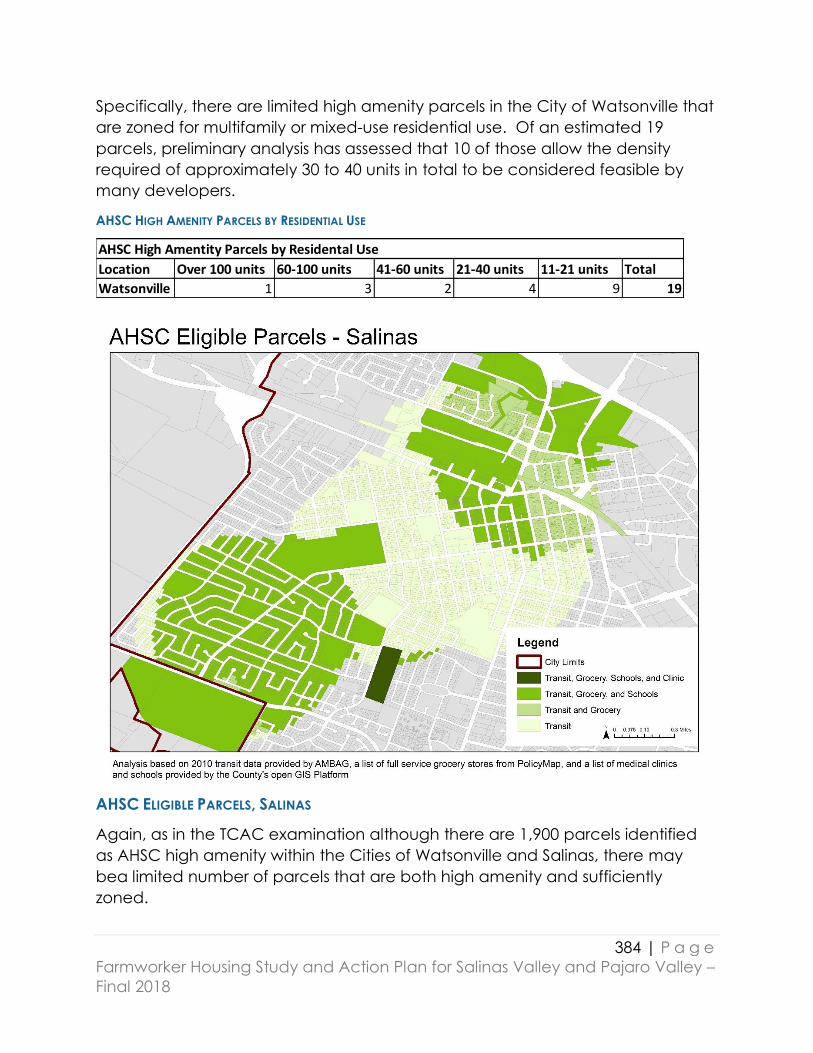
384 | P a g e
Farmworker Housing Study and Action Plan for Salinas Valley and Pajaro Valley –
Final 2018
Specifically, there are limited high amenity parcels in the City of Watsonville that
are zoned for multifamily or mixed-use residential use. Of an estimated 19
parcels, preliminary analysis has assessed that 10 of those allow the density
required of approximately 30 to 40 units in total to be considered feasible by
many developers.
AHSC HIGH AMENITY PARCELS BY RESIDENTIAL USE
AHSC ELIGIBLE PARCELS, SALINAS
Again, as in the TCAC examination although there are 1,900 parcels identified
as AHSC high amenity within the Cities of Watsonville and Salinas, there may
bea limited number of parcels that are both high amenity and sufficiently
zoned.
AHSC High Amentity Parcels by Residental Use
Location Over 100 units 60-100 units 41-60 units 21-40 units 11-21 units Total
Watsonville 1 3 2 4 9 19
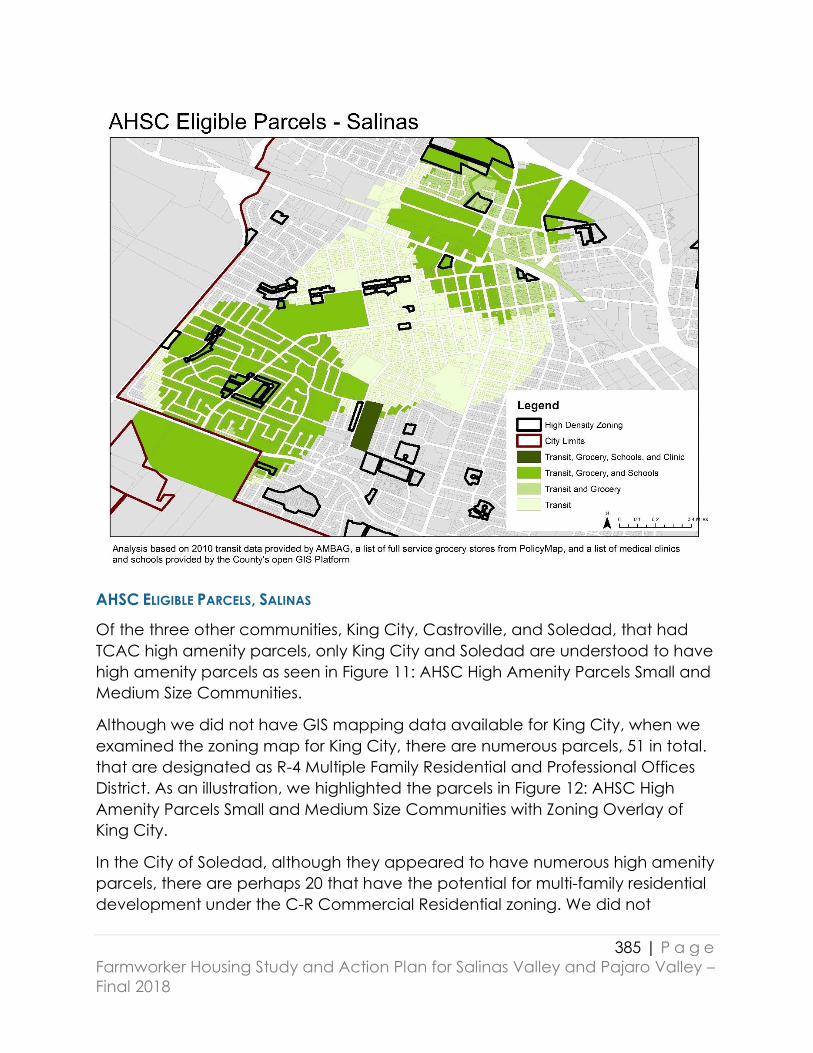
385 | P a g e
Farmworker Housing Study and Action Plan for Salinas Valley and Pajaro Valley –
Final 2018
AHSC ELIGIBLE PARCELS, SALINAS
Of the three other communities, King City, Castroville, and Soledad, that had
TCAC high amenity parcels, only King City and Soledad are understood to have
high amenity parcels as seen in Figure 11: AHSC High Amenity Parcels Small and
Medium Size Communities.
Although we did not have GIS mapping data available for King City, when we
examined the zoning map for King City, there are numerous parcels, 51 in total.
that are designated as R-4 Multiple Family Residential and Professional Offices
District. As an illustration, we highlighted the parcels in Figure 12: AHSC High
Amenity Parcels Small and Medium Size Communities with Zoning Overlay of
King City.
In the City of Soledad, although they appeared to have numerous high amenity
parcels, there are perhaps 20 that have the potential for multi-family residential
development under the C-R Commercial Residential zoning. We did not
386 | P a g e
Farmworker Housing Study and Action Plan for Salinas Valley and Pajaro Valley –
Final 2018
highlight the parcels because they would require a Special Use Permit for the
development of Multi-Family housing units in this zone.

387 | P a g e
Farmworker Housing Study and Action Plan for Salinas Valley and Pajaro Valley –
Final 2018
AHSC ELIGIBLE PARCELS, KING CITY, CASTROVILLE, SOLEDAD
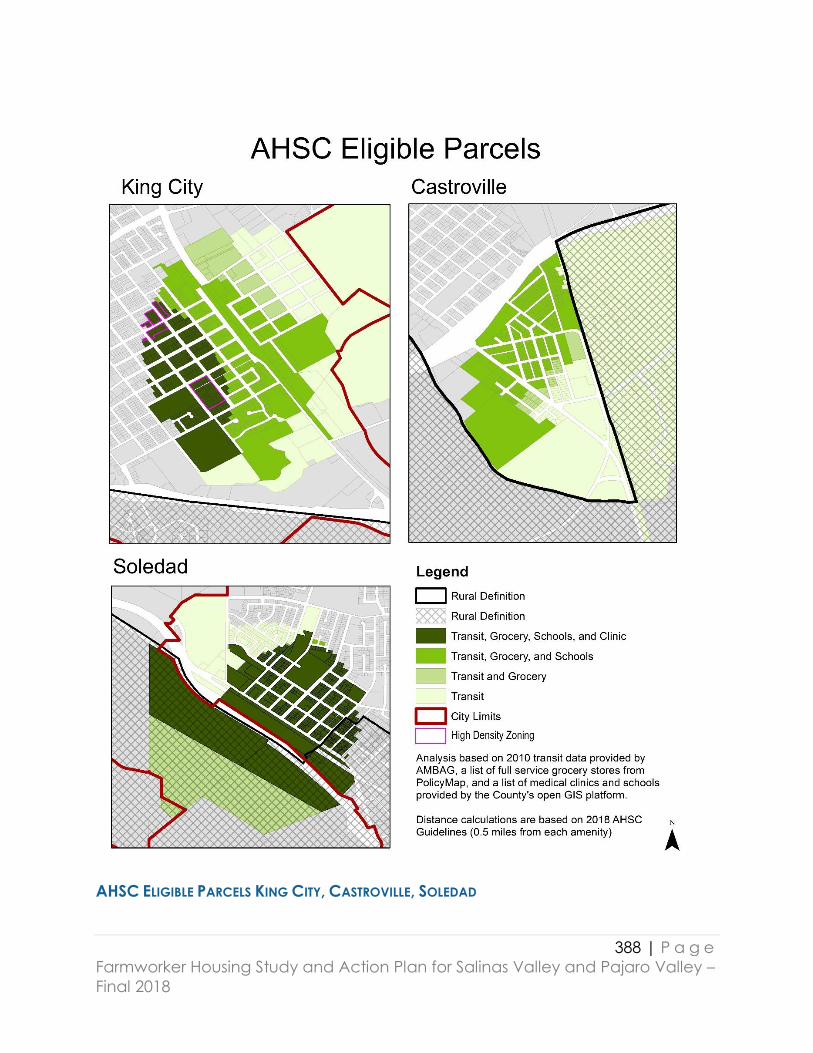
388 | P a g e
Farmworker Housing Study and Action Plan for Salinas Valley and Pajaro Valley –
Final 2018
AHSC ELIGIBLE PARCELS KING CITY, CASTROVILLE, SOLEDAD
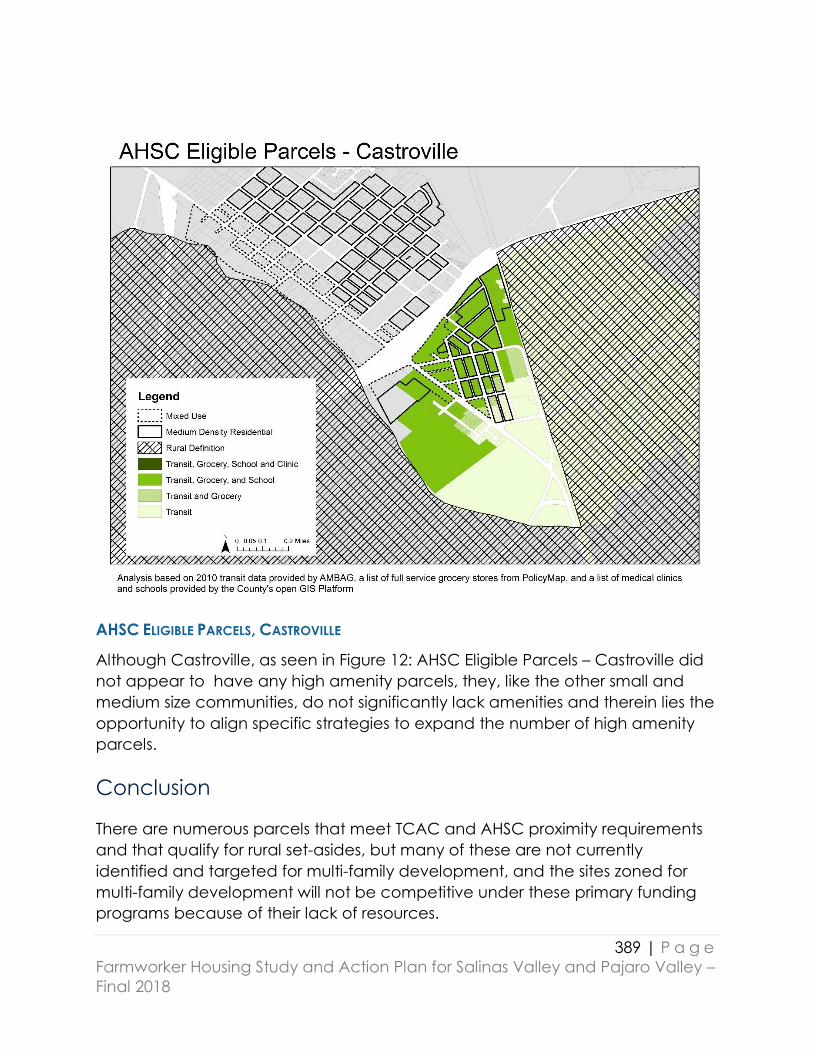
389 | P a g e
Farmworker Housing Study and Action Plan for Salinas Valley and Pajaro Valley –
Final 2018
AHSC ELIGIBLE PARCELS, CASTROVILLE
Although Castroville, as seen in Figure 12: AHSC Eligible Parcels – Castroville did
not appear to have any high amenity parcels, they, like the other small and
medium size communities, do not significantly lack amenities and therein lies the
opportunity to align specific strategies to expand the number of high amenity
parcels.
Conclusion
There are numerous parcels that meet TCAC and AHSC proximity requirements
and that qualify for rural set-asides, but many of these are not currently
identified and targeted for multi-family development, and the sites zoned for
multi-family development will not be competitive under these primary funding
programs because of their lack of resources.

390 | P a g e
Farmworker Housing Study and Action Plan for Salinas Valley and Pajaro Valley –
Final 2018
However, there is terrific opportunity to better position the region to compete for
state funding resources and the study area is well-situated to increase the
number of high amenity parcels with the requisite zoning by:
Examining existing land use and zoning policies and aligning them with
the TCAC and AHSC proximity requirements. When a combination of
TCAC and AHSC funding is utilized, aligning the eligible parcels will
increase the competitiveness of the proposed project site.
Increasing collaboration amongst affordable housing developers and
municipalities to identify specific parcels that are high amenity or close to
high amenity and examine the opportunities to reduce development
barriers or increase amenities.
Focusing transit investment in rural communities and proposing project
specific services to increase the number of high amenity parcels and
increase the competitiveness of sites within these communities.
Continue to include the consideration of TCAC and AHSC proximity
requirements in the region’s comprehensive and integrated planning
processes, such as AMBAG’s 2040 Sustainable Communities Strategy.
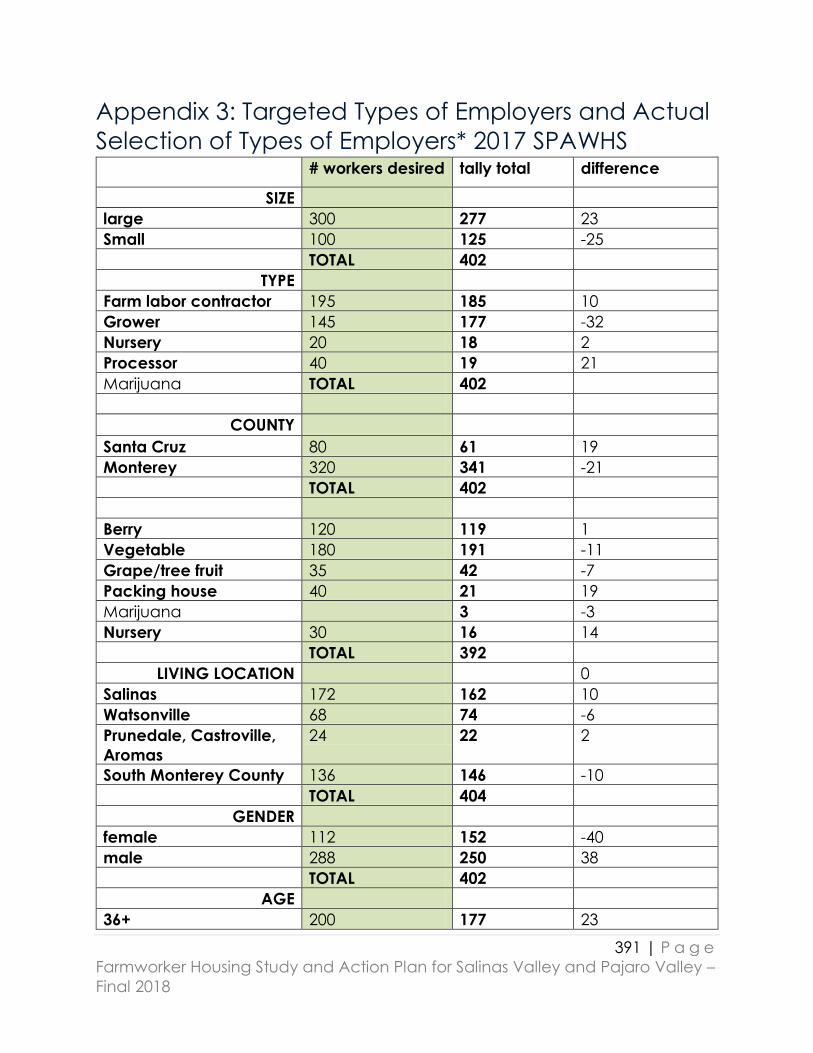
391 | P a g e
Farmworker Housing Study and Action Plan for Salinas Valley and Pajaro Valley –
Final 2018
Appendix 3: Targeted Types of Employers and Actual
Selection of Types of Employers* 2017 SPAWHS # workers desired tally total difference
SIZE
large 300 277 23
Small 100 125 -25
TOTAL 402
TYPE
Farm labor contractor 195 185 10
Grower 145 177 -32
Nursery 20 18 2
Processor 40 19 21
Marijuana TOTAL 402
COUNTY
Santa Cruz 80 61 19
Monterey 320 341 -21
TOTAL 402
Berry 120 119 1
Vegetable 180 191 -11
Grape/tree fruit 35 42 -7
Packing house 40 21 19
Marijuana 3 -3
Nursery 30 16 14
TOTAL 392
LIVING LOCATION 0
Salinas 172 162 10
Watsonville 68 74 -6
Prunedale, Castroville,
Aromas
24 22 2
South Monterey County 136 146 -10
TOTAL 404
GENDER
female 112 152 -40
male 288 250 38
TOTAL 402
AGE
36+ 200 177 23
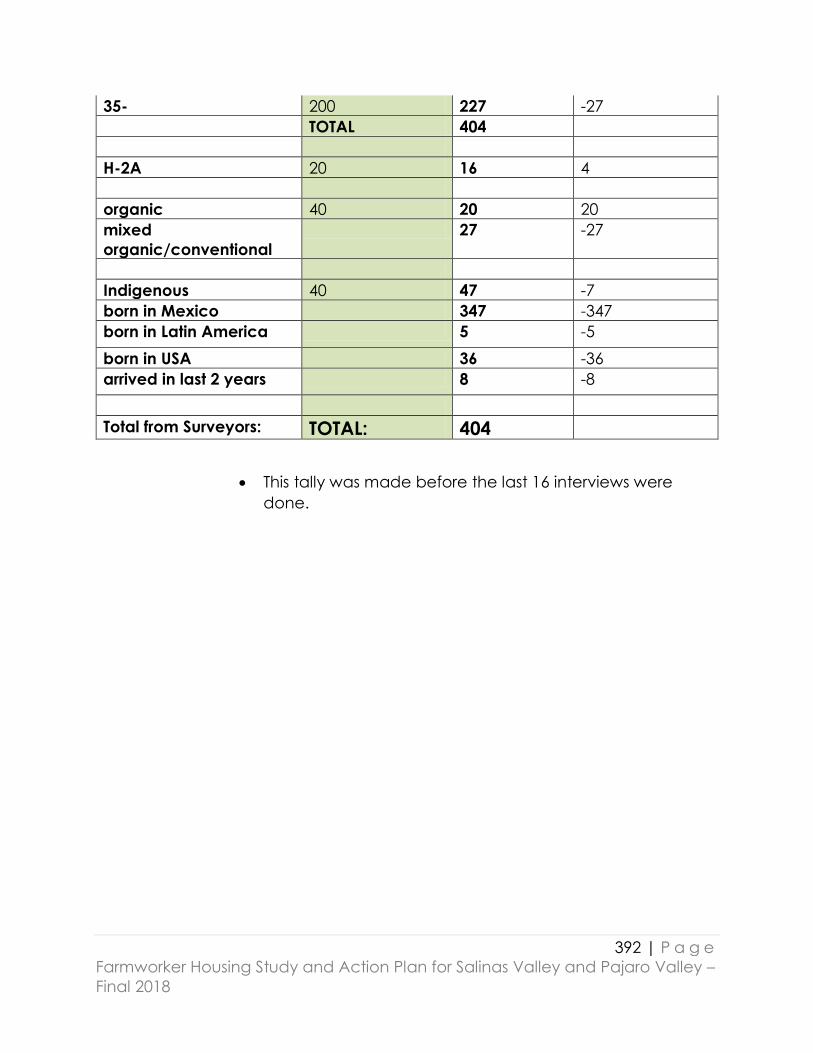
392 | P a g e
Farmworker Housing Study and Action Plan for Salinas Valley and Pajaro Valley –
Final 2018
35- 200 227 -27
TOTAL 404
H-2A 20 16 4
organic 40 20 20
mixed
organic/conventional
27 -27
Indigenous 40 47 -7
born in Mexico 347 -347
born in Latin America 5 -5
born in USA 36 -36
arrived in last 2 years 8 -8
Total from Surveyors: TOTAL: 404
This tally was made before the last 16 interviews were
done.

393 | P a g e
Farmworker Housing Study and Action Plan for Salinas Valley and Pajaro Valley –
Final 2018
Appendix 4: Data Tables 2017 SPAWHS
Wage table A-1
sex Mean Median N
man $13.74 $13.00 225
women $13.50 $12.50 155
Wage Table A-2
age Mean Median N
18 to 25 $13.37 $12.53 54
26 to 39 $14.08 $13.10 179
40 to 59 $13.32 $12.50 119
60 or more $12.63 $11.82 31
Wage Table A-3
Time of Arrival in
the US
Mean Median N
1950 to 1981 $13.21 $12.50 35
1982 to 1994 $13.95 $13.13 67
1995 to 2001 $13.66 $13.00 91
2002 to 2006 $13.79 $13.00 75
2007 to 2011 $13.88 $13.05 50
2012 to 2017 $13.95 $13.00 31
Measure of Crowdedness per room by Town of Residence (number of
interviewees)
less
than 1
1.0 to
1.5
1.51 to
2
2.01 to
2.5
2.51
to 3
greater
than 3
Total
Salinas 13 48 43 17 23 39 183
Watsonville 6 8 13 5 3 7 42
Greenfield 1 5 12 5 3 11 37

394 | P a g e
Farmworker Housing Study and Action Plan for Salinas Valley and Pajaro Valley –
Final 2018
King City 2 10 15 3 1 2 33
Soledad 2 10 8 4 2 3 29
Chualar 1 9 7 2 1 4 24
Castroville 0 3 4 1 4 1 13
Gonzalez 0 6 4 2 1 0 13
Pajaro 1 0 1 0 0 1 3
Freedom 0 1 0 1 1 0 3
Monterey 0 1 1 0 0 0 2
San Lucas 1 0 0 0 0 0 1
Total 27 101 108 40 39 68 383
Mean, Median of People per room by
home town of interviewee
Town Mean Median N
Salinas 2.4 2.0 202
Watsonville 2.3 2.0 44
Greenfield 2.5 2.0 38
King City 1.8 1.7 33
Soledad 1.9 1.5 29
Chualar 2.0 2.0 24
Gonzalez 2.5 1.8 19
Castroville 2.3 2.0 13
Pajaro 2.1 1.7 3
Freedom 2.0 2.3 3
Monterey 1.3 1.3 2
San Lucas 0.3 0.3 1

395 | P a g e
Farmworker Housing Study and Action Plan for Salinas Valley and Pajaro Valley –
Final 2018
Appendix 5: Survey Training Manual
Entrenamiento para La Encuesta para la mejora de la
vivienda de los jornaleros de Pájaro y Salinas
PRESENTACION DE LA ENCUESTA:
“El propósito de esta encuesta patrocinado por la ciudad de Salinas, muchos
otros pueblos cercanos y organizaciones agrícolas y sociales es de conocer a
fondo las condiciones, incluyendo el costo de la vivienda para los jornaleros de
los Valles de Salinas y Pajaro. Si bien que no haya ninguna garantía, se espera
que comprobando las tristes condiciones de vivienda que enfrentan los
jornaleros de la zona ayudaría a traer mejores viviendas para la gente que
trabajan en el campo.”
CONSENTIMIENTO VERBAL
Se tiene que explicar bien al entrevistado los elementos de consentimiento y no
presionar a la persona a participar.
Explicar el propósito del estudio: Conocer a fondo las condiciones,
incluyendo el costo de la vivienda para los jornaleros de los Valles de
Salinas y Pajaro. Ayudar a la iniciativa promovida por los gobiernos
locales para mejorar la vivienda de los que trabajan en el campo.
Explicar que se va a preguntar sobre la composición de la familia, el
ingreso, los patrones de migración, y las condiciones y costo de la
vivienda.
Esperamos, pero no hay ninguna garantía, que va a haber beneficios
para el jornalero de este proyecto. El estudio forzosamente va a
comprobar que el hacinamiento y alto costo de la vivienda son
problemas serios. Ojalá las autoridades locales puedan usar estos datos
para mejor diseñar políticas que mejoren la vivienda en el área.
No pedimos ni apellidos ni domicilios de los encuestados. Pero, sí
pedimos el pueblo donde vive, la zona postal si se conoce y los nombres
(no el apellido) de los entrevistados. Nadie le puede identificar usando

396 | P a g e
Farmworker Housing Study and Action Plan for Salinas Valley and Pajaro Valley –
Final 2018
estos datos. Y si prefiere pueden darnos nombres inventados. Usamos los
nombres nomas para poder formular las preguntas en la encuesta. De
hecho, no reportamos ningún dato de nadie en específico. En nuestros
reportes solo publicamos datos generales y promedios y nunca el nombre
de ningún encuestado.
Los encuestados tienen el derecho absoluto de retirar su participación a
cualquier momento durante la encuesta. Participación es voluntaria.
El encuestado puede hacer cualquier pregunta al encuestador y
también puede hacer quejas a nuestra directora: Gail Wadsworth ( 925-
817-7565 o [email protected]) quien dirige el Instituto de
Estudios Rurales de California.
A. LENGUAJE
ADAPTACIÓN DEL LENGUAJE. Para cada pregunta es necesario que primero
se use el vocabulario indicado en el cuestionario en su esfuerzo de conseguir
una respuesta. Si el encuestado no entiende la pregunta, puede usar otras
palabras. Al hacer esta adaptación lingüística tenga cuidado de no cambiar
el significado de las preguntas. En lo posible, trate de adaptar su lenguaje al
nivel de comprensión que establezca el entrevistado. El error más común es
elaborar preguntas que no den opción al participante a escoger su propia
respuesta. Es decir no busque que el entrevistado conteste de la manera que
usted piense que debe contestar sino deje que el encuestado escoja su propia
respuesta.
1. Adapte a las variaciones lingüísticas de los entrevistados.
2. Pueden usar el tuteo donde es apropiado.
PRESENTACIÓN Y ESTILO.
1. ENTONACIÓN. Al hacer las preguntas en la entrevista, hágalas en forma
clara y natural. En las preguntas que piden alguna opinión del
entrevistado, asegúrese de no explicar la pregunta con ejemplos que
puedan influir en la respuesta. Esto puede causar que el entrevistado
responda de una manera que él crea que Ud. quiere escuchar.
2. CONTACTO VISUAL. Hable en forma clara. En lo posible mantenga la
mirada hacia el entrevistado y sea cortés y amable con él/ella a través
de la entrevista. Si el encuestado quiere hablar sobre cualquier tema,
deje que complete su idea antes de volver a la encuesta.

397 | P a g e
Farmworker Housing Study and Action Plan for Salinas Valley and Pajaro Valley –
Final 2018
3. MEMORIZAR LA ENCUESTA: Se tiene que memorizar la encuesta. Solo se
mira al formulario para anotar datos. La mirada del encuestador hasta
que se pueda debe estar enfocada en el encuestado.
4. CONCENTRACIÓN. Observe al entrevistado para asegurarse que haya
entendido la pregunta. De la misma manera, asegúrese de que el
entrevistado no se distraiga mientras Ud. hace la pregunta. Es permitido
que otras personas estén presentes durante la encuesta toda vez que no
distraigan al entrevistado.
5. DINÁMICA. Mientras documenta respuestas en el cuestionario, trate de
mantener al entrevistado hablando. Recuerde que mientras más tiempo
se quede el entrevistado sin hablar, más fácil es que éste se distraiga,
aburra, y pierda interés en la entrevista.
6. CONFIANZA. Desarrollar confianza con el entrevistado es el tipo de
conducta más importante para tener éxito en la entrevista. El nivel de
confianza mutuo entre el trabajador y usted determinará la calidad de la
entrevista. Para facilitar esta confianza recuerde establecer: respeto,
adaptación lingüística y cultural, humor y honestidad.
CÓMO DOCUMENTAR EL CUESTIONARIO
1. SIMPLIFICAR. Antes de empezar la entrevista complete toda la
información que ya debe saber por anticipado como el nombre del
empleador, la fecha, el cultivo, la tarea, etc. Siempre haga la encuesta
en lápiz para poder borrar y corregir sus anotaciones.
2. LEGIBILIDAD. Escriba en forma legible (clara), especialmente los números.
A veces es difícil escribir con toda legibilidad por las demandas de la
encuesta. Sin embargo, en la revisión obligatoria después de la
encuesta, se puede rectificarlo y dejar todo bien claro (ve #11 abajo).
3. MARCAR. Marque las casillas para las respuestas. Si marca la casilla
equivocada, haga la corrección correspondiente y coloque algún
comentario que clarifique la corrección. Durante la revisión (ve #11
abajo) puede tomar su tiempo y dejar bien claras las respuestas.
4. LECTURA DE OPCIONES. Asegúrese de distinguir entre las preguntas que
exigen leer las opciones y aquellas que NO debe leer. Para C28, por
ejemplo, se deja abierta la respuesta mientras C2 se lea las opciones.
5. MARQUE TODAS LAS PREGUNTAS. Si la pregunta no se aplica al
entrevistado, marque N/A en el formulario. Deje alguna marca en todas
las preguntas que compruebe que trató de hacerla. No salte ninguna
pregunta sin dejar una marca.

398 | P a g e
Farmworker Housing Study and Action Plan for Salinas Valley and Pajaro Valley –
Final 2018
6. MARQUE SÓLO UNA O MARQUE TODAS. CUIDADO CON RESPUESTAS
MÚLTIPLES. Tenga mucho cuidado en diferenciar las preguntas que
permiten marcar sólo una respuesta. Cuando las instrucciones le indican
“marque todas”, esto quiere decir que la pregunta permite respuestas
múltiples. Asegúrese de que cada respuesta (afirmativa) reportada por
el entrevistado sea marcada en el lugar especificado. Por ejemplo, para
E9 solo puede marcar una respuesta, mientras las preguntas E10 y E11
permiten múltiples respuestas.
7. LEER OPCIONES DE RESPUESTAS. Si exigen leer o preguntar por las
opciones de respuesta. Por ejemplo, en C18 se debe leer todas las 6
posibilidades más la posibilidad “otro”.
8. RESPUESTA AMBIGUA. Si el entrevistado le responde en forma ambigua y
usted no está seguro de que opción marcar, vuelva a repetir la pregunta
si es necesario en otras palabras, explicándole la intención de la
pregunta. Tenga cuidado de no influir en la respuesta. Si aun así, no
consigue una respuesta clara, anote esta dificultad al lado de la
pregunta en el cuestionario y sigue a la próxima.
9. PREGUNTAS ABIERTAS (COMENTARIOS, SIN OPCIONES). Para estas
respuestas, escriba en forma legible y concisa las respuestas del
trabajador. Si no entiende la respuesta, pregunte para aclarar y
documente la explicación.
10. SONDEAR O INDAGAR. Si tiene que sondear o indagar para obtener una
respuesta, hágalo con mucho tacto, reformulando la pregunta sin
intimidar al entrevistado que le puede dar una respuesta que cree que
usted prefiere escuchar.
11. CONTRADICCIONES. Si alguna respuesta contradice una respuesta
anterior, no confronte al entrevistado por la contradicción; simplemente
mencione que entendió o escribió equivocadamente la respuesta
anterior, solicítele ayuda para clarificar, y haga las correcciones
necesarias.
12. REVISIÓN DE LA ENCUESTA: Es crítico que revise la encuesta tan pronto
como posible después de completar la entrevista. Debe revisar cada
pregunta y si encuentra un error, corrígelo. Muchas veces puede
completar respuestas que ha olvidado de completar durante la encuesta
pero de las cuales se acuerdan con mucha claridad de la respuesta
correcta. Es recomendable, ir a un lugar seguro y tranquilo justo después
de la entrevista para que no se olvide lo que reportó el encuestado.
Muchas veces se puede encontrar un café o biblioteca cercanos a la
encuesta.

399 | P a g e
Farmworker Housing Study and Action Plan for Salinas Valley and Pajaro Valley –
Final 2018
1. DUDAS. Si tiene alguna duda en los procedimientos o en la colección de
cualquiera de estos datos, llame a Ildi Carlisle (831-345-2109) o Rick Mines
(916-710-9506).
INSTRUCCIONES EN LAS PREGUNTAS DE LA ENCUESTA
1. PALABRAS ENTRE BARRA DIAGONAL /. Estas son opciones para que escoja
la más apropiada de acuerdo a su criterio y al flujo de la entrevista.
2. PALABRAS ENTRE CORCHETES [ ]. En inglés: brackets. Éstas son sólo
instrucciones para el entrevistador; y sirven de referencia sólo para las
preguntas donde éstas aparecen. No lea estas instrucciones al
entrevistado.
3. RESPUESTAS CON NÚMEROS (DÍGITOS). Si la respuesta exige números,
asegúrese que la respuesta tiene un número de dígitos razonable. Por
ejemplo, en página 2, la respuesta a números de años completas de
escuela debe variar entre 0 y 25. No anote un número imposible. Y
también si la persona tiene 8 años de edad no marque que ha hecho
más de los años posibles de escuela.
4. ESCRIBIR CÓDIGO. Si la respuesta exige escribir el código listado, sólo use
el número correspondiente.
5. NOTA. Si no está seguro del código que corresponde a la respuesta,
marque “Otro” y escriba la respuesta.
6. Un ejemplo es el código por relación (variable A2) en páginas 2 y 3.
7. SUELDOS/SALARIOS. En las preguntas referentes al pago por hora,
primero haga el cálculo para determinar el sueldo por hora y verifique
con el entrevistado si el cálculo esté correcto. Si después de
verificación, Ud. considera que la cantidad no es factible o razonable
(Por ejemplo, $60.00 por hora, o $0.50 por hora), consulte con el
entrevistado y haga las correcciones necesarias. Ve E8.
8. PERÍODOS DE REFERENCIAS. Preste especial atención al tiempo al que se
refiere la pregunta. Aunque la mayoría de ellas se refiere a los últimos 12
meses, hay algunas que no cubren ese período. Usamos el periodo “en
los últimos 3 meses” en varias preguntas, por ejemplo. También, dado
que nuestro enfoque es sobre condiciones de vivienda en el área de los
dos condados, hay casos en que se debe preguntar sobre el domicilio
actual aunque el encuestado haya vivido menos de tres meses en el
domicilio. Ve C12 a C21.
9. EN LOS EE.UU. Aunque la instrucción “en los EE.UU” aparenta ser
redundante a través del cuestionario, su repetición tiene como propósito
evitar que el trabajador entrevistado si es un inmigrante, interprete y
400 | P a g e
Farmworker Housing Study and Action Plan for Salinas Valley and Pajaro Valley –
Final 2018
responda las preguntas usando como punto de referencia su país de
origen.
10. RESPUESTAS INCONCLUSAS, OMISIONES. Asegúrese de que todas las
preguntas en el cuestionario tengan respuestas. Si alguna pregunta no
tiene respuesta, ponga nota, comentario o simplemente marque N/A o
no N/R. Sino, tenemos que considerarla como si nunca fue preguntada.
Cuando el participante no sabe la respuesta o rehúsa dar una respuesta;
o cuando la pregunta no es relevante para el entrevistado, marque N/A
o N/R. (No aplicable o no responde)
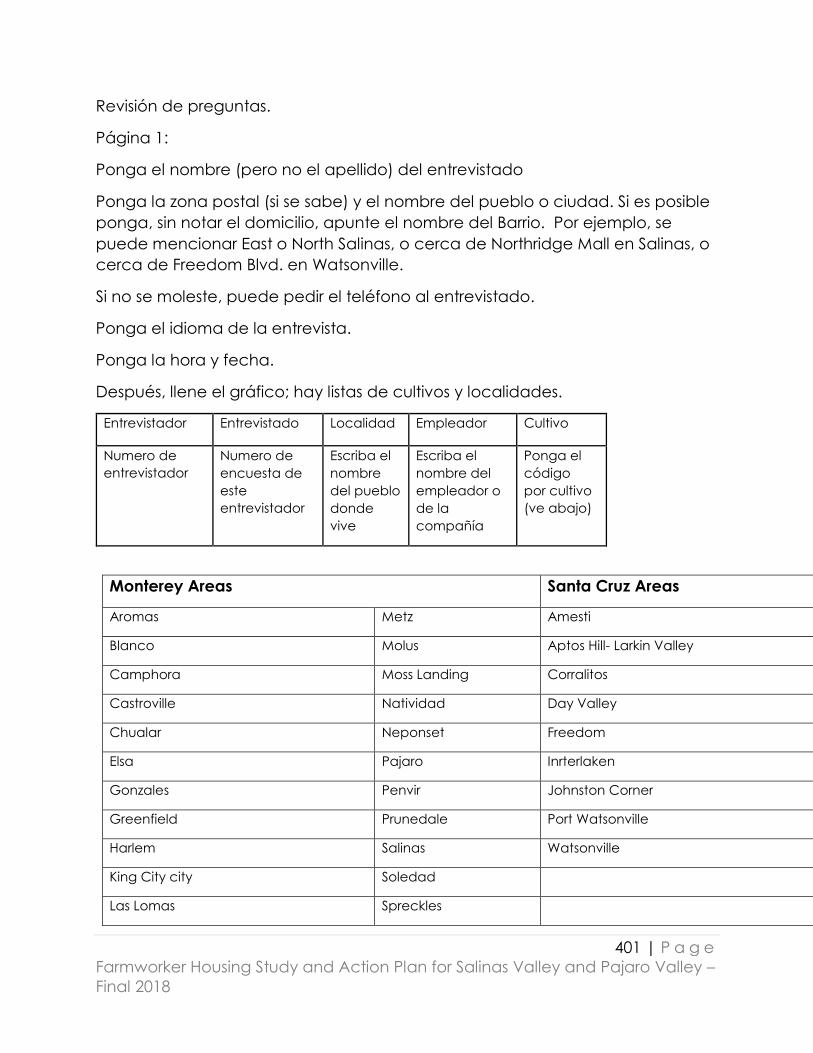
401 | P a g e
Farmworker Housing Study and Action Plan for Salinas Valley and Pajaro Valley –
Final 2018
Revisión de preguntas.
Página 1:
Ponga el nombre (pero no el apellido) del entrevistado
Ponga la zona postal (si se sabe) y el nombre del pueblo o ciudad. Si es posible
ponga, sin notar el domicilio, apunte el nombre del Barrio. Por ejemplo, se
puede mencionar East o North Salinas, o cerca de Northridge Mall en Salinas, o
cerca de Freedom Blvd. en Watsonville.
Si no se moleste, puede pedir el teléfono al entrevistado.
Ponga el idioma de la entrevista.
Ponga la hora y fecha.
Después, llene el gráfico; hay listas de cultivos y localidades.
Entrevistador Entrevistado Localidad Empleador Cultivo
Numero de
entrevistador
Numero de
encuesta de
este
entrevistador
Escriba el
nombre
del pueblo
donde
vive
Escriba el
nombre del
empleador o
de la
compañía
Ponga el
código
por cultivo
(ve abajo)
Monterey Areas Santa Cruz Areas
Aromas Metz Amesti
Blanco Molus Aptos Hill- Larkin Valley
Camphora Moss Landing Corralitos
Castroville Natividad Day Valley
Chualar Neponset Freedom
Elsa Pajaro Inrterlaken
Gonzales Penvir Johnston Corner
Greenfield Prunedale Port Watsonville
Harlem Salinas Watsonville
King City city Soledad
Las Lomas Spreckles
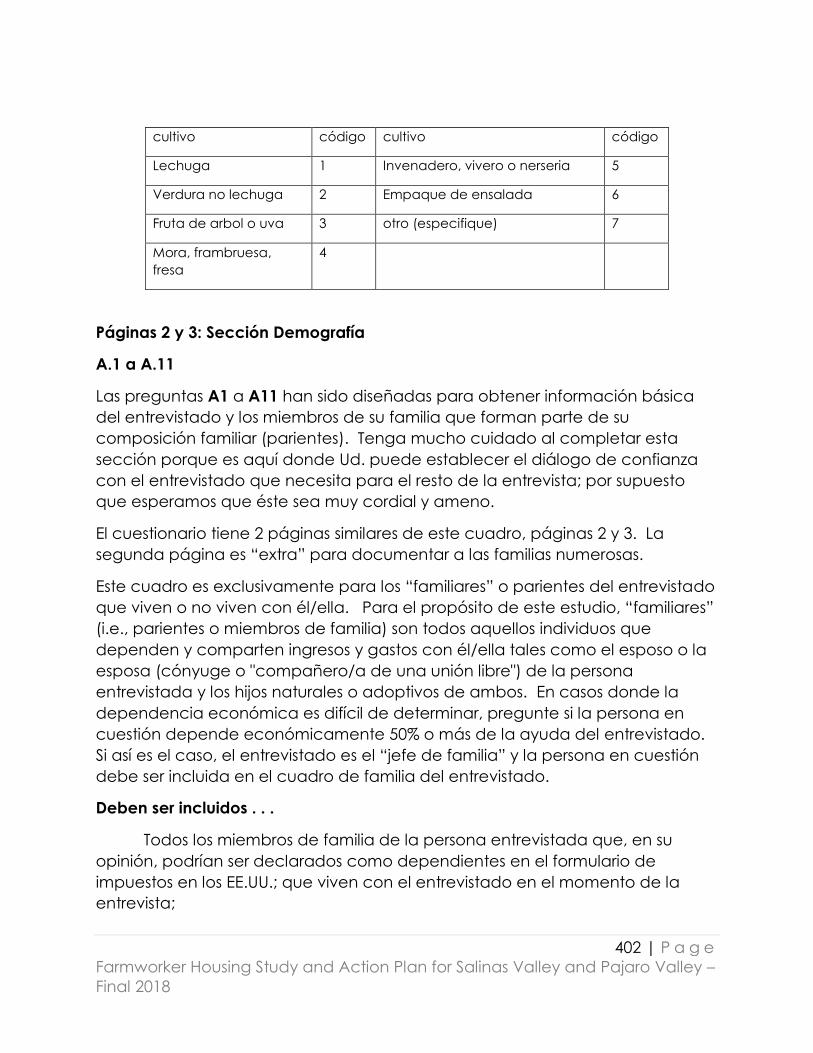
402 | P a g e
Farmworker Housing Study and Action Plan for Salinas Valley and Pajaro Valley –
Final 2018
cultivo código cultivo código
Lechuga 1 Invenadero, vivero o nerseria 5
Verdura no lechuga 2 Empaque de ensalada 6
Fruta de arbol o uva 3 otro (especifique) 7
Mora, frambruesa,
fresa
4
Páginas 2 y 3: Sección Demografía
A.1 a A.11
Las preguntas A1 a A11 han sido diseñadas para obtener información básica
del entrevistado y los miembros de su familia que forman parte de su
composición familiar (parientes). Tenga mucho cuidado al completar esta
sección porque es aquí donde Ud. puede establecer el diálogo de confianza
con el entrevistado que necesita para el resto de la entrevista; por supuesto
que esperamos que éste sea muy cordial y ameno.
El cuestionario tiene 2 páginas similares de este cuadro, páginas 2 y 3. La
segunda página es “extra” para documentar a las familias numerosas.
Este cuadro es exclusivamente para los “familiares” o parientes del entrevistado
que viven o no viven con él/ella. Para el propósito de este estudio, “familiares”
(i.e., parientes o miembros de familia) son todos aquellos individuos que
dependen y comparten ingresos y gastos con él/ella tales como el esposo o la
esposa (cónyuge o "compañero/a de una unión libre") de la persona
entrevistada y los hijos naturales o adoptivos de ambos. En casos donde la
dependencia económica es difícil de determinar, pregunte si la persona en
cuestión depende económicamente 50% o más de la ayuda del entrevistado.
Si así es el caso, el entrevistado es el “jefe de familia” y la persona en cuestión
debe ser incluida en el cuadro de familia del entrevistado.
Deben ser incluidos . . .
Todos los miembros de familia de la persona entrevistada que, en su
opinión, podrían ser declarados como dependientes en el formulario de
impuestos en los EE.UU.; que viven con el entrevistado en el momento de la
entrevista;
403 | P a g e
Farmworker Housing Study and Action Plan for Salinas Valley and Pajaro Valley –
Final 2018
NO deben ser incluidos . . .
...ni roommates ni housemates.” Aquellos que viven en la misma vivienda
(ej. Casa, apartamento, “tráiler”, etc.) pero que para propósitos de declaración
de impuestos no podrían ser declarados como dependientes por el
entrevistado ni declarar al entrevistado como dependiente. No interesa si estas
personas están relacionadas con el entrevistado.
...ni se incluye otras personas que compartan la misma vivienda (o propiedad),
pero no son parte de la unidad familiar y económica del entrevistado.
Solo nombres…
Acuérdese que solo se pide el nombre (y no el apellido) de la persona. Se pide
el nombre de el encuestado y de los miembros de su familia para poder tener
una conversación sobre los detalles de edad, nivel de escolaridad, etc. Pero,
no importa si los nombres son exactos toda vez que el encuestador pueda
notar con exactidud los datos de cada individuo.
La correcta documentación de datos en el Household Grid es de mucha
importancia para los análisis demográficos de esta encuesta; además, sirve
como “filtro” para el desarrollo de preguntas en otras secciones del
cuestionario. Es por eso que debe tener mucho cuidado al completar esta
sección.
Generalmente, es mejor anotar todos los nombres, relaciones y el género
primero (A.1 a A.3) primero, y luego conseguir los datos para cada miembro del
hogar después (A.4-A.11).
Es decir que uno llena verticalmente (por columnas de la tabla) los datos por
A.1 a A.3 primero aun si uno tiene que dar vuelta a la página. Despues uno
vuelve a preguntar horizontalmente (por filas de la tabla) persona por persona
A.4 a A.11.
Se comienza: “Ahora, voy a notar los nombres de cada uno de los miembros
de su hogar. Aquí, estoy refiriendo a los que han vivido aquí por dos semanas o
más y que comparten gastos. Primero usted: nombre__________? Luego, su
esposo/a nombre:______. Su hijo/el mayor nombre:______, etc., etc.” Marque 8
como relación por el entrevistado en A.2 y género en A.3, marque 1 a 7 como
relación y marque género para los demás miembros. Se puede preguntar:
“Qué relación tiene con usted?” (Ve los códigos abajo↓)
Estos son los códigos:

404 | P a g e
Farmworker Housing Study and Action Plan for Salinas Valley and Pajaro Valley –
Final 2018
Relación A.2: Año que entró A.9:
1 = Esposo/a o juntado/a 5 = nieto/a Si nació en EEUU, ponga 999
2 = hijo o hijo adoptivo 6 = Otro pariente
3 = hermano/a 7 = Otro ________
4 = padre o madre 8= entrevistado
A.4 “Ahora, está casado o juntado usted?” marque por el entrevistado: c,
s,v,d.
A.5-A.7 “Donde nació, que estado? Escriba el nombre del estado y
marque E, M, O o llene A.7.
A.8 “En que año nació?” Si no saben pida su edad y después de la
entrevista haga el cálculo.
A.9 “En que año vino por primera vez para trabajar o vivir en los EEUU?”
marque el año
A.10 “Cuantos años de escuela en total tiene usted, incluyendo primaria,
secundaria, prepa y todos los años que asistió aquí en los EEUU.?” No se
incluye clases de inglés en este cálculo pero solo clases en una escuela que
enseña materias.
A.11 “Ha trabajado un mes o más en la agricultura en los últimos 12 meses?”
Si ya sabe que el entrevistado es trabajador del campo o empaque no es
necesario hacerle esta pregunta. Nomás puede marcar Sí. Pero, para los
demás miembros de la casa debe hacer la pregunta.
Después de completar A.4 a A.11 para el entrevistado (relación=8), el
encuestador hará las preguntas al encuestado sobre los demás miembros de su
hogar (fila por fila). A veces se puede hacer las preguntas en forma resumida.
Por ejemplo, si todos los niños tienen menos de 16 años se puede confirmar su
estado civil (A.4) con una pregunta: “ningún hijo está casado, verdad?” O, si
sospecha que todos los hijos nacieron en los EEUU, se puede preguntar: “Sus
hijos todos nacieron aquí o algunos nacieron en México?” Las respuestas
resumidas pueden simplificar la anotación de los datos.
Página 4
B1 Se comienza esta sección con: “Ahora, quiero saber cuántos hijos
(incluyendo a los adoptivos) menos de 21 años tiene usted viviendo fuera del
hogar (B1a)? Y de éstos, cuantos viven en su país y cuantos viven en los EEUU?”
Ya pueden llenar B1b. y B1c.
405 | P a g e
Farmworker Housing Study and Action Plan for Salinas Valley and Pajaro Valley –
Final 2018
B2 Para la pregunta B2, se explica al entrevistado que corresponde al
domicilio. “Se incluye todas las estructuras y lugares para dormir dentro de la
propiedad de la misma dirección.”
Después se pregunta (B2a): “Aparte/además de las personas que me
mencionó anteriormente, ¿Hay otras personas que viven con Ud. (en su casa o
apartamento o ‘tráiler’/etc.) o en la misma propiedad ahora?” Marque Sí o
No. Si es “no”, puede saltar a B3. Si es “sí” hay que seguir con B2b. y B2c.
“De los que viven en esta propiedad, cuántos hombres y mujeres adultos hay?
(B2b1 y B2b2) La mayoría de ellos trabajan en la agricultura?” (B2b3)
“Y en esta propiedad, cuantos menores varones y muchachas hay? (B2c1 y
B2c2) Trabajan la mayoría en la agricultura?” (B2c3)
En este momento (B2d.) es buena idea de calcular el total de personas
viviendo en la casa para después compararlo con la respuesta a C19 en
página 11. Sume A1_y B2= ____
Es decir se suman todas personas en páginas 2 y 3 (A1) y todas las personas en
página 4 (B2b y B2c)
B3 Para B3.a si hay duda sobre los nombres de los pueblos en los dos
condados se puede usar la lista de pueblos arriba para identificar los linderos
de los dos condados. La lista aparece en la última página de la encuesta
también. Para B3.b el lugar puede estar en cualquier lado incluyendo a un
lugar en México. Escriba nomas los nombres de los pueblos y estados. Posible
respuestas: Yuma, AZ o Hollister, CA o San Luis Rio Colorado, Sonora. Si el
encuestado sabe el pueblo y no el estado. El encuestador debe buscar el
nombre del estado en el internet después de la encuesta y llenar el casillero
apropiado.
Página 5
B4 Para los que tienen una casa permanente durante 12 meses se pregunta
si han tenido que mudarse para obtener empleo. Se pide el pueblo y estado
en donde trabajaban. Se nota los 4 lugares más importantes. (Se definen como
los 4 donde ganaron más dinero.)
B5 Para los que dicen que no han tenido una casa permanente durante los
últimos meses (se cree que va a ser una minoría) se anota sus sitios de trabajo y
periodos de estancia. Se anota lugares en otros países también.
Página 6

406 | P a g e
Farmworker Housing Study and Action Plan for Salinas Valley and Pajaro Valley –
Final 2018
B6 pide el lugar donde vive mientras trabaja en los dos condados. Dése cuenta
que si la respuesta indica que el encuestado tiene una casa permanente
dentro o cerca de los dos condados se salta a la pregunta C1
Preguntas B7 a B10 son para los que NO tienen hospedaje permanente en los
dos condados.
B7,B8 B7 pide el tipo de estructura o vivienda temporal donde vive cuando
está trabajando en los dos condados. B8 pregunta si anda acompañado bajo
estas circunstancias.
B7,B8,B9 Se marca todos que se aplican.
Página 7
B9,B10 Estas preguntas indagan porque el encuestado elige no vivir en los
dos condados y si preferiría vivir allí si tuvo la opción.
Página 8
C1-C26 Estas preguntas se refiere al domicilio donde ha vivido la mayoría
del tiempo en los últimos 3 meses en el área de Salinas/Pajaro. Dado que el
enfoque del estudio es la vivienda local, si el encuestado acaba de llegar de
otra parte se pregunta por el domicilio en el área de los dos condados aunque
no sea el lugar donde ha vivido por la mayoría del tiempo en los últimos 3
meses. Por ejemplo, es posible que los trabajadores H-2A no hayan estado en
el área por 3 meses. No obstante, se debe indagar sobre su vivienda local y
actual.
C1 Pregunta si vive en la propiedad del patrón que sigue una opción por
algunos. Si el encuestado está quedando en un motel pagado por el patrón la
respuesta es “no”. Solo se refiere a gente viviendo “en” la propiedad del
patrón.
Página 9
C2 Pida el tipo de domicilio o estructura que ha ocupado por la mayoría del
tiempo en los últimos 3 meses o el actual si acaba de llegar a los dos condados.
Si la persona es “homeless” o sin techo se debe anotar las condiciones al final
de la encuesta. No hay preguntas de seguimiento enfocadas en este tipo de
“alojamiento”.
C3 Está buscando si ha ocupado una vivienda patrocinado por algún
programa público y pide el nombre del programa en C3a.
407 | P a g e
Farmworker Housing Study and Action Plan for Salinas Valley and Pajaro Valley –
Final 2018
C4 Se identifica si es dueño o renta y salta a las preguntas relevantes. Si no
paga renta se salta a C11.
C5-C7 Se pregunta el alquiler para todo el domicilio y la parte pagada
por el encuestado. Si paga todo se sigue a C7. Si comparta el pago con otros,
deben contestar las dos preguntas C6 (para todos) y C7 para el encuestado
nomas. Es crítico que en el caso que la persona que no comparte la renta que
salta el C6 y se lo marca con N/A.
Página 10
C8-C10 Se pregunta por la hipoteca para todo el domicilio y la parte pagada
por el encuestado. Si paga todo se sigue a C10. Si comparta el pago con
otros, deben contestar las dos preguntas C9 (para todos) y C10 para el
encuestado nomas. Es crítico en el caso que la persona no comparte la
hipoteca que salta el C9 y se lo marca con N/A.
C11 Pida al encuestado si el cobra renta a otros. Se nota la cantidad en
C11a.
C12-C19 Son unas preguntas para determinar que tan amontonado
(hacinado) es el domicilio y si usan cuartos o lugares que no son recámaras
para dormir. Otra vez, si acaba de llegar de otra parte se pregunta por el
domicilio en el área aunque no es el lugar donde ha vivido por la mayoría del
tiempo en los últimos 3 meses. Si ha vivido en varios lugares en el área en los
últimos 3 meses, pida el domicilio donde paso la mayoría (o la mayoría relativa)
de su tiempo.
Número habitaciones. Pida primero...
C12 número de recámaras o dormitorios o alcobas? Para esta pregunta, nos
referimos a las habitaciones construídas originalmente como cuartos para
dormir. Recuerde verificar las variaciones regionales. “Bedroom” puede ser en
español: dormitorio, recámara, alcoba o cuarto de dormir.
C13 número de baños? Aquí nos referimos al “cuarto de baño”. Si le responde
que este cuarto sólo tiene toilet (excusado, inodoro, WC, retrete, etc.) sin
“ducha, tina o regadera” considérelo como cuarto de baño.
C14 número de cuartos de cocina? Aunque parezca obvio, hay familias de
campesinos que comparten una misma vivienda, pero tienen cuartos de
cocinas separados. Simplemente anote la respuesta.
408 | P a g e
Farmworker Housing Study and Action Plan for Salinas Valley and Pajaro Valley –
Final 2018
C15 número de otras habitaciones o cuartos? Por habitación nos referimos a
cualquier otro cuarto que no coincida con las categorías anteriormente
mencionadas. No necesita describirlas, incluyen “sala, cuarto de lavandería,
salón de recreo o entretenimiento, etc.).
C16 Pregunte solo sobre las recámaras para esta pregunta.
Página 11
C17,C18 Si contesta sí a C17, lea a todas las opciones en C18 y anote el
número de gente menor y mayor de 18 años durmiendo fuera de recamaras.
C19 Asegúrese que está contando a todos que duermen en la propiedad.
Debe de comparar el cálculo de páginas 2,3, y 4 (la pregunta B2d) para validar
el número que se da en C19. Si no son iguales hay que indagar cual es la suma
correcta. Si faltaba gente en las preguntas en las 2, 3 y 4 se pueden volver a
agregar las personas que faltan al final de la encuesta. No se olvide!
C20 Si hay una temporada, escriba el mes o meses en C20a.
Página 12
C21,C22 En C21 se está indagando si hubo hombres y mujeres que no se
conocieron obligados a dormir juntos en el mismo cuarto. En C22, se está
indagando si niños fueron obligados de pasar la noche en el mismo cuarto con
adultos no conocidos por los niños.
C23 Se está indagando si hubo ocasiones en que una persona residente en la
casa que normalmente paga una parte de la renta, causó una interrupción de
pagos.
C24 Ponga el mes o meses de dificultad en C24a.
C25,C26 Anote el dinero pagado mensualmente por estos servicios. O
marque si uno o más están incluidos.
Página 13
C27 Lea toda la lista uno por uno y marque si tienen el servicio y si funciona.
Página 14
C28 No sugiera respuestas al encuestado sino espere que conteste. Si no
contesta, debe de leer la lista abajo.
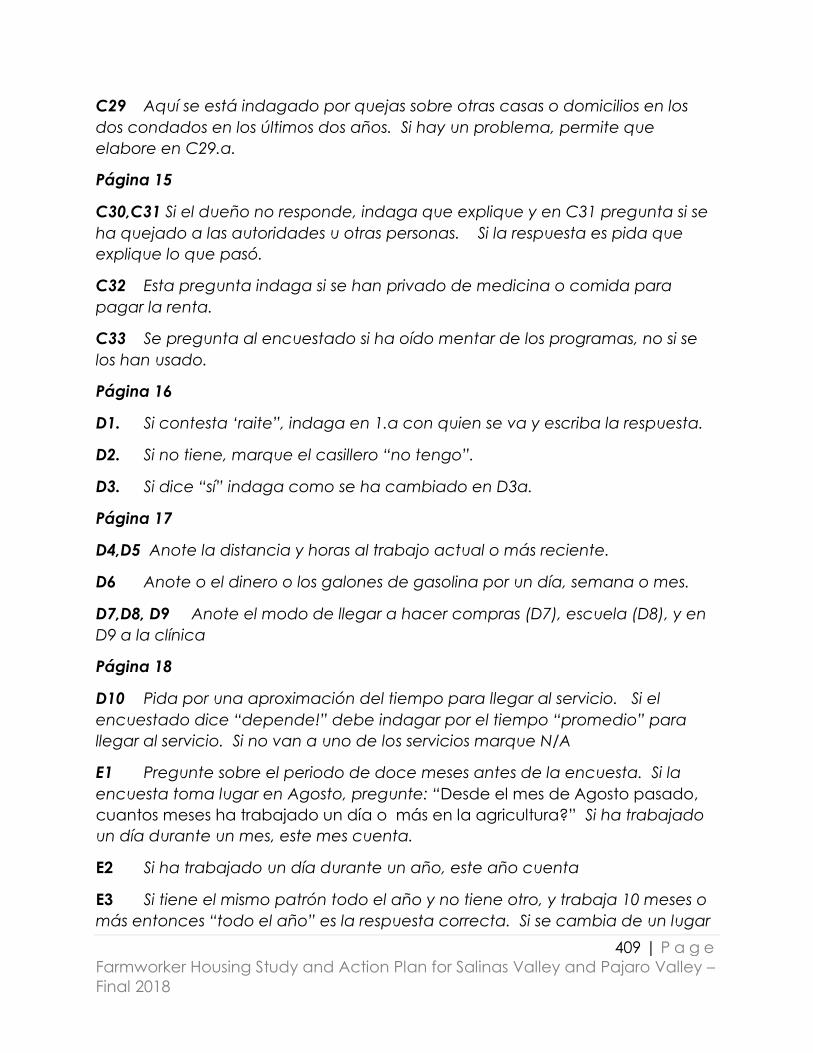
409 | P a g e
Farmworker Housing Study and Action Plan for Salinas Valley and Pajaro Valley –
Final 2018
C29 Aquí se está indagado por quejas sobre otras casas o domicilios en los
dos condados en los últimos dos años. Si hay un problema, permite que
elabore en C29.a.
Página 15
C30,C31 Si el dueño no responde, indaga que explique y en C31 pregunta si se
ha quejado a las autoridades u otras personas. Si la respuesta es pida que
explique lo que pasó.
C32 Esta pregunta indaga si se han privado de medicina o comida para
pagar la renta.
C33 Se pregunta al encuestado si ha oído mentar de los programas, no si se
los han usado.
Página 16
D1. Si contesta ‘raite”, indaga en 1.a con quien se va y escriba la respuesta.
D2. Si no tiene, marque el casillero “no tengo”.
D3. Si dice “sí” indaga como se ha cambiado en D3a.
Página 17
D4,D5 Anote la distancia y horas al trabajo actual o más reciente.
D6 Anote o el dinero o los galones de gasolina por un día, semana o mes.
D7,D8, D9 Anote el modo de llegar a hacer compras (D7), escuela (D8), y en
D9 a la clínica
Página 18
D10 Pida por una aproximación del tiempo para llegar al servicio. Si el
encuestado dice “depende!” debe indagar por el tiempo “promedio” para
llegar al servicio. Si no van a uno de los servicios marque N/A
E1 Pregunte sobre el periodo de doce meses antes de la encuesta. Si la
encuesta toma lugar en Agosto, pregunte: “Desde el mes de Agosto pasado,
cuantos meses ha trabajado un día o más en la agricultura?” Si ha trabajado
un día durante un mes, este mes cuenta.
E2 Si ha trabajado un día durante un año, este año cuenta
E3 Si tiene el mismo patrón todo el año y no tiene otro, y trabaja 10 meses o
más entonces “todo el año” es la respuesta correcta. Si se cambia de un lugar

410 | P a g e
Farmworker Housing Study and Action Plan for Salinas Valley and Pajaro Valley –
Final 2018
a otro (por ejemplo si se va a Yuma), pero tiene el mismo patrón, todavía “todo
el año” es la respuesta correcta.
E4,E5 Anote aquí los dos cultivos principales (si hay dos) como lechuga, brócoli,
fresa, etc. o marque empaque. Para E5 ponga el desaije, la cosecha, operario
de máquina, regador, etc. Ponga las dos principales tareas si hay dos.
Página 19
E6 Anote la forma de pago usual en el trabajo actual o más reciente por el
último pago.
E7 En E7a anote el dinero pagado en cualquier forma después de todas las
rebajas. En E7b, anote en total o en bruto antes de las rebajas.
E8 En E8 anote las horas trabajadas para ganar este cheque o pago. Y
luego, usando su calculadora haga un cálculo dividiendo el pago en bruto por
las horas (E7b/horas). En seguida pregunta al encuestado: “Este es mi cálculo,
¿le parece correcto? ¿Gana tanto por hora?” Si él dice “no”, entonces
pregúntale: “Entonces, cuánto gana”. Si el pago todavía parece
imposiblemente alto o bajo (por ejemplo $60 o $.50/hora), indague una vez
más para asegurar que el encuestado le está dando una respuesta posible.
E9 Es mejor mostrar la lista al entrevistado. Explique que se incluye a todos
que están en su hogar o unidad presupuestarios/de compartir gastos. Y
explique que se incluye solo dinero ganado en los EEUU y no cuenta asistencia
como estampillas de comida.
Página 20
E10,E11 Hay que leer las opciones. Se incluye a todos bienes que están
comprando o de que ya son dueños. En México, hay pocas hipotecas. No se
incluye bienes de sus padres pero de ellos mismos.
E12,E13 Estas preguntas son abiertas, no sugiera las respuestas a lo
encuestados.

411 | P a g e
Farmworker Housing Study and Action Plan for Salinas Valley and Pajaro Valley –
Final 2018
Appendix 6: Survey Instrument, Spanish
Encuesta para la Mejora de la Vivienda de los Trabajadores
Agrícolas en los Valles de Salinas y Pájaro (2017)
Todo lo que me dice es confidencial. No usaré su nombre de ninguna manera
públicamente. Todas estas preguntas son voluntarias. Si no se siente cómodo con
cualquier pregunta, puede optar por no responder. ¿Está claro? (DEBE CONSEGUIR
UN SÍ PARA MOVER HACIA ADELANTE) Sí (Continuar) No (Agradezca.)
T1 Nombre (sin apellido) del entrevistado
_______________________________________
T2 Zona Postal T3 Barrio T4 Pueblo o Ciudad
____________ __________________________ _______________________
T5 Idioma de la entrevista ____________ T6 Lugar de la entrevista _____
T7 Fecha ____/________/_______ T8 Hora: ____
cultivo código cultivo código
Lechuga 1 Invernadero, vivero o nersería 5
Verdura no lechuga 2 Empaque de ensalada 6
Fruta de arbol o uva 3 otro (especifique) 7
Mora, frambruesa, fresa 4
Códigos:
Entrevistador Entrevistado Localidad Empleador Cultivo
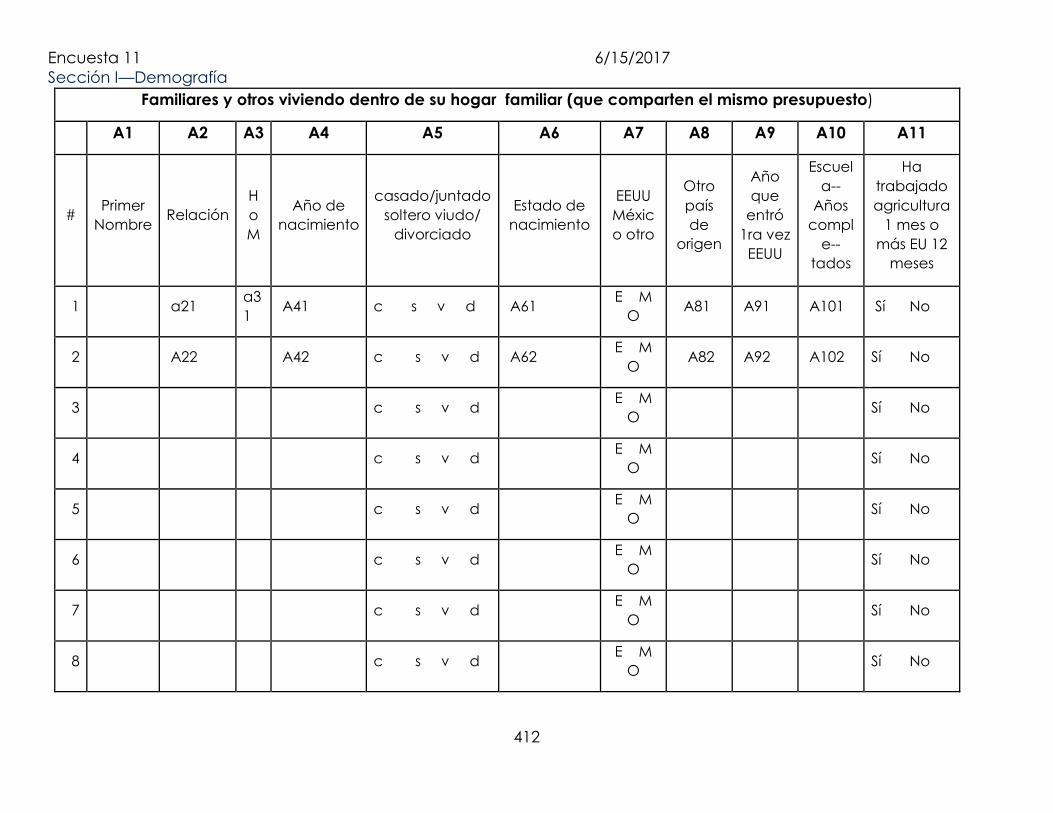
Encuesta 11 6/15/2017
412
Sección I—Demografía
Familiares y otros viviendo dentro de su hogar familiar (que comparten el mismo presupuesto)
A1 A2 A3 A4 A5 A6 A7 A8 A9 A10 A11
# Primer
Nombre Relación
H
o
M
Año de
nacimiento
casado/juntado
soltero viudo/
divorciado
Estado de
nacimiento
EEUU
Méxic
o otro
Otro
país
de
origen
Año
que
entró
1ra vez
EEUU
Escuel
a--
Años
compl
e--
tados
Ha
trabajado
agricultura
1 mes o
más EU 12
meses
1 a21 a3
1 A41 c s v d A61
E M
O A81 A91 A101 Sí No
2 A22 A42 c s v d A62 E M
O A82 A92 A102 Sí No
3 c s v d E M
O Sí No
4 c s v d E M
O Sí No
5 c s v d E M
O Sí No
6 c s v d E M
O Sí No
7 c s v d E M
O Sí No
8 c s v d E M
O Sí No
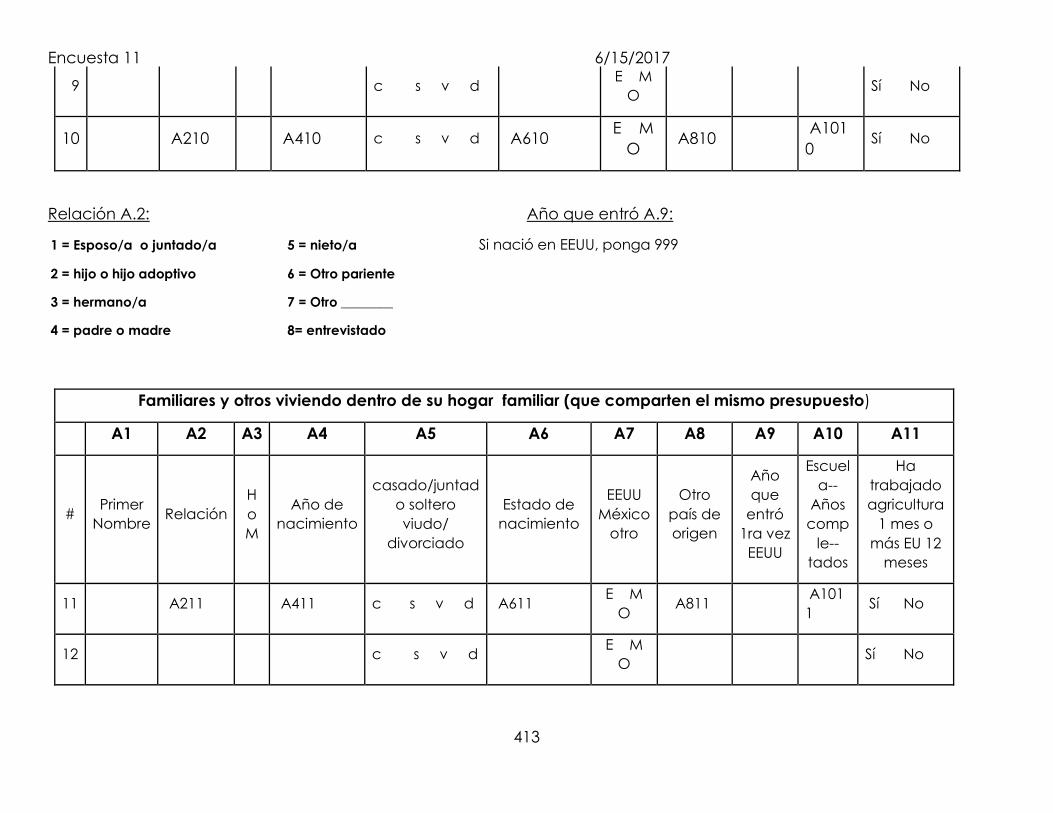
Encuesta 11 6/15/2017
413
9 c s v d E M
O Sí No
10 A210 A410 c s v d A610 E M
O A810
A101
0 Sí No
Relación A.2: Año que entró A.9:
1 = Esposo/a o juntado/a 5 = nieto/a Si nació en EEUU, ponga 999
2 = hijo o hijo adoptivo 6 = Otro pariente
3 = hermano/a 7 = Otro ________
4 = padre o madre 8= entrevistado
Familiares y otros viviendo dentro de su hogar familiar (que comparten el mismo presupuesto)
A1 A2 A3 A4 A5 A6 A7 A8 A9 A10 A11
# Primer
Nombre Relación
H
o
M
Año de
nacimiento
casado/juntad
o soltero
viudo/
divorciado
Estado de
nacimiento
EEUU
México
otro
Otro
país de
origen
Año
que
entró
1ra vez
EEUU
Escuel
a--
Años
comp
le--
tados
Ha
trabajado
agricultura
1 mes o
más EU 12
meses
11 A211 A411 c s v d A611 E M
O A811
A101
1 Sí No
12 c s v d E M
O Sí No
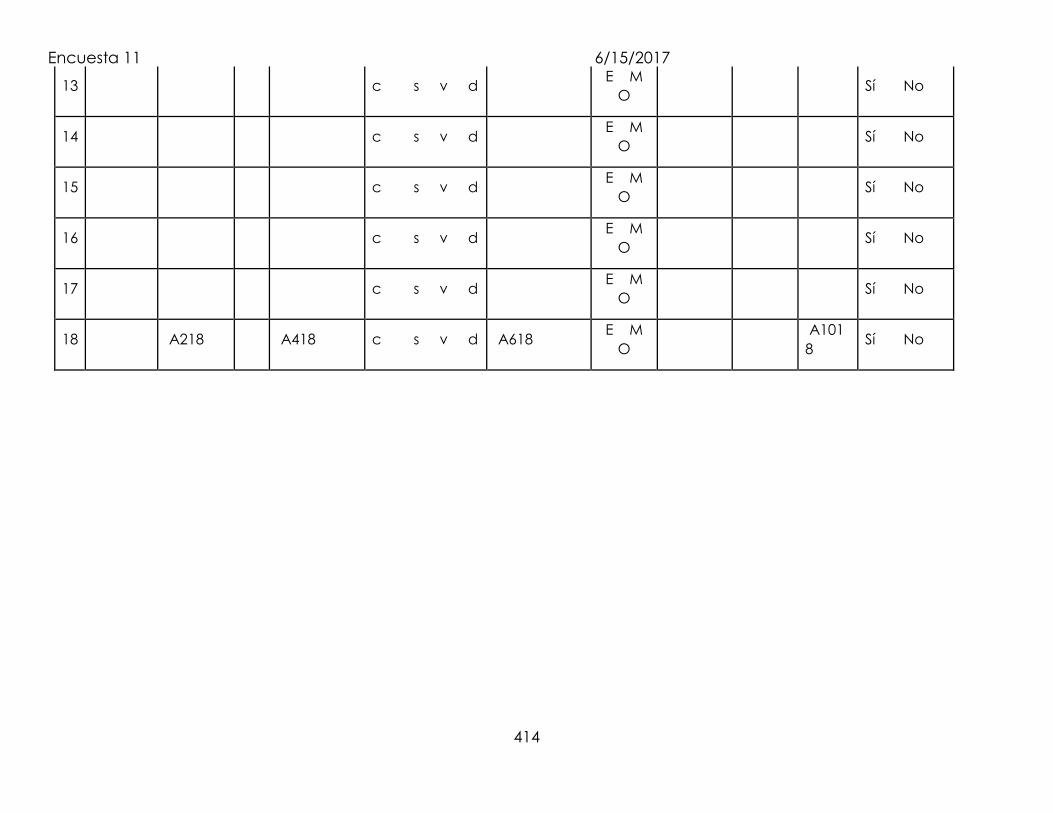
Encuesta 11 6/15/2017
414
13 c s v d E M
O Sí No
14 c s v d E M
O Sí No
15 c s v d E M
O Sí No
16 c s v d E M
O Sí No
17 c s v d E M
O Sí No
18 A218 A418 c s v d A618 E M
O
A101
8 Sí No
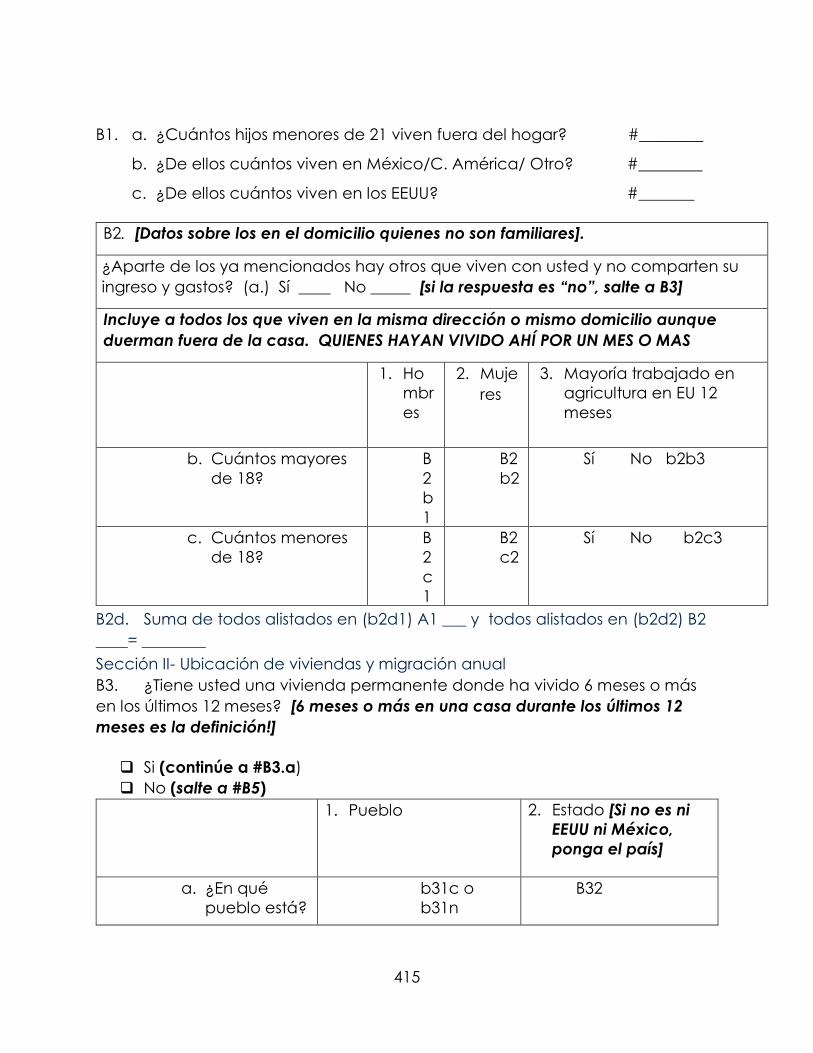
415
B1. a. ¿Cuántos hijos menores de 21 viven fuera del hogar? #________
b. ¿De ellos cuántos viven en México/C. América/ Otro? #________
c. ¿De ellos cuántos viven en los EEUU? #_______
B2. [Datos sobre los en el domicilio quienes no son familiares].
¿Aparte de los ya mencionados hay otros que viven con usted y no comparten su
ingreso y gastos? (a.) Sí ____ No _____ [si la respuesta es “no”, salte a B3]
Incluye a todos los que viven en la misma dirección o mismo domicilio aunque
duerman fuera de la casa. QUIENES HAYAN VIVIDO AHÍ POR UN MES O MAS
1. Ho
mbr
es
2. Muje
res
3. Mayoría trabajado en
agricultura en EU 12
meses
b. Cuántos mayores
de 18?
B
2
b
1
B2
b2
Sí No b2b3
c. Cuántos menores
de 18?
B
2
c
1
B2
c2
Sí No b2c3
B2d. Suma de todos alistados en (b2d1) A1 ___ y todos alistados en (b2d2) B2
____= ________
Sección II- Ubicación de viviendas y migración anual
B3. ¿Tiene usted una vivienda permanente donde ha vivido 6 meses o más
en los últimos 12 meses? [6 meses o más en una casa durante los últimos 12
meses es la definición!]
Si (continúe a #B3.a)
No (salte a #B5)
1. Pueblo 2. Estado [Si no es ni
EEUU ni México,
ponga el país]
a. ¿En qué
pueblo está?
b31c o
b31n
B32
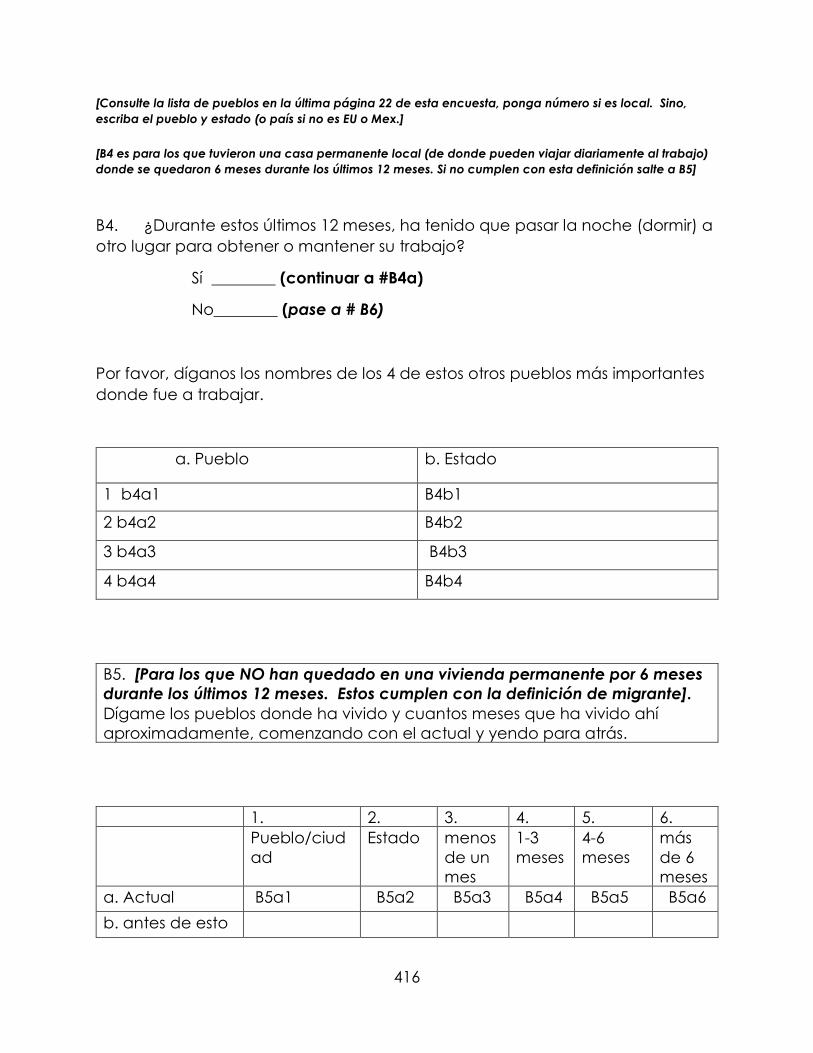
416
[Consulte la lista de pueblos en la última página 22 de esta encuesta, ponga número si es local. Sino,
escriba el pueblo y estado (o país si no es EU o Mex.]
[B4 es para los que tuvieron una casa permanente local (de donde pueden viajar diariamente al trabajo)
donde se quedaron 6 meses durante los últimos 12 meses. Si no cumplen con esta definición salte a B5]
B4. ¿Durante estos últimos 12 meses, ha tenido que pasar la noche (dormir) a
otro lugar para obtener o mantener su trabajo?
Sí ________ (continuar a #B4a)
No________ (pase a # B6)
Por favor, díganos los nombres de los 4 de estos otros pueblos más importantes
donde fue a trabajar.
a. Pueblo b. Estado
1 b4a1 B4b1
2 b4a2 B4b2
3 b4a3 B4b3
4 b4a4 B4b4
B5. [Para los que NO han quedado en una vivienda permanente por 6 meses
durante los últimos 12 meses. Estos cumplen con la definición de migrante].
Dígame los pueblos donde ha vivido y cuantos meses que ha vivido ahí
aproximadamente, comenzando con el actual y yendo para atrás.
1. 2. 3. 4. 5. 6.
Pueblo/ciud
ad
Estado menos
de un
mes
1-3
meses
4-6
meses
más
de 6
meses
a. Actual B5a1 B5a2 B5a3 B5a4 B5a5 B5a6
b. antes de esto

417
c. antes de esto B5c2
d. antes de esto
e. antes de esto B5e4
f. antes de esto
g. antes de esto
h. antes de esto B5h1 B5h2 B5h3 B5h4 B5h5 B5h6
B6. ¿Por la mayoría del tiempo, mientras trabaja en el condado de
Monterey o Santa Cruz, dónde vive? [Marque solo una opción. En muchos
casos, ya dijo el informante (en B3) que tiene vivienda permanente. Pero hay
que marcar la respuesta antes de saltar a #C1.]
1 Vuelvo a mi casa permanente dentro de los 2 condados [si marca esto
pase a la pregunta #C1]
2 Vuelvo a mi casa permanente a un condado cercano donde puedo
volver cada noche (a.)(especifique el pueblo (b62a)___________________
condado (b62b)_____________ [si marca esto pase a la pregunta #C1]
3 Me quedo en el rancho donde trabajo
4 Me quedo con parientes/amigos mientras trabajo en los 2 condados
5 Me quedo en otro lugar dentro de los 2 condados.
Explique (b62c)_______________________________________________________
6 No sé
7 No responde
B7. ¿Ahora por su trabajo, tiene que hospedarse fuera de su casa
permanente y tiene que pasar la noche en los dos condados (Monterey,
Santa Cruz) qué tipo de alojamiento es? [Lea todas opciones y marque sola
una opción que es el tipo más común que habita--por la mayoría del
tiempo]
1 Un cuarto de renta
2 Casa
3 Apartamento
4 Motel
5 Garaje junto o separado de la casa
6 Traila
7 Duermo en el campo
8 Galeras/barracas del trabajo
9 Carro/Troca
10 Casita de campar

418
11 Refugio
12 En la calle
13 Otro [Describa]:_______(b7a)
14 No Responde
B8. ¿Si se hospeda fuera de su casa para trabajar en los condados de
Monterey y Santa Cruz, quien los acompaña en este hospedaje? [Lea las
siguientes opciones y marquen las que aplican]
1 Solo yo
2 Solo mi esposo/a
3 Uno o más de mis hijos
4 Mis hijos y esposo/a
5 Otros (especifique) ___(b8a)____________
6 No sé
7 No responde
B9. ¿Por qué no se queda a vivir en el condado de Monterey o Santa Cruz
mientras trabaja aquí? [Marque todas las que aplican]
B91 Me quedo con familia/amigos en otro lugar, y desde ahí viaja al
condado de Monterey o Santa Cruz
B92 No puedo encontrar un lugar para vivir en el condado de Monterey o
Santa Cruz
B93 Demasiado caro quedarme en el Condado de Monterey o Santa
Cruz
B94 Otro [especifique]:__(b94a)______________________________________
B95 No sé
B96 No responde
B10. ¿Preferiría tener su vivienda permanente en el condado de Monterey o
santa cruz, si fuera posible?
1 Sí
2 No
3 No aplica, no tiene (quiere) residencia permanente
4 No sé
5 No responde
B10a. Puede explicar porque tiene esta preferencia.

419
________________________________________________________________________
________________________________________________________________________
Sección III Condiciones de su vivienda actual
Ahora, quiero preguntarle sobre la casa donde ha vivido la mayoría del tiempo
en los últimos 3 meses. [O si acaba de llegar el encuestado de otra parte se
pregunta por el domicilio en el área donde vive aunque no sea el lugar donde
ha vivido por la mayoría del tiempo en los últimos 3 meses].
C1. ¿Se encuentra este domicilio en la propiedad (rancho) de su patrón o
mayordomo?
Sí ____
b. ¿Cuál? (c1b)
Propiedad del ranchero
Propiedad del contratista/mayordomo
Otro _(c1b1)_____________________
No ____
C2. ¿En qué tipo de domicilio ha vivido Ud. la mayoría del tiempo en los
últimos 3 meses? [O si acaba de llegar pregunte sobre su domicilio local, lea
las opciones. Marque sólo la opción donde ha quedado por la mayoría del
tiempo]
1 Casa (separada)
2 Apartamento/Departamento (varias unidades en un edificio)
3 Cuarto o cama rentado en un departamento o una casa
4 Cuarto en hotel, motel, etc.
5 Cuarto/cama en pensión/dormitorios/casa de borde
6 Casa-remolque ("tráiler)/casa-móvil (en un parqueadero)
7 Tráiler en una propiedad particular (no en un parqueadero)
8 Vehículo remolque "camper", etc. (no estacionado en forma fija/formal)
9 Campamentos de barracas o salas de muchas camas.
10 Sin vivienda (vive en las afueras/al "aire libre"/en carro/carpa/bajo un
puente o en otro lugar (como garaje) no considerado como vivienda

420
11 Desamparado sin hogar
(c2a) Otro (Explique _______________________________________________
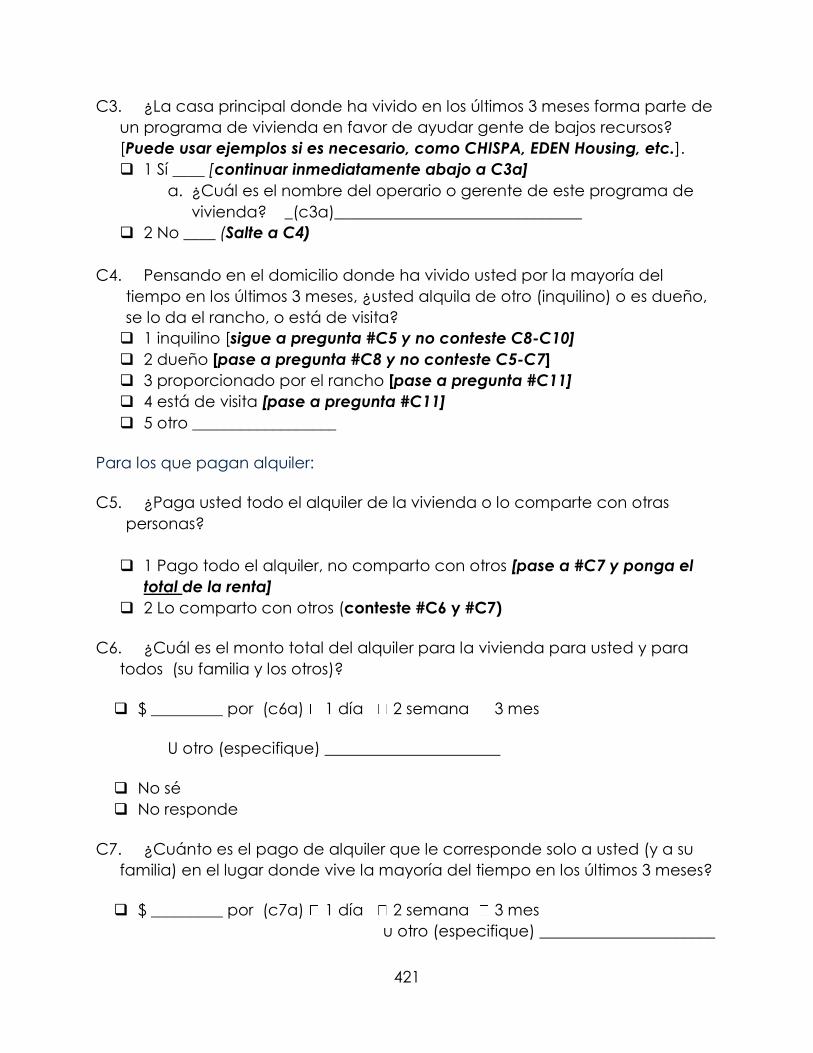
421
C3. ¿La casa principal donde ha vivido en los últimos 3 meses forma parte de
un programa de vivienda en favor de ayudar gente de bajos recursos?
[Puede usar ejemplos si es necesario, como CHISPA, EDEN Housing, etc.].
1 Sí ____ [continuar inmediatamente abajo a C3a]
a. ¿Cuál es el nombre del operario o gerente de este programa de
vivienda? _(c3a)_______________________________
2 No ____ (Salte a C4)
C4. Pensando en el domicilio donde ha vivido usted por la mayoría del
tiempo en los últimos 3 meses, ¿usted alquila de otro (inquilino) o es dueño,
se lo da el rancho, o está de visita?
1 inquilino [sigue a pregunta #C5 y no conteste C8-C10]
2 dueño [pase a pregunta #C8 y no conteste C5-C7]
3 proporcionado por el rancho [pase a pregunta #C11]
4 está de visita [pase a pregunta #C11]
5 otro __________________
Para los que pagan alquiler:
C5. ¿Paga usted todo el alquiler de la vivienda o lo comparte con otras
personas?
1 Pago todo el alquiler, no comparto con otros [pase a #C7 y ponga el
total de la renta]
2 Lo comparto con otros (conteste #C6 y #C7)
C6. ¿Cuál es el monto total del alquiler para la vivienda para usted y para
todos (su familia y los otros)?
$ _________ por (c6a) 1 día 2 semana 3 mes
U otro (especifique) ______________________
No sé
No responde
C7. ¿Cuánto es el pago de alquiler que le corresponde solo a usted (y a su
familia) en el lugar donde vive la mayoría del tiempo en los últimos 3 meses?
$ _________ por (c7a) 1 día 2 semana 3 mes
u otro (especifique) ______________________
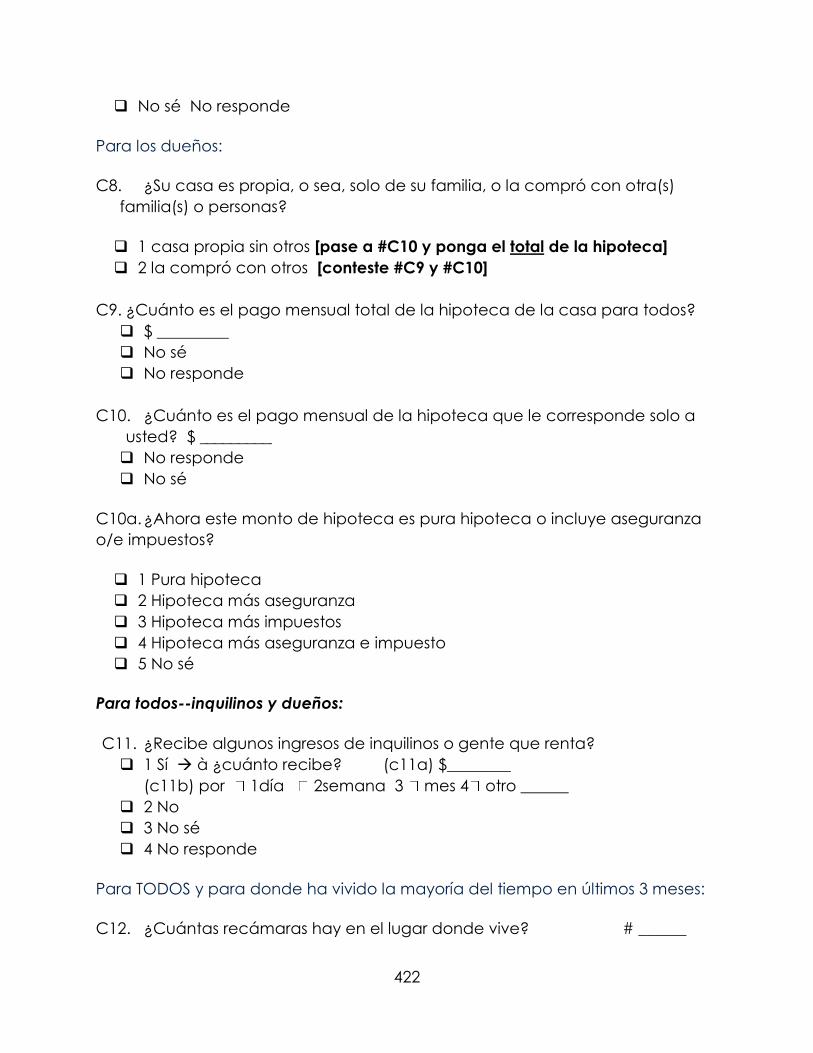
422
No sé No responde
Para los dueños:
C8. ¿Su casa es propia, o sea, solo de su familia, o la compró con otra(s)
familia(s) o personas?
1 casa propia sin otros [pase a #C10 y ponga el total de la hipoteca]
2 la compró con otros [conteste #C9 y #C10]
C9. ¿Cuánto es el pago mensual total de la hipoteca de la casa para todos?
$ _________
No sé
No responde
C10. ¿Cuánto es el pago mensual de la hipoteca que le corresponde solo a
usted? $ _________
No responde
No sé
C10a. ¿Ahora este monto de hipoteca es pura hipoteca o incluye aseguranza
o/e impuestos?
1 Pura hipoteca
2 Hipoteca más aseguranza
3 Hipoteca más impuestos
4 Hipoteca más aseguranza e impuesto
5 No sé
Para todos--inquilinos y dueños:
C11. ¿Recibe algunos ingresos de inquilinos o gente que renta?
1 Sí à ¿cuánto recibe? (c11a) $________
(c11b) por 1día 2semana 3 mes 4 otro ______
2 No
3 No sé
4 No responde
Para TODOS y para donde ha vivido la mayoría del tiempo en últimos 3 meses:
C12. ¿Cuántas recámaras hay en el lugar donde vive? # ______

423
C13. ¿Cuántos baños hay en el lugar donde vive? # ______
C14. ¿Cuántas cocinas hay en el lugar donde vive? # ______
C15. ¿Cuántos otros cuartos hay en el lugar donde vive? # ______
[sala, salón, comedor, oficina, etc.]
C16. ¿Cuantas personas duermen en las recamaras/dormitorios?
(C16a) #niños______(c16b)# adultos______
C17. ¿Alguien en la casa usa algún cuarto aparte de las
recámaras/dormitorios para dormir?
1 Sí [continúe a #C18]
2 No [pase a #C19]
C18. ¿Cuántos duermen en estos otros lugares? [marque todas las que
aplican] 1 2
A Sala # Niños______# Adultos______
B Comedor # Niños______# Adultos______
C Cocina # Niños______# Adultos______
D Pasillo # Niños______# Adultos______
E Garaje # Niños______# Adultos______
F Ropero # Niños______# Adultos______
G Estructura improvisada # Niños______# Adultos______
H Otro [Especifique]: ___________ # Niños______# Adultos______
I Otro [Especifique]: ___________ # Niños______# Adultos______
C19. ¿Durante la semana pasada, cuántas personas en total durmieron a
diario en su domicilio incluyendo todas las áreas dentro y fuera de su
domicilio?
#________ [Si no es igual a B2d, ponga una nota]
(c19a)___________________________________________________________________
C20. ¿Hay una temporada durante el año cuando hay más gente durmiendo
aquí en su casa?
1 Sí ____ [continuar a C20a.]
a. ¿En qué mes (o meses) hay más gente durmiendo aquí en su
casa? (c20a)________________ (c20b)____________________
b. □ 2 No
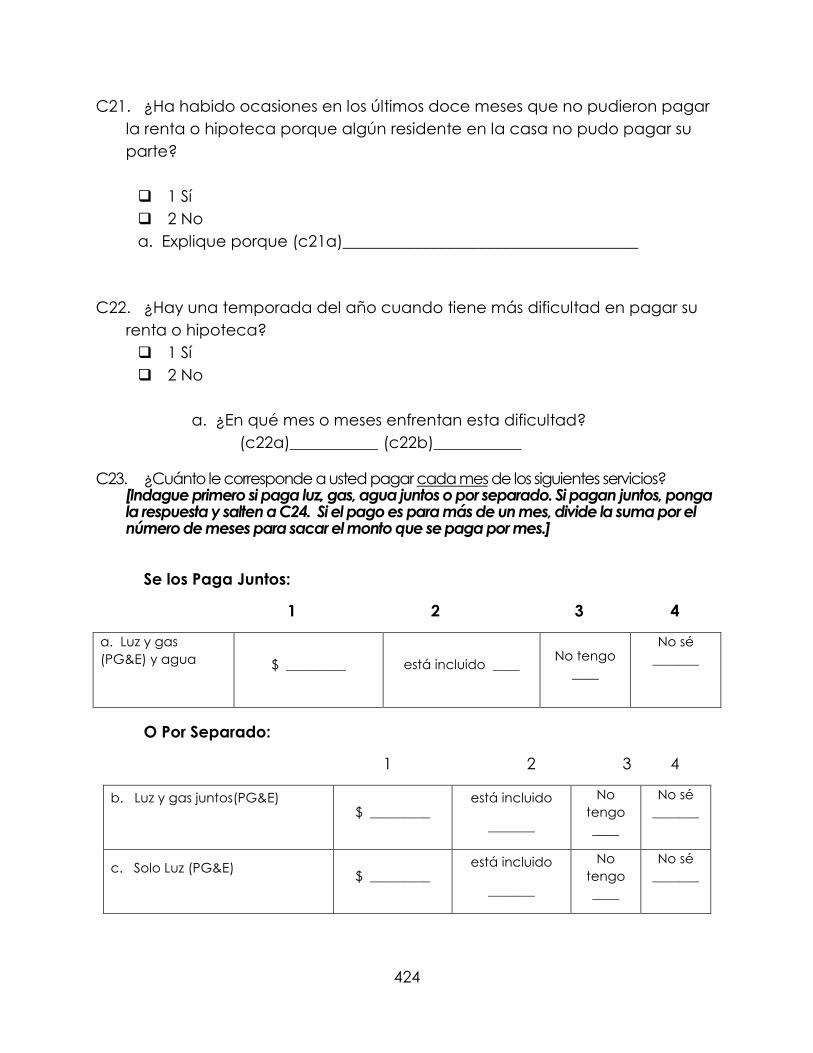
424
C21. ¿Ha habido ocasiones en los últimos doce meses que no pudieron pagar
la renta o hipoteca porque algún residente en la casa no pudo pagar su
parte?
1 Sí
2 No
a. Explique porque (c21a)_____________________________________
C22. ¿Hay una temporada del año cuando tiene más dificultad en pagar su
renta o hipoteca?
1 Sí
2 No
a. ¿En qué mes o meses enfrentan esta dificultad?
(c22a)___________ (c22b)___________
C23. ¿Cuánto le corresponde a usted pagar cada mes de los siguientes servicios? [Indague primero si paga luz, gas, agua juntos o por separado. Si pagan juntos, ponga la respuesta y salten a C24. Si el pago es para más de un mes, divide la suma por el número de meses para sacar el monto que se paga por mes.]
Se los Paga Juntos:
1 2 3 4
a. Luz y gas
(PG&E) y agua
$ _________ está incluido ____ No tengo
____
No sé
_______
O Por Separado:
1 2 3 4
b. Luz y gas juntos(PG&E)
$ _________
está incluido
_______
No
tengo
____
No sé
_______
c. Solo Luz (PG&E)
$ _________ está incluido
_______
No
tengo
____
No sé
_______
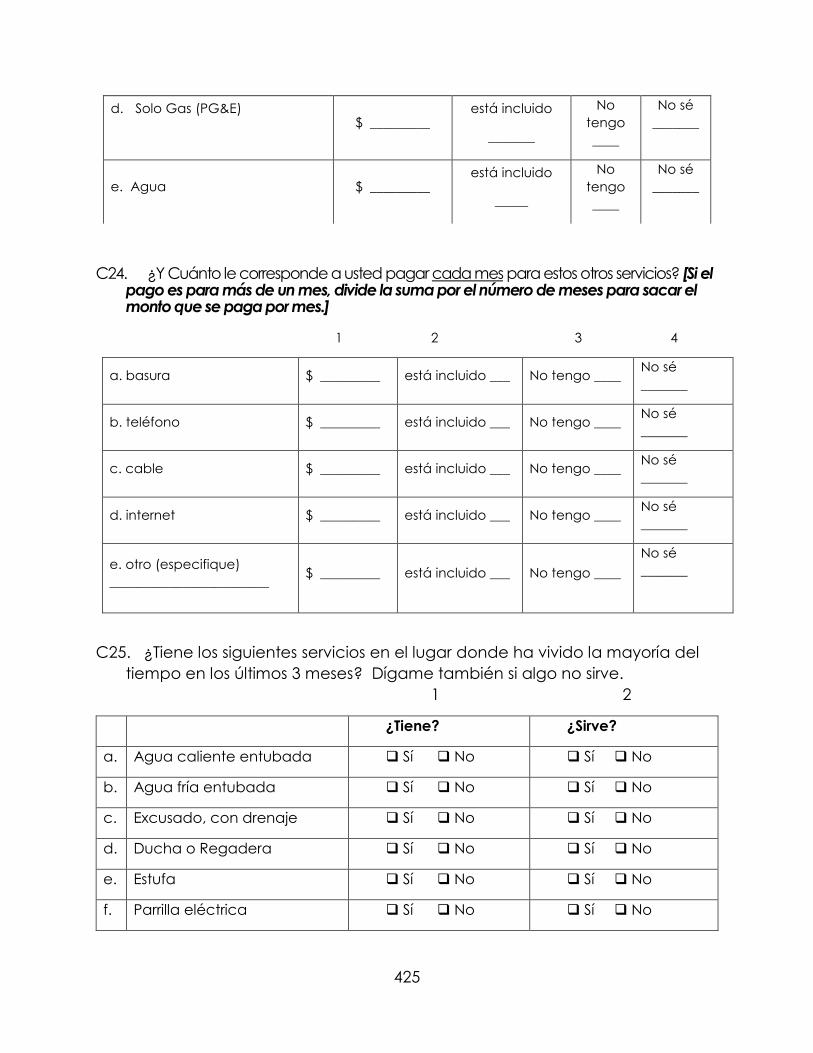
425
d. Solo Gas (PG&E)
$ _________
está incluido
_______
No
tengo
____
No sé
_______
e. Agua $ _________ está incluido
_____
No
tengo
____
No sé
_______
C24. ¿Y Cuánto le corresponde a usted pagar cada mes para estos otros servicios? [Si el pago es para más de un mes, divide la suma por el número de meses para sacar el monto que se paga por mes.]
1 2 3 4
a. basura $ _________ está incluido ___ No tengo ____ No sé
_______
b. teléfono $ _________ está incluido ___ No tengo ____ No sé
_______
c. cable $ _________ está incluido ___ No tengo ____ No sé
_______
d. internet $ _________ está incluido ___ No tengo ____ No sé
_______
e. otro (especifique)
________________________ $ _________ está incluido ___ No tengo ____
No sé
_______
C25. ¿Tiene los siguientes servicios en el lugar donde ha vivido la mayoría del
tiempo en los últimos 3 meses? Dígame también si algo no sirve.
1 2
¿Tiene? ¿Sirve?
a. Agua caliente entubada Sí No Sí No
b. Agua fría entubada Sí No Sí No
c. Excusado, con drenaje Sí No Sí No
d. Ducha o Regadera Sí No Sí No
e. Estufa Sí No Sí No
f. Parrilla eléctrica Sí No Sí No
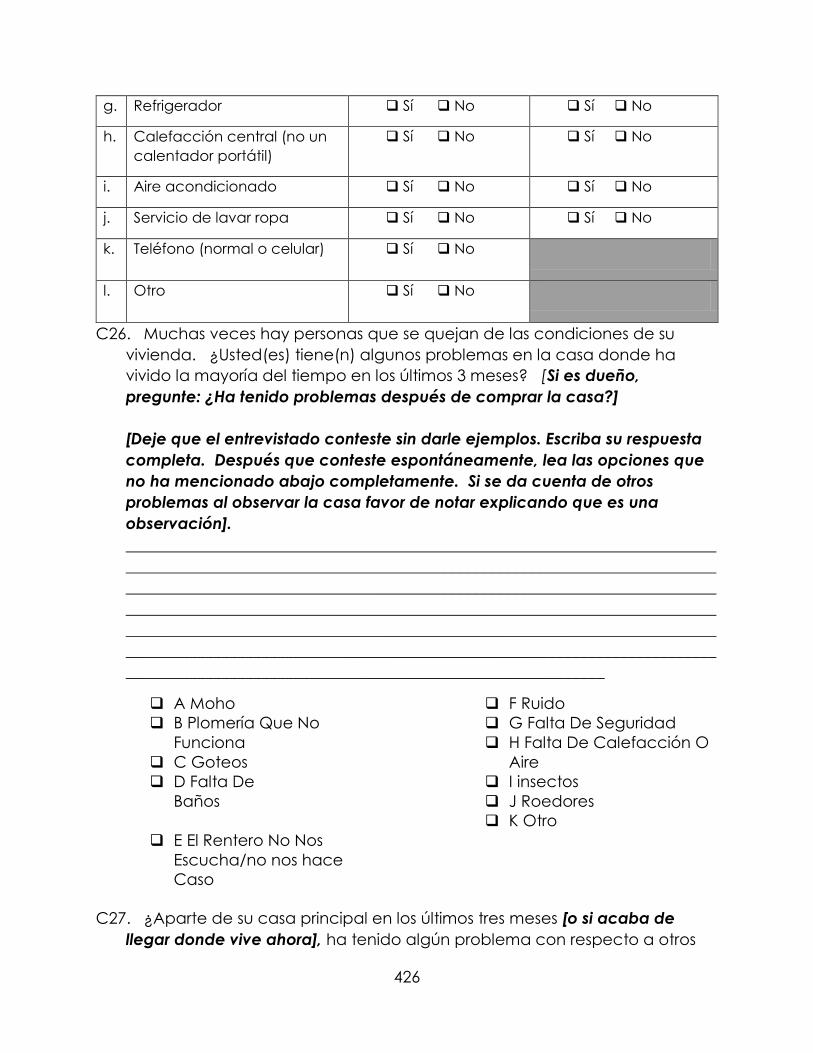
426
g. Refrigerador Sí No Sí No
h. Calefacción central (no un
calentador portátil)
Sí No Sí No
i. Aire acondicionado Sí No Sí No
j. Servicio de lavar ropa Sí No Sí No
k. Teléfono (normal o celular) Sí No
l. Otro Sí No
C26. Muchas veces hay personas que se quejan de las condiciones de su
vivienda. ¿Usted(es) tiene(n) algunos problemas en la casa donde ha
vivido la mayoría del tiempo en los últimos 3 meses? [Si es dueño,
pregunte: ¿Ha tenido problemas después de comprar la casa?]
[Deje que el entrevistado conteste sin darle ejemplos. Escriba su respuesta
completa. Después que conteste espontáneamente, lea las opciones que
no ha mencionado abajo completamente. Si se da cuenta de otros
problemas al observar la casa favor de notar explicando que es una
observación].
__________________________________________________________________________
__________________________________________________________________________
__________________________________________________________________________
__________________________________________________________________________
__________________________________________________________________________
__________________________________________________________________________
____________________________________________________________
A Moho
B Plomería Que No
Funciona
C Goteos
D Falta De
Baños
E El Rentero No Nos
Escucha/no nos hace
Caso
F Ruido
G Falta De Seguridad
H Falta De Calefacción O
Aire
I insectos
J Roedores
K Otro
C27. ¿Aparte de su casa principal en los últimos tres meses [o si acaba de
llegar donde vive ahora], ha tenido algún problema con respecto a otros

427
domicilios durante los últimos dos años, en algún lugar donde ha vivido
mientras trabajaba en el condado de Monterey o Santa Cruz?
1 SÍ
a. ¿Cuál problema?
(c27a)________________________________________________
2 No
3 No sé
4 No responde
Para los que alquilan [inquilinos]
C28. ¿Responde el dueño de su domicilio o cuarto cuando necesita que él
haga reparaciones en su casa?
1 Sí [salte a 30]
2 No
a. (c28a)Explica lo que pasó [Escriba una respuesta completa]
3 No sé
4 No responde
C29. ¿Si el dueño no ha respondido, usted ha hecho algún tipo de reporte o
queja a las autoridades u otra persona?
1 Sí a. Explique lo que pasó
_____(c29a)______________________________
_________________________________________________________________
2 No b. ¿Porque no hizo nada?
_____________________________(c29b)_____________________
3 No sé
4 No responde
C30. En los últimos doce meses, mientras trabajaba en la agricultura en el
condado de Monterey o Santa Cruz, ¿alguna vez tuvo que gastar menos
en la comida o la atención médica para poder pagar la renta o hipoteca?
1 Sí
2 No
3 No sé
4 No responde
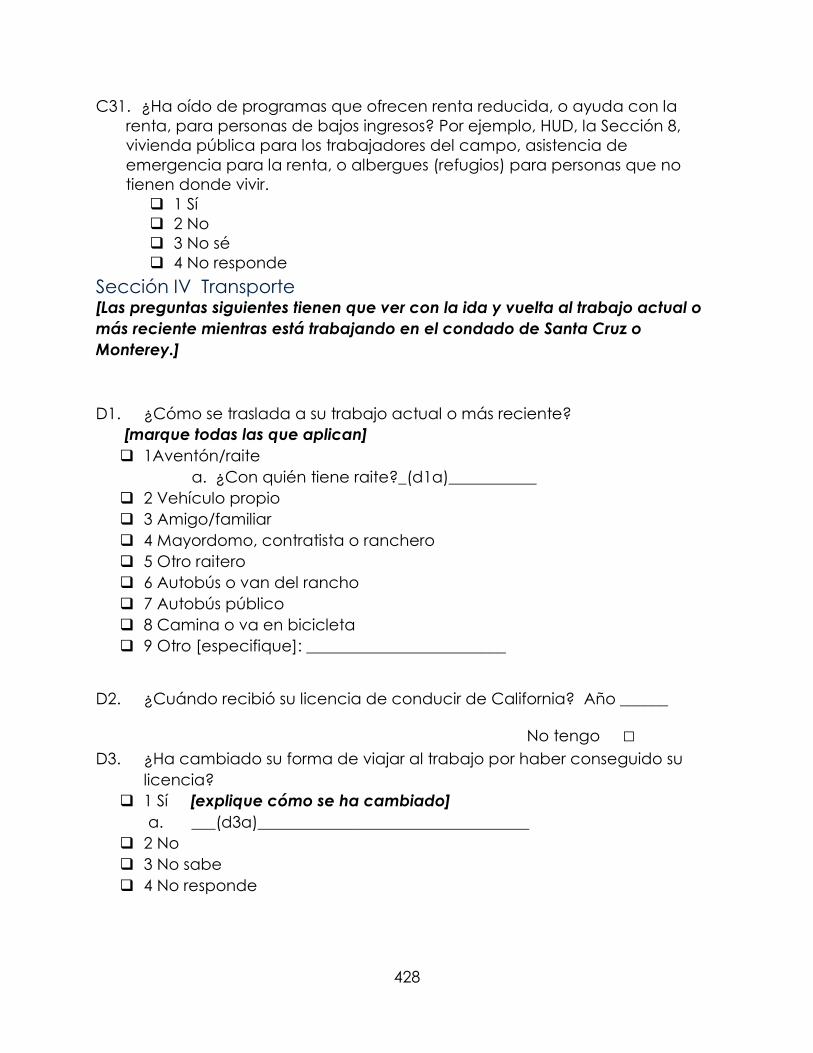
428
C31. ¿Ha oído de programas que ofrecen renta reducida, o ayuda con la
renta, para personas de bajos ingresos? Por ejemplo, HUD, la Sección 8,
vivienda pública para los trabajadores del campo, asistencia de
emergencia para la renta, o albergues (refugios) para personas que no
tienen donde vivir.
1 Sí
2 No
3 No sé
4 No responde
Sección IV Transporte [Las preguntas siguientes tienen que ver con la ida y vuelta al trabajo actual o
más reciente mientras está trabajando en el condado de Santa Cruz o
Monterey.]
D1. ¿Cómo se traslada a su trabajo actual o más reciente?
[marque todas las que aplican]
1Aventón/raite
a. ¿Con quién tiene raite?_(d1a)___________
2 Vehículo propio
3 Amigo/familiar
4 Mayordomo, contratista o ranchero
5 Otro raitero
6 Autobús o van del rancho
7 Autobús público
8 Camina o va en bicicleta
9 Otro [especifique]: _________________________
D2. ¿Cuándo recibió su licencia de conducir de California? Año ______
No tengo □ D3. ¿Ha cambiado su forma de viajar al trabajo por haber conseguido su
licencia?
1 Sí [explique cómo se ha cambiado]
a. ___(d3a)__________________________________
2 No
3 No sabe
4 No responde

429
D4. ¿Qué distancia hay entre su trabajo actual o más reciente y el lugar
donde vive ahora? [si dice “depende” tome un promedio.]
1 Vivo en el mismo lugar donde trabajo
2 1-9 millas o menos
3 10-24 millas
4 25-49 millas desde el lugar donde trabajo
5 50-74 millas
6 75 millas o más
7 Es diferente cada día
D5. Aproximadamente, ¿cuánto tiempo tarda en llegar al trabajo (o sea, solo
de ida)? ___(d5a)_ horas __(d5b)__ minutos
No sé
No responde
D6. Aproximadamente, ¿cuánto gasta en viajar al trabajo, de ida y vuelta en
dinero o en gasolina?
a. $(d6a)_________ b. (d6b) 1 2 3 mes
No sé
No responde
D7. ¿Cómo es su modo usual de ir a hacer compras? [marque la opción que
usualmente se usa]
1 Pago por un Aventón/raite
2 Vehículo propio o Amigo/familiar
3 Transporte público
4 Camina o va en bicicleta
5 Otro (especifique) ___(d7a)_______________________
D8. ¿Cómo es su modo usual de ir a la escuela? [marque la opción que
usualmente se usa]
1 Pago por un Aventón/raite
2 Vehículo propio o Amigo/familiar
3 Transporte público
4 Camina o va en bicicleta
5 Otro (especifique) ______(d8a)____________________
6 No voy

430
D9. ¿Cómo es su modo usual de ir a la clínica o buscar asistencia médica?
[marque la opción que usualmente se usa]
1 Pago por un Aventón/raite
2 Vehículo propio o Amigo/familiar
3 Transporte público
4 Camina o va en bicicleta
5 Otro (especifique) ______(d9a)____________________
D10. Aproximadamente, ¿cuánto tiempo tarda en llegar a?:(CALCULA EN
MINUTOS!)
a. ¿Hacer compras? número de minutos____ horas____
b. ¿Ir a la escuela? número de minutos____ horas____
c. ¿Ir a la clínica? número de minutos____ horas____Sección
V Empleo, Bienes e Ingresos
E1. ¿En los últimos 12 meses, ¿cuántos meses trabajó en el campo o en los
empaques de ensalada en los EE.UU.?[Promedio de meses: 1 día o más por mes
se cuenta como 1 mes]:
meses
[Ahora voy a hacerle algunas preguntas acerca del cultivo y tarea en su
trabajo con su actual o más reciente empleador en el campo].
E2. ¿Cuántos años ha trabajado para su actual patrón? [Un Día o Más Por
Año = Un Año]
años
E3. ¿Trabaja usted para este patrón sólo por temporadas o todo el año? [10
meses o más califica como todo el año]
1 Todo el año

431
2 Por temporadas
3 No Sé (Primera Vez)
E4. ¿En qué cultivos o productos principales está (o estaba) trabajando en el
trabajo actual o más reciente? a. _____(E4a)______ b. _______(e4b)________
E5. ¿Estos cultivos se consideran orgánicos? 1 Sí _____ 2 No ______
3 Algunos sí, Algunos no ___ 4 No sé ___
E6. ¿Qué son las dos tareas principales que hace (o hacía) usted en el
trabajo actual o más reciente?
a. ________(e6a)____________ b. _______(e6b)_____________
E7. ¿cómo le pagan a usted el trabajo actual o más reciente? [Marque la
forma de pago en el último pago, elige sola una respuesta.]
1 Por hora
2 Por unidad (contrato/pieza/a destajo)
3 Combinación hora y unidad
4 Salario u otro
E8. ¿Cuánto dinero recibió de su patrón en su último pago ($ o cheque)?
a. ¿Y...antes de las deducciones "en bruto/completo”?: $ _______________
b. ¿...Después de “rebajas/en limpio”?: $________________
E9. ¿Cuántas horas y días trabajó para ganar este pago?
a. Horas ________ b. días___________________
c. Cálculo rápido del entrevistado: Divide los (dólares total en bruto) entre
(horas)=_____________ o dicho en otras palabras E8a/E9a__(calculo=e9c)______

432
1. Este cálculo le parece correcto? (e9c1) Sí ___ No ____
[Si dice que no es correcto pase abajo a (E9c2.)]
2. Entonces cuánto gana por hora? (e9c2) $ ______._____
Ahora, unas preguntas sobre sus bienes e ingreso.
E10. ¿Cuál fue su ingreso familiar total (todos en su hogar) el año pasado - en
2016- en dólares en los EE.UU.)? [Lea o muestre opciones. Marque sólo una]
1 No Trabajé en 2016
2 Menos de 500
3 500 a 999
4 1,000 a 2,499
5 2,500 a 4,999
6 5,000 a 7,499
7 7,500 a 9,999
8 10,000 a 12,499
9 12,500 a 14,999
10 15,000 a 17,499
11 7,500 a 19,999
12 20,000 a 22,499
13 22,500 a 24,999
14 25,000 a 27,499
15 27,500 a 29,999
16 30,000 a 32,499
17 32,500 a 34,999
18 35,000 a 37,499
19 37,500 a 39,999
20 40,000 a 49,999
21 50,000 a 59,999
22 mas
23 No recuerda
24 No sabe
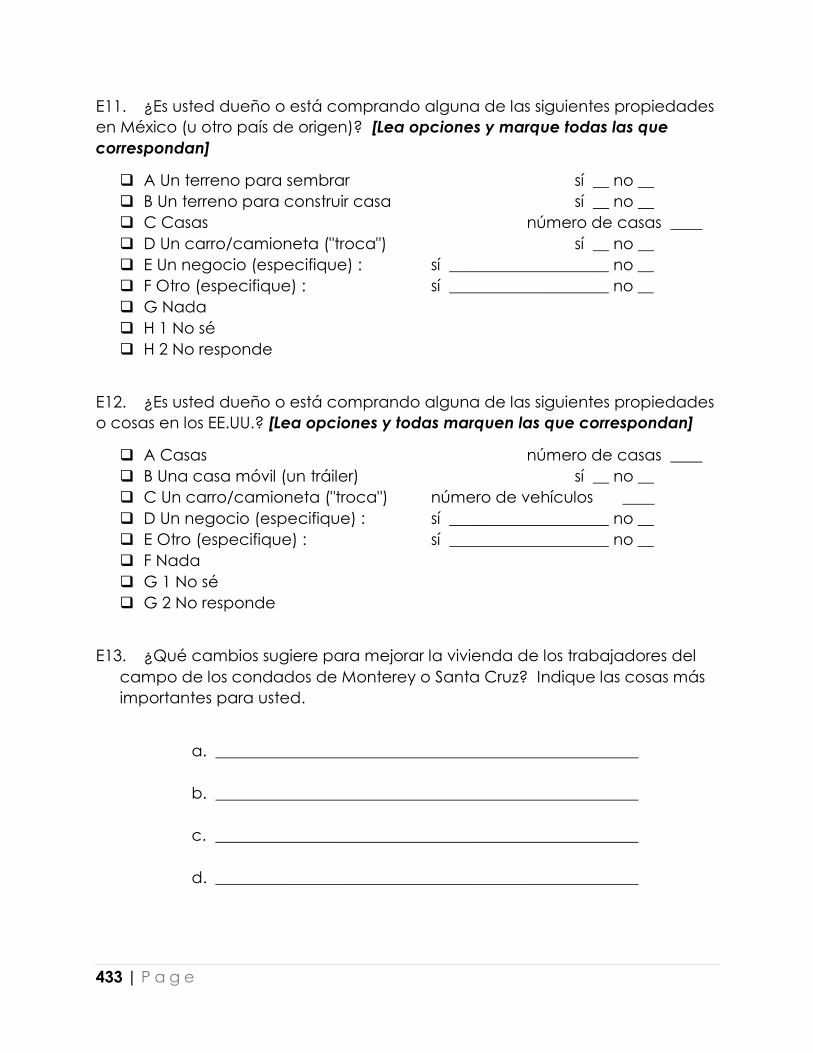
433 | P a g e
E11. ¿Es usted dueño o está comprando alguna de las siguientes propiedades
en México (u otro país de origen)? [Lea opciones y marque todas las que
correspondan]
A Un terreno para sembrar sí __ no __
B Un terreno para construir casa sí __ no __
C Casas número de casas ____
D Un carro/camioneta ("troca") sí __ no __
E Un negocio (especifique) : sí ____________________ no __
F Otro (especifique) : sí ____________________ no __
G Nada
H 1 No sé
H 2 No responde
E12. ¿Es usted dueño o está comprando alguna de las siguientes propiedades
o cosas en los EE.UU.? [Lea opciones y todas marquen las que correspondan]
A Casas número de casas ____
B Una casa móvil (un tráiler) sí __ no __
C Un carro/camioneta ("troca") número de vehículos ____
D Un negocio (especifique) : sí ____________________ no __
E Otro (especifique) : sí ____________________ no __
F Nada
G 1 No sé
G 2 No responde
E13. ¿Qué cambios sugiere para mejorar la vivienda de los trabajadores del
campo de los condados de Monterey o Santa Cruz? Indique las cosas más
importantes para usted.
a. _____________________________________________________
b. _____________________________________________________
c. _____________________________________________________
d. _____________________________________________________

434 | P a g e
E14. ¿Qué cambios sugiere para mejorar el transporte para los trabajadores
del campo de los condados de Monterey o Santa Cruz? Indique las cosas
más importantes para usted.
a. _____________________________________________________
b. _____________________________________________________
c. _____________________________________________________
d. _____________________________________________________
E15. ¿En su opinión, qué tipo de vivienda podría satisfacer las necesidades de
usted y su familia?
____________________________________________________________________
____________________________________________________________________
____________________________________________________________________
____________________________________________________________________
____________________________________________________________________
Notas del encuestador:
____________________________________________________________________
____________________________________________________________________
____________________________________________________________________

435 | P a g e
Entrevistador debe dar el incentivo al entrevistado al completar el cuestionario.
$20 Incentivo pagado (Iniciales del entrevistador) ______________________
$20 incentivo recibido (Iniciales del entrevistado o marque X) _______________
Códigos
Monterey Areas Santa Cruz Areas
1 Aromas 13 Metz 24 Amesti
2 Blanco 14 Molus 25 Aptos Hill- Larkin Valley
3 Camphora 15 Moss Landing 26 Corralitos
4 Castroville 16 Natividad 27 Day Valley
5 Chualar 17 Neponset 28 Freedom
6 Elsa 18 Pajaro 29 Inrterlaken
7 Gonzales 19 Penvir 30 Johnston Corner
8 Greenfield 20 Prunedale 31 Port Watsonville
9 Harlem 21 Salinas 32 Watsonville
10 King City city 22 Soledad
11 Las Lomas 23 Spreckles
12 Marina
cultivo código cultivo código
Lechuga 1 Invenadero, vivero o nerseria 5
Verdura no lechuga 2 Empaque de ensalada 6
Fruta de arbol o uva 3 otro (especifique) 7
Mora, frambruesa,
fresa
4

436 | P a g e
Relación A.2 Año que entró A.9:
1 = Esposo/a o juntado/a 5 = nieto/a Si nació en EEUU, ponga 999
2 = hijo o hijo adoptivo 6 = Otro pariente
3 = hermano/a 7 = Otro ________
4 = padre o madre 8= entrevistado

437 | P a g e
Notas del encuestador
____________________________________________________________________
____________________________________________________________________
____________________________________________________________________
____________________________________________________________________
____________________________________________________________________
____________________________________________________________________
____________________________________________________________________
____________________________________________________________________
____________________________________________________________________
____________________________________________________________________
____________________________________________________________________
____________________________________________________________________

438 | P a g e
Appendix 7: Survey Instrument. English Survey of Farmworker Housing in the Salinas Valley and Pajaro Valley
(2017) Version 11, 6/15/2017
Everything you tell me is confidential. I will not use your name in any
way publicly. All of these questions are answered voluntarily. If you
don’t feel comfortable with any questions, you can opt to not
respond. Is that clear? (YOU SHOULD HEAR “YES” BEFORE YOU MOVE
FORWARD). ___ Yes (continue) ___ No (thank them)
Name (without surname) of the person being interviewed
___________________
Zip Code_______ Neighborhood __________ Town or City
______________
Language of the interview ____________ Place of the interview
____________
Date: Month/Day/year Time_________
Crop Code Crop Code
Lettuce 1 Forestry, Nursery 5
Vegetable other than
lettuce
2 Salad packing 6
Tree fruit or grape 3 Other (specify) 7
Strawberry, raspberry,
blackberry
4
Codes:
Interviewer Interviewee Place Employer Crop
Section I. Demographics [THIS DATA IS GATHERED ON A CHART IN
SPANISH VERSION)
Relatives and other people living together in your home (that share
the same budget):
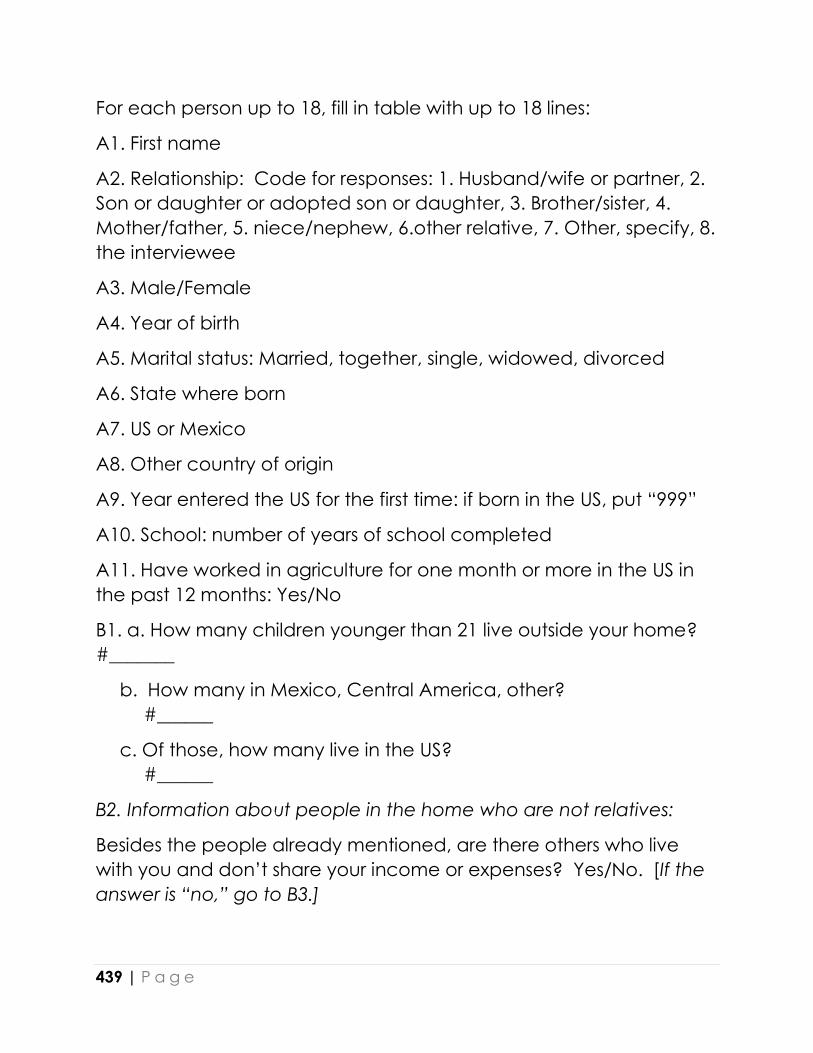
439 | P a g e
For each person up to 18, fill in table with up to 18 lines:
A1. First name
A2. Relationship: Code for responses: 1. Husband/wife or partner, 2.
Son or daughter or adopted son or daughter, 3. Brother/sister, 4.
Mother/father, 5. niece/nephew, 6.other relative, 7. Other, specify, 8.
the interviewee
A3. Male/Female
A4. Year of birth
A5. Marital status: Married, together, single, widowed, divorced
A6. State where born
A7. US or Mexico
A8. Other country of origin
A9. Year entered the US for the first time: if born in the US, put “999”
A10. School: number of years of school completed
A11. Have worked in agriculture for one month or more in the US in
the past 12 months: Yes/No
B1. a. How many children younger than 21 live outside your home?
#_______
b. How many in Mexico, Central America, other?
#______
c. Of those, how many live in the US?
#______
B2. Information about people in the home who are not relatives:
Besides the people already mentioned, are there others who live
with you and don’t share your income or expenses? Yes/No. [If the
answer is “no,” go to B3.]

440 | P a g e
Include all those who live at the same address or the same home
although they sleep outside the house. THOSE WHO HAVE LIVED
THERE FOR A MONTH OR MORE.
1. Men 2.Women 3.Working in
agriculture in the US
for most of the past
12 month
b. how many
older than 18?
Yes/No
c. how many
less than 18?
Yes/No
B2d. Total of those listed in A1 _____ and all those listed in B2____ =
________
Section II. Location of Housing and Annual Migration
B3. Do you have a permanent home where you have lived six
months or more in the past for the past 12 months? [6 months or
more in a home during the past 12 months is the definition!]
Yes [continue to #B3.a]
No [go to #B5]
1. City 2. State [if it’s not in the US
or Mexico, put the name
of the country]
a. In which town is
it?
[Look at the list of places in the last page, 22, of this survey, put the
number if it’s local. Otherwise, write the place and state (or country if
it is not in the US or Mexico]

441 | P a g e
[B4 is for those who have a permanent local home (to which they
can travel daily to work) where they stayed six months during the
past 12 months. If it doesn’t meet this definition, go to B5]
B4. During the past 12 months, have you slept in another place to
get or maintain your job?
Yes [continue to #B4a]
No [go to #B6]
Please tell us the names of four of those other places that were the
most important where you went to work:
a. City b. State
1
2
3
4
B5. [For those who have NOT staYed in a permanent house for 6
months during the past 12 months. This complies with the definition of
“migrant.”]
Tell me the places where you have lived and approximately how
many months you have lived there, beginning with the present
and going back in time from that.
1. 2. 3. 4. 5. 6.
Town/city State Less
than 1
month
1-3
months
4-6
months
More
than 6
months
a. Today
b. Before
that
c. Before
that
d. Before
that
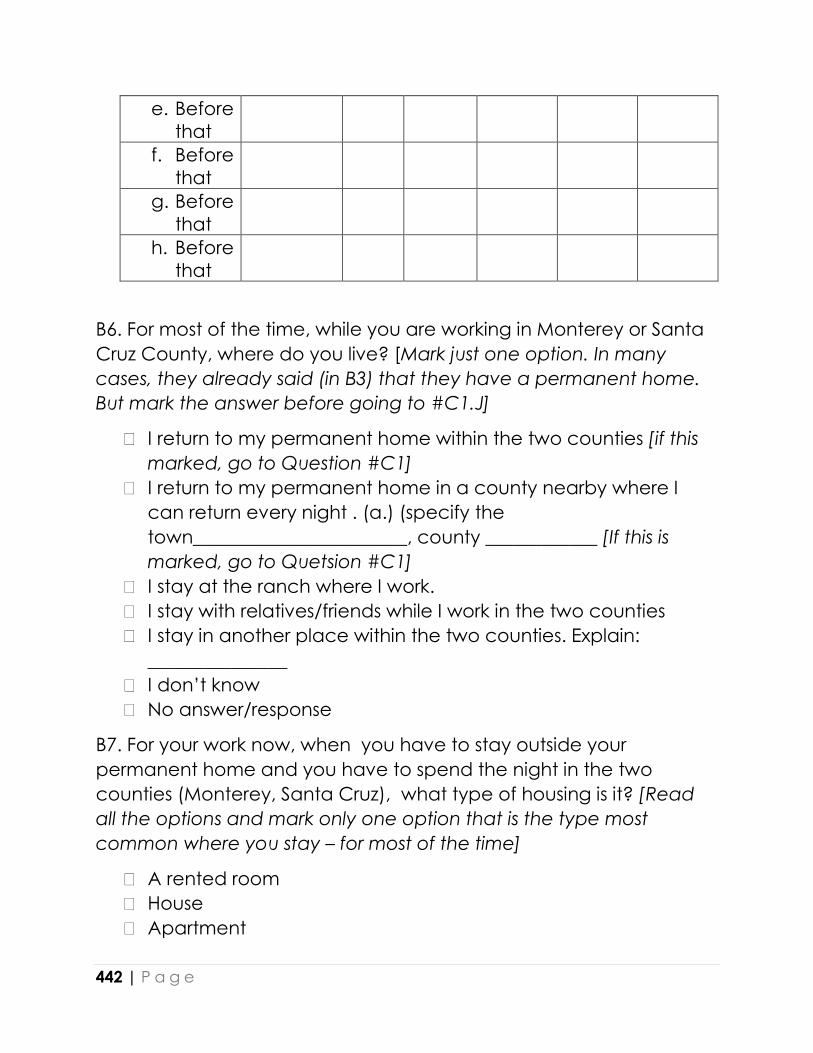
442 | P a g e
e. Before
that
f. Before
that
g. Before
that
h. Before
that
B6. For most of the time, while you are working in Monterey or Santa
Cruz County, where do you live? [Mark just one option. In many
cases, they already said (in B3) that they have a permanent home.
But mark the answer before going to #C1.J]
I return to my permanent home within the two counties [if this
marked, go to Question #C1]
I return to my permanent home in a county nearby where I
can return every night . (a.) (specify the
town_______________________, county ____________ [If this is
marked, go to Quetsion #C1]
I stay at the ranch where I work.
I stay with relatives/friends while I work in the two counties
I stay in another place within the two counties. Explain:
_______________
I don’t know
No answer/response
B7. For your work now, when you have to stay outside your
permanent home and you have to spend the night in the two
counties (Monterey, Santa Cruz), what type of housing is it? [Read
all the options and mark only one option that is the type most
common where you stay – for most of the time]
A rented room
House
Apartment

443 | P a g e
Motel
Garage next to or separated from the house
Mobile home
Sleep outdoors
Barracks of work
Car/Pickup Truck
Camping trailer
Shelter
In the street
Other [Describe]:_____________________
No answer
B8. If you stay outside your home to work in the counties of Monterey
and Santa Cruz, who accompanies you in that lodging? [Read the
following options and mark those that apply]
Only me
Only my wife/husband
One or more of my children
My children and their wife/husband
Others (specify) _______________
I don’t know
No answer
B9. Why don’t you stay to live in Monterey or Santa Cruz county while
you live here? [Mark all those that apply]
I stay with my family or friends in another place, and from there
I travel to Monterey or Santa Cruz County
I can’t find a place to live in Monterey or Santa Cruz County
It’s too expensive to stay in Monterey or Santa Cruz County
Other (specify): ________________________________
I don’t know
No answer
B10. Would you prefer to have a permanent residence in Monterey
or Santa Cruz County if it were possible?

444 | P a g e
Yes
No
Doesn’t apply, don’t want permanent residence
I don’t know
No answer
B10a. Please explain why you have this preference.
_______________________
Section III. Conditions of Current Housing
Now, I want to ask you about the housing where you have lived most
of the time in the past 3 months [Or if the interviewee just arrived
from somewhere else, ask about the home in the area where they
live although it’s not the place where they have lived for the majority
of the time in the past three months]
C1. Is your home on the ranch property of your employer or
contractor boss?
Yes___b. which?
Property of the farmer
Property of the contractor
Other _________________
No
C2. In what type of housing have you lived most of the time in the
past three months? [Or if the interviewee just arrived, ask about their
local housing, read the options. Mark only the option where they
have lived for the majority of the time]
House (separate)
Apartment (various units within a building)
Room or bed rented in an apartment or house
Room in hotel, motel, etc.
Room/bed in dormitory/boarding house
Trailer/mobile home (in a mobile home park)
Trailer on private property (not in a park)
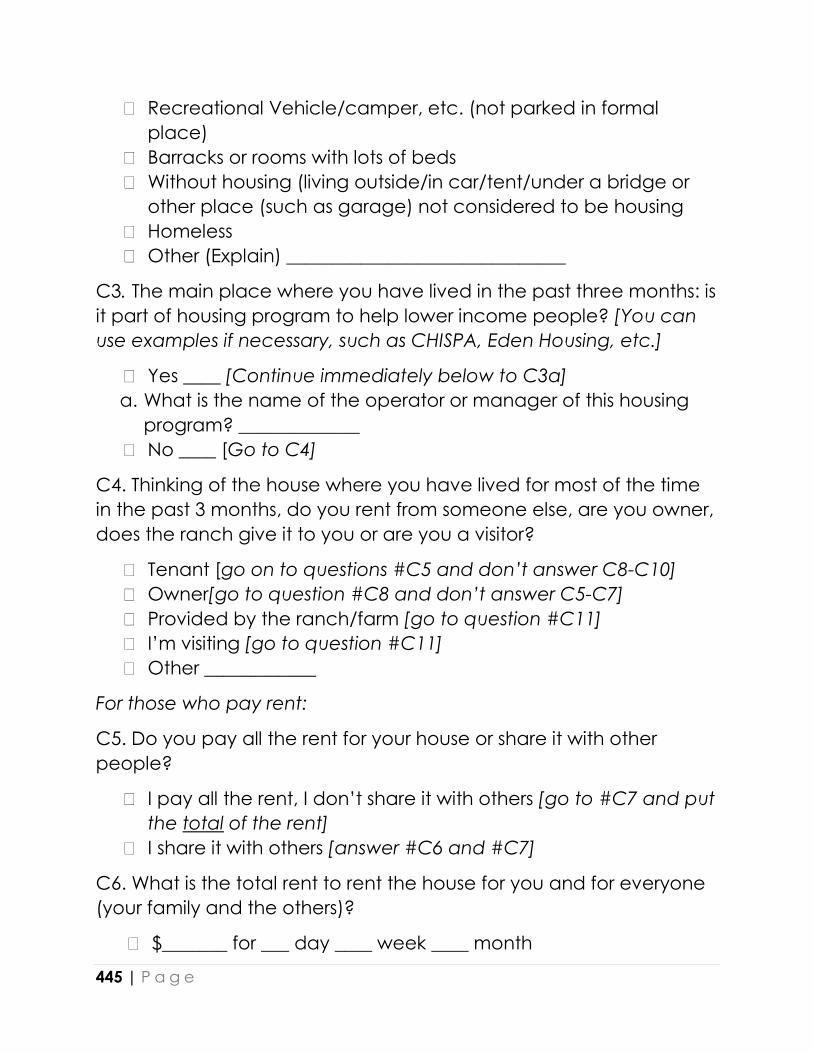
445 | P a g e
Recreational Vehicle/camper, etc. (not parked in formal
place)
Barracks or rooms with lots of beds
Without housing (living outside/in car/tent/under a bridge or
other place (such as garage) not considered to be housing
Homeless
Other (Explain) ______________________________
C3. The main place where you have lived in the past three months: is
it part of housing program to help lower income people? [You can
use examples if necessary, such as CHISPA, Eden Housing, etc.]
Yes ____ [Continue immediately below to C3a]
a. What is the name of the operator or manager of this housing
program? _____________
No ____ [Go to C4]
C4. Thinking of the house where you have lived for most of the time
in the past 3 months, do you rent from someone else, are you owner,
does the ranch give it to you or are you a visitor?
Tenant [go on to questions #C5 and don’t answer C8-C10]
Owner[go to question #C8 and don’t answer C5-C7]
Provided by the ranch/farm [go to question #C11]
I’m visiting [go to question #C11]
Other ____________
For those who pay rent:
C5. Do you pay all the rent for your house or share it with other
people?
I pay all the rent, I don’t share it with others [go to #C7 and put
the total of the rent]
I share it with others [answer #C6 and #C7]
C6. What is the total rent to rent the house for you and for everyone
(your family and the others)?
$_______ for ___ day ____ week ____ month

446 | P a g e
Or other (specify) ___________________
I don’t know
No answer
C7. How much is the rent payment just paid by you (and your family)
in the place where you live the majority of the time in the past 3
months?
$_______ for ___ day ____ week ____ month
Or other (specify) ___________________
I don’t know
No answer
For homeowners:
C8. Is your house just yours, or only for your family, or did you buy it
with other families or persons?
My own house without others [go to #C10 and put the total of
the mortgage]
I bought it with others [answer #C9 and #C10]
C9. What is the monthly mortgage payment of the house for
everyone?
$_________
No answer
Don’t know
C10. What is the monthly mortgage payment that is just your share?
$_________
No answer
Don’t know
C10a. Is this amount of mortgage just he mortgage or does it include
insurance and/or taxes?
Only mortgage
Mortgage plus insurance
Mortgage plus taxes

447 | P a g e
Mortgage plus insurance and taxes
Don’t know
For everyone – renters and homeowners:
C11. Do you receive some income from tenants or people who rent?
Yes __ and how much do you receive? $_____ by the
____day ____week___ month ____ other____________
No
Don’t know
No answer
For EVERYONE and about the place where you have lived most of
the time in the past three months:
C12. How many bedrooms are there in the place where you live?
#_______
C13. How many bathrooms are there in the place where you live?
#_______
C14. How many kitchens are there in the place where you live?
#_______
C15. How many other rooms are there in the place where you live?
#_______
[living room, dining room, office, etc.]
C16. How many people sleep in the bedrooms/dormitories?
____ children, _____ adults
C17. Does anyone in the home use a room besides the
bedrooms/dormitories for sleeping?
Yes [go to #C18]
No [go to #C19]
C18. How many sleep in the other places? [mark all that apply]
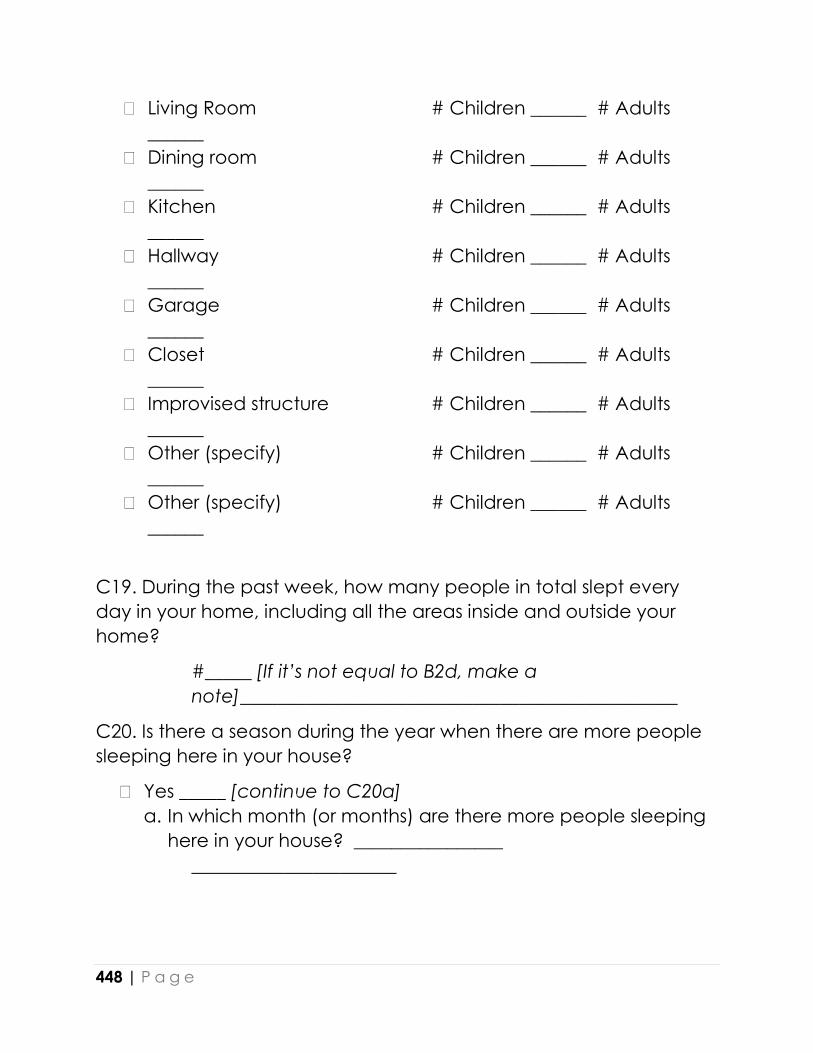
448 | P a g e
Living Room # Children ______ # Adults
______
Dining room # Children ______ # Adults
______
Kitchen # Children ______ # Adults
______
Hallway # Children ______ # Adults
______
Garage # Children ______ # Adults
______
Closet # Children ______ # Adults
______
Improvised structure # Children ______ # Adults
______
Other (specify) # Children ______ # Adults
______
Other (specify) # Children ______ # Adults
______
C19. During the past week, how many people in total slept every
day in your home, including all the areas inside and outside your
home?
#_____ [If it’s not equal to B2d, make a
note]_______________________________________________
C20. Is there a season during the year when there are more people
sleeping here in your house?
Yes _____ [continue to C20a]
a. In which month (or months) are there more people sleeping
here in your house? ________________
______________________

449 | P a g e
C21. Have there been occasions in the past 12 months when you
couldn’t pay the rent or mortgage because a resident in the house
couldn’t pay their part?
Yes
No
a. Explain why __________________________________________
C22. Is there a season of the year when you have more difficulty in
paying your rent or mortgage?
Yes
No
b. In which month or months do you have this difficulty? _________
_________
C23. How much do you pay every month for the following services?
[Indicate first if electricity, gas, and water is paid together or
separately, If paid together, put the answer and move to C24. If the
payment is for more than one month, divide the amount by the
number of months to calculate the amount paid per month]
If paid together:
a.Light and
gas (PG&E)
and water
$________ It’s included
____
Don’t have
____
Don’t know
_____
Or paid separately:
b.Light and
gas
together
(PG&E)
$________ It’s included
______
Don’t have
_______
Don’t know
_____
c.Only
electricity
(PG&E)
$________ It’s included
______
Don’t have
_______
Don’t know
_____
d.Only Gas
(PG&E)
$________ It’s included
______
Don’t have
_______
Don’t know
_____
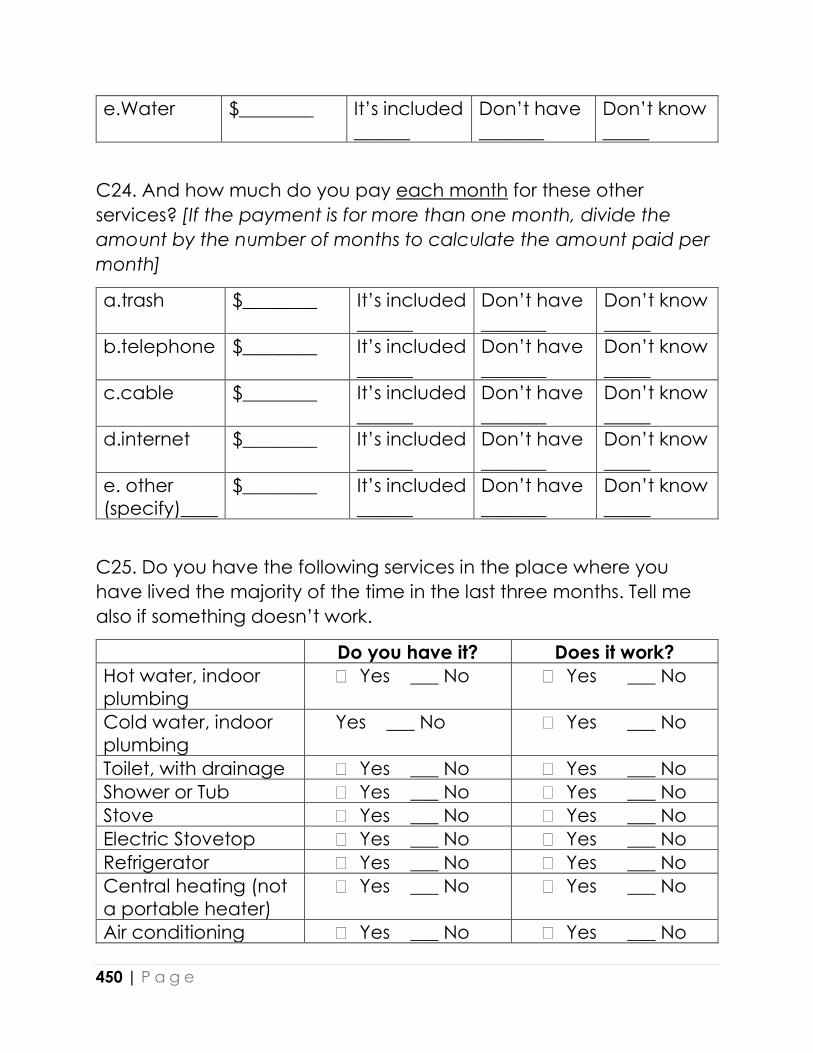
450 | P a g e
e.Water $________ It’s included
______
Don’t have
_______
Don’t know
_____
C24. And how much do you pay each month for these other
services? [If the payment is for more than one month, divide the
amount by the number of months to calculate the amount paid per
month]
a.trash $________ It’s included
______
Don’t have
_______
Don’t know
_____
b.telephone $________ It’s included
______
Don’t have
_______
Don’t know
_____
c.cable $________ It’s included
______
Don’t have
_______
Don’t know
_____
d.internet $________ It’s included
______
Don’t have
_______
Don’t know
_____
e. other
(specify)____
$________ It’s included
______
Don’t have
_______
Don’t know
_____
C25. Do you have the following services in the place where you
have lived the majority of the time in the last three months. Tell me
also if something doesn’t work.
Do you have it? Does it work?
Hot water, indoor
plumbing
Yes ___ No Yes ___ No
Cold water, indoor
plumbing
Yes ___ No Yes ___ No
Toilet, with drainage Yes ___ No Yes ___ No
Shower or Tub Yes ___ No Yes ___ No
Stove Yes ___ No Yes ___ No
Electric Stovetop Yes ___ No Yes ___ No
Refrigerator Yes ___ No Yes ___ No
Central heating (not
a portable heater)
Yes ___ No Yes ___ No
Air conditioning Yes ___ No Yes ___ No
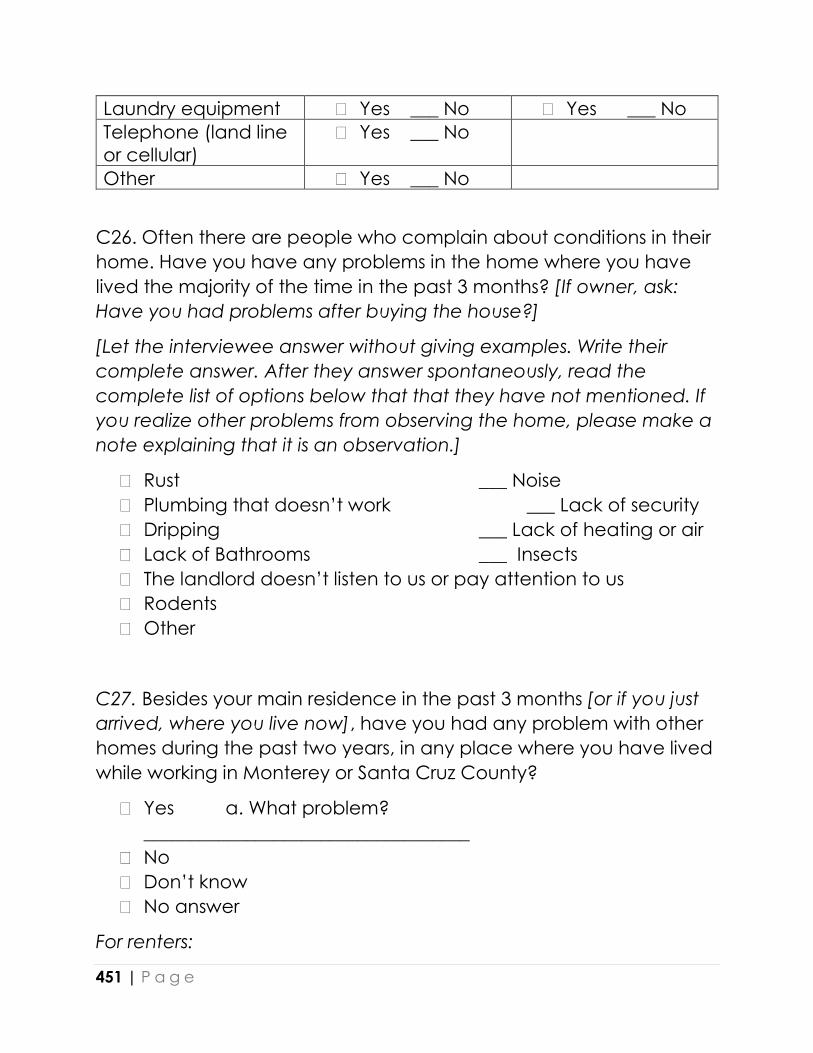
451 | P a g e
Laundry equipment Yes ___ No Yes ___ No
Telephone (land line
or cellular)
Yes ___ No
Other Yes ___ No
C26. Often there are people who complain about conditions in their
home. Have you have any problems in the home where you have
lived the majority of the time in the past 3 months? [If owner, ask:
Have you had problems after buying the house?]
[Let the interviewee answer without giving examples. Write their
complete answer. After they answer spontaneously, read the
complete list of options below that that they have not mentioned. If
you realize other problems from observing the home, please make a
note explaining that it is an observation.]
Rust ___ Noise
Plumbing that doesn’t work ___ Lack of security
Dripping ___ Lack of heating or air
Lack of Bathrooms ___ Insects
The landlord doesn’t listen to us or pay attention to us
Rodents
Other
C27. Besides your main residence in the past 3 months [or if you just
arrived, where you live now], have you had any problem with other
homes during the past two years, in any place where you have lived
while working in Monterey or Santa Cruz County?
Yes a. What problem?
___________________________________
No
Don’t know
No answer
For renters:
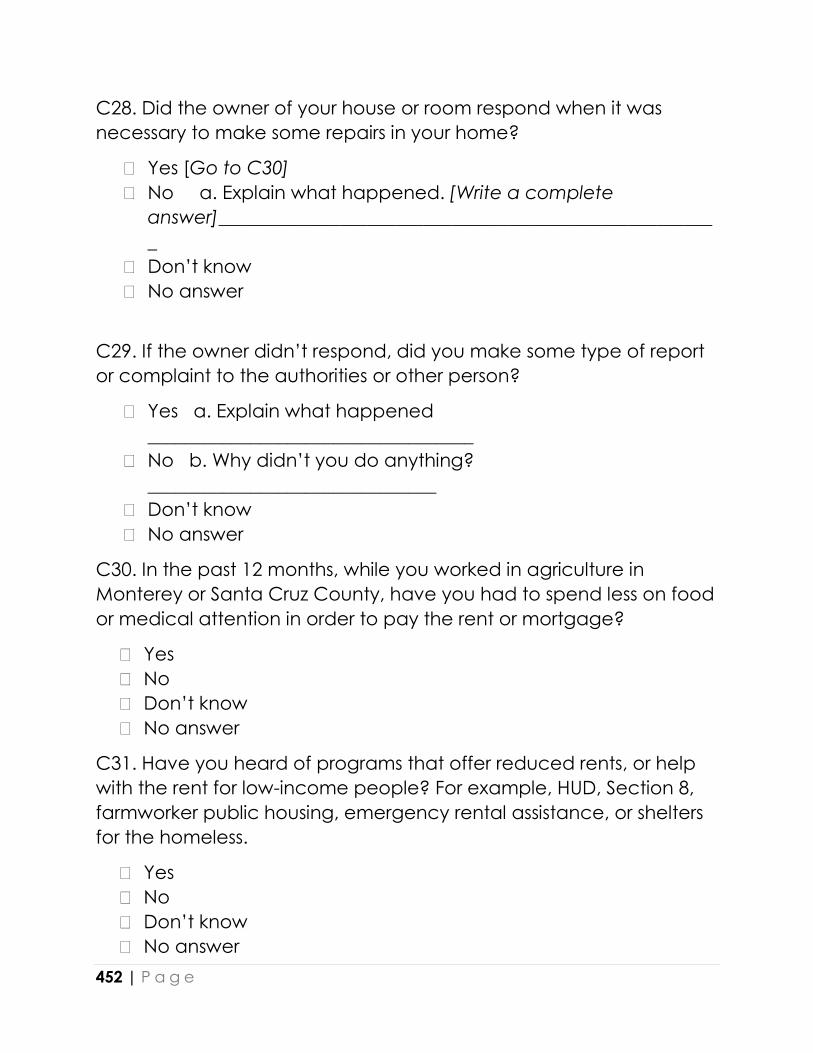
452 | P a g e
C28. Did the owner of your house or room respond when it was
necessary to make some repairs in your home?
Yes [Go to C30]
No a. Explain what happened. [Write a complete
answer]_____________________________________________________
_
Don’t know
No answer
C29. If the owner didn’t respond, did you make some type of report
or complaint to the authorities or other person?
Yes a. Explain what happened
___________________________________
No b. Why didn’t you do anything?
_______________________________
Don’t know
No answer
C30. In the past 12 months, while you worked in agriculture in
Monterey or Santa Cruz County, have you had to spend less on food
or medical attention in order to pay the rent or mortgage?
Yes
No
Don’t know
No answer
C31. Have you heard of programs that offer reduced rents, or help
with the rent for low-income people? For example, HUD, Section 8,
farmworker public housing, emergency rental assistance, or shelters
for the homeless.
Yes
No
Don’t know
No answer
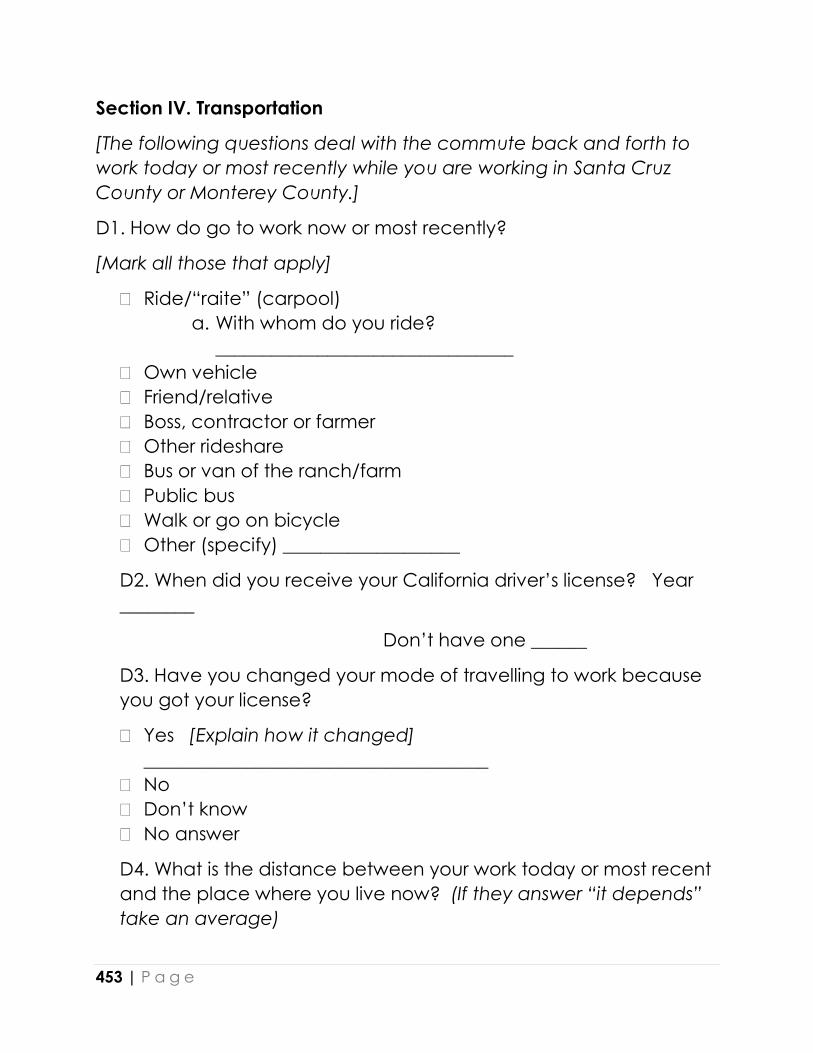
453 | P a g e
Section IV. Transportation
[The following questions deal with the commute back and forth to
work today or most recently while you are working in Santa Cruz
County or Monterey County.]
D1. How do go to work now or most recently?
[Mark all those that apply]
Ride/“raite” (carpool)
a. With whom do you ride?
________________________________
Own vehicle
Friend/relative
Boss, contractor or farmer
Other rideshare
Bus or van of the ranch/farm
Public bus
Walk or go on bicycle
Other (specify) ___________________
D2. When did you receive your California driver’s license? Year
________
Don’t have one ______
D3. Have you changed your mode of travelling to work because
you got your license?
Yes [Explain how it changed]
_____________________________________
No
Don’t know
No answer
D4. What is the distance between your work today or most recent
and the place where you live now? (If they answer “it depends”
take an average)

454 | P a g e
I live in the same place where I work
1-9 miles or less
10-24 miles
25-49 miles from the place where I work
50-74 miles
75 miles or more
It’s different every day
D5. Approximately, how long does it take you to get to work (or, only
one way) ____ hours ____ minutes
Don’t know
No answer
D6. Approximately, how much do you spent on travel to work, round
trip, in money or in gasoline?
a. $_________ b. per _____ day _____ week ____ month
Don’t know
No answer
D7. What is your usual mode of travel to go shopping? [Mark the
option you usually use]
I pay for a ride
Own vehicle or a friend/relative
Public transit
Walk or go by bicycle
Other [specify] _____________________
D8. What is your usual mode of travel to go to school? (Mark the
option that you usually use)
I pay for a ride
Own vehicle or a friend/relative
Public transit
Walk or go by bicycle
Other [specify]_____________________

455 | P a g e
D9. What is your usual mode of travel to get medical assistance?
(Mark the option that you usually use)
I pay for a ride
Own vehicle or a friend/relative
Public transit
Walk or go by bicycle
Other [specify] _____________________
D10. Approximately, how much time does it take you to arrive at?:
a. Going shopping? Number of minutes ____ Hours ____
b. Going to school? Number of minutes ____ Hours ____
c. Going to the clinic? Number of minutes ____ Hours ____
Section V. Work, Assets, and Income
E1. In the last twelve months, how many months did you work in the
field or packing plant in the US? [Average of months: 1 day or more
per month counts as 1 month] _____ ______ months
[Now we are going to ask some questions about the crop and work
in your job with your present or most recent employer in the field.]
E2. How many years have you worked for your current employer?
[One Day or more per year = one year]
______ _____ years
E3. Do you work for this employer only FOR PART OF THE YEAR or year-
round? [10 months or more qualifies as “all year” or “year round”]
All year
PART OF THE YEAR
Don’t know (first time)
E4. In what crops or products do you mainly work or did work either
today or most recently?
a. ________________ b.______________
E5. Are these crops considered organic? Yes_______ No _____

456 | P a g e
Some yes, some no _______ I don’t know _________
E6. What are the two principal jobs do you do (or have you done) in
your current job or most recent job?
a._____________________ b. _____________________
E7. How are you paid now, or in your current or most recent job?
[Mark the form of pay of this paycheck, choose only one answer.]
By the hour
By the unit (contract/piece/piecework)
Combination of hour and piece
Salary or other
E8. How much money did you receive from your employer in your
last pay (cash or check)?
a. And..Before deductions, “gross”?
$______________
b. After deductions? $
______________
E9. How many hours and days did you work to earn that pay?
a. Hours ______________ b. Days ________________
b. Quick calculation by the interviewer: Divide the (gross
dollars) by the (hours) = ___________ or said in other words
E8a/E9a = ___________
1. Does this seem correct? Yes_______ No _________
[If they say it’s not correct, go below to E9c2]
2. Then what do you think you earn per hour?
$______________
Now, some questions about Income and Assets.
E10. What is your total family income (everyone in your home) last
year – 2016 – in US dollars? [Read or show them the options. Mark just
one.]

457 | P a g e
I didn’t work in 2016 __22,500 to 24,999
Less than 500 __ 25,000 to 27,499
500 to 999 __ 27,500 to 29,999
1,000 to 2,499 ___30,000 to 32,499
2,500 to 4,999 ___ 32,500 to 34,999
5,000 to 7,499 ___ 35,000 to 37,499
7,500 to 9,999 ___ 37,500 to 39,999
10,000 to 12, 499 ___ 40,000 to 49,999
12,500 to 14,999 ___ 50,000 to 59,999
15,000 to 17,449 ___ more
17,500 to 19,999 ___ don’t remember
20,000 to 22,499 ___ don’t know
E11. Are you the owner, or are you buying any of the following
properties in Mexico (or other country of origin) ? [Read the options
and mark all of the ones that apply.]
Land to cultivate Yes ___ No ___
Land to build a house Yes ___ No ___
Houses Number of houses ____
A car or truck Yes ___ No ____
A business (specify) Yes_________ No ____
Other (specify) Yes _________ No ____
Nothing
Don’t know
Don’t answer
E12. Are you the owner or are you buying any of the following
property in the US? [Read the options and mark all that apply.]
Houses Number of houses ____
A mobile home/trailer Yes ____ No ____
A car or truck Number of vehicles____
A business (specify) Yes_________ No ____
Other (specify) Yes _________ No ____
Nothing
Don’t know

458 | P a g e
Don’t answer
E13. What changes would you suggest to improve housing for
farmworkers in Monterey and Santa Cruz County? State the most
important things for you.
a. b. c. d.
E14. What changes would you suggest to improve housing for
farmworkers in Monterey and Santa Cruz County? State the most
important things for you.
a. b. c. d.
E15. In your opinion, what type of housing would satisfy the needs of
you and your family?
______________________________________________________
Notes of interviewer:
________________________________________________
__________________________________________________________________
Codes
Monterey Areas Santa Cruz Areas
1 Aromas 13 Metz 24 Amesti
2 Blanco 14 Molus 25 Aptos Hill-
Larkin Valley
3 Camphora 15 Moss landing 26 Corralitos
4 Castroville 16 Natividad 27 Day Valley
5 Chualar 17 Neponse 28 Freedom
6 Elsa 18 Pajaro 29 Interlaken
7 Gonzales 19 Penvir 30 Johnston
Corner
8 Greenfield 20 Prunedale 31 Port
Watsonville
9 Harlem 21 Salinas 32 Watsonville
10 King City 22 Soledad
11 Las Lomas 23 Spreckles
12 Marina

459 | P a g e

460 | P a g e
APPENDIX 8: Summary Profiles and Descriptions of
Select Organizations
Non-Profit Organizations Units Staff Annual Budget ($M) Public Funding Sources
Community Housing Imrovement Systems and
Planning Association (CHISPA)2,268 50 $3.46
Community Housing Imrovement Systems and
Planning Association (CHISPA)
Tax Credits, USDA Section 515, HCD Joe Serna,
HCD Home
Salinas, CA
CHIPSA Housing Management, Inc
Salinas, CA
Central Coast Residential Builders
Salinas, CA
Eden Housing, Inc 8,526 99 $13.20
Eden Housing, Inc $7.24
Tax Credits, USDA Section 515. HCD Joe Serna,
HCD Home, HCD MHP, Bond Financing
Hayward, CA
Eden Housing Management, Inc $4.10
Hayward, CA
Eden Housing Resident Services, Inc $1.86
Hayward, CA
MidPen 7,658 375 $20.56
MidPen Housing Corporation $9.23
Tax Credits, USDA Section 515, HCD Joe Serna,
HCD Home
Foster City, CA
MidPen Property Management Corporation $3.94
Foster City, CA
MidPen Resident Services Corporation $7.39
Foster City, CA
For-Profit Organizations Units Staff Annual Budget ($M) Funding Sources
The John Stewart Company 20,000 1,000+ Private
The John Stewart Company HUD, CHFA, HCD and Tax Credit
San Francisco, CA
The John Stewart Company Property
Management
Salinas, CA
The John Stewart Company Resident Services
Salinas, CA

461 | P a g e
Community Housing Improvement Systems and Planning
Association (CHISPA) CHISPA, Inc.
295 Main St., Suite 100
Salinas, CA 93901
Mission Statement: To improve people's lives and create healthy neighborhoods
by developing, selling, owning and managing affordable homes.
Organizational Description: CHISPA (Community Housing Improvement Systems and
Planning Association, Inc.) is the largest private, nonprofit housing developer based in
Monterey County. Since its incorporation in 1980, CHISPA has built and renovated
2,268 single-family homes and apartments for low and moderate-income people in
Monterey, San Benito, and Santa Cruz Counties.
CHISPA is a 501 (c)(3) nonprofit Community-based Housing Development Organization
(CHDO), overseen by a nine-member Board of Directors. The board members have
diverse backgrounds and experience in law, agriculture, education, banking, and
business.
CHISPA offers onsite educational and recreational programs for the residents in rental
properties. Resident services are provided through partnership with local community
organizations and individual instructors, including YMCA, Boys and Girls Club of
Monterey County, Read to Me Project, Alisal Percussion, Arts Council for Monterey
County, and Alliance on Aging.
CHISPA manages all its apartment buildings with its subsidiary management
company CHISPA Housing Management (CHMI). CHISPA constructs its apartment
buildings and homes with its in-house general contracting company Central Coast
Residential Builders (CCRB).
462 | P a g e
Eden Housing, Inc. 22645 Grand Street
Hayward, CA 94541
Mission: The mission of Eden Housing is to build and maintain high quality, well-
managed, service-enhanced affordable housing communities that meet the
diverse needs of lower income families, seniors, and persons with disabilities.
History: Eden Housing was founded in 1968 by six community activists who were
greatly concerned about the lack of non-discriminatory affordable housing in
Alameda County. These pioneers, working out of makeshift “headquarters” such
as local coffee shops, were initiated into affordable housing development by
rehabilitating six older homes in Oakland for first time homebuyer families. Their
next project was much larger — development of the 150-unit Josephine Lum
Lodge for seniors in Hayward.
Organizational Description: For 50 years, Eden has demonstrated that safe,
decent, affordable homes provide a platform for families to succeed. Our
homes are the launching pad for children to go to college and families to get
ahead, and a landing place for seniors to age in place with dignity, courtesy
and respect.
Eden has worked in partnership with cities and local community partners to
develop or acquire more than 10,600 homes in communities throughout
California, currently serving a diverse population of 22,000 low-income residents
from all cultures and backgrounds. Since our humble beginnings, more than
100,000 people have come home to an Eden community.
In the mid-1980’s, to guarantee that our properties remain affordable and
professionally maintained long-term, Eden incorporated an affiliate property
management company, Eden Housing Management, Inc. (EHMI). In the mid-
1990’s, Eden expanded to provide free onsite resident support services through
Eden Housing Resident Services, Inc.
Eden Housing has over $138 million in assets making it one of the largest non-
profit housing developers in the United States.

463 | P a g e
MidPen Housing Corporation • Headquarters:
o 303 Vintage Park Drive
Suite 250
Foster City, CA 94404
• Coastal Office:
o 275 Main Street
Suite 204
Watsonville, CA 95076
831-707-2130
• East Bay Office:
o 1970 Broadway
Suite 440
Oakland, CA 94612
• North Bay Office:
o 558 B Street
Santa Rosa, CA 9540
Mission: To provide safe, affordable housing of high quality to those in need;
establish stability and opportunity in the lives of residents; and foster diverse
communities that allow people from all ethnic, social and economic
backgrounds to live in dignity, harmony and mutual respect.
History: In 1970, a small but influential coalition of Silicon Valley entrepreneurs, UC
Berkeley and Stanford faculty and other community leaders came together to
address concerns over the lack of affordable housing in the San Francisco Bay
Area. Out of their vision to create affordable housing solutions and with David
Packard’s personal guarantee on the first line of credit, MidPen Housing was
born.
Organizational Description: Driven by the belief that there had to be a better
way to build affordable housing, MidPen began to champion a whole new
industry. Leaving behind the public housing of the 1970s, known for its poor
design, poor management, crime and segregation, they created a new
paradigm: beautifully designed, well-managed housing built near good schools
and jobs. The kind of communities that make residents proud, revitalize cities,
win awards, and make great neighbors.
In the 45-plus years since they were founded, MidPen has built on the passion,
pioneering spirit and values of our founders: innovation, collaboration, shaking
the status quo and commitment to a clear social mission.
The MidPen family of companies includes MidPen Property Management
Corporation and MidPen Resident Services Corporation. With $126 million in
464 | P a g e
assets, the organization is one of the largest non-profit housing developers in the
United States.
Housing Authority of the County of Monterey Mission: The Mission Statement of The Housing Authority of the County of
Monterey is: “To provide, administer, and encourage quality affordable housing
and related services to eligible residents of Monterey County”
The Housing Authority accomplishes its mission by providing a variety of housing
and services through:
• Housing Choice Vouchers (formerly Section 8)
• Public Housing
• Farm Labor Housing
• Tax Credit and other Affordable Housing Programs
The Housing Authority partners with a broad spectrum of community non-profits,
city and county agencies, and state organizations to address affordable
housing and housing shortage issues.
History: The Housing Authority of the County of Monterey (HACM) was created
under the authority of the Health and Safety Code by Resolution which
identified a need for safe and sanitary low-income housing, by the Monterey
County Board of Supervisors on March 17, 1941.
Organizational Description: The Housing Authority of the County of Monterey
provides a variety of housing and services to low and moderate-income
residents of Monterey County.
The Housing Authority is supported by grants and special allocations from
the U.S. Department of Housing and Urban Development and the State of California
housing programs. In addition, the Monterey County Inclusionary Housing Fund
often provides seed money for housing development projects. The agency
receives no general fund allocation, tax increment revenue, or special funding
from the State of California, the County of Monterey or any city government.
The Housing Authority of the County of Monterey is growing, as is evidenced by
its expanding financial capacity.
HACM currently employs approximately 77 individuals and has a budget of $41
million, a substantial portion of the budget or $28 million was expended on
housing vouchers. As of 2016 HACM had total assets of approximately $140
million.
465 | P a g e
Housing Authority of the County of Santa Cruz Mission: The mission of the Housing Authority of the County of Santa Cruz is to
promote access to quality affordable housing, utilize housing as a platform for
improving quality of life, and support inclusive, healthy and sustainable
communities free from discrimination.
History: The Housing Authority of the County of Santa Cruz was created in 1969
with the charter to provide housing assistance for the county’s low and
moderate-income residents. The Agency also administers the Housing Authorities
for the Cities of San Juan Bautista and Hollister on a contract basis.
Organizational Description: The Housing Authority is an independent agency
governed by a seven-member Board of Commissioners. The County Board of
Supervisors, on an at-large basis, appoints the Commissioners. Two of the
Commissioners must be tenants of the Housing Authority, of which one must also
be over 62 years of age. The Agency has been designated as “High Performing”
by HUD for over 10 years. It employs 64 staff and operates with an annual
budget of $64 million (of which $54 million are pass-through funds). Current
programs include: administration of Housing Choice Voucher (“Section 8”)
program (4,539 vouchers including 286 VASH), and management of 234 units of
low income public housing, 106 units of migrant farmworker housing, 70 units of
USDA farmworker housing, and tax credit apartments and transitional housing
units. The Housing Authority also provides a wide variety of additional services
related to family self-sufficiency, housing rehabilitation, and homebuyer
assistance.
HACSC currently employs approximately 65 individuals and has a budget of $65
million, a substantial portion of the budget or $57 million was expended on
housing vouchers. As of 2016 HACSC had total assets of approximately $25
million.

466 | P a g e
Appendix 9: Non-Profit, For-Profit, and Public
Agencies that Supply and Manage Affordable
Housing in Santa Cruz and Monterey Counties EAH Housing
Non-Profit Housing Developer
San Rafael, California
www.eahhousing.org
The John Stewart Company
For-Profit Housing Developer
San Francisco, California
www.jsco.net
Mercy Housing
Non-Profit Housing Developer
San Francisco, California
www.mercyhousing.org
The Pacific Companies
For-Profit Housing Developer
Eagle, Idaho
www.tpchousing.com

467 | P a g e
Appendix 10: Permanent Affordable Farmworker
Housing Demand Model Assumptions
Total Farmworkers
91,500
Married to Farmworker 50%
Married to Non-Farmworker 23%
Single 27%
Respondents w/Minor
Children 57%
Migrant 20%
Migrant w/Family 10%
Migrant Desiring Perm Resd 80%
Minors Per Respondent
1.36
Total Farmworker (FW) Population Including Minor
Children
Married
FW w/FW Spouse 50% 45,750
FW w/Non-FW Spouse 23% 21,045
Single
All Single FW 27% 24,705
Total Married and Single 91,500
Migrant Adjustment -20%
(18,300)
Permanent FW Residents 73,200
Minor Children per FW
1.36 99,552
Non- FW Spouse of FW Adjustment 23% 21,045
Total Including Minor Children 193,797
Farmworker Range of Housing Demand
based on People Per Dwelling (PPD)
Deman
d Renters vs. Owners
Total Number of Individuals
193,797 Renters Owners
Monterey County
127,906 89% 11%
At Current PPD
7.00
18,272
16,262
2,010
At Hispanic PPD
4.38
29,202
25,990
3,212

468 | P a g e
At Average PPD
3.23
39,599
35,243
4,356
Santa Cruz County
65,891 89% 11%
At Current PPD
7.00
9,413
8,378
1,035
At Hispanic PPD
4.33
15,217
13,543
1,674
At Average PPD
2.60
25,343
22,555
2,788
Both Counties
193,797 89% 11%
At Current PPD
27,685
24,640
3,045
At Hispanic PPD
44,420
39,533
4,886
At Average PPD
64,942
57,798
7,144
Farmworker Affordable Housing Demand
Monterey County Access Rate Rental
At Current PPD 7.60% 1,236
At Hispanic PPD 7.60% 1,975
At Average PPD 7.60% 2,679
Santa Cruz County
At Current PPD 7.60% 637
At Hispanic PPD 7.60% 1,029
At Average PPD 7.60% 1,714
Both Counties
At Current PPD 7.60% 1,873
At Hispanic PPD 7.60% 3,005
At Average PPD 7.60% 4,393
Affordable Housing Gap
Monterey County Demand Supply Gap
At Current PPD 1,236 448 788
At Hispanic PPD 1,975 448 1,527
At Average PPD 2,679 448 2,231
Santa Cruz County Demand Supply Gap
At Current PPD 637 368 269
At Hispanic PPD 1,029 368 661
At Average PPD 1,714 368 1,346
Both Counties Demand Supply Gap

469 | P a g e
At Current PPD 1,873 816 1,057
At Hispanic PPD 3,005 816 2,189
At Average PPD 4,393 816 3,577

470 | P a g e
Appendix 11: Regional Forum – April 19, 2018
471 | P a g e
Figures and Tables Figure 1 Map of Study Area ............................................................................................. 4
Figure 2 Agricultural Land: Monterey and Santa Cruz Counties 2012 .................... 11
Figure 3 Number of farms: Monterey and Santa Cruz Counties by Type ............... 14
Figure 4 Number of Farms: Monterey and Santa Cruz Counties by Principal Type
........................................................................................................................................... 15
Figure 5 Monterey and Santa Cruz Farms Harvested Acres by Amount Harvested
........................................................................................................................................... 16
Figure 6 Acreage berry and Apple Crops, Monterey and Santa Cruz Counties . 19
Figure 7 Value of Farm Production ............................................................................... 21
Figure 8 Percent Increase of value of Farm Production ........................................... 22
Figure 9 Percent Change of Production Salinas and Pajaro Laborshed ............... 23
Figure 10 Monterey and Santa Cruz Counties: Value of Farm Production ............ 24
Figure 11 Harvested Acreage Lettuce, Salinas Pajaro Laborshed .......................... 25
Figure 12 Berry and Wine Grape Production Salinas Pajaro Laborshed ................ 27
Figure 13 Annual Average of Monthly Agriculture Employment Monterey and
Santa Cruz Counties 2005-16......................................................................................... 36
Figure 14 Monthly Employment, Agricultural Workers by Type of Employer,
Monterey and Santa Cruz Counties ............................................................................ 37
Figure 15 Temporary nonimmigrant Foreign Agricultural workers Certified (h2a)
Monterey and Santa Cruz Counties ............................................................................ 50
Figure 16 Percent of US Household Purchases, 3 year average, 2007-09 to 2015-
17 ....................................................................................................................................... 55
Figure 17 Housing for Permanent Farmworkers: Year placed in Service ................ 60
Figure 18 Miles to Work ................................................................................................... 93
Figure 19 Mode of Transport .......................................................................................... 94
Figure 20 Travel Time to Work ........................................................................................ 94
Figure 21 Distribution of Participants by gender and age ...................................... 153
Figure 22 Self-identified indigenous workers ............................................................. 154
Figure 23 Interviewees by Country of birth................................................................ 154
Figure 24 Distribution of interviewees by place of birth in Mexico ........................ 155
Figure 25 Interviewees by marriage status ................................................................ 156
Figure 26 Marriage status of 3 age groups ............................................................... 156
Figure 27 Median years in US by Ethnicity and Gender .......................................... 157
Figure 28 Years of schooling -- Interviewees ............................................................. 158
Figure 29 Distribution of education by place of birth .............................................. 159
Figure 30 Household Types .......................................................................................... 160
Figure 31 Distribution of associated Family Members by Place of Birth and Age
......................................................................................................................................... 162
Figure 32 Median years in US for non-interviewed Family Members ..................... 163

472 | P a g e
Figure 33 Years of School by US v Immigrant Adults (non-interviewed) ............... 164
Figure 34 Percent of Family Members who did farm work in past year ............... 165
Figure 35 Gender of FTC Migrants .............................................................................. 166
Figure 36 Comparison of Dwelling Type: Migrant and Non-Migrant .................... 167
Figure 37 WHO LIVES WITH WORKERS WHILE IN SALINAS PAJARO ......................... 168
Figure 38 Where do FTC Migrants Work? ................................................................... 169
Figure 39 ALL RESIDENTS BY GENDER AND AGE ........................................................ 171
Figure 40 Renters and Owners who Rent Out Space .............................................. 172
Figure 41 PEOPLE SLEEPING OUTSIDE BEDROOMS .................................................... 173
Figure 42 Types of Dwellings ........................................................................................ 174
Figure 43 Distribution of number of PPR ..................................................................... 176
Figure 44 Mean and Median of PPR BY PEOPLE Sleeping At Address .................. 176
Figure 45 Distribution by Type of dwelling ................................................................. 178
Figure 46 Utility Payments by Residence ................................................................... 183
Figure 47 How respondents get to work .................................................................... 187
Figure 48 Miles traveled to work ................................................................................. 187
Figure 49 Time it takes to get to work......................................................................... 187
Figure 50 Dates of Obtaining Driver's License .......................................................... 189
Figure 51 Months worked in Agriculture in past 12 months .................................... 190
Figure 52 Months worked in Agriculture by Migration Status ................................. 190
Figure 53 Years worked for Current Employer .......................................................... 191
Figure 54 Years worked for Current Employer by Migration Status ....................... 191
Figure 55 Self-Identified Employment Type ............................................................... 192
Figure 56 Household Income Levels ........................................................................... 193
Figure 57 Income Level by Household Size ............................................................... 194
Figure 58 Organic v Conventional Crops .................................................................. 195
Figure 59 Crops in which respondents worked ........................................................ 195
Figure 60 Tasks Done by Respondents ....................................................................... 196
Figure 61 Respondents by Task and Crop ................................................................. 197
Figure 62 Why live in Area? .......................................................................................... 205
Figure 63 Challenges for Employers .......................................................................... 208
Figure 64 Improving Housing ....................................................................................... 209
Figure 65 Housing Solutions .......................................................................................... 211
Table 1 Farms Reporting Harvested Berry Crop Acreage and Orchard Plantings
........................................................................................................................................... 18
Table 2 Summary of Number of Multi-County Farms Salinas Pajaro Region 2016 30
Table 3 Comparison of Migrant and Seasonal Definitions for Service Eligibility .... 33
Table 4 Monterey and Santa Cruz Counties: Number of hired farmworkers (Jobs)
2012 ................................................................................................................................... 35

473 | P a g e
Table 5 Size Distribution of Employment, by Firm Size, 3rd Quarter, Monterey
County Farm Operators 1990&2016 ............................................................................. 38
Table 6 Size Distribution of Total Wages, by firm size, 3rd Quarter, Monterey
County Crop Farm Operators 1990&2016 ................................................................... 39
Table 7 Expenses: Total Labor, Contract Labor, % Contract Labor by Type of
Farms, Millions. Monterey and Santa Cruz Counties Combined 2012 4-digit NAICS
Classification .................................................................................................................... 41
Table 8 Number of Farms Reporting Hired or Contract Labor Expenses, Monterey
and Santa Cruz Counties, 1978 & 2012 ....................................................................... 42
Table 9 Size Distribution of Employment, by firm size, 3rd Quarter, Monterey
County, Agricultural Services for Farm Production, 1990&2016 ............................... 42
Table 10 Reported Number of FLCs 2016, Monterey and Santa Cruz Counties ... 45
Table 11 Monterey or Santa Cruz Counties' FLC Registrants appearing in
Agricultural Commissioner FLC Registration Files in other counties ......................... 47
Table 12 Year-Round Permanent Farmworker housing in Santa Cruz and
Monterey Counties ......................................................................................................... 59
Table 13 Migrant and Seasonal Housing in Santa Cruz and Monterey Counties . 62
Table 14: TCAC Methodology for Determining Rural Status and Funding Eligibility
........................................................................................................................................... 72
Table 15 TCAC Proximity Requirements -- Transit Amenities, Maximum points in
each category ................................................................................................................ 76
Table 16: TCAC Proximity Requirements - Other Amenities – maximum points in
each category ................................................................................................................ 77
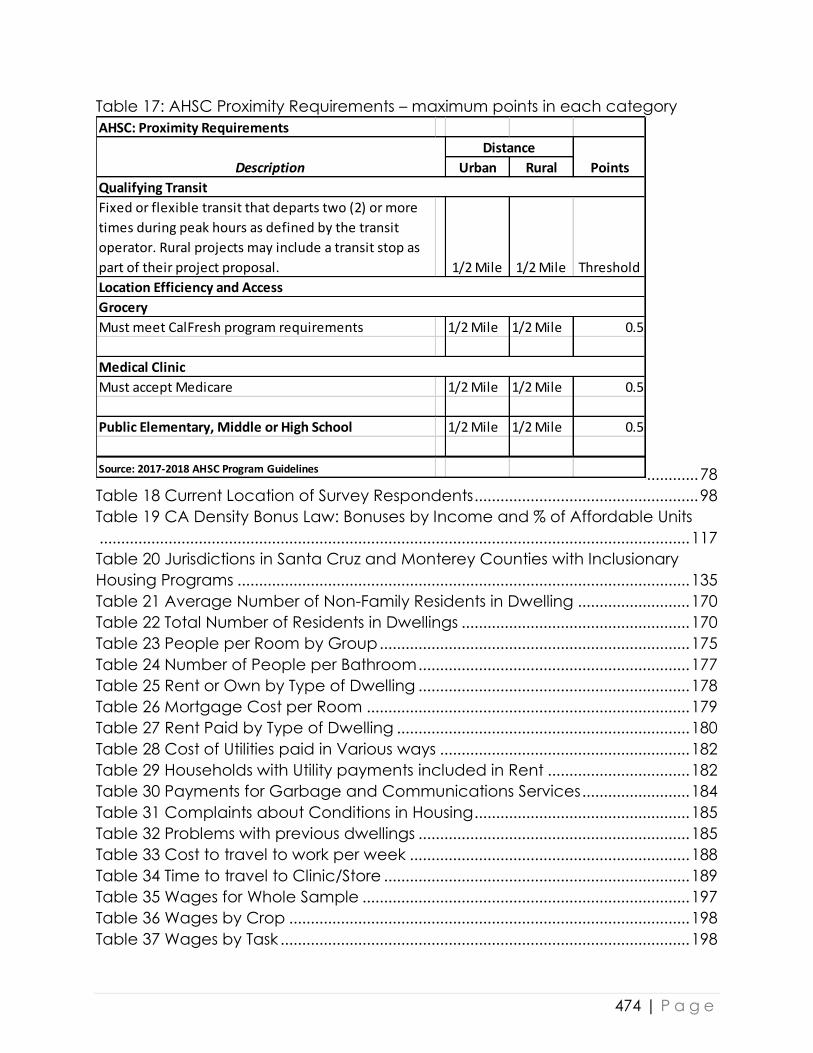
474 | P a g e
Table 17: AHSC Proximity Requirements – maximum points in each category
............ 78
Table 18 Current Location of Survey Respondents .................................................... 98
Table 19 CA Density Bonus Law: Bonuses by Income and % of Affordable Units
......................................................................................................................................... 117
Table 20 Jurisdictions in Santa Cruz and Monterey Counties with Inclusionary
Housing Programs ......................................................................................................... 135
Table 21 Average Number of Non-Family Residents in Dwelling .......................... 170
Table 22 Total Number of Residents in Dwellings ..................................................... 170
Table 23 People per Room by Group ........................................................................ 175
Table 24 Number of People per Bathroom ............................................................... 177
Table 25 Rent or Own by Type of Dwelling ............................................................... 178
Table 26 Mortgage Cost per Room ........................................................................... 179
Table 27 Rent Paid by Type of Dwelling .................................................................... 180
Table 28 Cost of Utilities paid in Various ways .......................................................... 182
Table 29 Households with Utility payments included in Rent ................................. 182
Table 30 Payments for Garbage and Communications Services ......................... 184
Table 31 Complaints about Conditions in Housing .................................................. 185
Table 32 Problems with previous dwellings ............................................................... 185
Table 33 Cost to travel to work per week ................................................................. 188
Table 34 Time to travel to Clinic/Store ....................................................................... 189
Table 35 Wages for Whole Sample ............................................................................ 197
Table 36 Wages by Crop ............................................................................................. 198
Table 37 Wages by Task ............................................................................................... 198
AHSC: Proximity Requirements
Urban Rural
Fixed or flexible transit that departs two (2) or more
times during peak hours as defined by the transit
operator. Rural projects may include a transit stop as
part of their project proposal. 1/2 Mile 1/2 Mile Threshold
Must meet CalFresh program requirements 1/2 Mile 1/2 Mile 0.5
Must accept Medicare 1/2 Mile 1/2 Mile 0.5
Public Elementary, Middle or High School 1/2 Mile 1/2 Mile 0.5
Source: 2017-2018 AHSC Program Guidelines
Grocery
Medical Clinic
Description
Distance
Points
Qualifying Transit
Location Efficiency and Access

475 | P a g e
Table 38 Assets of Foreign Born Respondents in Home Countries ......................... 198
Table 39 US Assets of Foreign Born Respondents ..................................................... 199
Table 40 Assets of US Born Respondents .................................................................... 199
Table 41 Birth Place, Age and Education ................................................................. 199
Table 42 Alternative Models for Development, Tenure, and Funding .................. 267
Table 43: RHNA for Very Low and Low-Income Housing Units by Location
................................................................ 345
Table 44: Estimated Total Population Including Minor Children ............................ 348
Table 45: Range of Housing Demand in Each County ........................................... 349
Table 46: Farmworker Affordable Housing Demand in Monterey and Santa Cruz
County ............................................................................................................................ 350
Table 47: Permanent Affordable Farmworker Housing Gap .................................. 351
Table 48 Projected Development of Farmworker Housing in Monterey and Santa
Cruz Counties 2019-2029 .............................................................................................. 356
RHNA Allocation
Geography Total Very Low Low
Monterey County 1914 1159 755
Gonzales 117 71 46
Greenfield 144 87 57
King City 71 43 28
Salinas 888 538 350
Soledad 76 46 30
Balance of County 618 374 244
Santa Cruz County 524 317 207
Watsonville 279 169 110
Balance of County 524 317 207

476 | P a g e
End Notes
1 24/7 Wall St., http://247wallst.com/special-report/2017/06/24/americas-25-least-affordable-housing-markets-2/. 2 Questionnaire response of Barbara Macri-Ortiz, Ventura County attorney and community activist, November 7,
2017. 3 While there are no absolute guarantees, Section 521 Rural Rental Assistance contracts are renewable on an annual
basis subject to Congressional appropriations. 4 Email from Alex Castilla, Property Portfolio Supervisor, Cabrillo Economic Development Corporation, January
12, 2018. 5 The Serna Program has not had new funding since the exhaustion of bond proceeds from Proposition 1C, which
was approved by California voters in 2006. However, the Legislature’s passage of SB 2 in 2017 could provide
about $25 million annually for Serna. Further, if voters approve the Veterans and Affordable Housing Bond Act of
2018 on the November 2018 State ballot, another $300 million will be earmarked for Serna. 6 In the 1990s, USDA provided larger awards of Section 514/516 across the counter; now, the total dollar award of
loans and grants per project is capped at $3 million and the funds are highly competitive and leveraged. The Family
Housing Demonstration Program was briefly operated as a component of the Multifamily Housing Program to test
innovative strategies of providing affordable housing combined with child care and job training to help families
eligible for CALWORKs move from welfare to work. 7 24/7 Wall St., http://247wallst.com/special-report/2017/06/24/americas-25-least-affordable-housing-markets-2/. 8 See https://www.jlcbuild.com/companies/jl-modular/. 9 While there are no absolute guarantees, Section 521 Rural Rental Assistance contracts are renewable on an annual
basis subject to Congressional appropriations. 10 The concept of Zero Net Energy differs from LEED (Leadership in Energy and Environmental Design) in that the
assessment is performed by measuring the amount of renewable energy produced over time rather than giving points
to systems that may work in the short-run but will not provide the same amount of energy savings in the long-run. xi Before the Digital Literacy class was created, ACCESS from Empower Yolo conducted three computer classes
every quarter. The subjects taught were how to use a computer, how to create an email account, and how to use
School Loop. Classes were mainly aimed at parents who wanted to become computer-conversant. xii Dept. of Agriculture and Weights & Measures: 2016 Agricultural Crop Report, Napa County, April 2017, p. 3. xiii Final Report: 2012 Napa County Farmworker Housing Needs Assessment, Executive Summary, Bay Area
Economics, produced for Napa County Housing and Intergovernmental Affairs, 2012, pp. vi-viii. xiv Rural Migration News, January 2010, Volume 16, Number 1. xv Rural Migration News, October 2000, Volume 6, Number 4. xvi SB 2 imposes a $75 per document recordation fee on real estate transactions, not including home sales. Ten
percent of the proceeds must be used for farmworker housing. xvii Currently, County code allows for the development of farmworker housing by right on agricultural land. xviii Food services, including cooks and other staff, supplies, and maintenance, accounts for $128,577 of total
expenses. xix At the time of this research, December 2017, there were 52 lodgers present. xx 2018 will be the 20th anniversary of the Cinco de Mayo, Inc., golf tournament and will probably surpass the $1
million mark.