Embed Size (px)
DESCRIPTION
Fast Generation of Nested Space-filling Latin Hypercube Sample Designs . Keith Dalbey, Ph.D. Sandia National Labs, Dept 1411 , Optimization and Uncertainty Quantification George N. Karystinos, Ph.D. Technical University of Crete, Depart. of Electronic and Computer Engineering. - PowerPoint PPT Presentation
Citation preview
Fast Generation of Nested Space-filling Latin Hypercube Sample Designs
Jan. 31 – Feb. 3, 2011
Keith Dalbey, Ph.D.Sandia National Labs, Dept 1411, Optimization and Uncertainty Quantification
George N. Karystinos, Ph.D.Technical University of Crete, Depart. of Electronic and Computer Engineering
Sandia is a multiprogram laboratory operated by Sandia Corporation, a Lockheed Martin Company, for the United States Department of Energy’s National Nuclear
Security Administration under Contract DE-AC04-94AL85000.
Outline
• Sampling: Why & What’s Good?
• Sample Design Quality Metrics
• “Binning Optimality,” a New Space-filling Metric
• Latin Hypercube Sampling (LHS)
• Jittered Sampling
• Binning Optimal Symmetric Latin Hypercube Sampling (BOSLHS)
• Conclusions
• Current Work
Sampling: Why & What’s Good?
Problem: generate a M dimensional sample design with Npoints at which to evaluate a simulator
Why sample simulator input?• To calculate statistics of outputs with uncertain inputs• To optimize e.g., guess several times and pick best guess• To construct meta-models (fast surrogates for slow simulators)
What qualities do we want in a sample design?• Design should be space-filling• Low-dimensional projections of points should be well spaced• Sample point locations should be uncorrelated with each other• Regularity is bad, leads to biased results• Nesting: want a SEQUENCE of designs that inherit all points
from earlier members in the sequence
Sample Design Quality Metrics
• Lots of metrics; fortunately one of them is almost always the most important
• “Discrepancy” (some norm of difference between points per sub-volume and uniform density): lower is better– “Koksma-Hlawka-like inequality” bounds error in a computed
mean in terms of discrepancy– Centered L2 Discrepancy (usually most important metric)– Wrap-Around L2 Discrepancy (important for periodic variables)
• Unfortunately, discrepancy is expensive (O(M N2) ops) to calculate for designs with large numbers of points, N, so...
• Can’t guess a large number of designs & pick the best
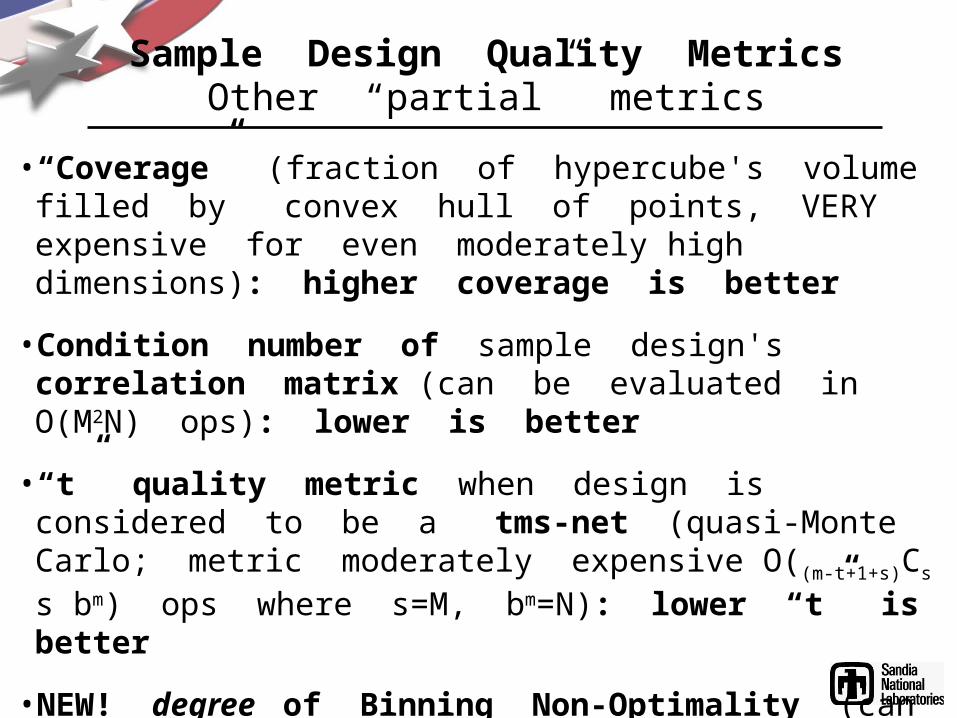
Sample Design Quality MetricsOther “partial” metrics
• “Coverage” (fraction of hypercube's volume filled by convex hull of points, VERY expensive for even moderately high dimensions): higher coverage is better
• Condition number of sample design's correlation matrix (can be evaluated in O(M2N) ops): lower is better
• “t” quality metric when design is considered to be a tms-net (quasi-Monte Carlo; metric moderately expensive O((m-t+1+s)Cs s bm) ops where s=M, bm=N): lower “t” is better
• NEW! degree of Binning Non-Optimality (can be evaluated in O(N log(N)) time): lower is better
“Binning Optimality”a New Space-filling Metric
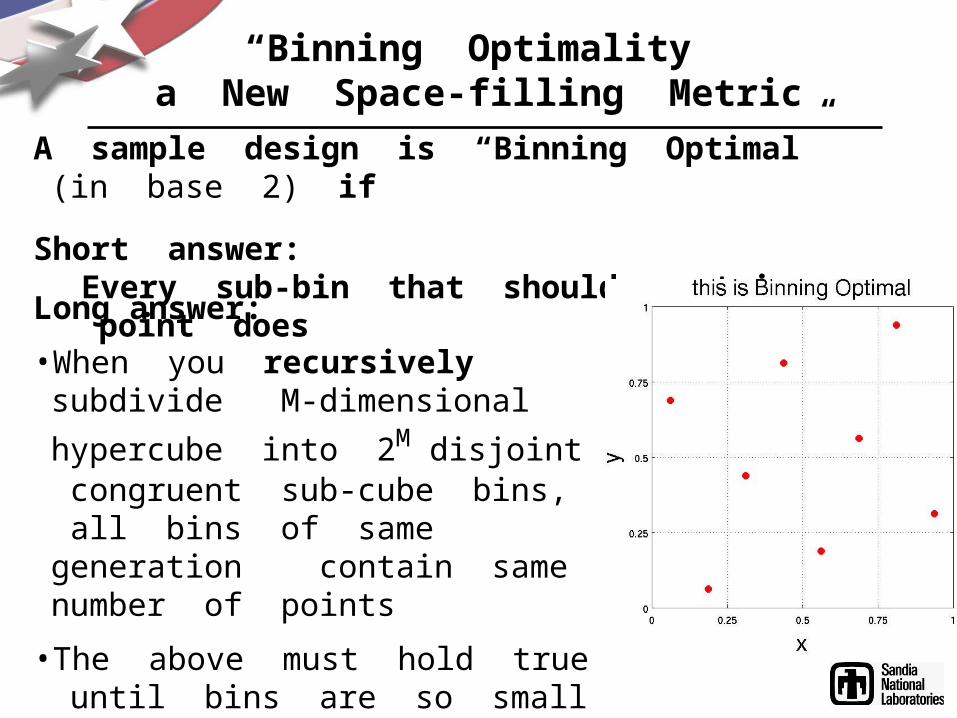
A sample design is “Binning Optimal” (in base 2) if
Short answer: Every sub-bin that should contain a point does
Long answer:• When you recursively subdivide M-dimensional hypercube into 2M disjoint congruent sub-cube bins, all bins of same generation contain same number of points
• The above must hold true until bins are so small that they each contain either 0 or 1 points
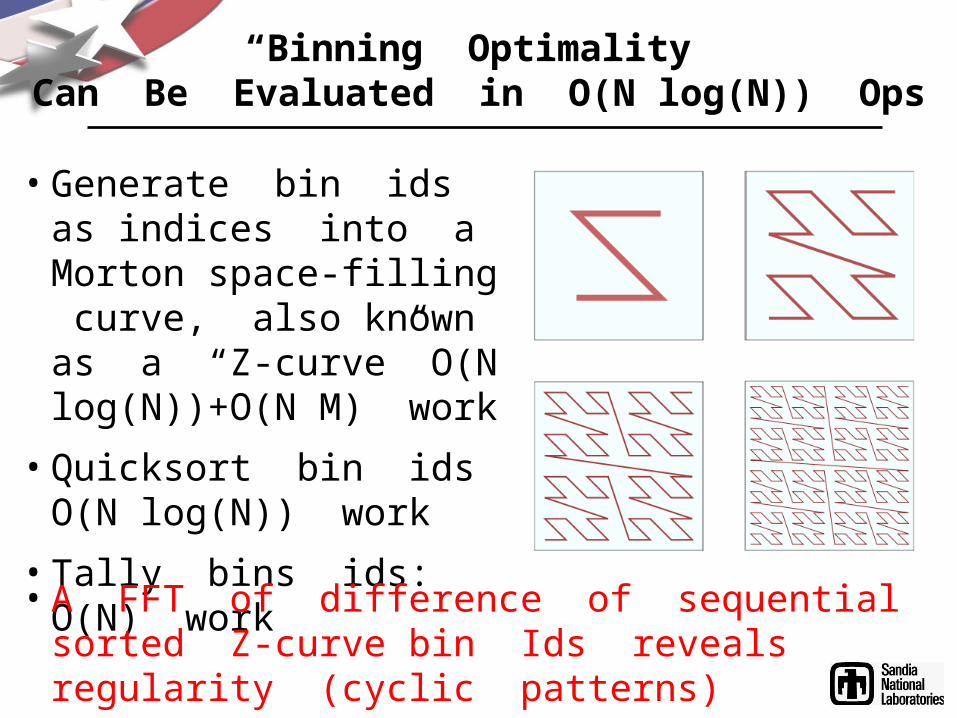
• Generate bin ids as indices into a Morton space-filling curve, also known as a “Z-curve” O(N log(N))+O(N M) work
• Quicksort bin ids O(N log(N)) work
• Tally bins ids: O(N) work
“Binning Optimality”Can Be Evaluated in O(N log(N)) Ops
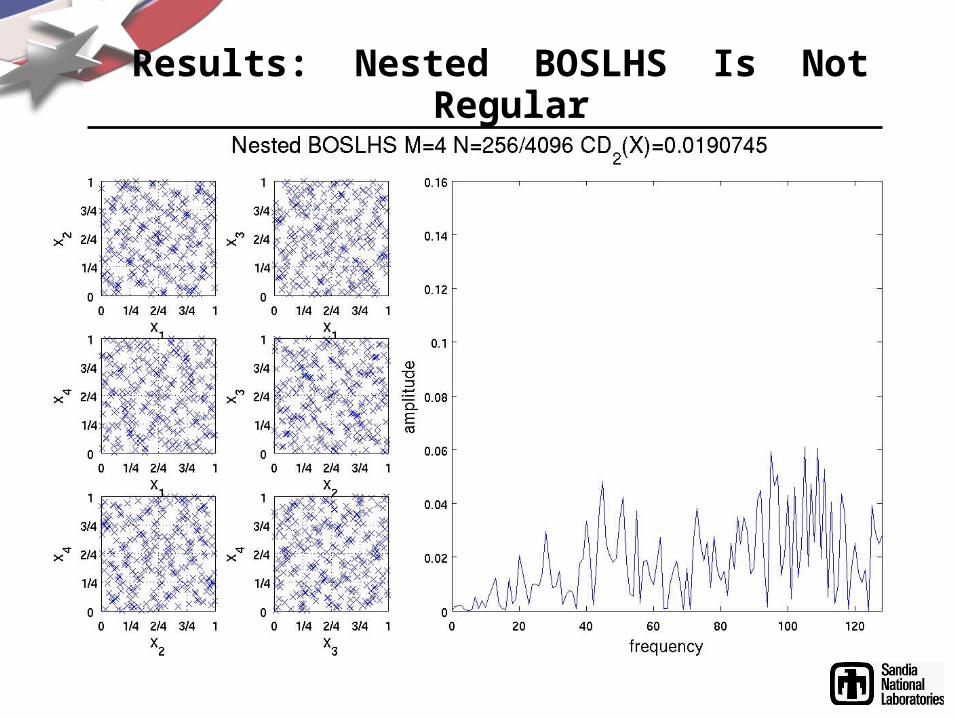
• A FFT of difference of sequential sorted Z-curve bin Ids reveals regularity (cyclic patterns)
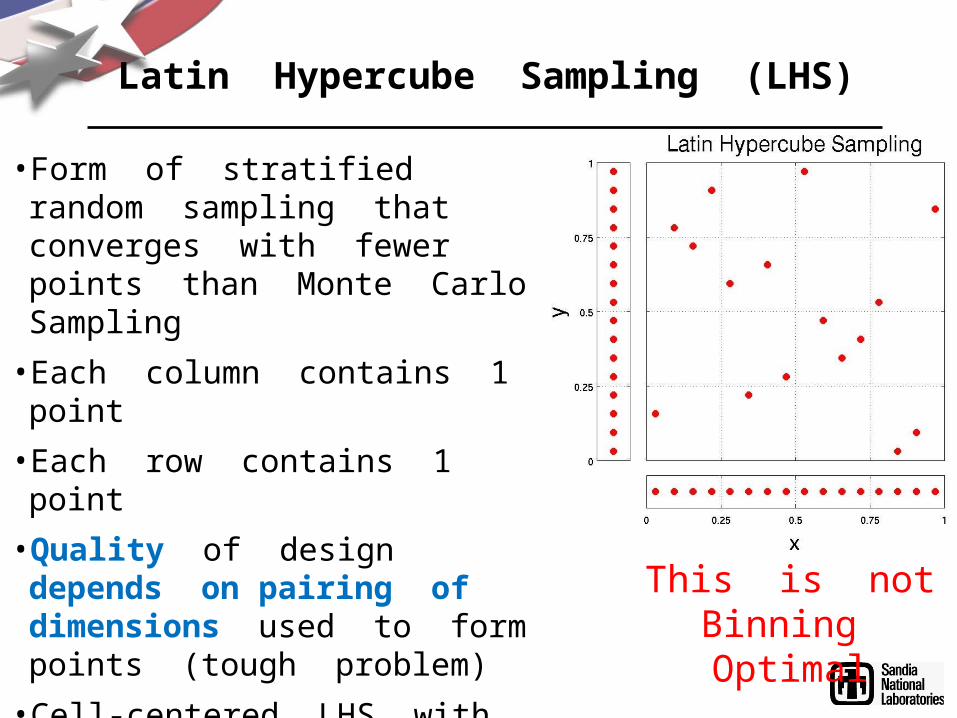
• Form of stratified random sampling that converges with fewer points than Monte Carlo Sampling
• Each column contains 1 point• Each row contains 1 point• Quality of design depends on pairing of dimensions used to form points (tough problem)
• Cell-centered LHS with randomly paired dimensions– gets 1D projections “perfect”– Is NOT space-filling
Latin Hypercube Sampling (LHS)
This is notBinning Optimal
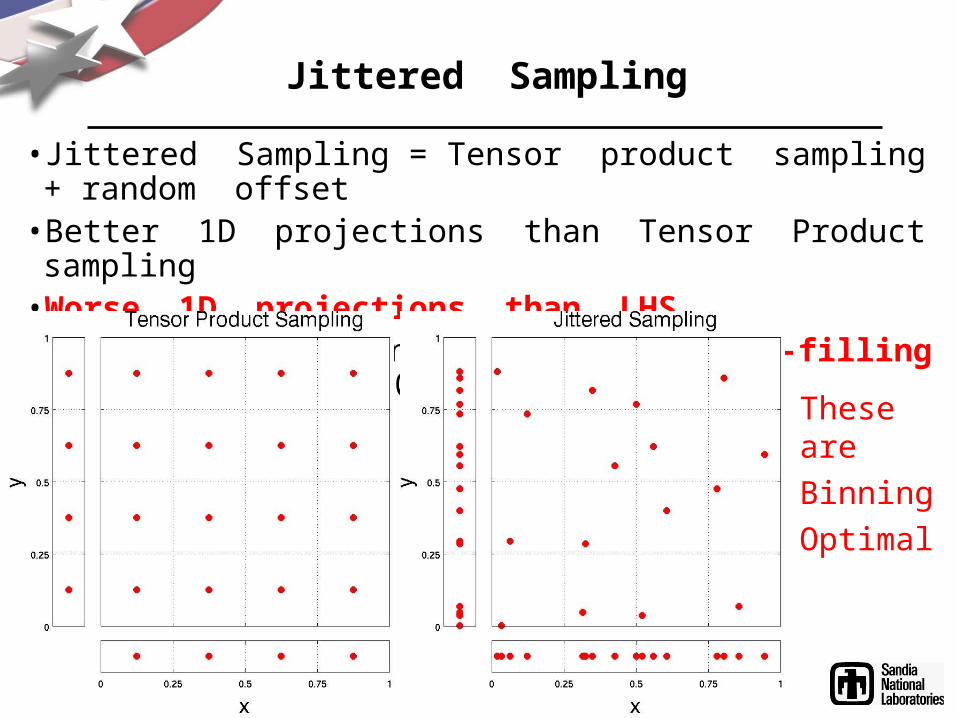
Jittered Sampling
• Jittered Sampling = Tensor product sampling + random offset• Better 1D projections than Tensor Product sampling• Worse 1D projections than LHS• Each cell contains a point space-filling as cell size 0
These are BinningOptimal
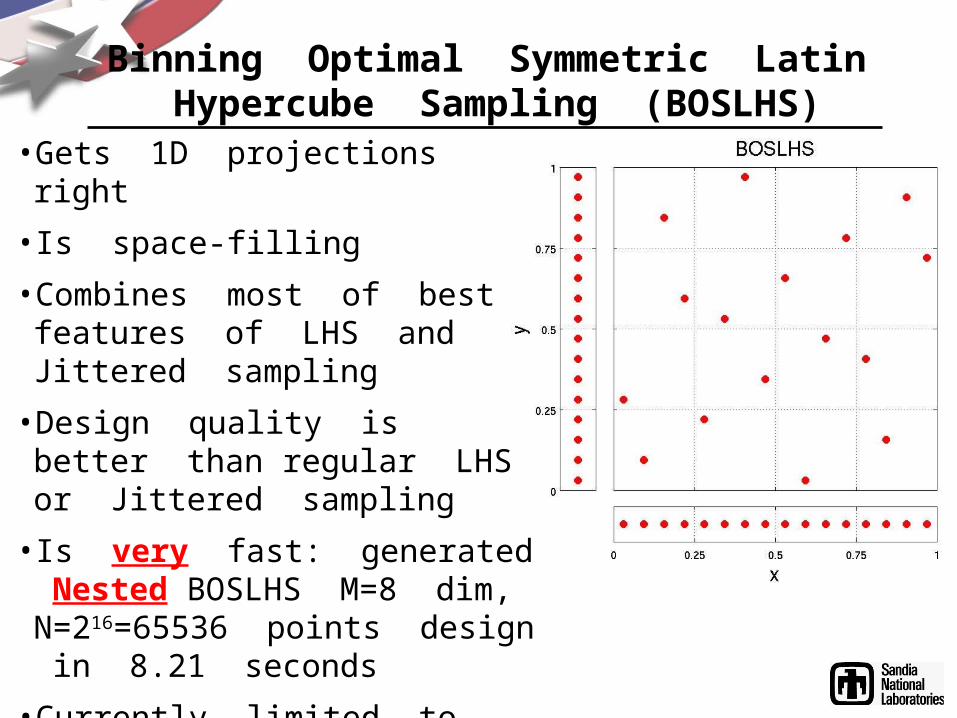
Binning Optimal Symmetric Latin Hypercube Sampling (BOSLHS)
• Gets 1D projections right• Is space-filling• Combines most of best features of LHS and Jittered sampling
• Design quality is better than regular LHS or Jittered sampling
• Is very fast: generated Nested BOSLHS M=8 dim, N=216=65536 points design in 8.21 seconds
• Currently limited to M=2p < 16 dimensions (low degree of binning non-optimality for non integer p, working on extending to M > 16)
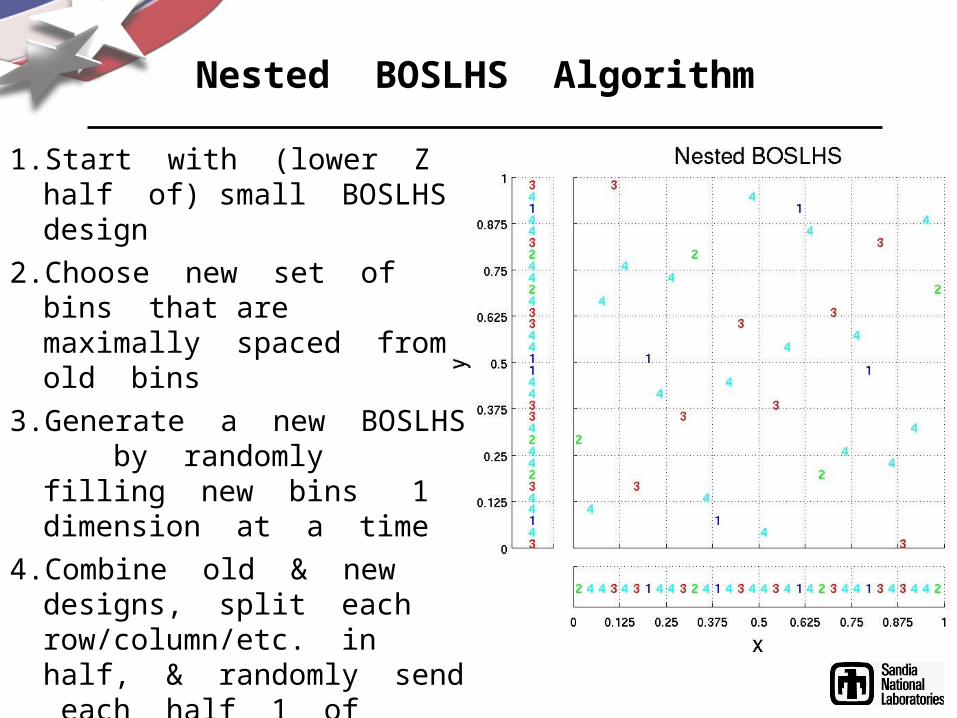
Nested BOSLHS Algorithm
1. Start with (lower Z half of) small BOSLHS design
2. Choose new set of bins that are maximally spaced from old bins
3. Generate a new BOSLHS by randomly filling new bins 1 dimension at a time
4. Combine old & new designs, split each row/column/etc. in half, & randomly send each half 1 of duplicate coordinates
5. Repeat steps 2 through 4 as many times as desired.
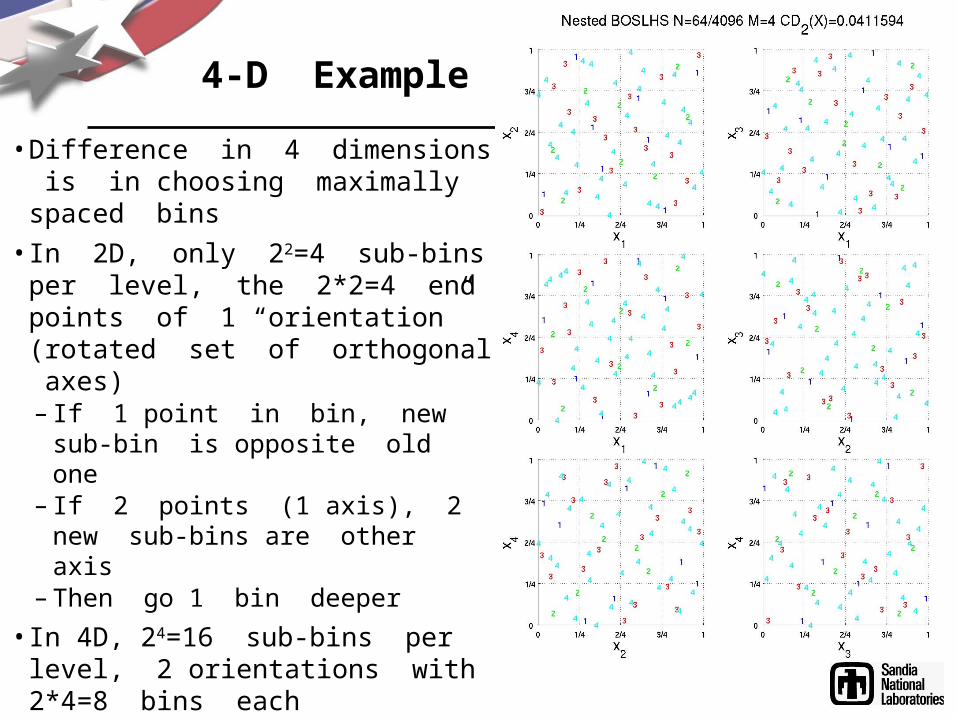
4-D Example
• Difference in 4 dimensions is in choosing maximally spaced bins
• In 2D, only 22=4 sub-bins per level, the 2*2=4 end points of 1 “orientation” (rotated set of orthogonal axes)– If 1 point in bin, new sub-bin is
opposite old one– If 2 points (1 axis), 2 new sub-bins
are other axis– Then go 1 bin deeper
• In 4D, 24=16 sub-bins per level, 2 orientations with 2*4=8 bins each– After first axis, randomly select order
of other axes in same orientation– Then choose other orientation– Then go 1 bin deeper

• Generating list is simple for up to M=8 dimensions.It’s difficult beyond that BUT…
• It’s similar to digital communication problems
• Collaborator, Professor George N. Karystinos of Technical University of Crete (Department of Electronic & Computer Engineering), found a group theory solution for arbitrarily large dimensions
• But… memory requirements prevent even listing the octants for M > 32
• Working on generating maximally spaced partial list
Higher Dimensions Need a Maximally Spaced List of Octants
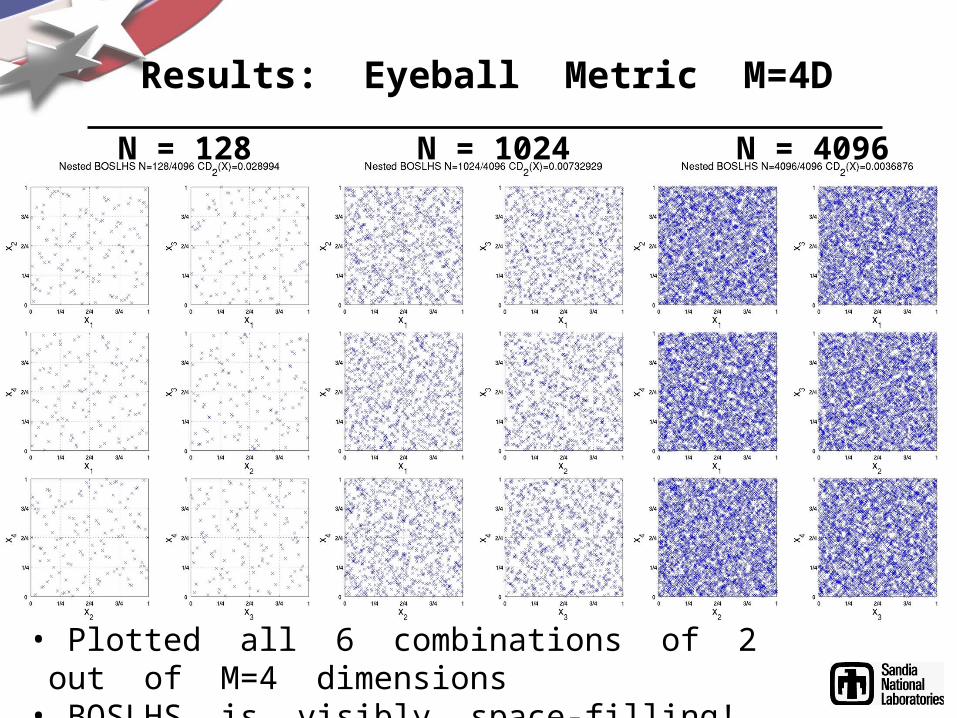
Results: Eyeball Metric M=4D
• Plotted all 6 combinations of 2 out of M=4 dimensions
• BOSLHS is visibly space-filling!
N = 128 N = 4096N = 1024
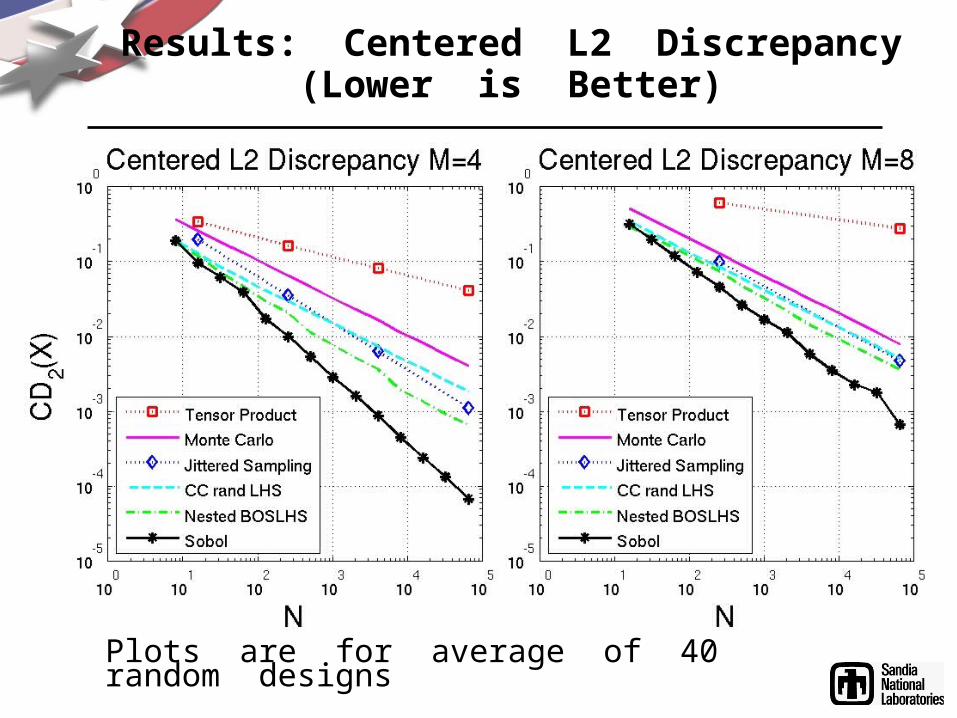
Results: Centered L2 Discrepancy(Lower is Better)
10.26
Plots are for average of 40 random designs
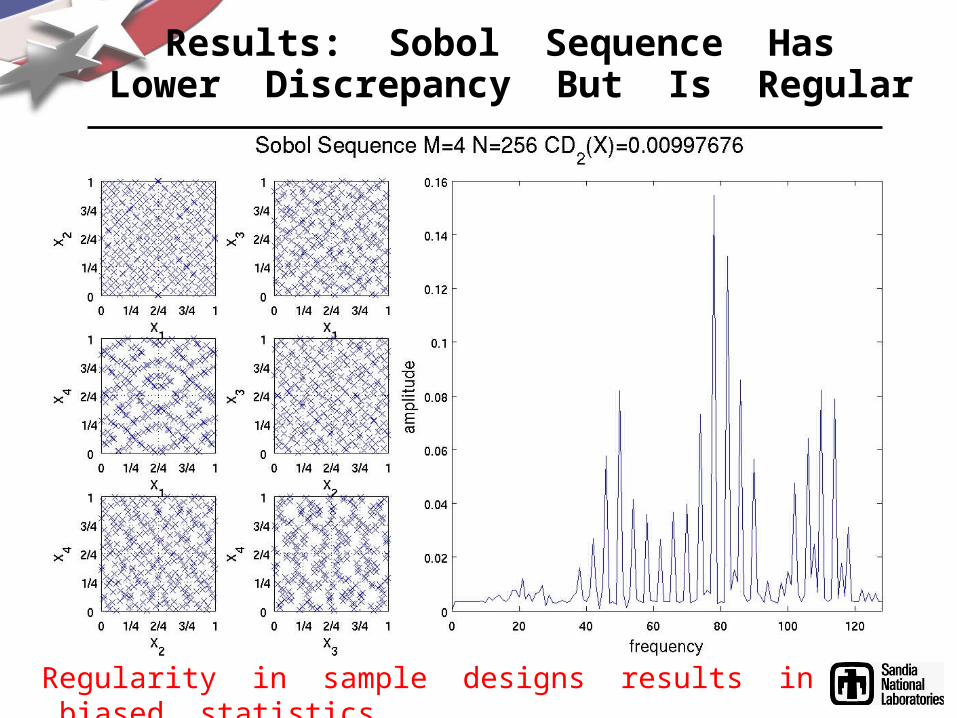
Results: Sobol Sequence Has Lower Discrepancy But Is Regular
10.26
Regularity in sample designs results in biased statistics
10.26
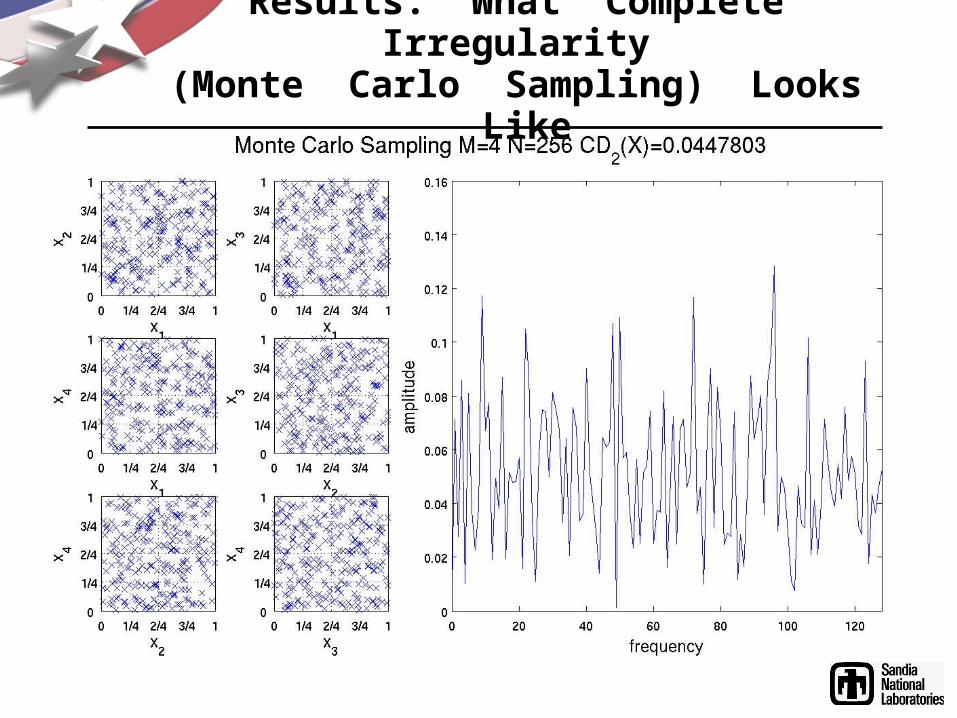
Results: What Complete Irregularity (Monte Carlo Sampling) Looks Like
10.26
Results: Nested BOSLHS Is Not Regular
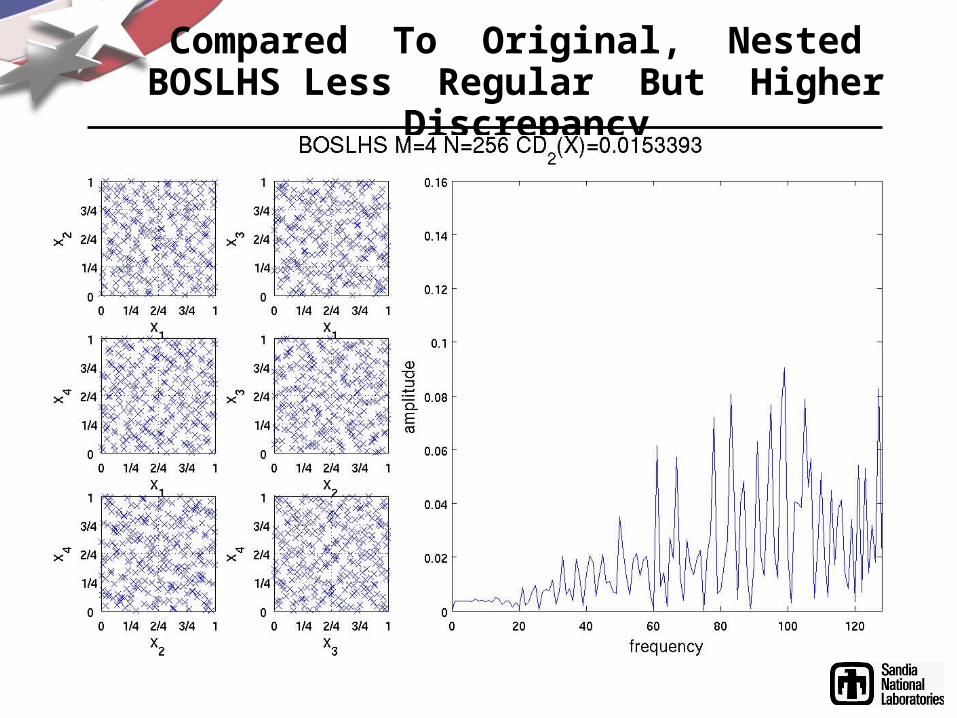
Compared To Original, Nested BOSLHS Less Regular But Higher Discrepancy
10.26
Results
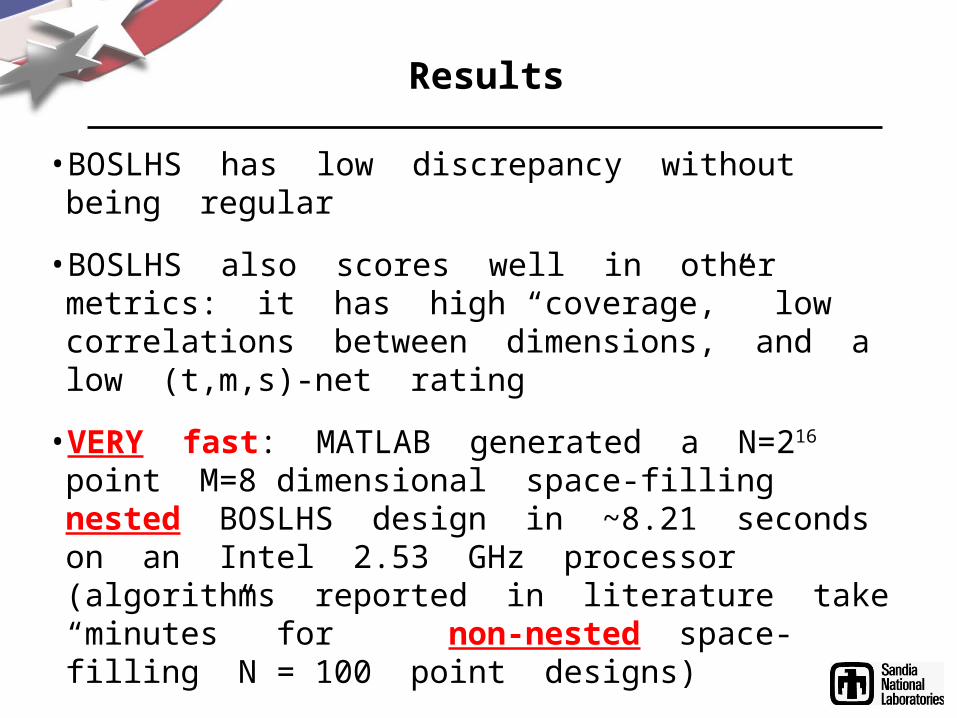
• BOSLHS has low discrepancy without being regular
• BOSLHS also scores well in other metrics: it has high “coverage,” low correlations between dimensions, and a low (t,m,s)-net rating
• VERY fast: MATLAB generated a N=216 point M=8 dimensional space-filling nested BOSLHS design in ~8.21 seconds on an Intel 2.53 GHz processor (algorithms reported in literature take “minutes” for non-nested space-filling N = 100 point designs)
• By comparison, it took ~298.2 seconds (O(N2M) ops) to evaluate discrepancy for same design
Conclusions
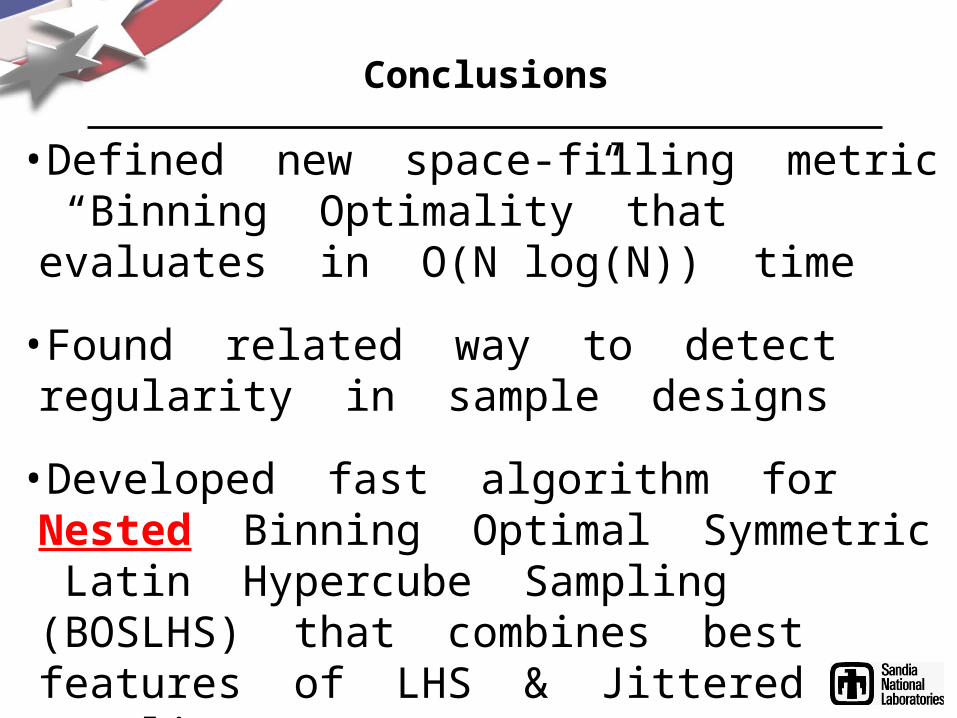
•Defined new space-filling metric “Binning Optimality” that evaluates in O(N log(N)) time
•Found related way to detect regularity in sample designs
•Developed fast algorithm for Nested Binning Optimal Symmetric Latin Hypercube Sampling (BOSLHS) that combines best features of LHS & Jittered Sampling
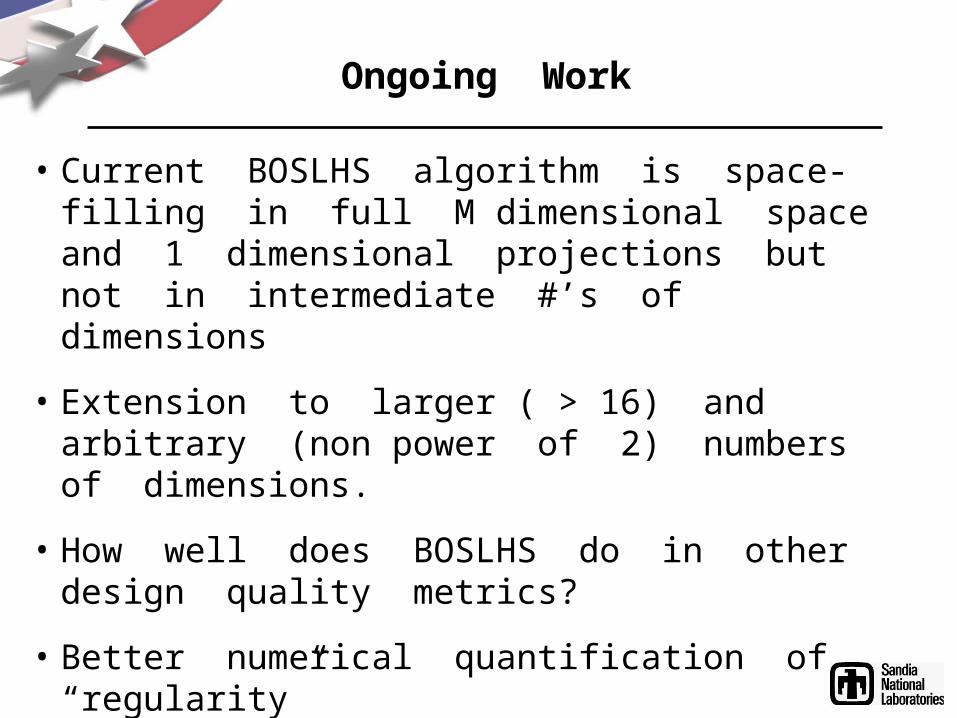
• Current BOSLHS algorithm is space-filling in full M dimensional space and 1 dimensional projections but not in intermediate #’s of dimensions
• Extension to larger ( > 16) and arbitrary (non power of 2) numbers of dimensions.
• How well does BOSLHS do in other design quality metrics?
• Better numerical quantification of “regularity”
Ongoing Work
References
1. K. R. Dalbey and G. N. Karystinos, “Fast Generation of Space-filling Latin Hypercube Sample Designs,” Proceedings of the 13th AIAA/ISSMO Multidisciplinary Analysis and Optimization Conference, 2010.
2. K. R. Dalbey and G. N. Karystinos, “Generating a Maximally Spaced Set of Bins to Fill for High Dimensional Space-filling Latin Hypercube Sampling,” International Journal for Uncertainty Quantification, (to appear), 2011.

Bonus Slides Start Here
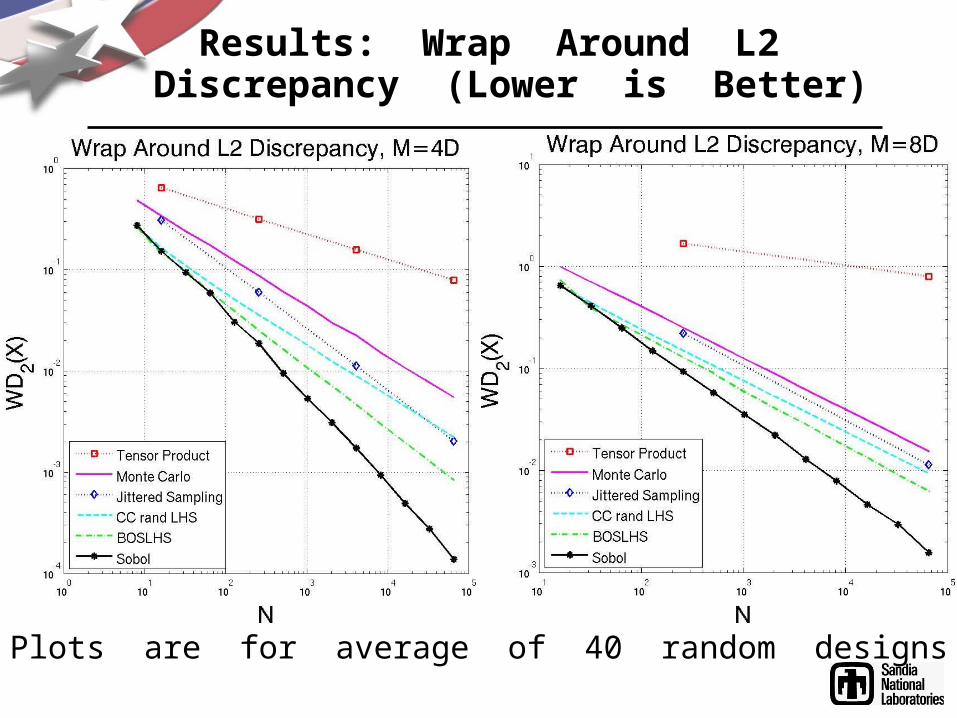
Results: Wrap Around L2 Discrepancy (Lower is Better)
10.26
Plots are for average of 40 random designs
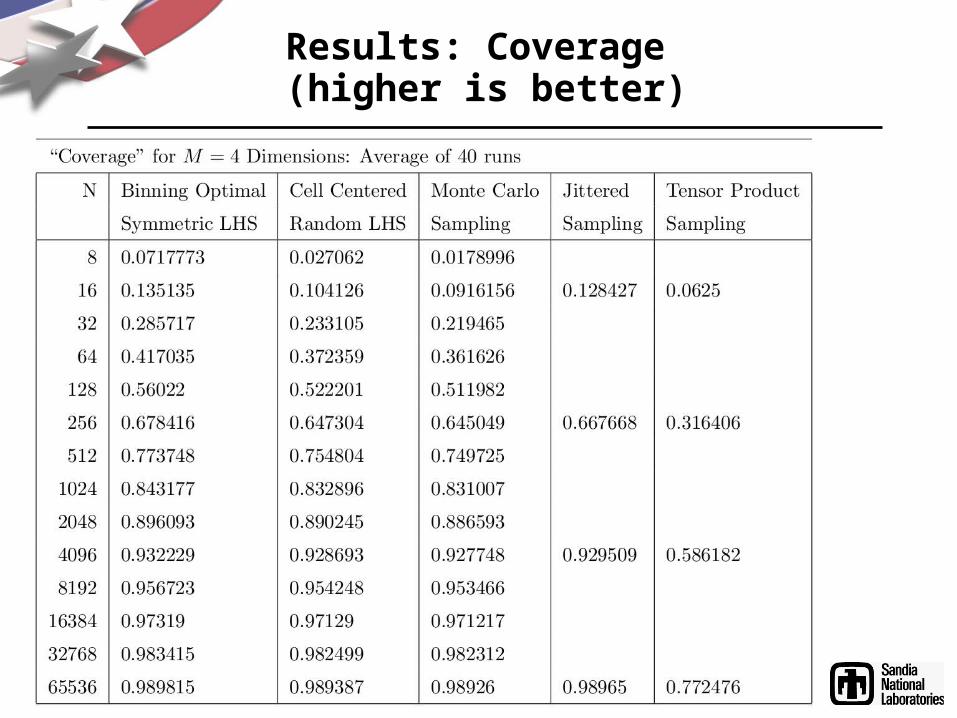
Results: Coverage (higher is better)
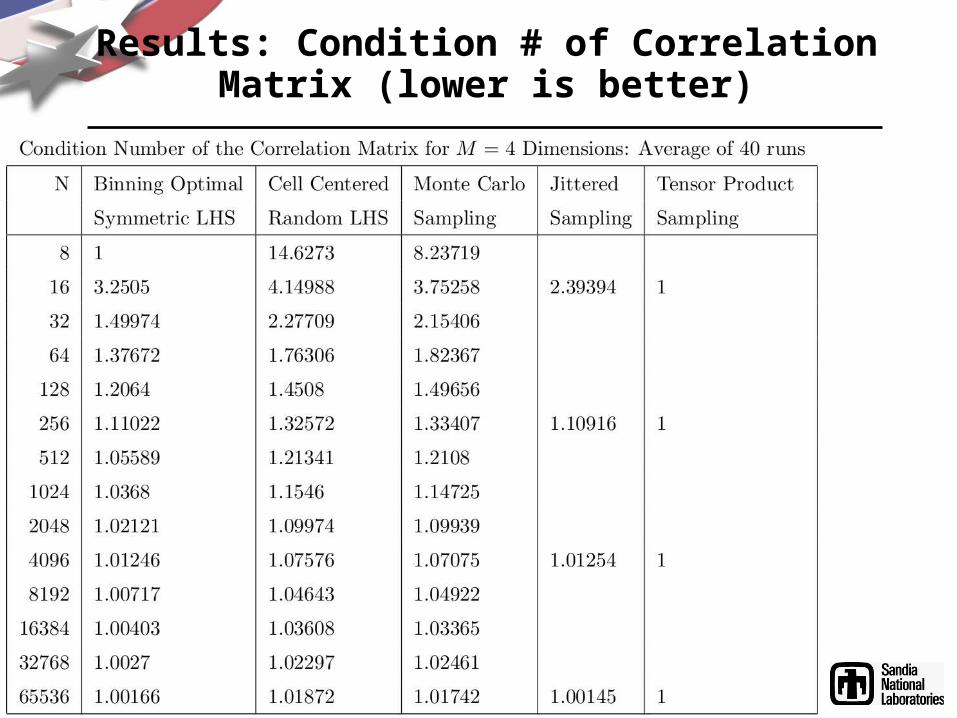
Results: Condition # of CorrelationMatrix (lower is better)
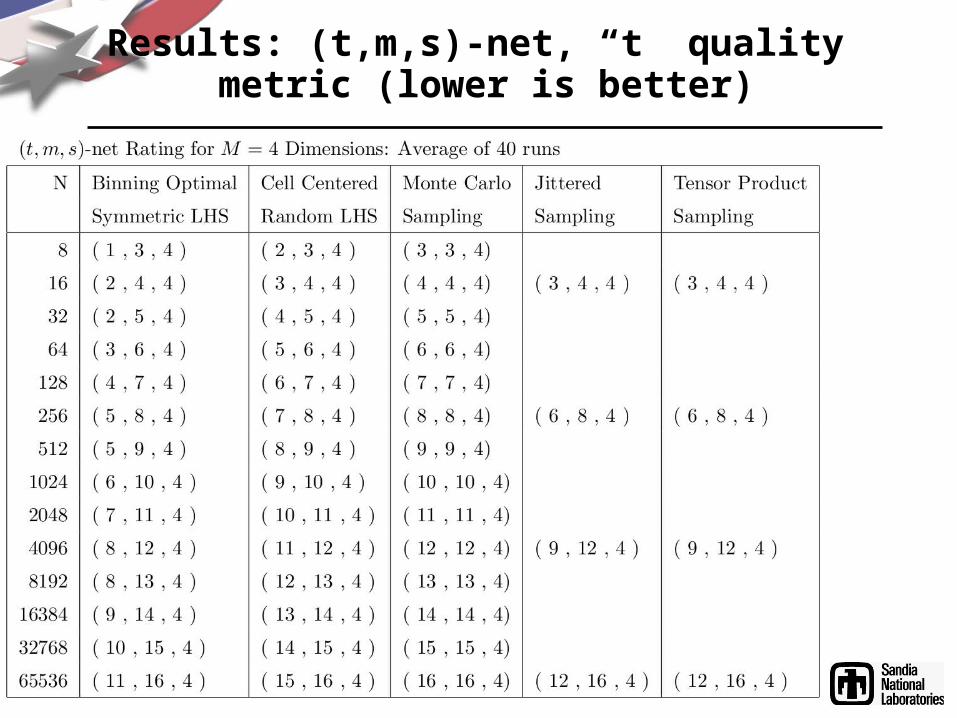
Results: (t,m,s)-net, “t” quality metric (lower is better)
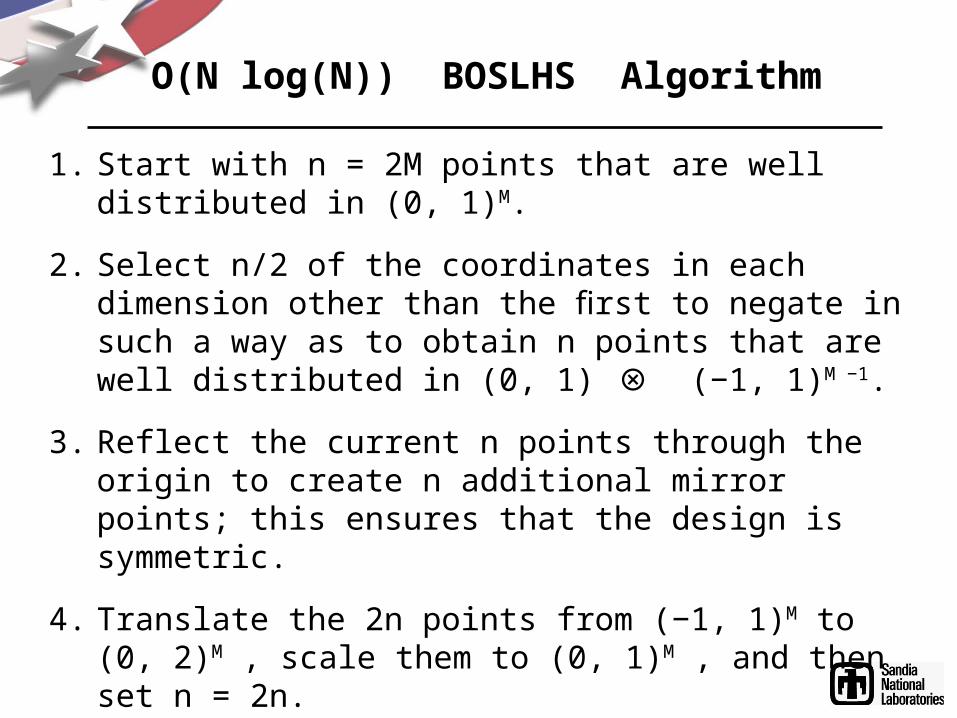
O(N log(N)) BOSLHS Algorithm
1. Start with n = 2M points that are well distributed in (0, 1)M.
2. Select n/2 of the coordinates in each dimension other than the first to negate in such a way as to obtain n points that are well distributed in (0, 1) (−1, 1)⊗ M −1.
3. Reflect the current n points through the origin to create n additional mirror points; this ensures that the design is symmetric.
4. Translate the 2n points from (−1, 1)M to (0, 2)M , scale them to (0, 1)M , and then set n = 2n.
5. Repeat steps 2 through 4 until the desired number of points has been obtained, i.e. until n = N.
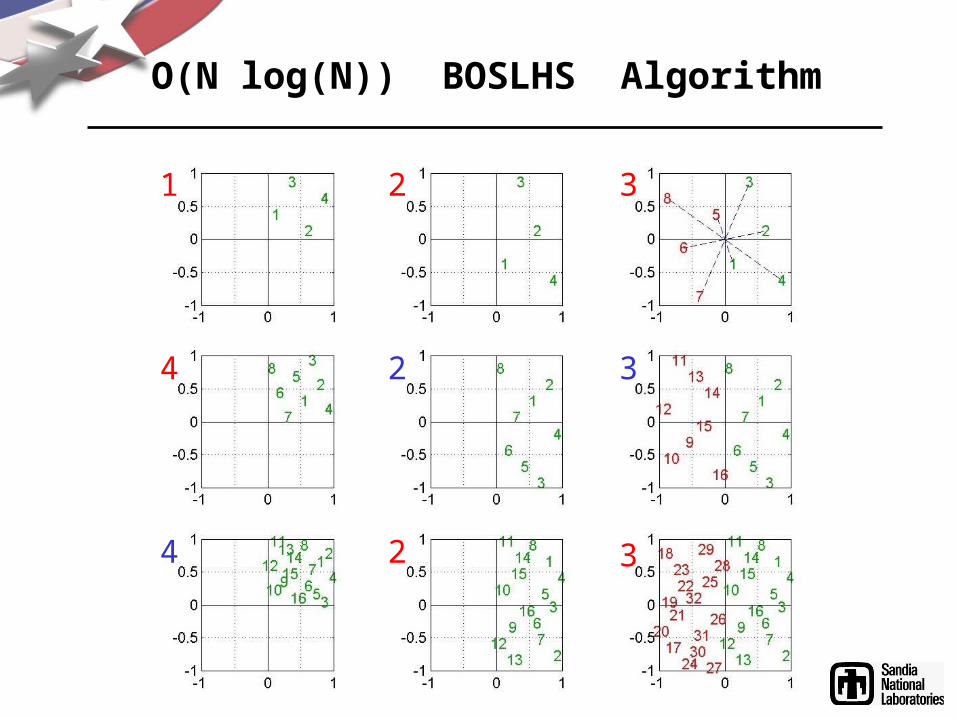
O(N log(N)) BOSLHS Algorithm
1 2
2
3
3
32
4
4
O(N log(N)) BOSLHS Algorithm
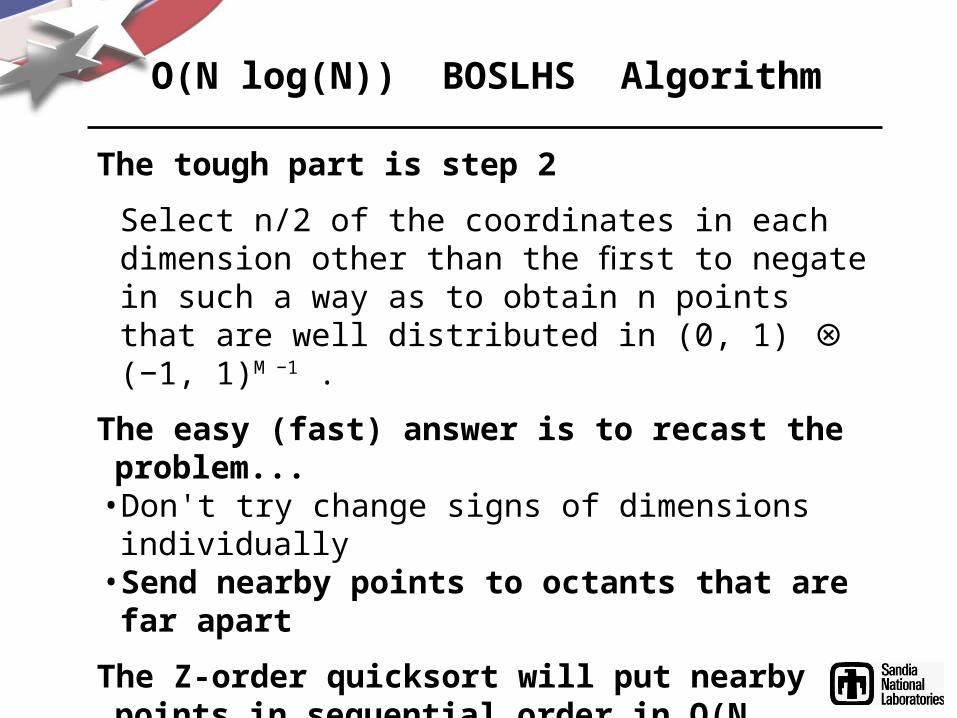
The tough part is step 2Select n/2 of the coordinates in each dimension other than the first to negate in such a way as to obtain n points that are well distributed in (0, 1) (−1, 1)⊗ M −1 .
The easy (fast) answer is to recast the problem...• Don't try change signs of dimensions individually• Send nearby points to octants that are far apartThe Z-order quicksort will put nearby points in
sequential order in O(N log(N)) opsWe just need a listing of octants in maximally
spaced order