Embed Size (px)
Citation preview
Chemical ScienceResearch Frontiers 2015 Research Frontiers 2015
78
Fast ortho-para conversion of H2 observed in a coordination nanospace
The hydrogen molecule H2 has two different nuclear-spin isomers, para (p) and ortho (o), owing to the requirement of symmetry of the wavefunction. Since interconversion between these isomers is a forbidden process in an isolated molecule, it has a long time constant, 100 hours. The o-p conversion accompanied by heat generation causes a boil-off problem in cryogenic H2 storage. Recently, fast o-p conversions on the order of one or a few minutes have been observed on the H2 physisorbed porous coordination polymer (PCP) [1] and amorphous solid water (ASW) [2]. Several theoretical mechanisms, Spin-Orbit-Electric Dipole-Hyperfine Contact (SOPY) [3], ion-molecule electron exchanges (XY), and charge transfer [3], have also been proposed for these fast o-p conversions of non-magnetic insulating catalysts. We found an o-p conversion of less than 10 minutes for H2 adsorbed in a Hofmann-type PCP, {Fe(pz)[Pd(CN)4]} (pz = pyrazine), on the basis of the temperature dependence of Raman spectra. The charge density study using synchrotron radiation X-ray powder diffraction (SR-XRPD) reveals the electric field generated in coordination nanospace. The present results corroborate similar findings observed on different systems and confirm that o-p conversions can occur on non-magnetic solids and that an electric field can induce the catalytic hydrogen o-p conversion [4].
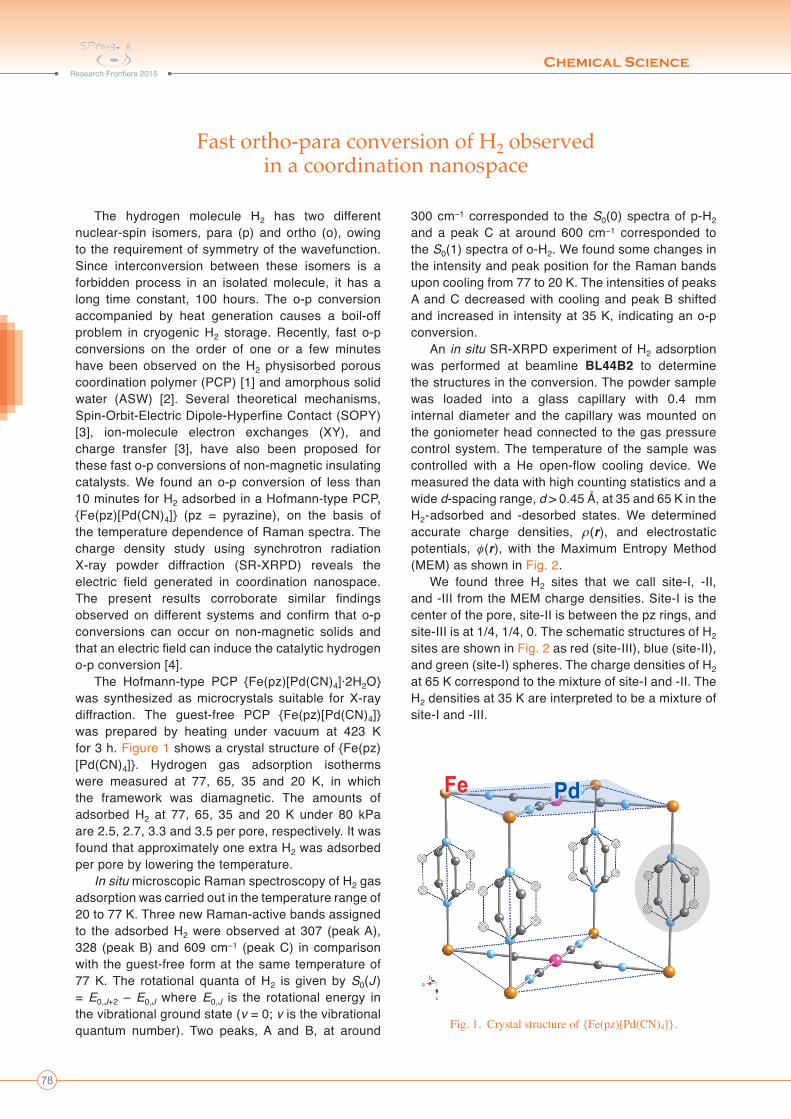
The Hofmann-type PCP {Fe(pz)[Pd(CN)4]·2H2O} was synthesized as microcrystals suitable for X-ray diffraction. The guest-free PCP {Fe(pz)[Pd(CN)4]} was prepared by heating under vacuum at 423 K for 3 h. Figure 1 shows a crystal structure of {Fe(pz)[Pd(CN)4]}. Hydrogen gas adsorption isotherms were measured at 77, 65, 35 and 20 K, in which the framework was diamagnetic. The amounts of adsorbed H2 at 77, 65, 35 and 20 K under 80 kPa are 2.5, 2.7, 3.3 and 3.5 per pore, respectively. It was found that approximately one extra H2 was adsorbed per pore by lowering the temperature.
In situ microscopic Raman spectroscopy of H2 gas adsorption was carried out in the temperature range of 20 to 77 K. Three new Raman-active bands assigned to the adsorbed H2 were observed at 307 (peak A), 328 (peak B) and 609 cm–1 (peak C) in comparison with the guest-free form at the same temperature of 77 K. The rotational quanta of H2 is given by S0(J ) = E0,J+2 – E0,J where E0,J is the rotational energy in the vibrational ground state (v = 0; v is the vibrational quantum number). Two peaks, A and B, at around
300 cm–1 corresponded to the S0(0) spectra of p-H2 and a peak C at around 600 cm–1 corresponded to the S0(1) spectra of o-H2. We found some changes in the intensity and peak position for the Raman bands upon cooling from 77 to 20 K. The intensities of peaks A and C decreased with cooling and peak B shifted and increased in intensity at 35 K, indicating an o-p conversion.
An in situ SR-XRPD experiment of H2 adsorption was performed at beamline BL44B2 to determine the structures in the conversion. The powder sample was loaded into a glass capillary with 0.4 mm internal diameter and the capillary was mounted on the goniometer head connected to the gas pressure control system. The temperature of the sample was controlled with a He open-flow cooling device. We measured the data with high counting statistics and a wide d-spacing range, d > 0.45 Å, at 35 and 65 K in the H2-adsorbed and -desorbed states. We determined accurate charge densities, ρ(r), and electrostatic potentials, φ (r), with the Maximum Entropy Method (MEM) as shown in Fig. 2.
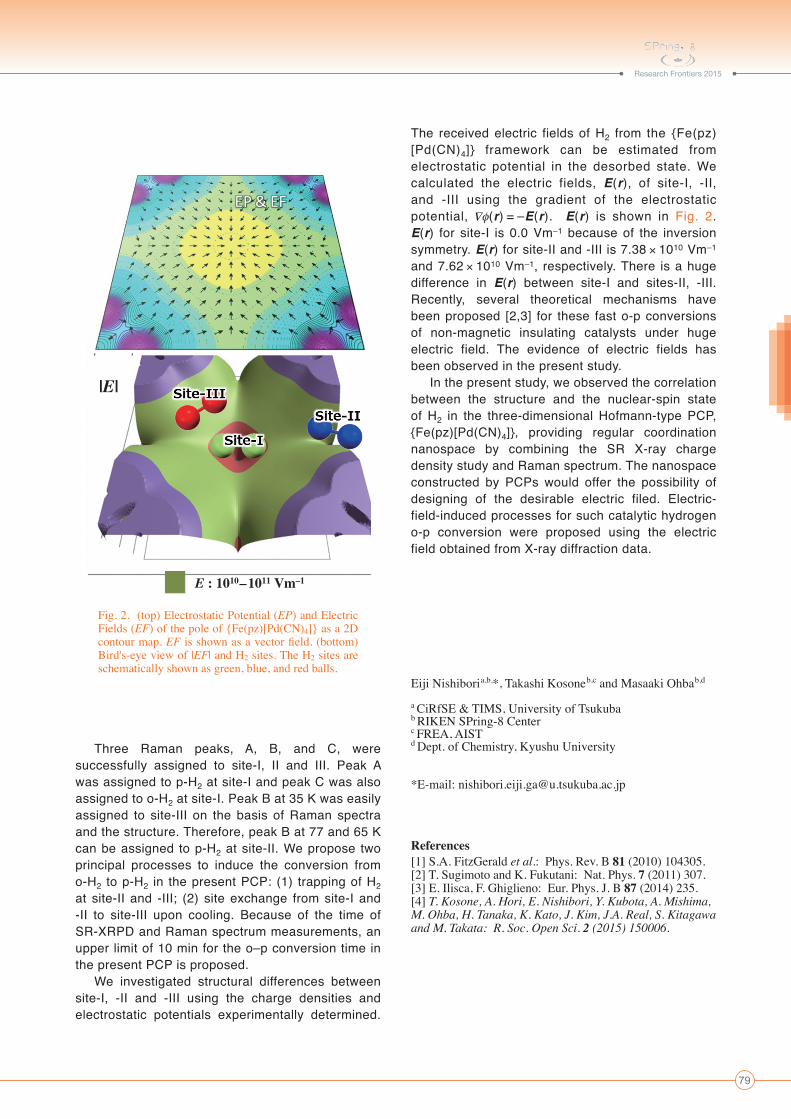
We found three H2 sites that we call site-I, -II, and -III from the MEM charge densities. Site-I is the center of the pore, site-II is between the pz rings, and site-III is at 1/4, 1/4, 0. The schematic structures of H2 sites are shown in Fig. 2 as red (site-III), blue (site-II), and green (site-I) spheres. The charge densities of H2 at 65 K correspond to the mixture of site-I and -II. The H2 densities at 35 K are interpreted to be a mixture of site-I and -III.
Fig. 1. Crystal structure of {Fe(pz)[Pd(CN)4]}.
a
c
b
Fe Pd
Chemical ScienceResearch Frontiers 2015 Research Frontiers 2015
79
Three Raman peaks, A, B, and C, were successfully assigned to site-I, II and III. Peak A was assigned to p-H2 at site-I and peak C was also assigned to o-H2 at site-I. Peak B at 35 K was easily assigned to site-III on the basis of Raman spectra and the structure. Therefore, peak B at 77 and 65 K can be assigned to p-H2 at site-II. We propose two principal processes to induce the conversion from o-H2 to p-H2 in the present PCP: (1) trapping of H2 at site-II and -III; (2) site exchange from site-I and -II to site-III upon cooling. Because of the time of SR-XRPD and Raman spectrum measurements, an upper limit of 10 min for the o–p conversion time in the present PCP is proposed.
We investigated structural differences between site-I, -II and -III using the charge densities and electrostatic potentials experimentally determined.
The received electric fields of H2 from the {Fe(pz)[Pd(CN)4]} framework can be estimated from electrostatic potential in the desorbed state. We calculated the electric fields, E(r), of site-I, -II, and -III using the gradient of the electrostatic potential, Δ
φ(r) = –E(r). E(r) is shown in Fig. 2. E(r) for site-I is 0.0 Vm–1 because of the inversion symmetry. E(r) for site-II and -III is 7.38 × 10¹⁰ Vm–1 and 7.62 × 10¹⁰ Vm–1, respectively. There is a huge difference in E(r) between site-I and sites-II, -III. Recently, several theoretical mechanisms have been proposed [2,3] for these fast o-p conversions of non-magnetic insulating catalysts under huge electric field. The evidence of electric fields has been observed in the present study.
In the present study, we observed the correlation between the structure and the nuclear-spin state of H2 in the three-dimensional Hofmann-type PCP, {Fe(pz)[Pd(CN)4]}, providing regular coordination nanospace by combining the SR X-ray charge density study and Raman spectrum. The nanospace constructed by PCPs would offer the possibility of designing of the desirable electric filed. Electric-field-induced processes for such catalytic hydrogen o-p conversion were proposed using the electric field obtained from X-ray diffraction data.
Fig. 2. (top) Electrostatic Potential (EP) and Electric Fields (EF) of the pole of {Fe(pz)[Pd(CN)4]} as a 2D contour map. EF is shown as a vector field. (bottom) Bird's-eye view of |EF| and H2 sites. The H2 sites are schematically shown as green, blue, and red balls.
Eiji Nishiboria,b,*, Takashi Kosoneb,c and Masaaki Ohbab,d a CiRfSE & TIMS, University of Tsukubab RIKEN SPring-8 Centerc FREA, AISTd Dept. of Chemistry, Kyushu University
*E-mail: [email protected]
References[1] S.A. FitzGerald et al.: Phys. Rev. B 81 (2010) 104305.[2] T. Sugimoto and K. Fukutani: Nat. Phys. 7 (2011) 307.[3] E. Ilisca, F. Ghiglieno: Eur. Phys. J. B 87 (2014) 235.[4] T. Kosone, A. Hori, E. Nishibori, Y. Kubota, A. Mishima, M. Ohba, H. Tanaka, K. Kato, J. Kim, J.A. Real, S. Kitagawa and M. Takata: R. Soc. Open Sci. 2 (2015) 150006.
E : 1010–1011 Vm–1
|E|