Embed Size (px)
DESCRIPTION
Fast, Selective, and Sensitive Screening for More Than 1000 Targeted Pesticides with Identification Using Automated Library Searching
Citation preview
p 1
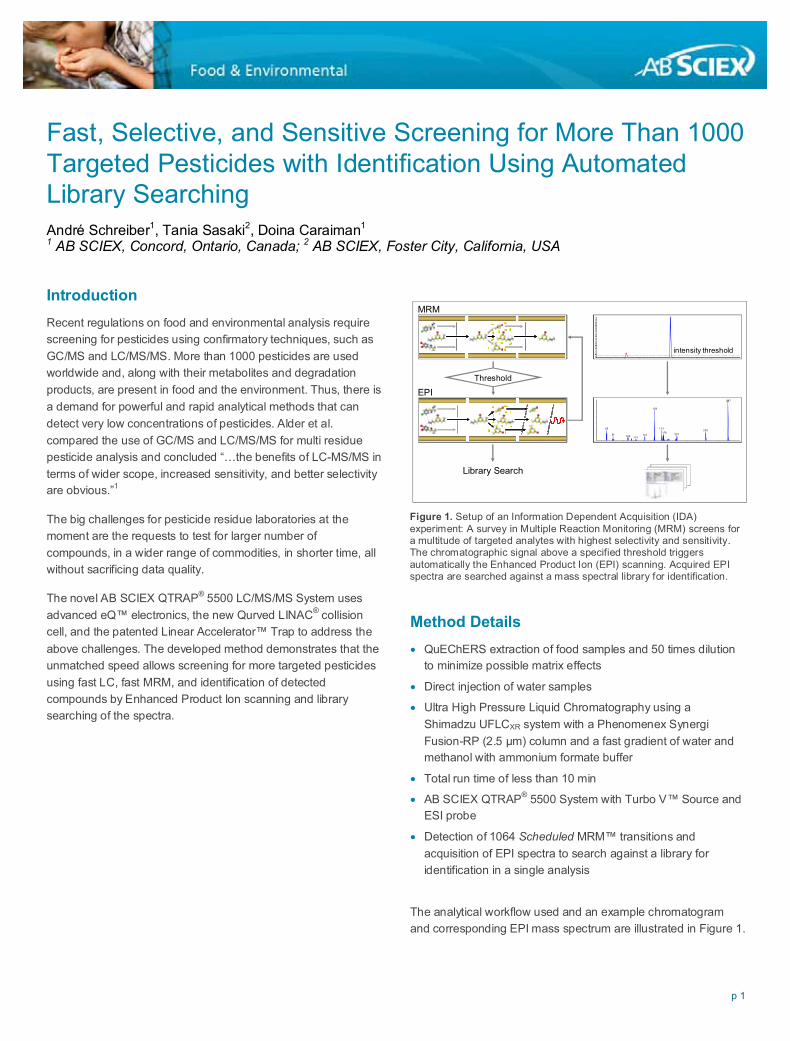
Fast, Selective, and Sensitive Screening for More Than 1000Targeted Pesticides with Identification Using AutomatedLibrary SearchingAndré Schreiber1, Tania Sasaki2, Doina Caraiman1
1 AB SCIEX, Concord, Ontario, Canada; 2 AB SCIEX, Foster City, California, USA
IntroductionRecent regulations on food and environmental analysis requirescreening for pesticides using confirmatory techniques, such asGC/MS and LC/MS/MS. More than 1000 pesticides are usedworldwide and, along with their metabolites and degradationproducts, are present in food and the environment. Thus, there isa demand for powerful and rapid analytical methods that candetect very low concentrations of pesticides. Alder et al.compared the use of GC/MS and LC/MS/MS for multi residuepesticide analysis and concluded “…the benefits of LC-MS/MS interms of wider scope, increased sensitivity, and better selectivityare obvious.”1
The big challenges for pesticide residue laboratories at themoment are the requests to test for larger number ofcompounds, in a wider range of commodities, in shorter time, allwithout sacrificing data quality.
The novel AB SCIEX QTRAP® 5500 LC/MS/MS System usesadvanced eQ™ electronics, the new Qurved LINAC® collisioncell, and the patented Linear Accelerator™ Trap to address theabove challenges. The developed method demonstrates that theunmatched speed allows screening for more targeted pesticidesusing fast LC, fast MRM, and identification of detectedcompounds by Enhanced Product Ion scanning and librarysearching of the spectra.
Method Details• QuEChERS extraction of food samples and 50 times dilution
to minimize possible matrix effects
• Direct injection of water samples
• Ultra High Pressure Liquid Chromatography using aShimadzu UFLCXR system with a Phenomenex SynergiFusion-RP (2.5 μm) column and a fast gradient of water andmethanol with ammonium formate buffer
• Total run time of less than 10 min
• AB SCIEX QTRAP® 5500 System with Turbo V™ Source andESI probe
• Detection of 1064 Scheduled MRM™ transitions andacquisition of EPI spectra to search against a library foridentification in a single analysis
The analytical workflow used and an example chromatogramand corresponding EPI mass spectrum are illustrated in Figure 1.
Figure 1. Setup of an Information Dependent Acquisition (IDA)experiment: A survey in Multiple Reaction Monitoring (MRM) screens fora multitude of targeted analytes with highest selectivity and sensitivity.The chromatographic signal above a specified threshold triggersautomatically the Enhanced Product Ion (EPI) scanning. Acquired EPIspectra are searched against a mass spectral library for identification.
intensity threshold
Threshold
Library Search
MRM
EPI297
159
69 173255
176 20181 141109 115
p 2
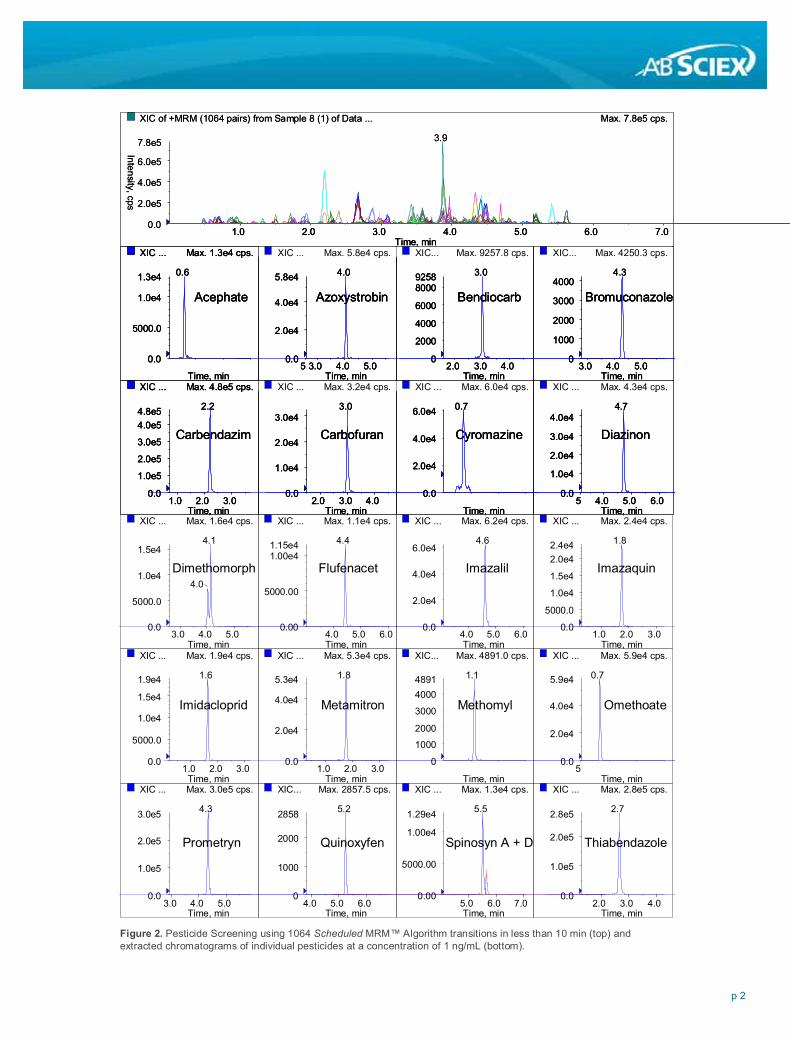
Figure 2. Pesticide Screening using 1064 Scheduled MRM™ Algorithm transitions in less than 10 min (top) andextracted chromatograms of individual pesticides at a concentration of 1 ng/mL (bottom).
XIC of +MRM (1064 pairs) from Sample 8 (1) of Data ... Max. 7.8e5 cps.
0.0
2.0e5
4.0e5
6.0e5
7.8e5
Intensity,cps
3.9
1.0 2.0 3.0 4.0 5.0 6.0 7.0Time, min
XIC ... Max. 1.3e4 cps.
5Time, min
0.0
5000.0
1.0e4
1.3e4 0.6
Acephate
XIC ... Max. 5.8e4 cps.
3.0 4.0 5.0Time, min
0.0
2.0e4
4.0e4
5.8e4 4.0
Azoxystrobin
XIC... Max. 9257.8 cps.
2.0 3.0 4.0Time, min
0
2000
4000
6000
80009258 3.0
Bendiocarb
XIC... Max. 4250.3 cps.
3.0 4.0 5.0Time, min
0
1000
2000
3000
40004.3
Bromuconazole
XIC ... Max. 4.8e5 cps.
1.0 2.0 3.0Time, min
0.0
1.0e5
2.0e5
3.0e5
4.0e54.8e5 2.2
Carbendazim
XIC ... Max. 3.2e4 cps.
2.0 3.0 4.0Time, min
0.0
1.0e4
2.0e4
3.0e43.0
Carbofuran
XIC ... Max. 6.0e4 cps.
5Time, min
0.0
2.0e4
4.0e4
6.0e4 0.7
Cyromazine
XIC ... Max. 4.3e4 cps.
4.0 5.0 6.0Time, min
0.0
1.0e4
2.0e4
3.0e4
4.0e44.7
Diazinon
XIC ... Max. 1.6e4 cps.
3.0 4.0 5.0Time, min
0.0
5000.0
1.0e4
1.5e44.1
4.0Dimethomorph
XIC ... Max. 1.1e4 cps.
4.0 5.0 6.0Time, min
0.00
5000.00
1.00e41.15e4 4.4
Flufenacet
XIC ... Max. 6.2e4 cps.
4.0 5.0 6.0Time, min
0.0
2.0e4
4.0e4
6.0e44.6
Imazalil
XIC ... Max. 2.4e4 cps.
1.0 2.0 3.0Time, min
0.0
5000.0
1.0e4
1.5e4
2.0e42.4e4 1.8
Imazaquin
XIC ... Max. 1.9e4 cps.
1.0 2.0 3.0Time, min
0.0
5000.0
1.0e4
1.5e4
1.9e4 1.6
Imidacloprid
XIC ... Max. 5.3e4 cps.
1.0 2.0 3.0Time, min
0.0
2.0e4
4.0e4
5.3e4 1.8
Metamitron
XIC... Max. 4891.0 cps.
5Time, min
0
1000
2000
3000
40004891 1.1
Methomyl
XIC ... Max. 5.9e4 cps.
Time, min
0.0
2.0e4
4.0e4
5.9e4 0.7
Omethoate
XIC ... Max. 3.0e5 cps.
3.0 4.0 5.0Time, min
0.0
1.0e5
2.0e5
3.0e5 4.3
Prometryn
XIC... Max. 2857.5 cps.
4.0 5.0 6.0Time, min
0
1000
2000
2858 5.2
Quinoxyfen
XIC ... Max. 1.3e4 cps.
5.0 6.0 7.0Time, min
0.00
5000.00
1.00e4
1.29e4 5.5
Spinosyn A + D
XIC ... Max. 2.8e5 cps.
2.0 3.0 4.0Time, min
0.0
1.0e5
2.0e5
2.8e5 2.7
Thiabendazole
p 3
ResultsThe new QTRAP® 5500 System allows the use of short MRMdwell times and pause times while maintaining highestselectivity, sensitivity and reproducibility. These short times, incombination with the Scheduled MRM™ Algorithm offered inAnalyst® Software 1.5, make it possible to detect severalhundreds — or even thousands — of MRM transitions in a singleanalytical run. Figure 2 shows an example of an IDAchromatogram monitoring over 1000 transitions with a run timeof less than 10 min. The representative extractedchromatograms highlight the superior sensitivity allowingdetection limits at sub ng/mL concentrations.
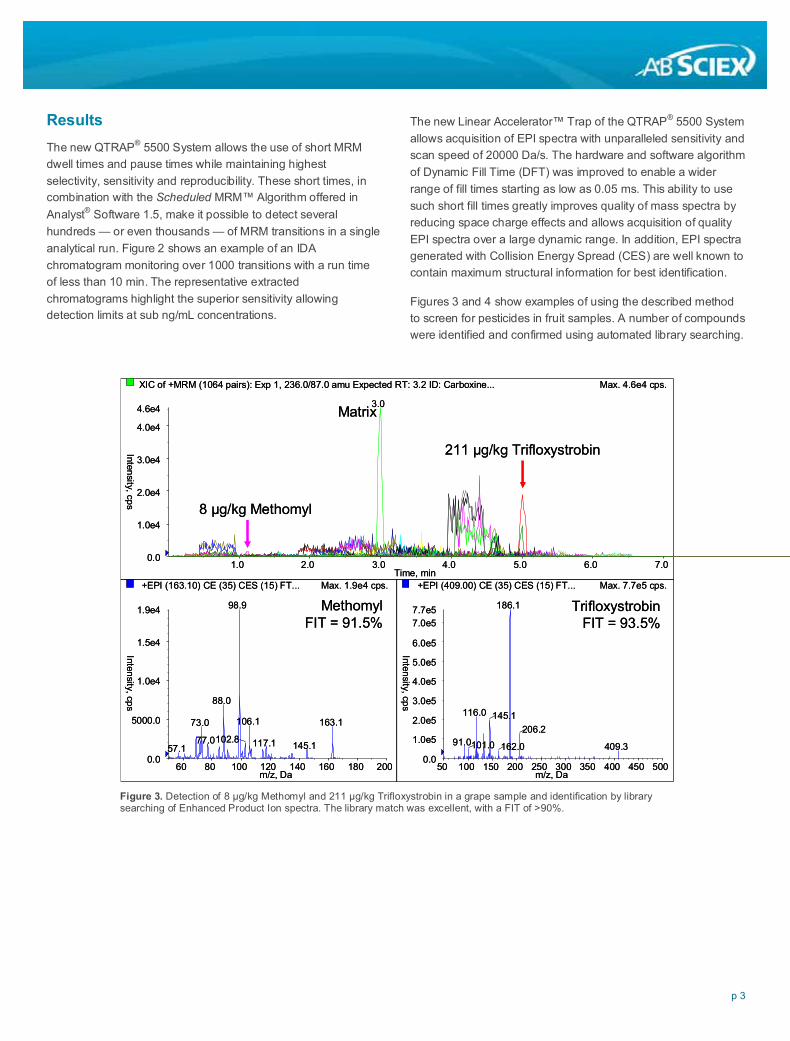
The new Linear Accelerator™ Trap of the QTRAP® 5500 Systemallows acquisition of EPI spectra with unparalleled sensitivity andscan speed of 20000 Da/s. The hardware and software algorithmof Dynamic Fill Time (DFT) was improved to enable a widerrange of fill times starting as low as 0.05 ms. This ability to usesuch short fill times greatly improves quality of mass spectra byreducing space charge effects and allows acquisition of qualityEPI spectra over a large dynamic range. In addition, EPI spectragenerated with Collision Energy Spread (CES) are well known tocontain maximum structural information for best identification.
Figures 3 and 4 show examples of using the described methodto screen for pesticides in fruit samples. A number of compoundswere identified and confirmed using automated library searching.
Figure 3. Detection of 8 μg/kg Methomyl and 211 μg/kg Trifloxystrobin in a grape sample and identification by librarysearching of Enhanced Product Ion spectra. The library match was excellent, with a FIT of >90%.
XIC of +MRM (1064 pairs): Exp 1, 236.0/87.0 amu Expected RT: 3.2 ID: Carboxine... Max. 4.6e4 cps.
1.0 2.0 3.0 4.0 5.0 6.0 7.0Time, min
0.0
1.0e4
2.0e4
3.0e4
4.0e4
4.6e4
Intensity,cps
3.0
+EPI (163.10) CE (35) CES (15) FT... Max. 1.9e4 cps.
60 80 100 120 140 160 180 200m/z, Da
0.0
5000.0
1.0e4
1.5e4
1.9e4
Intensity,cps
98.9
88.0
106.1 163.173.0
102.877.0 117.1 145.157.1
+EPI (409.00) CE (35) CES (15) FT... Max. 7.7e5 cps.
50 100 150 200 250 300 350 400 450 500m/z, Da
0.0
1.0e5
2.0e5
3.0e5
4.0e5
5.0e5
6.0e5
7.0e57.7e5
Intensity,cps
186.1
116.0 145.1206.2
91.0101.0 409.3162.0
8 µg/kg Methomyl
211 µg/kg Trifloxystrobin
Matrix
MethomylFIT = 91.5%
TrifloxystrobinFIT = 93.5%
For Research Use Only. Not for use in diagnostic procedures.
© 2010 AB SCIEX. The trademarks mentioned herein are the property of AB Sciex Pte. Ltd. or their respective owners. AB SCIEX™ is being used under license.
Publication number: 1121010-01
Headquarters International Sales353 Hatch Drive Foster City CA 94404 USA For our office locations please call the division
Phone 650-638-5800 headquarters or refer to our website atwww.absciex.com www.absciex.com/offices
SummaryThe new QTRAP® 5500 LC/MS/MS System incorporates theproven technology of the Turbo V™ source and the CurtainGas™ interface for ultimate sensitivity and robustness. Theunmatched speed of monitoring MRM transitions and acquiringEPI spectra is made possible by advanced technologiesincluding the new Qurved LINAC® collision cell and the LinearAccelerator™ Trap. These performance criteria, together withsophisticated software algorithms such as Scheduled MRM™Algorithm and Collision Energy Spread, make the QTRAP® 5500System the ideal instrument for high throughput multi-pesticidescreening at required sensitivity levels for analysis of food anddrinking water. In addition, library search of EPI spectra giveshighest degree of confidence in analytical results.
References1 L. Alder, K. Greulich, G. Kempe, B. Vieth: Mass
Spectrometry Reviews 25 (2006) 838-865
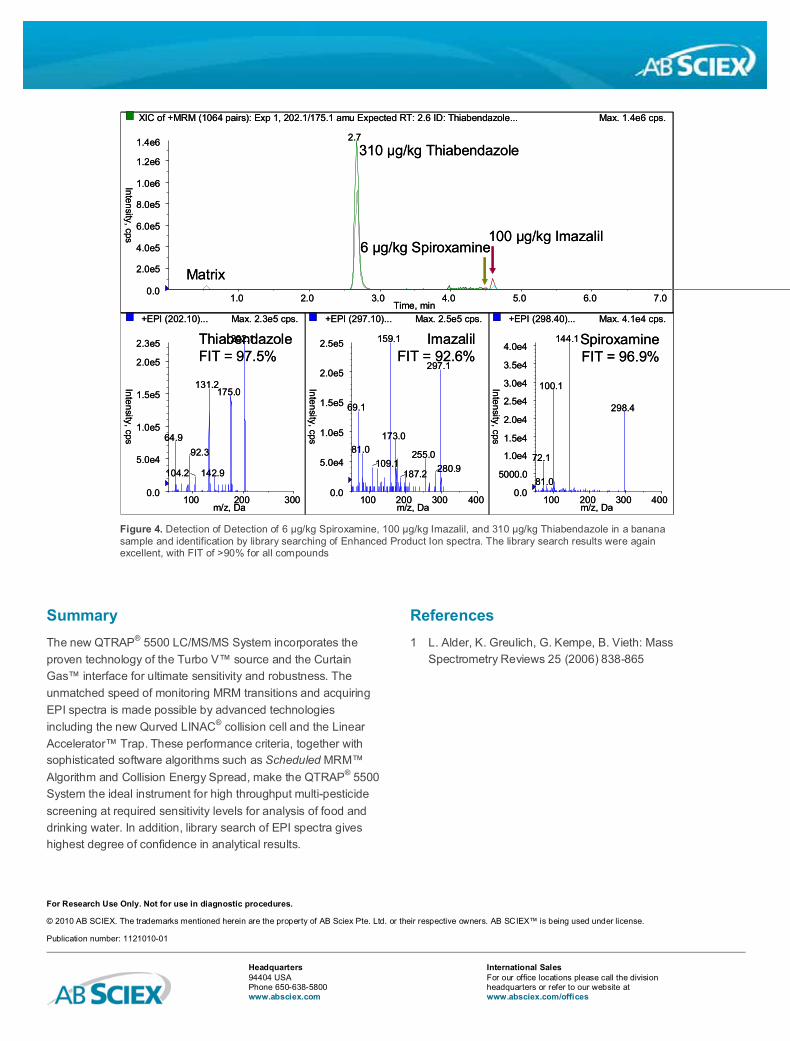
Figure 4. Detection of Detection of 6 μg/kg Spiroxamine, 100 μg/kg Imazalil, and 310 μg/kg Thiabendazole in a bananasample and identification by library searching of Enhanced Product Ion spectra. The library search results were againexcellent, with FIT of >90% for all compounds
XIC of +MRM (1064 pairs): Exp 1, 202.1/175.1 amu Expected RT: 2.6 ID: Thiabendazole... Max. 1.4e6 cps.
1.0 2.0 3.0 4.0 5.0 6.0 7.0Time, min
0.0
2.0e5
4.0e5
6.0e5
8.0e5
1.0e6
1.2e6
1.4e6
Intensity,cps
2.7
+EPI (202.10)... Max. 2.3e5 cps.
100 200 300m/z, Da
0.0
5.0e4
1.0e5
1.5e5
2.0e5
2.3e5
Intensity,cps
202.1
131.2175.0
64.992.3
142.9104.2
+EPI (297.10)... Max. 2.5e5 cps.
100 200 300 400m/z, Da
0.0
5.0e4
1.0e5
1.5e5
2.0e5
2.5e5
Intensity,cps
159.1
297.1
69.1
173.081.0 255.0
109.1 280.9187.2
+EPI (298.40)... Max. 4.1e4 cps.
100 200 300 400m/z, Da
0.0
5000.0
1.0e4
1.5e4
2.0e4
2.5e4
3.0e4
3.5e4
4.0e4
Intensity,cps
144.1
100.1
298.4
72.1
81.0
Matrix
100 µg/kg Imazalil6 µg/kg Spiroxamine
310 µg/kg Thiabendazole
ImazalilFIT = 92.6%
SpiroxamineFIT = 96.9%
ThiabendazoleFIT = 97.5%