Embed Size (px)
Citation preview
Global Equity Research – India Indian Retail Sector
April 2008
1 Global Equity Research – India
Fasten your seatbelts-organized retail to treble in 5 years
The Indian Super Bazaar, which is the fifth largest retail destination
globally, according to industry estimates is estimated to grow from the
US$ 330 billion in 2007 to US$ 440 billion by 2010 and $650 billion by
2015. The organized retail market is expected to grow at nearly 28%
CAGR from an estimated Rs.690 billion in 2006-2007 to around
Rs.2400 billion by 2012.
The main factors contributing to this robust growth will be –
(1) Rising disposable income;
(2) Demographic changes;
(3) Growing consumerism;
(4) Growing retail malls, infrastructure, etc.
Organized retail comprises various verticals including Food & beverage,
Clothing & textiles, Household appliances, Home Décor & furnishing,
Beauty, personal and health care, Footwear, Equipment, Stationery &
paper.
Domestic big corporate houses and International major retailers are
exploring various formats and options to capture the market share and
ride high on the growth trajectory of Indian Retail market.
Profitably and long term viability in all the above verticals is directly
related to 3 major factors
- Focus in terms of products and target customer,
- Economies of scale, and
- Share of Private Labels
Market study and our research indicate that apparels enjoy maximum
gross margins, followed by food & grocery and household appliances.
However apparels also witness the highest overhead costs due to
massive selling & advertising costs and high lease rentals.
To capture the high retail growth trajectory, we initiate coverage on
Vishal Retail and Koutons Retail – the 2 major players that have
build up a good retail business model and are honing their strategies to
capture higher share in the growing organized retail.
Vishal retail now intends to adopt the franchisee model for its
Epitome Global Services Pvt. Ltd 7th Floor, “A” wing Prism Towers Mindspace, Goregaon (w) Mumbai - 400 062 Tel: (022) 4001.6600 Fax: (022) 4001.6666 Analysts: Anandh Baheti 91 22 4001 6612 Hiral Susania 91 22 4001 6613 Sector: Retail/Buy Date: 11th April 2008
Indian Retail Research Report
June 19, 2008
Indian Retail Sector -April 2008
2 Global Equity Research – India
specialist retail formats seeing the tremendous leverage it offers in
terms of scale whereas Koutons now plans to open its own large
format stores which was so far operating on the franchisee model.
Thus, the two companies are trying to strike a strategic balance
between own stores and franchise operated stores.
Though the two companies have various differences such as format,
size and product portfolio, the common thing that belies in the two
companies is the importance given to entrepreneurship spirit and the
target potential customer group.
Vishal retail now intends to adopt the franchisee model for its
speciality retail formats seeing the tremendous leverage it offers in
terms of scale whereas Koutons now plans to open its own large
format stores which was so far operating on the franchisee model.
Thus, the two companies are trying to strike a strategic balance
between own stores and franchise operated stores.
Retailing – revolutionizing the way Indians shop
India has one of the largest numbers of retail outlets in the world. Of
the 13 million retail outlets in the country, nearly 5 million sell only
food and grocery related products. At present, organized retail
accounts for only 4 per cent of the total retail market, offering huge
growth potential.
Key Characteristics
■ Total Private Consumption Expenditure in India –approx 400
Billion USD
■ Retail Sale – 225 Billion USD
■ Organized Retail – 7 Billion USD (3.2%)
■ Retailing – 35% of GDP
■ Format – Only 6% larger than 500 sq. Ft.
India has topped AT Kearney's annual Global Retail Development
Index (GRDI) for the third consecutive year, maintaining its position
as the most attractive market for retail investment.
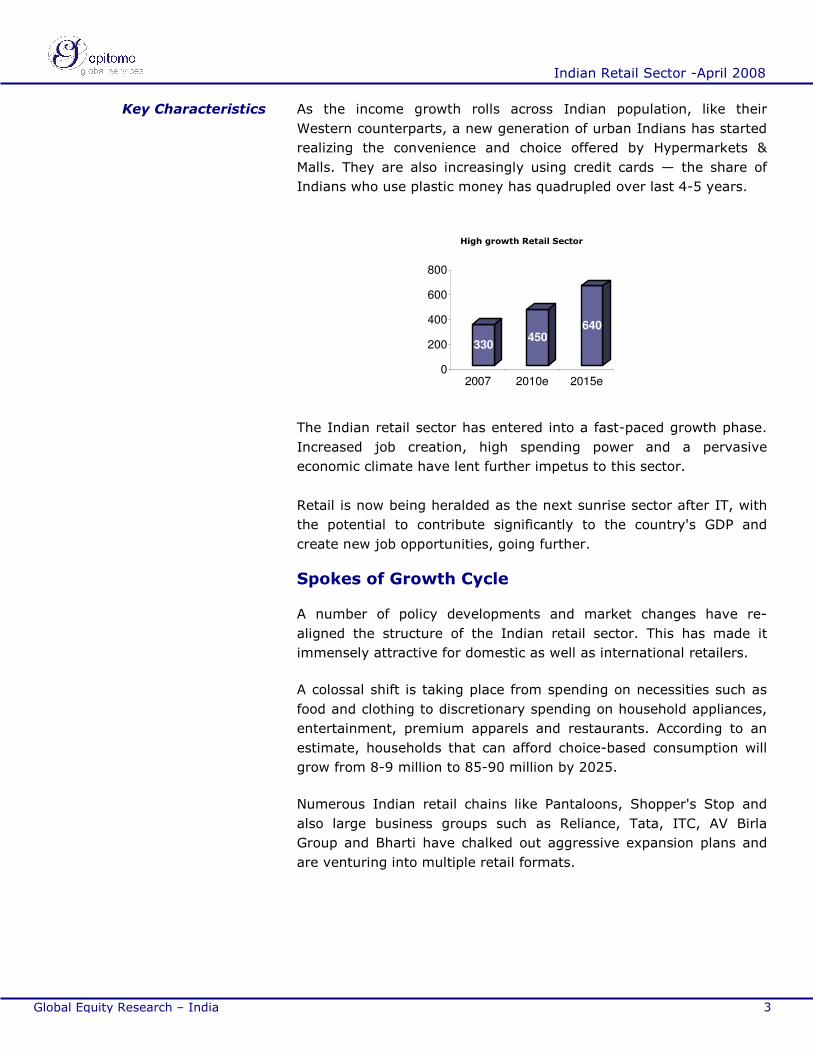
The Indian retail market, which is the fifth largest retail destination
globally, according to industry estimates is projected to grow from
US$ 330 billion in 2007 to US$ 450 billion by 2010 and US$ 640
billion by 2015.
* Whereas organized retail
which presently accounts only
for 5 per cent of the total
market is likely to increase its
share to 12 – 15 per cent by
2010. I.e. 67.5 billion
Indian Retail Research Report
June 19, 2008
Indian Retail Sector -April 2008
3 Global Equity Research – India
As the income growth rolls across Indian population, like their
Western counterparts, a new generation of urban Indians has started
realizing the convenience and choice offered by Hypermarkets &
Malls. They are also increasingly using credit cards — the share of
Indians who use plastic money has quadrupled over last 4-5 years.
330450
640
0
200
400
600
800
2007 2010e 2015e
High growth Retail Sector
The Indian retail sector has entered into a fast-paced growth phase.
Increased job creation, high spending power and a pervasive
economic climate have lent further impetus to this sector.
Retail is now being heralded as the next sunrise sector after IT, with
the potential to contribute significantly to the country's GDP and
create new job opportunities, going further.
Spokes of Growth Cycle
A number of policy developments and market changes have re-
aligned the structure of the Indian retail sector. This has made it
immensely attractive for domestic as well as international retailers.
A colossal shift is taking place from spending on necessities such as
food and clothing to discretionary spending on household appliances,
entertainment, premium apparels and restaurants. According to an
estimate, households that can afford choice-based consumption will
grow from 8-9 million to 85-90 million by 2025.
Numerous Indian retail chains like Pantaloons, Shopper's Stop and
also large business groups such as Reliance, Tata, ITC, AV Birla
Group and Bharti have chalked out aggressive expansion plans and
are venturing into multiple retail formats.
Key Characteristics
Indian Retail Research Report
June 19, 2008
Indian Retail Sector -April 2008
4 Global Equity Research – India
Visible Investments in the Industry
■ Reliance Retail is going ahead with plans worth an investment of
US$ 6.25 billion for setting up over 5000 stores in various
formats.
■ Spencer's is also planning to set up 500 more stores within a year
with an investment of nearly US$ 25 million.
■ Hypercity is planning to set up 250 Express-city stores in the
convenience store format across the country in the next five
years.
■ Wadhawan Food Retail promoted "Spinach" chain of retail stores
plans to have 1,500 establishments by 2011.
■ DLF plans to invest US$ 4.02 billion over four years to develop
about 20 large shopping malls across the country.
■ Big Shopping centers and US-based Lehman Brothers' wholly-
owned special purpose vehicle BIG Mauritius Holdings to invest
US$ 2.4 billion for setting up shopping malls in the next ten years
■ Israeli mall developer Plaza Center NV plans to invest US$ 1.25
billion over the next five-seven years to set up 50 malls in India
■ Bharti Enterprises had announced US$ 2.5 billion retail plans and
has inked a 50:50 joint venture with Walmart; plans to announce
final plans by April’08
The home-bred retailers, with their intrinsic knowledge of the Indian
Markets, are expected to capture a major share of the retailing pie
before foreign retailers make their big bang entry.
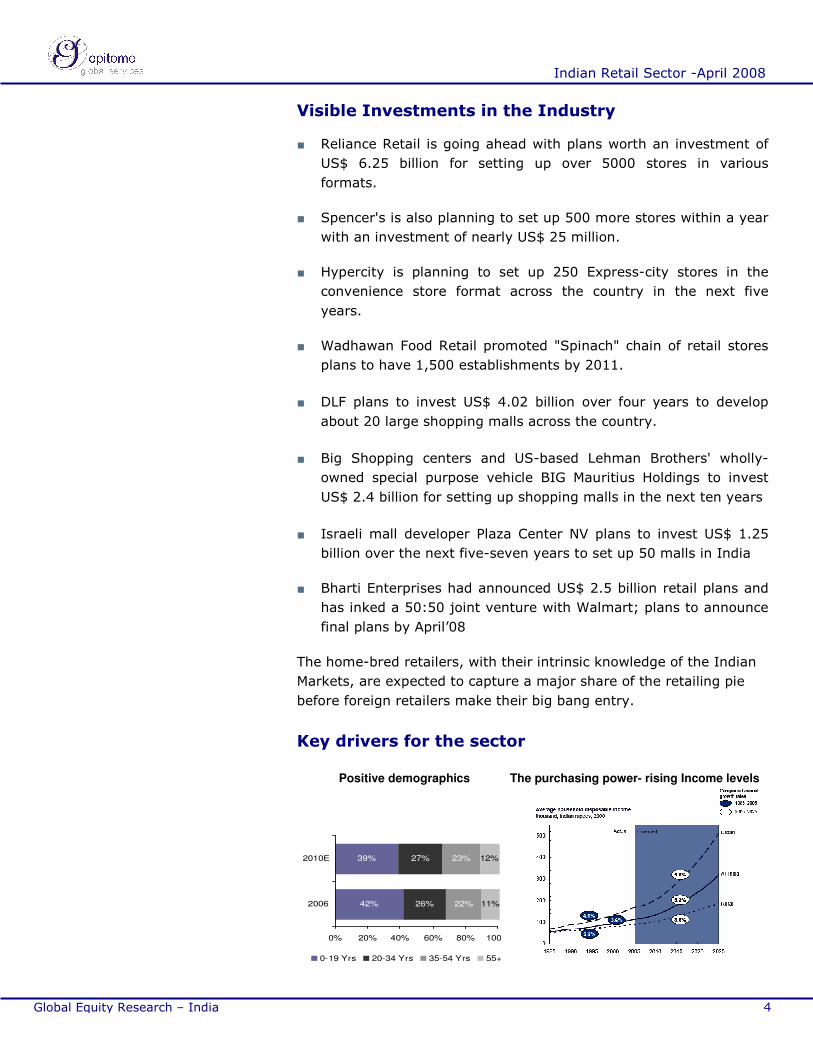
Key drivers for the sector
Positive demographics The purchasing power- rising Income levels
42%
39%
26%
27%
22%
23%
11%
12%
0% 20% 40% 60% 80% 100%
2006
2010E
0-19 Yrs 20-34 Yrs 35-54 Yrs 55+ Yrs
`
Indian Retail Research Report
June 19, 2008
Indian Retail Sector -April 2008
5 Global Equity Research – India
Increased FDI
Wal-Mart of the US, Tesco of the UK and Carrefour of France are also
firming up the plans for Indian market. Increased FDI in Indian retail
is expected to develop strong backward linkages and also create a
domestic supply chain of international standards. All this will result in
elimination of wastage, lower prices and better quality for consumers.
Space to watch out
Most of the retailers expect growth in retail segments across the
board; however, food and grocery is expected to see the highest
growth, with clothing being the second fastest growing segment.
Generally the deciding factor for store formats is dependent on kind
of retailing offered – Premium lifestyle retailing, Lifestyle retailing or
Value retailing. For example selling premium luxury brand could entail
a store size of 20,000 – 75,000 square feet. Format size for
hypermarkets, departmental and supermarkets varies with the
average ticket size in a locality, availability of place, population etc.
The other formats including airport retailing, online retailing,
telephone and catalogue buying are being tapped to capture newer
markets. Driven by changing lifestyles, strong income growth,
favourable demographic patterns, and huge investments by retailers,
Indian retail will be expanding at a blistering rate.
Reforms
The Government allows 100 per cent foreign direct investment (FDI)
in cash and carry through the automatic route and 51 per cent in
single brand retailing. Besides, the franchise route is available for big
operators.
Now, the Government also proposes further liberalization in the retail
sector allowing 51 per cent FDI in consumer electronics, sports
goods, stationery and building equipment.
Going ahead, the Government is expected to adopt a highly calibrated
approach to allowing further FDI in the retail space. There is a
possibility that further relaxation of FDI restrictions may take another
3-5 years. In spite of the delay, international retailers’ decibel levels
are rising in expressing their interest in the Indian retail market.
Indian Retail Research Report
June 19, 2008
Indian Retail Sector -April 2008
6 Global Equity Research – India
NSC Code
BSC Code
BLOOMBERG
VISHAL
RET/532867
VISH IN Equity
CMP Price Target Time-frame
Rs.
Rs.
Mths
797
1,376
12-15
Exp. Price return Exp. Divd yield
%
%
72.66
-
Exp. Total return % 72.66
Volatility Risk Medium
52-Week Range Rs. 423 – 1001
Face Value Market Cap Curr. Enterprise Value
Rs
Rs mn
Rs mn
10
17,855
22,544
Total shares o/s Promoters stake Free Float Average Daily Vol
Mn % Mn No's
22.40 63.93 8.08 1,536
Web Site www.vishalmegamart.net
Corporate Office RZ/A-95,96, Road No Street No-9,Mahilpalpur, New Delhi 110 037
VISHAL RETAIL LTD. Analysts: Anand Baheti Sector: Retail/Buy 91 22 4001 6612 Hiral Susania
91 22 4001 6613
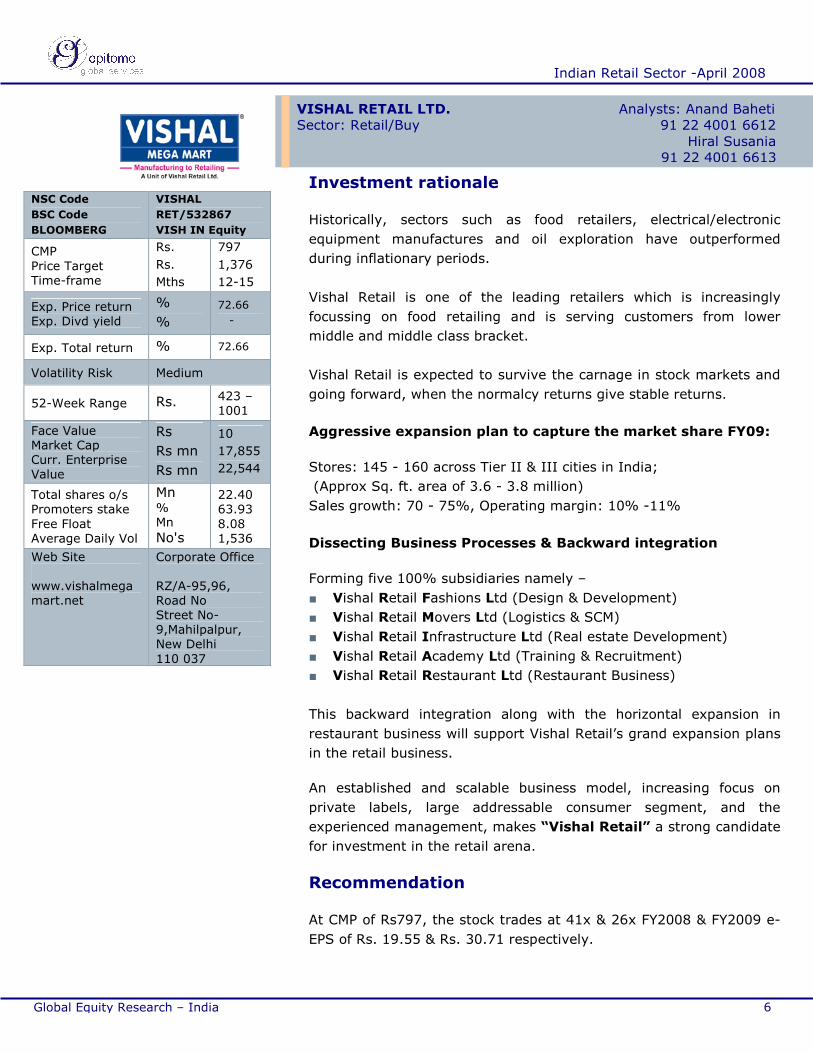
Investment rationale
Historically, sectors such as food retailers, electrical/electronic
equipment manufactures and oil exploration have outperformed
during inflationary periods.
Vishal Retail is one of the leading retailers which is increasingly
focussing on food retailing and is serving customers from lower
middle and middle class bracket.
Vishal Retail is expected to survive the carnage in stock markets and
going forward, when the normalcy returns give stable returns.
Aggressive expansion plan to capture the market share FY09:
Stores: 145 - 160 across Tier II & III cities in India;
(Approx Sq. ft. area of 3.6 - 3.8 million)
Sales growth: 70 - 75%, Operating margin: 10% -11%
Dissecting Business Processes & Backward integration
Forming five 100% subsidiaries namely –
■ Vishal Retail Fashions Ltd (Design & Development)
■ Vishal Retail Movers Ltd (Logistics & SCM)
■ Vishal Retail Infrastructure Ltd (Real estate Development)
■ Vishal Retail Academy Ltd (Training & Recruitment)
■ Vishal Retail Restaurant Ltd (Restaurant Business)
This backward integration along with the horizontal expansion in
restaurant business will support Vishal Retail’s grand expansion plans
in the retail business.
An established and scalable business model, increasing focus on
private labels, large addressable consumer segment, and the
experienced management, makes “Vishal Retail” a strong candidate
for investment in the retail arena.
Recommendation
At CMP of Rs797, the stock trades at 41x & 26x FY2008 & FY2009 e-
EPS of Rs. 19.55 & Rs. 30.71 respectively.
Indian Retail Research Report
June 19, 2008
Indian Retail Sector -April 2008
7 Global Equity Research – India
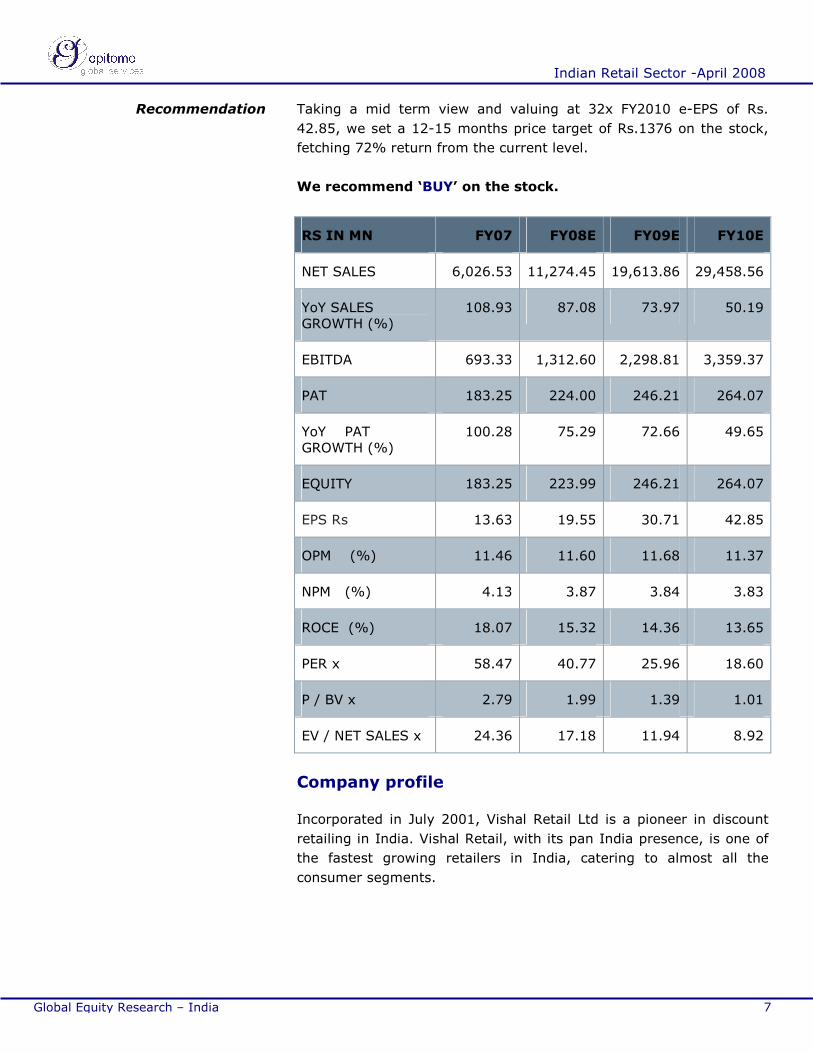
Taking a mid term view and valuing at 32x FY2010 e-EPS of Rs.
42.85, we set a 12-15 months price target of Rs.1376 on the stock,
fetching 72% return from the current level.
We recommend ‘BUY’ on the stock.
RS IN MN FY07 FY08E FY09E FY10E
NET SALES 6,026.53 11,274.45 19,613.86 29,458.56
YoY SALES GROWTH (%)
108.93 87.08 73.97 50.19
EBITDA 693.33 1,312.60 2,298.81 3,359.37
PAT 183.25 224.00 246.21 264.07
YoY PAT GROWTH (%)
100.28 75.29 72.66 49.65
EQUITY 183.25 223.99 246.21 264.07
EPS Rs 13.63 19.55 30.71 42.85
OPM (%) 11.46 11.60 11.68 11.37
NPM (%) 4.13 3.87 3.84 3.83
ROCE (%) 18.07 15.32 14.36 13.65
PER x 58.47 40.77 25.96 18.60
P / BV x 2.79 1.99 1.39 1.01
EV / NET SALES x 24.36 17.18 11.94 8.92
Company profile
Incorporated in July 2001, Vishal Retail Ltd is a pioneer in discount
retailing in India. Vishal Retail, with its pan India presence, is one of
the fastest growing retailers in India, catering to almost all the
consumer segments.
Recommendation
Indian Retail Research Report
June 19, 2008
Indian Retail Sector -April 2008
8 Global Equity Research – India
The growth magnitude of Vishal Retail is visible from the following
numbers –
Jan 1986 - 1 store
(An independent enterprise)
March 2008 – 100 stores
(67Cities 20 States; covering area of 2,130,000 Sq. Ft approx)
Though the growth looks a bit of non-starter, the fact that actual
growth has started ticking only after 2001 will definitely give a
high.
Vishal primarily caters to the bulging middle and lower middle class
consumer bracket, which forms approx. 60% of India’s total
purchasing power. The Company is operating a chain of low cost
hypermarkets, focused on Tier II and III towns and cities, across the
country.
The philosophy behind value retailing is - cost benefits that are
derived from the large central purchase of goods and services are
passed on to the consumer. Vishal’s hypermarket showrooms have
over 85,000 products which fulfil all the household needs and also
offer affordable family fashion at prices suiting every section of the
society.
Vishal has differentiated itself with its strong focus on private labels
manufactured in-house, and quasi-private labels sourced from low-
cost manufacturers. This also helps Vishal in improving revenue
streams and margins.
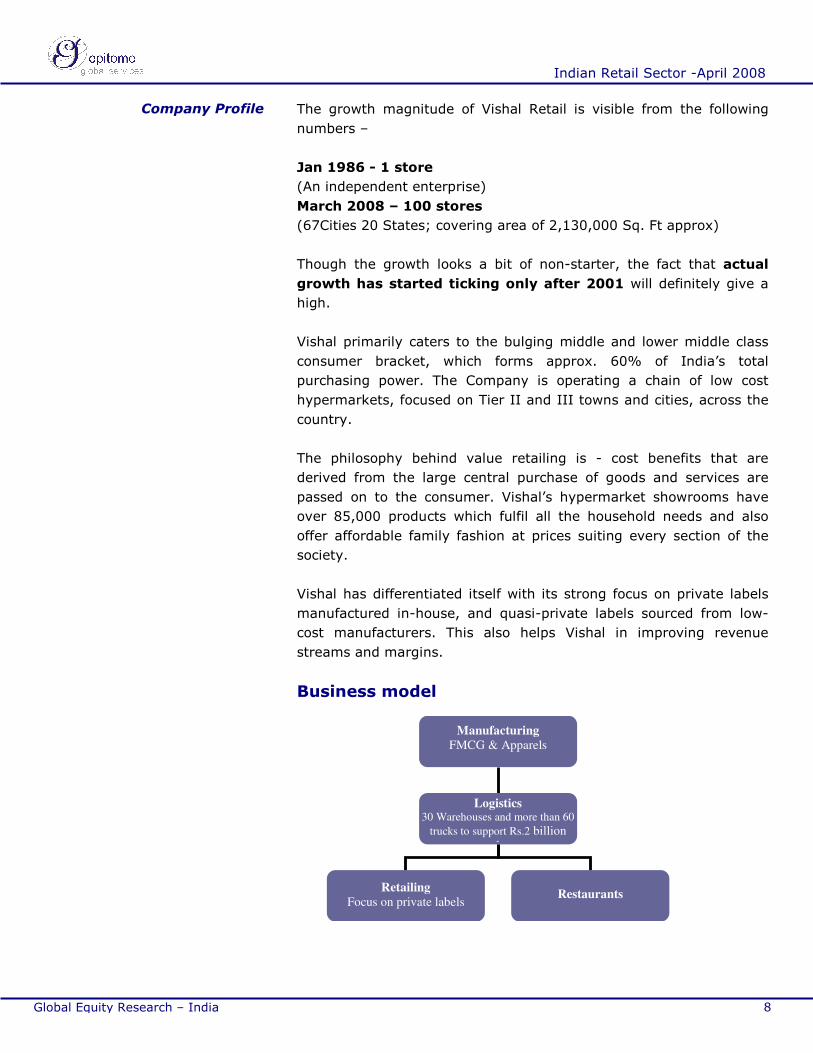
Business model
Manufacturing
FMCG & Apparels
Logistics 30 Warehouses and more than 60
trucks to support Rs.2 billion
sales
Retailing
Focus on private labels Restaurants
Restaurants
Company Profile
Indian Retail Research Report
June 19, 2008
Indian Retail Sector -April 2008
9 Global Equity Research – India
Strategy
It has an ambitious rollout plan to reach a total of 150 stores
covering approx 3.80 million sq. Ft. of retail space by FY09. The
Company is also focusing on integration and towards this end has
initiated backward integration in the field of high fashion by setting
up a state of the art manufacturing facility to support its high-end /
premium retailing.
With more than 80% of its stores located in Tier II & III cities, the
company is gaining first mover advantage and a competitive edge by
acquiring/leasing real estate at lower prices, and is also achieving
critical mass. During 9M FY08, the average rentals per square feet
per month stood at Rs. 31.
With its basics firmly in place, Vishal is now focusing on de-risking its
business model by diversifying in Restaurants, Jewellery and
medicine retailing, by strengthening its management team and
upgrading its technology and supply chain efficiencies. This will help
support scalability and derive efficiency gains.
On pilot basis the Company opened Vishal Fashion Mart and Vishal
Jewel Mart in New Delhi to tap the speciality market. These formats
are much smaller in size ranging from 1,500-2,500 square feet. The
Company already has close to 20 Vishal Fashion Mart and is also
considering to enter various other formats including convenience,
apparel, restaurants, consumer durables, IT, footwear, lifestyle and
home in the next one years time.
For these speciality formats, the Company plans to take up the
franchise route to control its fixed costs and overcome the talent
crunch which the industry is facing. Apart from this, the Company
plans to foray in the cash-and-carry business in a year’s time.
Vishal has also focused on its backward integration into garment
manufacturing as a key margin improvement factor for the company.
In FY07, Private labels (in-house manufacturing) contributed to 10%
of turnover and the quasi-private labels (products sourced from
unbranded manufacturer suppliers) contributed over 60% to its
revenue.
Indian Retail Research Report
June 19, 2008
Indian Retail Sector -April 2008
10 Global Equity Research – India
To support this high decibel growth they have decided to form
separate project implementation teams. Also, the implementation of
SAP will enable the company to scale without any hiccups.
As the Company generates 61 % of its revenue form its Apparel
business, the VRFL will provide the stores with latest designs and
trend in the market which can eventually be manufactured as private
or quasi-private labels.
VRML will provide complete logistic solution to the Company stores.
These resources can eventually be used to cater to the needs of the
other retailers, thus making optimum utilization of available
resources.
Normally, the king-size formats of Vishal retail stores are of around
25,000 sq. Ft. That automatically increase the per square feet rates
of the surrounding area. Vishal retail, which has big plans of covering
an area of approx. 10 million sq ft. In next 5-6 years, can tap this
potential increase in realty prices by developing the stores and the
surrounding area through VRIL.
The big store size also allows the Company to expand horizontally
and generate additional stream of revenues from its restaurant
business. The Company already has 40 (QSR) Quick Service
Restaurants that generate a very healthy gross margin of 60%
(excluding only the raw material costs). The Company plans to have
restaurants in all the stores that are more than 20,000 square feet in
size.
The Company with the existing headcount of 12,500 employees is
facing a high attrition rate of 15%. VRAL will be a training institute
for the aspirants seeking a career in retail and feeder to Vishal Retail
Ltd. Initially, this will cater only to the needs of the Company at both
the front-end and the backend level and eventually will cater to the
overall retail sector.
Thus, the Company’s strategy of moving backwards from its business
will not only help the Company to capitalize on its retail expansion
but also tap the potential opportunities available in the logistics,
training and development and real estate infrastructure which is
geared-up by the boom in the retail industry.
Strategy
Indian Retail Research Report
June 19, 2008
Indian Retail Sector -April 2008
11 Global Equity Research – India
Financial performance
New stores addition
26
100
49
16
-
2,000
4,000
6,000
8,000
10,000
12,000
2005 2006 2007 2008e 0
20
40
60
80
100
120
Sales Store count
(Rs in million)
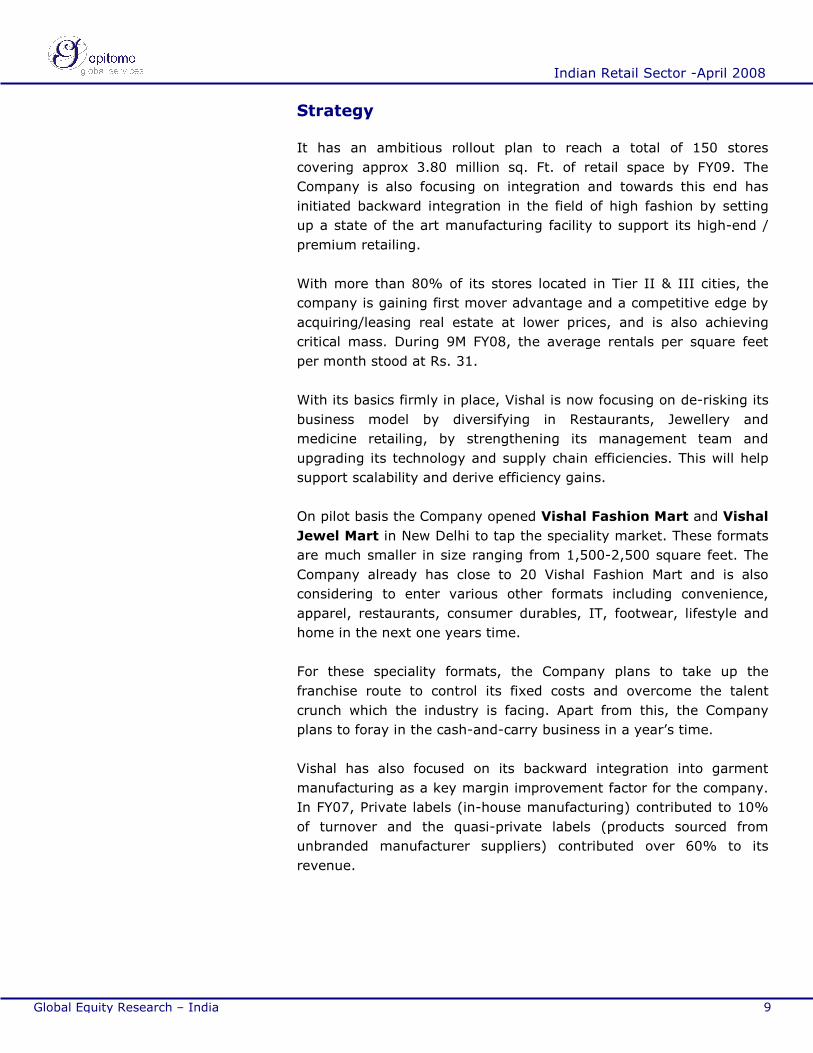
3-year CAGR of 90% in Revenues
In the past three years, the Company grew at a CAGR of 90% and
generated revenues of Rs.6,026.5 million in FY07.
Strong revenue growth is attributable to:
■ Increase in total retail space
■ Addition of new stores
■ Growth in the same store sales
■ Escalation in average footfalls per day with new stores and
optimization of product mix.
Indian Retail Research Report
June 19, 2008
Indian Retail Sector -April 2008
12 Global Equity Research – India
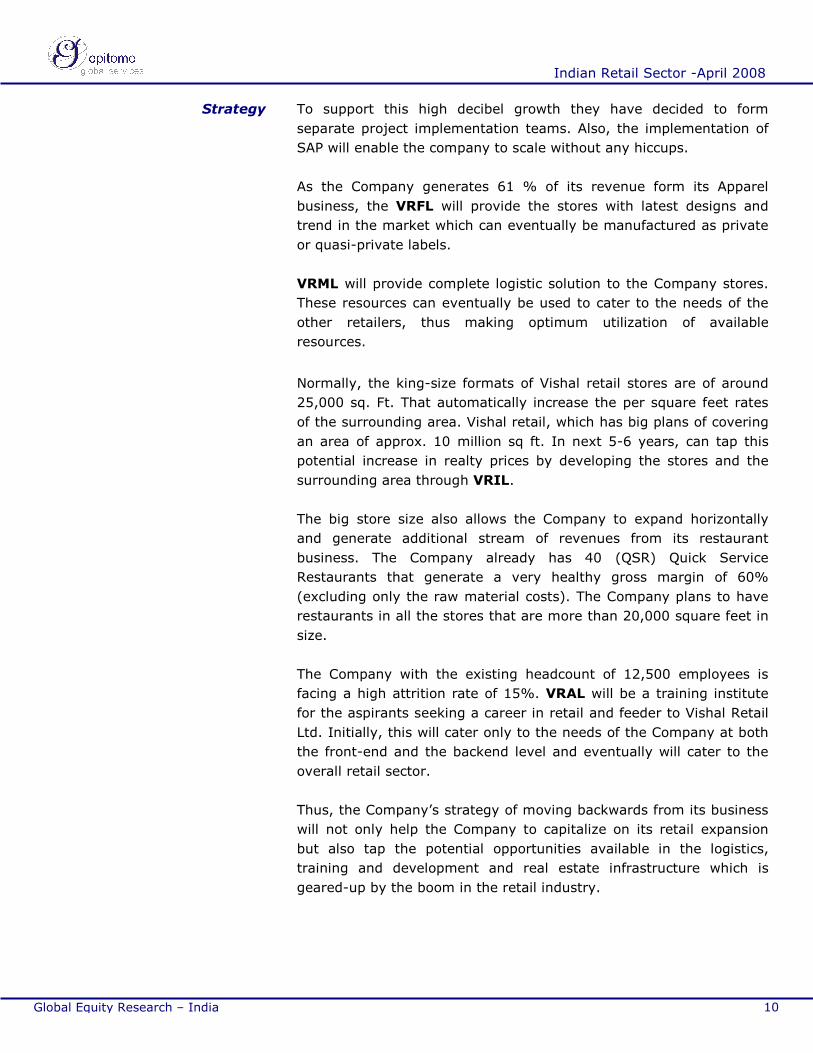
Four-fold increase in retail space
Vishal Retail increased the total retail space more than four times
since FY05 to 1.26 million square feet in FY07. For the nine-month
ended December-07, the Company’s total retail space stood at 1.89
million square feet with a store count of 82.
16 2649
100
200
250
300
160
-
1,000
2,000
3,000
4,000
5,000
6,000
7,000
8,000
FY05 FY06 FY07 FY08 FY09e FY10e FY11e FY12e
Sq. ft.
-
50
100
150
200
250
300
350
Total Sq ft (thousands) No of stores
No. of stores
Going forward, the number of stores is expected to reach 300 by
FY12 and the total square feet to cross 7.5 million square feet.
Along with the increase in sales from new stores, the Company’s
existing stores registered a y-o-y sales growth of 21% in FY06 and
12% in FY07. The same store sales increase is driven by increase in
non-apparel and FMCG product mix.
3-Year CAGR of 184% in operating profits
The operating profits moved faster than sales growth as the Company
benefited from change in sales mix, economies of scale and cost
reduction initiatives. From an EBITDA margin of 6% in FY05, the
margins almost doubled in FY07 to 11.5%. The following diagram
illustrates the change in composition of product mix in favour of non
apparels and FMCG which aided in improving profitability.
Indian Retail Research Report
June 19, 2008
Indian Retail Sector -April 2008
13 Global Equity Research – India
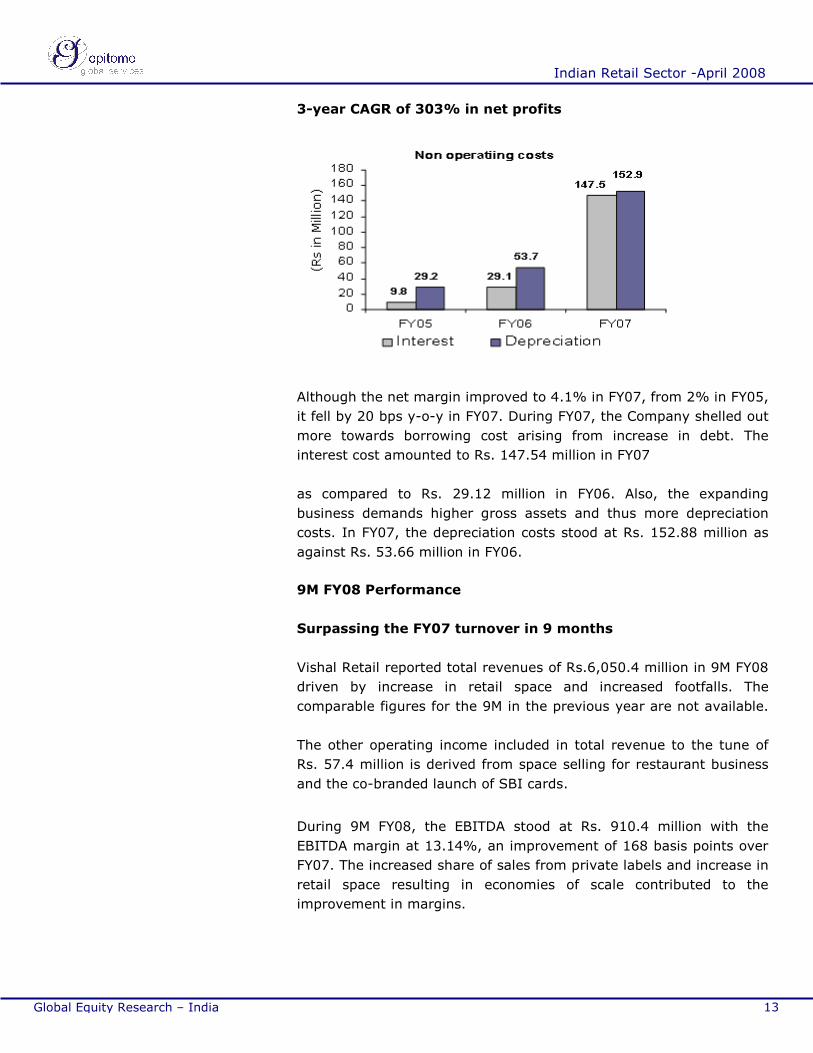
3-year CAGR of 303% in net profits
Although the net margin improved to 4.1% in FY07, from 2% in FY05,
it fell by 20 bps y-o-y in FY07. During FY07, the Company shelled out
more towards borrowing cost arising from increase in debt. The
interest cost amounted to Rs. 147.54 million in FY07
as compared to Rs. 29.12 million in FY06. Also, the expanding
business demands higher gross assets and thus more depreciation
costs. In FY07, the depreciation costs stood at Rs. 152.88 million as
against Rs. 53.66 million in FY06.
9M FY08 Performance
Surpassing the FY07 turnover in 9 months
Vishal Retail reported total revenues of Rs.6,050.4 million in 9M FY08
driven by increase in retail space and increased footfalls. The
comparable figures for the 9M in the previous year are not available.
The other operating income included in total revenue to the tune of
Rs. 57.4 million is derived from space selling for restaurant business
and the co-branded launch of SBI cards.
During 9M FY08, the EBITDA stood at Rs. 910.4 million with the
EBITDA margin at 13.14%, an improvement of 168 basis points over
FY07. The increased share of sales from private labels and increase in
retail space resulting in economies of scale contributed to the
improvement in margins.
Indian Retail Research Report
June 19, 2008
Indian Retail Sector -April 2008
14 Global Equity Research – India
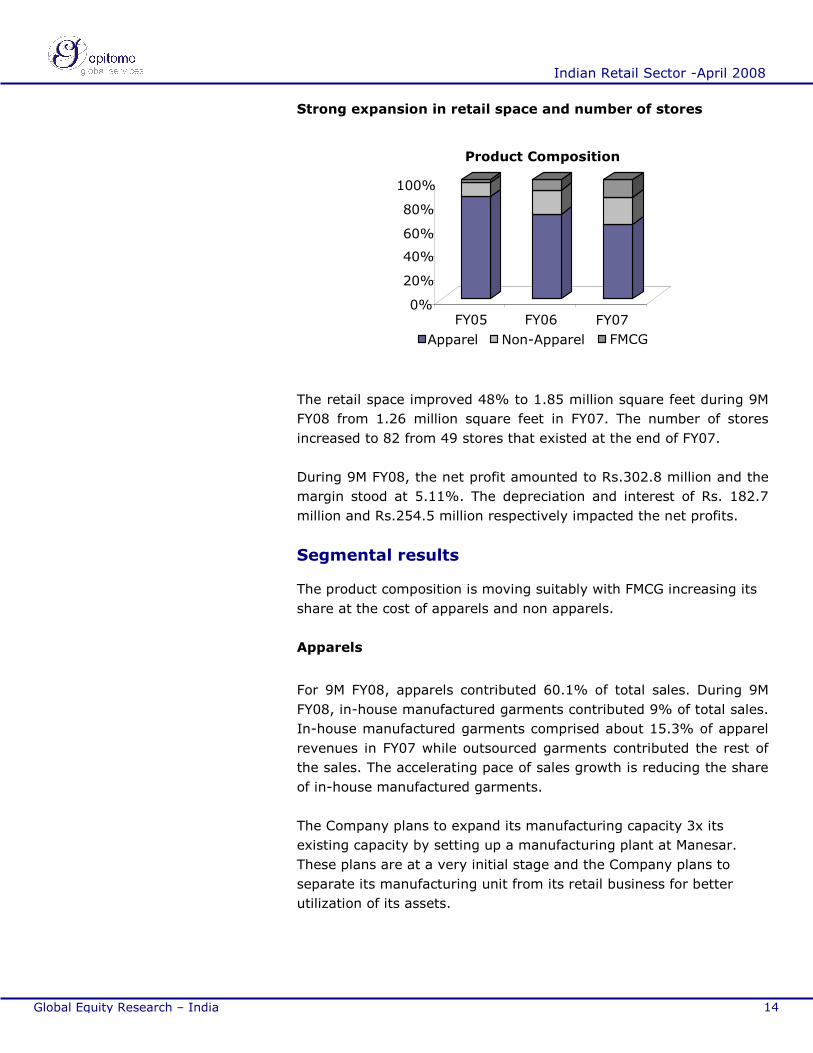
Strong expansion in retail space and number of stores
0%
20%
40%
60%
80%
100%
FY05 FY06 FY07
Product Composition
Apparel Non-Apparel
FMCG
The retail space improved 48% to 1.85 million square feet during 9M
FY08 from 1.26 million square feet in FY07. The number of stores
increased to 82 from 49 stores that existed at the end of FY07.
During 9M FY08, the net profit amounted to Rs.302.8 million and the
margin stood at 5.11%. The depreciation and interest of Rs. 182.7
million and Rs.254.5 million respectively impacted the net profits.
Segmental results
The product composition is moving suitably with FMCG increasing its
share at the cost of apparels and non apparels.
Apparels
For 9M FY08, apparels contributed 60.1% of total sales. During 9M
FY08, in-house manufactured garments contributed 9% of total sales.
In-house manufactured garments comprised about 15.3% of apparel
revenues in FY07 while outsourced garments contributed the rest of
the sales. The accelerating pace of sales growth is reducing the share
of in-house manufactured garments.
The Company plans to expand its manufacturing capacity 3x its
existing capacity by setting up a manufacturing plant at Manesar.
These plans are at a very initial stage and the Company plans to
separate its manufacturing unit from its retail business for better
utilization of its assets.
Indian Retail Research Report
June 19, 2008
Indian Retail Sector -April 2008
15 Global Equity Research – India
The Company has approximately 30 vendors for these segments. The
Company also imports finished and semi-finished goods from China
and Thailand. Of the total out-sourced component, China contributed
9% during 9M FY08. During this period, non apparels and FMCG as a
% of total sales stood at 19.5% and 18.9% respectively. For FY07,
Non apparels and FMCG contributed 21.7% and 15% respectively.
For FMCG segment too, the Company is focusing on private labels to
earn better margins. The Company Company targets to earn 20% of
revenues from FMCG segment in FY09 by increasing the product
offerings in the segment.
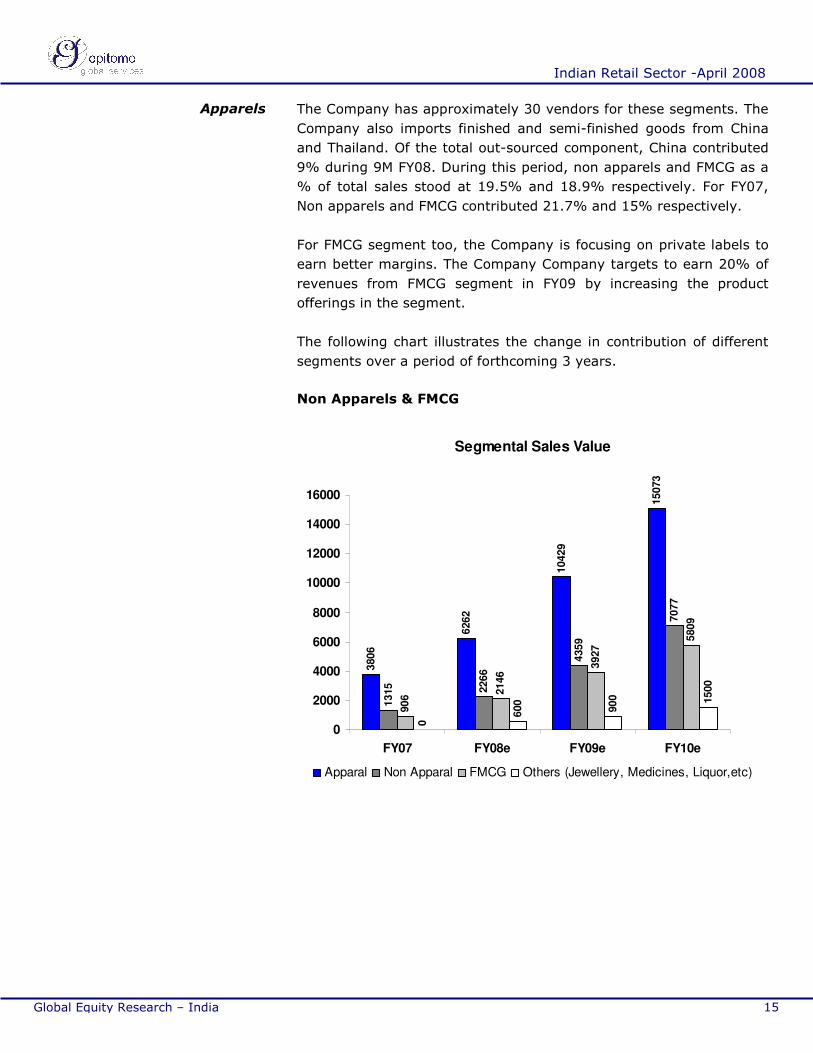
The following chart illustrates the change in contribution of different
segments over a period of forthcoming 3 years.
Non Apparels & FMCG
Segmental Sales Value
3806
6262
10429
15073
1315 2266
4359
7077
906
2146
3927
5809
0
600
900 1500
0
2000
4000
6000
8000
10000
12000
14000
16000
FY07 FY08e FY09e FY10e
Apparal Non Apparal FMCG Others (Jewellery, Medicines, Liquor,etc)
Apparels
Indian Retail Research Report
June 19, 2008
Indian Retail Sector -April 2008
16 Global Equity Research – India
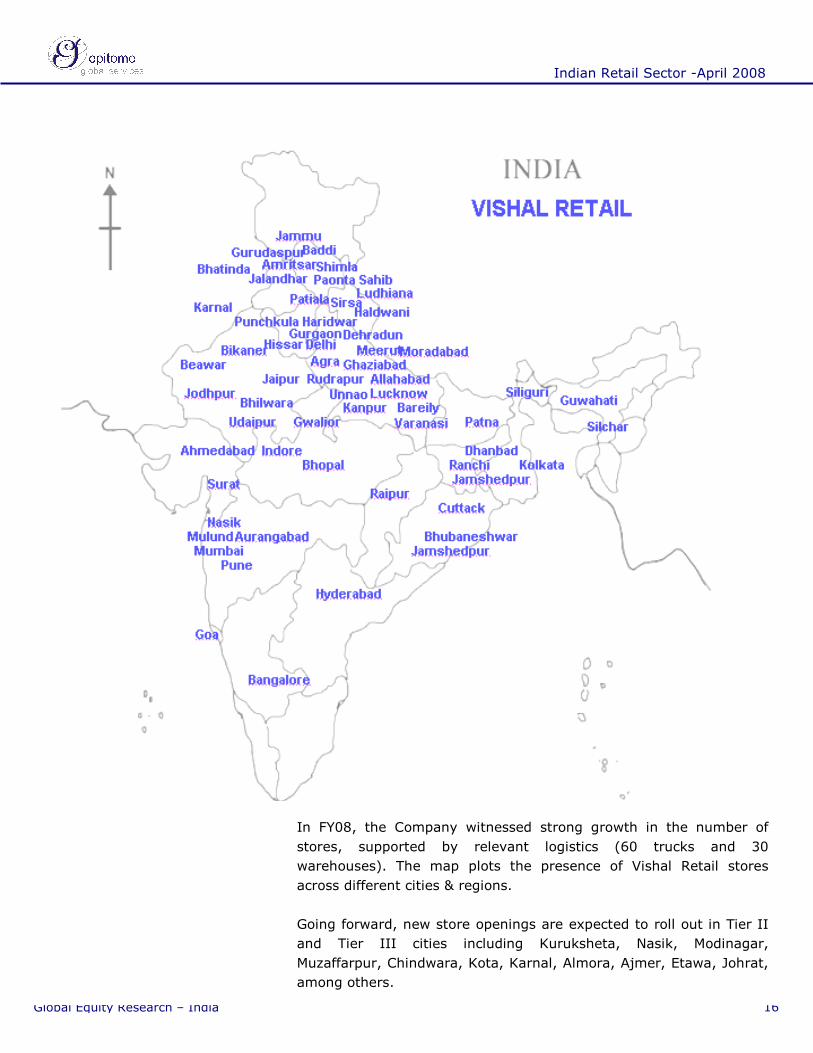
In FY08, the Company witnessed strong growth in the number of
stores, supported by relevant logistics (60 trucks and 30
warehouses). The map plots the presence of Vishal Retail stores
across different cities & regions.
Going forward, new store openings are expected to roll out in Tier II
and Tier III cities including Kuruksheta, Nasik, Modinagar,
Muzaffarpur, Chindwara, Kota, Karnal, Almora, Ajmer, Etawa, Johrat,
among others.
Indian Retail Research Report
June 19, 2008
Indian Retail Sector -April 2008
17 Global Equity Research – India
The Company has already finalized approx. 1.1 million square feet of
space with an average size of 20,000 square feet in different cities
and approximately 1.1 million square feet is under the process of
finalization.
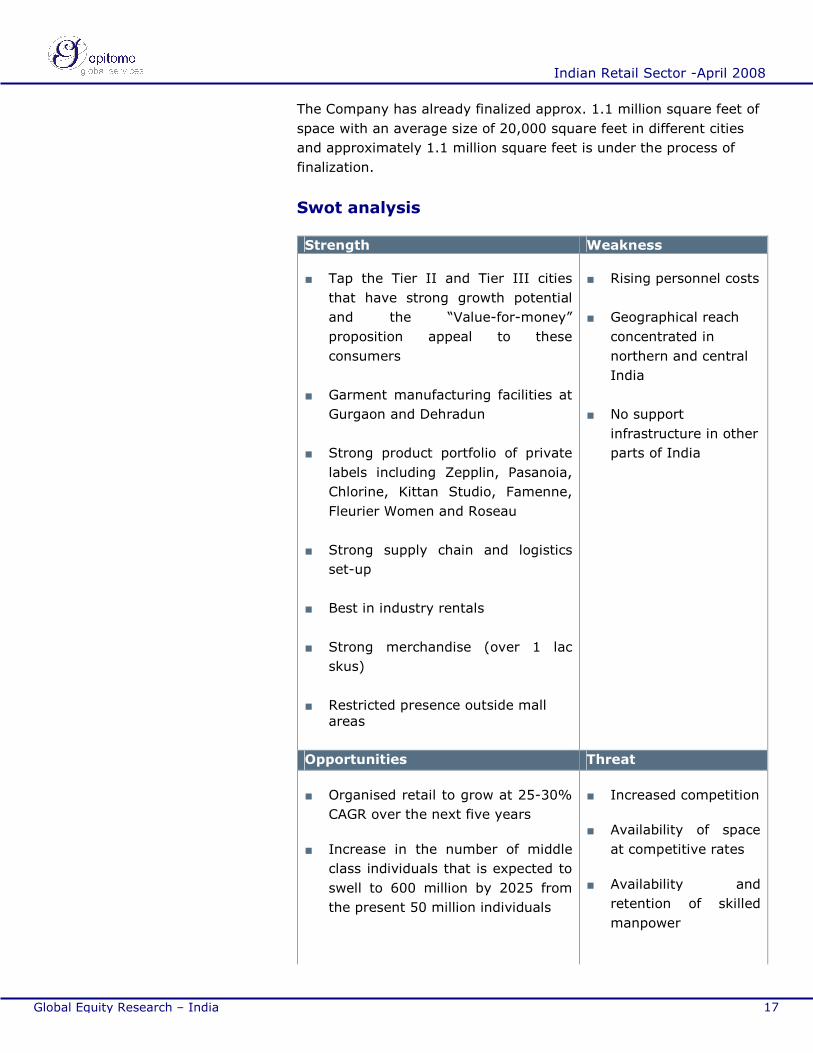
Swot analysis
Strength Weakness
■ Tap the Tier II and Tier III cities
that have strong growth potential
and the “Value-for-money”
proposition appeal to these
consumers
■ Garment manufacturing facilities at
Gurgaon and Dehradun
■ Strong product portfolio of private
labels including Zepplin, Pasanoia,
Chlorine, Kittan Studio, Famenne,
Fleurier Women and Roseau
■ Strong supply chain and logistics
set-up
■ Best in industry rentals
■ Strong merchandise (over 1 lac
skus)
■ Restricted presence outside mall areas
■ Rising personnel costs
■ Geographical reach
concentrated in
northern and central
India
■ No support
infrastructure in other
parts of India
Opportunities Threat
■ Organised retail to grow at 25-30%
CAGR over the next five years
■ Increase in the number of middle
class individuals that is expected to
swell to 600 million by 2025 from
the present 50 million individuals
■ Increased competition
■ Availability of space
at competitive rates
■ Availability and
retention of skilled
manpower
Indian Retail Research Report
June 19, 2008
Indian Retail Sector -April 2008
18 Global Equity Research – India
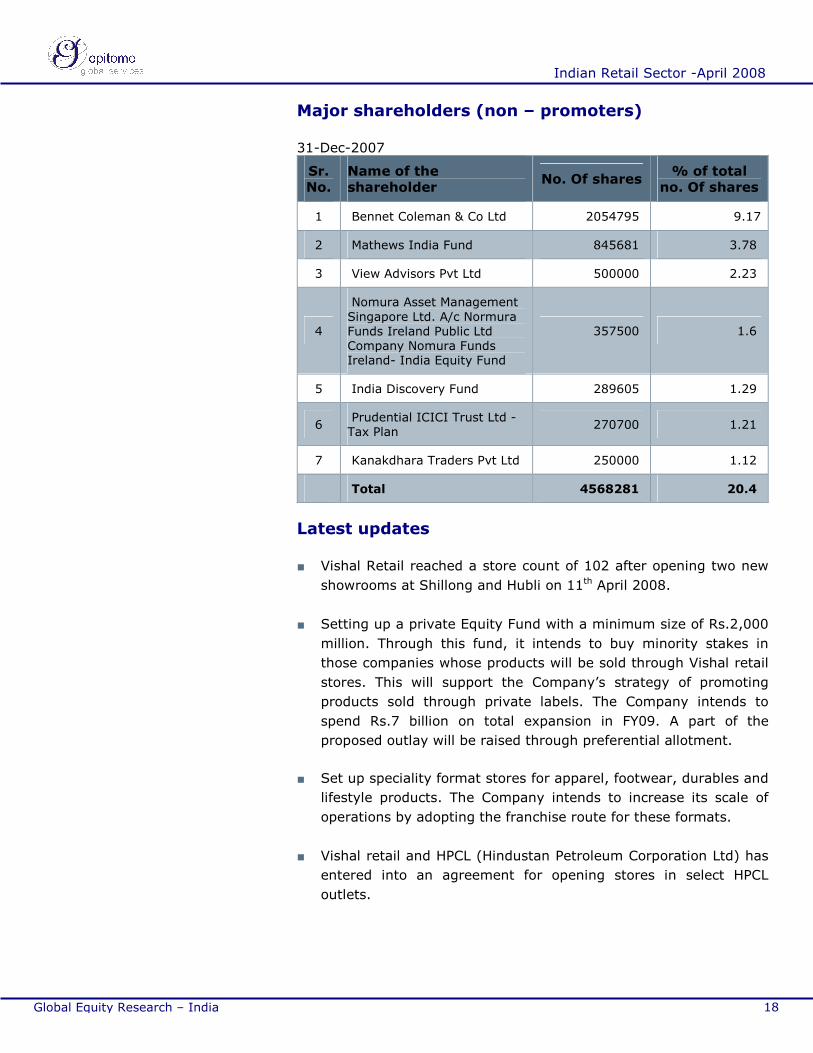
Major shareholders (non – promoters)
31-Dec-2007
Sr.
No.
Name of the
shareholder No. Of shares
% of total
no. Of shares
1 Bennet Coleman & Co Ltd 2054795 9.17
2 Mathews India Fund 845681 3.78
3 View Advisors Pvt Ltd 500000 2.23
4
Nomura Asset Management Singapore Ltd. A/c Normura Funds Ireland Public Ltd Company Nomura Funds Ireland- India Equity Fund
357500 1.6
5 India Discovery Fund 289605 1.29
6 Prudential ICICI Trust Ltd -Tax Plan
270700 1.21
7 Kanakdhara Traders Pvt Ltd 250000 1.12
Total 4568281 20.4
Latest updates
■ Vishal Retail reached a store count of 102 after opening two new
showrooms at Shillong and Hubli on 11th April 2008.
■ Setting up a private Equity Fund with a minimum size of Rs.2,000
million. Through this fund, it intends to buy minority stakes in
those companies whose products will be sold through Vishal retail
stores. This will support the Company’s strategy of promoting
products sold through private labels. The Company intends to
spend Rs.7 billion on total expansion in FY09. A part of the
proposed outlay will be raised through preferential allotment.
■ Set up speciality format stores for apparel, footwear, durables and
lifestyle products. The Company intends to increase its scale of
operations by adopting the franchise route for these formats.
■ Vishal retail and HPCL (Hindustan Petroleum Corporation Ltd) has
entered into an agreement for opening stores in select HPCL
outlets.
Indian Retail Research Report
June 19, 2008
Indian Retail Sector -April 2008
19 Global Equity Research – India
■ HPCL has 8,000 retail outlets and the Company intends to either
open stores or use them for the purpose of warehouse.
■ Like Koutons retail, the Company intends to capitalize on the
benefits of franchise model. Accordingly, the kirana outlets that
were facing the heat of organised retail will join hands with Vishal
under the franchise route. This will be a win-win situation for both
parties. The kirana stores will benefit from Vishal’s merchandising
expertise, technology, promotional schemes and supply chain
management. Besides, they will be offered minimum guarantee so
they do not lose out on their opportunity cost. While Vishal retail
will have a strong support of the army of kirana stores – so far
disgruntled with organised retail -- that exist in the country. This
will help the company in facing the competition from large players
like Reliance, Future and Bharti Retail.
Latest updates
Indian Retail Research Report
June 19, 2008
Indian Retail Sector -April 2008
20 Global Equity Research – India
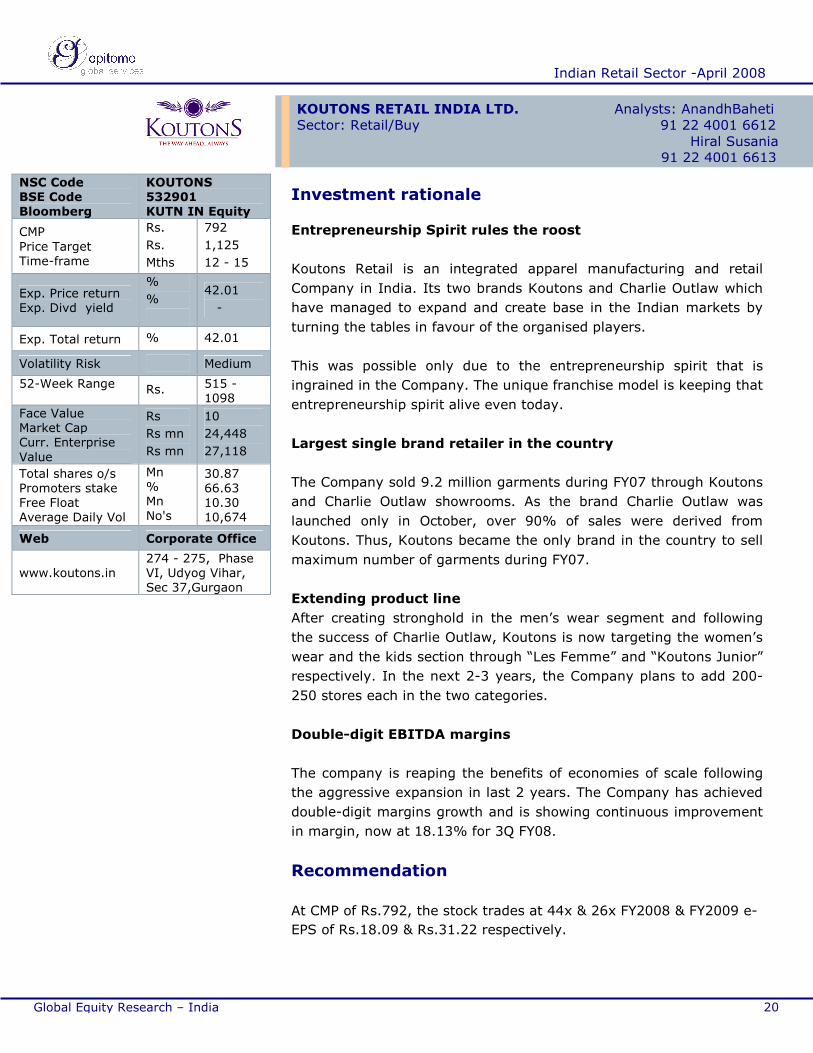
NSC Code BSE Code Bloomberg
KOUTONS 532901 KUTN IN Equity
CMP Price Target Time-frame
Rs.
Rs.
Mths
792
1,125
12 - 15
Exp. Price return Exp. Divd yield
%
%
42.01
-
Exp. Total return % 42.01
Volatility Risk Medium
52-Week Range
Rs. 515 - 1098
Face Value Market Cap Curr. Enterprise Value
Rs
Rs mn
Rs mn
10
24,448
27,118
Total shares o/s Promoters stake Free Float Average Daily Vol
Mn % Mn No's
30.87 66.63 10.30 10,674
Web Corporate Office
www.koutons.in 274 - 275, Phase VI, Udyog Vihar, Sec 37,Gurgaon
Investment rationale
Entrepreneurship Spirit rules the roost
Koutons Retail is an integrated apparel manufacturing and retail
Company in India. Its two brands Koutons and Charlie Outlaw which
have managed to expand and create base in the Indian markets by
turning the tables in favour of the organised players.
This was possible only due to the entrepreneurship spirit that is
ingrained in the Company. The unique franchise model is keeping that
entrepreneurship spirit alive even today.
Largest single brand retailer in the country
The Company sold 9.2 million garments during FY07 through Koutons
and Charlie Outlaw showrooms. As the brand Charlie Outlaw was
launched only in October, over 90% of sales were derived from
Koutons. Thus, Koutons became the only brand in the country to sell
maximum number of garments during FY07.
Extending product line
After creating stronghold in the men’s wear segment and following
the success of Charlie Outlaw, Koutons is now targeting the women’s
wear and the kids section through “Les Femme” and “Koutons Junior”
respectively. In the next 2-3 years, the Company plans to add 200-
250 stores each in the two categories.
Double-digit EBITDA margins
The company is reaping the benefits of economies of scale following
the aggressive expansion in last 2 years. The Company has achieved
double-digit margins growth and is showing continuous improvement
in margin, now at 18.13% for 3Q FY08.
Recommendation
At CMP of Rs.792, the stock trades at 44x & 26x FY2008 & FY2009 e-
EPS of Rs.18.09 & Rs.31.22 respectively.
KOUTONS RETAIL INDIA LTD. Analysts: AnandhBaheti Sector: Retail/Buy 91 22 4001 6612
Hiral Susania 91 22 4001 6613
Indian Retail Research Report
June 19, 2008
Indian Retail Sector -April 2008
21 Global Equity Research – India
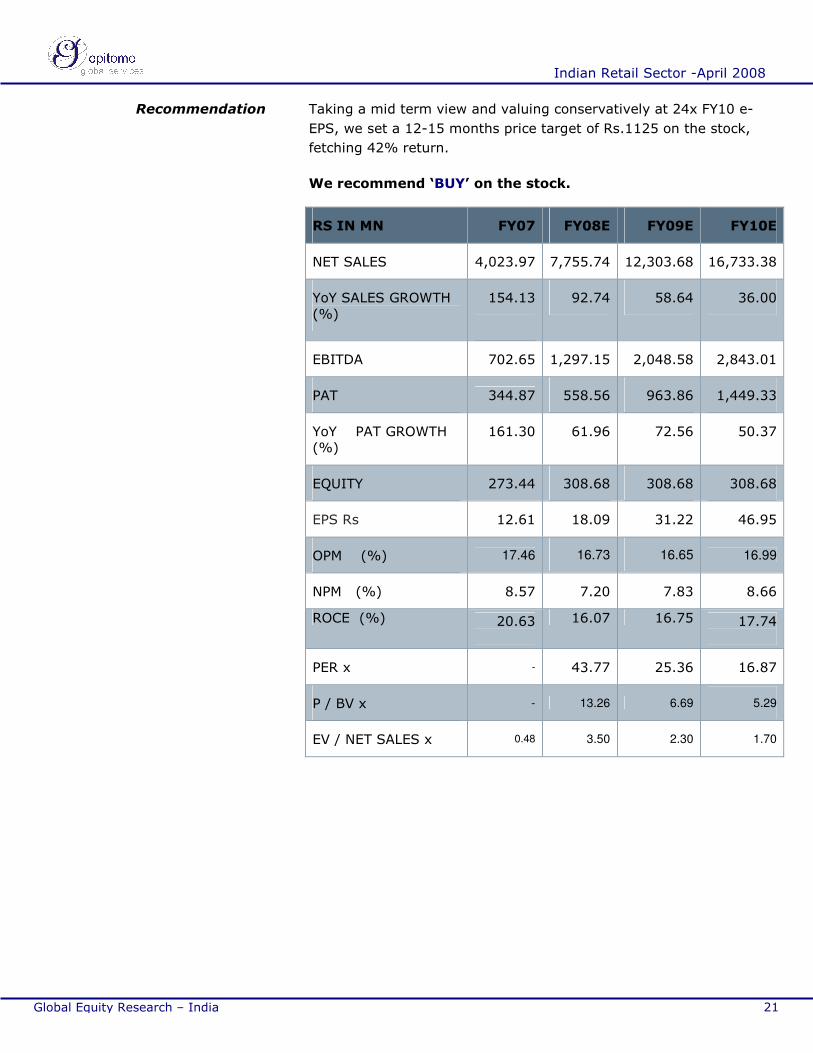
Taking a mid term view and valuing conservatively at 24x FY10 e-
EPS, we set a 12-15 months price target of Rs.1125 on the stock,
fetching 42% return.
We recommend ‘BUY’ on the stock.
RS IN MN FY07 FY08E FY09E FY10E
NET SALES 4,023.97 7,755.74 12,303.68 16,733.38
YoY SALES GROWTH (%)
154.13
92.74 58.64 36.00
EBITDA 702.65 1,297.15 2,048.58 2,843.01
PAT 344.87 558.56 963.86 1,449.33
YoY PAT GROWTH (%)
161.30
61.96 72.56 50.37
EQUITY 273.44 308.68 308.68 308.68
EPS Rs 12.61 18.09 31.22 46.95
OPM (%) 17.46 16.73 16.65 16.99
NPM (%) 8.57 7.20 7.83 8.66
ROCE (%) 20.63
16.07 16.75 17.74
PER x - 43.77 25.36 16.87
P / BV x - 13.26 6.69 5.29
EV / NET SALES x 0.48 3.50 2.30 1.70
Recommendation
Indian Retail Research Report
June 19, 2008
Indian Retail Sector -April 2008
22 Global Equity Research – India
Company overview
Koutons was incorporated in 1994 as Charlie Creations Private Ltd.
The name was later changed to Koutons Retail Private Limited in
February 2006 and Koutons Retail India Limited from June 2006.
Koutons Retail has emerged as an integrated apparel manufacturing
and retailing company. It undertakes designing, manufacturing and
retailing of apparel under the Koutons, Charlie Outlaw, Upper Class,
Les Femme, and Koutons Junior brands.
The Company’s major focus area has been to target men’s apparel
range including denim and non-denim trousers, formal and casual
shirts, t-shirts, suits, blazers, sweat shirts, cargos in the middle to
high fashion segment predominantly through the Company’s ebos
(Exclusive brand outlets).
To address a broader customer base, the Company has recently
introduced a line of women’s wear under the “Les femme” brand and
the “Koutons Junior” brand that targets the children.
The Company sold 9.2 million garments during FY07 through Koutons
and Charlie Outlaw showrooms. As the brand Charlie Outlaw was
launched only in October; over 90% of sales were derived from
Koutons. Thus, Koutons became the only brand in the country to sell
maximum number of garments during FY07.
Strategy
Integrated Manufacturing Facilities
The Company presently has 18 manufacturing units (1 Owned and
rest leased for a period of 5-7 years) and 14 warehouses located in
and around Gurgaon. An integrated manufacturing unit at Gurgaon,
Haryana will be set-up on the 13,000 square feet of land allotted to
the Company by the Government and commissioned by December
2008. The Company will shift 7-8 of the existing units to this location
which will improve efficiencies and lower the lease rental costs to that
extent for the Company.
In the appreciating rupee scenario, a lot of domestic manufacturing
capacities and those in Bangladesh are lying idle which is available for
domestic retailers. And the Company plans to take full advantage
Indian Retail Research Report
June 19, 2008
Indian Retail Sector -April 2008
23 Global Equity Research – India
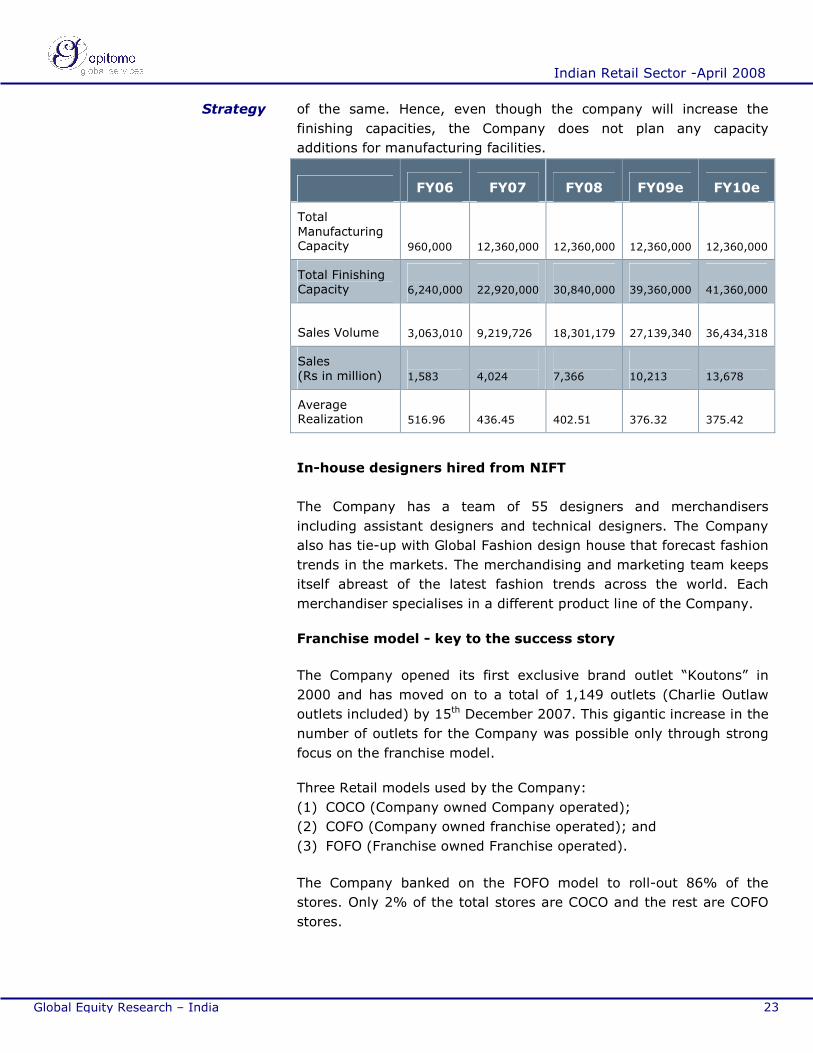
of the same. Hence, even though the company will increase the
finishing capacities, the Company does not plan any capacity
additions for manufacturing facilities.
FY06 FY07 FY08 FY09e FY10e
Total Manufacturing Capacity
960,000
12,360,000
12,360,000
12,360,000
12,360,000
Total Finishing Capacity
6,240,000
22,920,000
30,840,000
39,360,000
41,360,000
Sales Volume 3,063,010
9,219,726
18,301,179
27,139,340
36,434,318
Sales (Rs in million)
1,583
4,024
7,366
10,213
13,678
Average Realization
516.96
436.45
402.51
376.32
375.42
In-house designers hired from NIFT
The Company has a team of 55 designers and merchandisers
including assistant designers and technical designers. The Company
also has tie-up with Global Fashion design house that forecast fashion
trends in the markets. The merchandising and marketing team keeps
itself abreast of the latest fashion trends across the world. Each
merchandiser specialises in a different product line of the Company.
Franchise model - key to the success story
The Company opened its first exclusive brand outlet “Koutons” in
2000 and has moved on to a total of 1,149 outlets (Charlie Outlaw
outlets included) by 15th December 2007. This gigantic increase in the
number of outlets for the Company was possible only through strong
focus on the franchise model.
Three Retail models used by the Company:
(1) COCO (Company owned Company operated);
(2) COFO (Company owned franchise operated); and
(3) FOFO (Franchise owned Franchise operated).
The Company banked on the FOFO model to roll-out 86% of the
stores. Only 2% of the total stores are COCO and the rest are COFO
stores.
Strategy
Indian Retail Research Report
June 19, 2008
Indian Retail Sector -April 2008
24 Global Equity Research – India
Under COFO/FOFO model, the Company bears only the promotion
and advertising expenses and the rest of the expenses including,
operating and staffing expenses, taxation returns etc are borne by
the franchisee.
The franchisee has to pay security deposit (Rs.5 – Rs.10 Lakh) to the
Company for obtaining the rights to open the retail outlet.The
Company is liable to pay interest on the security deposit. Depending
on the volume of sales generated, the franchisee receives commission
or minimum guarantee whichever is higher as consideration. The
company has nine-year franchise agreement where the franchisees
are disallowed to exit for the said period. However, the Company can
close the stores at its own discretion.
Coco store plans
Going forward, the Company plans to increase the share of the COCO
stores as it plans to add larger format flagship stores in 38 cities.
Over the next two years, 120 such stores will be added with store
sizes ranging from 3,000-5,000 square feet. These stores will act as a
one stop shop for the entire family as it will include all the products
range of the Company.
To save on paying higher rentals, the Company plans to open
different stores in the same shopping mall. For example, the ground
floor could be booked for women’s wear while the first floor for Men’s
wear and the basement for kids wear. This would average out the
rental costs of the Company as rentals vary on different floors.
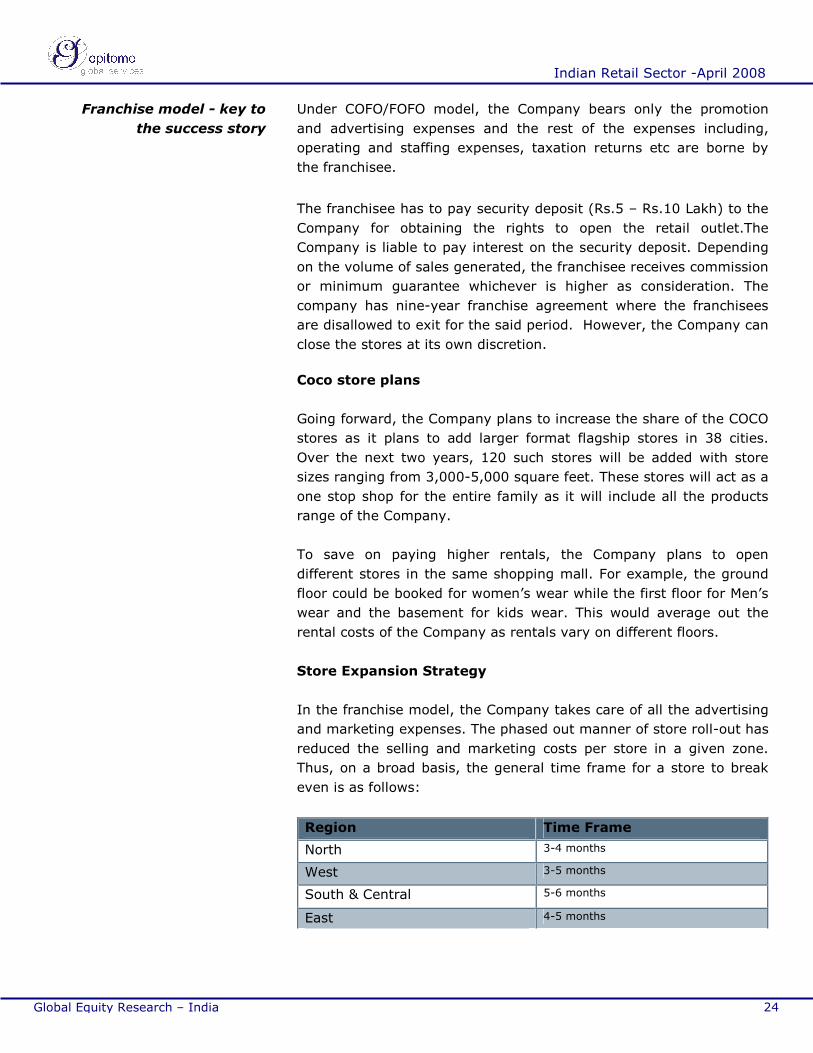
Store Expansion Strategy
In the franchise model, the Company takes care of all the advertising
and marketing expenses. The phased out manner of store roll-out has
reduced the selling and marketing costs per store in a given zone.
Thus, on a broad basis, the general time frame for a store to break
even is as follows:
Region Time Frame
North 3-4 months
West 3-5 months
South & Central 5-6 months
East 4-5 months
Franchise model - key to
the success story
Indian Retail Research Report
June 19, 2008
Indian Retail Sector -April 2008
25 Global Equity Research – India
The break even point for a Franchise operated store is at the level
when the Company is able to recover the minimum guarantee
payment made on a monthly basis and the selling and advertising
expenses for a region.
In the rising rental costs scenario to keep the franchisees motivated,
the company either increases the minimum guarantee to incorporate
increased rentals or creates sales target slabs which offer incremental
commission rate.
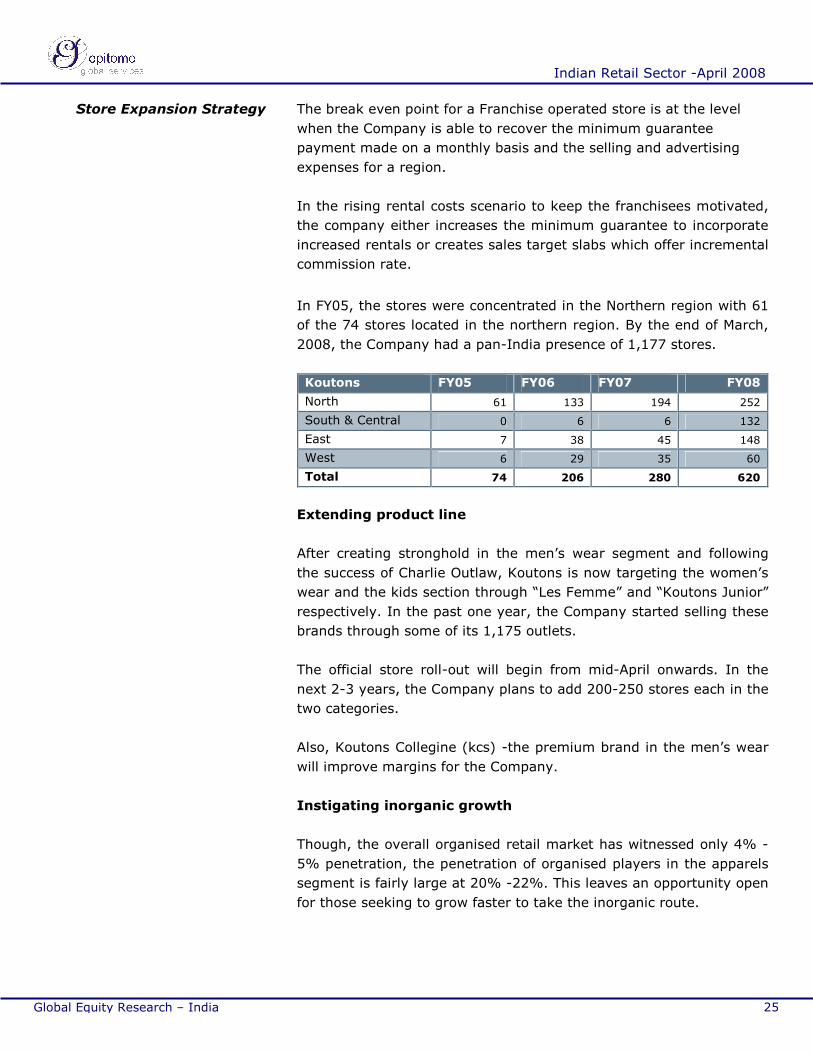
In FY05, the stores were concentrated in the Northern region with 61
of the 74 stores located in the northern region. By the end of March,
2008, the Company had a pan-India presence of 1,177 stores.
Koutons FY05 FY06 FY07 FY08
North 61 133 194 252
South & Central 0 6 6 132
East 7 38 45 148
West 6 29 35 60
Total 74 206 280 620
Extending product line
After creating stronghold in the men’s wear segment and following
the success of Charlie Outlaw, Koutons is now targeting the women’s
wear and the kids section through “Les Femme” and “Koutons Junior”
respectively. In the past one year, the Company started selling these
brands through some of its 1,175 outlets.
The official store roll-out will begin from mid-April onwards. In the
next 2-3 years, the Company plans to add 200-250 stores each in the
two categories.
Also, Koutons Collegine (kcs) -the premium brand in the men’s wear
will improve margins for the Company.
Instigating inorganic growth
Though, the overall organised retail market has witnessed only 4% -
5% penetration, the penetration of organised players in the apparels
segment is fairly large at 20% -22%. This leaves an opportunity open
for those seeking to grow faster to take the inorganic route.
Store Expansion Strategy
Indian Retail Research Report
June 19, 2008
Indian Retail Sector -April 2008
26 Global Equity Research – India
Koutons capitalised on one such opportunity available to acquire 51%
stake in Delhi-based Upper Class through its 100% subsidiary DBG
retail. Upper Class has strong presence in the ladies apparel segment.
This acquisition goes well with overall strategy of the Company
wherein the Company recently targeted the women’s segment. This
acquisition is expected to add Rs.170 million at the top line and 7 –
8% at net margin level.
The Upper Class has close to two decades of experience in the
women’s premium apparel segment. In the domestic market, Upper
Class has its own brand outlets in New Delhi, Jaipur, Ludhiana and
Vadodara. And it is available in multi brand outlets (mbos) such as
Globus, Piramyd, Shoppers Stop and Pantaloons.
In the export market, Upper Class supplies apparels to leading brands
in Europe such as Armand, Thiery, Class, F Ferra, Alcorpe English,
and is available in stores such as Splash and Lullu Center in the
Middle East under its signature brand Upper class.
Koutons plans to increase the domestic presence of Upper Class to
400 retail outlets by 2010. The Company’s pan-India presence and
franchising experience will facilitate Upper Class in procuring material
from domestic as well as international markets at reasonable prices.
Brand strategy
The Koutons stores are positioned for men’s formal wear range
targeting the 22-45 years age group. The average per store size
varies between 1,000-1,500 square feet. These stores are largely
located in Tier-I cities (roughly corresponding to state capitals and
important cities and Tier-II (roughly corresponding to district
headquarters) cities. At the end of March 2008, the store cont stood
at 620. The Company on an average earns 18%-18.5% margin on
Koutons stores with per store generating approximately Rs.1.2 crore
of revenues.
The Charlie Outlaw stores are positioned for casual wear that target
the 14-25 years of age group. The average per store size varies from
500-700 square feet. These stores are located in Tier II cities
(roughly corresponding to sub-district headquarters), Tier III cities
and Tier IV cities. This small format size of the stores helped the
Company in rolling out stores at an accelerated pace. Since the
launch of 104 stores in a single day in October 2006, the store count
now stands at 557 at the end of March 2008. On an average one
Instigating inorganic growth
Indian Retail Research Report
June 19, 2008
Indian Retail Sector -April 2008
27 Global Equity Research – India
Charlie outlaw
Store generates Rs. 0.5 – Rs. 0.6 million of revenue and margins
stands at 17% -18%
SCM
Both in the domestic and the international market, the Company
operates through intermediaries.
The Company procures raw materials from India, China, Taiwan and
Italy through third-party suppliers. In the next two years, the
Company plans to set-up offices at Hong Kong and Singapore to
eliminate the intermediaries.
In FY07, out of the total raw material procured, 28% was imported
and the rest was procured from domestic sources. The decision
making process of procuring raw materials is real time / live delayed
as Mr. B.S. Sawhney-Managing Director is involved in procurement of
raw materials.
For the movement of apparels from the warehouse to the ebos, the
Company is dependent on road transport and relies completely on
third-party transporters. In terms of costing and specialisation, the
regional transport companies are more competent and hence the
Company relies on them.
Considering the scale of operations, the Company is able to book
truckloads instead of booking the number of cartons. This reduces the
cost per carton for the Company.
For example, if the Company books place in the truck on the basis of
carton it would cost them around Rs.50 per carton while a truck with
a capacity of 1000 cartons would cost only Rs.22,000. Thus, cost per
carton comes down to Rs.22.
Brand strategy
Indian Retail Research Report
June 19, 2008
Indian Retail Sector -April 2008
28 Global Equity Research – India
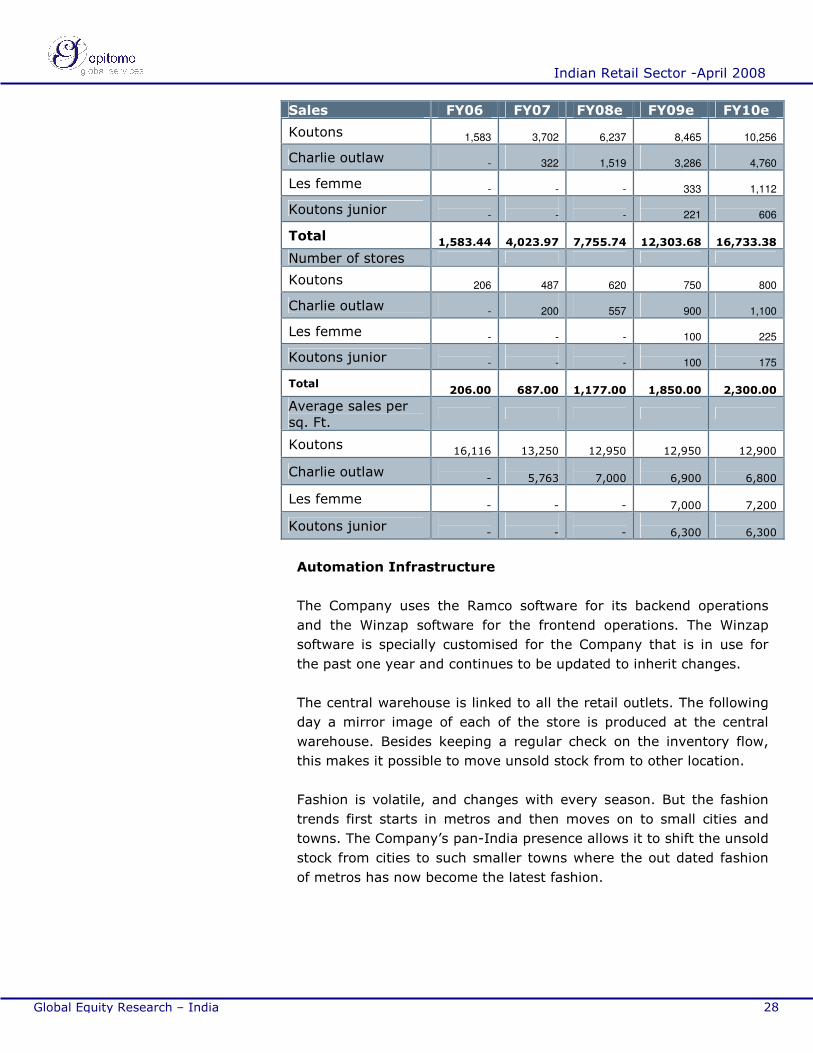
Sales FY06 FY07 FY08e FY09e FY10e
Koutons
1,583
3,702
6,237
8,465
10,256
Charlie outlaw
-
322
1,519
3,286
4,760
Les femme
-
-
-
333
1,112
Koutons junior
-
-
-
221
606
Total
1,583.44
4,023.97
7,755.74
12,303.68
16,733.38
Number of stores
Koutons
206
487
620
750
800
Charlie outlaw
-
200
557
900
1,100
Les femme
-
-
-
100
225
Koutons junior
-
-
-
100
175
Total
206.00
687.00
1,177.00
1,850.00
2,300.00
Average sales per sq. Ft.
Koutons
16,116
13,250
12,950
12,950
12,900
Charlie outlaw -
5,763
7,000
6,900
6,800
Les femme -
-
-
7,000
7,200
Koutons junior -
-
-
6,300
6,300
Automation Infrastructure
The Company uses the Ramco software for its backend operations
and the Winzap software for the frontend operations. The Winzap
software is specially customised for the Company that is in use for
the past one year and continues to be updated to inherit changes.
The central warehouse is linked to all the retail outlets. The following
day a mirror image of each of the store is produced at the central
warehouse. Besides keeping a regular check on the inventory flow,
this makes it possible to move unsold stock from to other location.
Fashion is volatile, and changes with every season. But the fashion
trends first starts in metros and then moves on to small cities and
towns. The Company’s pan-India presence allows it to shift the unsold
stock from cities to such smaller towns where the out dated fashion
of metros has now become the latest fashion.
Indian Retail Research Report
June 19, 2008
Indian Retail Sector -April 2008
29 Global Equity Research – India
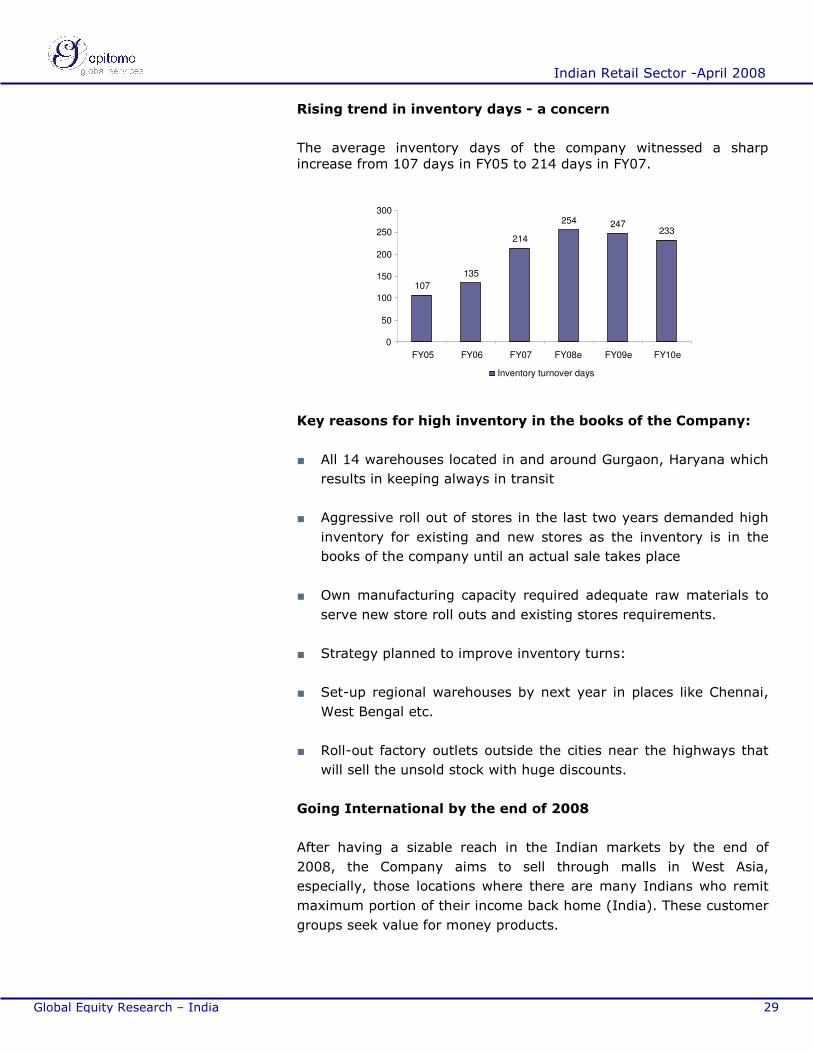
Rising trend in inventory days - a concern
The average inventory days of the company witnessed a sharp increase from 107 days in FY05 to 214 days in FY07.
107 135
214
254 247 233
0
50
100
150
200
250
300
FY05 FY06 FY07 FY08e FY09e FY10e
Inventory turnover days
Key reasons for high inventory in the books of the Company:
■ All 14 warehouses located in and around Gurgaon, Haryana which
results in keeping always in transit
■ Aggressive roll out of stores in the last two years demanded high
inventory for existing and new stores as the inventory is in the
books of the company until an actual sale takes place
■ Own manufacturing capacity required adequate raw materials to
serve new store roll outs and existing stores requirements.
■ Strategy planned to improve inventory turns:
■ Set-up regional warehouses by next year in places like Chennai,
West Bengal etc.
■ Roll-out factory outlets outside the cities near the highways that
will sell the unsold stock with huge discounts.
Going International by the end of 2008
After having a sizable reach in the Indian markets by the end of
2008, the Company aims to sell through malls in West Asia,
especially, those locations where there are many Indians who remit
maximum portion of their income back home (India). These customer
groups seek value for money products.
Indian Retail Research Report
June 19, 2008
Indian Retail Sector -April 2008
30 Global Equity Research – India
Also, “Upper Class” already has presence in Europe and Middle East.
The Company initially plan to supply to other stores – both to test the
markets and to create brand visibility and eventually open their
stores in those areas.
In India, the Company has booked space for 240 stores in mall areas
with an average carpet area of 800-900 sq.ft. The Company will open
200 stores of all formats during April 15-May 15.
Financial performance
Strong Revenue growth – 135% CAGR in 3 years
In the past three years, the Company grew at a CAGR of 134.85%
and generated revenues of Rs.4,023.97 million in FY07. This growth
is largely attributable to aggressive expansion strategy adopted by
the Company. The region-wise contribution to percentage sales
growth is depicted from the following table:
Zonal Break-up (%) FY06 FY07 FY08
North 174.75 84.43 32.15
South & Central - 197.95 185.11
East 1074.85 264.60 58.23
West 304.00 285.00 45.84
*No comparable data available for FY06
This clearly implies that the growth in the Northern region is
maturing. The other regions continue to show high growth backed by
increased penetration.
In the Southern and Central region the store count has significantly
moved up from 6 to 132 which support the triple-digit sales growth.
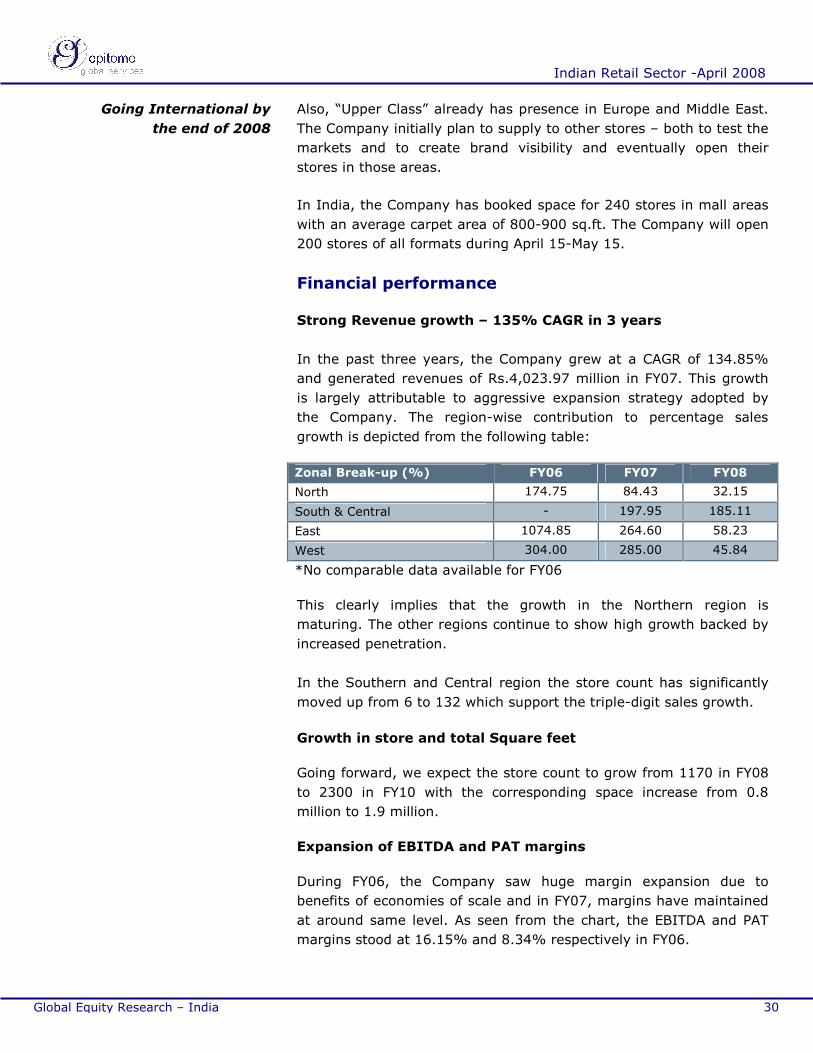
Growth in store and total Square feet
Going forward, we expect the store count to grow from 1170 in FY08
to 2300 in FY10 with the corresponding space increase from 0.8
million to 1.9 million.
Expansion of EBITDA and PAT margins
During FY06, the Company saw huge margin expansion due to
benefits of economies of scale and in FY07, margins have maintained
at around same level. As seen from the chart, the EBITDA and PAT
margins stood at 16.15% and 8.34% respectively in FY06.
Going International by
the end of 2008
Indian Retail Research Report
June 19, 2008
Indian Retail Sector -April 2008
31 Global Equity Research – India
Though at EBITDA levels the margins improved by 131 bps, at PAT
level it was almost flat at 8.57%.
74 206 687
1177
1850
2950 2660
2300
0
500
1000
1500
2000
2500
3000
FY05 FY06 FY07 FY08e FY09e FY10e FY11e FY12e
Sq.Ft
0
500
1000
1500
2000
2500
3000
3500
no. of stores
Total Square Feet (thousands) No. of stores
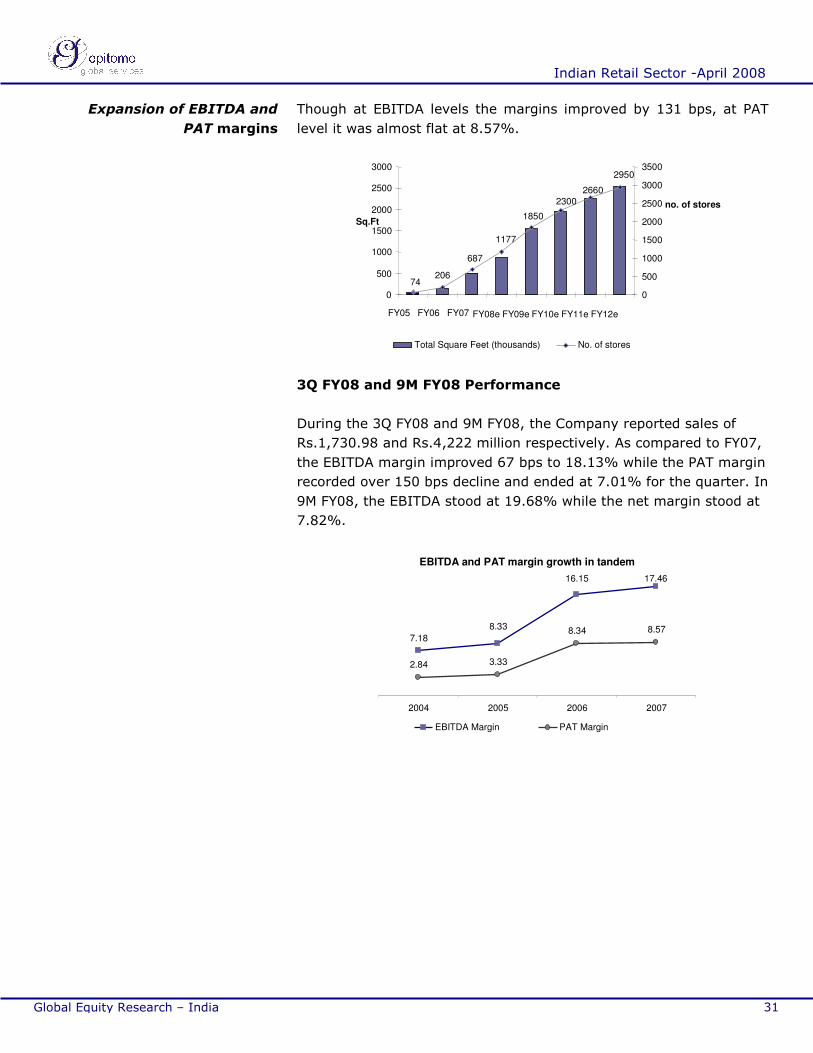
3Q FY08 and 9M FY08 Performance
During the 3Q FY08 and 9M FY08, the Company reported sales of
Rs.1,730.98 and Rs.4,222 million respectively. As compared to FY07,
the EBITDA margin improved 67 bps to 18.13% while the PAT margin
recorded over 150 bps decline and ended at 7.01% for the quarter. In
9M FY08, the EBITDA stood at 19.68% while the net margin stood at
7.82%.
EBITDA and PAT margin growth in tandem
7.18 8.33
16.15
2.84 3.33
8.34 8.57
17.46
2004 2005 2006 2007
EBITDA Margin PAT Margin
Expansion of EBITDA and
PAT margins
Indian Retail Research Report
June 19, 2008
Indian Retail Sector -April 2008
32 Global Equity Research – India
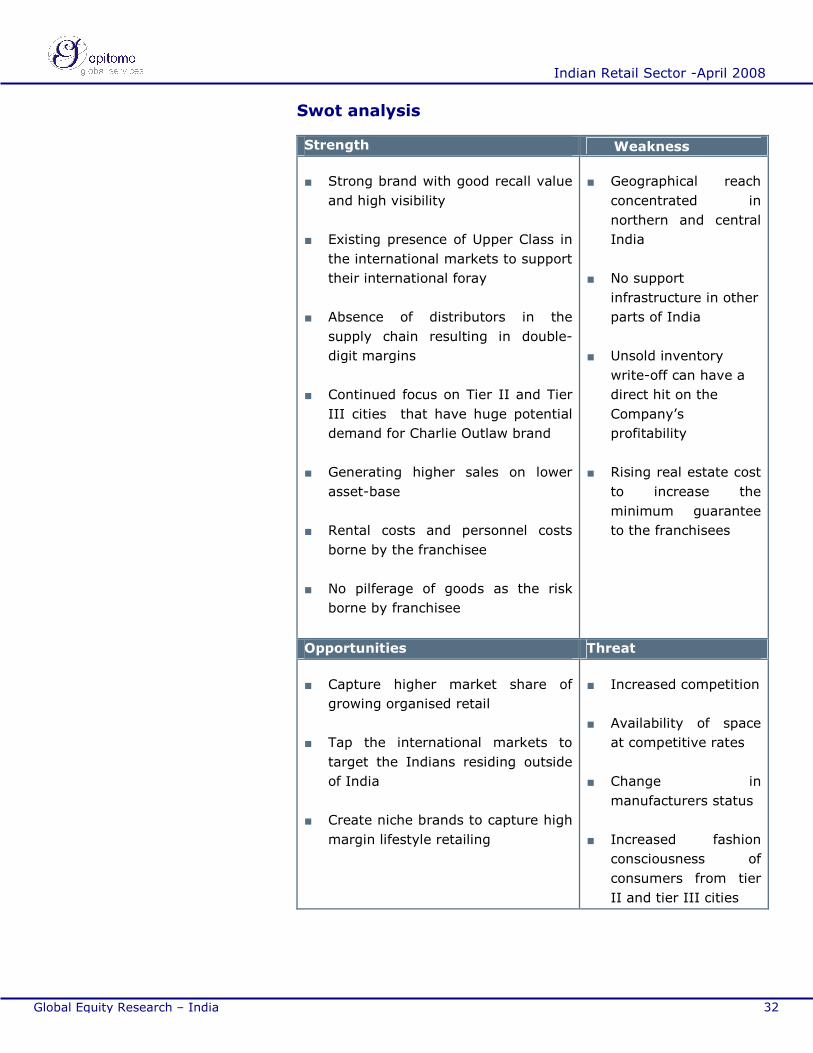
Swot analysis
Strength Weakness
■ Strong brand with good recall value
and high visibility
■ Existing presence of Upper Class in
the international markets to support
their international foray
■ Absence of distributors in the
supply chain resulting in double-
digit margins
■ Continued focus on Tier II and Tier
III cities that have huge potential
demand for Charlie Outlaw brand
■ Generating higher sales on lower
asset-base
■ Rental costs and personnel costs
borne by the franchisee
■ No pilferage of goods as the risk
borne by franchisee
■ Geographical reach
concentrated in
northern and central
India
■ No support
infrastructure in other
parts of India
■ Unsold inventory
write-off can have a
direct hit on the
Company’s
profitability
■ Rising real estate cost
to increase the
minimum guarantee
to the franchisees
Opportunities Threat
■ Capture higher market share of
growing organised retail
■ Tap the international markets to
target the Indians residing outside
of India
■ Create niche brands to capture high
margin lifestyle retailing
■ Increased competition
■ Availability of space
at competitive rates
■ Change in
manufacturers status
■ Increased fashion
consciousness of
consumers from tier
II and tier III cities
Indian Retail Research Report
June 19, 2008
Indian Retail Sector -April 2008
33 Global Equity Research – India
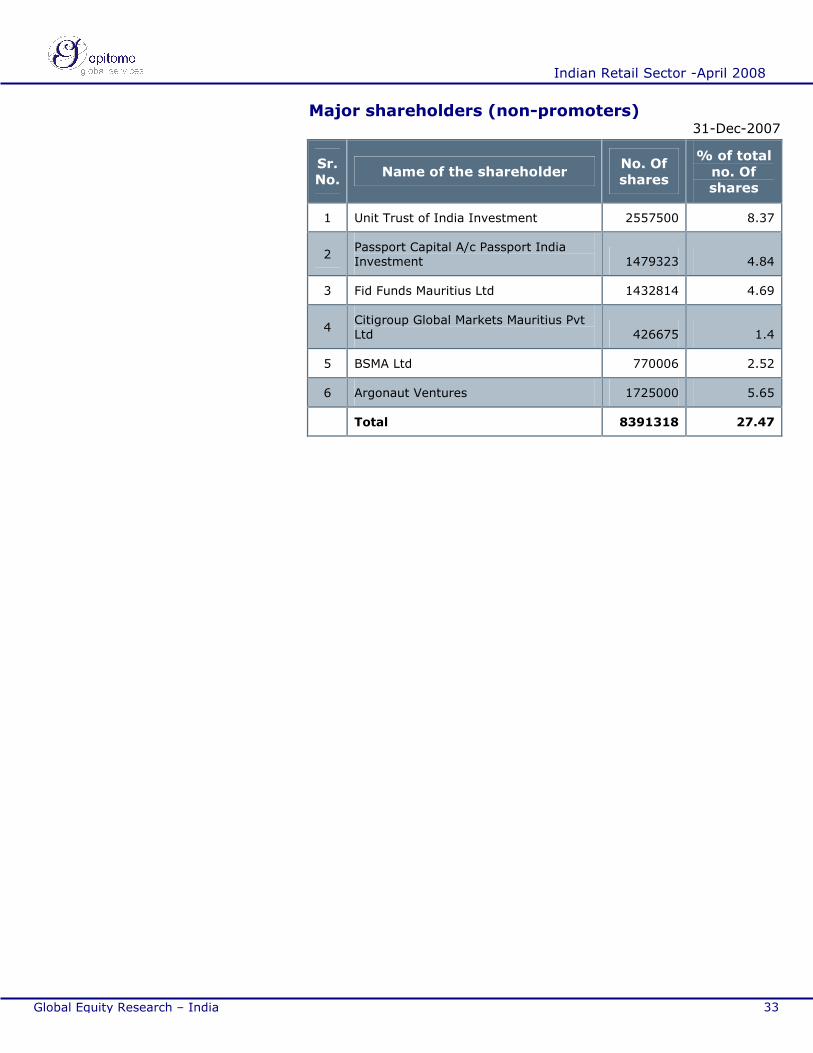
Major shareholders (non-promoters) 31-Dec-2007
Sr.
No. Name of the shareholder
No. Of
shares
% of total
no. Of shares
1 Unit Trust of India Investment 2557500 8.37
2 Passport Capital A/c Passport India Investment 1479323 4.84
3 Fid Funds Mauritius Ltd 1432814 4.69
4 Citigroup Global Markets Mauritius Pvt Ltd 426675 1.4
5 BSMA Ltd 770006 2.52
6 Argonaut Ventures 1725000 5.65
Total 8391318 27.47
Indian Retail Research Report
June 19, 2008
Indian Retail Sector -April 2008
34 Global Equity Research – India
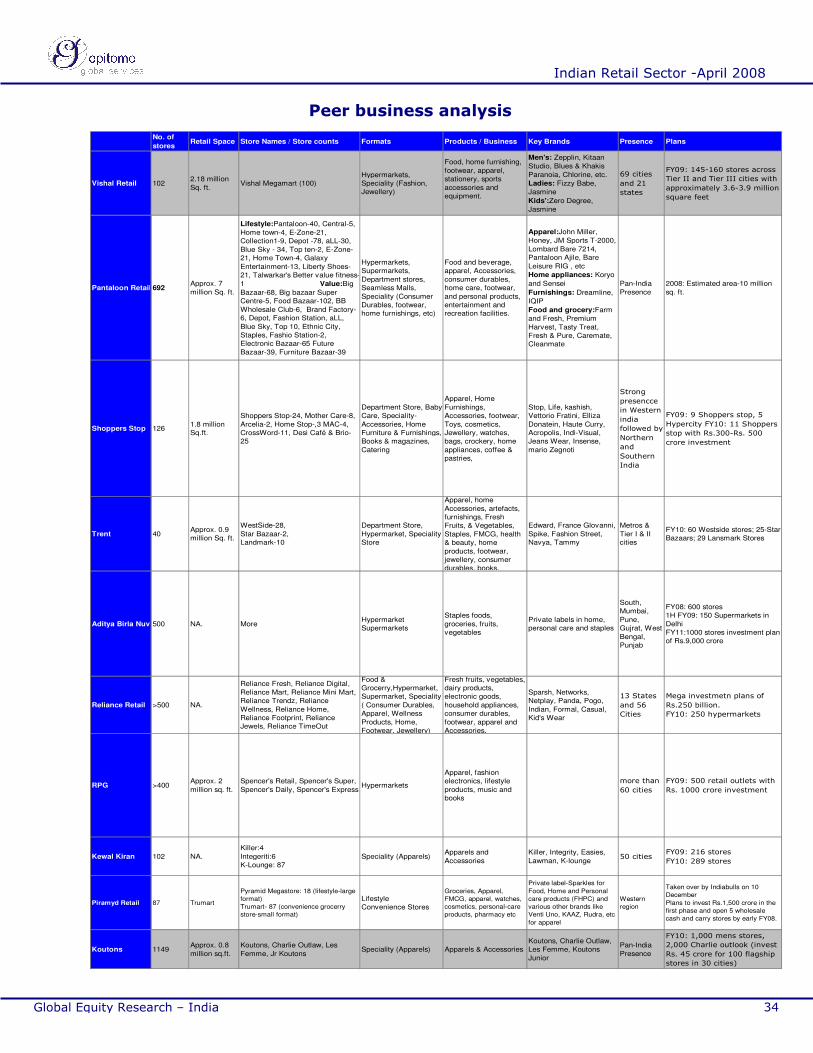
Peer business analysis
No. of
storesRetail Space Store Names / Store counts Formats Products / Business Key Brands Presence Plans
Vishal Retail 1022.18 million
Sq. ft.Vishal Megamart (100)
Hypermarkets,
Speciality (Fashion,
Jewellery)
Food, home furnishing,
footwear, apparel,
stationery, sports
accessories and
equipment.
Men's: Zepplin, Kitaan
Studio, Blues & Khakis
Paranoia, Chlorine, etc.
Ladies: Fizzy Babe,
Jasmine
Kids':Zero Degree,
Jasmine
69 cities
and 21
states
FY09: 145-160 stores across
Tier II and Tier III cities with
approximately 3.6-3.9 million
square feet
Pantaloon Retail 692Approx. 7
million Sq. ft.
Lifestyle:Pantaloon-40, Central-5,
Home town-4, E-Zone-21,
Collection1-9, Depot -78, aLL-30,
Blue Sky - 34, Top ten-2, E-Zone-
21, Home Town-4, Galaxy
Entertainment-13, Liberty Shoes-
21, Talwarkar's Better value fitness-
1 Value:Big
Bazaar-68, Big bazaar Super
Centre-5, Food Bazaar-102, BB
Wholesale Club-6, Brand Factory-
6, Depot, Fashion Station, aLL,
Blue Sky, Top 10, Ethnic City,
Staples, Fashio Station-2,
Electronic Bazaar-65 Future
Bazaar-39, Furniture Bazaar-39
Hypermarkets,
Supermarkets,
Department stores,
Seamless Malls,
Speciality (Consumer
Durables, footwear,
home furnishings, etc)
Food and beverage,
apparel, Accessories,
consumer durables,
home care, footwear,
and personal products,
entertainment and
recreation facilities.
Apparel:John Miller,
Honey, JM Sports T-2000,
Lombard Bare 7214,
Pantaloon Ajile, Bare
Leisure RIG , etc
Home appliances: Koryo
and Sensei
Furnishings: Dreamline,
IQIP
Food and grocery:Farm
and Fresh, Premium
Harvest, Tasty Treat,
Fresh & Pure, Caremate,
Cleanmate
Pan-India
Presence
2008: Estimated area-10 million
sq. ft.
Shoppers Stop 1261.8 million
Sq.ft.
Shoppers Stop-24, Mother Care-8,
Arcelia-2, Home Stop-,3 MAC-4,
CrossWord-11, Desi Café & Brio-
25
Department Store, Baby
Care, Speciality-
Accessories, Home
Furniture & Furnishings,
Books & magazines,
Catering
Apparel, Home
Furnishings,
Accessories, footwear,
Toys, cosmetics,
Jewellery, watches,
bags, crockery, home
appliances, coffee &
pastries,
Stop, Life, kashish,
Vettorio Fratini, Elliza
Donatein, Haute Curry,
Acropolis, Indi-Visual,
Jeans Wear, Insense,
mario Zegnoti
Strong
presencce
in Western
india
followed by
Northern
and
Southern
India
FY09: 9 Shoppers stop, 5
Hypercity FY10: 11 Shoppers
stop with Rs.300-Rs. 500
crore investment
Trent 40Approx. 0.9
million Sq. ft.
WestSide-28,
Star Bazaar-2,
Landmark-10
Department Store,
Hypermarket, Speciality
Store
Apparel, home
Accessories, artefacts,
furnishings, Fresh
Fruits, & Vegetables,
Staples, FMCG, health
& beauty, home
products, footwear,
jewellery, consumer
durables, books,
Edward, France Glovanni,
Spike, Fashion Street,
Navya, Tammy
Metros &
Tier I & II
cities
FY10: 60 Westside stores; 25-Star
Bazaars; 29 Lansmark Stores
Aditya Birla Nuvo500 NA. MoreHypermarket
Supermarkets
Staples foods,
groceries, fruits,
vegetables
Private labels in home,
personal care and staples
South,
Mumbai,
Pune,
Gujrat, West
Bengal,
Punjab
FY08: 600 stores
1H FY09: 150 Supermarkets in
Delhi
FY11:1000 stores investment plan
of Rs.9,000 crore
Reliance Retail >500 NA.
Reliance Fresh, Reliance Digital,
Reliance Mart, Reliance Mini Mart,
Reliance Trendz, Reliance
Wellness, Reliance Home,
Reliance Footprint, Reliance
Jewels, Reliance TimeOut
Food &
Grocerry,Hypermarket,
Supermarket, Speciality
( Consumer Durables,
Apparel, Wellness
Products, Home,
Footwear, Jewellery)
Fresh fruits, vegetables,
dairy products,
electronic goods,
household appliances,
consumer durables,
footwear, apparel and
Accessories,
Sparsh, Networks,
Netplay, Panda, Pogo,
Indian, Formal, Casual,
Kid's Wear
13 States
and 56
Cities
Mega investmetn plans of
Rs.250 billion.
FY10: 250 hypermarkets
RPG >400Approx. 2
million sq. ft.
Spencer's Retail, Spencer's Super,
Spencer's Daily, Spencer's ExpressHypermarkets
Apparel, fashion
electronics, lifestyle
products, music and
books
more than
60 cities
FY09: 500 retail outlets with
Rs. 1000 crore investment
Kewal Kiran 102 NA.
Killer:4
Integeriti:6
K-Lounge: 87
Speciality (Apparels)Apparels and
Accessories
Killer, Integrity, Easies,
Lawman, K-lounge50 cities
FY09: 216 stores
FY10: 289 stores
Piramyd Retail 87 Trumart
Pyramid Megastore: 18 (lifestyle-large
format)
Trumart- 87 (convenience grocerry
store-small format)
Lifestyle
Convenience Stores
Groceries, Apparel,
FMCG, apparel, watches,
cosmetics, personal-care
products, pharmacy etc
Private label-Sparkles for
Food, Home and Personal
care products (FHPC) and
various other brands like
Venti Uno, KAAZ, Rudra, etc
for apparel
Western
region
Taken over by Indiabulls on 10
December
Plans to invest Rs.1,500 crore in the
first phase and open 5 wholesale
cash and carry stores by early FY08.
Koutons 1149Approx. 0.8
million sq.ft.
Koutons, Charlie Outlaw, Les
Femme, Jr KoutonsSpeciality (Apparels) Apparels & Accessories
Koutons, Charlie Outlaw,
Les Femme, Koutons
Junior
Pan-India
Presence
FY10: 1,000 mens stores,
2,000 Charlie outlook (invest
Rs. 45 crore for 100 flagship
stores in 30 cities)
Indian Retail Research Report
June 19, 2008
Indian Retail Sector -April 2008
35 Global Equity Research – India
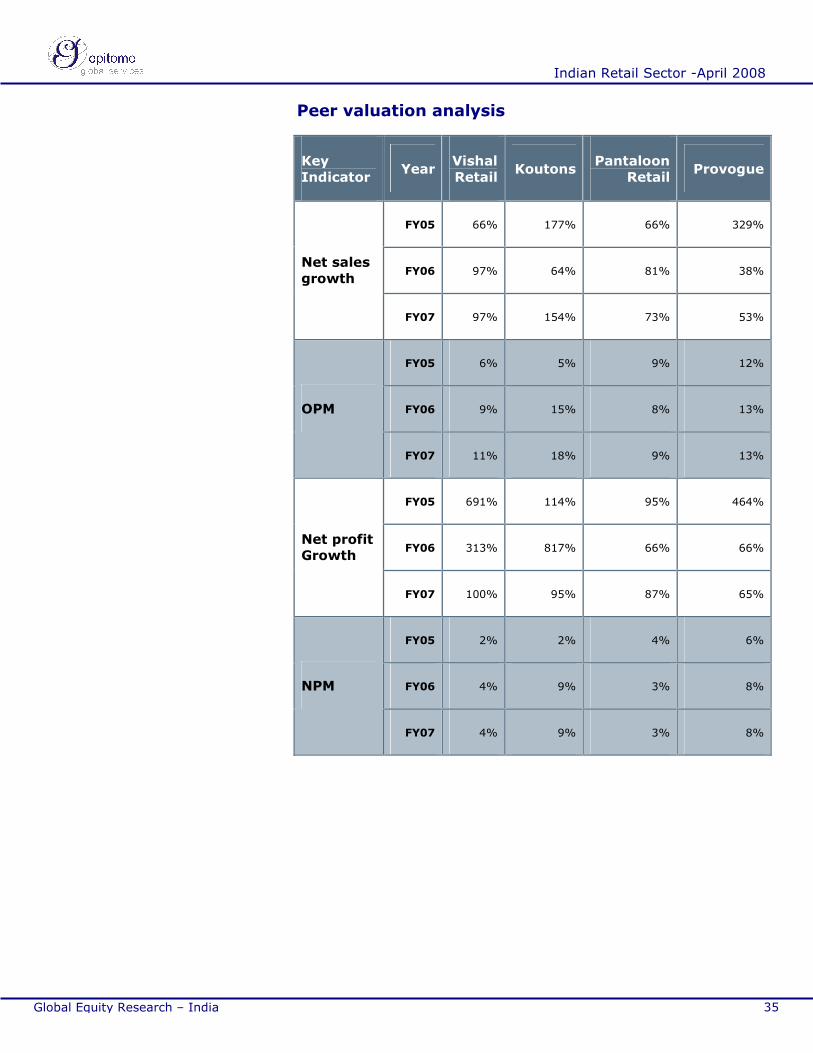
Peer valuation analysis
Key
Indicator Year
Vishal
Retail Koutons
Pantaloon
Retail Provogue
FY05 66% 177% 66% 329%
FY06 97% 64% 81% 38% Net sales
growth
FY07 97% 154% 73% 53%
FY05 6% 5% 9% 12%
FY06 9% 15% 8% 13% OPM
FY07 11% 18% 9% 13%
FY05 691% 114% 95% 464%
FY06 313% 817% 66% 66% Net profit
Growth
FY07 100% 95% 87% 65%
FY05 2% 2% 4% 6%
FY06 4% 9% 3% 8% NPM
FY07 4% 9% 3% 8%
Indian Retail Research Report
June 19, 2008
Indian Retail Sector -April 2008
36 Global Equity Research – India
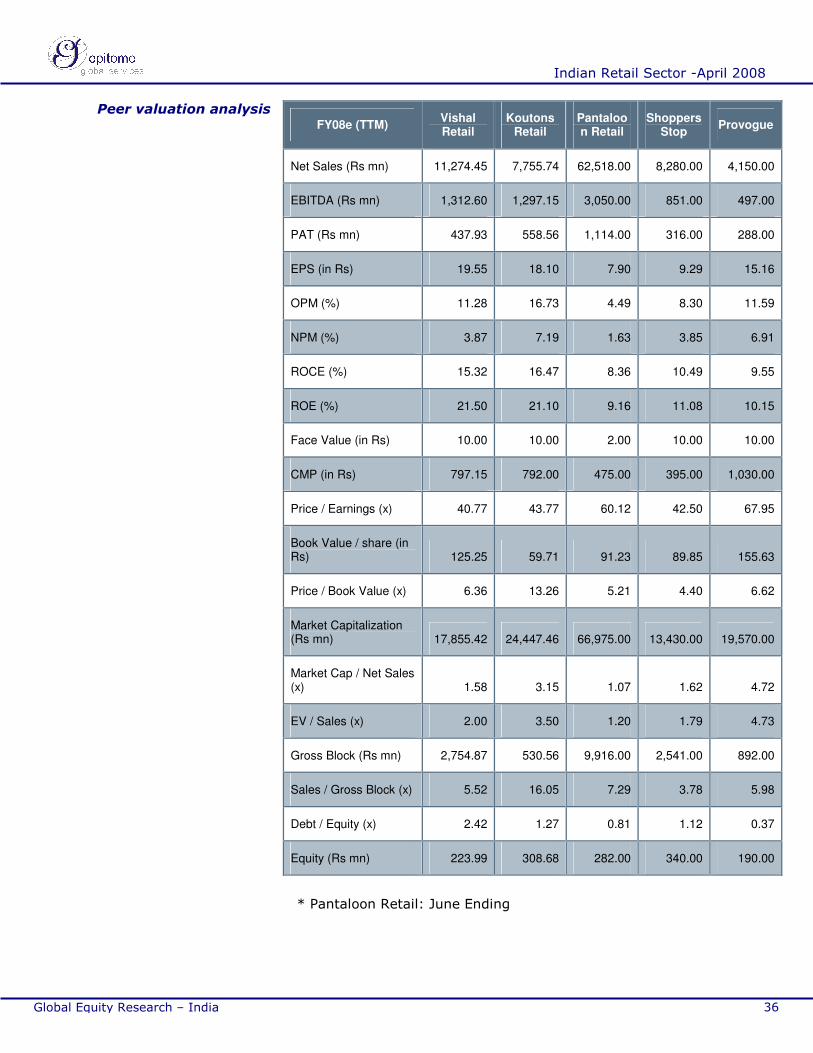
FY08e (TTM) Vishal Retail
Koutons Retail
Pantaloon Retail
Shoppers Stop
Provogue
Net Sales (Rs mn) 11,274.45 7,755.74 62,518.00 8,280.00 4,150.00
EBITDA (Rs mn) 1,312.60 1,297.15 3,050.00 851.00 497.00
PAT (Rs mn) 437.93 558.56 1,114.00 316.00 288.00
EPS (in Rs) 19.55 18.10 7.90 9.29 15.16
OPM (%) 11.28 16.73 4.49 8.30 11.59
NPM (%) 3.87 7.19 1.63 3.85 6.91
ROCE (%) 15.32 16.47 8.36 10.49 9.55
ROE (%) 21.50 21.10 9.16 11.08 10.15
Face Value (in Rs) 10.00 10.00 2.00 10.00 10.00
CMP (in Rs) 797.15 792.00 475.00 395.00 1,030.00
Price / Earnings (x) 40.77 43.77 60.12 42.50 67.95
Book Value / share (in Rs) 125.25 59.71 91.23 89.85 155.63
Price / Book Value (x) 6.36 13.26 5.21 4.40 6.62
Market Capitalization (Rs mn) 17,855.42 24,447.46 66,975.00 13,430.00 19,570.00
Market Cap / Net Sales (x) 1.58 3.15 1.07 1.62 4.72
EV / Sales (x) 2.00 3.50 1.20 1.79 4.73
Gross Block (Rs mn) 2,754.87 530.56 9,916.00 2,541.00 892.00
Sales / Gross Block (x) 5.52 16.05 7.29 3.78 5.98
Debt / Equity (x) 2.42 1.27 0.81 1.12 0.37
Equity (Rs mn) 223.99 308.68 282.00 340.00 190.00
* Pantaloon Retail: June Ending
Peer valuation analysis
Indian Retail Research Report
June 19, 2008
Indian Retail Sector -April 2008
37 Global Equity Research – India
Though Pantaloon Retails’ sales dwarf the sales of both Vishal retail
and Koutons it clearly suggests the kind of potential growth
opportunity available in India.
Leveraging on the strength of the franchise model, Koutons retail has
been able to generate the highest margins both at the operating and
net levels.
Vishal Retail’s operating level margin compares well with Provogue
but the product offering in the FMCG and non apparel categories
along with massive investment lined up by the company puts
pressure on net margins that stand at lower-single digit levels.
However, ROCE and ROE for both Vishal Retail and Koutons makes
them a promising investment opportunity.
Koutons price to book value and sales to gross block is the highest
among its peers as the company derives its sales on a very low asset
base of rs.705.98 million.
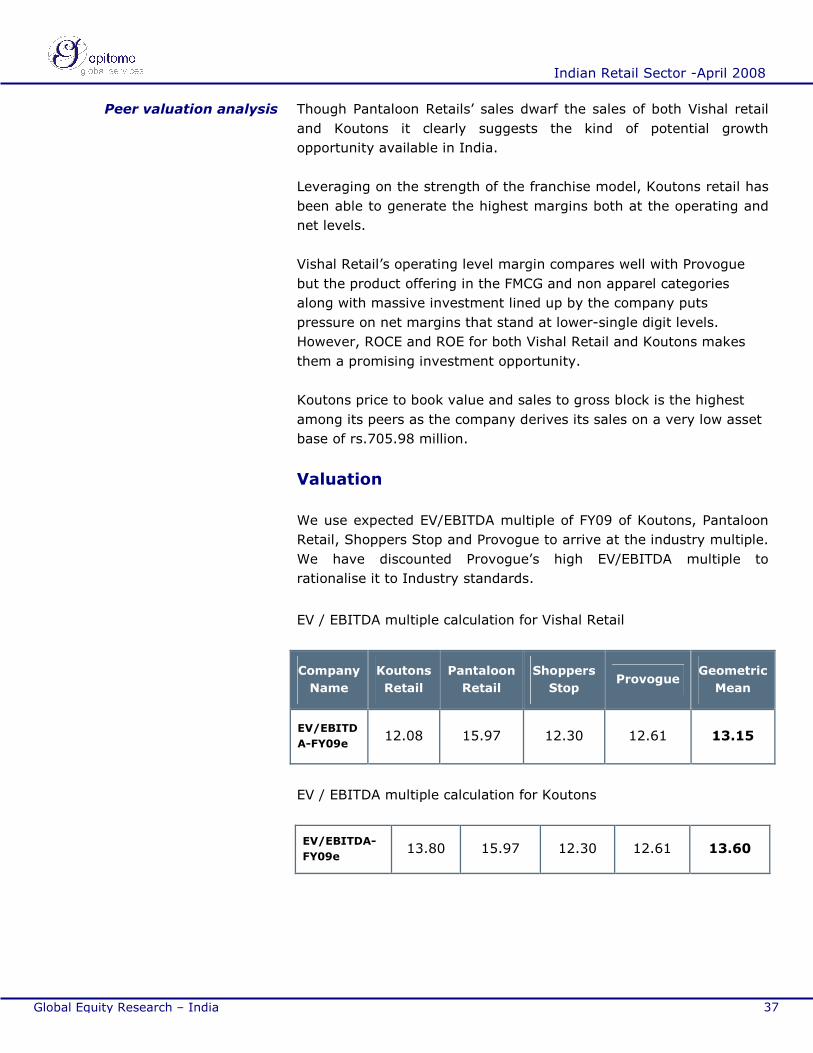
Valuation
We use expected EV/EBITDA multiple of FY09 of Koutons, Pantaloon
Retail, Shoppers Stop and Provogue to arrive at the industry multiple.
We have discounted Provogue’s high EV/EBITDA multiple to
rationalise it to Industry standards.
EV / EBITDA multiple calculation for Vishal Retail
Company
Name
Koutons
Retail
Pantaloon
Retail
Shoppers
Stop Provogue
Geometric
Mean
EV/EBITD
A-FY09e 12.08 15.97 12.30 12.61 13.15
EV / EBITDA multiple calculation for Koutons
EV/EBITDA-
FY09e 13.80 15.97 12.30 12.61 13.60
Peer valuation analysis
Indian Retail Research Report
June 19, 2008
Indian Retail Sector -April 2008
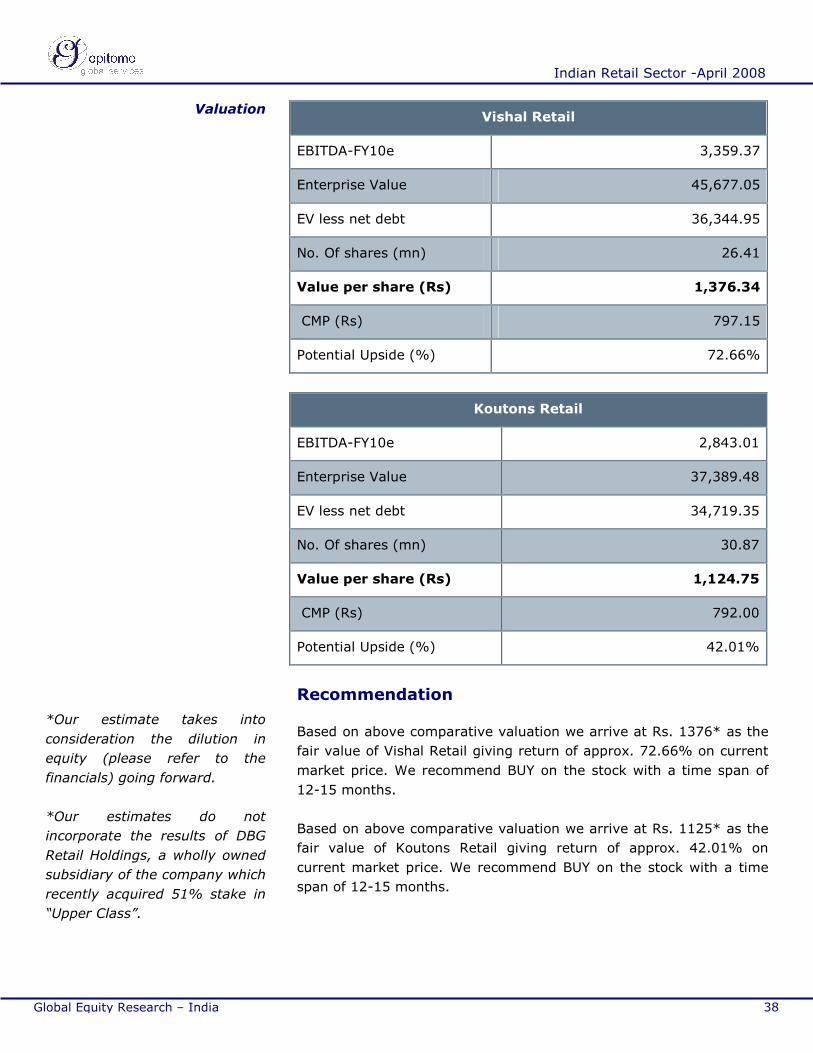
38 Global Equity Research – India
Vishal Retail
EBITDA-FY10e 3,359.37
Enterprise Value 45,677.05
EV less net debt 36,344.95
No. Of shares (mn) 26.41
Value per share (Rs) 1,376.34
CMP (Rs) 797.15
Potential Upside (%) 72.66%
Koutons Retail
EBITDA-FY10e 2,843.01
Enterprise Value 37,389.48
EV less net debt 34,719.35
No. Of shares (mn) 30.87
Value per share (Rs) 1,124.75
CMP (Rs) 792.00
Potential Upside (%) 42.01%
Recommendation
Based on above comparative valuation we arrive at Rs. 1376* as the
fair value of Vishal Retail giving return of approx. 72.66% on current
market price. We recommend BUY on the stock with a time span of
12-15 months.
Based on above comparative valuation we arrive at Rs. 1125* as the
fair value of Koutons Retail giving return of approx. 42.01% on
current market price. We recommend BUY on the stock with a time
span of 12-15 months.
*Our estimate takes into
consideration the dilution in
equity (please refer to the
financials) going forward.
*Our estimates do not
incorporate the results of DBG
Retail Holdings, a wholly owned
subsidiary of the company which
recently acquired 51% stake in
“Upper Class”.
Valuation
Indian Retail Research Report
June 19, 2008
Indian Retail Sector -April 2008
39 Global Equity Research – India
Risk & concerns
Vishal retail
Competition risk
The huge investments being planned in the booming retail sector will
result in increased competition. Although the organized retail
presently accounts for only 4% of total retail, their strong presence in
Tier I cities and now their expansion in smaller cities will beef-up
competition.
As a matter of fact, Reliance and Big Bazaar have big plans to
increase the number of stores in NCR region where Vishal retail have
strong presence.
In FY07, the Company derived 62% of its revenues from the Northern
block.
This can affect the same store sales and profitability of the Company
as the existing and potential customers have more choice and the
winner will eventually be the one who is closer to the consumer and
sells at competitive prices.
Execution risk
During FY08, the Company has been able to shore up its store count
to 100 from 49 in FY07.
Also, alone in the March quarter the Company added 18 stores to
meet the targeted store roll-out of 100 for FY08. However going
forward, the store openings may be delayed due to lack of suitable
space and infrastructure bottlenecks.
Supply chain management risk
The Company’s aggressive store roll-out strategy demands a strong
logistics and distribution facilities in place.
So far the Company has been able to post strong performance thanks
to fleet of 60 trucks owned by the Company and 30 warehouses in 9
cities.
Indian Retail Research Report
June 19, 2008
Indian Retail Sector -April 2008
40 Global Equity Research – India
Also, the Company’s wholly owned subsidiary “Vishal Retail Movers
Ltd” for which the Company already has set-up a team will be an
added advantage.
Fashion risk
The Company generated 63% of its revenue during FY07 through
Apparels. Thus, any change in fashion has its direct impact on the
sales for the Company.
Vishal retail can mitigate this risk by manufacturing the apparels in its
manufacturing plants at Delhi and Dehradun. The Company also has
an in-house team of 40-50 designers.
Rising rental costs
For a retail chain, lease rentals normally accounts for 7 – 8% of
revenue. The location of the Vishal retail stores away from mall areas
in standalone buildings has kept their lease rentals low. In FY07, the
rentals as a percent of sales stood at 5.4%.
The Company continues to maintain focus in tier III cities like
Haldwani, Patiala, Jalandhar, Jammu, Panchkula, Hissar, Bhilwara,
Bikaner, Baddi etc, where rentals per sq. Ft. Is comparatively lower.
This strategy mitigates the risk of high rentals for the Company.
Koutons retail
Execution risk
The Company’s execution capabilities can be easily gauged from the
fact that the number of stores in each of the Koutons and Charlie
Outlaw Brand has grown manifold. From a modest store count of 74
in FY05, the number of stores has grown to 1,177 in FY08.
Any delay in the store roll out can directly impact the future revenues
of the Company.
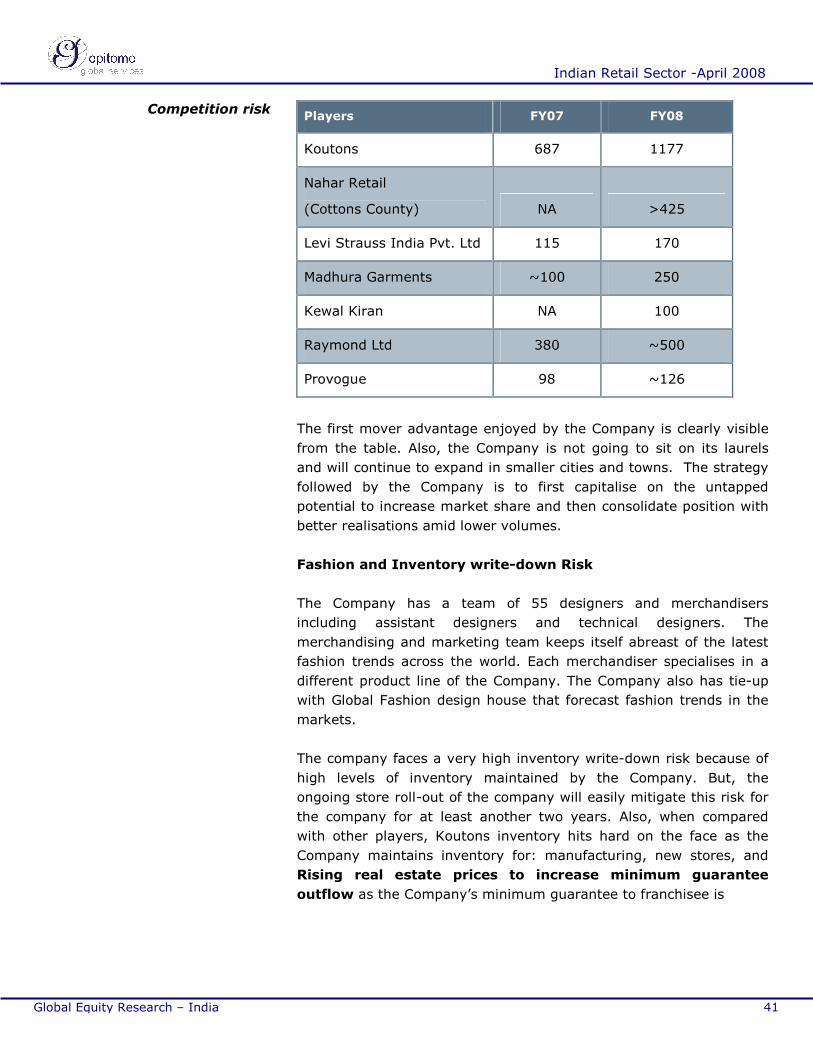
Competition risk
Koutons lead the race in terms of store count. The kind of competition
faced by the Company is visible from the following table:
Supply chain
management risk
Indian Retail Research Report
June 19, 2008
Indian Retail Sector -April 2008
41 Global Equity Research – India
Players FY07 FY08
Koutons 687 1177
Nahar Retail
(Cottons County) NA >425
Levi Strauss India Pvt. Ltd 115 170
Madhura Garments ~100 250
Kewal Kiran NA 100
Raymond Ltd 380 ~500
Provogue 98 ~126
The first mover advantage enjoyed by the Company is clearly visible
from the table. Also, the Company is not going to sit on its laurels
and will continue to expand in smaller cities and towns. The strategy
followed by the Company is to first capitalise on the untapped
potential to increase market share and then consolidate position with
better realisations amid lower volumes.
Fashion and Inventory write-down Risk
The Company has a team of 55 designers and merchandisers
including assistant designers and technical designers. The
merchandising and marketing team keeps itself abreast of the latest
fashion trends across the world. Each merchandiser specialises in a
different product line of the Company. The Company also has tie-up
with Global Fashion design house that forecast fashion trends in the
markets.
The company faces a very high inventory write-down risk because of
high levels of inventory maintained by the Company. But, the
ongoing store roll-out of the company will easily mitigate this risk for
the company for at least another two years. Also, when compared
with other players, Koutons inventory hits hard on the face as the
Company maintains inventory for: manufacturing, new stores, and
Rising real estate prices to increase minimum guarantee
outflow as the Company’s minimum guarantee to franchisee is
Competition risk
Indian Retail Research Report
June 19, 2008
Indian Retail Sector -April 2008
42 Global Equity Research – India
dependent on the overall costs borne by the franchisee including the
rentals and salary payable to employees, the increase in real estate
costs has a direct impact on rentals payable by franchisee.
To mitigate this risk, the commission received by the franchisee is
made volume driven. Also, once a store is opened the company has
nine-year franchise agreement where the franchisees are disallowed
to exit for the said period. However, the Company can close the
stores at its own discretion.
Fashion and Inventory
write-down Risk
Indian Retail Research Report
June 19, 2008
Indian Retail Sector -April 2008
43 Global Equity Research – India
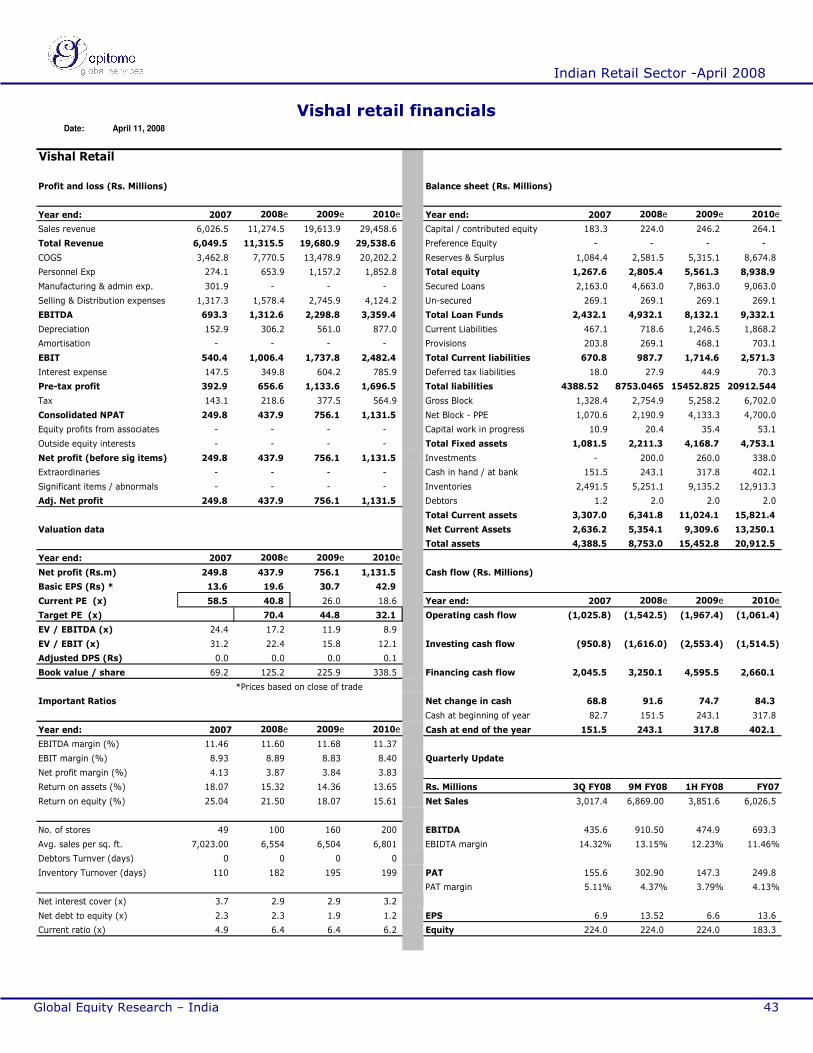
Vishal Retail
Profit and loss (Rs. Millions) Balance sheet (Rs. Millions)
Year end: 2007 2008e 2009e 2010e Year end: 2007 2008e 2009e 2010e
Sales revenue 6,026.5 11,274.5 19,613.9 29,458.6 Capital / contributed equity 183.3 224.0 246.2 264.1
Total Revenue 6,049.5 11,315.5 19,680.9 29,538.6 Preference Equity - - - -
COGS 3,462.8 7,770.5 13,478.9 20,202.2 Reserves & Surplus 1,084.4 2,581.5 5,315.1 8,674.8
Personnel Exp 274.1 653.9 1,157.2 1,852.8 Total equity 1,267.6 2,805.4 5,561.3 8,938.9
Manufacturing & admin exp. 301.9 - - - Secured Loans 2,163.0 4,663.0 7,863.0 9,063.0
Selling & Distribution expenses 1,317.3 1,578.4 2,745.9 4,124.2 Un-secured 269.1 269.1 269.1 269.1
EBITDA 693.3 1,312.6 2,298.8 3,359.4 Total Loan Funds 2,432.1 4,932.1 8,132.1 9,332.1
Depreciation 152.9 306.2 561.0 877.0 Current Liabilities 467.1 718.6 1,246.5 1,868.2
Amortisation - - - - Provisions 203.8 269.1 468.1 703.1
EBIT 540.4 1,006.4 1,737.8 2,482.4 Total Current liabilities 670.8 987.7 1,714.6 2,571.3
Interest expense 147.5 349.8 604.2 785.9 Deferred tax liabilities 18.0 27.9 44.9 70.3
Pre-tax profit 392.9 656.6 1,133.6 1,696.5 Total liabilities 4388.52 8753.0465 15452.825 20912.544
Tax 143.1 218.6 377.5 564.9 Gross Block 1,328.4 2,754.9 5,258.2 6,702.0
Consolidated NPAT 249.8 437.9 756.1 1,131.5 Net Block - PPE 1,070.6 2,190.9 4,133.3 4,700.0
Equity profits from associates - - - - Capital work in progress 10.9 20.4 35.4 53.1
Outside equity interests - - - - Total Fixed assets 1,081.5 2,211.3 4,168.7 4,753.1
Net profit (before sig items) 249.8 437.9 756.1 1,131.5 Investments - 200.0 260.0 338.0
Extraordinaries - - - - Cash in hand / at bank 151.5 243.1 317.8 402.1
Significant items / abnormals - - - - Inventories 2,491.5 5,251.1 9,135.2 12,913.3
Adj. Net profit 249.8 437.9 756.1 1,131.5 Debtors 1.2 2.0 2.0 2.0
Total Current assets 3,307.0 6,341.8 11,024.1 15,821.4
Valuation data Net Current Assets 2,636.2 5,354.1 9,309.6 13,250.1
Total assets 4,388.5 8,753.0 15,452.8 20,912.5
Year end: 2007 2008e 2009e 2010e
Net profit (Rs.m) 249.8 437.9 756.1 1,131.5 Cash flow (Rs. Millions)
Basic EPS (Rs) * 13.6 19.6 30.7 42.9
Current PE (x) 58.5 40.8 26.0 18.6 Year end: 2007 2008e 2009e 2010e
Target PE (x) 70.4 44.8 32.1 Operating cash flow (1,025.8) (1,542.5) (1,967.4) (1,061.4)
EV / EBITDA (x) 24.4 17.2 11.9 8.9
EV / EBIT (x) 31.2 22.4 15.8 12.1 Investing cash flow (950.8) (1,616.0) (2,553.4) (1,514.5)
Adjusted DPS (Rs) 0.0 0.0 0.0 0.1
Book value / share 69.2 125.2 225.9 338.5 Financing cash flow 2,045.5 3,250.1 4,595.5 2,660.1
*Prices based on close of trade
Important Ratios Net change in cash 68.8 91.6 74.7 84.3
Cash at beginning of year 82.7 151.5 243.1 317.8
Year end: 2007 2008e 2009e 2010e Cash at end of the year 151.5 243.1 317.8 402.1
EBITDA margin (%) 11.46 11.60 11.68 11.37
EBIT margin (%) 8.93 8.89 8.83 8.40 Quarterly Update
Net profit margin (%) 4.13 3.87 3.84 3.83
Return on assets (%) 18.07 15.32 14.36 13.65 Rs. Millions 3Q FY08 9M FY08 1H FY08 FY07
Return on equity (%) 25.04 21.50 18.07 15.61 Net Sales 3,017.4 6,869.00 3,851.6 6,026.5
No. of stores 49 100 160 200 EBITDA 435.6 910.50 474.9 693.3
Avg. sales per sq. ft. 7,023.00 6,554 6,504 6,801 EBIDTA margin 14.32% 13.15% 12.23% 11.46%
Debtors Turnver (days) 0 0 0 0
Inventory Turnover (days) 110 182 195 199 PAT 155.6 302.90 147.3 249.8
PAT margin 5.11% 4.37% 3.79% 4.13%
Net interest cover (x) 3.7 2.9 2.9 3.2
Net debt to equity (x) 2.3 2.3 1.9 1.2 EPS 6.9 13.52 6.6 13.6
Current ratio (x) 4.9 6.4 6.4 6.2 Equity 224.0 224.0 224.0 183.3
Date: April 11, 2008
Vishal retail financials
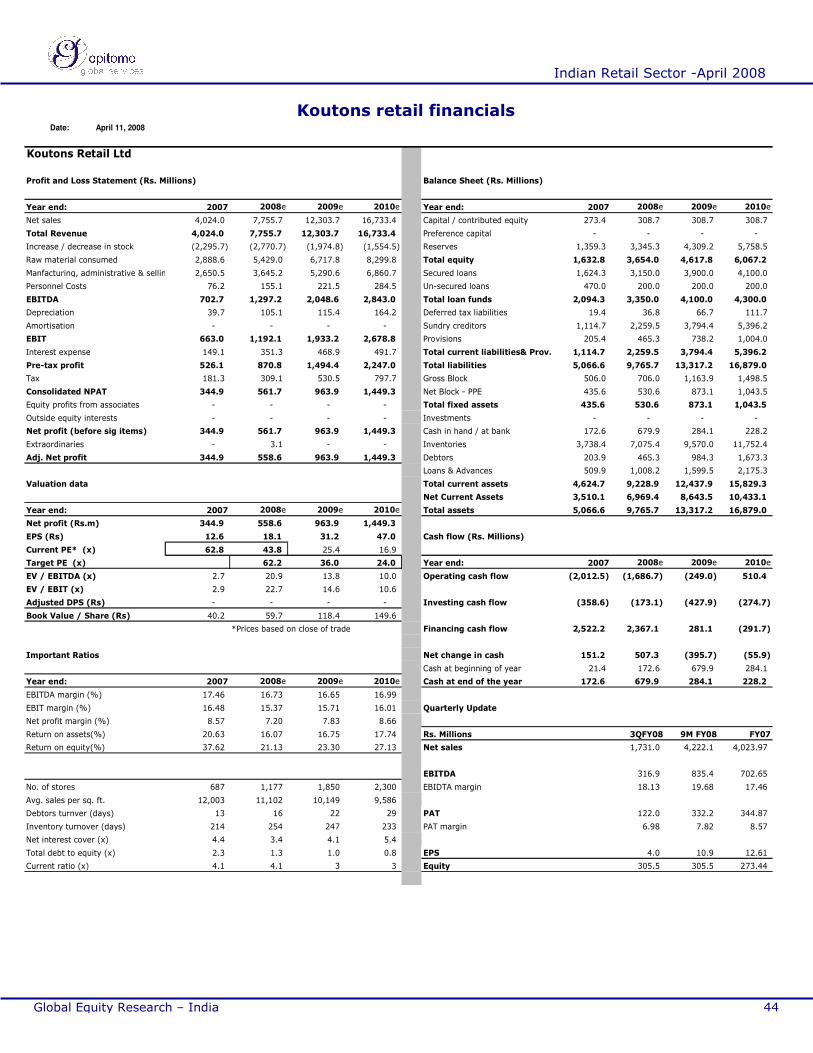
Indian Retail Research Report
June 19, 2008
Indian Retail Sector -April 2008
44 Global Equity Research – India
Koutons Retail Ltd
Profit and Loss Statement (Rs. Millions) Balance Sheet (Rs. Millions)
Year end: 2007 2008e 2009e 2010e Year end: 2007 2008e 2009e 2010e
Net sales 4,024.0 7,755.7 12,303.7 16,733.4 Capital / contributed equity 273.4 308.7 308.7 308.7
Total Revenue 4,024.0 7,755.7 12,303.7 16,733.4 Preference capital - - - -
Increase / decrease in stock (2,295.7) (2,770.7) (1,974.8) (1,554.5) Reserves 1,359.3 3,345.3 4,309.2 5,758.5
Raw material consumed 2,888.6 5,429.0 6,717.8 8,299.8 Total equity 1,632.8 3,654.0 4,617.8 6,067.2
Manfacturing, administrative & selling expenses2,650.5 3,645.2 5,290.6 6,860.7 Secured loans 1,624.3 3,150.0 3,900.0 4,100.0
Personnel Costs 76.2 155.1 221.5 284.5 Un-secured loans 470.0 200.0 200.0 200.0
EBITDA 702.7 1,297.2 2,048.6 2,843.0 Total loan funds 2,094.3 3,350.0 4,100.0 4,300.0
Depreciation 39.7 105.1 115.4 164.2 Deferred tax liabilities 19.4 36.8 66.7 111.7
Amortisation - - - - Sundry creditors 1,114.7 2,259.5 3,794.4 5,396.2
EBIT 663.0 1,192.1 1,933.2 2,678.8 Provisions 205.4 465.3 738.2 1,004.0
Interest expense 149.1 351.3 468.9 491.7 Total current liabilities& Prov. 1,114.7 2,259.5 3,794.4 5,396.2
Pre-tax profit 526.1 870.8 1,494.4 2,247.0 Total liabilities 5,066.6 9,765.7 13,317.2 16,879.0
Tax 181.3 309.1 530.5 797.7 Gross Block 506.0 706.0 1,163.9 1,498.5
Consolidated NPAT 344.9 561.7 963.9 1,449.3 Net Block - PPE 435.6 530.6 873.1 1,043.5
Equity profits from associates - - - - Total fixed assets 435.6 530.6 873.1 1,043.5
Outside equity interests - - - - Investments - - - -
Net profit (before sig items) 344.9 561.7 963.9 1,449.3 Cash in hand / at bank 172.6 679.9 284.1 228.2
Extraordinaries - 3.1 - - Inventories 3,738.4 7,075.4 9,570.0 11,752.4
Adj. Net profit 344.9 558.6 963.9 1,449.3 Debtors 203.9 465.3 984.3 1,673.3
Loans & Advances 509.9 1,008.2 1,599.5 2,175.3
Valuation data Total current assets 4,624.7 9,228.9 12,437.9 15,829.3
Net Current Assets 3,510.1 6,969.4 8,643.5 10,433.1
Year end: 2007 2008e 2009e 2010e Total assets 5,066.6 9,765.7 13,317.2 16,879.0
Net profit (Rs.m) 344.9 558.6 963.9 1,449.3
EPS (Rs) 12.6 18.1 31.2 47.0 Cash flow (Rs. Millions)
Current PE* (x) 62.8 43.8 25.4 16.9
Target PE (x) 62.2 36.0 24.0 Year end: 2007 2008e 2009e 2010e
EV / EBITDA (x) 2.7 20.9 13.8 10.0 Operating cash flow (2,012.5) (1,686.7) (249.0) 510.4
EV / EBIT (x) 2.9 22.7 14.6 10.6
Adjusted DPS (Rs) - - - - Investing cash flow (358.6) (173.1) (427.9) (274.7)
Book Value / Share (Rs) 40.2 59.7 118.4 149.6
*Prices based on close of trade Financing cash flow 2,522.2 2,367.1 281.1 (291.7)
Important Ratios Net change in cash 151.2 507.3 (395.7) (55.9)
Cash at beginning of year 21.4 172.6 679.9 284.1
Year end: 2007 2008e 2009e 2010e Cash at end of the year 172.6 679.9 284.1 228.2
EBITDA margin (%) 17.46 16.73 16.65 16.99
EBIT margin (%) 16.48 15.37 15.71 16.01 Quarterly Update
Net profit margin (%) 8.57 7.20 7.83 8.66
Return on assets(%) 20.63 16.07 16.75 17.74 Rs. Millions 3QFY08 9M FY08 FY07
Return on equity(%) 37.62 21.13 23.30 27.13 Net sales 1,731.0 4,222.1 4,023.97
EBITDA 316.9 835.4 702.65
No. of stores 687 1,177 1,850 2,300 EBIDTA margin 18.13 19.68 17.46
Avg. sales per sq. ft. 12,003 11,102 10,149 9,586
Debtors turnver (days) 13 16 22 29 PAT 122.0 332.2 344.87
Inventory turnover (days) 214 254 247 233 PAT margin 6.98 7.82 8.57
Net interest cover (x) 4.4 3.4 4.1 5.4
Total debt to equity (x) 2.3 1.3 1.0 0.8 EPS 4.0 10.9 12.61
Current ratio (x) 4.1 4.1 3 3 Equity 305.5 305.5 273.44
Date: April 11, 2008
Koutons retail financials

Indian Retail Research Report
June 19, 2008
Indian Retail Sector -April 2008
45 Global Equity Research – India
Disclaimer This report is not for public distribution and has been furnished solely for information for the exclusive use of the addressee(s). If you are not the intended recipient, you are hereby notified that any dissemination, distribution or copying of this report is strictly prohibited. This material is for the personal information of the authorized recipient, and we are not soliciting any action based upon it. This report is not to be construed as an offer to sell or the solicitation of an offer to buy any security/commodities. We have reviewed the report, and believe it to be reliable though its accuracy or completeness cannot be guaranteed. Neither Epitome Global Services, nor any person connected with it, accepts any liability arising from the use of this document. The recipients of this material should rely on their own investigations and take their own professional advice. Price and value of the investments referred to in this material may go up or down. Past performance is not a guide for future performance. ©Epitome Global Services Ltd. All Rights Reserved.
About Epitome Global Services
Based in New York, with a strategic delivery centre in Mumbai, India, Epitome offers a wide range of services to asset managers including hedge funds. Epitome’s client offerings include bespoke research and analytics services, middle and back office support including risk management solutions, independent price verification and over the counter (OTC) derivatives valuation, fund services and advisory services. The company was founded in late 2005 by Raju Panjwani, a former managing director at Morgan Stanley.
U.S.A.: Rockefeller Center, 1230 Avenue of the Americas, 7th Floor, New York, NY 10020 Tel: +1 212 618 6365 Fax: +1 212 618 6309 India: 7th Floor, "A" Wing, Prism Towers, Mindspace, Goregaon (West), Mumbai 400 062 Tel: +91 22 4001 6600 Fax: +91 22 4001 6666
Contact Details
Annie George Sales [email protected] +646 70603 425 Asutosh K Mishra Research [email protected] +91 22 4001 6702