Embed Size (px)
Citation preview

FASTER, FURTHER, SMOOTHER: THE CASE FOR PROBABILISTIC CONSTELLATION SHAPING
W H I T E PA P E R
Conventional coherent modulation based on quadrature amplitude modulation (QAM) has limitations related to granularity, reach, and baud rate flexibility. A new modulation paradigm, probabilistic constellation shaping (PCS), promises to address these limitations while taking us to within touching distance of the Shannon limit, the theoretical maximum data capacity for a given amount of spectrum in the presence of noise.

| FASTER, FURTHER, SMOOTHER: THE CASE FOR PROBABILISTIC CONSTELLATION SHAPING2
CONVENTIONAL QAM MODULATIONConventional coherent transmission is based on QAM, which uses a combination of phase and amplitude to encode bits of data. For example, Figure 1 shows a 16QAM constellation diagram with 16 constellation points encoding 4 bits. Each constellation point is a unique combination of phase and amplitude, with phase represented by the angle and amplitude by the distance from the center of the diagram.
0000 0100
0001 0101
1100 1000
Phase
1101 1001
0011 0111
0010 0110
1111 1011
1110 1010
FIGURE 1: 16QAM example: phase and amplitude
The first generations of coherent transmission used polarization-multiplexed quadrature phase-shift keying (PM-QPSK), sometimes referred to as PM-4QAM. Each of the two orthogonal polarizations of light (X-polarization, Y-polarization) uses 4 constellation points to transmit 2 bits for a total of 4 bits per symbol, as shown in Figure 2. This was followed by PM-8QAM, which uses 8 constellation points to transmit 3 bits on each polarization for a total of 6 bits per symbol, and PM-16QAM, which uses 16 constellation points to transmit 4 bits on each polarization for a total of 8 bits per symbol. The most recent generations also support PM-32QAM, which uses 32 constellation points to transmit 5 bits on each polarization for a total of 10 bits per symbol, and PM-64QAM, which uses 64 constellation points to transmit 6 bits on each polarization for a total of 12 bits per symbol.
PM-64QAMPM-32QAMPM-16QAMPM-8QAMPM-QPSK
12 bits/symbol10 bits/symbol8 bits/symbol6 bits/symbol4 bits/symbol
6 bits5 bits4 bits3 bits2 bits
6 bits5 bits4 bits3 bits2 bits
FIGURE 2: Conventional coherent modulation
| FASTER, FURTHER, SMOOTHER: THE CASE FOR PROBABILISTIC CONSTELLATION SHAPING3
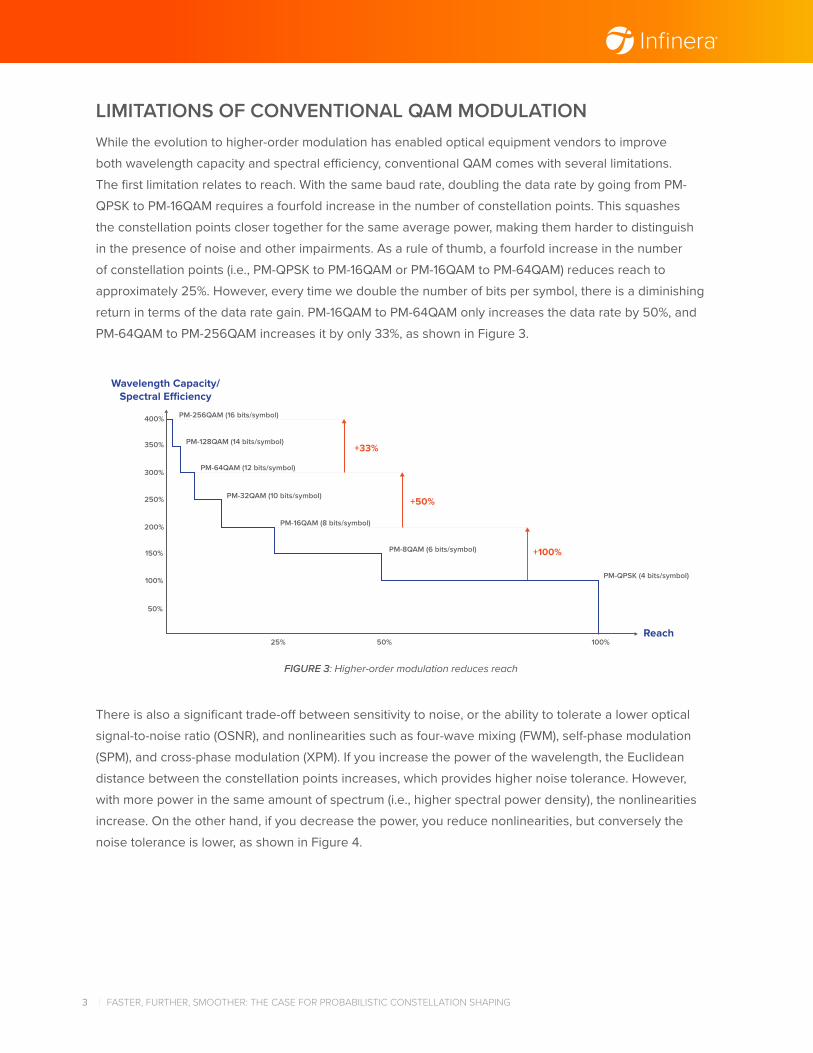
LIMITATIONS OF CONVENTIONAL QAM MODULATIONWhile the evolution to higher-order modulation has enabled optical equipment vendors to improve both wavelength capacity and spectral efficiency, conventional QAM comes with several limitations. The first limitation relates to reach. With the same baud rate, doubling the data rate by going from PM-QPSK to PM-16QAM requires a fourfold increase in the number of constellation points. This squashes the constellation points closer together for the same average power, making them harder to distinguish in the presence of noise and other impairments. As a rule of thumb, a fourfold increase in the number of constellation points (i.e., PM-QPSK to PM-16QAM or PM-16QAM to PM-64QAM) reduces reach to approximately 25%. However, every time we double the number of bits per symbol, there is a diminishing return in terms of the data rate gain. PM-16QAM to PM-64QAM only increases the data rate by 50%, and PM-64QAM to PM-256QAM increases it by only 33%, as shown in Figure 3.
400%
350%
300%
250%
200%
150%
100%
50%
50% 100%
PM-QPSK (4 bits/symbol)
PM-8QAM (6 bits/symbol)
PM-16QAM (8 bits/symbol)
PM-32QAM (10 bits/symbol)
PM-64QAM (12 bits/symbol)
PM-128QAM (14 bits/symbol)
Reach
Wavelength Capacity/Spectral E�ciency
+33%
+50%
+100%
25%
PM-256QAM (16 bits/symbol)
FIGURE 3: Higher-order modulation reduces reach
There is also a significant trade-off between sensitivity to noise, or the ability to tolerate a lower optical signal-to-noise ratio (OSNR), and nonlinearities such as four-wave mixing (FWM), self-phase modulation (SPM), and cross-phase modulation (XPM). If you increase the power of the wavelength, the Euclidean distance between the constellation points increases, which provides higher noise tolerance. However, with more power in the same amount of spectrum (i.e., higher spectral power density), the nonlinearities increase. On the other hand, if you decrease the power, you reduce nonlinearities, but conversely the noise tolerance is lower, as shown in Figure 4.

| FASTER, FURTHER, SMOOTHER: THE CASE FOR PROBABILISTIC CONSTELLATION SHAPING4
Higher Power
Noise Tolerance HigherIncreased
LowerReducedNonlinearities
Lower Power
FIGURE 4: Noise tolerance vs. nonlinearities
Another limitation relates to granularity. Conventional coherent modulation supports a limited range of increments: PM-QPSK (4 bits/symbol), PM-8QAM (6 bits/symbol), PM-16QAM (8 bits/symbol), PM-32QAM (10 bits/symbol), and PM-64QAM (12 bits/symbol). If the reach requirement is beyond that of the higher modulation (i.e., PM-16QAM), even by just a small amount, then the next lowest modulation (i.e., PM-8QAM) must be used, with a substantial drop in wavelength capacity and spectral efficiency.
INTRODUCING PROBABILISTIC CONSTELLATION SHAPINGProbabilistic constellation shaping is an advanced modulation technique that addresses many of the limitations of conventional QAM modulation. But what is it, and how does it work? With traditional modulation, each constellation point has the same probability of being used. This means the outer constellation points with higher amplitude and therefore more energy/power have the same probability of being used as inner constellation points with lower energy/power, as shown in Figure 5.
Probability
Lower energy/power
Higher energy/power
FIGURE 5: Conventional QAM: equal probabilities

| FASTER, FURTHER, SMOOTHER: THE CASE FOR PROBABILISTIC CONSTELLATION SHAPING5
PCS uses the lower-energy/-power inner constellation points more frequently and the higher-energy/-power outer constellation points less frequently, as shown in Figure 6. This enables PCS to deliver the following benefits:
Probability
Lower-energy/-power inner constellation pointssent more frequently
Higher-energy/-power outer constellation pointssent less frequently
FIGURE 6: Probabilistic constellation shaping
Benefit 1: Enhanced GranularityPCS provides the option of fine granularity, enabling a far smoother curve than traditional modulation. In practice, the need for useful data rates will limit granularity to fixed increments of 25 Gb/s or 50 Gb/s. Even with these increments, PCS can better maximize the number of bits per symbol than traditional QAM, with much smaller step change drops in capacity. Even if there were no other benefits, the enhanced granularity of PCS would greatly increase capacity and spectral efficiency in scenarios where the reach requirement was just beyond the capabilities of the higher-order modulation, as shown in Figure 7.
Wavelength Capacity
Reach
PCS
PCS with fixed increments (i.e., 25 Gb/s)
Conventional modulation
Reach Requirement
FIGURE 7: PCS enhances granularity

| FASTER, FURTHER, SMOOTHER: THE CASE FOR PROBABILISTIC CONSTELLATION SHAPING6
Benefit 2: Improved Noise Tolerance (or Reduced Nonlinearities)PCS uses the lower-power inner constellation points more frequently and the higher-power outer constellation points less frequently. For the same average power and spectral efficiency, there is greater Euclidean distance between the constellation points relative to conventional QAM, which increases tolerance to noise (i.e., OSNR tolerance). Figure 8 illustrates this showing 16QAM and PCS-64QAM, both with 8 bits per symbol and the same average power, with the probability of each constellation point represented by its area. In addition, the receiver can use the probability distribution of the PCS constellation points to further enhance OSNR tolerance.
Conventional QAM(PM-16QAM = 8 bits/symbol)
Probabilistic Constellation Shaping(PM-PCS-64QAM at 8 bits/symbol)
Constant Powerand Spectral E�ciency
FIGURE 8: PCS improves noise tolerance
This increase in noise tolerance comes with no increase in nonlinearities, which are a function of the average power of the wavelength and its spectrum (i.e., the power spectral density), and takes us closer to the Shannon limit, as shown in Figure 9. Alternatively, for the same noise tolerance, less power is required, and therefore nonlinearities are reduced. Both cases provide the ability to increase wavelength capacity/spectral efficiency and/or reach.
Wavelength Capacity
Reach
PCS
PCS with fixed increments
Conventional modulation
The Shannon limit
FIGURE 9: PCS takes us closer to the Shannon limit

| FASTER, FURTHER, SMOOTHER: THE CASE FOR PROBABILISTIC CONSTELLATION SHAPING7
Benefit 3: Baud Rate FlexibilityA third benefit of PCS is that it provides the option to choose the optimal baud rate and then use PCS to get the desired wavelength speed. As a general rule, when it comes to baud rates, the higher the better. Higher baud rates maximize wavelength capacity-reach, reducing cost, footprint, and power consumption. However, the limited granularity of traditional QAM-based modulation provides far less flexibility when selecting the baud rate. For example, for a wavelength data rate of 800 Gb/s (i.e., the transport of 8 x 100 GbE clients) with an overhead of 20% for forward error correction and physical layer functions, we need a raw transmission rate of 960 Gb/s. To achieve this raw transmission speed with conventional modulation, we could use PM-64QAM (12 bits/symbol) and 80 Gbaud or PM-32QAM (10 bits/symbol) and 96 Gbaud, as shown in Table 1.
Modulation PM-64QAM PM-PCS-64QAM PM-32QAMWavelength Data Rate 800 Gb/s 800 Gb/s 800 Gb/s
Overhead (FEC, Physical Layer) 20% 20% 20%
Raw Transmission Rate 960 Gb/s 960 Gb/s 960 Gb/s
Bits per Symbol 12 10.67 10
Baud Rate 80 Gbaud 90 Gbaud 96 Gbaud
TABLE 1: 800G examples: baud rate and modulation
But what if we have an optical engine that is capable of 90 Gbaud but not 96 Gbaud? With conventional modulation, we would have to use 80 Gbaud, forgoing the benefits of the extra 10 Gbaud of which the optical engine is capable. With PCS, we can dial up the baud rate to 90 Gbaud, which provides the baud rate overhead for PCS to shape the probability density function of the constellation points, dialing down the modulation to 10.67 bits/symbol and thus enabling much greater 800G reach. This benefit can also apply to lower baud rate use cases such as fixed grid networks and transoceanic submarine, letting us choose the optimal baud rate and therefore spectral width of the wavelength and then using PCS to get the desired wavelength speed.
HOW DOES IT WORK?The next question many people have is, how does PCS work? The “secret sauce” of PCS is the distribution matcher. While sophisticated in detail, at a high level what it does is take a uniform bit sequence, ones and zeros with equal probability, and convert these into symbols with a desired distribution, typically Gaussian. At the other end, a reverse distribution matcher converts these symbols back to the original bit stream.

| FASTER, FURTHER, SMOOTHER: THE CASE FOR PROBABILISTIC CONSTELLATION SHAPING8
To show how this might work with a simplified example, if we take four bits (0 to 15) and convert these to two symbols (from among eight possible symbols, letters A to H), as shown on the left of Figure 11, then regardless of the incoming bitstream, we are likely to see a lot more Ds and Es and a lot fewer As or Hs, giving us the distribution shown on the right. Note that we are not mapping bits to individual symbols but a string of bits to a combination of symbols, with the mappings in this example created manually to give the desired distribution. In this example we are using 6 bits (two 3-bit symbols) to transmit 4 bits worth of data, so our data rate is now two-thirds of what we would get if we used the full modulation with all the symbols used equally.
Uniform Bit Sequence Desired (Gaussian) Distribution
Probability Probability
S¹
SSSSSSSSSSSSSSSSSSSSSSS
Codeword
S² S³ S⁴ S⁵ S⁶
0101010100100101001101010101 DistributionMatcher
0 1
FIGURE 10: The distribution matcher
Number Binary Symbols Probability
Symbols
0.25
0.2
0.15
0.1
0.05
0A B C D E F G H
0 0000 DD1 0001 DE2 0010 DA3 0011 DB4 0100 DH5 0101 BG6 0110 GF7 0111 FE8 1000 CF9 1001 CC10 1010 EC11 1011 ED12 1100 EA13 1101 EB14 1110 EH15 1111 GF
FIGURE 11: Example bits to symbol mapping and symbol distribution
LONG-CODEWORD PCSA real distribution matcher is more complicated than the simplified example described in the previous section. The distribution matcher needs to find a bits-to-symbols mapping that meets the desired data rate (effective bits per symbol) with the desired probability distribution, and it needs to do this in real time for a constantly changing stream of bits at the speeds required for 800 Gb/s wavelengths, including the overhead (i.e., 960 Gb/s with a 20% overhead or 1,000 Gb/s with a 25% overhead).

| FASTER, FURTHER, SMOOTHER: THE CASE FOR PROBABILISTIC CONSTELLATION SHAPING9
How well it does this depends, to a large extent, on how much data it looks at, which we will refer to as the codeword length, shown in Figure 10 on the previous page. A long codeword increases the probability that a good match can be found. The game of chess provides a good analogy: the larger the number of moves you can think ahead, the better your chances of winning.
Codeword Length (Symbols)~100
~50%
100%
~1000
FIGURE 12: Codeword length vs. PCS gain
As shown in Figure 12, a codeword length of around 100 symbols results in around half the gain of a codeword with a length of around 1,000 symbols, with diminishing returns as we go much beyond 1,000 symbols. A codeword with a little more than 1,000 symbols is therefore enough to deliver almost all the potential gain of PCS. However, in addition to advanced algorithms, long-codeword PCS (LC-PCS) requires an ASIC/DSP with a 7-nm or better process node.
TRANSCEIVER QUALITYAnother important factor for PCS gain is the quality of the coherent transceiver, the modem signal-to-noise ratio (SNR), which basically describes the amount of noise generated inside the transceiver/modem. Factors that influence the modem SNR include the precision of the digital signal processor (DSP); the performance of the digital to-analog converter (DAC), analog-to-digital converter (ACD), Mach-Zehnder modulators and trans-impedance amplifiers (TIAs); and the quality of the radio frequency (RF) interconnects between the ASIC/DSP and analog electronics (drivers and TIAs) and between the analog electronics and photonics (i.e., the photonic integrated circuit in the case of Infinera’s sixth-generation Infinite Capacity Engine, ICE6). The better the transceiver, the higher the modem SNR. For a practical coherent transceiver, PCS gain is determined by both the codeword length and modem SNR.
GAUSSIAN VS. SUPER-GAUSSIAN DISTRIBUTIONSAnother factor that can impact PCS performance is the shape of the distribution. For most applications, a Gaussian distribution will deliver the best results. However, for scenarios where power levels are high and reducing nonlinearities is the priority, such as submarine with uncompensated large effective area fibers, a flatter super-Gaussian distribution, which more evenly spreads the power over the inner constellation points, as shown in Figure 13, can deliver better results.

| FASTER, FURTHER, SMOOTHER: THE CASE FOR PROBABILISTIC CONSTELLATION SHAPING10
Super-GaussianGaussian
FIGURE 13: Gaussian vs. Super-Gaussian
PER-SUBCARRIER PCS WITH DYNAMIC BANDWIDTH ALLOCATIONA single-carrier wavelength experiences different penalties across its spectrum, typically with higher penalties toward the edges and lower penalties nearer the center, due to factors such as filter roll-off and DAC/ADC performance, as shown in Figure 14. Nyquist subcarriers use advanced digital signal processing to divide a single high-baud-rate carrier into multiple lower-baud-rate subcarriers. However, if all the subcarriers must operate at the same data rate, then for a given reach requirement, the capacity will be limited by the outermost subcarriers. Dynamic bandwidth allocation (DBA) enables the data rate on each subcarrier to be set individually with a different bits/symbol setting for PCS.
Wavelength
Frequency
Power Penalties
Filter penaltiesADC/DAC performance
FIGURE 14: Wavelengths have higher penalties at the edges
For example, if all the subcarriers have to be at the same data rate, then for the reach requirement shown in Figure 15, we are limited by the outer subcarriers to 87.5 Gb/s per subcarrier, giving a total of 700 Gb/s for the wavelength. With DBA we can increase the inner subcarriers to 95 Gb/s, 105 Gb/s, and 112.5 Gb/s, increasing the total wavelength capacity to 800 Gb/s, as shown in Figure 16.

| FASTER, FURTHER, SMOOTHER: THE CASE FOR PROBABILISTIC CONSTELLATION SHAPING11
700G
87.5G
87.5G
Capacity-reach limited by outer subcarriers
Reach
87.5G
87.5G
87.5G
87.5G
87.5G
87.5G
FIGURE 15: Uniform subcarriers: limited by outer subcarriers
800G
87.5G
95G
Reach
105G
112.5G
112.5G
Same Reach
FIGURE 16: Dynamic bandwidth allocation for increased capacity
Alternatively, we could decrease the outer subcarriers to 82.5 Gb/s and 85 Gb/s and increase the inner subcarriers to 90 Gb/s and 92.5 Gb/s to increase the reach with the same wavelength capacity (700 Gb/s), as shown in Figure 17.
700G
82.5G
85G
Reach
90G
92.5G
92.5G
New Reach
Old Reach
FIGURE 17: Dynamic bandwidth allocation for increased reach

© 2020 Infinera Corporation. All Rights Reserved. Infinera and logos that contain Infinera are trademarks or registered trademarks of Infinera Corporation in the United States and other countries. All other trademarks are the property of their respective owners. Statements herein may contain projections regarding future products, features, or technology and resulting commercial or technical benefits, which are subject to risk and may or may not occur. This publication is subject to change without notice and does not constitute legal obligation to deliver any material, code, or functionality and is not intended to modify or supplement any product specifications or warranties. 0257-WP-RevA-0620
LATENCY AND POWER CONSUMPTIONA common concern that comes up with PCS is latency. Does PCS add latency? Does a longer codeword mean more latency? The answer is that PCS, even with a long codeword, adds negligible latency, less than 10 nanoseconds, at least for the long-codeword PCS implementation in Infinera’s ICE6 optical engine, which does not require buffering.
Another concern can be power consumption. PCS requires additional processing in the digital ASIC/DSP, which has a cost in terms of power consumption. This can increase the “headline” power consumption, the power consumption in watts per Gb/s for the maximum data rate at the shortest distance. It may also limit the adoption of PCS in ASICs/DSPs for compact coherent pluggables where low power consumption is a top priority. However, the increased capacity-reach enabled by PCS can give it an advantage when distance is included in power consumption comparisons (i.e., watts per Gb/s per km). Furthermore, the power consumption of PCS is reduced with power-efficient 7-nm process node ASIC/DSP technology, as used in Infinera’s ICE6 optical engine.
SUMMARYPCS reduces the probability of higher-energy/-power outer constellation points, while increasing the probability of lower-energy/-power inner constellation points. This provides extremely granular control of the number of bits per symbol, as well as the flexibility to select the best baud rate and spectral width. It improves capacity-reach and spectral efficiency with better tolerance to noise and/or fewer nonlinearities. Enhancements that can maximize the value of PCS include a long codeword, high transceiver quality (practical modem SNR), per-subcarrier PCS with DBA, and the option of a super-Gaussian distribution for scenarios with high power and nonlinearities.