Embed Size (px)
Citation preview
Faster Progress Bars: Manipulating Perceived Duration with Visual Augmentations
Chris Harrison Zhiquan Yeo Scott E. Hudson Human-Computer Interaction Institute, Carnegie Mellon University
5000 Forbes Avenue, Pittsburgh, PA 15213 {chris.harrison, zyeo, scott.hudson}@cs.cmu.edu
ABSTRACT Human perception of time is fluid, and can be manipulated in purposeful and productive ways. In this note, we propose and evaluate variations on two visual designs for progress bars that alter users’ perception of time passing, and “ap-pear” faster when in fact they are not. As a baseline, we use standard, solid-color progress bars, prevalent in many user interfaces. In a series of direct comparison tests, we are able to rank how these augmentations compare to one an-other. We then show that these designs yield statistically significantly shorter perceived durations than progress bars seen in many modern interfaces, including Mac OSX. Pro-gress bars with animated ribbing that move backwards in a decelerating manner proved to have the strongest effect. In a final experiment, we measured the effect of this particular progress bar design and showed that it reduces the per-ceived duration among our participants by 11%. ACM Classification: H5.2 [Information interfaces and presentation]: User Interfaces. - Graphical user interfaces. General terms: Design, Human Factors Keywords: Progress bars, percent-done indicators, percep-tion, perceived performance, induced motion. INTRODUCTION Progress bars [8], typically used to visualize the progres-sion of an extended operation, are prevalent in current user interfaces. In desktop systems, advanced users often multi-task during these periods. However, it is not uncommon for advanced users to watch an install finish or file transfer complete – especially if they are waiting on that operation. Anecdotally, novice users tend to anxiously monitor their progress bars, in hopes that some error does not occur. In non-desktop applications (e.g., ATMs, ticketing kiosks, and some mobile device platforms), novice and expert users alike have no choice but to watch progress bars frustrat-ingly inch their way across the screen. No matter how ob-jectively fast we make these operations, it is typically the subjective speed that mars the user experience [11]. Indeed, a core tenet of HCI is to improve user satisfaction. Previous research has shown that the perceived duration of progress bars can be manipulated by changing how they
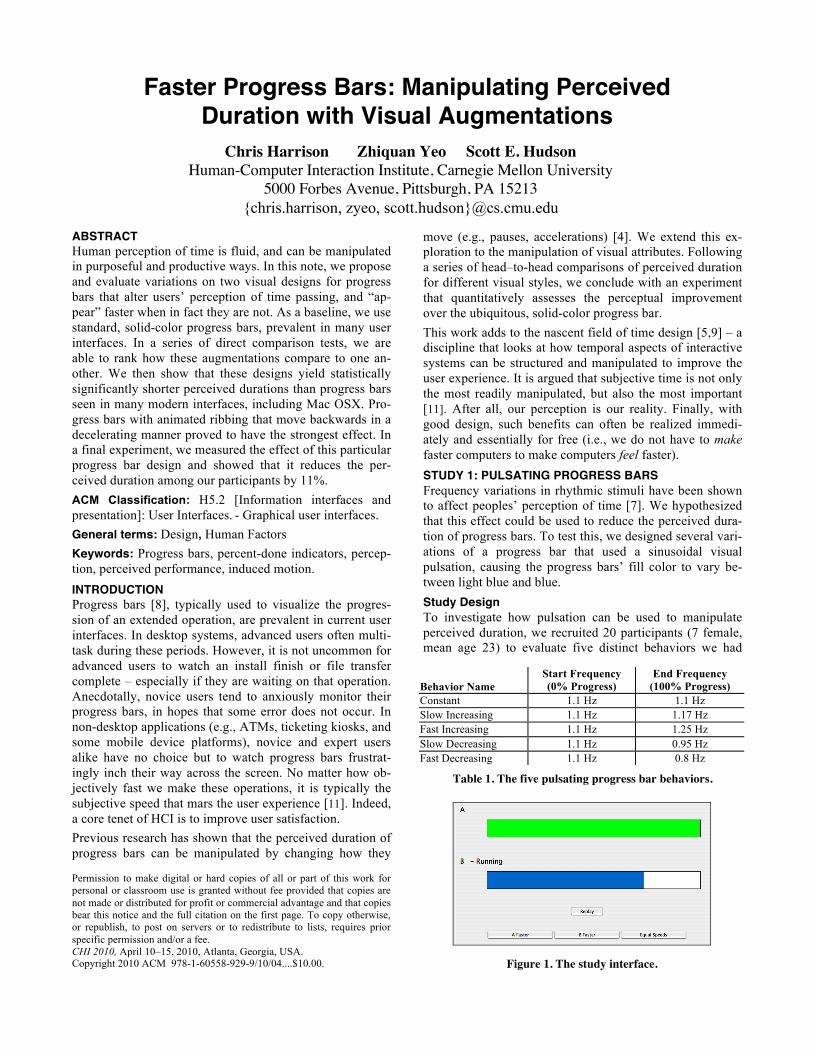
move (e.g., pauses, accelerations) [4]. We extend this ex-ploration to the manipulation of visual attributes. Following a series of head–to-head comparisons of perceived duration for different visual styles, we conclude with an experiment that quantitatively assesses the perceptual improvement over the ubiquitous, solid-color progress bar. This work adds to the nascent field of time design [5,9] – a discipline that looks at how temporal aspects of interactive systems can be structured and manipulated to improve the user experience. It is argued that subjective time is not only the most readily manipulated, but also the most important [11]. After all, our perception is our reality. Finally, with good design, such benefits can often be realized immedi-ately and essentially for free (i.e., we do not have to make faster computers to make computers feel faster). STUDY 1: PULSATING PROGRESS BARS Frequency variations in rhythmic stimuli have been shown to affect peoples’ perception of time [7]. We hypothesized that this effect could be used to reduce the perceived dura-tion of progress bars. To test this, we designed several vari-ations of a progress bar that used a sinusoidal visual pulsation, causing the progress bars’ fill color to vary be-tween light blue and blue. Study Design To investigate how pulsation can be used to manipulate perceived duration, we recruited 20 participants (7 female, mean age 23) to evaluate five distinct behaviors we had
Behavior Name Start Frequency (0% Progress)
End Frequency (100% Progress)
Constant 1.1 Hz 1.1 Hz Slow Increasing 1.1 Hz 1.17 Hz Fast Increasing 1.1 Hz 1.25 Hz Slow Decreasing 1.1 Hz 0.95 Hz Fast Decreasing 1.1 Hz 0.8 Hz
Table 1. The five pulsating progress bar behaviors.
Figure 1. The study interface.
Permission to make digital or hard copies of all or part of this work for personal or classroom use is granted without fee provided that copies are not made or distributed for profit or commercial advantage and that copies bear this notice and the full citation on the first page. To copy otherwise, or republish, to post on servers or to redistribute to lists, requires prior specific permission and/or a fee. CHI 2010, April 10–15, 2010, Atlanta, Georgia, USA. Copyright 2010 ACM 978-1-60558-929-9/10/04....$10.00.
created (Table 1). To identify perceptual differences, we employed a simple interface that presented two progress bars to the participant (Figure 1), each of which took five seconds to complete. Progress bars were run sequentially – when the first one finished, the second one began. Sequen-tial, rather than parallel presentation was necessary to hide the fact that the progress bars were actually the same dura-tion. Although five seconds is a somewhat short duration for a progress bar, it was a necessary trade off to run the number of trials we desired and still maintain user attention for the complete experiment. However, as you will see in discussion of the results from our final experiment, we be-lieve that these types of effects can scale to at least some-what longer durations. After watching the two progress bars run to completion, participants selected whether they believed the first pro-gress bar was faster, the second progress bar was faster, or that the progress bars were equal in duration. The next trial began once an answer was provided. Participants could replay the progress bars if desired. All distinct ordered pairings of the five pulsation behaviors were shown to participants, for total of 25 trials. This in-cluded testing behaviors against themselves, and both or-derings of every pair, the results of which are combined to control for order effects. Presentation order was also randomized to control for time order errors (see [3], p52). Results and Discussion We employed a simple preference metric [4] to compare the performance of different behaviors, which is calculated as an average of the following individual scores: +1 if the first behavior is preferred (i.e. perceived to be faster), -1 if the second is preferred, and 0 if the participant believed the two to be equal in duration. For example, in 40 compari-sons of Fast Increasing vs. Slow Decreasing, 16 partici-pants felt the former was faster, 6 participants felt the latter was faster, and 18 believed the two progress bars were equal in duration. Thus, the mean preferences score is (16 – 6) / 40 = 0.25. The positive value indicates a preference towards Fast Increasing. To derive our statistical measures, we employed a two-sided sign test of the null hypothesis that each function was equally likely to be preferred. There were several statistically significant differences in the preferences between the various pulsation behaviors. Figure 2 provides a partial order of these relationships, and clearly illustrates the preference towards behaviors with increasing pulsation frequencies. This result is confirmed when results are grouped by behavior type – behaviors with
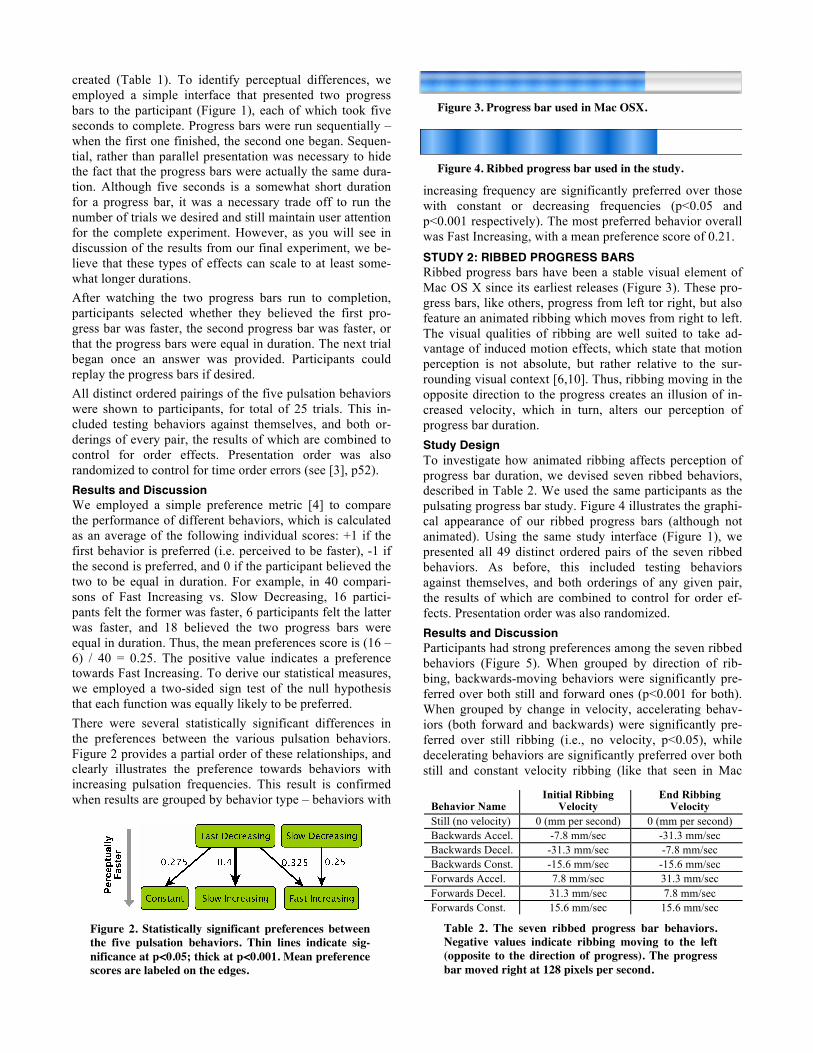
increasing frequency are significantly preferred over those with constant or decreasing frequencies (p<0.05 and p<0.001 respectively). The most preferred behavior overall was Fast Increasing, with a mean preference score of 0.21. STUDY 2: RIBBED PROGRESS BARS Ribbed progress bars have been a stable visual element of Mac OS X since its earliest releases (Figure 3). These pro-gress bars, like others, progress from left tor right, but also feature an animated ribbing which moves from right to left. The visual qualities of ribbing are well suited to take ad-vantage of induced motion effects, which state that motion perception is not absolute, but rather relative to the sur-rounding visual context [6,10]. Thus, ribbing moving in the opposite direction to the progress creates an illusion of in-creased velocity, which in turn, alters our perception of progress bar duration. Study Design To investigate how animated ribbing affects perception of progress bar duration, we devised seven ribbed behaviors, described in Table 2. We used the same participants as the pulsating progress bar study. Figure 4 illustrates the graphi-cal appearance of our ribbed progress bars (although not animated). Using the same study interface (Figure 1), we presented all 49 distinct ordered pairs of the seven ribbed behaviors. As before, this included testing behaviors against themselves, and both orderings of any given pair, the results of which are combined to control for order ef-fects. Presentation order was also randomized. Results and Discussion Participants had strong preferences among the seven ribbed behaviors (Figure 5). When grouped by direction of rib-bing, backwards-moving behaviors were significantly pre-ferred over both still and forward ones (p<0.001 for both). When grouped by change in velocity, accelerating behav-iors (both forward and backwards) were significantly pre-ferred over still ribbing (i.e., no velocity, p<0.05), while decelerating behaviors are significantly preferred over both still and constant velocity ribbing (like that seen in Mac
Figure 3. Progress bar used in Mac OSX.
Figure 4. Ribbed progress bar used in the study.
Figure 2. Statistically significant preferences between the five pulsation behaviors. Thin lines indicate sig-nificance at p<0.05; thick at p<0.001. Mean preference scores are labeled on the edges.
Behavior Name Initial Ribbing
Velocity End Ribbing
Velocity Still (no velocity) 0 (mm per second) 0 (mm per second) Backwards Accel. -7.8 mm/sec -31.3 mm/sec Backwards Decel. -31.3 mm/sec -7.8 mm/sec Backwards Const. -15.6 mm/sec -15.6 mm/sec Forwards Accel. 7.8 mm/sec 31.3 mm/sec Forwards Decel. 31.3 mm/sec 7.8 mm/sec Forwards Const. 15.6 mm/sec 15.6 mm/sec
Table 2. The seven ribbed progress bar behaviors. Negative values indicate ribbing moving to the left (opposite to the direction of progress). The progress bar moved right at 128 pixels per second.
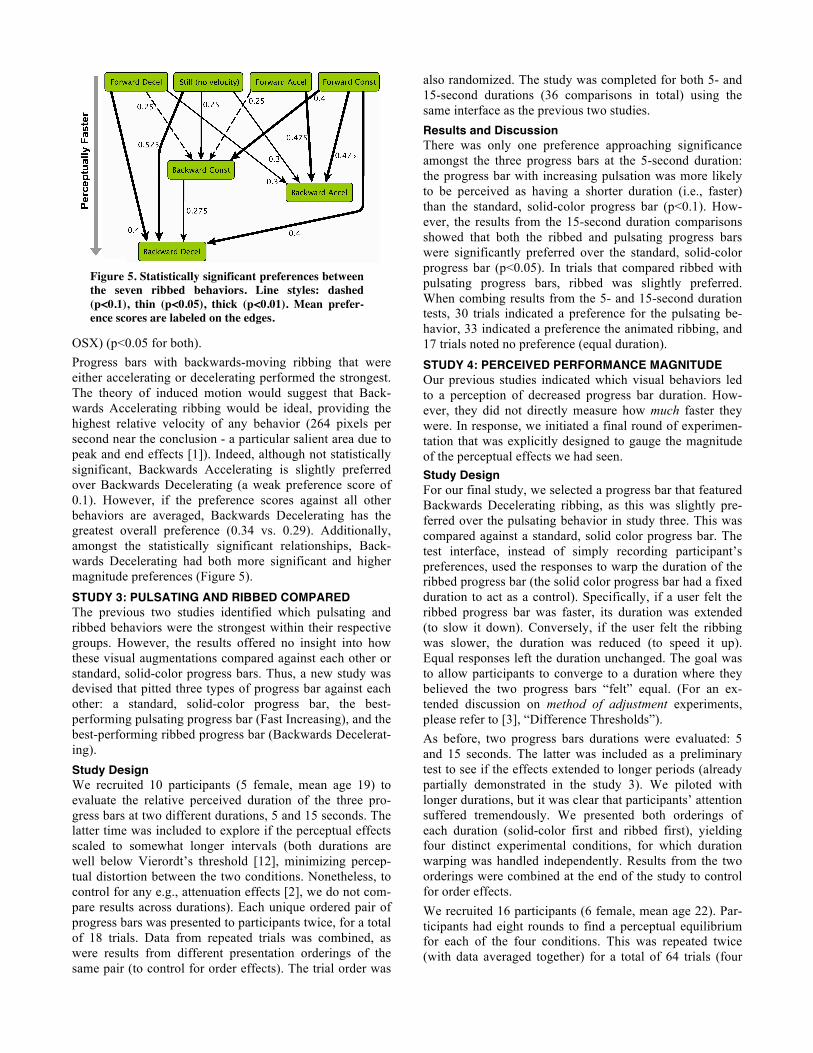
OSX) (p<0.05 for both). Progress bars with backwards-moving ribbing that were either accelerating or decelerating performed the strongest. The theory of induced motion would suggest that Back-wards Accelerating ribbing would be ideal, providing the highest relative velocity of any behavior (264 pixels per second near the conclusion - a particular salient area due to peak and end effects [1]). Indeed, although not statistically significant, Backwards Accelerating is slightly preferred over Backwards Decelerating (a weak preference score of 0.1). However, if the preference scores against all other behaviors are averaged, Backwards Decelerating has the greatest overall preference (0.34 vs. 0.29). Additionally, amongst the statistically significant relationships, Back-wards Decelerating had both more significant and higher magnitude preferences (Figure 5). STUDY 3: PULSATING AND RIBBED COMPARED The previous two studies identified which pulsating and ribbed behaviors were the strongest within their respective groups. However, the results offered no insight into how these visual augmentations compared against each other or standard, solid-color progress bars. Thus, a new study was devised that pitted three types of progress bar against each other: a standard, solid-color progress bar, the best-performing pulsating progress bar (Fast Increasing), and the best-performing ribbed progress bar (Backwards Decelerat-ing). Study Design We recruited 10 participants (5 female, mean age 19) to evaluate the relative perceived duration of the three pro-gress bars at two different durations, 5 and 15 seconds. The latter time was included to explore if the perceptual effects scaled to somewhat longer intervals (both durations are well below Vierordt’s threshold [12], minimizing percep-tual distortion between the two conditions. Nonetheless, to control for any e.g., attenuation effects [2], we do not com-pare results across durations). Each unique ordered pair of progress bars was presented to participants twice, for a total of 18 trials. Data from repeated trials was combined, as were results from different presentation orderings of the same pair (to control for order effects). The trial order was
also randomized. The study was completed for both 5- and 15-second durations (36 comparisons in total) using the same interface as the previous two studies. Results and Discussion There was only one preference approaching significance amongst the three progress bars at the 5-second duration: the progress bar with increasing pulsation was more likely to be perceived as having a shorter duration (i.e., faster) than the standard, solid-color progress bar (p<0.1). How-ever, the results from the 15-second duration comparisons showed that both the ribbed and pulsating progress bars were significantly preferred over the standard, solid-color progress bar (p<0.05). In trials that compared ribbed with pulsating progress bars, ribbed was slightly preferred. When combing results from the 5- and 15-second duration tests, 30 trials indicated a preference for the pulsating be-havior, 33 indicated a preference the animated ribbing, and 17 trials noted no preference (equal duration). STUDY 4: PERCEIVED PERFORMANCE MAGNITUDE Our previous studies indicated which visual behaviors led to a perception of decreased progress bar duration. How-ever, they did not directly measure how much faster they were. In response, we initiated a final round of experimen-tation that was explicitly designed to gauge the magnitude of the perceptual effects we had seen. Study Design For our final study, we selected a progress bar that featured Backwards Decelerating ribbing, as this was slightly pre-ferred over the pulsating behavior in study three. This was compared against a standard, solid color progress bar. The test interface, instead of simply recording participant’s preferences, used the responses to warp the duration of the ribbed progress bar (the solid color progress bar had a fixed duration to act as a control). Specifically, if a user felt the ribbed progress bar was faster, its duration was extended (to slow it down). Conversely, if the user felt the ribbing was slower, the duration was reduced (to speed it up). Equal responses left the duration unchanged. The goal was to allow participants to converge to a duration where they believed the two progress bars “felt” equal. (For an ex-tended discussion on method of adjustment experiments, please refer to [3], “Difference Thresholds”). As before, two progress bars durations were evaluated: 5 and 15 seconds. The latter was included as a preliminary test to see if the effects extended to longer periods (already partially demonstrated in the study 3). We piloted with longer durations, but it was clear that participants’ attention suffered tremendously. We presented both orderings of each duration (solid-color first and ribbed first), yielding four distinct experimental conditions, for which duration warping was handled independently. Results from the two orderings were combined at the end of the study to control for order effects. We recruited 16 participants (6 female, mean age 22). Par-ticipants had eight rounds to find a perceptual equilibrium for each of the four conditions. This was repeated twice (with data averaged together) for a total of 64 trials (four
Figure 5. Statistically significant preferences between the seven ribbed behaviors. Line styles: dashed (p<0.1), thin (p<0.05), thick (p<0.01). Mean prefer-ence scores are labeled on the edges.
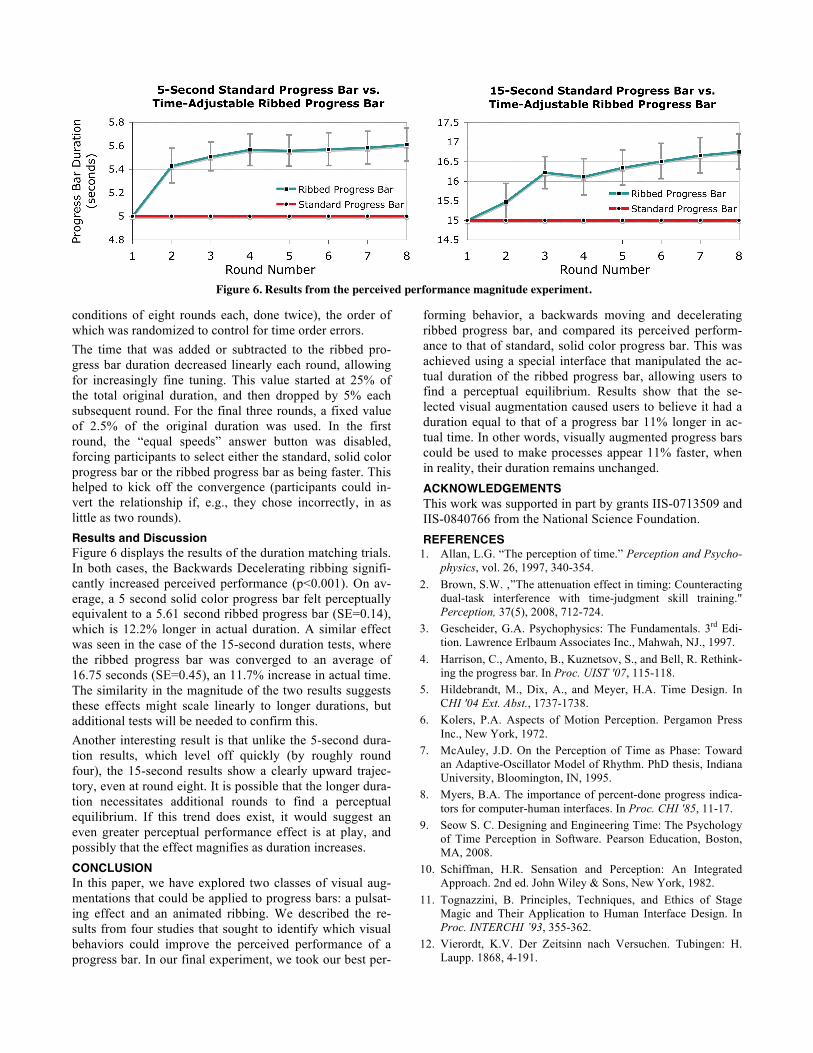
conditions of eight rounds each, done twice), the order of which was randomized to control for time order errors. The time that was added or subtracted to the ribbed pro-gress bar duration decreased linearly each round, allowing for increasingly fine tuning. This value started at 25% of the total original duration, and then dropped by 5% each subsequent round. For the final three rounds, a fixed value of 2.5% of the original duration was used. In the first round, the “equal speeds” answer button was disabled, forcing participants to select either the standard, solid color progress bar or the ribbed progress bar as being faster. This helped to kick off the convergence (participants could in-vert the relationship if, e.g., they chose incorrectly, in as little as two rounds). Results and Discussion Figure 6 displays the results of the duration matching trials. In both cases, the Backwards Decelerating ribbing signifi-cantly increased perceived performance (p<0.001). On av-erage, a 5 second solid color progress bar felt perceptually equivalent to a 5.61 second ribbed progress bar (SE=0.14), which is 12.2% longer in actual duration. A similar effect was seen in the case of the 15-second duration tests, where the ribbed progress bar was converged to an average of 16.75 seconds (SE=0.45), an 11.7% increase in actual time. The similarity in the magnitude of the two results suggests these effects might scale linearly to longer durations, but additional tests will be needed to confirm this. Another interesting result is that unlike the 5-second dura-tion results, which level off quickly (by roughly round four), the 15-second results show a clearly upward trajec-tory, even at round eight. It is possible that the longer dura-tion necessitates additional rounds to find a perceptual equilibrium. If this trend does exist, it would suggest an even greater perceptual performance effect is at play, and possibly that the effect magnifies as duration increases. CONCLUSION In this paper, we have explored two classes of visual aug-mentations that could be applied to progress bars: a pulsat-ing effect and an animated ribbing. We described the re-sults from four studies that sought to identify which visual behaviors could improve the perceived performance of a progress bar. In our final experiment, we took our best per-
forming behavior, a backwards moving and decelerating ribbed progress bar, and compared its perceived perform-ance to that of standard, solid color progress bar. This was achieved using a special interface that manipulated the ac-tual duration of the ribbed progress bar, allowing users to find a perceptual equilibrium. Results show that the se-lected visual augmentation caused users to believe it had a duration equal to that of a progress bar 11% longer in ac-tual time. In other words, visually augmented progress bars could be used to make processes appear 11% faster, when in reality, their duration remains unchanged. ACKNOWLEDGEMENTS This work was supported in part by grants IIS-0713509 and IIS-0840766 from the National Science Foundation. REFERENCES
1. Allan, L.G. “The perception of time.” Perception and Psycho-physics, vol. 26, 1997, 340-354.
2. Brown, S.W. ‚”The attenuation effect in timing: Counteracting dual-task interference with time-judgment skill training." Perception, 37(5), 2008, 712-724.
3. Gescheider, G.A. Psychophysics: The Fundamentals. 3rd Edi-tion. Lawrence Erlbaum Associates Inc., Mahwah, NJ., 1997.
4. Harrison, C., Amento, B., Kuznetsov, S., and Bell, R. Rethink-ing the progress bar. In Proc. UIST '07, 115-118.
5. Hildebrandt, M., Dix, A., and Meyer, H.A. Time Design. In CHI '04 Ext. Abst., 1737-1738.
6. Kolers, P.A. Aspects of Motion Perception. Pergamon Press Inc., New York, 1972.
7. McAuley, J.D. On the Perception of Time as Phase: Toward an Adaptive-Oscillator Model of Rhythm. PhD thesis, Indiana University, Bloomington, IN, 1995.
8. Myers, B.A. The importance of percent-done progress indica-tors for computer-human interfaces. In Proc. CHI '85, 11-17.
9. Seow S. C. Designing and Engineering Time: The Psychology of Time Perception in Software. Pearson Education, Boston, MA, 2008.
10. Schiffman, H.R. Sensation and Perception: An Integrated Approach. 2nd ed. John Wiley & Sons, New York, 1982.
11. Tognazzini, B. Principles, Techniques, and Ethics of Stage Magic and Their Application to Human Interface Design. In Proc. INTERCHI ’93, 355-362.
12. Vierordt, K.V. Der Zeitsinn nach Versuchen. Tubingen: H. Laupp. 1868, 4-191.
Figure 6. Results from the perceived performance magnitude experiment.