Embed Size (px)
Citation preview
TECHNICAL NOTE
1 ISS TECHNICAL NOTE
FastFLIM STED for Alba v5
Yuansheng Sun, Ulas Coskun and Shih-Chu Liao ISS, Inc.
1. Introduction
Stimulated Emission Depletion (STED) is a powerful microscopy technique that allows for the observation of
macromolecular fluorescence structures with spatial resolution below the diffraction limit. The ISS module, developed
for Alba v5, uses the pulsed excitation and pulsed depletion approach (pSTED) in combination with the digital
frequency domain fluorescence lifetime imaging (FastFLIM) to record the time-resolved photons which allows for an
increase in the image resolution and the separation of two labels with a single pair of excitation / depletion lasers.
2. Instrument Set Up
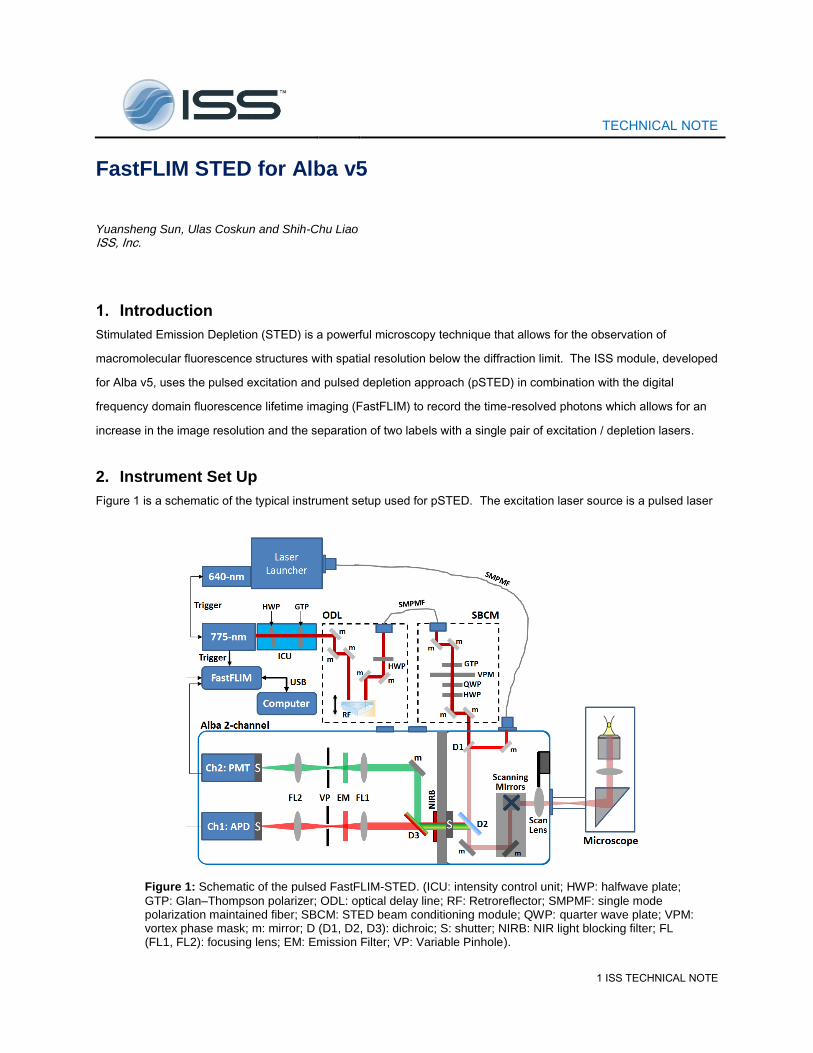
Figure 1 is a schematic of the typical instrument setup used for pSTED. The excitation laser source is a pulsed laser
Figure 1: Schematic of the pulsed FastFLIM-STED. (ICU: intensity control unit; HWP: halfwave plate;
GTP: Glan–Thompson polarizer; ODL: optical delay line; RF: Retroreflector; SMPMF: single mode polarization maintained fiber; SBCM: STED beam conditioning module; QWP: quarter wave plate; VPM: vortex phase mask; m: mirror; D (D1, D2, D3): dichroic; S: shutter; NIRB: NIR light blocking filter; FL (FL1, FL2): focusing lens; EM: Emission Filter; VP: Variable Pinhole).
2 ISS TECHNICAL NOTE
diode by B&H emitting at 640 nm (pulsewidth = 120 ps; rep rate=20/50/80 MHz); the laser is mounted in the ISS laser
launcher and it is delivered to the Alba through a polarization maintained fiber. The depletion source is a fiber laser
by OneFive emitting at 775 nm (pulsewidth about 600ps; rep rate: 20~80 MHz). The intensity control unit (ICU)
allows for control of the laser intensity prior to entering the Optical Delay Line (ODL) module. The beam goes
through the single mode polarization maintained fiber (SMPMF) before entering the STED Beam Conditioning Unit
(SBCM), where it goes through the vortex phase mask (VPM) to generate the “donut-like” point spread function
(PSF) after the objective lens.
In the excitation area of the Alba, the two beams are combined at dichroic D1 and sent to the scanning mirrors
module and hence to the sample.
3. FastFLIM for the time-resolved pSTED acquisition
FastFLIM (www.iss.com/microscopy/components/FastFLIM.html ) is the data acquisition card for FLIM acquisition
when acquisition speed is of the essence. The card is based upon the Digital Frequency Domain (DFD) technique
that allows for the acquisition of Time-Tagged-Time-Resolved data without the dead time typical of TCSPC approach.
The card features an extremely high dynamic range: signals of up to 13 million counts/sec when using the
appropriate detector can be recorded (versus the about 100,000 counts/sec typical of TCSPC). The 4 independent
input channels can be configured for accepting signals from PMTs, APDs with TTL output, or a combination of the
two types of detectors. Decay times from 1 ms to 50 ps can be resolved. The card is supported by Windows 10
operating system and the connection to the computer is through USB2.
4. The Phasor Plot
FastFLIM provides the phase () and the modulation (m) measurements at each modulation frequency as well as the
total intensity at each pixel. These data are ready for analysis using the Phasor Plot
(http://www.iss.com/resources/pdf/technotes/FLIM_Using_Phasor_Plots.pdf), a powerful technique for graphically
separating complex decays times without the assumption of ad-hoc decay models. The phase () and the modulation
(m) measurements at each pixel of the image are transformed to the phasor space (G, S), as G = m·cos() and S
= m·sin(), where is the modulation frequency. Thus, the raw FLIM data measured at each pixel can be directly
located on a 2D phasor plot.
The phasor plot approach provides a linear way of analyzing a complex mixture (Gω, Sω) composed of multiple (e.g.
N) species, each of which is represented by a unique phasor (Gω,i , Sω,i) and can behave as a single-exponential (on
the semicircle) or multi-exponential (inside the semicircle) decay kinetics:
𝐺𝜔 =∑ (𝑓𝑖 ∙ 𝐺𝜔,𝑖)𝑁
𝑖=0 ; 𝑆𝜔 = ∑ (𝑓𝑖 ∙ 𝑆𝜔,𝑖)
𝑁
𝑖=0 ; ∑ (𝑓𝑖)
𝑁𝑖=0 = 1 ;
where fi denotes the contribution of the ith species to the mixture. When the phasor signature of each species (Gω,i ,
Sω,i) is known and given the measurements of enough harmonics (), decomposing the mixture will yield the
contribution of each species (fi).
3 ISS TECHNICAL NOTE
Ideally, only the molecules excited by the excitation laser in the donut center should be detected in order to acquire
an image with high resolution; the background fluorescence given from the depletion (donut) area should be rejected
increasing the deplection laser power is an effective way to reduce this incomplete depletion; however it will also
cause more photo-toxicity. The use of the phasor plot to the time-resolved pSTED images acquired by FastFLIM
allows for the separation of the decay times of completely and partially depleted molecules thus increasing the image
resolution.
5. Results
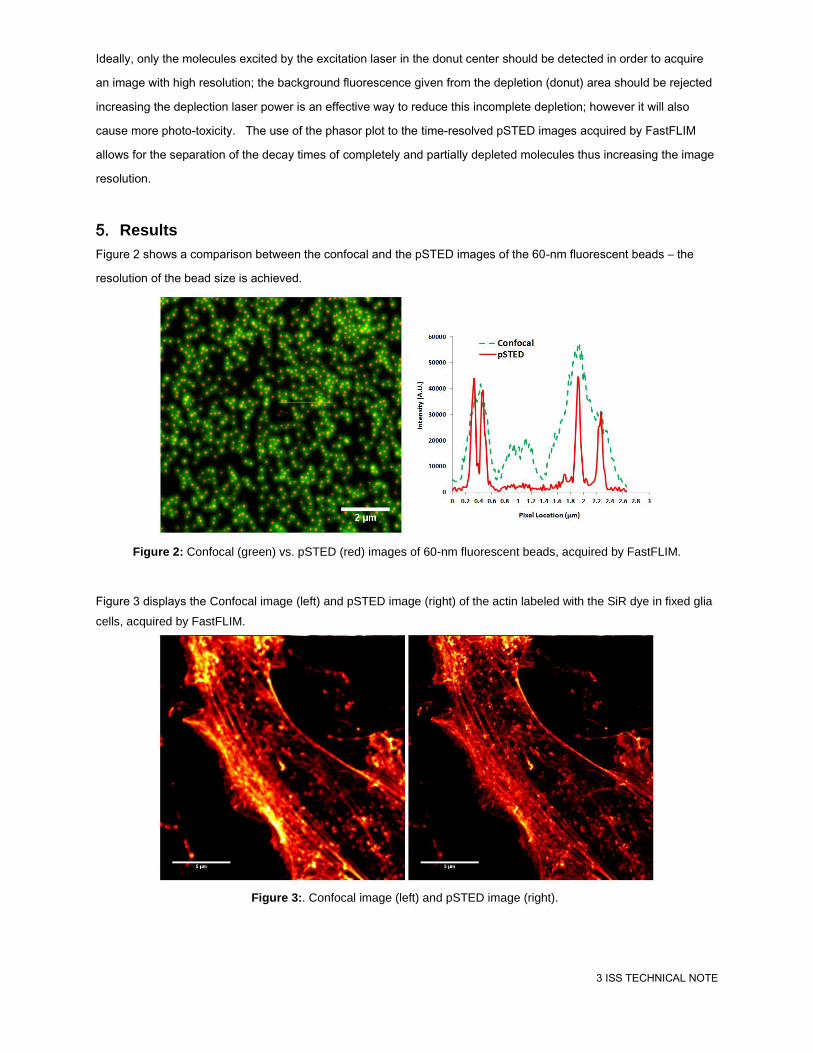
Figure 2 shows a comparison between the confocal and the pSTED images of the 60-nm fluorescent beads – the
resolution of the bead size is achieved.
Figure 2: Confocal (green) vs. pSTED (red) images of 60-nm fluorescent beads, acquired by FastFLIM.
Figure 3 displays the Confocal image (left) and pSTED image (right) of the actin labeled with the SiR dye in fixed glia
cells, acquired by FastFLIM.
Figure 3:. Confocal image (left) and pSTED image (right).
4 ISS TECHNICAL NOTE
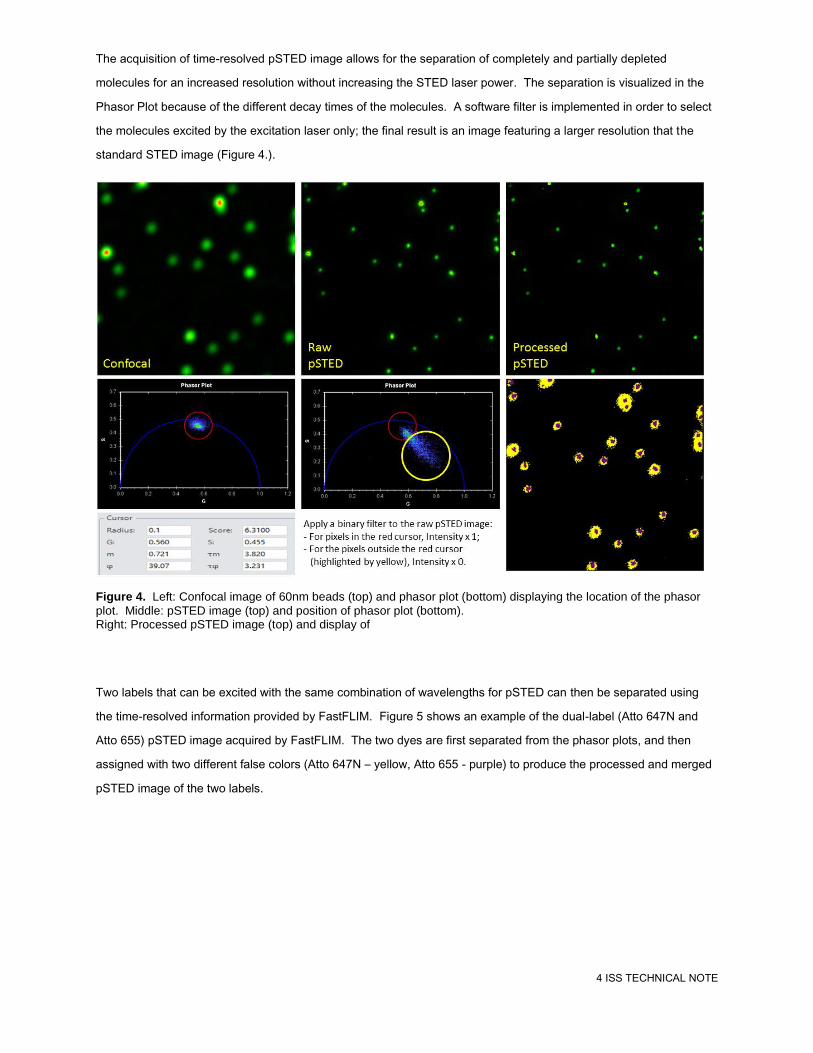
The acquisition of time-resolved pSTED image allows for the separation of completely and partially depleted
molecules for an increased resolution without increasing the STED laser power. The separation is visualized in the
Phasor Plot because of the different decay times of the molecules. A software filter is implemented in order to select
the molecules excited by the excitation laser only; the final result is an image featuring a larger resolution that the
standard STED image (Figure 4.).
Figure 4. Left: Confocal image of 60nm beads (top) and phasor plot (bottom) displaying the location of the phasor
plot. Middle: pSTED image (top) and position of phasor plot (bottom). Right: Processed pSTED image (top) and display of
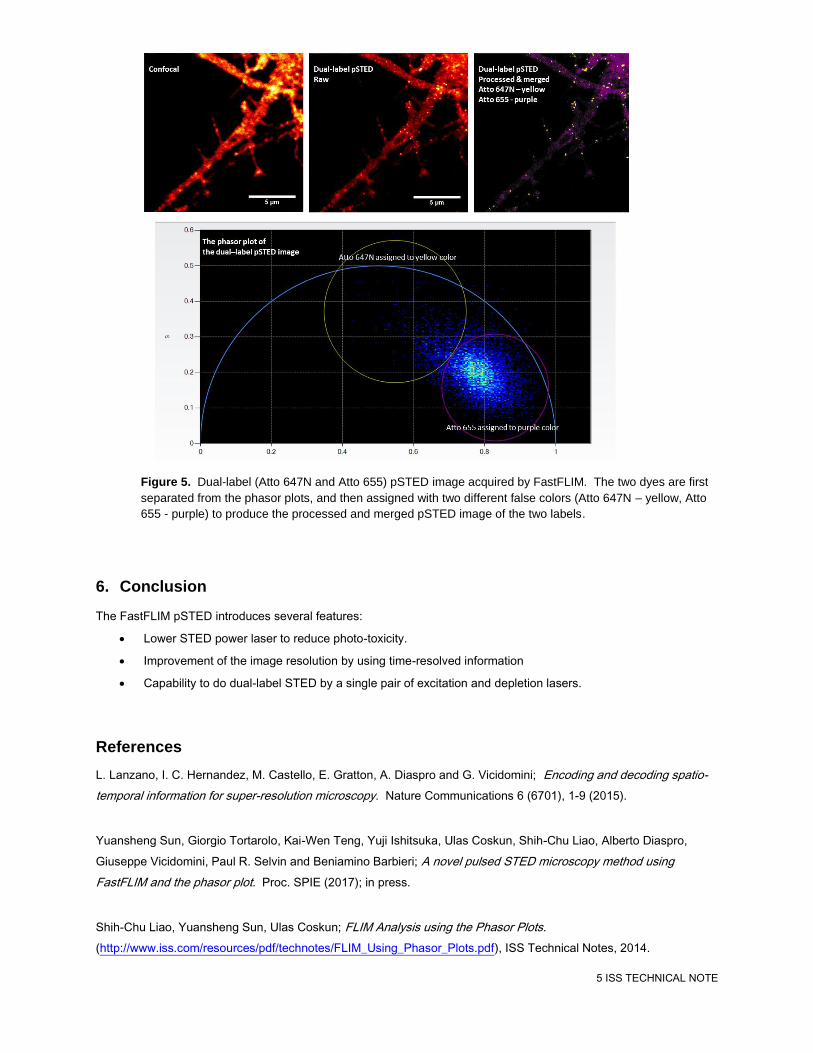
Two labels that can be excited with the same combination of wavelengths for pSTED can then be separated using
the time-resolved information provided by FastFLIM. Figure 5 shows an example of the dual-label (Atto 647N and
Atto 655) pSTED image acquired by FastFLIM. The two dyes are first separated from the phasor plots, and then
assigned with two different false colors (Atto 647N – yellow, Atto 655 - purple) to produce the processed and merged
pSTED image of the two labels.
5 ISS TECHNICAL NOTE
Figure 5. Dual-label (Atto 647N and Atto 655) pSTED image acquired by FastFLIM. The two dyes are first
separated from the phasor plots, and then assigned with two different false colors (Atto 647N – yellow, Atto
655 - purple) to produce the processed and merged pSTED image of the two labels.
6. Conclusion
The FastFLIM pSTED introduces several features:
Lower STED power laser to reduce photo-toxicity.
Improvement of the image resolution by using time-resolved information
Capability to do dual-label STED by a single pair of excitation and depletion lasers.
References
L. Lanzano, I. C. Hernandez, M. Castello, E. Gratton, A. Diaspro and G. Vicidomini; Encoding and decoding spatio-
temporal information for super-resolution microscopy. Nature Communications 6 (6701), 1-9 (2015).
Yuansheng Sun, Giorgio Tortarolo, Kai-Wen Teng, Yuji Ishitsuka, Ulas Coskun, Shih-Chu Liao, Alberto Diaspro,
Giuseppe Vicidomini, Paul R. Selvin and Beniamino Barbieri; A novel pulsed STED microscopy method using
FastFLIM and the phasor plot. Proc. SPIE (2017); in press.
Shih-Chu Liao, Yuansheng Sun, Ulas Coskun; FLIM Analysis using the Phasor Plots.
(http://www.iss.com/resources/pdf/technotes/FLIM_Using_Phasor_Plots.pdf), ISS Technical Notes, 2014.

6 ISS TECHNICAL NOTE
For more information please call (217) 359-8681
or visit our website at www.iss.com
1602 Newton Drive
Champaign, Illinois 61822 USA
Telephone: (217) 359-8681
Fax: (217) 359-7879
Email: [email protected]
Copyright ©2016 ISS, Inc. All Rights Reserved.