Embed Size (px)
Citation preview
This report complies with ISO:20252 standards
and other relevant forms of conduct
Fastrack On-Bus Engagement –
Joint Transportation Board
Prepared by Lake Market Research with Shane Hymers KCC
March 2020
Fastrack Engagement – Research Overview
2
CUSTOMER SATISFACTION SURVEY
• 325 interviews completed at 10 bus hubs selected by Fastrack team (7 minute survey).
• Interviewer shifts were conducted across weekdays / weekends / early mornings and evenings
as applicable. Shifts were determined based on estimated peak travel periods.
CUSTOMER ORIGIN DESTINATION SURVEY
• Passengers were asked to complete origin destination information for journey together with
profiling information whilst on bus.
• Interviewer shifts were conducted across a pre-determined Thursday, Saturday and Sunday on
each route to cover the two buses each hour between the hours of 6.30am and 10pm.
CATCHMENT AREA HOUSEHOLD SURVEY
• Residents within a 500m catchment of the Fastrack
A and B service interviewed in home, capturing
feedback from users, non users and lapsed users.
• 642 interviews completed across catchment area.
FASTRACK DRIVER SURVEY
• Anonymous online survey to capture
feedback on service delivery.
• Lake visit to depot to speak to drivers
first hand.
3
GENDER
PROFILE
All
interviewed
INTERVIEWED AT…
Darent Valley
(30)
Bluewater
(64)
Dartford Home
Gardens
(23)
Temple Hill
(43)
Ebbsfleet
station
(19)
Greenhithe
station
(31)
Bridge
residential
(89)
Garrick
Street
(26)
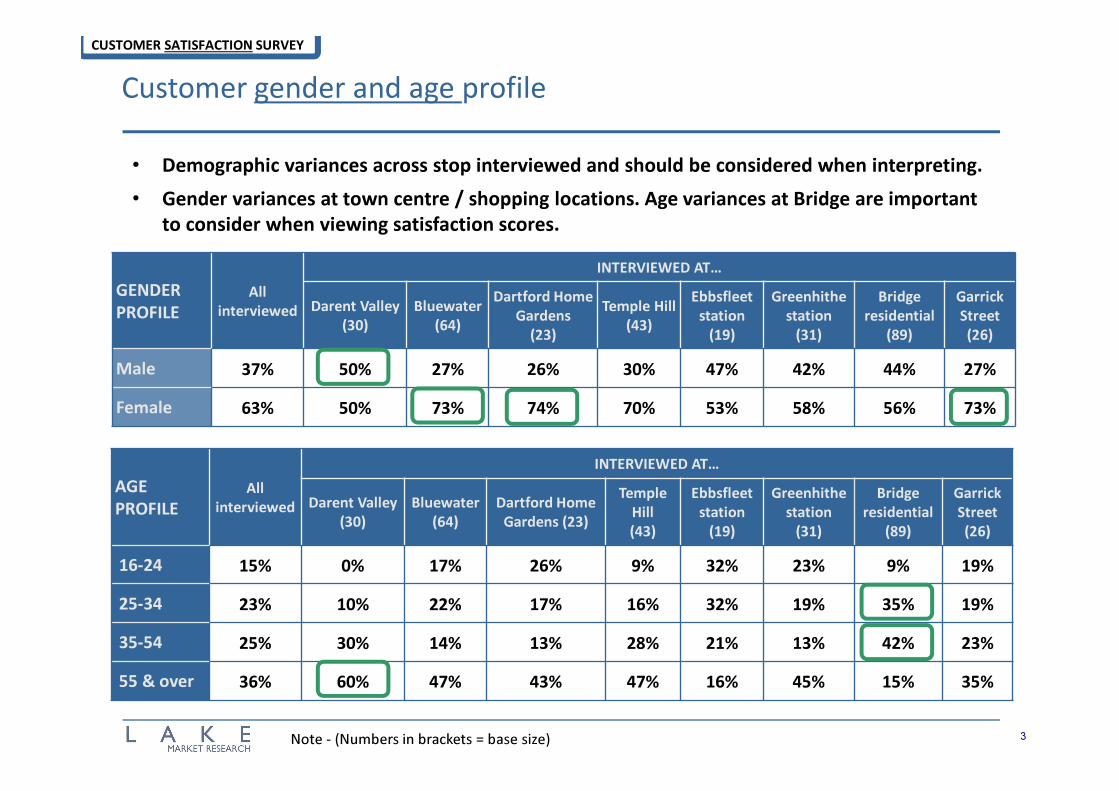
Male 37% 50% 27% 26% 30% 47% 42% 44% 27%
Female 63% 50% 73% 74% 70% 53% 58% 56% 73%
Customer gender and age profile
• Demographic variances across stop interviewed and should be considered when interpreting.
• Gender variances at town centre / shopping locations. Age variances at Bridge are important
to consider when viewing satisfaction scores.
AGE
PROFILE
All
interviewed
INTERVIEWED AT…
Darent Valley
(30)
Bluewater
(64)
Dartford Home
Gardens (23)
Temple
Hill
(43)
Ebbsfleet
station
(19)
Greenhithe
station
(31)
Bridge
residential
(89)
Garrick
Street
(26)
16-24 15% 0% 17% 26% 9% 32% 23% 9% 19%
25-34 23% 10% 22% 17% 16% 32% 19% 35% 19%
35-54 25% 30% 14% 13% 28% 21% 13% 42% 23%
55 & over 36% 60% 47% 43% 47% 16% 45% 15% 35%
Note - (Numbers in brackets = base size)
CUSTOMER SATISFACTION SURVEY
4
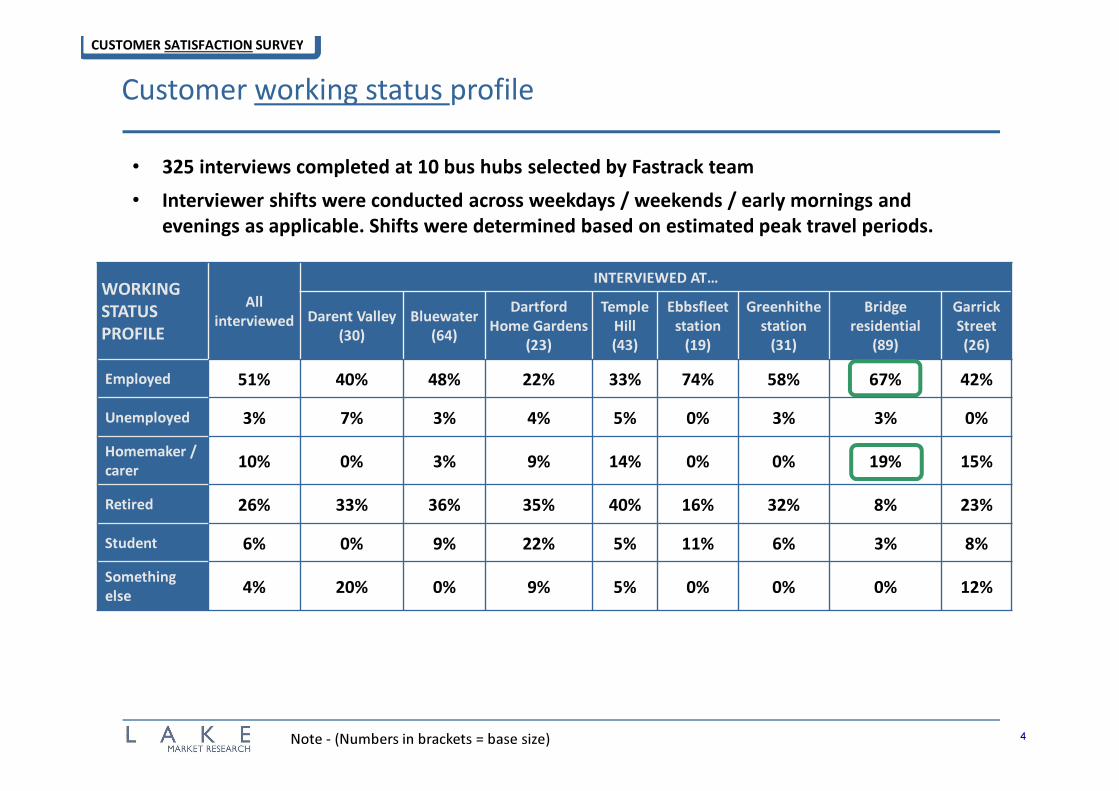
Customer working status profile
• 325 interviews completed at 10 bus hubs selected by Fastrack team
• Interviewer shifts were conducted across weekdays / weekends / early mornings and
evenings as applicable. Shifts were determined based on estimated peak travel periods.
WORKING
STATUS
PROFILE
All
interviewed
INTERVIEWED AT…
Darent Valley
(30)
Bluewater
(64)
Dartford
Home Gardens
(23)
Temple
Hill
(43)
Ebbsfleet
station
(19)
Greenhithe
station
(31)
Bridge
residential
(89)
Garrick
Street
(26)
Employed 51% 40% 48% 22% 33% 74% 58% 67% 42%
Unemployed 3% 7% 3% 4% 5% 0% 3% 3% 0%
Homemaker /
carer10% 0% 3% 9% 14% 0% 0% 19% 15%
Retired 26% 33% 36% 35% 40% 16% 32% 8% 23%
Student 6% 0% 9% 22% 5% 11% 6% 3% 8%
Something
else4% 20% 0% 9% 5% 0% 0% 0% 12%
Note - (Numbers in brackets = base size)
CUSTOMER SATISFACTION SURVEY
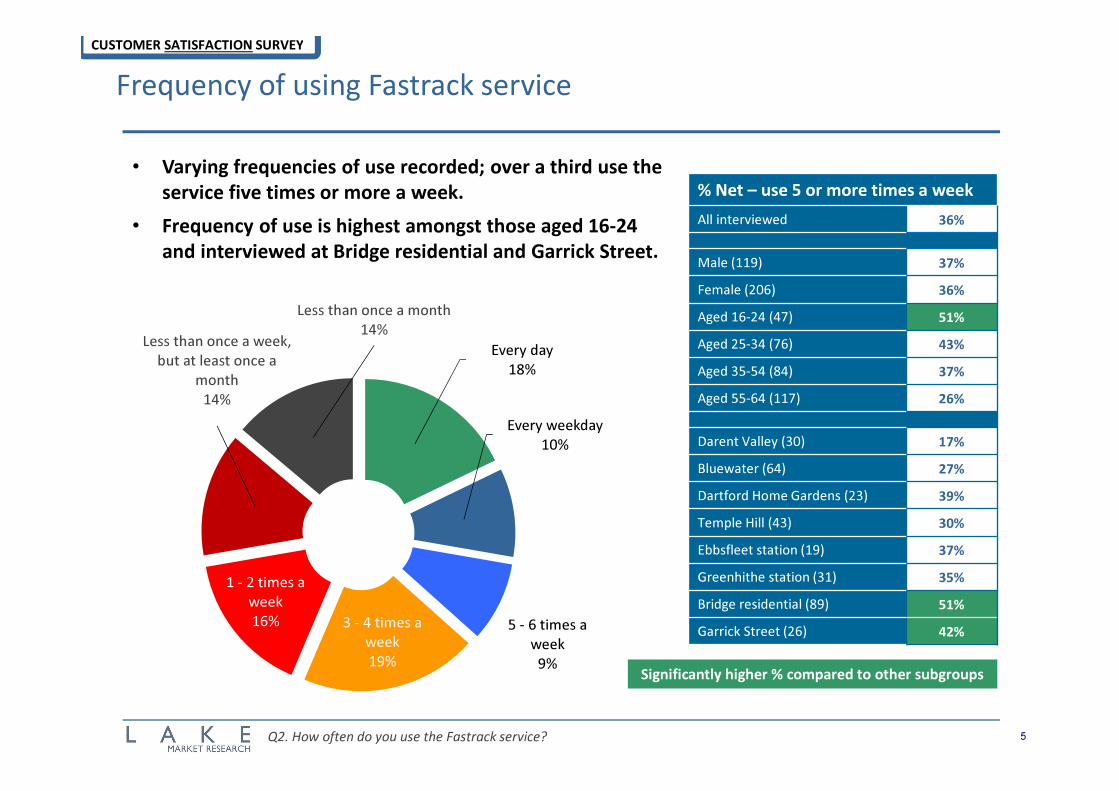
Every day
18%
Every weekday
10%
5 - 6 times a
week
9%
3 - 4 times a
week
19%
1 - 2 times a
week
16%
Less than once a week,
but at least once a
month
14%
Less than once a month
14%
Frequency of using Fastrack service
5Q2. How often do you use the Fastrack service?
% Net – use 5 or more times a week
All interviewed 36%
Male (119) 37%
Female (206) 36%
Aged 16-24 (47) 51%
Aged 25-34 (76) 43%
Aged 35-54 (84) 37%
Aged 55-64 (117) 26%
Darent Valley (30) 17%
Bluewater (64) 27%
Dartford Home Gardens (23) 39%
Temple Hill (43) 30%
Ebbsfleet station (19) 37%
Greenhithe station (31) 35%
Bridge residential (89) 51%
Garrick Street (26) 42%
Significantly higher % compared to other subgroups
CUSTOMER SATISFACTION SURVEY
• Varying frequencies of use recorded; over a third use the
service five times or more a week.
• Frequency of use is highest amongst those aged 16-24
and interviewed at Bridge residential and Garrick Street.
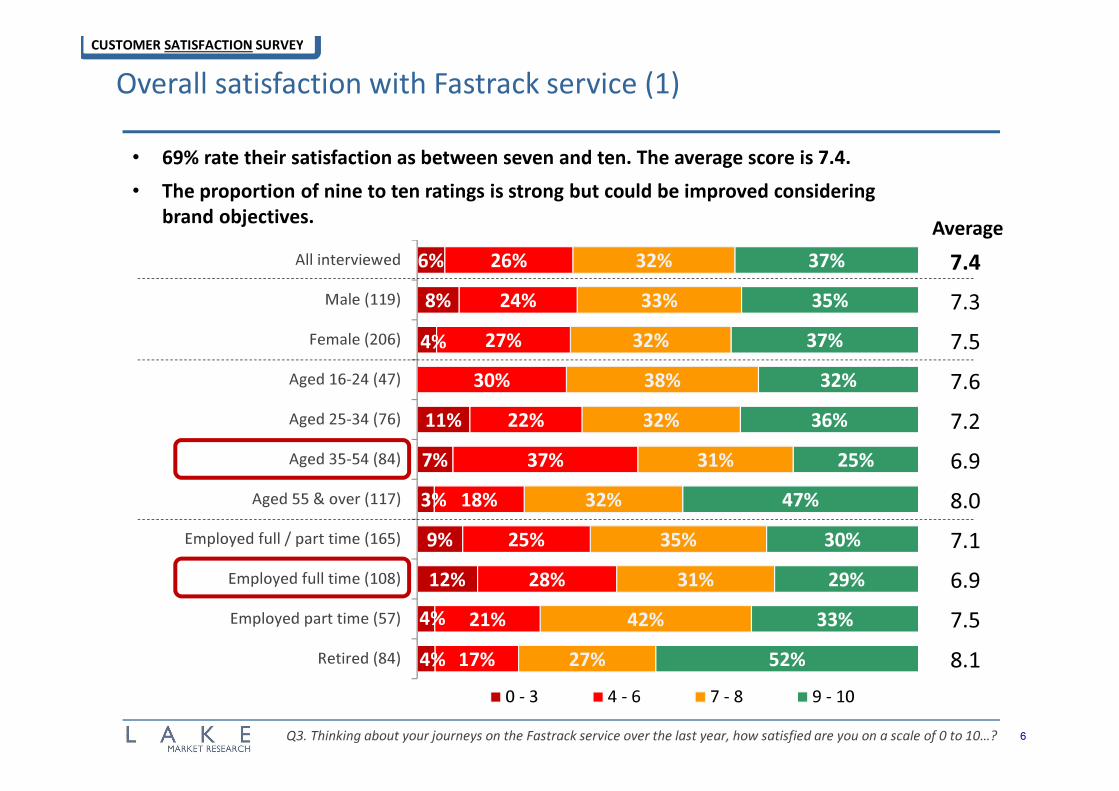
Overall satisfaction with Fastrack service (1)
6Q3. Thinking about your journeys on the Fastrack service over the last year, how satisfied are you on a scale of 0 to 10…?
6%
8%
4%
11%
7%
3%
9%
12%
4%
4%
26%
24%
27%
30%
22%
37%
18%
25%
28%
21%
17%
32%
33%
32%
38%
32%
31%
32%
35%
31%
42%
27%
37%
35%
37%
32%
36%
25%
47%
30%
29%
33%
52%
All interviewed
Male (119)
Female (206)
Aged 16-24 (47)
Aged 25-34 (76)
Aged 35-54 (84)
Aged 55 & over (117)
Employed full / part time (165)
Employed full time (108)
Employed part time (57)
Retired (84)
0 - 3 4 - 6 7 - 8 9 - 10
Average
7.4
7.3
7.5
7.6
7.2
6.9
8.0
7.1
6.9
7.5
8.1
CUSTOMER SATISFACTION SURVEY
• 69% rate their satisfaction as between seven and ten. The average score is 7.4.
• The proportion of nine to ten ratings is strong but could be improved considering
brand objectives.
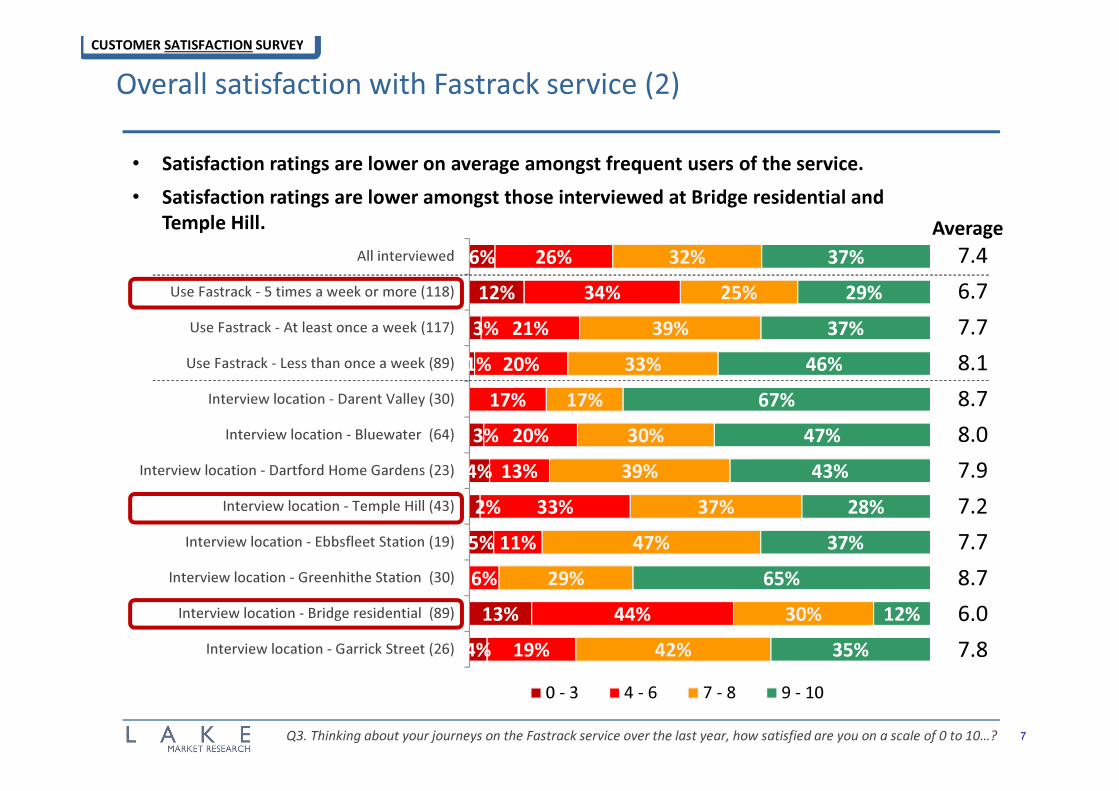
Overall satisfaction with Fastrack service (2)
7Q3. Thinking about your journeys on the Fastrack service over the last year, how satisfied are you on a scale of 0 to 10…?
6%
12%
3%
1%
3%
4%
2%
5%
13%
4%
26%
34%
21%
20%
17%
20%
13%
33%
11%
6%
44%
19%
32%
25%
39%
33%
17%
30%
39%
37%
47%
29%
30%
42%
37%
29%
37%
46%
67%
47%
43%
28%
37%
65%
12%
35%
All interviewed
Use Fastrack - 5 times a week or more (118)
Use Fastrack - At least once a week (117)
Use Fastrack - Less than once a week (89)
Interview location - Darent Valley (30)
Interview location - Bluewater (64)
Interview location - Dartford Home Gardens (23)
Interview location - Temple Hill (43)
Interview location - Ebbsfleet Station (19)
Interview location - Greenhithe Station (30)
Interview location - Bridge residential (89)
Interview location - Garrick Street (26)
0 - 3 4 - 6 7 - 8 9 - 10
7.4
6.7
7.7
8.1
8.7
8.0
7.9
7.2
7.7
8.7
6.0
7.8
• Satisfaction ratings are lower on average amongst frequent users of the service.
• Satisfaction ratings are lower amongst those interviewed at Bridge residential and
Temple Hill. Average
CUSTOMER SATISFACTION SURVEY
41%
20%
8%
6%
3%
3%
3%
2%
2%
2%
1%
1%
10%
4%
Nothing / the service meets my needs
Punctuality / to be on time
More frequent / regular services
Fewer delays / cancellations / greater reliability
More polite / considerate / helpful drivers
More accurate / updated information at bus stops
Less bunching of buses / several buses arriving at the same time
Held up due to traffic / contingency plans
Cheaper / lower fares
Better service / more buses in the evenings / at night
Improved Sunday service
Faster times / routes
Don't know
Other
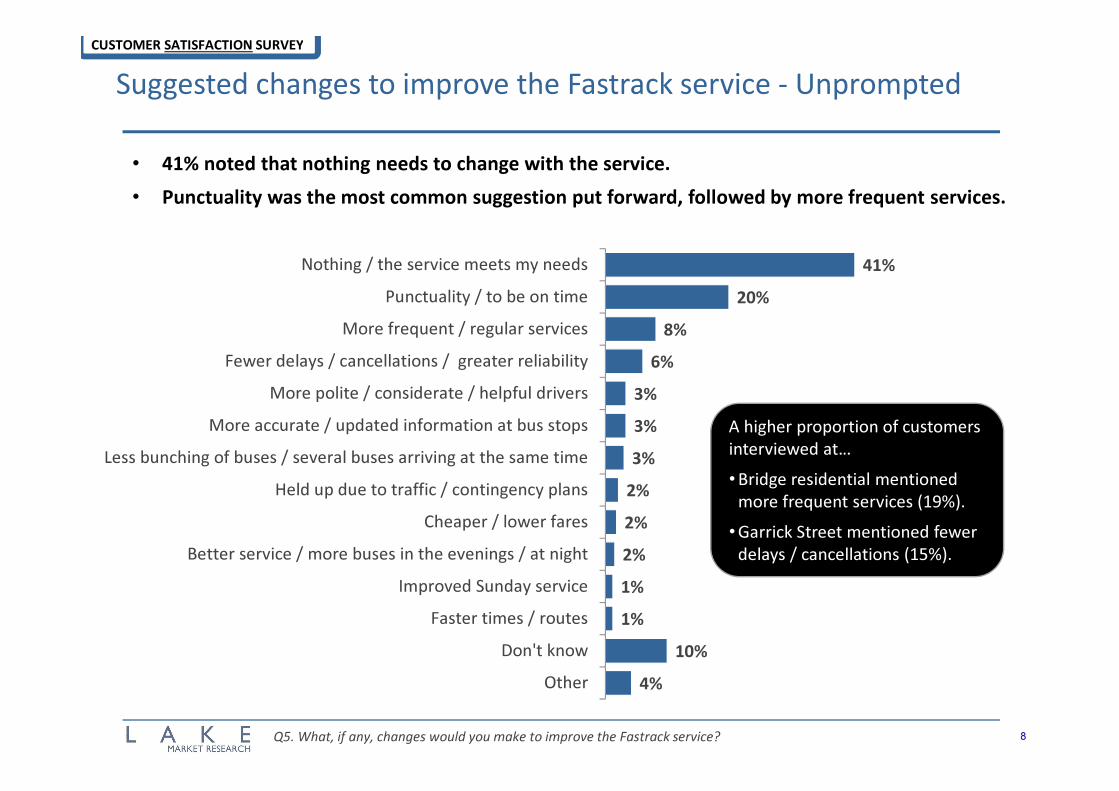
Suggested changes to improve the Fastrack service - Unprompted
8Q5. What, if any, changes would you make to improve the Fastrack service?
• 41% noted that nothing needs to change with the service.
• Punctuality was the most common suggestion put forward, followed by more frequent services.
A higher proportion of customers
interviewed at…
•Bridge residential mentioned
more frequent services (19%).
•Garrick Street mentioned fewer
delays / cancellations (15%).
CUSTOMER SATISFACTION SURVEY
4%
4%
8%
7%
10%
7%
9%
13%
10%
12%
13%
31%
33%
27%
33%
32%
42%
30%
33%
35%
30%
43%
64%
62%
64%
59%
58%
51%
60%
53%
53%
57%
43%
Ease of getting on & off the bus
Cleanliness & condition of inside of bus
Your personal safety on the bus
Safety of driving
Cleanliness & condition of outside of bus
Distance of bus stops to destination/connecting transport
Level of crowding inside bus
Greeting / welcome received from drivers
Helpfulness & attitude of drivers
Availability of seating & space to stand
Distance of bus stops from journey start
0 - 3 4 - 6 7 - 8 9 - 10
Average
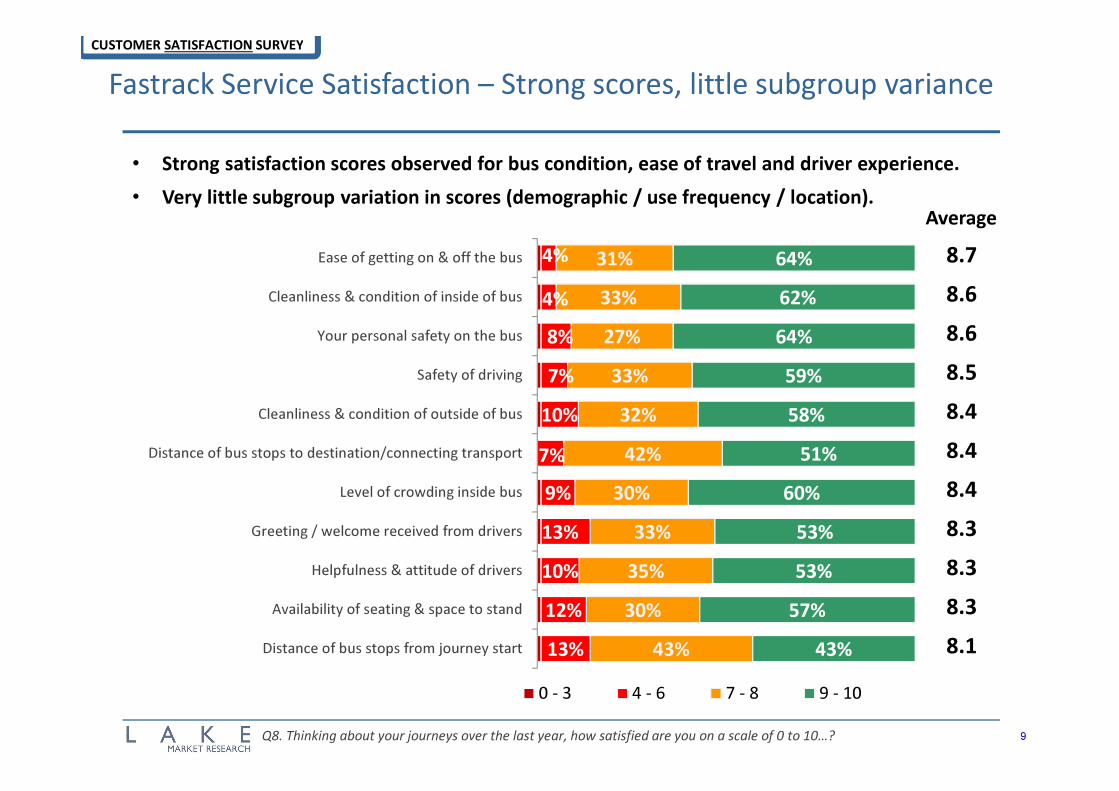
Fastrack Service Satisfaction – Strong scores, little subgroup variance
9Q8. Thinking about your journeys over the last year, how satisfied are you on a scale of 0 to 10…?
8.7
8.6
8.6
8.5
8.4
8.4
8.4
8.3
8.3
8.3
8.1
• Strong satisfaction scores observed for bus condition, ease of travel and driver experience.
• Very little subgroup variation in scores (demographic / use frequency / location).
CUSTOMER SATISFACTION SURVEY
2%
1%
3%
2%
4%
5%
6%
7%
14%
19%
18%
21%
22%
20%
17%
28%
40%
38%
39%
36%
35%
38%
42%
34%
44%
43%
40%
41%
39%
37%
35%
31%
Condition / standard of maintenance of bus stops
The hours of operation
Value for money
Timetable information provided in bus
Timetable information at bus stops
Frequency of the service
Punctuality of bus / turning up on time
Accuracy of information provided on real-time
passenger boards
0 - 3 4 - 6 7 - 8 9 - 10
Average
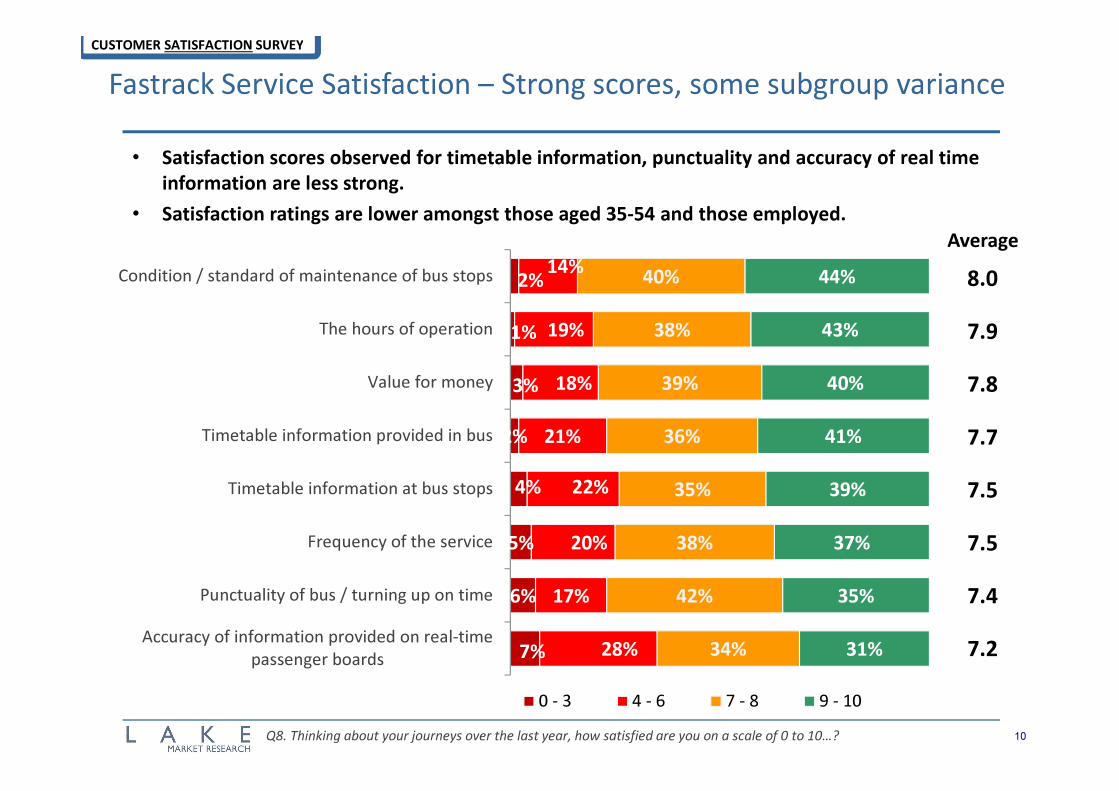
Fastrack Service Satisfaction – Strong scores, some subgroup variance
10Q8. Thinking about your journeys over the last year, how satisfied are you on a scale of 0 to 10…?
8.0
7.9
7.8
7.7
7.5
7.5
7.4
7.2
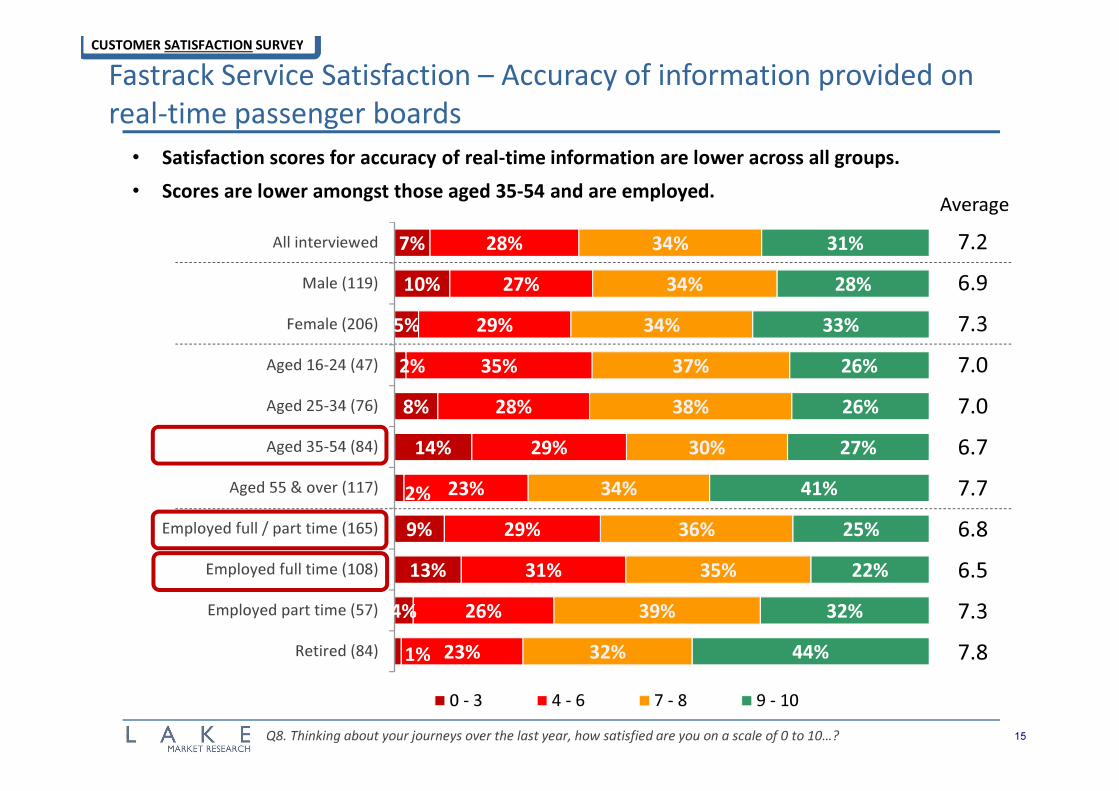
• Satisfaction scores observed for timetable information, punctuality and accuracy of real time
information are less strong.
• Satisfaction ratings are lower amongst those aged 35-54 and those employed.
CUSTOMER SATISFACTION SURVEY
5%
8%
3%
9%
7%
7%
1%
8%
9%
5%
20%
18%
21%
23%
22%
26%
12%
21%
20%
21%
13%
38%
34%
40%
32%
37%
43%
38%
40%
39%
42%
37%
37%
40%
35%
36%
34%
24%
50%
32%
31%
32%
50%
All interviewed
Male (119)
Female (206)
Aged 16-24 (47)
Aged 25-34 (76)
Aged 35-54 (84)
Aged 55 & over (117)
Employed full / part time (165)
Employed full time (108)
Employed part time (57)
Retired (84)
0 - 3 4 - 6 7 - 8 9 - 10
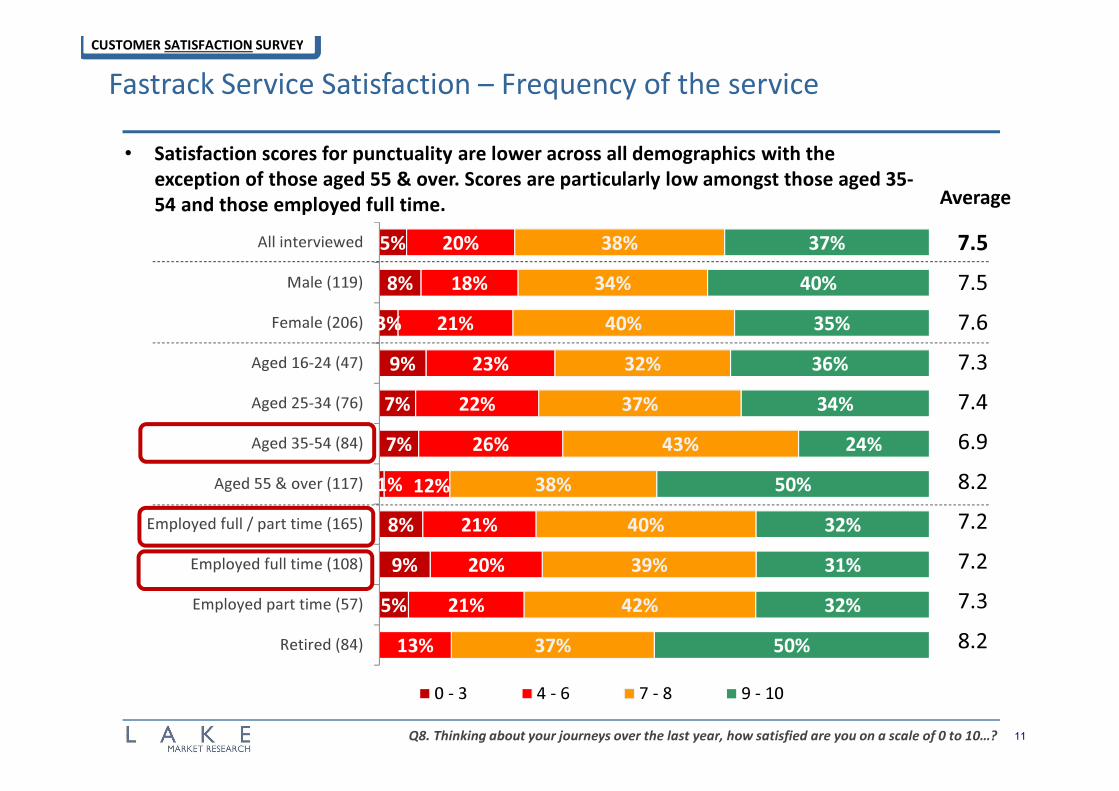
Fastrack Service Satisfaction – Frequency of the service
11Q8. Thinking about your journeys over the last year, how satisfied are you on a scale of 0 to 10…?
7.5
7.5
7.6
7.3
7.4
6.9
8.2
7.2
7.2
7.3
8.2
CUSTOMER SATISFACTION SURVEY
Average
• Satisfaction scores for punctuality are lower across all demographics with the
exception of those aged 55 & over. Scores are particularly low amongst those aged 35-
54 and those employed full time.
5%
10%
2%
2%
3%
7%
10%
8%
20%
27%
20%
10%
10%
14%
9%
19%
11%
6%
36%
23%
38%
32%
41%
42%
23%
39%
52%
51%
37%
26%
39%
31%
37%
31%
38%
46%
67%
44%
39%
23%
53%
68%
15%
38%
All interviewed
Use Fastrack - 5 times a week or more (118)
Use Fastrack - At least once a week (117)
Use Fastrack - Less than once a week (89)
Interview location - Darent Valley (30)
Interview location - Bluewater (64)
Interview location - Dartford Home Gardens (23)
Interview location - Temple Hill (43)
Interview location - Ebbsfleet Station (19)
Interview location - Greenhithe Station (30)
Interview location - Bridge residential (89)
Interview location - Garrick Street (26)
0 - 3 4 - 6 7 - 8 9 - 10
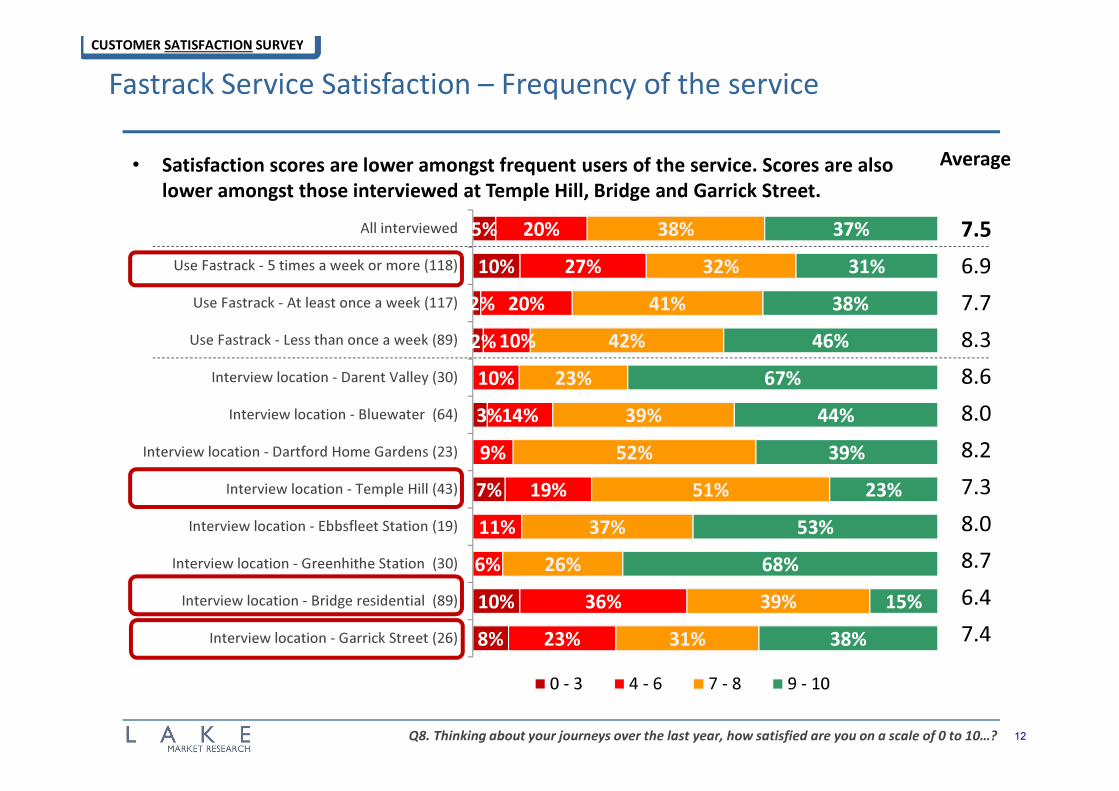
Fastrack Service Satisfaction – Frequency of the service
12Q8. Thinking about your journeys over the last year, how satisfied are you on a scale of 0 to 10…?
7.5
6.9
7.7
8.3
8.6
8.0
8.2
7.3
8.0
8.7
6.4
7.4
CUSTOMER SATISFACTION SURVEY
Average• Satisfaction scores are lower amongst frequent users of the service. Scores are also
lower amongst those interviewed at Temple Hill, Bridge and Garrick Street.
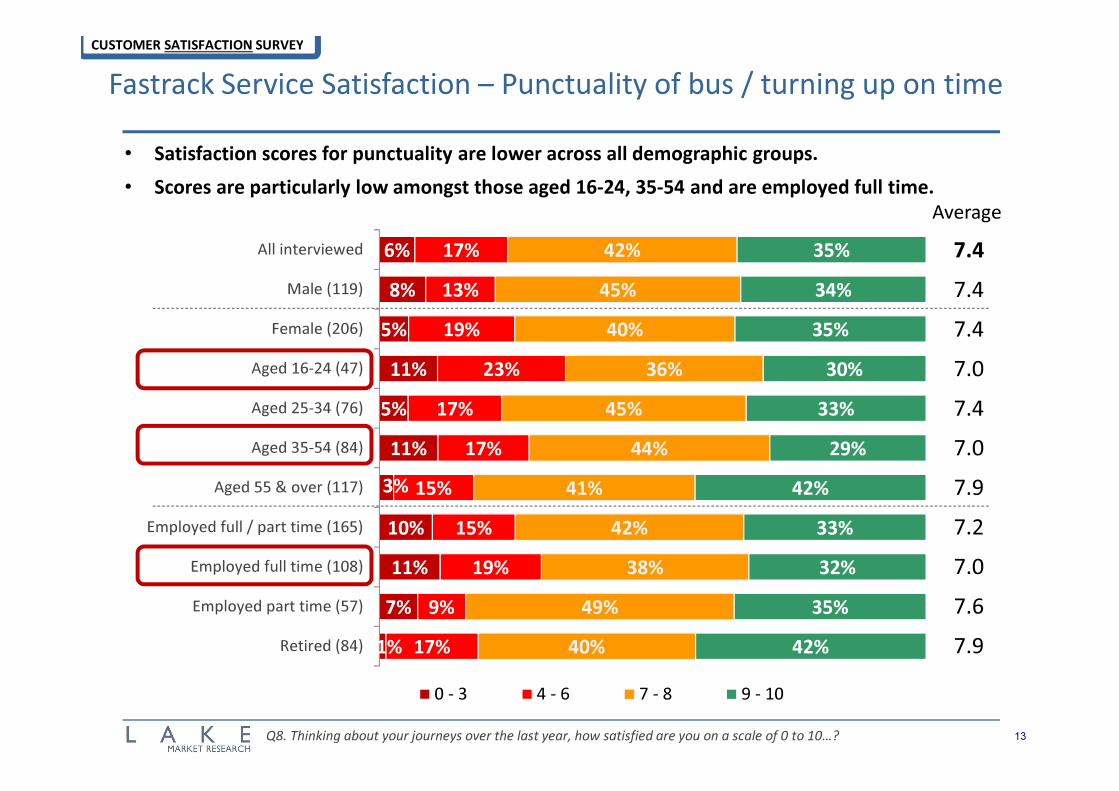
Fastrack Service Satisfaction – Punctuality of bus / turning up on time
13
6%
8%
5%
11%
5%
11%
3%
10%
11%
7%
1%
17%
13%
19%
23%
17%
17%
15%
15%
19%
9%
17%
42%
45%
40%
36%
45%
44%
41%
42%
38%
49%
40%
35%
34%
35%
30%
33%
29%
42%
33%
32%
35%
42%
All interviewed
Male (119)
Female (206)
Aged 16-24 (47)
Aged 25-34 (76)
Aged 35-54 (84)
Aged 55 & over (117)
Employed full / part time (165)
Employed full time (108)
Employed part time (57)
Retired (84)
0 - 3 4 - 6 7 - 8 9 - 10
7.4
7.4
7.4
7.0
7.4
7.0
7.9
7.2
7.0
7.6
7.9
Average
• Satisfaction scores for punctuality are lower across all demographic groups.
• Scores are particularly low amongst those aged 16-24, 35-54 and are employed full time.
Q8. Thinking about your journeys over the last year, how satisfied are you on a scale of 0 to 10…?
CUSTOMER SATISFACTION SURVEY
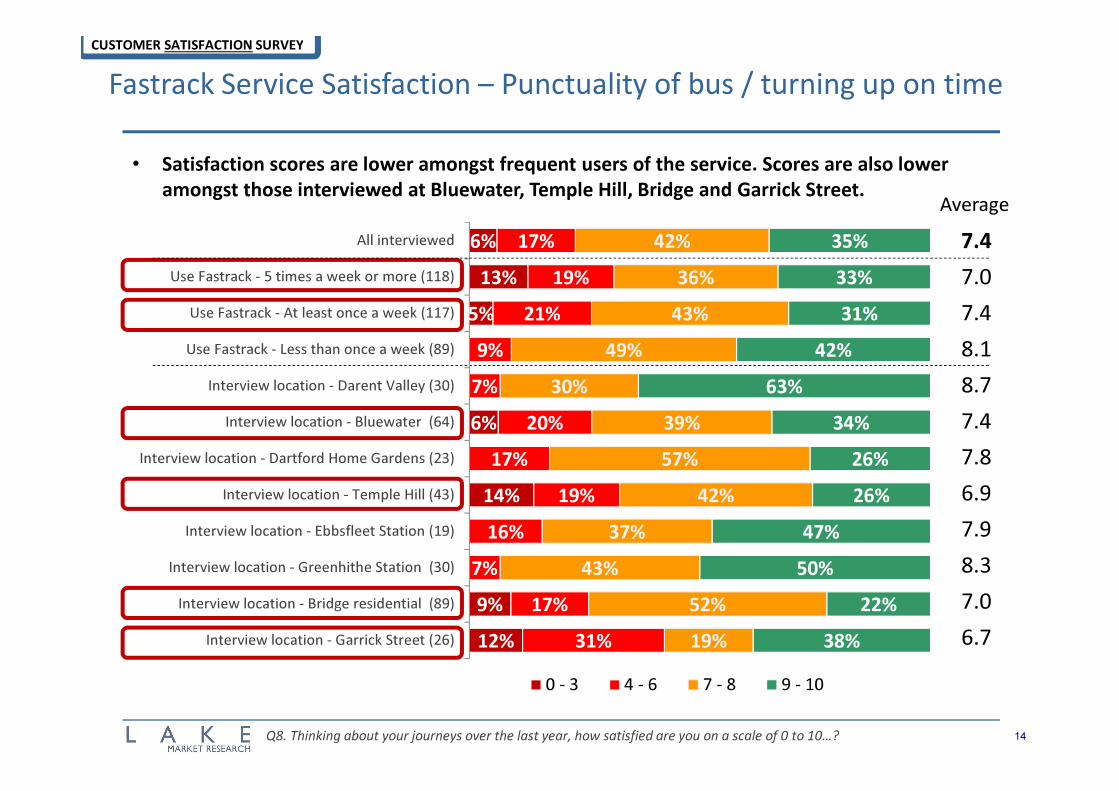
Fastrack Service Satisfaction – Punctuality of bus / turning up on time
14
6%
13%
5%
6%
14%
9%
12%
17%
19%
21%
9%
7%
20%
17%
19%
16%
7%
17%
31%
42%
36%
43%
49%
30%
39%
57%
42%
37%
43%
52%
19%
35%
33%
31%
42%
63%
34%
26%
26%
47%
50%
22%
38%
All interviewed
Use Fastrack - 5 times a week or more (118)
Use Fastrack - At least once a week (117)
Use Fastrack - Less than once a week (89)
Interview location - Darent Valley (30)
Interview location - Bluewater (64)
Interview location - Dartford Home Gardens (23)
Interview location - Temple Hill (43)
Interview location - Ebbsfleet Station (19)
Interview location - Greenhithe Station (30)
Interview location - Bridge residential (89)
Interview location - Garrick Street (26)
0 - 3 4 - 6 7 - 8 9 - 10
7.4
7.0
7.4
8.1
8.7
7.4
7.8
6.9
7.9
8.3
7.0
6.7
Average
• Satisfaction scores are lower amongst frequent users of the service. Scores are also lower
amongst those interviewed at Bluewater, Temple Hill, Bridge and Garrick Street.
Q8. Thinking about your journeys over the last year, how satisfied are you on a scale of 0 to 10…?
CUSTOMER SATISFACTION SURVEY
Fastrack Service Satisfaction – Accuracy of information provided on
real-time passenger boards
15
7%
10%
5%
2%
8%
14%
2%
9%
13%
4%
1%
28%
27%
29%
35%
28%
29%
23%
29%
31%
26%
23%
34%
34%
34%
37%
38%
30%
34%
36%
35%
39%
32%
31%
28%
33%
26%
26%
27%
41%
25%
22%
32%
44%
All interviewed
Male (119)
Female (206)
Aged 16-24 (47)
Aged 25-34 (76)
Aged 35-54 (84)
Aged 55 & over (117)
Employed full / part time (165)
Employed full time (108)
Employed part time (57)
Retired (84)
0 - 3 4 - 6 7 - 8 9 - 10
7.2
6.9
7.3
7.0
7.0
6.7
7.7
6.8
6.5
7.3
7.8
Q8. Thinking about your journeys over the last year, how satisfied are you on a scale of 0 to 10…?
Average
• Satisfaction scores for accuracy of real-time information are lower across all groups.
• Scores are lower amongst those aged 35-54 and are employed.
CUSTOMER SATISFACTION SURVEY
Fastrack Service Satisfaction – Accuracy of information provided on
real-time passenger boards
16
7%
11%
4%
3%
3%
10%
15%
10%
28%
32%
29%
22%
10%
36%
9%
38%
21%
3%
39%
20%
34%
30%
35%
40%
20%
27%
48%
38%
32%
48%
37%
25%
31%
27%
32%
35%
70%
34%
43%
14%
47%
48%
9%
45%
All interviewed
Use Fastrack - 5 times a week or more (118)
Use Fastrack - At least once a week (117)
Use Fastrack - Less than once a week (89)
Interview location - Darent Valley (30)
Interview location - Bluewater (64)
Interview location - Dartford Home Gardens (23)
Interview location - Temple Hill (43)
Interview location - Ebbsfleet Station (19)
Interview location - Greenhithe Station (30)
Interview location - Bridge residential (89)
Interview location - Garrick Street (26)
0 - 3 4 - 6 7 - 8 9 - 10
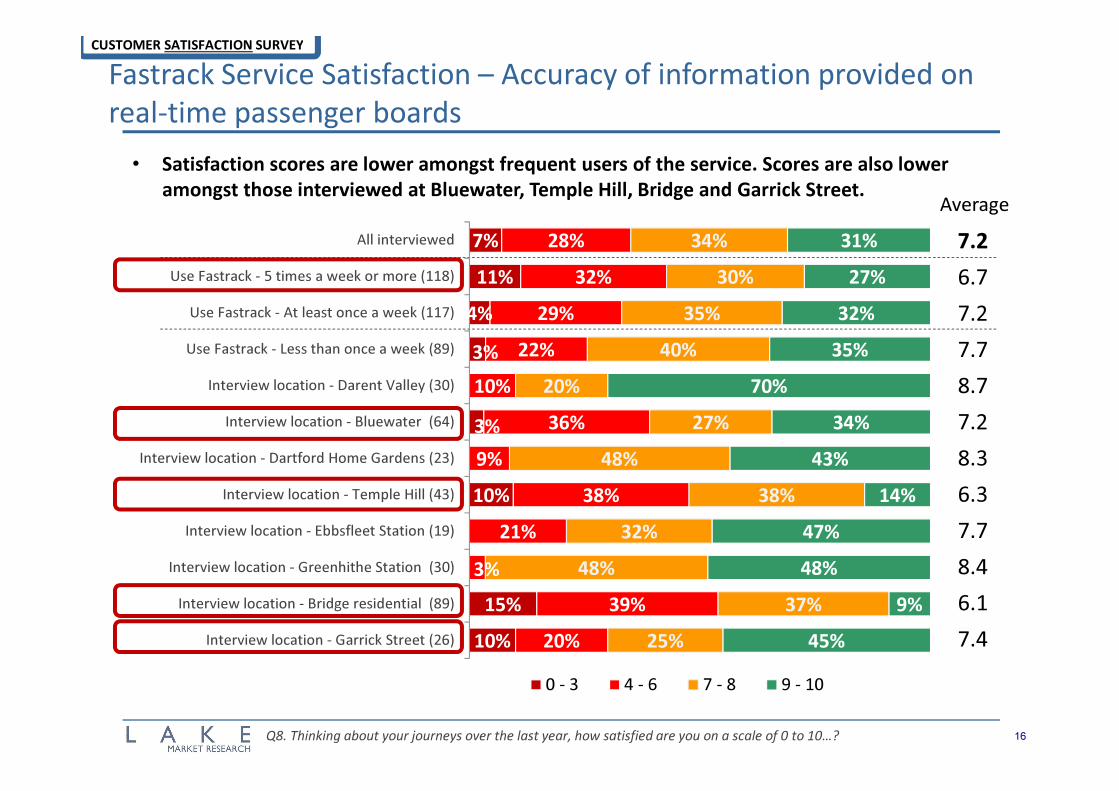
7.2
6.7
7.2
7.7
8.7
7.2
8.3
6.3
7.7
8.4
6.1
7.4
Q8. Thinking about your journeys over the last year, how satisfied are you on a scale of 0 to 10…?
Average
• Satisfaction scores are lower amongst frequent users of the service. Scores are also lower
amongst those interviewed at Bluewater, Temple Hill, Bridge and Garrick Street.
CUSTOMER SATISFACTION SURVEY
Fastrack Service Satisfaction – Value for money
17
3%
3%
3%
3%
4%
4%
2%
3%
4%
0%
0%
18%
14%
21%
22%
16%
26%
11%
22%
19%
27%
9%
39%
42%
36%
44%
42%
40%
32%
43%
47%
35%
33%
40%
41%
39%
31%
38%
30%
56%
33%
30%
38%
58%
All interviewed
Male (119)
Female (206)
Aged 16-24 (47)
Aged 25-34 (76)
Aged 35-54 (84)
Aged 55 & over (117)
Employed full / part time (165)
Employed full time (108)
Employed part time (57)
Retired (84)
0 - 3 4 - 6 7 - 8 9 - 10
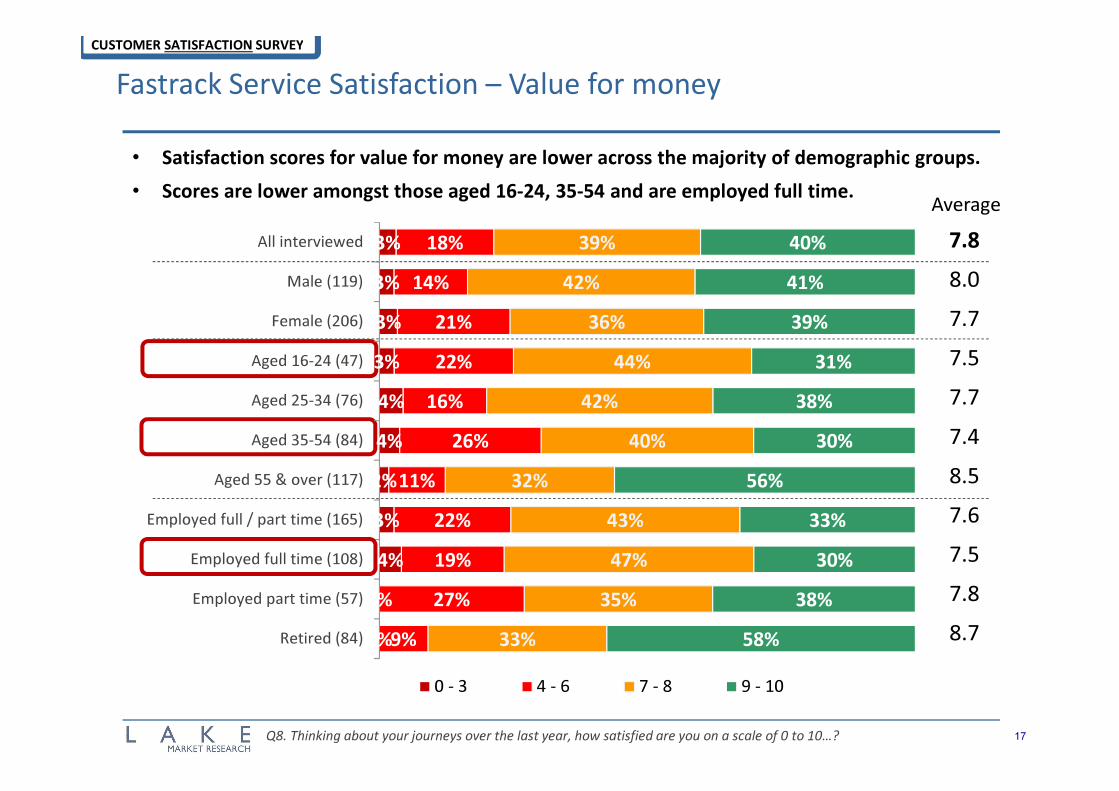
7.8
8.0
7.7
7.5
7.7
7.4
8.5
7.6
7.5
7.8
8.7
Q8. Thinking about your journeys over the last year, how satisfied are you on a scale of 0 to 10…?
Average
• Satisfaction scores for value for money are lower across the majority of demographic groups.
• Scores are lower amongst those aged 16-24, 35-54 and are employed full time.
CUSTOMER SATISFACTION SURVEY
Fastrack Service Satisfaction – Value for money
18
3%
8%
2%
5%
13%
3%
8%
18%
24%
12%
18%
7%
32%
13%
22%
12%
4%
8%
33%
39%
32%
45%
38%
22%
32%
33%
35%
65%
42%
85%
29%
40%
36%
41%
44%
70%
32%
40%
41%
24%
54%
38%
All interviewed
Use Fastrack - 5 times a week or more (118)
Use Fastrack - At least once a week (117)
Use Fastrack - Less than once a week (89)
Interview location - Darent Valley (30)
Interview location - Bluewater (64)
Interview location - Dartford Home Gardens (23)
Interview location - Temple Hill (43)
Interview location - Ebbsfleet Station (19)
Interview location - Greenhithe Station (30)
Interview location - Bridge residential (89)
Interview location - Garrick Street (26)
0 - 3 4 - 6 7 - 8 9 - 10
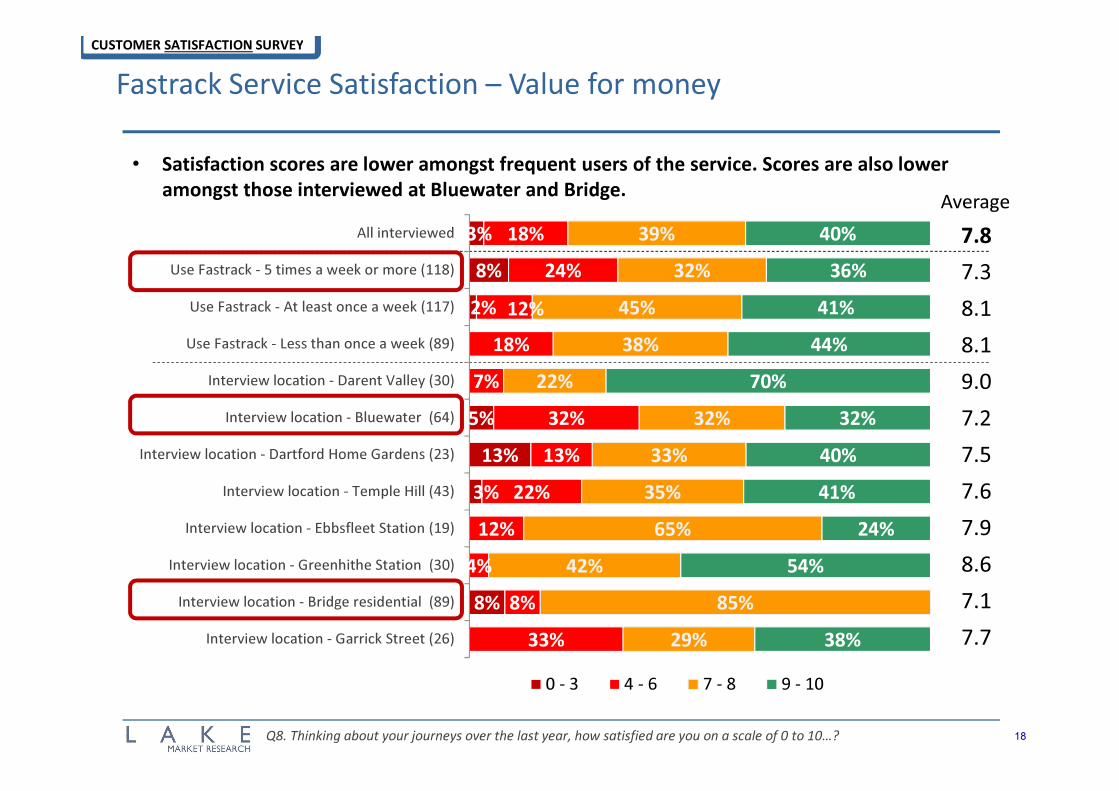
7.8
7.3
8.1
8.1
9.0
7.2
7.5
7.6
7.9
8.6
7.1
7.7
Q8. Thinking about your journeys over the last year, how satisfied are you on a scale of 0 to 10…?
Average
• Satisfaction scores are lower amongst frequent users of the service. Scores are also lower
amongst those interviewed at Bluewater and Bridge.
CUSTOMER SATISFACTION SURVEY
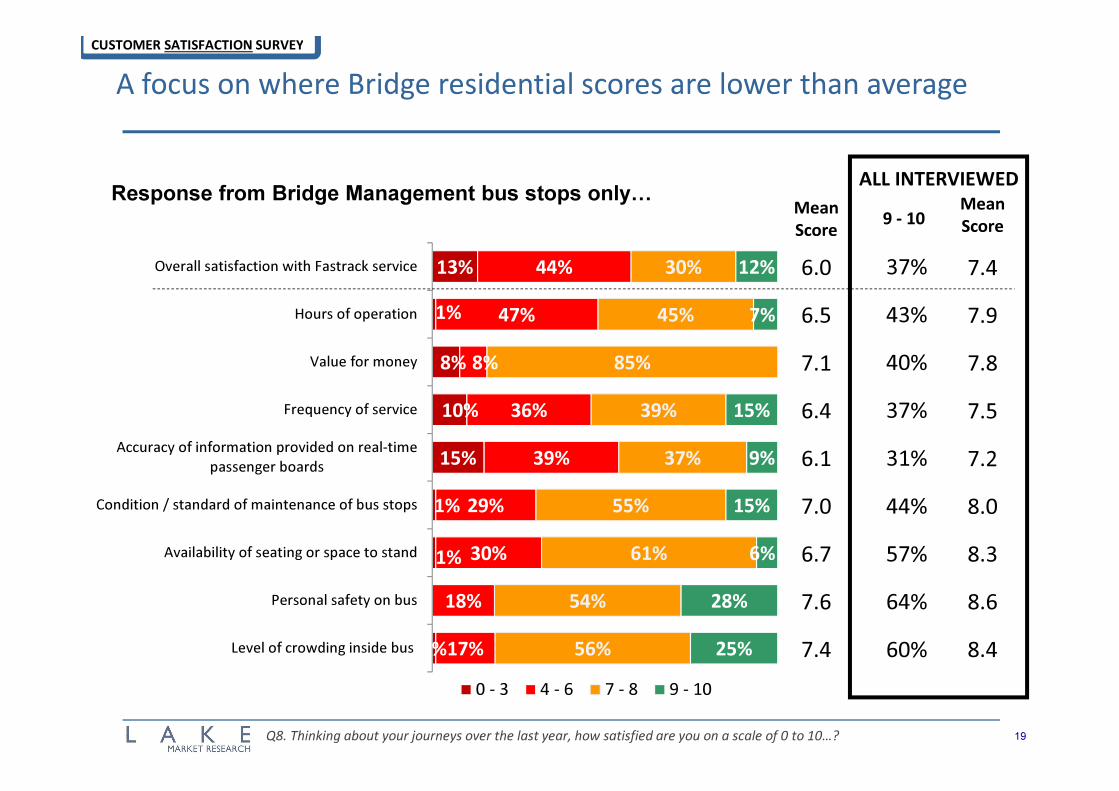
A focus on where Bridge residential scores are lower than average
19
13%
1%
8%
10%
15%
1%
1%
1%
44%
47%
8%
36%
39%
29%
30%
18%
17%
30%
45%
85%
39%
37%
55%
61%
54%
56%
12%
7%
15%
9%
15%
6%
28%
25%
Overall satisfaction with Fastrack service
Hours of operation
Value for money
Frequency of service
Accuracy of information provided on real-time
passenger boards
Condition / standard of maintenance of bus stops
Availability of seating or space to stand
Personal safety on bus
Level of crowding inside bus
0 - 3 4 - 6 7 - 8 9 - 10
Mean
Score
7.4
7.9
7.8
7.5
7.2
8.0
8.3
8.6
8.4
9 - 10
37%
43%
40%
37%
31%
44%
57%
64%
60%
ALL INTERVIEWED
Mean
Score
6.0
6.5
7.1
6.4
6.1
7.0
6.7
7.6
7.4
Response from Bridge Management bus stops only…
Q8. Thinking about your journeys over the last year, how satisfied are you on a scale of 0 to 10…?
CUSTOMER SATISFACTION SURVEY
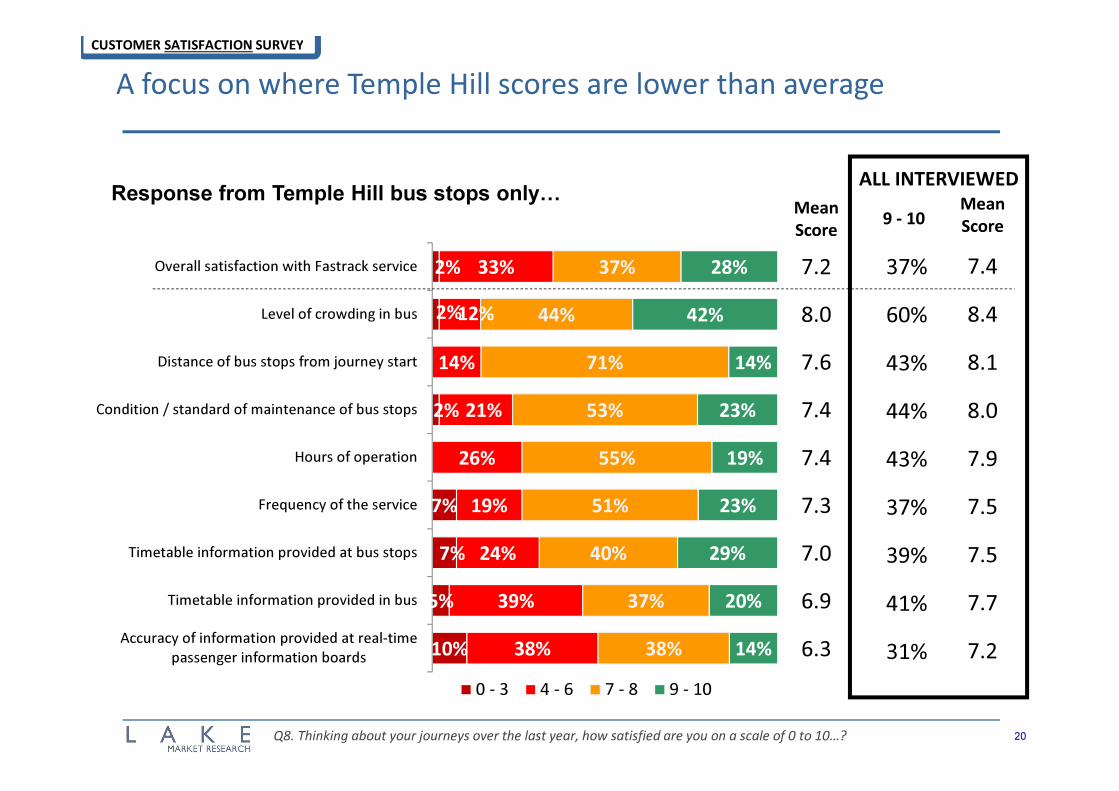
A focus on where Temple Hill scores are lower than average
20Q8. Thinking about your journeys over the last year, how satisfied are you on a scale of 0 to 10…?
2%
2%
2%
7%
7%
5%
10%
33%
12%
14%
21%
26%
19%
24%
39%
38%
37%
44%
71%
53%
55%
51%
40%
37%
38%
28%
42%
14%
23%
19%
23%
29%
20%
14%
Overall satisfaction with Fastrack service
Level of crowding in bus
Distance of bus stops from journey start
Condition / standard of maintenance of bus stops
Hours of operation
Frequency of the service
Timetable information provided at bus stops
Timetable information provided in bus
Accuracy of information provided at real-time
passenger information boards
0 - 3 4 - 6 7 - 8 9 - 10
Mean
Score
7.4
8.4
8.1
8.0
7.9
7.5
7.5
7.7
7.2
9 - 10
37%
60%
43%
44%
43%
37%
39%
41%
31%
ALL INTERVIEWED
Mean
Score
7.2
8.0
7.6
7.4
7.4
7.3
7.0
6.9
6.3
Response from Temple Hill bus stops only…
CUSTOMER SATISFACTION SURVEY
33%
23%
14%
13%
13%
11%
11%
10%
7%
6%
5%
4%
1%
Nothing needs improving on the service
More reliable journey times
More buses per hour
Less congestion / traffic jams on route
Improved real-time information at bus stops
Improved timetable information at bus stops
More buses at evenings and weekends
A bus stop nearer my home
Faster journey times
Less road works on route
Extend the routes to other destinations
A smoother ride
Improved personal safety on bus
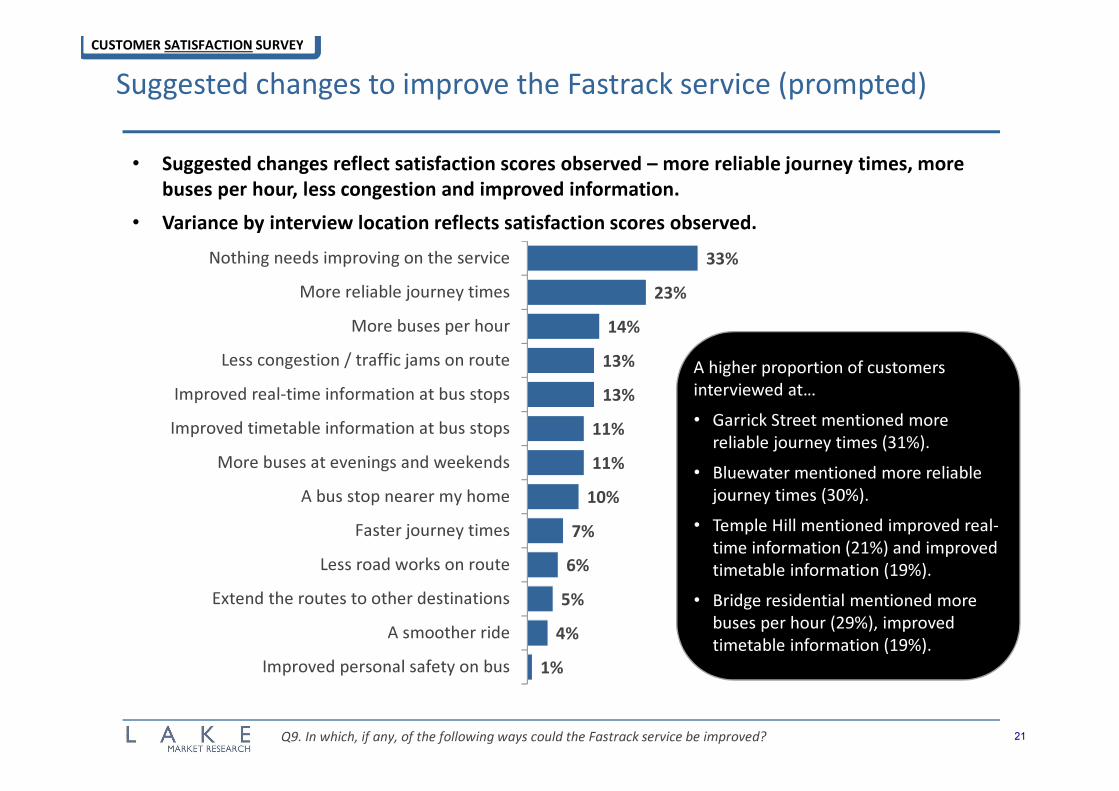
Suggested changes to improve the Fastrack service (prompted)
21Q9. In which, if any, of the following ways could the Fastrack service be improved?
• Suggested changes reflect satisfaction scores observed – more reliable journey times, more
buses per hour, less congestion and improved information.
• Variance by interview location reflects satisfaction scores observed.
CUSTOMER SATISFACTION SURVEY
A higher proportion of customers
interviewed at…
• Garrick Street mentioned more
reliable journey times (31%).
• Bluewater mentioned more reliable
journey times (30%).
• Temple Hill mentioned improved real-
time information (21%) and improved
timetable information (19%).
• Bridge residential mentioned more
buses per hour (29%), improved
timetable information (19%).
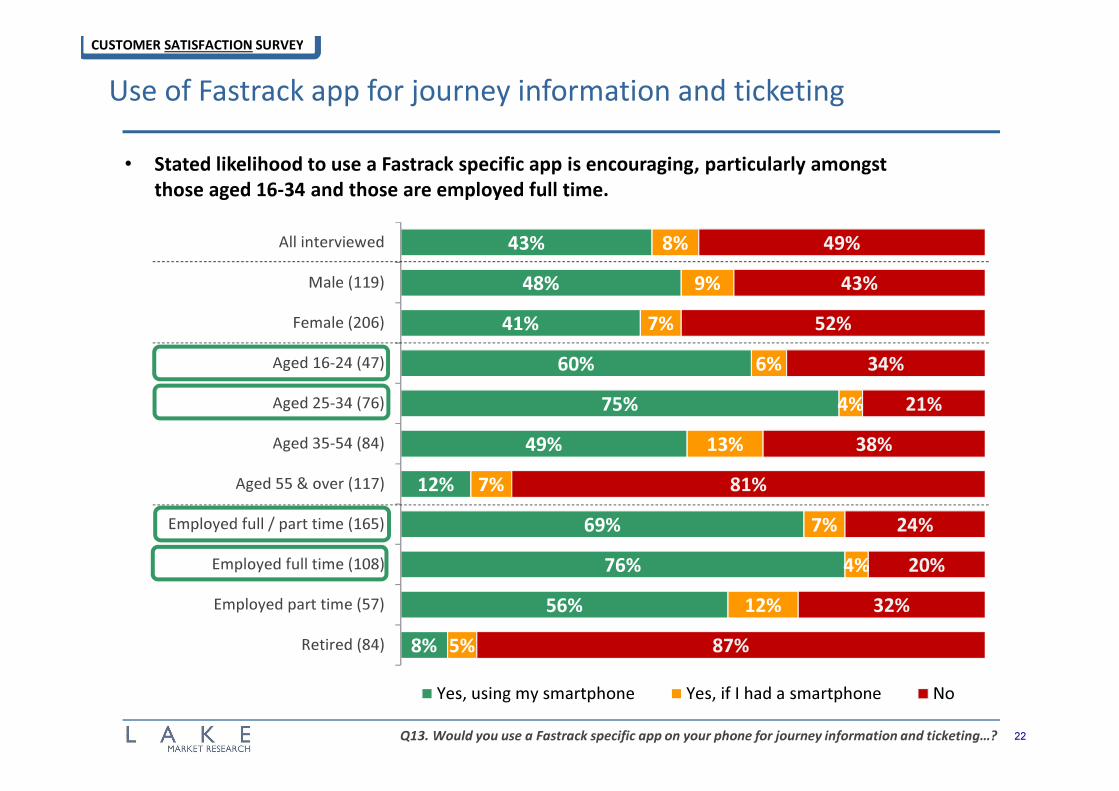
43%
48%
41%
60%
75%
49%
12%
69%
76%
56%
8%
8%
9%
7%
6%
4%
13%
7%
7%
4%
12%
5%
49%
43%
52%
34%
21%
38%
81%
24%
20%
32%
87%
All interviewed
Male (119)
Female (206)
Aged 16-24 (47)
Aged 25-34 (76)
Aged 35-54 (84)
Aged 55 & over (117)
Employed full / part time (165)
Employed full time (108)
Employed part time (57)
Retired (84)
Yes, using my smartphone Yes, if I had a smartphone No
Use of Fastrack app for journey information and ticketing
22Q13. Would you use a Fastrack specific app on your phone for journey information and ticketing…?
CUSTOMER SATISFACTION SURVEY
• Stated likelihood to use a Fastrack specific app is encouraging, particularly amongst
those aged 16-34 and those are employed full time.
43%
59%
39%
28%
30%
33%
22%
28%
47%
52%
66%
38%
8%
8%
9%
6%
7%
4%
28%
11%
49%
33%
51%
66%
63%
67%
74%
44%
53%
48%
22%
62%
All interviewed
Use Fastrack - 5 times a week or more (118)
Use Fastrack - At least once a week (117)
Use Fastrack - Less than once a week (89)
Interview location - Darent Valley (30)
Interview location - Bluewater (64)
Interview location - Dartford Home Gardens (23)
Interview location - Temple Hill (43)
Interview location - Ebbsfleet Station (19)
Interview location - Greenhithe Station (30)
Interview location - Bridge residential (89)
Interview location - Garrick Street (26)
Yes, using my smartphone Yes, if I had a smartphone No
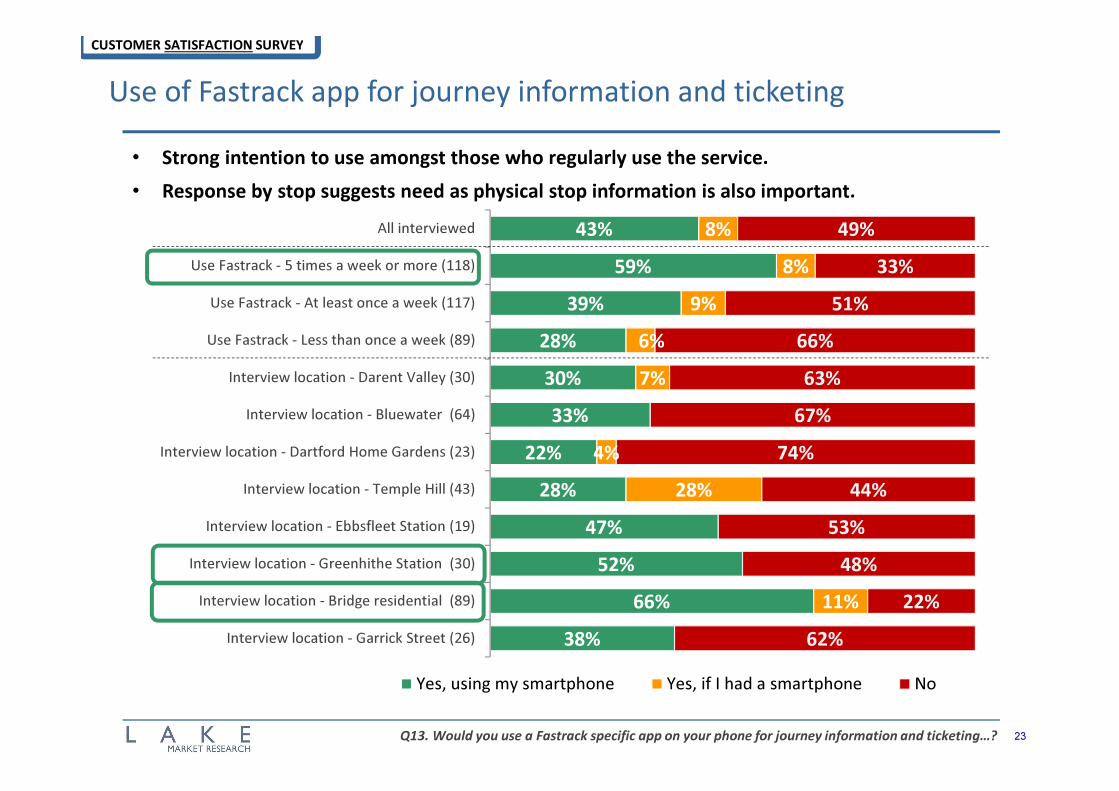
Use of Fastrack app for journey information and ticketing
23
CUSTOMER SATISFACTION SURVEY
• Strong intention to use amongst those who regularly use the service.
• Response by stop suggests need as physical stop information is also important.
Q13. Would you use a Fastrack specific app on your phone for journey information and ticketing…?