Embed Size (px)
DESCRIPTION
RQ vs FQ
Citation preview
I From the Department of Human Biology. University of Limburg.Maastricht. The Netherlands.
2 Address reprint requests to KR Westerterp. Department of HumanBiology. University of Limburg. P0 Box 616. 6200 MD, Maastricht.
The Netherlands.
.Ini J (l/ii \zuir 1993:57(suppl):759S-65S. Printed in USA. � 1993 American Society for Clinical Nutrition 759S
Food quotient, respiratory quotient, and energy balance1’2
Klaas R H ‘e.sterierp
ABSTRACT This paper reviews evidence that the macro-
nutrient composition ofthe diet and the maintenance of energy
balance are correlated. Intervention studies show that subjects
lose weight on low-fat diets and gain weight on high-fat diets.
Descriptive studies show that overweight subjects eat relatively
more fat but have the same total energy intake as nonoverweight
subjects. The body has a limited ability to oxidize fat compared
with its ability to oxidize carbohydrate and protein. The con-
elusion is that becoming overweight can be prevented by reducing
the fat content of the diet. Studies on nutrient utilization show
a ready increase in carbohydrate oxidation whereas fat oxidation
does not change after meals enriched with, respectively, carbo-
hydrate or fat. However, in the long term, the respiratory quotient
(RQ) is closer to the food quotient (FQ) for subjects eating high-
fat diets than it is for subjects eating high-carbohydrate diets.
For high-carbohydrate diets, the RQ is lower than is the FQ.
indicating that subjects must mobilize body fat. This is supported
by data on body weight loss in subjects changing from a standard
maintenance diet to a low-fat diet, even while energy intake was
increased with nearly 20% . Direct evidence for a higher energy
expenditure for low-fat diets is not yet available. ..1,;i J (liii
Nutr I 993:57(suppl):759S-65S.
KEY WORDS Food quotient, respiratory quotient, energy
balance, diets, carbohydrate, protein. fat
Introduction
Humans consume food to maintain energy balance. Food en-
ergy is consumed in the form ofcarbohydrate, protein, and fat,
the macronutrients of our diet. The distribution of food energy
between the macronutrients differs between cultures and coun-
tries. There is a fairly wide range of carbohydrate-protein-fat
ratios (c:p:f) at which energy balance can be maintained. as
shown by nationwide studies of nutrient intake (Table I). The
carbohydrate intake ranges from 3 to 82 en% and the fat intake
ranges from 6 to 54 en#{176}%. whereas the protein intake is at least
1 1 en%. Within one culture or country. dietary changes take
place with changes in food supply. There is an increasing avail-
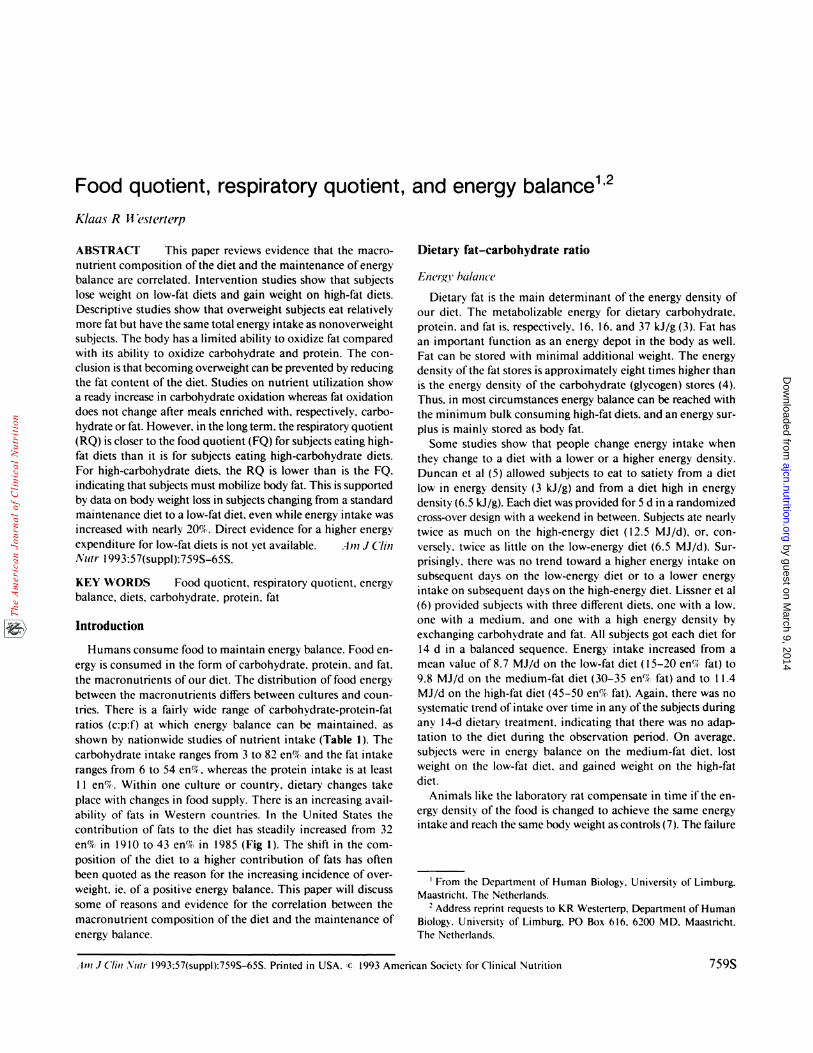
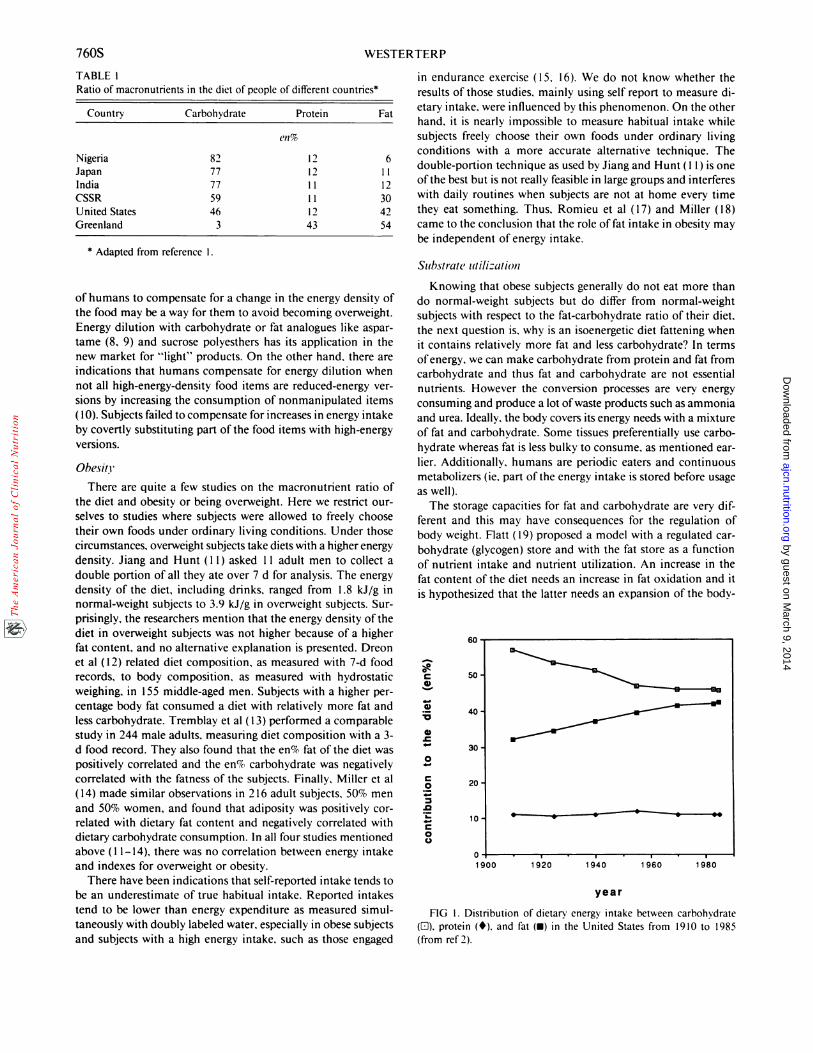
ability of fats in Western countries. In the United States the
contribution of fats to the diet has steadily increased from 32
en% in 1910 to 43 en% in 1985 (Fig I). The shift in the com-
position of the diet to a higher contribution of fats has often
been quoted as the reason for the increasing incidence of over-
weight. ie, of a positive energy balance. This paper will discuss
some of reasons and evidence for the correlation between the
macronutnient composition ofthe diet and the maintenance of
energy balance.
Dietary fat-carbohydrate ratio
Eneigi balance
Dietary fat is the main determinant ofthe energy density of
our diet. The metabolizable energy for dietary carbohydrate.
protein. and fat is. respectively. 16. 16. and 37 kJ/g (3). Fat has
an important function as an energy depot in the body as well.
Fat can be stored with minimal additional weight. The energy
density ofthe fat stores is approximately eight times higher than
is the energy density of the carbohydrate (glycogen) stores (4).
Thus. in most circumstances energy balance can be reached with
the minimum bulk consuming high-fat diets. and an energy sur-
plus is mainly stored as body fat.
Some studies show that people change energy intake when
they change to a diet with a lower or a higher energy density.
Duncan et al (5) allowed subjects to eat to satiety from a diet
low in energy density (3 kJ/g) and from a diet high in energy
density (6.5 kJ/g). Each diet was provided for 5 d in a randomized
cross-over design with a weekend in between. Subjects ate nearly
twice as much on the high-energy diet (12.5 MJ/d), or. con-
versely. twice as little on the low-energy diet (6.5 MJ/d). Sur-
prisingly. there was no trend toward a higher energy intake on
subsequent days on the low-energy diet or to a lower energy
intake on subsequent days on the high-energy diet. Lissner et al
(6) provided subjects with three different diets. one with a low.
one with a medium. and one with a high energy density by
exchanging carbohydrate and fat. All subjects got each diet for
14 d in a balanced sequence. Energy intake increased from a
mean value of 8.7 MJ/d on the low-fat diet ( 1 5-20 en% fat) to
9.8 MI/d on the medium-fat diet (30-35 en% fat) and to I 1.4
MJ/d on the high-fat diet (45-50 en% fat). Again. there was no
systematic trend ofintake over time in any ofthe subjects during
any 14-d dietary treatment. indicating that there was no adap-
tation to the diet during the observation period. On average,
subjects were in energy balance on the medium-fat diet. lost
weight on the low-fat diet. and gained weight on the high-fat
diet.
Animals like the laboratory rat compensate in time ifthe en-
ergy density of the food is changed to achieve the same energy
intake and reach the same hod�’ weight as controls (7). The failure
by guest on March 9, 2014
ajcn.nutrition.orgD
ownloaded from
* Adapted from reference I.
50’
40’
30
C
a)
a)
a)
0
C0
C00
.- -4�-- � S.
20
10
01920 I 940 1 960 1 980
year
760S WESTERTERP
TABLE 1
Ratio of macronutrients in the diet of people of different countries*
Country Carbohydrate Protein Fat
en%
Nigeria 82 12 6
Japan 77 12 11
India 77 11 12CSSR 59 11 30
United States 46 12 42Greenland 3 43 54
of humans to compensate for a change in the energy density of
the food may be a way for them to avoid becoming overweight.
Energy dilution with carbohydrate or fat analogues like aspar-
tame (8, 9) and sucrose polyesthers has its application in the
new market for “light” products. On the other hand. there are
indications that humans compensate for energy dilution when
not all high-energy-density food items are reduced-energy ver-
sions by increasing the consumption of nonmanipulated items
(10). Subjects failed to compensate for increases in energy intake
by covertly substituting part ofthe food items with high-energy
versions.
Obesiti
There are quite a few studies on the macronutrient ratio of
the diet and obesity or being overweight. Here we restrict our-
selves to studies where subjects were allowed to freely choose
their own foods under ordinary living conditions. Under those
circumstances, overweight subjects take diets with a higher energy
density. Jiang and Hunt ( 1 1) asked 1 1 adult men to collect a
double portion of all they ate over 7 d for analysis. The energy
density of the diet, including drinks, ranged from 1 .8 kJ/g in
normal-weight subjects to 3.9 kJ/g in overweight subjects. Sun-
prisingly, the researchers mention that the energy density of the
diet in overweight subjects was not higher because of a higher
fat content, and no alternative explanation is presented. Dreon
et al ( 12) related diet composition, as measured with 7-d food
records, to body composition. as measured with hydrostatic
weighing, in 1 55 middle-aged men. Subjects with a higher per-
centage body fat consumed a diet with relatively more fat and
less carbohydrate. Tremblay et al ( 1 3) performed a comparable
study in 244 male adults, measuring diet composition with a 3-
d food record. They also found that the en% fat of the diet was
positively correlated and the en% carbohydrate was negatively
correlated with the fatness of the subjects. Finally, Miller et al
(14) made similar observations in 2 16 adult subjects, 50% men
and 50% women, and found that adiposity was positively con-
related with dietary fat content and negatively correlated with
dietary carbohydrate consumption. In all four studies mentioned
above ( 1 1 - I 4), there was no correlation between energy intake
and indexes for overweight or obesity.
There have been indications that self-reported intake tends to
be an underestimate of true habitual intake. Reported intakes
tend to be lower than energy expenditure as measured simul-
taneously with doubly labeled water, especially in obese subjects
and subjects with a high energy intake. such as those engaged
in endurance exercise (15, 16). We do not know whether the
results of those studies, mainly using self report to measure di-
etary intake. were influenced by this phenomenon. On the other
hand. it is nearly impossible to measure habitual intake while
subjects freely choose their own foods under ordinary living
conditions with a more accurate alternative technique. The
double-portion technique as used by Jiang and Hunt ( 1 1) is one
ofthe best but is not really feasible in large groups and interferes
with daily routines when subjects are not at home every time
they eat something. Thus, Romieu et al ( 17) and Miller (18)
came to the conclusion that the role offat intake in obesity may
be independent of energy intake.
Substrate utilizatioui
Knowing that obese subjects generally do not eat more than
do normal-weight subjects but do differ from normal-weight
subjects with respect to the fat-carbohydrate ratio of their diet,
the next question is. why is an isoenergetic diet fattening when
it contains relatively more fat and less carbohydrate? In terms
ofenergy, we can make carbohydrate from protein and fat from
carbohydrate and thus fat and carbohydrate are not essential
nutrients. However the conversion processes are very energy
consuming and produce a lot ofwaste products such as ammonia
and urea. Ideally. the body covers its energy needs with a mixture
of fat and carbohydrate. Some tissues preferentially use carbo-
hydrate whereas fat is less bulky to consume, as mentioned ear-
her. Additionally, humans are periodic eaters and continuous
metabolizers (ie. part ofthe energy intake is stored before usage
as well).
The storage capacities for fat and carbohydrate are very dif-
ferent and this may have consequences for the regulation of
body weight. Flatt ( 19) proposed a model with a regulated car-
bohydrate (glycogen) store and with the fat store as a function
of nutrient intake and nutrient utilization. An increase in the
fat content of the diet needs an increase in fat oxidation and it
is hypothesized that the latter needs an expansion of the body-
FIG I . Distribution of dietary energy intake between carbohydrate(H). protein (#{149}).and fat (5) in the United States from 1910 to 1985(from ref 2).
by guest on March 9, 2014
ajcn.nutrition.orgD
ownloaded from
FQ, RQ, AND ENERGY BALANCE 76 1S
fat mass, explaining the increased adiposity in subjects consum-
ing high-fat diets.
Several groups studied the effect ofa change in nutrient intake
on nutrient utilization. Nutrient utilization can be measured
with indirect calorimetry from oxygen consumption, carbon
dioxide production, and urinary nitrogen excretion (20). Some-
times protein oxidation is measured by primed infusion of a
‘3C-labeled amino acid: measuring the elimination ofthe label
in respiratory gas provides a more rapid, more responsive index
(2 1). Studies of nutrient utilization can be split in short-term
studies. usually measuring the effects ofa single meal, and long-
term studies. covering at least one 24-h cycle on a fixed dietwith or without an adaptation period beforehand. The indirect-
calorimetry system in short-term studies is a ventilated hood,
with subjects lying or sitting. Long-term studies are performed
in a respiration chamber that allows subjects to move around
on 10-20 m2 offloor space.
Short-term studies of nutrient utilization
Short-term studies of nutrient utilization are usually started
in the postabsorptive condition after an overnight fast. Food is
consumed as a breakfast, after which baseline measurements
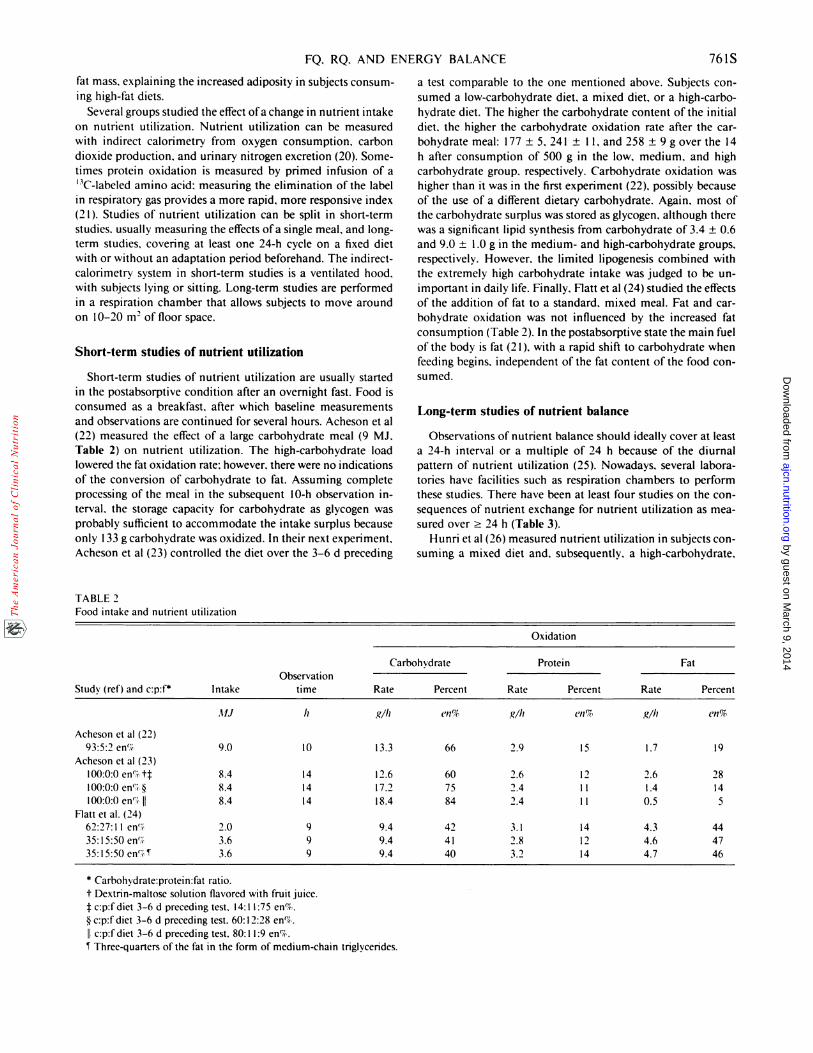
and observations are continued for several hours. Acheson et al
(22) measured the effect of a large carbohydrate meal (9 Mi.
Table 2) on nutrient utilization. The high-carbohydrate load
lowered the fat oxidation rate: however. there were no indications
of the conversion of carbohydrate to fat. Assuming complete
processing of the meal in the subsequent 10-h observation in-
terval, the storage capacity for carbohydrate as glycogen was
probably sufficient to accommodate the intake surplus because
only 1 33 g carbohydrate was oxidized. In their next experiment.
Acheson et al (23) controlled the diet over the 3-6 d preceding
a test comparable to the one mentioned above. Subjects con-
sumed a low-carbohydrate diet, a mixed diet, or a high-carbo-
hydrate diet. The higher the carbohydrate content ofthe initial
diet. the higher the carbohydrate oxidation rate after the car-
bohydrate meal: 177 ± 5. 241 ± 11, and 258 ± 9 g over the 14
h after consumption of 500 g in the low, medium, and high
carbohydrate group, respectively. Carbohydrate oxidation was
higher than it was in the first experiment (22), possibly because
of the use of a different dietary carbohydrate. Again, most of
the carbohydrate surplus was stored as glycogen, although there
was a significant lipid synthesis from carbohydrate of 3.4 ± 0.6
and 9.0 ± 1 .0 g in the medium- and high-carbohydrate groups,
respectively. However. the limited lipogenesis combined with
the extremely high carbohydrate intake was judged to be un-
important in daily life. Finally, Flatt et al (24) studied the effects
of the addition of fat to a standard, mixed meal. Fat and car-
bohydrate oxidation was not influenced by the increased fat
consumption (Table 2). In the postabsorptive state the main fuel
of the body is fat (2 1 ), with a rapid shift to carbohydrate when
feeding begins. independent of the fat content of the food con-
sumed.
Long-term studies of nutrient balance
Observations of nutrient balance should ideally cover at least
a 24-h interval or a multiple of 24 h because of the diurnal
pattern of nutrient utilization (25). Nowadays. several labora-
tories have facilities such as respiration chambers to perform
these studies. There have been at least four studies on the con-
sequences of nutrient exchange for nutrient utilization as mea-
sured over � 24 h (Table 3).Hunni Ct al (26) measured nutrient utilization in subjects con-
suming a mixed diet and. subsequently. a high-carbohydrate,
TABLE 2Food intake and nutrient utilization
Studs’ (ref) and c:p:f’� IntakeObservation
time
Oxidation
Carbohydrate
Rate Percent Rate
Protein
Percent Rate
Fat
Percent
fIji Ii g//i en% g/h en% g//z en%
Acheson et al (22)93:5:2 en% 9.0 10 13.3 66 2.9 15 1.7 19
Acheson et al (23)100:0:0 en�t� 8.4 14 12.6 60 2.6 12 2.6 28l00:0:0enc� 8.4 14 17.2 75 2.4 II 1.4 14100:0:0 en� � 8.4 14 18.4 84 2.4 1 1 0.5 5
Flatt et al. (24)62:27:11 en� 2.0 9 9.4 42 3.1 14 4.3 4435:l5:50enc� 3.6 9 9.4 41 2.8 12 4.6 47
35:15:50 en� 3.6 9 9.4 40 3.2 14 4.7 46
* Carhohydrate:protein:fat ratio.
t Dextrin-maltose solution flavored with fruit juice.:t c:p:fdiet 3-6 d preceding test. 14:1 1:75 en%.
§ c:p:f diet 3-6 d preceding test. 60: 12:28 en�.
II c:p:fdiet 3-6 d preceding test. 80:1 1:9 en%.#{182}Three-quarters of the fat in the form of medium-chain triglycerides.
by guest on March 9, 2014
ajcn.nutrition.orgD
ownloaded from
762S WESTERTERP
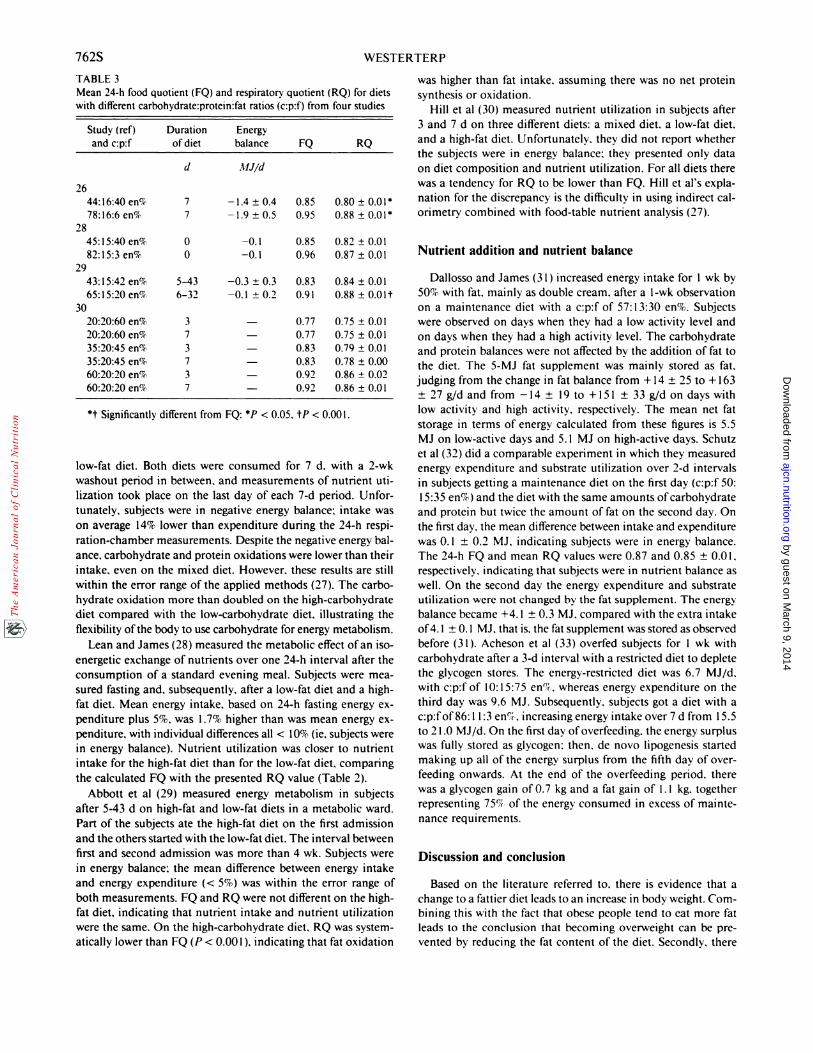
TABLE 3Mean 24-h food quotient (FQ) and respiratory quotient (RQ) for dietswith different carbohydrate:protein:fat ratios (c:p:f) from four studies
Study (ref)and c:p:f
Durationofdiet
Energybalance FQ RQ
d .41J/d
26
44: 16:40 en% 7 - 1.4 ± 0.4 0.85 0.80 ± 0.0 1�78:16:6 en% 7 -1.9 ± 0.5 0.95 0.88 ± 0.01*
28
45:15:40 en% 0 -0.1 0.85 0.82 ± 0.01
82:15:3 en% 0 -0.1 0.96 0.87 ± 0.01
29
43:15:42 en% 5-43 -0.3 ± 0.3 0.83 0.84 ± 0.0165:15:20 en% 6-32 -0.1 ± 0.2 0.91 0.88 ± 0.011’
3020:20:60 en% 3 - 0.77 0.75 ± 0.0120:20:60 en% 7 - 0.77 0.75 ± 0.01
35:20:45 en% 3 - 0.83 0.79 ± 0.0135:20:45 eri% 7 - 0.83 0.78 ± 0.0060:20:20 en% 3 - 0.92 0.86 ± 0.0260:20:20 en% 7 - 0.92 0.86 ± 0.01
*t Significantly different from FQ: *P < 0.05, tP < 0.001.
low-fat diet. Both diets were consumed for 7 d, with a 2-wk
washout period in between, and measurements of nutrient uti-
lization took place on the last day of each 7-d period. Unfor-
tunately. subjects were in negative energy balance: intake was
on average 14% lower than expenditure during the 24-h respi-
ration-chamber measurements. Despite the negative energy bal-
ance, carbohydrate and protein oxidations were lower than their
intake, even on the mixed diet. However, these results are still
within the error range of the applied methods (27). The carbo-
hydrate oxidation more than doubled on the high-carbohydrate
diet compared with the low-carbohydrate diet. illustrating the
flexibility ofthe body to use carbohydrate for energy metabolism.
Lean and James (28) measured the metabolic effect ofan iso-
energetic exchange of nutrients over one 24-h interval after the
consumption of a standard evening meal. Subjects were mea-
sured fasting and, subsequently, after a low-fat diet and a high-
fat diet. Mean energy intake, based on 24-h fasting energy ex-
penditure plus 5%, was 1 .7% higher than was mean energy ex-
penditure, with individual differences all < 10% (ie, subjects were
in energy balance). Nutrient utilization was closer to nutrient
intake for the high-fat diet than for the low-fat diet. comparing
the calculated FQ with the presented RQ value (Table 2).
Abbott et al (29) measured energy metabolism in subjects
after 5-43 d on high-fat and low-fat diets in a metabolic ward.
Part of the subjects ate the high-fat diet on the first admission
and the others started with the low-fat diet. The interval between
first and second admission was more than 4 wk. Subjects were
in energy balance: the mean difference between energy intake
and energy expenditure (< 5%) was within the error range of
both measurements. FQ and RQ were not different on the high-
fat diet, indicating that nutrient intake and nutrient utilization
were the same. On the high-carbohydrate diet, RQ was system-
atically lower than FQ (P < 0.00 1 ), indicating that fat oxidation
was higher than fat intake, assuming there was no net protein
synthesis or oxidation.
Hill et al (30) measured nutrient utilization in subjects after
3 and 7 d on three different diets: a mixed diet, a low-fat diet,
and a high-fat diet. Unfortunately. they did not report whether
the subjects were in energy balance: they presented only data
on diet composition and nutrient utilization. For all diets there
was a tendency for RQ to be lower than FQ. Hill et al’s expla-
nation for the discrepancy is the difficulty in using indirect cal-
orimetry combined with food-table nutrient analysis (27).
Nutrient addition and nutrient balance
Dallosso and lames (3 1 ) increased energy intake for 1 wk by
50% with fat, mainly as double cream. after a l-wk observation
on a maintenance diet with a c:p:f of 57: 1 3:30 en%. Subjects
were observed on days when they had a low activity level and
on days when they had a high activity level. The carbohydrate
and protein balances were not affected by the addition of fat to
the diet. The 5-MI fat supplement was mainly stored as fat,
judging from the change in fat balance from + 14 ± 25 to +163
± 27 g/d and from -14 ± 19 to +151 ± 33 g/d on days with
low activity and high activity. respectively. The mean net fat
storage in terms of energy calculated from these figures is 5.5
Mi on low-active days and 5. 1 Ml on high-active days. Schutz
et al (32) did a comparable experiment in which they measured
energy expenditure and substrate utilization over 2-d intervals
in subjects getting a maintenance diet on the first day (c:p:f 50:
1 5:35 en%) and the diet with the same amounts of carbohydrate
and protein but twice the amount of fat on the second day. On
the first day, the mean difference between intake and expenditure
was 0.1 ± 0.2 MI. indicating subjects were in energy balance.
The 24-h FQ and mean RQ values were 0.87 and 0.85 ± 0.01,
respectively. indicating that subjects were in nutrient balance as
well. On the second day the energy expenditure and substrate
utilization were not changed by the fat supplement. The energy
balance became +4. 1 ± 0.3 Mi, compared with the extra intake
of4. I ± 0. 1 Ml, that is, the fat supplement was stored as observed
before (3 1 ). Acheson et al (33) overfed subjects for I wk with
carbohydrate after a 3-d interval with a restricted diet to deplete
the glycogen stores. The energy-restricted diet was 6.7 Ml/d.
with c:p:fof 10:15:75 en%. whereas energy expenditure on the
third day was 9.6 Ml. Subsequently. subjects got a diet with a
c:p:fof86: 1 1:3 en%, increasing energy intake over 7 d from I 5.5
to 2 1 .0 MI/d. On the first day ofoverfeeding. the energy surplus
was fully stored as glycogen: then, de novo lipogenesis started
making up all of the energy surplus from the fifth day of over-
feeding onwards. At the end of the overfeeding period. there
was a glycogen gain of 0.7 kg and a fat gain of 1 . 1 kg, together
representing 75% of the energy consumed in excess of mainte-
nance requirements.
Discussion and conclusion
Based on the literature referred to. there is evidence that a
change to a fattier diet leads to an increase in body weight. Com-
bining this with the fact that obese people tend to eat more fat
leads to the conclusion that becoming overweight can be pre-
vented by reducing the fat content of the diet. Secondly. there
by guest on March 9, 2014
ajcn.nutrition.orgD
ownloaded from
FQ, RQ. AND ENERGY BALANCE 763S
is evidence that the body has a limited ability to oxidize fat
compared with the ability to oxidize carbohydrate and protein.
It is often suggested that this limitation is more pronounced in
obesity-susceptible individuals (34). Thus some individuals are
more likely to become obese consuming a high-fat diet than are
others. On the other hand. intervention studies do not support
unequivocally the body’s limitations to burn fat.
Short-term studies, measuring substrate utilization over up to
14 h after a meal, show how the carbohydrate oxidation is in-
creased after a high-carbohydrate meal whereas addition of fat
to a meal does not influence fat oxidation (Table 2). In the long
term. measuring substrate utilization over � 24 h, there are in-
dications of the opposite. At diets higher in carbohydrate there
is a bigger discrepancy between FQ and RQ such that RQ is
lower than FQ (Table 3). This should mean that substrate uti-
lization is closer to substrate intake for diets higher in fat than
for diets higher in carbohydrate. a phenomenon that cannot be
readily explained.
Under conditions ofperfect energy and nutrient balance. FQ
must equal RQ. Under conditions ofenergy or nutrient imbal-
ance, a normal-weight adult stores or mobilizes, in the long term.
near1� all energy in the form of body fat. Then. the body does
not use protein and carbohydrate reserves for energy storage or
energy mobilization. The carbohydrate store in the form of liver
and muscle glycogen fluctuates between 250 and 500 g, or 4 and
8 Ml. Reference man has a muscle mass of 30 kg with 7.5 kg
protein, or an energy equivalent of 120 Mi. but changes in mus-
cle mass are insignificant in terms of energy compared with
changes in fat mass, unless body fat is nearly depleted. Thus, in
the long term, an RQ higher than the FQ implicates conversion
of carbohydrate or protein to body fat. and an RQ lower than
the FQ, a mobilization ofenergy from body fat.
Combining the observation of the lower-than-expected RQ
for a high-carbohydrate diet with the fact that an RQ measured
over a long-term interval can only be lower than the FQ by
mobilizing body fat leads to the conclusion that high-carbohy-
drate diets induce body fat loss. Apart from studies referred earlier
(5. 6), a recent study suggests that the macronutrient composition
of the diet plays a role in the energy requirement for weight
maintenance. Prewitt et al (35) reported data on 18 women con-
suming a standard diet for 4 wk (c:p:f44:19:37 en%), followed
by 20 wk of low-fat diet (c:p:f 60: 19:2 1 en%). Energy intake of
the subjects was adjusted to maintain body weight throughout
the study period. that is. intake was increased or decreased when
body weight decreased or increased by > 1 kg, respectively.
Comparing the initial 4-wk interval for the standard diet with
the last 4 wk for the low-fat diet, the mean energy intake increased
with 19% and the mean body weight decreased with 2 kg. Thus.
a high-carbohydrate diet resulted in a significant reduction in
body weight despite a substantial increase in energy intake aimed
at weight maintenance.
This review leads to the suggestion that energy expenditure is
higher for low-fat, high-carbohydrate diets than for high-fat, low-
carbohydrate diets. Convincing evidence for this at this point is
not yet available. Current studies include measurement of energy
expenditure over short time intervals, up to 24 h in a respiration
chamber, and calculation of energy expenditure from energy
intake and changes in body composition. Future studies should
include direct measurement of energy expenditure for � 1 wk
under normal living conditions. #{163}3
References
I . Fabry P. Feeding pattern and nutritional adaptations. Prague: Aca-
demia. and London: Butterworths. 1969.2. National Research Council (US). Committee on Diet and Health.
Diet and health: implications for reducing chronic disease risk.
Washington. DC: National Academy Press. 1989.
3. Atwater WO. Bryant AP. The availability and food values of food
materials. In: The I 2th annual report ofthe Storrs. CT. Agricultural
Experimental Station. Storrs, CT: Storrs. CT. Agricultural Experi-
ment Station, 1900:73-I 10.
4. Bray GA. Bethune JE. eds. Treatment and management of obesity.Hagerstown. MD: Harper & Row, 1974.
5. Duncan KH. Bacon IA. Weinsier RL. The effects of high and low
energy density diets on satiety. energy intake. and eating time of
obese and nonobese subjects. Am I Clin Nutr 1983:37:763-7.
6. Lissner L, Levitsky DA. Strupp BJ. Kalkwarf HI. Roe DA. Dietary
fat and the regulation of energy intake in human subjects. Am JClin Nutr 1987:46:886-92.
7. Adolph EF. Urges to eat and drink in rats. Am I Physiol 1947:151:
110-25.
8. Porikos KP. Booth G. Van Itallie TB. Effect ofcovert nutritive di-lution on the spontaneous food intake of obese individuals: a pilot
study. Am I Clin Nutr 1977:30:1638-44.
9. Porikos KP. Control offood intake in man: response to covert caloric
dilution of a conventional and palatable diet. In: Cioffi LA, JamesWPT, Van Itallie TB, eds. The body weight regulatory system: normal
and disturbed mechanisms. New York: Raven Press, 198 1:83-7.
10. Foltin RW. Fischman MW, Emurian CS, Rachlinski. Compensation
for caloric dilution in humans given unrestricted access to food ina residential laboratory. Appetite I 988:10:13-24.
I 1. Jiang C-L. Hunt IN. The relation between freely chosen meals andbody habitus. Am I Clin Nutr 1983:38:32-40.
12. Dreon DM, Frey-Hewitt B, Ellsworth N, Williams PT, Terry RB,Wood PD. Dietary fat:carbohydrate ratio and obesity in middle-
aged men. Am I Clin Nutr 1988:47:995-1000.
I 3. Trembla� A. Plourde G. Despres I-P. Bouchard C. Impact of dietary
fat content and fat oxidation on energy intake in humans. Am IClin Nutr 1989:49:799-805.
14. Miller WC. Lindeman AK. Wallace I. Niederpruem M. Diet com-
position, energy intake. and exercise in relation to body fat in menand women. Am I Clin Nutr 1990:52:426-30.
I 5. Schoeller DA. How accurate is self-reported dietary energy intake?Nutr Rev 1990:10:373-9.
16. Westerterp KR. Verboeket-van de Venne WPHG. Meijer GAL. HoorF ten. Self-reported intake as a measure for energy intake. a validation
against doubly labelled water. In: Ailhaud G. Guy-Grand B. LafontanM. Riequier D. eds. Obesity in Europe 91 . London: John Libbey.
1992:17-22.
I 7. Romieu I. Willett WC. Stampfer MI, et al. Energy intake and other
determinants of relative weight. Am I Clin Nutr I 988:47:406-12.
18. Miller WC. Diet composition. energy intake, and nutritional status
in relation to obesity in men and women. Med Sci Sports ExercI991:23:280-4.
19. Flatt IP. The difference in the storage capacities for carbohydrate
and for fat. and its implications in the regulation of body weight.Ann NY Acad Sci 1987:499:104-23.
20. Frayn KN. Calculation of substrate oxidation rates in vivo fromgaseous exchange. I AppI Physiol 1983:55:628-34.
2 1 . Garlick P1, McNurlan MA. McHardy KC. Factors controlling the
disposition of primary nutrients. Proc Nutr Soc 1988:47:169-76.
22. Acheson KJ. Flatt IP, l#{233}quierE. Glycogen synthesis versus lipogenesis
after a 500 gram carbohydrate meal in man. Metabolism 1982:31:
I 234-40.
by guest on March 9, 2014
ajcn.nutrition.orgD
ownloaded from
7645 WESTERTERP
23. Acheson KI. Schutz Y. Bessard T. Ravussin E. l#{233}quierE. Flatt IP.Nutritional influences on lipogenesis and thermogenesis after a car-bohydrate meal. Am I Physiol 1984:246:E62-70.
24. Flatt JP. Ravussin E. Acheson 10. l#{233}quierE. Effects of dietary faton postprandial substrate oxidation and on carbohydrate and fat
balance. I Clin Invest 1985:76:1019-24.25. Verboeket-van de Venne PHG. Westerterp KR. Influence of the
feeding frequency on nutrient utilization in man: consequences for
energy metabolism. Eurl Clin Nutr 1991:45:161-9.26. Hunri M. Burnand B, Pittet Ph. lequier E. Metabolic effects
ofa mixed and a high-carbohydrate low-fat diet in man. mea-
sured over 24 h in a respiration chamber. Br I Nutr 1982:47:
33-43.
27. Livesey G. Elia M. Estimation of energy expenditure, net carbo-hydrate utilization. and net fat oxidation and synthesis by indirectcalorimetry: evaluation of errors with special reference to the detailedcomposition offuels. Am J Clin Nutr 1988:47:608-28.
28. Lean MEl, James WPT. Metabolic effects of isoenergetic nutrient
exchange over 24 hours in relation to obesity in women. Int I Obes1988: 12:15-27.
29. Abbott WGH, Howard BV, Ruotolo G. Ravussin E. Energy expen-
diture in humans: effects of dietary fat and carbohydrate. Am I
Physiol 1990:258:E347-5 I.
30. Hill 10. Peters IC. Reed GW. Schlundt DG. Sharp T. Greene HL.Nutrient balance in humans: effects ofdiet composition. Am I Clin
Nutr 1991:54:10-7.
31. Dallosso HM. James WPT. Whole-body calorimetry studies in adult
men: 1 . The effect of fat over-feeding on 24 h energy expenditure.Br I Nutr 1984:52:49-64.
32. Schutz Y. Flatt IP. J#{233}quierE. Failure ofdietary fat intake to promotefat oxidation: a factor favoring the development of obesity. Am I
Clin Nutr 1989:50:307-14.33. Acheson KI. Schutz Y. Bessard T, Anantharaman K. Flatt IP, and
J#{233}quierE. Glycogen storage capacity and de novo lipogenesis duringmassive carbohydrate overfeeding in man. Am I Clin Nutr I 988:48:
240-7.
34. Zurlo F. Lillioja S. Esposito-Del Puente A. et al. Low ratio of fat tocarbohydrate oxidation as predictor of weight gain: study of 24-h
RQ. Am I Physiol l990:259:E650-7.35. Prewitt TE. Schmeisser D. Bowen PE. et al. Changes in body weight.
both composition. and energy intake in women fed high- and low-fat diets. Am J Clin Nutr 199 1:54:304-10.
Discussion
Michael A Crawford: This may be a naive question. but I wasinterested in the analogy that you gave us-your models of the
test tube and the barrel. the test tube of carbohydrate and the
barrel of fat. What seems to be slightly out of focus to me was
the size of the input you showed. You showed two little pots.
One ofcarbohydrate and one offat ofdifferent proportions and
different diets. It seems to me that if you had represented those
inputs in proportion to the daily amount ofstuffthat was going
in, one would have seen that the amount of carbohydrate that
went in over a 24-hour period would be really very much larger
than the amount of carbohydrate that was stored in the test
tube. A 24-hour input of carbohydrate is quite a lot in a high-
carbohydrate diet. At the same time. the barrel is full of fat, so
that carbohydrate. although coming through the carbohydrate
route, is actually filling up the fat barrel because it doesn’t store
that amount of carbohydrate. So. it has to be converted to fat
and fill up the fat barrel. The energy process ofconverting that
carbohydrate to fat needs to be a sort of negative consideration
in terms ofthe overall energy balance ofthe individual. I wonder
to what extent that contributes to disturbing these relationships
and explaining why fat is going straight into the barrel and doesn’t
really have any effect of energy. The carbohydrate going in de-
mands energy to convert it into fat and destorts it as such. Does
that confound the equation with regard to a rich-carbohydrate
vs a rich-fat diet?
Klaas R Westerterp: I think you are stressing an interesting point.
I don’t know whether this model was really on the right scale
and, as you say. we eat a lot of carbohydrate in proportion to
our carbohydrate stores. On the other hand, there is not much
information on whether we really have to convert carbohydrate
to fat, apart from the one study I showed you, and maybe one
or two others in the literature in which you can see that at least
there is a day-night rhythm in substrate utilization. That rhythm
suggests that we might store part ofthe carbohydrate we consume
during the day for overnight use. That has been seen in small-
animal studies. but you can’t really compare those with human
studies because we as humans have a big intestine for food storage
and we have got a relatively far lower energy metabolism per
unit body weight. Maybe the reason for having a higher energy
expenditure at a high-carbohydrate diet is the conversion of car-
bohydrate to fat.
Eric Ravussin: I would like to expand a little on this comment.
I think that in men there is less and less evidence that de novo
lipogenesis plays an important role. and in the study that you
showed from Kevin Acheson, in which he gave an enormous
amount ofcarbohvdrate (500 g). We tried that first as one meal.
but after the subject had problems, we offered it at 250 grams
and at two times 125 grams. It was very, very difficult to induce
a significant amount ofde novo lipogenesis. I agree that indirect
calorimetry doesn’t differentiate between oxidation and going
into fat. but I think that the point is that there is little room for
de novo lipogenesis in men. Therefore. you are right when you
say that maybe 50- 100% of the glycogen stores are replaced on
a daily basis vs < 1% for fat. I think that most ofthe carbohydrate
ingested is either stored as glycogen or oxidized into CO2. I
think that the enzymatic activities ofthe lipogenic enzymes are
very low in men, and recent studies using stable isotope showed
that de novo lipogenesis is very insignificant in man.
Westerterp: I agree with that, but on the other hand. the studies
ofAcheson were short-term studies. In the long term. when you
consume a high-carbohydrate diet. you can’t really store this
amount of carbohydrate in your glycogen stores because they
are just not big enough. So. you have to do something with it
when you are in a positive energy balance. but apparently you
tend to be in a negative energy balance on a high-carbohydrate
diet. We do not yet have any reason for that. Maybe you have
a suggestion for why you tend to be in a negative energy balance
on a high carbohydrate diet. Why would your energy expenditure
go up?
Ravussin: In all the studies ofoverfeeding. for example. Schutz’sstudy. you need to push a lot ofcarbohydrate through the system.
by guest on March 9, 2014
ajcn.nutrition.orgD
ownloaded from
FQ. RQ. AND ENERGY BALANCE
When we talk about weight gain in obese people. they are ob-
viously in positive energy balance. but by a minute amount on
a daily basis. There is limited storage capacity in men, and there-
fore carbohydrate is oxidized: maybe there is a little lipogenesis.
There was the British school in the l960s that said that lipogenesis
might be higher in lean people because it is an energy-costly
process. I don’t know what is the status of that now.
Nlartijn Katan: Could I sum a little note of caution about the
effectiveness of high-carbohydrate diets in reducing obesity be-
cause the final tests are long-term control trials and there have
been a few ofthose? In 1970 the National Diet Heart Study was
published in (‘irculation, where large groups of middleaged
American men were given diets of 40% or 20% energy as fat.
There was some weight loss in the 20-en%-fat group but that
was very minor, 1 or at most 2 kg in the first few months and
765S
than no change for the rest of the year. There is a recent pub-
lication from the pilot study for the breast-cancer-dietary-fat
trial, where you see a similar phenomenon. that indeed the
women on the very-low-fat diet lost some weight but nothing
like the amounts you would expect from the short-term trials,
again something like 1 or 2 kg over the year. There are also the
data from the Seattle dietary alternative trial. a 2-year study that
I think is still in press, where again you see in middleaged man
only � I kg weight loss on 20 vs 40 en% of fat. I think there is
more going on than just the mechanisms that we have been
talking about. The body seems to resist weight loss even on the
more carbohydrate-rich diets.
Westerterp: Maybe you are right. The only problem is the control
offood intake in these types ofstudies. On the other hand. long-
term experimental feeding studies are costly. Therefore, we have
to accept the results as they are.
by guest on March 9, 2014
ajcn.nutrition.orgD
ownloaded from