Embed Size (px)
Citation preview
Fatherlessness in MassachusettsThe Economic and Social Costs to Our Commonwealth
Massachusetts Family InstituteOctober 2014
100 Trade Center, Suite 625Woburn, MA 01801
(781) 569-0400 (Phone)(781) 569-0472 (Fax)
[email protected] (e-mail)www.mafamily.org (Web Site)
Walter WeldChairman
Andrew BeckwithPresident & CEO
Fatherlessness in Massachusetts
The Economic and Social Costs to Our Commonwealth
October 2014
Introduction
I. The Decline of the American Family
II. The Cost of Fatherlessness
Poverty Academic Underachievement Crime Violence Pregnancy Tax Burden
III. The Increase in Single-Parent Families Fewer Marriages More Births Out of Wedlock High Divorce Rate
IV. Guiding Principles for Strengthening Traditional Families
V. The Need to Strengthen Traditional Families Public Policy
Conclusion
Endnotes
Table of Contents
i
1
4
22
26
28
30
32
page
i
“We know the statistics – that children who grow up without a father are five times more likely to live in poverty and commit crime; nine times more likely to drop out of schools and twenty times more likely to end up in prison. They are more likely to have behavioral problems, or run away from home, or become teenage parents themselves. And the foundations of our community are weaker because of it.”
- President Barrack Obama , The White House Blog, “PresidentObama Promotes Responsible Fatherhood: ‘No Excuses,’” Whitehouse.gov. N.p., 21 June 2010.
“On just about any measure of development you can think of, children who are born to unmarried women fare worse than the children of divorce and far worse than children raised in intact families. This unwelcome reality persists even after controlling for the income and education of the parents.”
- Charles Murray, “The New American Divide.” The Wall StreetJournal. N.p., 21 Jan. 2012.
“The word family has all but lost its original meaning in our modern landscape. You don’t have to look far to see the fallout. Divorce is the norm. An increasing number of children are growing up in homes where at least one parent is absent. Broken families are the root cause of so many of our social problems, from abuse and addiction to poverty and crime… Somehow, we’ve lost our way.”
- Jim Daly, Foreword, Why Family Matters - A Modern Look at anAncient Truth, Focus on the Family, 2013, p. 7.
“American fatherlessness is a national disaster and, according to the latest research into its effects, more of a disaster than anybody could have imagined.”
- Stephen Marche, “Manifesto of the New Fatherhood.” Esquire.com Article. N.p., 13 June 2014. Web.
Introduction: The need for strong, intact, two-parent families
ii
Sometimes the best solution to a problem is the simplest and most obvious. Amidst the clamor over many of the pressing social issues of our day – rising income inequality, disparity of educational opportunity, youth violence, and access to health care – one simple, obvious causal factor is often overlooked: the state of the American family.
The family has been described by William Bennett as “the first form of
community and government” and, by Michael Novak, as “the first, best and original Department of Health, Education and Welfare.”1 In Massachusetts, we may pride ourselves on our world class educational and medical institutions and take comfort in our Commonwealth’s generous social services programs and welfare assistance, but none of these efforts, no matter how well intended, can replace the fundamental advantage and security for children of going to sleep at night under the same roof as their mother and father. As a Commonwealth, we need to remind ourselves that all the programs and services to help children are merely a support, and never a replacement, for the family.
In fact, current social science and census data paint a compelling case of the need for strong, intact, two-parent families here and now in the 21st century. If we truly care about our children, and particularly the most vulnerable among them, we must do everything in our power to ensure they are raised by a mother and a father.
As President Barrack Obama said so well on Father’s Day, 2010: “We can all agree that we’ve got too many mothers out there forced to do everything all by themselves. They’re doing a heroic job, often under trying circumstances. They deserve a lot of credit for that. But they shouldn’t have to do it alone. The work of raising our children is the most important job in this country, and it’s all of our responsibilities – mothers and fathers.”2
We wholeheartedly agree, and believe our Commonwealth’s laws and policies should reflect that same principle.
Andrew BeckwithPresident & CEOMassachusetts Family Institute

1
20%
23%
26%
29%
32%
1982 1987 1992 1997 2002 2007 2012
PERCENTAGE OF MASSACHUSETTS CHILDREN IN SINGLE-‐PARENT FAMILIES
I:the decline of the american family
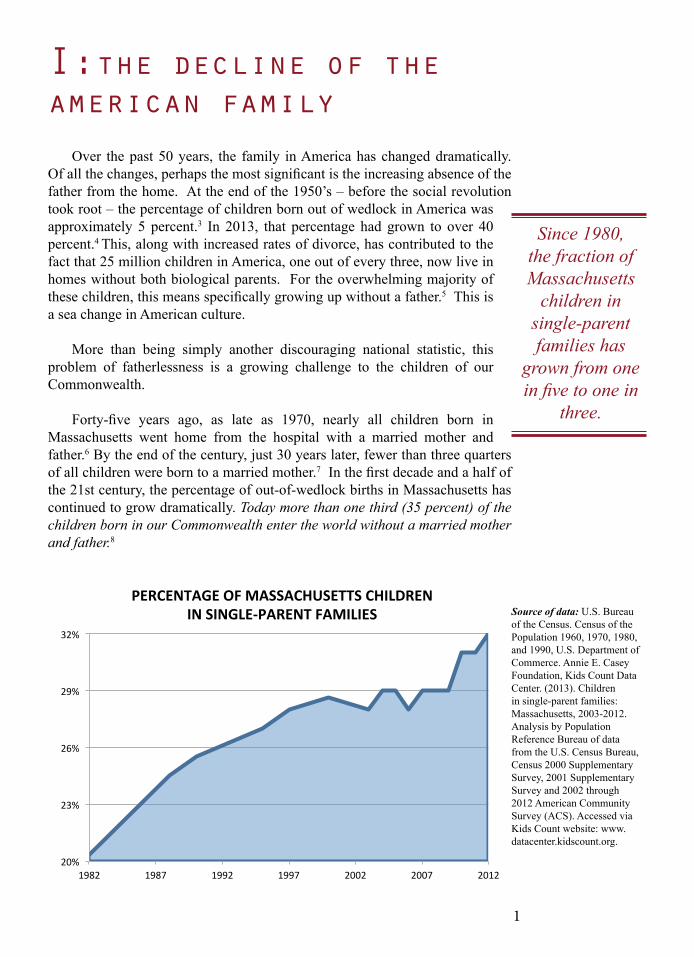
Over the past 50 years, the family in America has changed dramatically. Of all the changes, perhaps the most significant is the increasing absence of the father from the home. At the end of the 1950’s – before the social revolution took root – the percentage of children born out of wedlock in America was approximately 5 percent.3 In 2013, that percentage had grown to over 40 percent.4 This, along with increased rates of divorce, has contributed to the fact that 25 million children in America, one out of every three, now live in homes without both biological parents. For the overwhelming majority of these children, this means specifically growing up without a father.5 This is a sea change in American culture.
More than being simply another discouraging national statistic, this problem of fatherlessness is a growing challenge to the children of our Commonwealth.
Forty-five years ago, as late as 1970, nearly all children born in
Massachusetts went home from the hospital with a married mother and father.6 By the end of the century, just 30 years later, fewer than three quarters of all children were born to a married mother.7 In the first decade and a half of the 21st century, the percentage of out-of-wedlock births in Massachusetts has continued to grow dramatically. Today more than one third (35 percent) of the children born in our Commonwealth enter the world without a married mother and father.8
Source of data: U.S. Bureau of the Census. Census of the Population 1960, 1970, 1980, and 1990, U.S. Department of Commerce. Annie E. Casey Foundation, Kids Count Data Center. (2013). Children in single-parent families: Massachusetts, 2003-2012. Analysis by Population Reference Bureau of data from the U.S. Census Bureau, Census 2000 Supplementary Survey, 2001 Supplementary Survey and 2002 through 2012 American Community Survey (ACS). Accessed via Kids Count website: www.datacenter.kidscount.org.
Since 1980, the fraction of Massachusetts
children in single-parent families has
grown from one in five to one in
three.
2
46%
49%
51%
53%
54%
54%
55%
62%
0% 10% 20% 30% 40% 50% 60% 70%
LOWELL
WORCESTER
LYNN
BROCKTON
FALL RIVER
BOSTON
NEW BEDFORD
SPRINGFIELD
MASSACHUSETTS CHILDREN LIVING IN SINGLE-‐PARENT HOUSEHOLDS, 2012
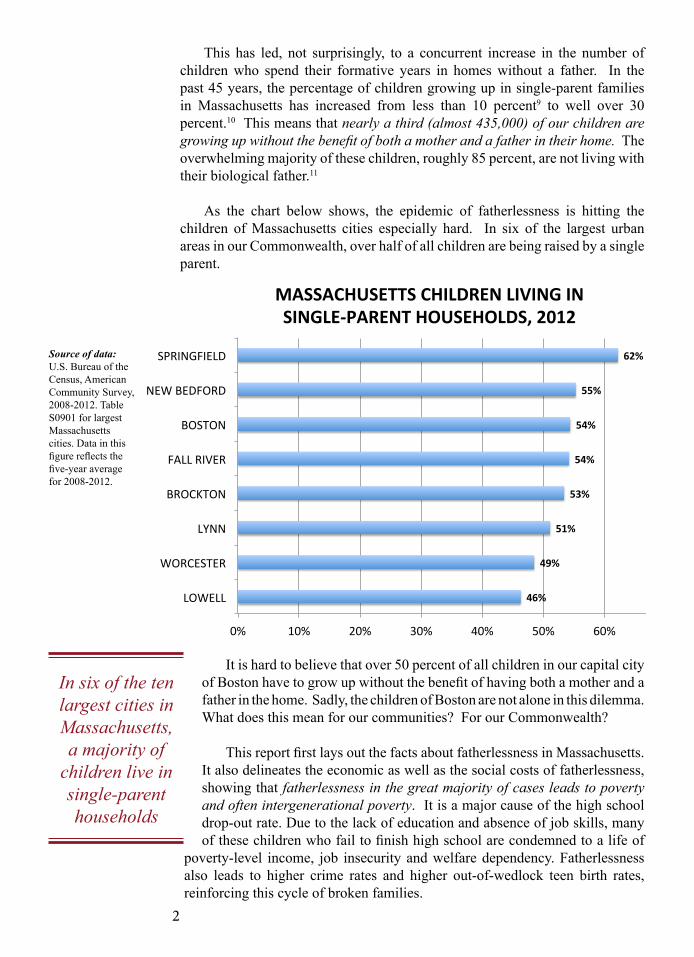
This has led, not surprisingly, to a concurrent increase in the number of children who spend their formative years in homes without a father. In the past 45 years, the percentage of children growing up in single-parent families in Massachusetts has increased from less than 10 percent9 to well over 30 percent.10 This means that nearly a third (almost 435,000) of our children are growing up without the benefit of both a mother and a father in their home. The overwhelming majority of these children, roughly 85 percent, are not living with their biological father.11
As the chart below shows, the epidemic of fatherlessness is hitting the children of Massachusetts cities especially hard. In six of the largest urban areas in our Commonwealth, over half of all children are being raised by a single parent.
It is hard to believe that over 50 percent of all children in our capital city of Boston have to grow up without the benefit of having both a mother and a father in the home. Sadly, the children of Boston are not alone in this dilemma. What does this mean for our communities? For our Commonwealth?
This report first lays out the facts about fatherlessness in Massachusetts. It also delineates the economic as well as the social costs of fatherlessness, showing that fatherlessness in the great majority of cases leads to poverty and often intergenerational poverty. It is a major cause of the high school drop-out rate. Due to the lack of education and absence of job skills, many of these children who fail to finish high school are condemned to a life of
poverty-level income, job insecurity and welfare dependency. Fatherlessness also leads to higher crime rates and higher out-of-wedlock teen birth rates, reinforcing this cycle of broken families.
In six of the ten largest cities in Massachusetts, a majority of
children live in single-parent households
Source of data: U.S. Bureau of the Census, American Community Survey, 2008-2012. Table S0901 for largest Massachusetts cities. Data in this figure reflects the five-year average for 2008-2012.
3
In brief, fatherlessness is a tragedy for the child, a disaster for the family, a blight on the community and a catastrophe for the Commonwealth and the country! The consequences of fatherlessness do not stop at the door of the family home, but radiate out to the surrounding community and civic body in the form of increased crime and a ballooning economic burden of welfare costs. Fatherlessness affects us all, and leaders in our government, our churches, academia and the professions should unite to make it a high priority to bring fathers home.
This problem of family decline is not limited to any one demographic group in Massachusetts, as fatherlessness cuts across racial and ethnic lines. In New Bedford, which has a majority of white children in its child population, 55 percent of all children live in single-parent families. In Springfield, which has a majority of Hispanic children in its child population, 62 percent of all children live in single-parent families. In Brockton, where black children are the largest racial/ethnic group, 53 percent of all children live in single-parent families. And in Boston, in which no one racial/ethnic group predominates, 54 percent of all children live in single-parent families.12
The problem of family decline is also not limited to any one geographic area. It is evident in rural as well as urban areas of the Commonwealth. In Western Massachusetts, encompassing Berkshire, Franklin, and Hampshire counties, fewer than half of today’s teenagers – 46 percent – have grown up living with both married parents throughout their childhood. In the urban neighborhoods of South Boston and adjacent areas of Suffolk County, only about a quarter of teenagers – 28 percent – have been raised by both married parents. Even in the Boston suburbs of Norfolk and Middlesex counties, with their well-educated and affluent populations, the proportion of teens who have grown up with both parents does not exceed 70 percent.13
The increase in fatherless families means that growing numbers of young people will reach adulthood ill-equipped to become self-supporting wage earners and taxpayers, and active, informed citizens. A single-parent upbringing puts a child at greater risk of academic underachievement, youthful idleness, teen parenthood and adult criminality. No Massachusetts community is immune from the problem of fatherlessness, and we must all face it together.
The consequences of fatherlessness do not stop at the door of the family home, but radiate out to the surrounding
community.
No Massachusetts community is immune from
the problem of fatherlessness, and we must all face it
together.
4
II:the cost of fatherlessnesspoverty
Young people who grow up in fatherless families are far more likely to live in poverty
The presence of a committed father is
statistically one of the greatest predictors of financial stability for
children.
“… [T]he proliferation of single-parent households accounts for virtually all of the increase in child poverty since the early 1970s.”
– Jonathan Rauch, “The Widening Marriage Gap: America’s NewClass Divide.” Reason.com. N.p., 19 May 2001. Web. 29 Sept. 2014.
“The truth is, the greatest tool to lift children and families from poverty is one that decreases the probability of child poverty by 82%. But it isn’t a government spending program. It’s called marriage.”
– Marco Rubio, United States Senator for Florida. “Reclaiming The Land of Opportunity: Conservative Reforms for Combatting Poverty”. N.p., 8 Jan. 2014. Web. 29 Sept. 2014.
“Child poverty is an ongoing national concern, but few are aware of its principal cause: the absence of married fathers in the home.”
– Robert Rector, “Marriage: America’s Greatest Weapon Against Child Poverty,” The Heritage Foundation, Special Report No. 117September 5, 2012 p. 1.
“Nonmarital childbearing is one of the preeminent reasons this nation, despite spending about $1 trillion a year on programs for disadvantaged families, is struggling to reduce poverty and increase economic mobility.”
– Ron Haskins, “The Crisis of Nonmarital Childbearing,” The Heritage Foundation 2014 Index of Culture and Opportunity, p. 45.
“… [W]hen parents fail to marry and stay married, children are more likely to experience deep and persistent poverty, even after controlling for race and family background.”
– W. Bradford Wilcox et. al., Why Marriage Matters: Twenty-SixConclusions from the Social Sciences, rev. ed. (New York: Institute ofAmerican Values, 2005), 19.
5
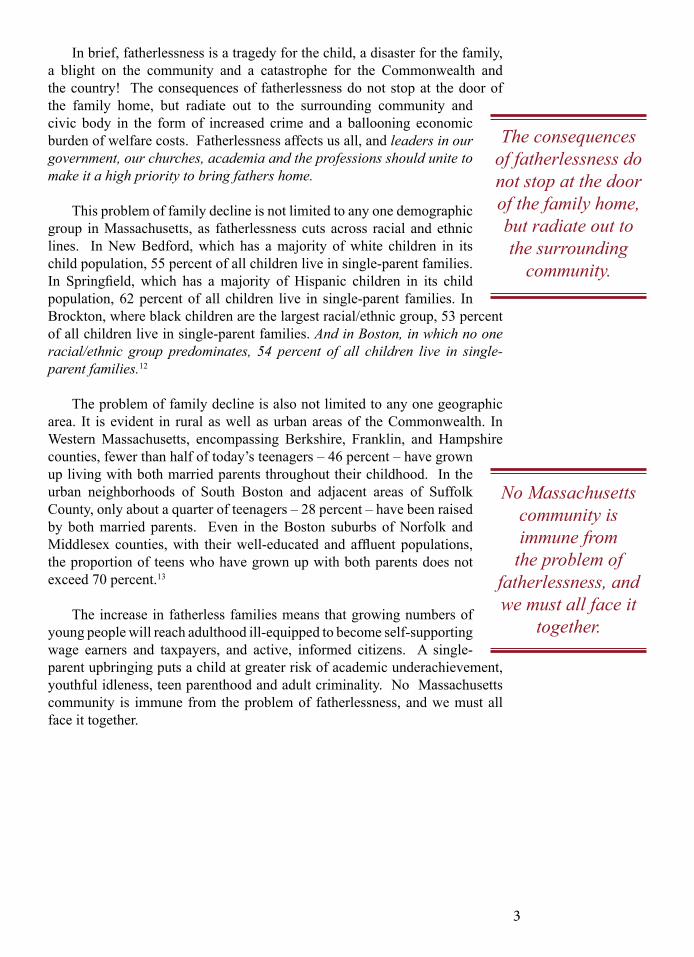
The poverty rate for fatherless families in Massachusetts is five to ten times higher
than the poverty rate for children who are
living in married two-parent families.
Source of data: National Survey of Children’s Health (NSCH), public use microdata files from 2011-2012 surveys. Analyzed by Nicholas Zill, May 2014.
51%
26%
5% 0%
10%
20%
30%
40%
50%
60%
Never-‐Married Mother
Divorced or Separated Mother
Both Married Parents
MASSACHUSETTS CHILDREN IN POVERTY
The importance of a father to the economic well-being of children cannot be overemphasized. Statistically one of the greatest predictors of financial stability for children is the presence of a committed father. This is dramatically illustrated by the increased threat of poverty where a father is absent. Nationally, nearly half of all homes where a married father is not present are in poverty.15 In 2013, the poverty rate for fatherless homes was more than twice the average for all families in America and over four times the rate of poverty for children living with a married mother and father.16
In Massachusetts, the economic disparity between married mother-father homes and fatherless households is even greater. For example, the poverty rate for fatherless families in the Commonwealth is five to ten times higher than the poverty rate for children who are living in married two-parent families, with both their birth parents or two adoptive parents.17 The poverty rate for children when both mother and father are present is 5 percent. In contrast, 26 percent of Massachusetts children living with divorced or separated mothers, and 51 percent of those living with never-married mothers, are in families whose income is below the official poverty line.18

6
In four of the 10 largest cities in Massachusetts,
majorities of children in
fatherless homes are poor.
$0
$20,000
$40,000
$60,000
$80,000
$100,000
$120,000
Married-‐couple Households
Fatherless Households
2013 MEDIAN ANNUAL INCOME IN MASSACHUSETTS
These statistics are even more unsettling when we look at the real dollar value of what it means to be “in poverty.” The federal poverty threshold in 2012 for a mother and one child was $15,825. For a mother and two children, it was $18,498.19 Children in mother-father families, however, are significantly less vulnerable to falling below the poverty level. In fact, they are statistically less likely to get anywhere near it. A clear majority, 60 percent, of Massachusetts children in intact, two-parent families are in what is termed a “financially-secure household,” whose annual income is at least 400 percent of the official poverty level.20
There has been much concern and discussion in recent years about the problem of “rising income inequality.” Many lament what is seen as a growing gulf between the super-rich and the working poor. Sadly, a critical factor in this discussion is often overlooked; that is, that the increase in fatherless families is a significant contributor to income inequality. In the Commonwealth, for example, the median family income for married-couple households with children in 2013 was $114,376. For female-headed households with children, it was less than a quarter as much, $26,999.21
More than 60 percent of children in married-couple households have both parents in the labor force. By contrast, nearly 25 percent of children in fatherless families have no parent working to support them. Eighty percent
of children in married-couple households in Massachusetts live in houses or apartments that their parents own. Seventy percent of children in female-headed households have mothers who are renters.22
Source of data: U.S. Bureau of the Census, American Community Survey (ACS), 2013. Table S0901. Characteristics of Children. Accessed via the American FactFinder website: http://factfinder2.census.gov.
income inequality
7
Young people who grow up in fatherless
families are far more likely to live
in poverty than those who grow up in married-couple families.
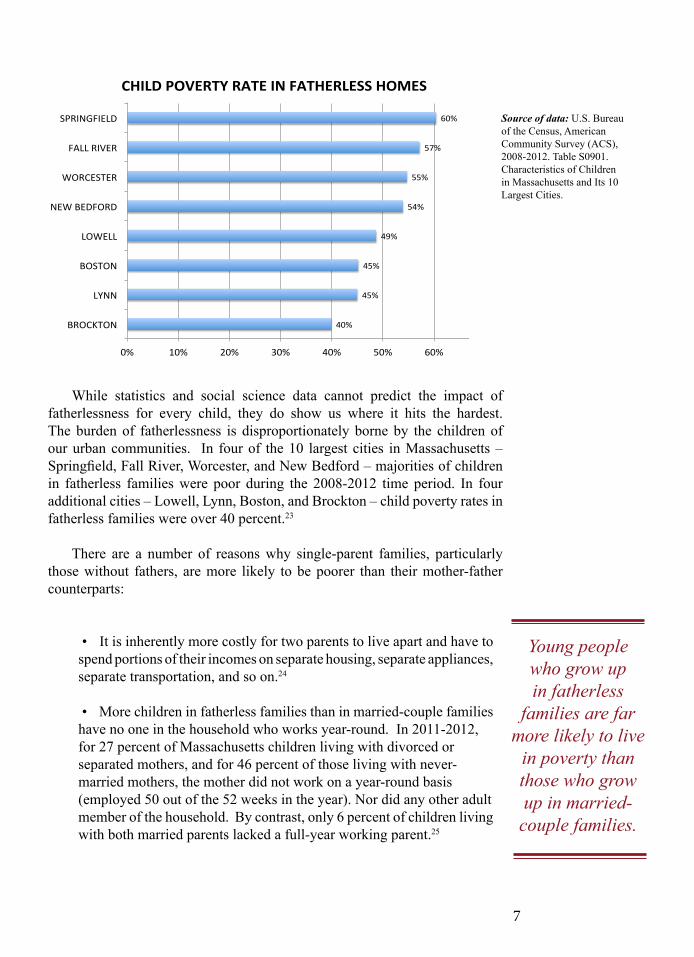
40%
45%
45%
49%
54%
55%
57%
60%
0% 10% 20% 30% 40% 50% 60% 70%
BROCKTON
LYNN
BOSTON
LOWELL
NEW BEDFORD
WORCESTER
FALL RIVER
SPRINGFIELD
CHILD POVERTY RATE IN FATHERLESS HOMES
Source of data: U.S. Bureau of the Census, American Community Survey (ACS), 2008-2012. Table S0901. Characteristics of Children in Massachusetts and Its 10 Largest Cities.
While statistics and social science data cannot predict the impact of fatherlessness for every child, they do show us where it hits the hardest. The burden of fatherlessness is disproportionately borne by the children of our urban communities. In four of the 10 largest cities in Massachusetts – Springfield, Fall River, Worcester, and New Bedford – majorities of children in fatherless families were poor during the 2008-2012 time period. In four additional cities – Lowell, Lynn, Boston, and Brockton – child poverty rates in fatherless families were over 40 percent.23
There are a number of reasons why single-parent families, particularly those without fathers, are more likely to be poorer than their mother-father counterparts:
• It is inherently more costly for two parents to live apart and have to spend portions of their incomes on separate housing, separate appliances, separate transportation, and so on.24
• More children in fatherless families than in married-couple families have no one in the household who works year-round. In 2011-2012, for 27 percent of Massachusetts children living with divorced or separated mothers, and for 46 percent of those living with never-married mothers, the mother did not work on a year-round basis (employed 50 out of the 52 weeks in the year). Nor did any other adult member of the household. By contrast, only 6 percent of children living with both married parents lacked a full-year working parent.25
8
• For 65 percent of Massachusetts children with never-married mothers, and 27 percent of those with divorced or separated mothers, the mother had achieved only a high school education or less. This limited her potential earnings.
As the above figures demonstrate, the economic plight of never-married mothers is consistently and substantially greater than that of divorced or separated mothers. This evidences a residual economic benefit of marriage, even after the upheaval of divorce, as those children who start out with no father fare significantly worse than those who at least begin with the advantage of married parents. Some of this disparity no doubt stems from greater child support payments from divorced fathers. However, this is still a poor financial substitute for having a father in the house.
• Nationally, 70 percent of children in fatherless families have fathers who do not pay child support to the mother. Divorced mothers are more likely to be receiving child support than separated or never-married mothers.27
• Even when fathers do pay child support, they typically do not pay much. Nationally, the median amount of child support received by custodial mothers who received any support in 2011 was $2,500 per year. Often, the non-residential father has started a new family that puts demands on his earnings as well.28
Conclusion: Notwithstanding the heroic efforts of single mothers raising children, young people who grow up in fatherless families are far more likely to live in poverty than those with a married father and mother living together. This is not to disparage in any way the sacrifice and exhausting work of mothers raising children by themselves. Instead, we should work to minimize the number who must do so.
9
academic underachievement Students from fatherless families have a greater risk of academic and behavioral problems
Source of data: Sara McLanahan “Father Absence and the Welfare of Children.” MacArthur Research Network on The Family and The Economy Working Paper, (1999).
Students from fatherless families have twice the risk
of high-school dropout as those
from married-couple families.
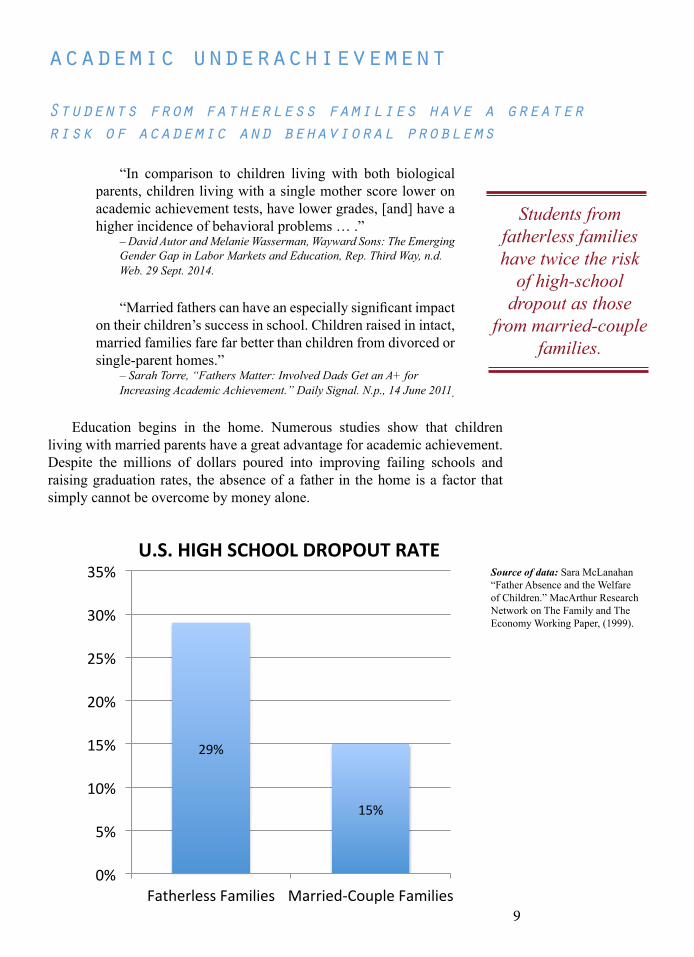
29%
15%
0%
5%
10%
15%
20%
25%
30%
35%
Fatherless Families Married-‐Couple Families
U.S. HIGH SCHOOL DROPOUT RATE
“In comparison to children living with both biological parents, children living with a single mother score lower on academic achievement tests, have lower grades, [and] have a higher incidence of behavioral problems … .”
– David Autor and Melanie Wasserman, Wayward Sons: The EmergingGender Gap in Labor Markets and Education, Rep. Third Way, n.d.Web. 29 Sept. 2014.
“Married fathers can have an especially significant impact on their children’s success in school. Children raised in intact, married families fare far better than children from divorced or single-parent homes.”
– Sarah Torre, “Fathers Matter: Involved Dads Get an A+ forIncreasing Academic Achievement.” Daily Signal. N.p., 14 June 2011.
Education begins in the home. Numerous studies show that children living with married parents have a great advantage for academic achievement. Despite the millions of dollars poured into improving failing schools and raising graduation rates, the absence of a father in the home is a factor that simply cannot be overcome by money alone.
10
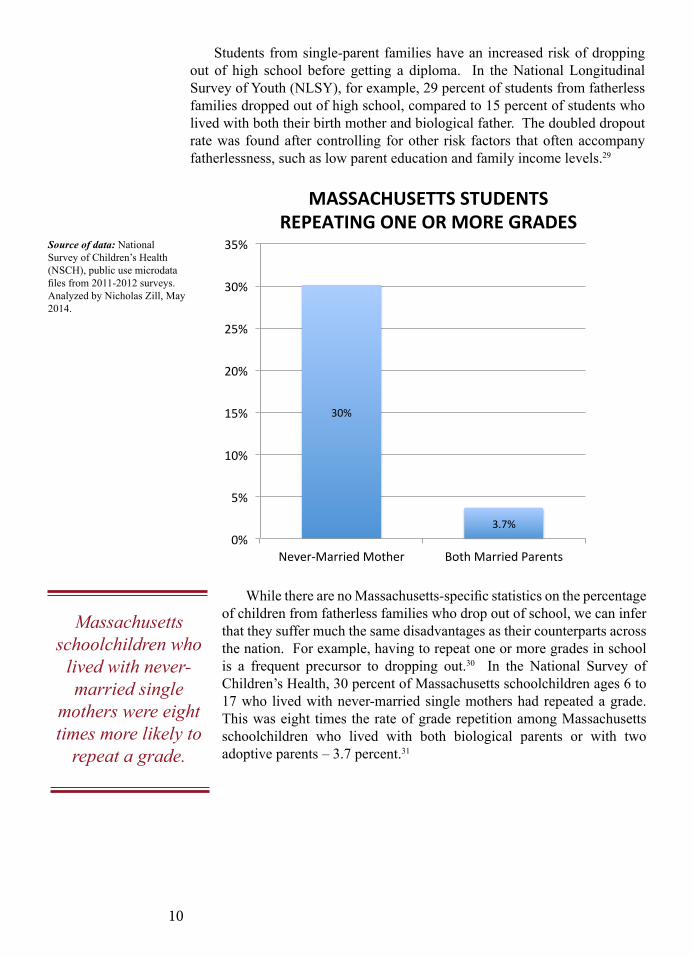
Source of data: National Survey of Children’s Health (NSCH), public use microdata files from 2011-2012 surveys. Analyzed by Nicholas Zill, May 2014.
Massachusetts schoolchildren who
lived with never-married single
mothers were eight times more likely to
repeat a grade.
30%
3.7% 0%
5%
10%
15%
20%
25%
30%
35%
Never-‐Married Mother Both Married Parents
MASSACHUSETTS STUDENTS REPEATING ONE OR MORE GRADES
Students from single-parent families have an increased risk of dropping out of high school before getting a diploma. In the National Longitudinal Survey of Youth (NLSY), for example, 29 percent of students from fatherless families dropped out of high school, compared to 15 percent of students who lived with both their birth mother and biological father. The doubled dropout rate was found after controlling for other risk factors that often accompany fatherlessness, such as low parent education and family income levels.29
While there are no Massachusetts-specific statistics on the percentage of children from fatherless families who drop out of school, we can infer that they suffer much the same disadvantages as their counterparts across the nation. For example, having to repeat one or more grades in school is a frequent precursor to dropping out.30 In the National Survey of Children’s Health, 30 percent of Massachusetts schoolchildren ages 6 to 17 who lived with never-married single mothers had repeated a grade. This was eight times the rate of grade repetition among Massachusetts schoolchildren who lived with both biological parents or with two adoptive parents – 3.7 percent.31
11
High school dropout rates are higher in
Massachusetts cities with more fatherless
families.
Source of data: Massachusetts Department of Elementary and Secondary Education, 2013 Graduation Report (DISTRICT) for All Students, 4-Year Graduation Rate.
12%
12%
12%
14%
16%
18%
28%
30%
0% 5% 10% 15% 20% 25% 30%
Brockton
Lowell
Worcester
Lynn
Boston
Fall River
New Bedford
Springfield
MASSACHUSETTS CITIES: FOUR-‐YEAR HIGH SCHOOL DROPOUT RATE, 2013
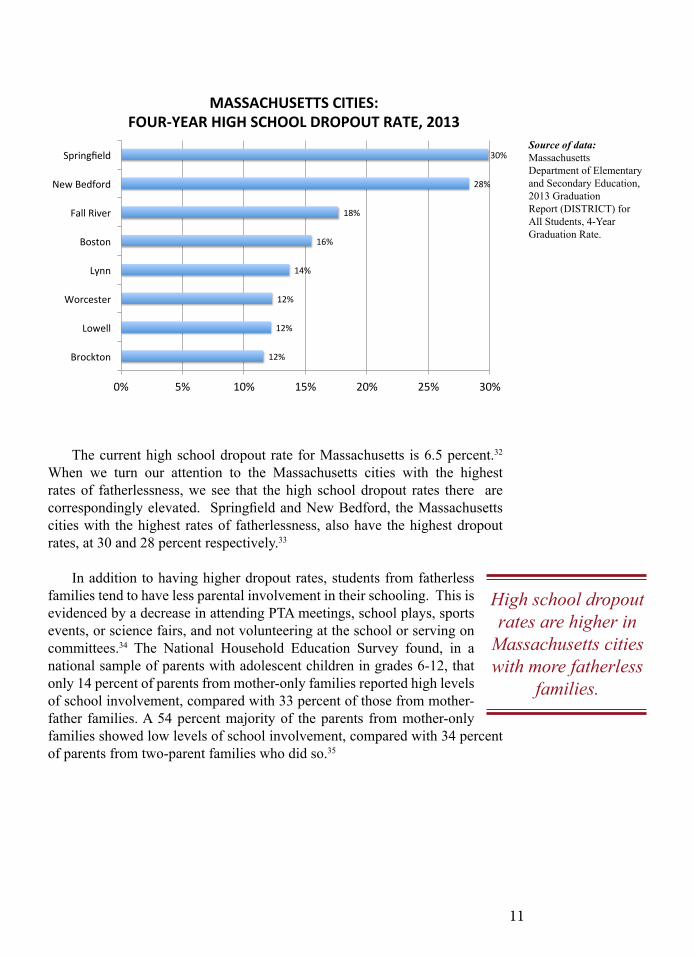
The current high school dropout rate for Massachusetts is 6.5 percent.32 When we turn our attention to the Massachusetts cities with the highest rates of fatherlessness, we see that the high school dropout rates there are correspondingly elevated. Springfield and New Bedford, the Massachusetts cities with the highest rates of fatherlessness, also have the highest dropout rates, at 30 and 28 percent respectively.33
In addition to having higher dropout rates, students from fatherless families tend to have less parental involvement in their schooling. This is evidenced by a decrease in attending PTA meetings, school plays, sports events, or science fairs, and not volunteering at the school or serving on committees.34 The National Household Education Survey found, in a national sample of parents with adolescent children in grades 6-12, that only 14 percent of parents from mother-only families reported high levels of school involvement, compared with 33 percent of those from mother-father families. A 54 percent majority of the parents from mother-only families showed low levels of school involvement, compared with 34 percent of parents from two-parent families who did so.35
12
Students with mother-only families or
stepfamilies were twice as likely to have been
suspended from school as students from mother-father
families.
When schools do have contact with single-parent homes, it is often to address disciplinary problems. In the National Survey of Children’s Health, 43 percent of Massachusetts schoolchildren ages 6 to 17 who lived with never-married single mothers had one or more problems at school that led to the school’s contacting the parent. Among schoolchildren living with divorced or separated mothers, 36 percent had one or more problems resulting in the school’s contacting the parent. Both of these groups had higher rates of parent contact than was found among Massachusetts schoolchildren who lived with both biological parents – 25 percent. Controlling for age, sex, race and parent education level reduced the disparity in contact rates somewhat, but the students with never-married, separated, or divorced mothers still had significantly higher contact rates than students who lived with both biological parents.36
Likewise, in the National Household Education Survey, students from mother-only families or stepfamilies were twice as likely to have been suspended from school as students from mother-father families. After adjustment for parent education, family income, race, and parent involvement, students from mother-only families and stepfamilies were still twice as likely to be suspended as those from two-parent families.37
For students who do graduate from high school, their chances of enrolling in and then graduating from college are less if they come from fatherless families than if they come from two-parent families. In a study based on the second National Survey of Families and Households, for example, 61 percent of students from mother-father families who graduated from high school went on to enroll in college, compared with 49 percent of high school graduates from mother-only families. Subsequently, 37 percent of the students from two-parent families got a bachelor’s degree, compared with 17 percent of the students from fatherless families.38
Not completing high school has a long-term impact on a young person’s chances for stable employment and his or her prospects for earning a living wage. According to the U.S. Bureau of Labor Statistics, the unemployment rate in 2013 for workers 25 years old and older who had less than a high-school education was 47 percent higher than for workers who had a high
school diploma. And it was more than twice as high as the unemployment rate for workers who had an associate’s degree – 5.4 percent. The median weekly earnings in 2013 for full-time wage and salary workers with less than a high school education was $472. That’s only 73 percent of the weekly earnings for a worker with a high school diploma ($651) and just 60 percent of the weekly earnings for workers with an associate’s degree ($777).39
Conclusion: One of the root causes of “income equality” is educational disparity. Young people who fail to obtain a high school diploma are far more likely to have difficulty finding employment and more vulnerable to falling below the poverty level. The economic and familial stability of marriage gives children more opportunity and choice in education and puts them on the path to success.40
13
crime
Young adults from fatherless families are more likely to commit crimes and be incarcerated
“Over 70 percent of long-term prison inmates come from broken homes, and young men raised in fatherless households are at least twice as likely to be incarcerated as those from intact families.”
– Chuck Colson, as quoted by Eric Metaxas, “Be a Heroic Dad.” Breakpoint Commentaries, 15 May 2013. Web. 29 Sept. 2014.
“Even after controlling for income, youths in father-absent households still had significantly higher odds of incarceration than those in mother-father families. Youths who never had a father in the household experienced the highest odds.”
– Cynthia Harper and Sara S. McLanahan. “Father Absence andYouth Incarceration.” Journal of Research on Adolescence, 14: 369-397, (September 2004).
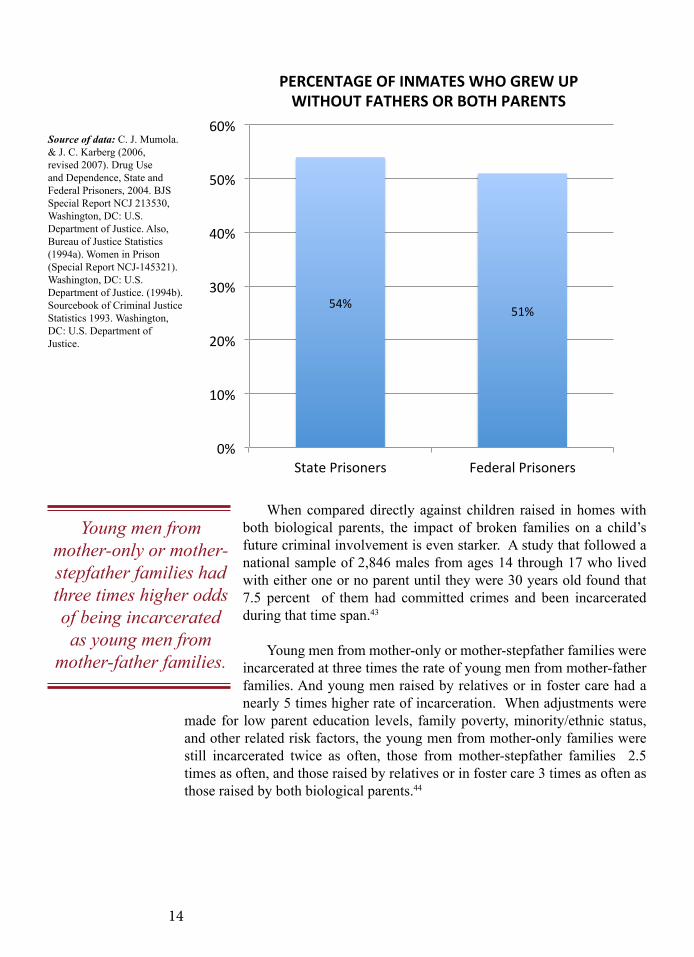
Children growing up outside of two-parent homes, particularly those without a father, have a substantially higher incidence of incarceration as adults. When the Department of Justice conducted surveys looking at the family backgrounds of prisoners in state and federal prisons in the United States, it found that the majority of prisoners, male and female, grew up in fatherless families or lived apart from both parents, with relatives or in foster care.41
In the year 2004, for example, 54 percent of prisoners in state penal institutions and 51 percent of those in federal prisons were raised apart from their fathers or from both biological parents. By comparison, 24 percent of the U.S. young adult population at that time grew up in single-parent or no-parent households.42 This disproportionate representation of children from fatherless families behind bars demonstrates the tragic relationship between family decline and crime.
14
54% 51%
0%
10%
20%
30%
40%
50%
60%
State Prisoners Federal Prisoners
PERCENTAGE OF INMATES WHO GREW UP WITHOUT FATHERS OR BOTH PARENTS
Young men from mother-only or mother-stepfather families had three times higher odds of being incarcerated as young men from
mother-father families.
Source of data: C. J. Mumola. & J. C. Karberg (2006, revised 2007). Drug Use and Dependence, State and Federal Prisoners, 2004. BJS Special Report NCJ 213530, Washington, DC: U.S. Department of Justice. Also, Bureau of Justice Statistics (1994a). Women in Prison (Special Report NCJ-145321). Washington, DC: U.S. Department of Justice. (1994b). Sourcebook of Criminal Justice Statistics 1993. Washington, DC: U.S. Department of Justice.
When compared directly against children raised in homes with both biological parents, the impact of broken families on a child’s future criminal involvement is even starker. A study that followed a national sample of 2,846 males from ages 14 through 17 who lived with either one or no parent until they were 30 years old found that 7.5 percent of them had committed crimes and been incarcerated during that time span.43
Young men from mother-only or mother-stepfather families were incarcerated at three times the rate of young men from mother-father families. And young men raised by relatives or in foster care had a nearly 5 times higher rate of incarceration. When adjustments were
made for low parent education levels, family poverty, minority/ethnic status, and other related risk factors, the young men from mother-only families were still incarcerated twice as often, those from mother-stepfather families 2.5 times as often, and those raised by relatives or in foster care 3 times as often as those raised by both biological parents.44
15
violence
Children in fatherless families are more likely to be victims of violent crime
25%
16%
4% 0%
5%
10%
15%
20%
25%
30%
Never-‐Married Mother
Divorced or Separated Mother
Both Married Parents
PERCENTAGE OF MASSACHUSETTS CHILDREN WHO HAVE EXPERIENCED VIOLENCE IN THEIR NEIGHBORHOOD
Source of data: National Survey of Children’s Health (NSCH), public use microdata files from 2011-2012 surveys. Analyzed by Nicholas Zill, May 2014.
Children in fatherless families are six times more likely to be victims of violent crimes
than children living with both
biological parents.
“There’s no more important ingredient for success, nothing that would be more important for us reducing violence than strong, stable families — which means we should do more to promote marriage and encourage fatherhood.”
– President Barack Obama, Remarks by the President onStrengthening the Economy for the Middle Class, speech given atHyde Park Academy, Chicago, IL, 15 Feb. 2013. The White House,Office of the Press Secretary, Web. 29 Sept. 2014.
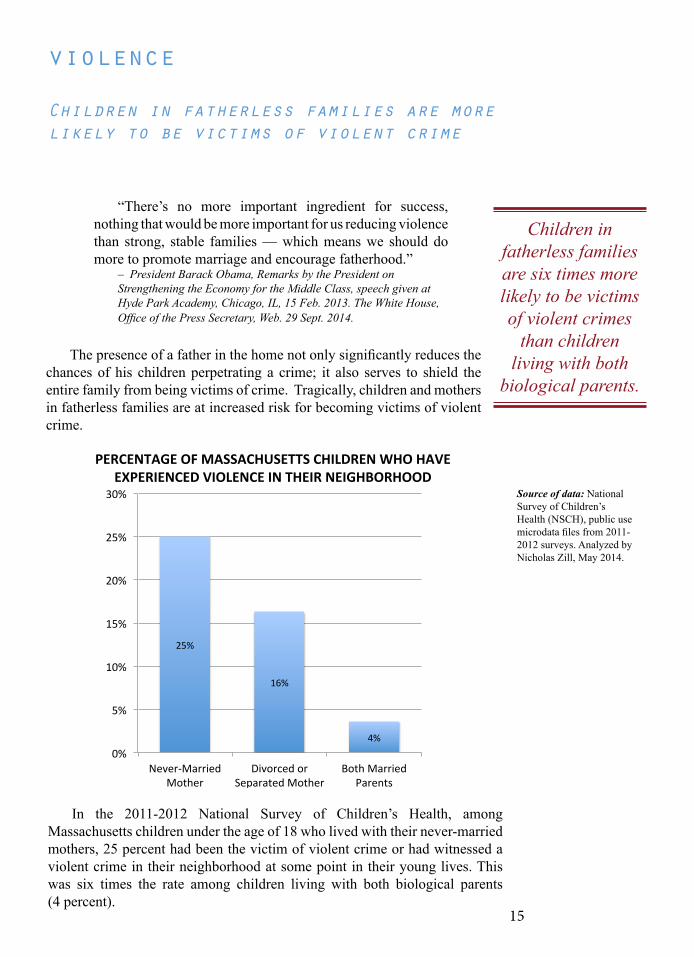
The presence of a father in the home not only significantly reduces the
chances of his children perpetrating a crime; it also serves to shield the entire family from being victims of crime. Tragically, children and mothers in fatherless families are at increased risk for becoming victims of violent crime.
In the 2011-2012 National Survey of Children’s Health, among Massachusetts children under the age of 18 who lived with their never-married mothers, 25 percent had been the victim of violent crime or had witnessed a violent crime in their neighborhood at some point in their young lives. This was six times the rate among children living with both biological parents (4 percent).
16
18%
2% 0%
2%
4%
6%
8%
10%
12%
14%
16%
18%
20%
Fatherless Both Married Parents
MASSACHUSETTS CHILDREN WHO HAVE WITNESSED VIOLENCE IN THEIR OWN HOME
Source of data: National Survey of Children’s Health (NSCH), public use microdata files from 2011-2012 surveys. Analyzed by Nicholas Zill, May 2014.
Massachusetts children in fatherless
families had nine times the risk of having witnessed
violence within their own households.
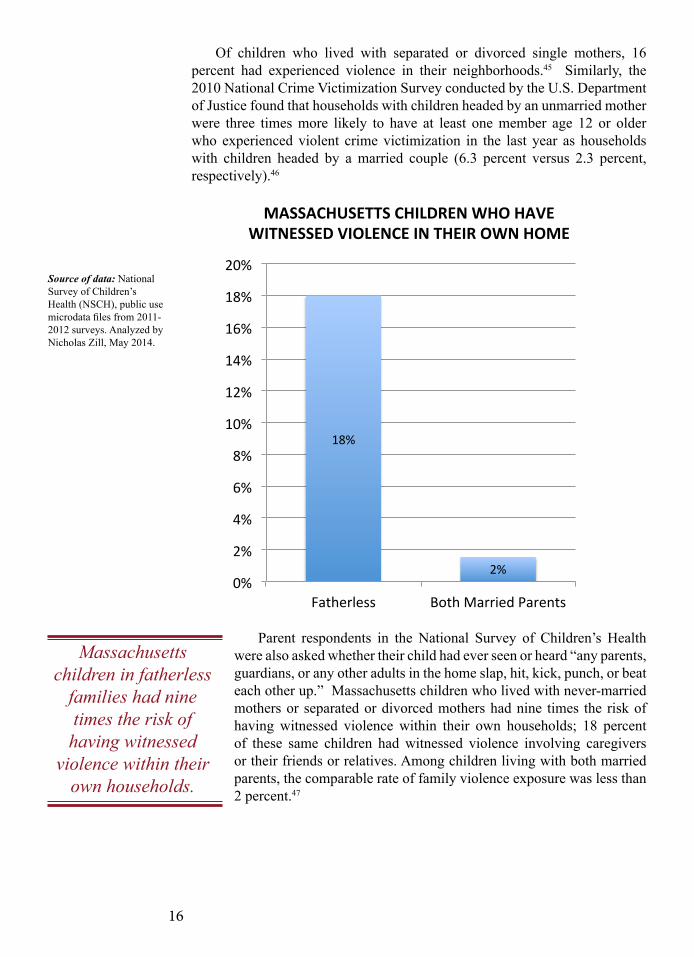
Of children who lived with separated or divorced single mothers, 16 percent had experienced violence in their neighborhoods.45 Similarly, the 2010 National Crime Victimization Survey conducted by the U.S. Department of Justice found that households with children headed by an unmarried mother were three times more likely to have at least one member age 12 or older who experienced violent crime victimization in the last year as households with children headed by a married couple (6.3 percent versus 2.3 percent, respectively).46
Parent respondents in the National Survey of Children’s Health were also asked whether their child had ever seen or heard “any parents, guardians, or any other adults in the home slap, hit, kick, punch, or beat each other up.” Massachusetts children who lived with never-married mothers or separated or divorced mothers had nine times the risk of having witnessed violence within their own households; 18 percent of these same children had witnessed violence involving caregivers or their friends or relatives. Among children living with both married parents, the comparable rate of family violence exposure was less than 2 percent.47
17
teen pregnancy
Young women from fatherless families are more likely to become teen mothers
13%
6%
0%
2%
4%
6%
8%
10%
12%
14%
Fatherless Families Mother-‐Father Families
PERCENTAGE OF TEEN MOTHERS BY FAMILY TYPE IN THE U.S.
Source of data: McLanahan, S. (1999). Father absence and the welfare of children. MacArthur Research Network on The Family and The Economy Working Paper, Figure 4, http://apps.olin.wustl.edu/macarthur/working%20papers/wp-mclanahan2.htm
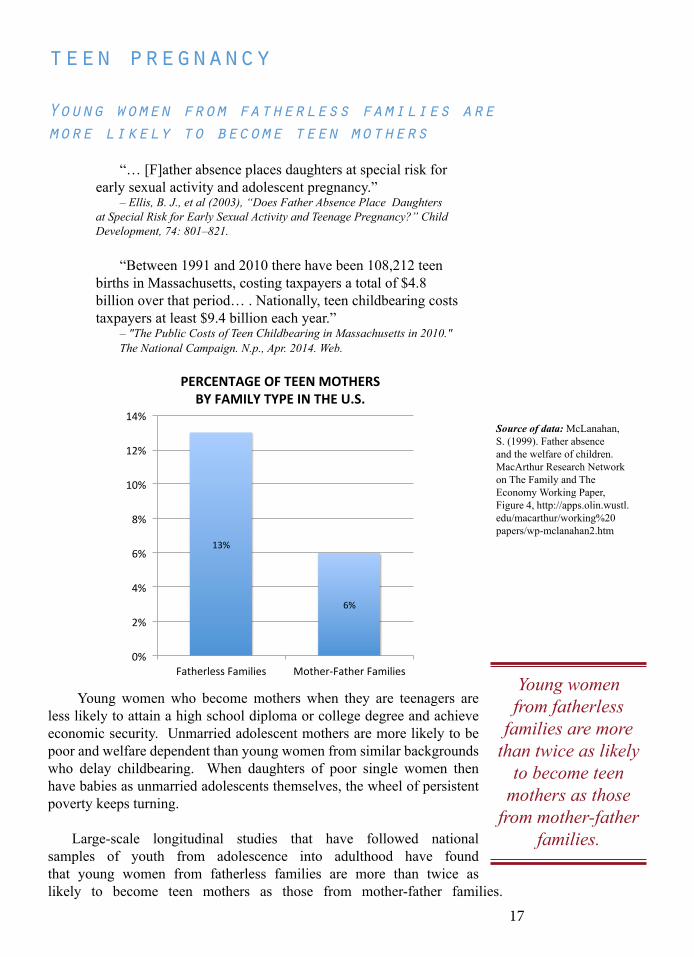
Young women who become mothers when they are teenagers are less likely to attain a high school diploma or college degree and achieve economic security. Unmarried adolescent mothers are more likely to be poor and welfare dependent than young women from similar backgrounds who delay childbearing. When daughters of poor single women then have babies as unmarried adolescents themselves, the wheel of persistent poverty keeps turning.
Large-scale longitudinal studies that have followed national samples of youth from adolescence into adulthood have found that young women from fatherless families are more than twice as likely to become teen mothers as those from mother-father families.
“… [F]ather absence places daughters at special risk for early sexual activity and adolescent pregnancy.”
– Ellis, B. J., et al (2003), “Does Father Absence Place Daughters at Special Risk for Early Sexual Activity and Teenage Pregnancy?” Child Development, 74: 801–821.
“Between 1991 and 2010 there have been 108,212 teen births in Massachusetts, costing taxpayers a total of $4.8 billion over that period… . Nationally, teen childbearing costs taxpayers at least $9.4 billion each year.”
– "The Public Costs of Teen Childbearing in Massachusetts in 2010."The National Campaign. N.p., Apr. 2014. Web.
Young women from fatherless
families are more than twice as likely
to become teen mothers as those
from mother-father families.
18
19.4
31.6
35.5
44.6
44.7
46.2
47.4
54.3
0 10 20 30 40 50 60
Boston
Worcester
Brockton
Fall River
Lowell
Lynn
New Bedford
Springfield
MASSACHUSETTS CITIES: NUMBER OF TEEN BIRTHS PER 1,000 TEENAGERS, 2010
Source of data: Massachusetts Department of Public Health, Bureau of Health Information, Statistics, Research and Evaluation. (March 2013). Massachusetts Births 2010, Table 7. Boston, MA: Commonwealth of Massachusetts, Department of Public Health.
Teen birth rates are higher in
Massachusetts cities with high
concentrations of fatherless families.
In the National Longitudinal Survey of Youth (NLSY), for example, 27 percent of young women from fatherless families became mothers as teenagers, compared with 11 percent of young women from two-parent families who did so. Thirteen percent of the women from fatherless families, versus 6 percent of those from mother-father families, were unmarried teens when they
gave birth for the first time. These contrasts were adjusted for related risk factors such as low parent education and family income levels and minority ethnic background.48
Having married parents reduces the chances of a young woman becoming a teen mother even in households with very low levels of education. In the NLSY sample, young women whose mothers have less than a high-school education as well as being unmarried are especially vulnerable to giving birth before age twenty. Forty-four percent of white women from such backgrounds became teen mothers, as did 45 percent of black women and 46 percent of Hispanic women with similar family backgrounds. These rates of teen parenthood were one-and-a-half to two
times higher than those for young women whose parents had low education levels but were married to one another.49 This demonstrates that the problem of unwed teen pregnancy will not be solved by education alone but rather requires the intergenerational support of marriage.
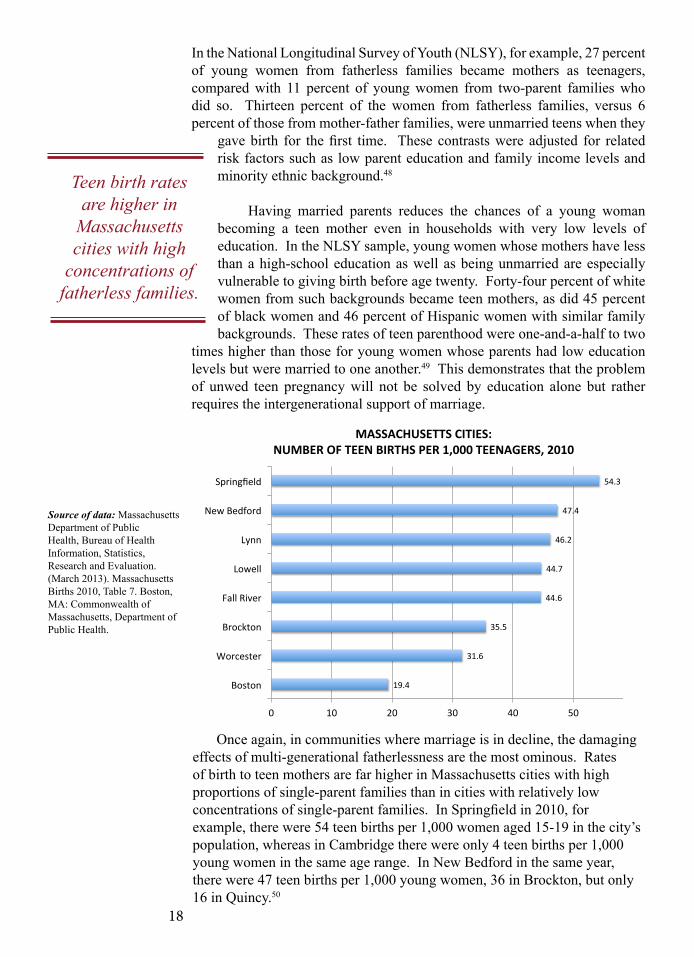
Once again, in communities where marriage is in decline, the damaging effects of multi-generational fatherlessness are the most ominous. Rates of birth to teen mothers are far higher in Massachusetts cities with high proportions of single-parent families than in cities with relatively low concentrations of single-parent families. In Springfield in 2010, for example, there were 54 teen births per 1,000 women aged 15-19 in the city’s population, whereas in Cambridge there were only 4 teen births per 1,000 young women in the same age range. In New Bedford in the same year, there were 47 teen births per 1,000 young women, 36 in Brockton, but only 16 in Quincy.50
19
tax burden
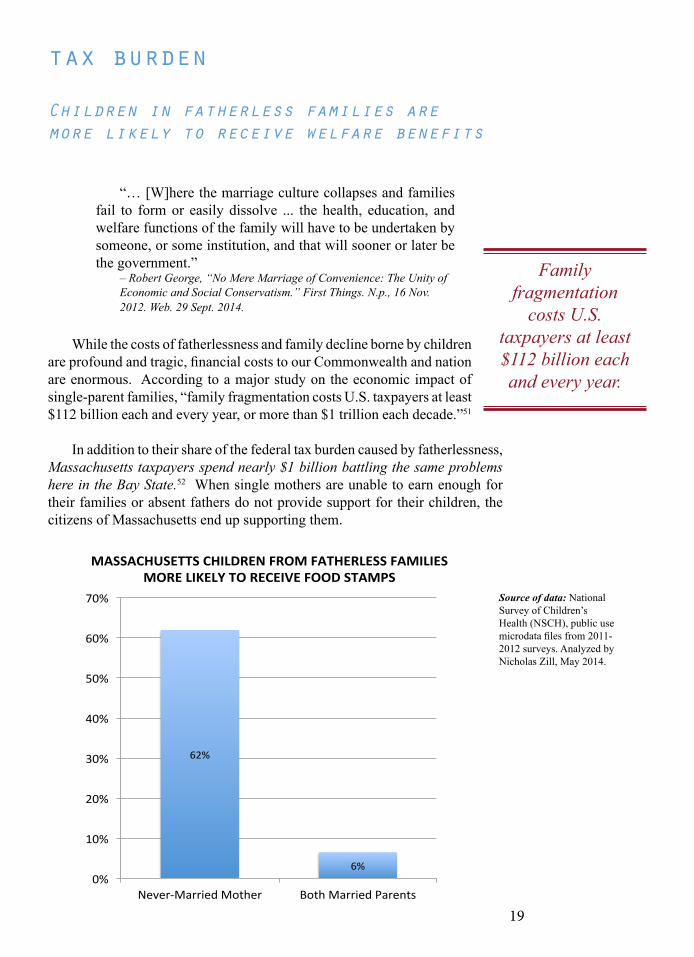
Children in fatherless families are more likely to receive welfare benefits
62%
6% 0%
10%
20%
30%
40%
50%
60%
70%
Never-‐Married Mother Both Married Parents
MASSACHUSETTS CHILDREN FROM FATHERLESS FAMILIES MORE LIKELY TO RECEIVE FOOD STAMPS
Source of data: National Survey of Children’s Health (NSCH), public use microdata files from 2011-2012 surveys. Analyzed by Nicholas Zill, May 2014.
Family fragmentation
costs U.S. taxpayers at least $112 billion each and every year.
“… [W]here the marriage culture collapses and families fail to form or easily dissolve ... the health, education, and welfare functions of the family will have to be undertaken by someone, or some institution, and that will sooner or later be the government.”
– Robert George, “No Mere Marriage of Convenience: The Unity ofEconomic and Social Conservatism.” First Things. N.p., 16 Nov.2012. Web. 29 Sept. 2014.
While the costs of fatherlessness and family decline borne by children are profound and tragic, financial costs to our Commonwealth and nation are enormous. According to a major study on the economic impact of single-parent families, “family fragmentation costs U.S. taxpayers at least $112 billion each and every year, or more than $1 trillion each decade.”51
In addition to their share of the federal tax burden caused by fatherlessness, Massachusetts taxpayers spend nearly $1 billion battling the same problems here in the Bay State.52 When single mothers are unable to earn enough for their families or absent fathers do not provide support for their children, the citizens of Massachusetts end up supporting them.
20
84%
14%
0%
10%
20%
30%
40%
50%
60%
70%
80%
90%
Never-‐Married Mother Both Married Parents
PERCENTAGE OF MASSACHUSETTS CHILDREN COVERED BY PUBLICLY-‐SUBSIDIZED HEALTH INSURANCE
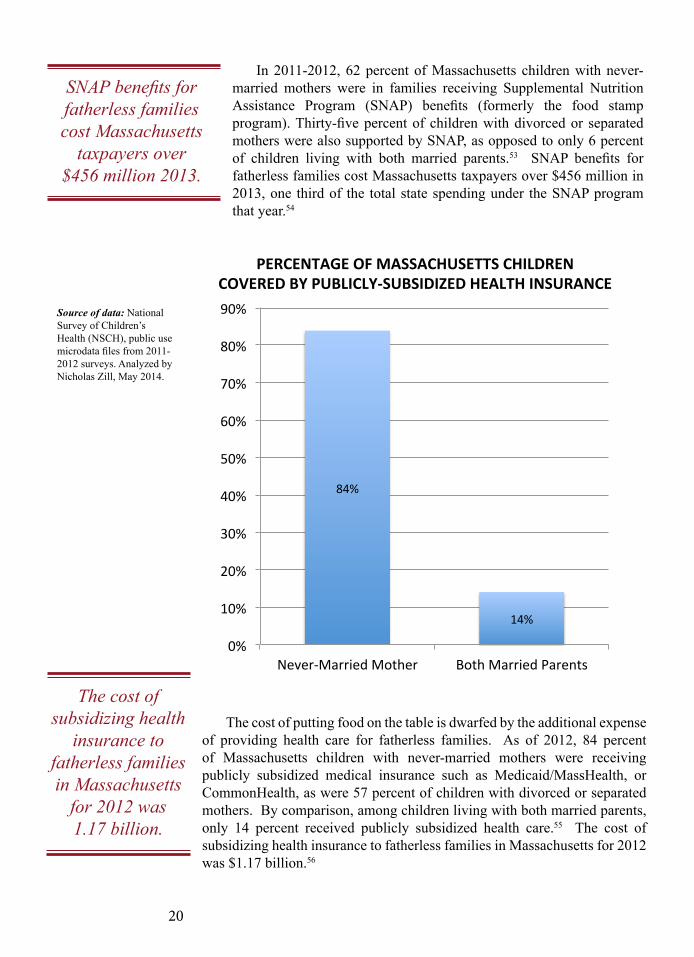
SNAP benefits for fatherless families cost Massachusetts
taxpayers over $456 million 2013.
Source of data: National Survey of Children’s Health (NSCH), public use microdata files from 2011-2012 surveys. Analyzed by Nicholas Zill, May 2014.
The cost of subsidizing health
insurance to fatherless families in Massachusetts
for 2012 was 1.17 billion.
In 2011-2012, 62 percent of Massachusetts children with never-married mothers were in families receiving Supplemental Nutrition Assistance Program (SNAP) benefits (formerly the food stamp program). Thirty-five percent of children with divorced or separated mothers were also supported by SNAP, as opposed to only 6 percent of children living with both married parents.53 SNAP benefits for fatherless families cost Massachusetts taxpayers over $456 million in 2013, one third of the total state spending under the SNAP program that year.54
The cost of putting food on the table is dwarfed by the additional expense of providing health care for fatherless families. As of 2012, 84 percent of Massachusetts children with never-married mothers were receiving publicly subsidized medical insurance such as Medicaid/MassHealth, or CommonHealth, as were 57 percent of children with divorced or separated mothers. By comparison, among children living with both married parents, only 14 percent received publicly subsidized health care.55 The cost of subsidizing health insurance to fatherless families in Massachusetts for 2012 was $1.17 billion.56
21
53%
59%
60%
62%
66%
68%
69%
78%
0% 10% 20% 30% 40% 50% 60% 70% 80% 90%
BROCKTON
LOWELL
BOSTON
LYNN
NEW BEDFORD
WORCESTER
FALL RIVER
SPRINGFIELD
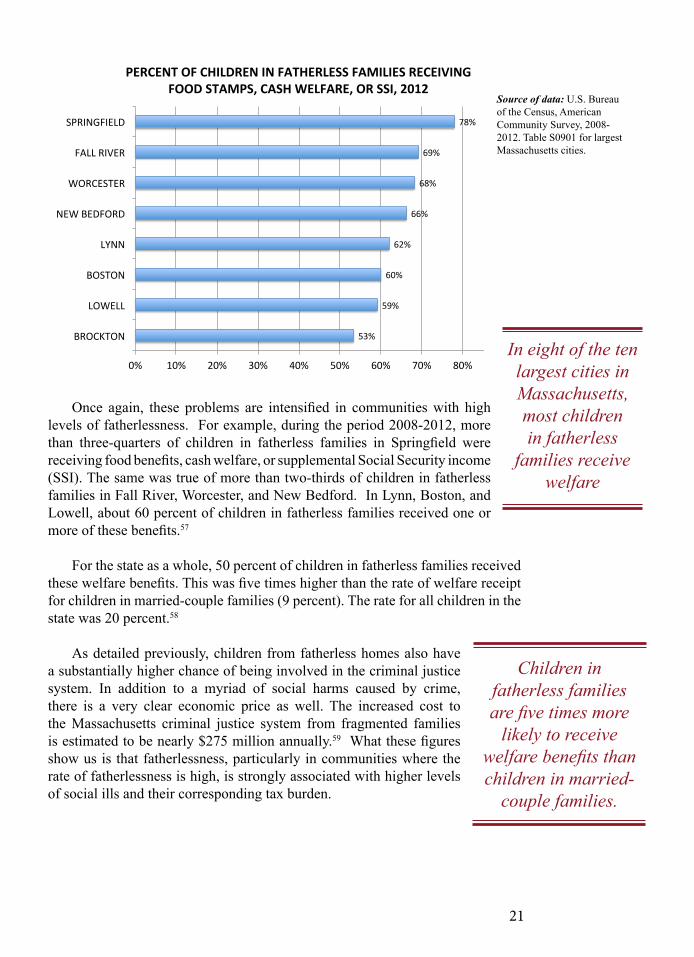
PERCENT OF CHILDREN IN FATHERLESS FAMILIES RECEIVING FOOD STAMPS, CASH WELFARE, OR SSI, 2012
Source of data: U.S. Bureau of the Census, American Community Survey, 2008-2012. Table S0901 for largest Massachusetts cities.
Children in fatherless families are five times more
likely to receive welfare benefits than children in married-
couple families.
In eight of the ten largest cities in Massachusetts, most children in fatherless
families receive welfare
Once again, these problems are intensified in communities with high levels of fatherlessness. For example, during the period 2008-2012, more than three-quarters of children in fatherless families in Springfield were receiving food benefits, cash welfare, or supplemental Social Security income (SSI). The same was true of more than two-thirds of children in fatherless families in Fall River, Worcester, and New Bedford. In Lynn, Boston, and Lowell, about 60 percent of children in fatherless families received one or more of these benefits.57
For the state as a whole, 50 percent of children in fatherless families received these welfare benefits. This was five times higher than the rate of welfare receipt for children in married-couple families (9 percent). The rate for all children in the state was 20 percent.58
As detailed previously, children from fatherless homes also have a substantially higher chance of being involved in the criminal justice system. In addition to a myriad of social harms caused by crime, there is a very clear economic price as well. The increased cost to the Massachusetts criminal justice system from fragmented families is estimated to be nearly $275 million annually.59 What these figures show us is that fatherlessness, particularly in communities where the rate of fatherlessness is high, is strongly associated with higher levels of social ills and their corresponding tax burden.
22
III:the increase in single-parent families
“Trends in marriage are important not just with regard to the organization of communities, but because they are associated with large effects on the socialization of the next generation. No matter what the outcome being examined – the quality of the mother-infant relationship, externalizing behavior in childhood (aggression, delinquency, and hyperactivity), delinquency in adolescence, criminality as adults, illness and injury in childhood, early mortality, sexual decision-making in adolescence, school problems and dropping out, emotional health, or any other measure of how well or poorly children do in life – the family structure that produces the best outcomes for children, on average, are two biological parents who remain married.”
- Charles A. Murray, Coming Apart: The State of White America, 19602010. New York, NY: Crown Forum, 2012. p. 159.
Over the past decade and a half, the rate of fatherlessness in Massachusetts has continued to rise. This has occurred despite awareness of the dramatic social and financial costs that come with it. So why has this costly trend persisted?
The increase in single-parent families is partly due to high rates of marital separation and divorce, as it always has been. But three newer trends are also at play: a decline in the marriage rate, a decline in the birth rate, and a greater cultural acceptance of and complacency towards having and raising children outside marriage.60
fewer marriages
more young people are postponing marriage or not getting married
Young couples, particularly those with college educations, are postponing marriage and having children until they are in their thirties or even forties. Between 1980 and 2011, the number of marriages per year in Massachusetts declined by 25 percent, from about 49,000 to fewer than 36,000.61
23
0%
5%
10%
15%
20%
25%
30%
35%
40%
1970 1975 1980 1985 1990 1995 2000 2005 2010
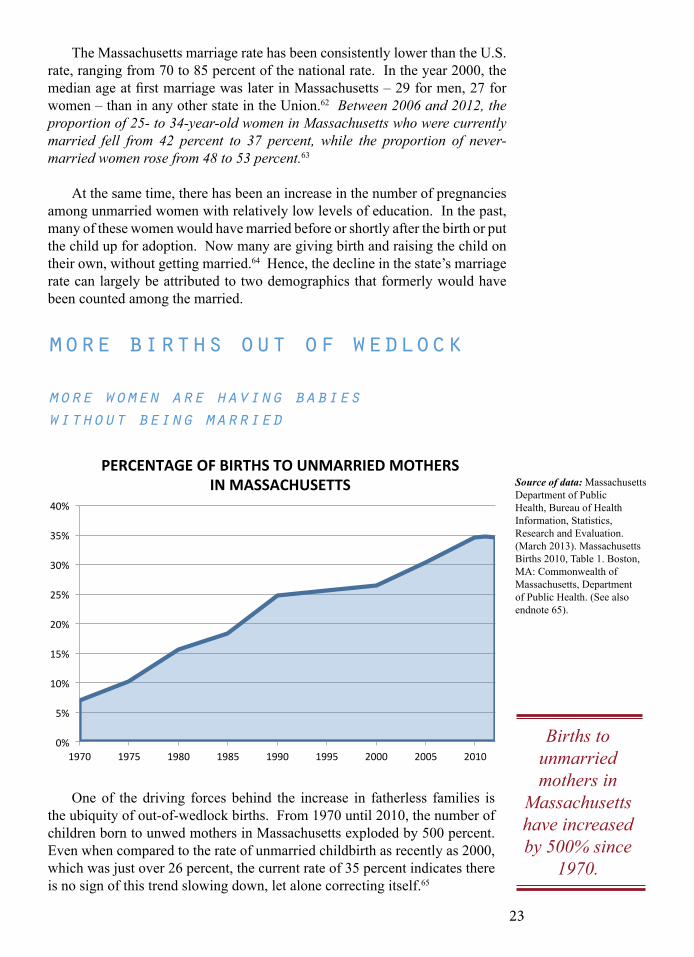
PERCENTAGE OF BIRTHS TO UNMARRIED MOTHERS IN MASSACHUSETTS Source of data: Massachusetts
Department of Public Health, Bureau of Health Information, Statistics, Research and Evaluation. (March 2013). Massachusetts Births 2010, Table 1. Boston, MA: Commonwealth of Massachusetts, Department of Public Health. (See also endnote 65).
Births to unmarried mothers in
Massachusetts have increased by 500% since
1970.
The Massachusetts marriage rate has been consistently lower than the U.S. rate, ranging from 70 to 85 percent of the national rate. In the year 2000, the median age at first marriage was later in Massachusetts – 29 for men, 27 for women – than in any other state in the Union.62 Between 2006 and 2012, the proportion of 25- to 34-year-old women in Massachusetts who were currently married fell from 42 percent to 37 percent, while the proportion of never-married women rose from 48 to 53 percent.63
At the same time, there has been an increase in the number of pregnancies among unmarried women with relatively low levels of education. In the past, many of these women would have married before or shortly after the birth or put the child up for adoption. Now many are giving birth and raising the child on their own, without getting married.64 Hence, the decline in the state’s marriage rate can largely be attributed to two demographics that formerly would have been counted among the married.
more births out of wedlock
more women are having babies without being married
One of the driving forces behind the increase in fatherless families is the ubiquity of out-of-wedlock births. From 1970 until 2010, the number of children born to unwed mothers in Massachusetts exploded by 500 percent. Even when compared to the rate of unmarried childbirth as recently as 2000, which was just over 26 percent, the current rate of 35 percent indicates there is no sign of this trend slowing down, let alone correcting itself.65
24
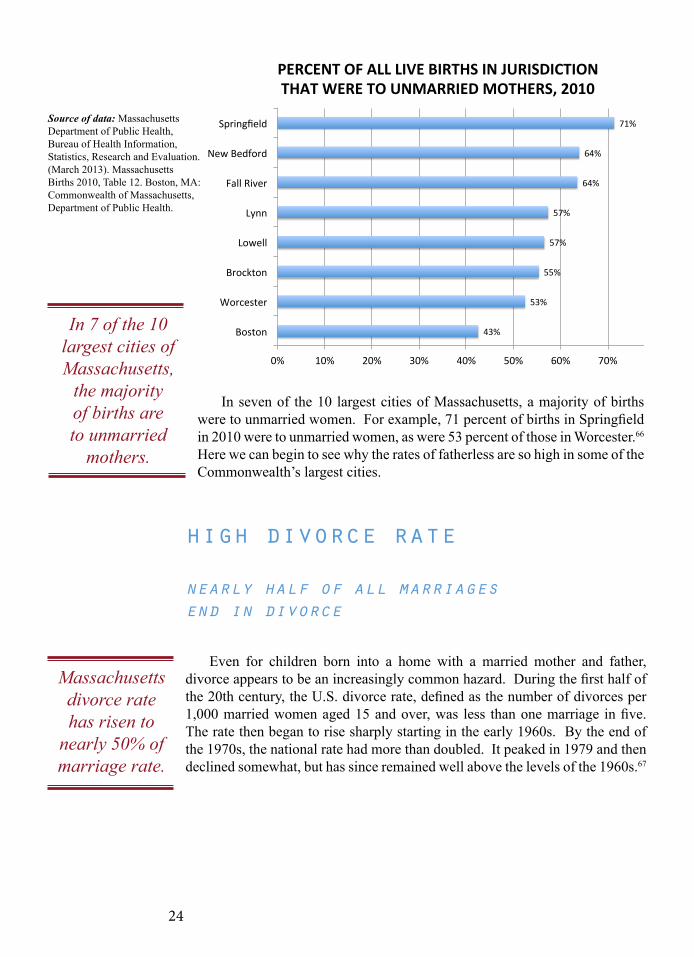
43%
53%
55%
57%
57%
64%
64%
71%
0% 10% 20% 30% 40% 50% 60% 70% 80%
Boston
Worcester
Brockton
Lowell
Lynn
Fall River
New Bedford
Springfield
PERCENT OF ALL LIVE BIRTHS IN JURISDICTION THAT WERE TO UNMARRIED MOTHERS, 2010
In seven of the 10 largest cities of Massachusetts, a majority of births were to unmarried women. For example, 71 percent of births in Springfield in 2010 were to unmarried women, as were 53 percent of those in Worcester.66
Here we can begin to see why the rates of fatherless are so high in some of the Commonwealth’s largest cities.
In 7 of the 10 largest cities of Massachusetts,
the majority of births are to unmarried
mothers.
Source of data: Massachusetts Department of Public Health, Bureau of Health Information, Statistics, Research and Evaluation. (March 2013). Massachusetts Births 2010, Table 12. Boston, MA: Commonwealth of Massachusetts, Department of Public Health.
high divorce rate
nearly half of all marriages end in divorce
Even for children born into a home with a married mother and father, divorce appears to be an increasingly common hazard. During the first half of the 20th century, the U.S. divorce rate, defined as the number of divorces per 1,000 married women aged 15 and over, was less than one marriage in five. The rate then began to rise sharply starting in the early 1960s. By the end of the 1970s, the national rate had more than doubled. It peaked in 1979 and then declined somewhat, but has since remained well above the levels of the 1960s.67
Massachusetts divorce rate has risen to
nearly 50% of marriage rate.
25
0%
10%
20%
30%
40%
50%
60%
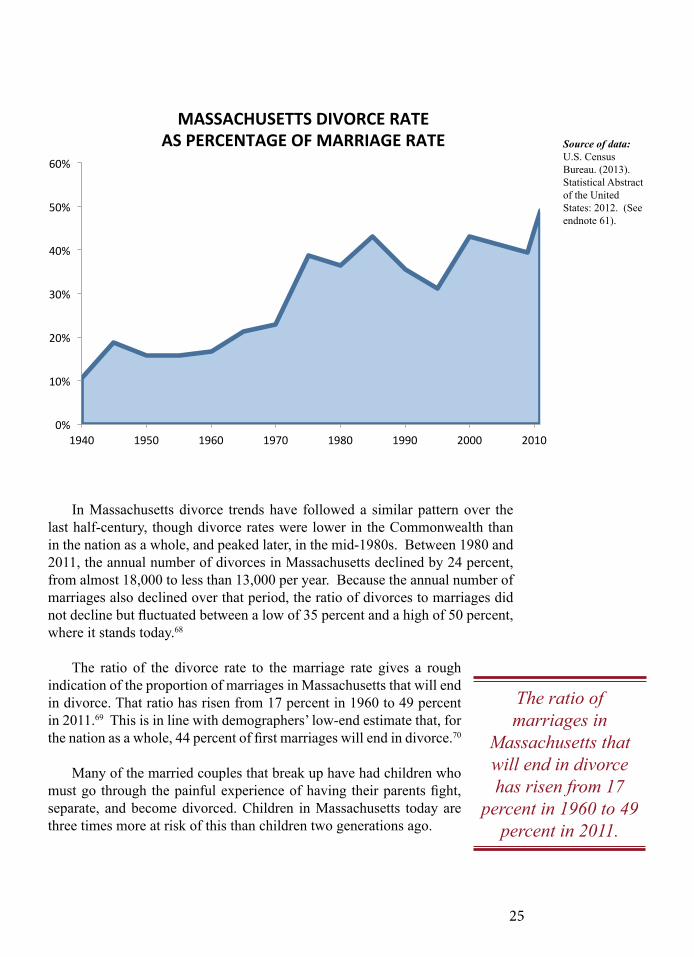
1940 1950 1960 1970 1980 1990 2000 2010
MASSACHUSETTS DIVORCE RATE AS PERCENTAGE OF MARRIAGE RATE Source of data:
U.S. Census Bureau. (2013). Statistical Abstract of the United States: 2012. (See endnote 61).
The ratio of marriages in
Massachusetts that will end in divorce has risen from 17
percent in 1960 to 49 percent in 2011.
In Massachusetts divorce trends have followed a similar pattern over the last half-century, though divorce rates were lower in the Commonwealth than in the nation as a whole, and peaked later, in the mid-1980s. Between 1980 and 2011, the annual number of divorces in Massachusetts declined by 24 percent, from almost 18,000 to less than 13,000 per year. Because the annual number of marriages also declined over that period, the ratio of divorces to marriages did not decline but fluctuated between a low of 35 percent and a high of 50 percent, where it stands today.68
The ratio of the divorce rate to the marriage rate gives a rough
indication of the proportion of marriages in Massachusetts that will end in divorce. That ratio has risen from 17 percent in 1960 to 49 percent in 2011.69 This is in line with demographers’ low-end estimate that, for the nation as a whole, 44 percent of first marriages will end in divorce.70
Many of the married couples that break up have had children who must go through the painful experience of having their parents fight, separate, and become divorced. Children in Massachusetts today are three times more at risk of this than children two generations ago.
26
IV:guiding principles for strengthening traditional families
Two-parent families composed of a man and a woman united by marriage and by a mutual commitment to raising their biological or adopted children are the foundation of a healthy society. No other public or private social institution can compare with the tremendously positive impact that traditional families have upon the society around them. Traditional families produce more productive citizens, lower crime rates, lower rates of child poverty, more stable communities, and less drain on the social welfare system of our Commonwealth.
1. traditional families are our most important social resource
Social science research strongly indicates that children have the best chance of success when they are raised by a mother and a father in an intact family. Although a small minority of traditional families are seriously dysfunctional, the vast majority of traditional families provide the best environment for raising children to become healthy and responsible citizens.
2. children have the best chance of successin a traditional family
4. parents should be the primary care giversand educators in their children’s lives
Parents have the primary responsibility to provide for and protect the physical, emotional, psychological, and intellectual health and well-being of their children. They also have the right not to have that role challenged or usurped unless there is clear and convincing evidence that the physical, emotional or psychological health of the child is in imminent danger.
The social and economic costs of family decline, particularly fatherlessness, are legion. Intergenerational poverty, academic failure, crime and violence plague our children and our communities when the traditional family breaks down. Massachusetts taxpayers then bear an enormous financial burden from attempts, often in vain, to ameliorate this failing through government spending alone.
3. traditional families are vital to thesocial and economic health of Massachusetts
27
5. public policies that strengthen traditionalfamilies strengthen all of society
Social science research strongly indicates that a wide range of social pathologies are directly related to a decline in the percentage of traditional families. For this reason, public policies that strengthen traditional families simultaneously strengthen all of society. Indeed, government has a compelling interest in pursuing public policies that strengthen traditional families because of the social benefits that traditional families provide to our entire society.
In most sectors of the economy, state government agencies are a poor substitute for private enterprise. Similarly, in the vast majority of cases, parents are far better guardians of the health and well-being of their own children than any state government agency. For this reason, public policies that seek to replace parental authority with the impersonal authority of a government agency are harmful both to children and to the social prosperity and well-being of the Commonwealth.
6. state welfare agencies are a poorsubstitute for parents
The state government should do everything within its power to support parents in their social role as primary caregivers for their own children rather than seek to replace them. For example, state agencies should not use a limited delegation of parental authority over children (such as the limited delegation of authority over the education of children during school hours) to usurp parental authority in other areas.
7. the state should seek to support parentsrather than replace them
In the same manner that studies are prepared to evaluate the impact of proposed legislation on private enterprise or the environment, the government should carefully consider the impact that proposed legislation will have upon families. To this end, proposed legislation that may have a significant impact upon families should be accompanied by a “Family Impact Statement” which will explain the direct and indirect effects of the proposed policy on families in Massachusetts.
8. no legislation should be passed withoutconsidering the impact on families
28
V:the need to strengthen traditional families
“The principal social objective of American government at every level should be to see that children are born to intact families and that they remain so.”
– Sen. Daniel Patrick Moynihan, interview on Meet the Press (Sept. 19, 1993).
All sectors of society, including local communities, businesses and religious communities, have a critical role to play in building strong traditional mother-father families in Massachusetts. Nothing in this report is intended to imply that reforms designed to strengthen traditional families must come primarily or exclusively from the public sector. On the contrary, this report is intended in significant part to encourage community leaders, business leaders, opinion leaders, community activists, and religious leaders to pursue reforms that will help to reverse the destructive dynamic of the decline of the traditional family in Massachusetts.
At the same time, in light of the grave social threat posed by the decline
in the percentage of traditional families, there is also an urgent need for a bi-partisan campaign to encourage and strengthen traditional families in Massachusetts. In the war on poverty and the fight against income inequality, there is one strategy that has consistently proven effective – intact families with a married mother and father. The most powerful educational program we can employ is not to give every student the latest smart tablet to take home, it’s working to ensure the home they return to at the end of the school day contains a married mother and father. Keeping criminals off the street is important to ensuring children’s safety, but equally so is bringing fathers back to their children’s home. When children have both a mother and a father working together to support their family, the state doesn’t have to cover those expenses, and we all benefit.
This is common sense, and the social science data backs it up. The
harm caused by fatherlessness and family decline is undeniable and the need to address the root cause is clear. We must work together, across the political and ideological spectrum, to promote the timeless and irreplaceable institution of a married mother and father for the benefit of our children and our Commonwealth.
29
“Family decline will be stemmed only when it is widely understood that care provided by both biological parents is the most powerful social and economic advantage that any child can enjoy.”
– Heather MacDonald, “Encourage Two-Parent Families.” The WallStreet Journal. N.p., 8 July 2014.
In keeping with the principles outlined above, state legislators and government officials should reject public policies that weaken and undermine the critical social institution of the two-parent family. More important, state legislators and government officials should undertake a bi-partisan effort to pursue a wide range of public policies specifically designed to protect and strengthen traditional families.
As part of this effort, state legislators and government officials should
consider action in the following public policy areas:
• Fatherhood Initiatives: Campaigns to alert the public as well as business, community and religious leaders to the urgent need to actively address the social crisis of father absence and the decline of the traditional family.
• Tax Relief for Families: Reforms to reduce the heavy tax burden on families so that a more reasonable share of family economic resources is available to parents raising children.
• Welfare Reform: Reforms to help encourage marriage among those receiving public assistance.
• Gambling Reform: Public policies that will protect both adults and children from the destructive impact of compulsive gambling behavior upon families.
• Parental Rights: Legislation to recognize and strengthen the unique role of mothers and fathers, particularly in the education and healthcare decisions for their children.
public policy
30
Conclusion
The health of the traditional family is critical to the health of American society. That’s a bold claim, we know. And any report that takes a strong stance on an issue like this is vulnerable to criticism. So we want to be clear about two points:
• No simple solutions exist for the pressing social issues of our day – rising income inequality, disparity of educational opportunity, youth violence, and access to health care.
• Single-mothers, as President Obama said, “are doing a heroic job, often under trying circumstances. ... But they shouldn’t have to do it alone.”
It should surprise no one that an organization called Massachusetts Family Institute would publish a report promoting the benefits of the traditional family – mother, father and children living in the same home. Of course, we would hope that married people who read this report will be encouraged by the findings affirming that their commitment to their marriage is of great benefit to their children and a common good for our society as a whole.
But there is a negative message in this report as well: Children who grow up in single-parent homes are at a decided disadvantage in every critical area of their lives. They are much more likely to be poor, have problems in school, commit crime, be exposed to violence, and have difficulty accessing good healthcare.
Publicizing the disadvantages of single parenthood does not mean condemning or demonizing women or men who are already single parents. Rather, it means pointing out the risks and burdens involved in lone parenthood to young women and men who are not yet parents. It means making them aware that there are choices they can make – such as to complete their educations, find jobs, and get married before they start families – that will dramatically lower the odds that their children will grow up in poverty.
We believe these facts need to be disseminated widely, confidently, and repeatedly.
31
Endnotes1. Bennett, William. “Stronger Families, Stronger Societies.” Editorial. New York Times. N.p., 24 Apr. 2012. Web. 29 Sept. 2014.
2. President Barrack Obama , The White House Blog, “President Obama Promotes Responsible Fatherhood: ‘No Excuses,’” Whitehouse.gov. N.p., 21 June 2010. Web. 29 Sept. 2014.
3. U.S. Department of Health and Human Services, National Center for Health Statistics, “Births to Unmarried Mothers: United States 1980-92,” and assorted National Monthly Vital Statistics Reports.
4. National Vital Statistics Reports, Vol. 63, No. 2, p. 4, May 29, 2014.
5. U.S. Bureau of the Census, American Community Survey (ACS), 2013. Table S0901. Characteristics of Children. Accessed via the American FactFinder website: http://factfinder2.census.gov.
6. U.S. Bureau of the Census. Census of the Population 1960, 1970, U.S. Department of Commerce.
7. Advance Data Births 1999, Bureau of Health Statistics, Research and Evaluations, Bureau of Family and Community Health, MA Department of Health.
8. Massachusetts Department of Public Health, Bureau of Health Information, Statistics, Research and Evaluation. (August 2014). Massachusetts Births 2011 and 2012. Table 1. Boston, MA: Commonwealth of Massachusetts, Department of Public Health.
9. U.S. Bureau of the Census. Census of the Population 1960, 1970, U.S. Department of Commerce.
10. U.S. Bureau of the Census, American Community Survey (ACS), 2012. Table S0901. Characteristics of Children in Massachusetts. Accessed via the American FactFinder website: http://factfinder2.census.gov.
11. U.S. Bureau of the Census, American Community Survey (ACS), 2013. Table S0901. Characteristics of Children. Accessed via the American FactFinder website: http://factfinder2.census.gov.
12. U.S. Bureau of the Census, American Community Survey (ACS), 2008-2012. Table S0901. Characteristics of Children in Massachusetts and Its 10 Largest Cities. Accessed via the American FactFinder website: http://factfinder2.census.gov.
13. U.S. Bureau of the Census, American Community Survey (ACS), 2008-2010. Percentage of teens aged 15-17 who lived with both married biological parents throughout childhood calculated for each Super PUMA in Massachusetts from ACS public use microdata file by Nicholas Zill and Philip Fletcher, 2012.
14. Massachusetts Family Institute. (2001). The Crisis of Family Decline in Massachusetts. 2001 Annual Report on Massachusetts Families. Newton Upper Falls, MA. www.mafamily.org.
15. U.S. Bureau of the Census, American Community Survey (ACS), 2013. Table S0901. Characteristics of Children. Accessed via the American FactFinder website: http://factfinder2.census.gov.
16. Ibid.
17. National Survey of Children’s Health (NSCH), public use microdata files from 2011-2012 surveys. Analyzed by Nicholas Zill, May 2014
18. Ibid.
19. U.S. Census Bureau website: https://www.census.gov/hhes/www/poverty/data/threshld/
20. NSCH 2011-2012, op. cit.
21. ACS 2013, op. cit. Table S0901 for Massachusetts. Characteristics of Children.
22. U.S. Bureau of the Census. (November 2013). Current Population Survey (CPS), 2013 Annual Social and Economic Supplement. Table C3. Living Arrangements of Children Under 18 Years and Marital Status of Parents, by Age, Sex, Race, and Hispanic Origin and Selected Characteristics of the Child for All Children: 2013.
23. ACS 2008-2012, op. cit. Table S0901. Characteristics of Children in Massachusetts and Its 10 Largest Cities.
24. Nicholas Zill & Christine W. Nord. (1994). Running in Place: How American Families are Faring in a Changing Economy and an Individualistic Society. Washington, DC: Child Trends.
25. NSCH 2011-2012, 0p. cit.
26. Ibid.
27. U.S. Bureau of the Census. (November 2013). Current Population Survey, 2013 Annual Social and Economic Supplement. Table C3. Living Arrangements of Children Under 18 Years and Marital Status of Parents, by Age, Sex, Race, and Hispanic Origin and Selected Characteristics of the Child for All Children: 2013.
32
28. U.S. Bureau of the Census. ( 2014). Current Population Survey, April 2012. Custodial Mothers and Fathers and Their Child Support: 2011. Series P60-246 Detailed Tables.
29. The five studies made use of data from the National Longitudinal Study of Youth (NLSY) conducted by the Bureau of Labor Statistics, the Panel Study of Income Dynamics (PSID), the High School and Beyond Study (HSB) conducted by the National Center for Education Statistics, and two cohorts of the National Survey of Families and Households. See McLanahan, Sara. “Father Absence and the Welfare of Children.” MacArthur Research Network on The Family and The Economy Working Paper. http://apps.olin.wustl.edu/macarthur/working%20papers/wp-mclanahan2.htm (1999), Figure 1 for further details about these studies and analytic findings reported here. Also, Nan Astone & Sara McLanahan. (1991). “Family structure, parental practices, and high school completion,” American Sociological Review, Vol. 56: Pp. 309-320, & (1994). “Family structure, residential mobility and school dropout: A research note,” Demography, 31(4): Pp. 575-584. Nicholas Zill, “Family Change and Student Achievement: What We Have Learned, What It Means for Schools,” in Family-School Links: How Do They Affect Educational Outcomes, eds. Alan Booth and Judith F. Dunn (Mahwah, N.J.: Lawrence Erlbaum, 1996): pp. 139-184.
30. Zill (1996), op. cit., pp. 139-184.
31. NSCH 2011-2012, op. cit.
32. Massachusetts Department of Elementary and Secondary Education, 2013 Graduation Report (DISTRICT) for All Students, Four-Year Graduation Rate. http://profiles.doe.mass.edu/state_report/gradrates.aspx
33. Ibid.
34. Zill & Nord (1994), op. cit., pp. 44-54, Tables III-1, III-2, & III-3, pp. 99-101. Zill (1996). op. cit.
35. Zill (1996), op cit., Tables III-1, III-2, & III-3, pp. 99-101.
36. NSCH 2011-2012, op. cit. Also, Zill (1996), op. cit., Figure 10.3.
37. Zill & Nord (1994), op. cit., Table III-6. Also, Zill (1996), op. cit., Figure 10.3.
38. McLanahan, Sara. “Father Absence and the Welfare of Children.” MacArthur Research Network on The Family and The Economy Working Paper. http://apps.olin.wustl.edu/macarthur/working%20papers/wp-mclanahan2.htm (1999), Figure 2. Also, Wilcox, Bradford W., “The Difference Fathers Make for College Graduation,” Institute for Family Studies Newsletter, April 23, 2014.
39. U.S. Bureau of Labor Statistics. (2014). Employment Projections: Earnings and Unemployment Rates by Educational Attainment, updated March 24, 2014. Accessed via website: www.bls.gov/EMP.
40. Ibid.; ACS 2013, op. cit., Table S0901 for Massachusetts. Characteristics of Children.
41. C. J. Mumola. & J. C. Karberg (2006, revised 2007). Drug Use and Dependence, State and Federal Prisoners, 2004. BJS Special Report NCJ 213530, Washington, DC: U.S. Department of Justice. Also, Bureau of Justice Statistics (1994a). Women in Prison (Special Report NCJ-145321). Washington, DC: U.S. Department of Justice. (1994b). Sourcebook of Criminal Justice Statistics 1993. Washington, DC: U.S. Department of Justice.
42. Ibid.
43. Cynthia C. Harper & Sara S. McLanahan, “Father Absence and Youth Incarceration,” Journal of Research on Adolescence, Vol. 14, No. 3, (2004), pp. 369-397.
44. Ibid.
45. NSCH 2011-2012, op. cit. Also, Matthew Bramlett & Laura Radel. (2014). Adverse Family Experiences among Children in Non-parental Care, 2011–2012. National Health Statistics Reports No. 74.
46. Jennifer L. Truman & Erica L. Smith. (2012). Prevalence of Violent Crime among Households with Children, 1993-2010. Bureau of Justice Statistics Special Report NCJ 238799, September 2012.
47. NSCH 2011-2012, op. cit.
48. McLanahan (1999), op. cit., Figure 4. Also, Sara McLanahan, “Family structure and the reproduction of poverty,” American Journal of Sociology, Vol. 90 (January, 1985), Pp. 873-901; & “Family Structure and Dependency: Early Transitions to Female Household Headship,” Demography, (February, 1988) Vol. 25 , Pp. 1-16.
49. McLanahan (1999), op. cit., Table 1.
50. Massachusetts Department of Public Health, Bureau of Health Information, Statistics, Research and Evaluation. (March 2013). Massachusetts Births 2010, Table 7. Boston, MA: Commonwealth of Massachusetts, Department of Public Health.
51. Scafaldi, Benjamin, ed. The Taxpayer Costs of Divorce and Unwed Childbearing, Institute for American Values, 2008, p. 5
52. Ibid., Table A.5, p. 38.
33
53. NSCH 2011-2012, op. cit.
54. Calculated from food stamp/SNAP participation information available in 2013 American Community Survey, Massachusetts state file, and state-level payment information available at: http://www.fns.usda.gov/snap/eligibility and http://www.fns.usda.gov/pd/supplemental-nutrition-assistance-program-snap
55. NSCH 2011-2012, op. cit.
56. Calculated from Medicaid participation information available in 2011-2012 National Survey of Children’s Health, Massachusetts state file, and state-level Medicaid payment information available at: http://kff.org/medicaid/state-indicator/medicaid-payments-per-enrollee/
57. ACS 2008-2012, op. cit., Table S0901. Characteristics of Children in Massachusetts and Its 10 Largest Cities.
58. Scafaldi, op. cit., Table A.5, p. 38.
59. Ibid.
60. Larry Bumpass. (1990). “What’s Happening to the Family?” Demography, 27(4), pp. 483-498. Larry Bumpass & James Sweet. (1989). “Children’s Experience in Single Parent Families: Implications of Cohabitation and Marital Transitions.” Family Planning Perspectives, Vol. 21, Pp. 256-260. Andrew J. Cherlin. (1981, 1992). Marriage, divorce, remarriage (revised and enlarged edition); (2009). The Marriage-go-round: The State of Marriage and the Family in America Today; Diana B. Elliott, Kristy Krivickas, Matthew W. Brault, Rose M. Kreider. (2012). Historical marriage trends from 1890-2010. U.S. Bureau of the Census SEHSD Working Paper Number 2012-12; Sara McLanahan. (2004). Diverging destinies (op. cit.). David Popenoe. (1988). Disturbing the nest: Family Change and Decline in Modern Societies. Nicholas Zill & Christine W. Nord. (1994). Running in place: How American families are faring in a changing economy and an individualistic society.
61. U.S. Census Bureau. (2013). Statistical Abstract of the United States: 2012. Table 133. Marriages and divorces: Number and rate by state: 1990 to 2009. Washington, DC: U.S. Department of Commerce. U. S. Centers for Disease Control and Prevention, National Center for Health Statistics, National Vital Statistics System. (2013). Marriage rates by State: 1990, 1995, and 1999-2011. Accessed via CDC website: www.cdc.gov. U. S. Centers for Disease Control and Prevention, National Center for Health Statistics, National Vital Statistics System. (1981). Annual Summary of Births, Deaths, Marriages, and Divorces: United States, 1980. Monthly Vital Statistics Report, Volume 29, Number 13. September 17, 1981.
62. Tavia Simmons & Jane Lawler Dye. (2004). “What Has Happened to Median Age at First Marriage Data?” Presentation at Annual Meeting of American Sociological Association, San Francisco, CA: August 14-17. Population Division, U.S. Census Bureau. Accessed via Census Bureau website: www.census.gov.
63. U.S. Bureau of the Census, American Community Survey, 2008, 2012. Table B12002. Sex by Marital Status for Massachusetts, 2006-2008 & 2010-2012. Accessed via the American FactFinder website: http://factfinder2.census.gov.
64. Bumpass (1990), op. cit.; Bumpass & Sweet (1989), op. cit.; Cherlin (1981, 1992), op. cit.; Elliott, Krivickas, Brault, & Kreider (2012), op. cit. U.S. Bureau of the Census SEHSD Working Paper Number 2012-12; McLanahan. (2004), op. cit.; Popenoe (1988), op. cit. Zill & Nord (1994), op. cit.
65. Advance Data Births 1999, Bureau of Health Statistics, Research and Evaluations, Bureau of Family and Community Health, MA Department of Health.; Massachusetts Births 2010, op. cit., Table 1.
66. Ibid., Table 12.
67. Cherlin (1981, 1992), op. cit., pp. 20-27.; Zill & Nord (1994), op. cit.. pp. 6-8.; Bumpass (1990), op. cit., pp. 483-498.
68. U.S. Census Bureau. (2013). Statistical Abstract of the United States: 2012. Table 133. Marriages and divorces: Number and rate by state: 1990 to 2009. Washington, DC: U.S. Department of Commerce. U. S. Department of Health, Education, & Welfare, Public Health Service. (1978). Vital Statistics of the United States: 1975. Vol. III – Marriage and Divorce. Hyattsville, MD: National Center for Health Statistics. U. S. Department of Health, Education, & Welfare, Public Health Service. (1968a). Vital Statistics of the United States: 1965. Vol. III – Marriage and Divorce. Washington, DC: National Center for Health Statistics. U. S. Department of Health, Education, & Welfare, Public Health Service. (1968b). Vital Statistics Rates in the United States: 1940-1960. By Robert D. Grove & Alice M. Hetzel. Washington, DC: National Center for Health Statistics. U. S. Centers for Disease Control and Prevention, National Center for Health Statistics, National Vital Statistics System. (2013). Divorce rates by State: 1990, 1995, and 1999-2011. Accessed via CDC website: www.cdc.gov.
69. Divorce ratio trend for Massachusetts calculated by Nicholas Zill from above sources, May 2014.
70. Cherlin (1981, 1992), op cit., pp. 24

100 Trade Center, Suite 625Woburn, MA 01801
(781) 569-0400 (Phone)(781) 569-0472 (Fax)
[email protected] (e-mail)www.mafamily.org (Web Site)