Embed Size (px)
Citation preview

Fatigue and Failure Testing of Elastomers for AnalysisBy Kurt Miller, Axel Products, Inc.
Introduction
Elastomeric materials in engineering applications experience complicated strains and stresses. They are expected to carry loads, dissipate energy, and seal gaps. Sometimes they fail and that, too, is complicated.
Mechanical fatigue and failure in elastomers is about starting and growing cracks. Some stresses in a part can cause a crack to grow; depending on the direction of a stress, it might actually close the crack and not cause it to grow.
However, mechanical failure in elastomers is nearly always a crack growing event. Even in a simple tension test, at some point while stretching the elastomer, a tiny flaw somewhere in the specimen reaches a critical energy and rips across the specimen until it breaks into 2 separate pieces. The crack could be an unintentional defect or inherent to the material morphology.
To predict mechanical failure and fatigue in elastomeric parts, one may study how cracks start and grow in elastomeric materials under various loadings and temperatures. We look at the stress needed to rupture a specimen, the stress needed to start and existing crack growing, the energy needed to grow cracks during cycling, the energy needed to resist cutting, the time needed to grow cracks under constant stress, and the number of cycles needed to initiate crack growth.Temperature matters. Testing at room temperature does not often predict behavior away from room temperature. Elastomers in service can generate high internal temperatures due to low conductive properties and/or high dissipative properties.
This document reviews some of the experiments used at Axel Products to investigate the fatigue and failure of elastomers for material selection, comparison, and analysis.
Figure 1, Dynamic fatigue test system used to measure crack growth in elastomers.
Axel Products, Inc. www.axelproducts.com
Testing and Analysis

Tensile Test to Failure
One would reasonably expect a tensile test to provide very useful failure information, but while the failure data is useful, it may not be sufficient. Two different elastomers may exhibit the same strain value at failure in a tensile test yet in the presence of a tiny sharp cut, one material may fail at a strain one-tenth of the other. Some elastomers are very durable in the presence of cuts and some are not.
For some elastomers, failure strain results show a large variability between tensile test repetitions. Some feel this is related to the statistical variability in crack initiation sites within a material specimen.
Tear Strength
Since the dominant mechanism of mechanical failure in elastomers is the growth of cracks, it makes sense to subject a material to the worst-case direction of crack growing and simply pull open an existing cut. This is the tear strength, or tearing energy, test. Unlike some of the ISO and ASTM tests that are similar, this experiment is best performed by adding a very sharp cut into a material and pulling in a Mode I direction. The stress, strain, and energy at which the crack grows provide very useful design limits for engineering design and analysis. From this experiment, a critical tearing energy, Tc, may be calculated.
In this experiment, a cut is made in a planar tension test specimen and stretched until the crack grows. This experiment is often performed at multiple temperatures.
aB
H
U
Force, F
Deflection, dH
Tc = HU/((B-a)t)
a = crack lengthH = specimen heightU = area under the force deflection curveB = specimen widtht = specimen thickness
Figure 6, Tear strength specimen and strain-stress data.
Break Point
Stre
ss
StrainFigure 4, Tensile test to failure stress-strain result.
Figure 5, A planar tension specimen with a pre-test cut and laser tags for strain measurement.
Figure 3, A failed tensile specimen.
Figure 2, Tensile tester with laser strain measuring stretching a tensile specimen to failure.
2Axel Products, Inc. www.axelproducts.com

Fatigue Experiments
In plastics and metals, basic strain-life (s-n) curves are often used effectively to predict part fatigue. "S-N" curves are generated by cycling tensile specimens to failure. This approach isn't as straightforward for elastomers for several reason:
1. Elastomers are typically used at large strains and they generate viscoelastic heat during straining. As such, to avoid significantly changing the temperature of the test specimen during testing, elastomeric cyclic tests are typically run at 1 Hz or slower. This makes each test take a long time and time on test instruments is costly.
2. "S-N" tests inherently exhibit high scatter due to the variation in the material's initial crack size. The variation for some materials can be very frustrating and requires more replicates to overcome.
3. Each experiment, which can take days or weeks, is only one point on an "s-n" curve.
4. Some elastomers exhibit an effect called "strain crystallizing." This effect makes the material very minimum-strain sensitive. An elastomer that fully unloads to zero strain during cycling will fail much faster than when the minimum strain is not unloaded to zero strain. This effect, which can be very significant in some materials, is typically not captured with "s-n" data sets.
5. It isn't enough to focus on maximum stresses to find failure locations; the critical question with elastomers is, "Will this stress in this direction open a crack?"
In summary, generating elastomeric strain-life fatigue data sets is very time consuming and can be very frustrating.
Fatigue Crack Growth Experiments
The purpose of the fatigue crack growth experiment is to measure the rate at which a pre-cut crack grows during cyclic loading. The main idea here is that if we know the starting crack size and we know how fast cracks grow, we can predict part failure.
There are many ways to design a crack growth experiment and at Axel Products we perform them under many conditions. For simplicity, a common approach is described herein. A pure shear (planar tension_ test specimen is selected because the strain state at the crack tip stays the same as the crack `grows and the calculation of crack tip energy is simple.
A cut is placed in the specimen far from the edge to avoid edge effects. The specimen is stretched in a loading-unloading pattern such that the minimum strain is zero and the maximum strain slowly increases over 20 hours. Throughout the entire duration of the experiment, the width of the crack is measured. Figure 8, A typical fatigue crack growth test specimen description.
Figure 7, Fatigue crack growth test specimen during testing.
3Axel Products, Inc. www.axelproducts.com
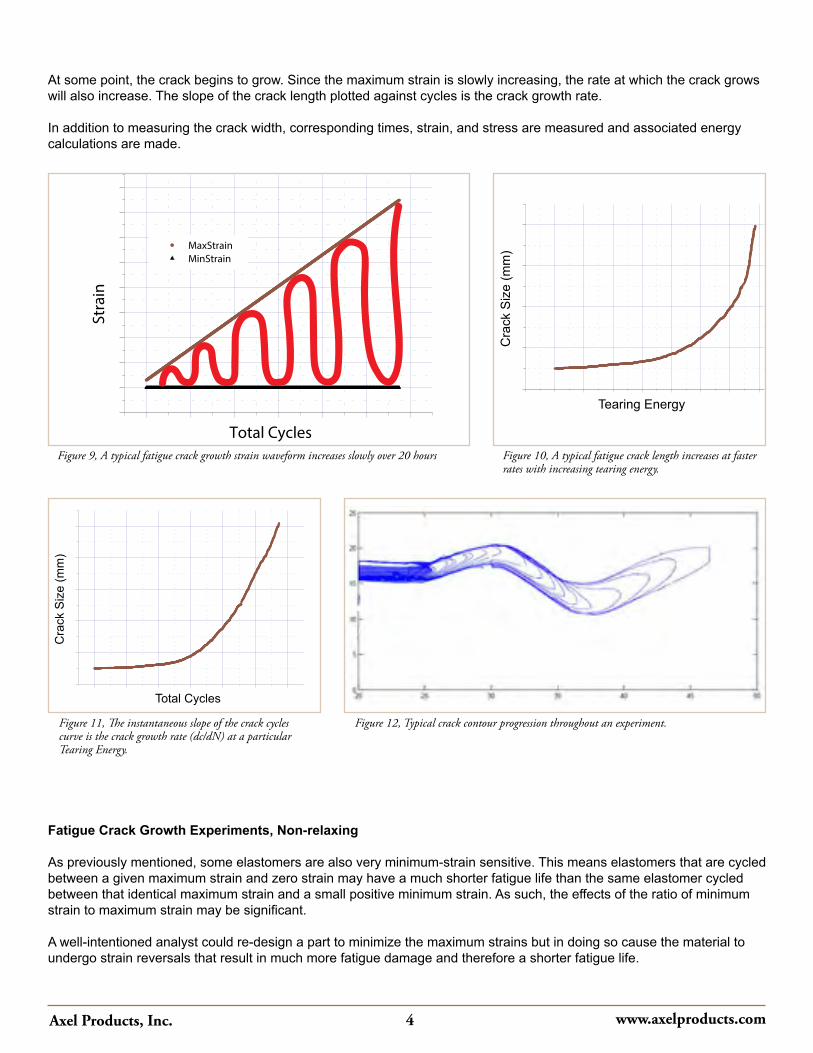
At some point, the crack begins to grow. Since the maximum strain is slowly increasing, the rate at which the crack grows will also increase. The slope of the crack length plotted against cycles is the crack growth rate.
In addition to measuring the crack width, corresponding times, strain, and stress are measured and associated energy calculations are made.
Fatigue Crack Growth Experiments, Non-relaxing
As previously mentioned, some elastomers are also very minimum-strain sensitive. This means elastomers that are cycled between a given maximum strain and zero strain may have a much shorter fatigue life than the same elastomer cycled between that identical maximum strain and a small positive minimum strain. As such, the effects of the ratio of minimum strain to maximum strain may be significant.
A well-intentioned analyst could re-design a part to minimize the maximum strains but in doing so cause the material to undergo strain reversals that result in much more fatigue damage and therefore a shorter fatigue life.
Figure 12, Typical crack contour progression throughout an experiment.
Cra
ck S
ize
(mm
)
Tearing Energy
Figure 10, A typical fatigue crack length increases at faster rates with increasing tearing energy.
Cra
ck S
ize
(mm
)
Total Cycles
Figure 11, The instantaneous slope of the crack cycles curve is the crack growth rate (dc/dN) at a particular Tearing Energy.
MaxStrain MinStrain
Stra
in
Total CyclesFigure 9, A typical fatigue crack growth strain waveform increases slowly over 20 hours
4Axel Products, Inc. www.axelproducts.com

Crack growth experiments can be designed to capture this effect. These tests are referred to as "non-relaxing" in the elastomer fatigue community. The basic idea is to increase the maximum strain during cycling to a set maximum strain or crack growth rate, hold at this rate for a short time, and finally increase the minimum strain until the crack growth decreases to zero. This sequence is typically repeated at 3 different crack growth rates.
Fatigue Crack Growth, Wave-shapes, and Frequency
Fatigue crack growth rates are somewhat sensitive to the type of loading. A sine wave input may have a slightly different result than a pulse-dwell wave-shape. Some experienced analysts use very specific wave-shapes. For example, tire manufacturers might use a dwell pulse timed similarly to the loading of a tire patch strain history on a highway. Machine mount manufacturers may prefer a low frequency sine wave.
Figure 14, Typical Haigh Diagram shows crack growth rate (colors) as a function of mean strain and amplitude.
Minimum Strain
Maximum Strain Cr
ack
Size
Total Cycles
Str
ain
Figure 13, Fatigue cracks grow faster with increased maximum strains but sometimes stop growing with increased minimum strains.
Stra
in
Time
Figure 15, Pulse waveforms and constant strain rate waveforms are sometimes used during crack growth experiments.
5Axel Products, Inc. www.axelproducts.com

Creep Crack Growth Experiments
When a load is carried over a long period, a crack in an elastomeric material may grow, even if the load is smaller than the static tearing strength (Tc) and even in the absence of dynamic cycles. The rate of crack growth under these circumstances is governed by the instantaneous value of the energy release rate. The growth of a pre-cut crack in an elastomer specimen is observed under a constant or very slowly increasing strain. The creep crack growth may occur at smaller stresses and strains than expected. Valuable information may be obtained in experiments lasting less than a day.
Cutting Resistance Experiments
Cutting resistance is measured by applying a sharp blade against pre-strained elastomer specimens while observing the force required to cut. The cutting resistance forces can be used directly to evaluate materials. The resulting data may also be used as part of an intrinsic energy calculation. The experiment is a modern version of the experiment performed by G. J. Lake and O. H. Yeoh referenced in the International Journal of
Figure 17, A sharp blade entering the pre-cut region of a typical specimen.
Figure 16, Crack contour progression during a creep experiment.
Pre-Cycle
Pre-Cut
Stretch-HoldMeasure Cut Resistance
Force 1
Stretch-HoldMeasure Cut Resistance
Force 2
Stretch-HoldMeasure Cut Resistance
Force 3
Figure 18, The steps performed in a cutting resistance experiment.
6Axel Products, Inc. www.axelproducts.com

Fracture 14, 509 (1978). The experiment was rediscovered by Will Mars of Endurica in recent years.
Crack Nucleation Experiments
Large strain cyclic tests are run, typically at 2 strain levels, until failure. These data points are combined with the fatigue crack growth rate curves to determine what the initial crack size must be to create that failure estimate.
Figure 20, Cyclic tensile fatigue data used with fatigue crack growth data to back out initial crack size.
-200 0 200 400 600 800 1000 1200 1400 1600
0.0
0.5
1.0
1.5
2.0 at 5% Axial Strain
at 15% Axial Strain
at 10% Axial Strain
Cut
ting
Res
ista
nce
(N)
Time (seconds)Figure 19, Data showing cutting resistance forces at 3 pre-strain levels.
Figure 21, Typical failed cyclic fatigue tensile specimen.
7Axel Products, Inc. www.axelproducts.com
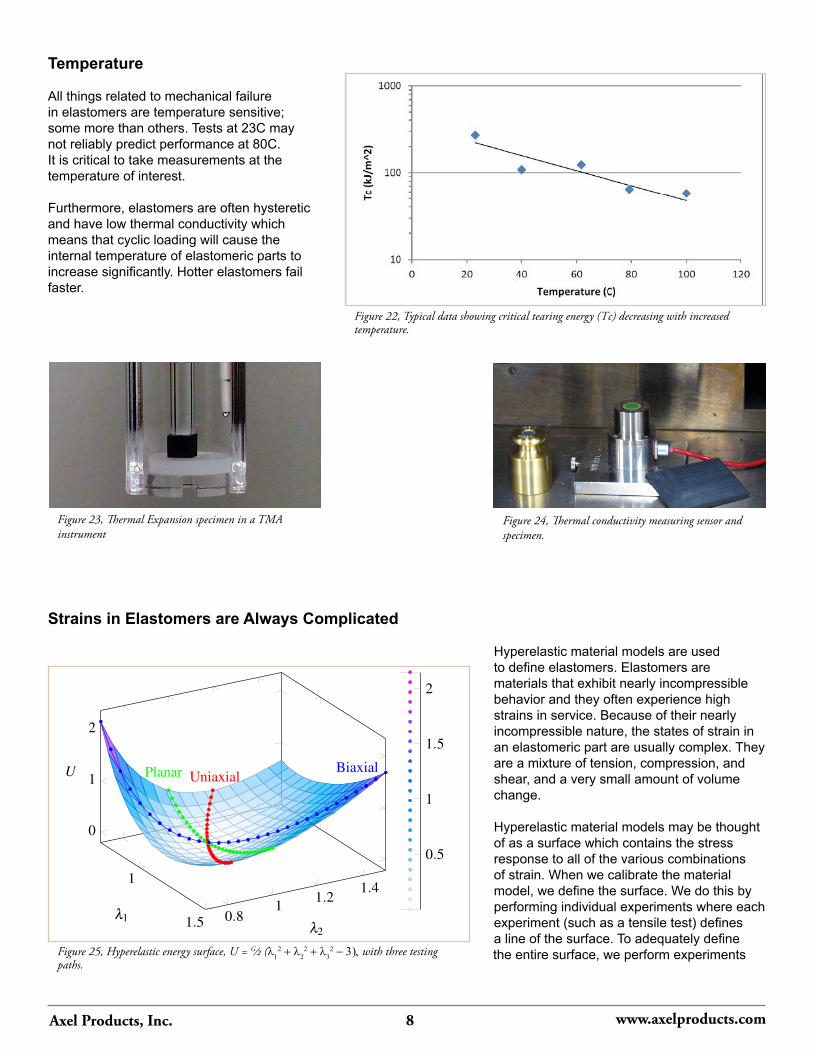
Temperature
All things related to mechanical failure in elastomers are temperature sensitive; some more than others. Tests at 23C may not reliably predict performance at 80C. It is critical to take measurements at the temperature of interest.
Furthermore, elastomers are often hysteretic and have low thermal conductivity which means that cyclic loading will cause the internal temperature of elastomeric parts to increase significantly. Hotter elastomers fail faster.
Strains in Elastomers are Always Complicated
Hyperelastic material models are used to define elastomers. Elastomers are materials that exhibit nearly incompressible behavior and they often experience high strains in service. Because of their nearly incompressible nature, the states of strain in an elastomeric part are usually complex. They are a mixture of tension, compression, and shear, and a very small amount of volume change.
Hyperelastic material models may be thought of as a surface which contains the stress response to all of the various combinations of strain. When we calibrate the material model, we define the surface. We do this by performing individual experiments where each experiment (such as a tensile test) defines a line of the surface. To adequately define the entire surface, we perform experiments Figure 25, Hyperelastic energy surface, U = G/2 (l1
2 + l22 + l3
2 - 3), with three testing paths.
1
1.5 0.81 1.2
1.4
0
1
2
UniaxialPlanar Biaxial
λ1λ2
U
0.5
1
1.5
2
Figure 1: Hyperelastic energy surface, U = G2 (λ 2
1 + λ 22 + λ 2
3 − 3),with three testing paths.
1
Figure 24, Thermal conductivity measuring sensor and specimen.
Figure 23, Thermal Expansion specimen in a TMA instrument
Figure 22, Typical data showing critical tearing energy (Tc) decreasing with increased temperature.
8Axel Products, Inc. www.axelproducts.com

in several strain states so as to crisscross the surface and force it to represent the actual material.
The experiments used to calibrate the material model must put the material in a known state of strain so that we know exactly what the test data represents. A tension specimen must be long so that it is only in tension and there are no lateral constrains on it. A compression test would seem like a good experiment because it is simple and elastomers are often used in compression. However, since even tiny amounts of friction between the test specimen and the contacting platen cause significant shearing strains in the material, the overall strain state becomes unknown, making the compression test less desirable.
The nearly incompressible behavior of elastomers is such that the Poisson's ratio is nearly 0.5. If an elastomer is constrained in service, exactly how close to 0.5 is it may be critical to predicting stresses.
Since we cannot measure Poisson's ratio in the lab with sufficient precision to extract this information, we perform a confined compression experiment to directly measure the bulk modulus.
Good failure analysis starts with good stress and strain analysis.
Figure 27, Complex stress condition in a simple O-ring.
Removable Base to Extract Specimen
Specimen
PlungerDirectlyMeasure
Figure 26, Clockwise from top left: Simple Tension, Volumetric Compression, Planar Tension, and Biaxial Extension experiments.
9Axel Products, Inc. www.axelproducts.com

Fatigue Analysis Software
Orientation of stresses relative to crack surfaces needs to be part of the fatigue calculation. This is sometimes referred to as critical plane analysis. Keep in mind that the stress field in elastomeric parts is very complex. It isn't obvious where bad things may happen.
Critical Plane Analysis
Critical plane analysis enables accurate calculation of the effects of multiaxial loading on fatigue performance. The analysis considers how a series of potential microcracks will experience the 6 components of the stress tensor. Each potential microcrack is identified by its unit normal vector, and the set of all unit normals is represented as a sphere colored according to the life computed for each normal. The shortest life among all the normals (colored red in the Figure 28) is reported as the fatigue life and its location on the sphere shows the plane on which cracks first initiate. Figure 28, Fatigue life as a function of direction.
Axel Products, Inc.2255 S Industrial Ann Arbor MI 48104Tel: 734 994 8308Fax: 734 994 [email protected]
For more information, visit www.axelproducts.com.
Axel Products provides physical testing services for engineers and analysts. The focus is on the characterization of nonlinear materials such as elastomers and plastics.