Embed Size (px)
Citation preview

Accepted Manuscript
Fatigue and Fracture of A 316 Stainless Steel Metal Matrix Composite Rein‐
forced with 25% Titanium Diboride
D.H. Bacon, L. Edwards, J.E. Moffatt, M.E. Fitzpatrick
PII: S0142-1123(12)00280-0
DOI: http://dx.doi.org/10.1016/j.ijfatigue.2012.09.016
Reference: JIJF 2977
To appear in: International Journal of Fatigue
Received Date: 22 March 2012
Revised Date: 11 September 2012
Accepted Date: 12 September 2012
Please cite this article as: Bacon, D.H., Edwards, L., Moffatt, J.E., Fitzpatrick, M.E., Fatigue and Fracture of A 316
Stainless Steel Metal Matrix Composite Reinforced with 25% Titanium Diboride, International Journal of Fatigue
(2012), doi: http://dx.doi.org/10.1016/j.ijfatigue.2012.09.016
This is a PDF file of an unedited manuscript that has been accepted for publication. As a service to our customers
we are providing this early version of the manuscript. The manuscript will undergo copyediting, typesetting, and
review of the resulting proof before it is published in its final form. Please note that during the production process
errors may be discovered which could affect the content, and all legal disclaimers that apply to the journal pertain.

FATIGUE AND FRACTURE OF A 316 STAINLESS STEEL METAL MATRIX COMPOSITE REINFORCED WITH 25% TITANIUM DIBORIDE
D. H. Bacon1, L. Edwards1,2, J. E. Moffatt1, M. E. Fitzpatrick1,*
1Materials Engineering, The Open University, Walton Hall, Milton Keynes MK7 6AA,
UK
1Now at: Australian Nuclear Science & Technology Organisation, Locked Bag 2001,
Kirrawee, Sydney, NSW 2234, Australia.
*Corresponding author, [email protected]; Tel: +44 1908 653100
ABSTRACT
Fatigue and fracture mechanisms have been studied in a steel-based metal matrix composite (MMC), comprising a 316L austenitic matrix reinforced with 25 wt% particulate titanium diboride (TiB2). The fracture toughness was determined in the as-HIPped condition as being slightly below 30 MPa√m. Fatigue crack growth rates have been determined, and corrected for the effects of crack closure. The fracture surfaces have been studied to determine the mechanisms of damage during crack advance, which are determined as matrix fatigue, reinforcement particle fracture, and ductile rupture of the matrix. We show that the occurrence of damage mechanisms during fatigue of the material is linked to Kmax, rather than to ∆K. This is rationalised in terms of a semi-cohesive process zone within the monotonic plastic zone ahead of the crack tip.
1 Introduction
Metal matrix composites are a potentially-attractive class of material in that they allow the
possibility of increased specific strength and stiffness compared to unreinforced alloys.
There has been significant interest in systems based on aluminium alloy matrices, because
of the low initial density that they offer. However, steel-based systems offer the advantage
of high inherent strength and toughness. A steel-based material with a reduction in density
and enhanced stiffness would offer design benefits in high performance aerospace and
automotive components, where there are not only constraints on component weight but
where high strength and stiffness are also required.

There has been some previous work on steel-based MMCs, though in general they have
focussed on the improved wear properties that are available from those systems [1-4]
rather than on fatigue and fracture.
TiB2 has been identified as an optimal reinforcement to use with iron-based matrices, not
only because of its high stiffness (565 GPa) and low density (~4.53 g/cc) but also because
it is in direct equilibrium with both the austenite and ferrite phases [5]. Solid state
processing, in particular powder metallurgy, has been the preferred route for production of
steel MMCs reinforced with TiB2, using commercially available TiB2 powders or
synthesised through the in-situ reaction of ferro-titanium and ferro-boron powders [6, 7]
or a master alloy composed of Fe- (50% TiB2 + 50% Ti) [8] to avoid the production of
undesirable brittle third phases such as Fe2B and TiC. The production of such phases is
unavoidable when using other production routes such as liquid state processing [9, 10] as
it is very difficult to remove all impurities (such as oxygen) in the molten mix [7].
The inclusion of a hard ceramic reinforcing particle has little or no effect on the corrosion
resistance of stainless steel matrices until a certain volume fraction is reached which is
dependent on the matrix alloy. Typically this occurs at fraction volumes of 30% [11].
When this point has been reached the presence of the reinforcement can cause the local
breakdown of the passive layer.
Metal matrix composites are well-known to generate internal residual stresses in the two
phases, because of the difference in coefficient of thermal expansion (CTE) of the matrix
and reinforcement [12-14]. For an Al-SiC system with 20% SiC partlices, where the
matrix has a CTE around five times higher than the reinforcement (~4.5 µε/K compared
with 23.4 µε/K), typical residual stresses at room temperature arising from the shape
misfits are +70 MPa in the matrix and –280 MPa in the reinforcement [13]. The thermal
misfit residual stresses do not reflect the full temperature drop from the fabrication

temperature as there is some relaxation whilst the material is at high temperature with a
low matrix yield stress. In the case of the Fe-TiB2 system the mismatch is lower: ~7.4
µε/K compared with ~9 µε/K. Therefore the internal thermal misfit residual stresses can
be expected to be low. Measuring them is problematic in this system: the neutron
diffraction methods that have been applied previously to metal matrix composites are
unsuitable for boron-containing systems because of their high neutron absorption.
2 Materials
The powder metallurgy processing technique used to produce the material includes
mixing of the metal and the ceramic particulate, compressing and compacting, and
consolidation. The initial mixing of the raw materials is especially important, as this
controls the distribution of particles and porosity in the composite. This is usually
followed by cold compaction, canning, evacuation, degassing and a high temperature
consolidation stage such as Hot Isostatic Pressing (HIP) or extrusion.
The material used for this project was manufactured by Aerospace Metal Composites
(AMC), Farnborough, in billet form and was fabricated by a technique based on powder
blending and compaction. The matrix (steel) and reinforcing (TiB2) powders are
mechanically mixed until a blend of uniformly homogeneous mixture is produced, which
is cold compacted into a can. The particle size of the TiB2 reinforcing particles had a
nominal size of 5 μm; the TiB2 particles comprised 25% of the mixture by volume. The
can was then sealed and the powders consolidated through HIPing to produce a fully
dense material. All the material in this project was supplied and tested in this condition
without any secondary processing.
The matrix of the material was based on 316L austenitic stainless steel alloy and has a
density of 7.96 g/cm3. The steel grade 316L typically contains Fe, < 0.03% C, <0.03% Cr,
10-14% Ni, 2-3% Mo, <2% Mn, <1% Si, <0.045% and P < 0.03%.
The MMC studied has a density of 7.1 g/cm3, an elastic modulus of 242 GPa, a 0.2% yield
strength of 600 MPa, UTS of 1100 MPa, a ductility of 2% and a hardness of 420 HV. The
microstructure is shown in Figure 1, where the homogeneous distribution of the
reinforcement can be seen clearly. As the material was not subjected to any secondary
processing it shows no directionality in its properties.
The room temperature monotonic properties are presented in Table 1, together with
properties of the unreinforced alloy from the literature [15]. Increases in both strength and
modulus are noted for the composite over the unreinforced stainless steel matrix, while the
ductility of the composite is reduced by the inclusion of the hard, stiff, brittle
reinforcement phase.
3 Fracture Toughness
MMCs in general show significant improvement in properties such as strength and fatigue
life compared to the monolithic matrix material, whilst the fracture toughness, KIC, of
MMCs exhibits a marked degradation due to the inclusion of hard brittle reinforcing
particles.
The fracture toughness for the 316L steel reinforced with 25% TiB2 was measured using
compact tension C(T) samples, the dimensions of which are shown in Figure 2. Three
different thicknesses B were used, 24 mm, 12 mm and 6mm, to enable the minimum
specimen thickness to achieve a valid plane strain KIC for this material to be assessed.
Plane-strain fracture toughness tests were carried out in accordance with ASTM standard
E399. The test comprises initiation and growth of a suitable pre-crack by fatigue loading,
followed by the fracture test itself. An MTS servo hydraulic machine was used.
Fatigue pre-cracking was conducted under load control with a sinusoidal waveform at a
frequency of 25 Hz. A loading ratio of 0.1 was used to initiate and grow the fatigue pre-

crack, with the crack length being monitored in situ via a travelling microscope. The
specimens were ground and polished using a diamond medium to produce a mirror
surface finish, which allowed the crack to be easily observed.
The crack was initiated at a Kmax of 13 MPa√m and was grown until the ratio of crack
length a to specimen width W ~ 0.48. The specimen was then fractured and a load vs.
displacement plot was recorded. The opening displacement was measured using a clip
gauge with a gauge length of 10 mm which was attached via knife edges across the mouth
of the notch.
The results from the fracture toughness tests can be seen in Table 2. It can be seen that
there is little spread in all the KQ results.
For fracture toughness tests to be valid to the ASTM standard E399, 2.5(KQ/σYS)2 has to
be equal to or smaller than the width of the specimen. The 6-mm-thick samples did not
fulfil this condition, and the tests are invalid for the determination of KIC. The KIC value
for this material was therefore found to be 29.6±0.5 MPa√m. Although the fracture
toughness values are not comparable to the unreinforced metal matrix, as steels often have
toughness values in excess of 100 MPa√m, the KIC value of 29.6 MPa√m for this
composite is very respectable when compared to other MMC systems (aluminium alloy
reinforced with 10% SiC ~ K1C= 15 MPa√m [16]). Other aerospace aluminium alloys
(unreinforced) have K1C values of 30 MPa√m, for example 2124 Al has values between
24.2 and 31.9 depending on condition [17].
Both the fatigue pre-crack and the fracture surfaces of the specimens were examined using
scanning electron microscopy in a Zeiss SUPRA55 FEGSEM. The analysis shows fewer
fractured particles on the fatigue surface of the pre-crack (Figure 3a) when compared to
the fracture surfaces (Figure 3b). The crack driving force was typically small (∆K=13
MPa√m) in the pre-crack region and the crack propagation followed the weakest path,

which in this material was the metal matrix. As the stress fields around the crack tip at this
stress intensity are not high enough to fracture the TiB2 particles, the crack mainly
propagated through the metallic matrix and very few fractured particles were observed on
the fatigue surface. This is discussed more thoroughly in the following section. The fast
fracture surfaces on the other hand show many brittle fractured TiB2 particles. At a
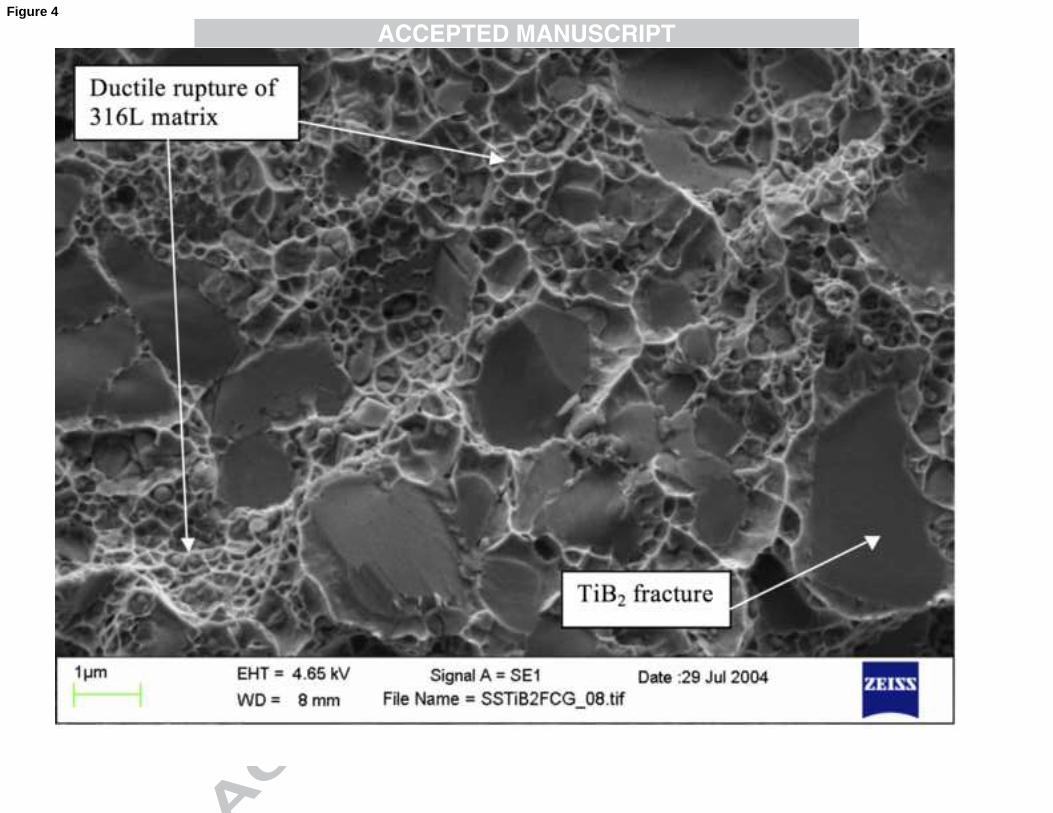
microscopic level, features reminiscent of both brittle and ductile failure mechanisms are
present. Matrix ductile failure is characterised by the formation of micro-voids and
resultant dimples on the fracture surface, attributed to the decohesion of inter-metallic
carbide particles within the steel matrix: see figure 4.
4 Fatigue Crack Growth Rates
The fatigue crack growth rate was measured using Compact-Tension C(T) samples, the
dimensions of which are as in figure 2, with a thickness B of 6 mm. Monitoring of the
crack growth was performed using two methods; surface measurements using a travelling
microscope, and pulsed direct-current potential drop (DCPD). Specimens that used the
surface measurement technique to monitor the crack were ground and polished using a
diamond medium to produce a mirror finish.
Most specimens used the potential drop technique. This involved threaded pins being
attached to the sample, which were used to attach the current leads. Further leads were
spot welded either side of the mouth of the notch in the sample to measure the potential
drop across the crack.
Fatigue crack growth rates were measured according to ASTM Standard E647. Fatigue
crack growth tests were performed on an MTS servo-hydraulic testing machine with a 10
kN load cell that allowed excellent precision of command and actual applied load for the
loads used. Fatigue cracking was controlled by a sinusoidal tension-tension load

waveform, at a frequency of 25 Hz with loading ratios R of 0.1, 0.3 and 0.5. A fatigue pre-
crack of 1 mm was grown before any crack growth data was collected to prevent any
effects of the machined notch affecting crack growth rates at the crack tip.
The crack growth rates were determined by applying constant stress intensity ∆K for a
crack length increment of 1 mm. On successful completion of that increment the ∆K was
then increased or reduced by 1 MPa√m and then grown for another 1 mm and so on.
Although fatigue crack propagation curves determined by constant ∆K testing show fewer
data points than those determined by constant load testing, more reliance can be placed on
each individual result in the former case, as growth rates are determined over much larger
distances. Stress intensity threshold ∆Kth and final fracture values were measured by
systematically reducing or increasing the applied stress intensity until the occurrence of
crack arrest for the former or specimen fracture for the latter. To investigate the crack
closure phenomenon for this material, three loading ratios were used (R= 0.1, 0.3 and 0.5).
The dependence of fatigue crack propagation rates upon the applied stress intensity range
∆K for the material is shown in Figure 5. It can be seen that the material shows a response
typical of a metallic material, with three distinct regimes: near-threshold, linear (Paris),
and finally fracture. The fatigue threshold ∆Kth of this material at a loading ratio of 0.1 is
4.6 MPa√m. This is relatively low when compared to the ∆Kth for the parent alloy of 15
MPa√m suggested in the literature [18, 19]. It is highly unlikely that the steel-based MMC
would show superior fatigue crack growth properties in any regime, as the parent alloy
has a fracture toughness (KIC) in excess of 100 MPa√m [20]. The gradient (m) in the Paris
regime for this composite is higher (5.0) than other metallic materials (2-4).
Consequently, crack growth resistance is increasingly inferior at high ∆K compared to the

unreinforced alloy, as crack growth instability and final fracture is reached at lower Kmax
values due to the lower fracture toughness. Final fracture occurs when the fracture
toughness is reached.
4.1 Influence of R-ratio
The load ratio effect on the MMC system can be seen in Figure 5. At higher R-ratios (0.3
and 0.5) the growth rates within the Paris regime increase compared to R = 0.1. Note that
the two higher loading ratios (0.3 and 0.5) have similar growth rates. Since crack advance
is predominantly controlled by ∆K [21], this trend of faster growth with increasing loading
ratios has been associated with increased crack closure levels at lower R-ratios [22], as the
value of Kmin increases with increasing R-ratio for a given ∆K. If Kmin is increased beyond
the point at which closure begins to operate, the crack growth rates will be closure-free
and subsequently the crack will grow at a faster rate. At lower R ratios, if Kmin is below
Kcl, then Kcl becomes the effective Kmin, thus reducing the effective ∆K, resulting in slower
crack growth rates.
A compliance-based technique was used to monitor crack closure levels. Two strain
gauges were used to monitor crack tip displacement, one placed on the back face of the
sample, and the second placed near the crack tip measuring strains perpendicular to the
crack growth direction. A typical load vs. displacement plot from the crack tip strain
gauges for the loading ratio of 0.1 is shown in Figure 6. The change in slope of the
load:displacement trace is used to indicate the crack opening (or, on unloading, the
closing) load: in figure 6 there is a change in slope at 608 N, which corresponds to a stress
intensity of 3.4 MPa√m. The crack-tip gauge measurements were found to be more
sensitive to closure than the back-face strain gauge measurements. At the higher R values

of 0.3 and 0.5, no closure was detected – i.e., the load-displacement traces were linear –
which explains the similarity in the crack growth rates at R = 0.3 and 0.5 in Figure 5, as
both loading ratios are closure-free, therefore subjected to the same ∆K.
Applying the closure values measured at R = 0.1 as a correction to the ∆K values applied,
all the crack growth rate curves (R = 0.1, 0.3 and 0.5) coincide, thus producing a closure-
free crack growth rate for the 316L / 25% TiB2, which can be seen in Figure 7.
5 Quantitative analysis of fatigue and fracture surface
The fracture surfaces were examined using a Zeiss FEGSEM and the fracture topography
of the material was related to the applied ∆K. Observations from the fracture surface
revealed three mechanisms of failure: fatigue of the metal matrix, ductile rupture of the
matrix, and reinforcement fracture, which can be seen in Figure 8.
At low ∆K (<15MPa√m), the major failure mechanism was fatigue of the metal matrix;
this is typified by the production of striations on the fatigued surface (Figure 8a). At
intermediate and high ∆Ks (>15MPa√m), both brittle fracture of the TiB2 particles and
ductile rupture of the matrix are present. The ductile failure of the matrix is influenced by
presence of the reinforcing particles within the process zone ahead of the crack tip, as the
reinforcing particles will bear a substantial amount of the stress within the process zone. It
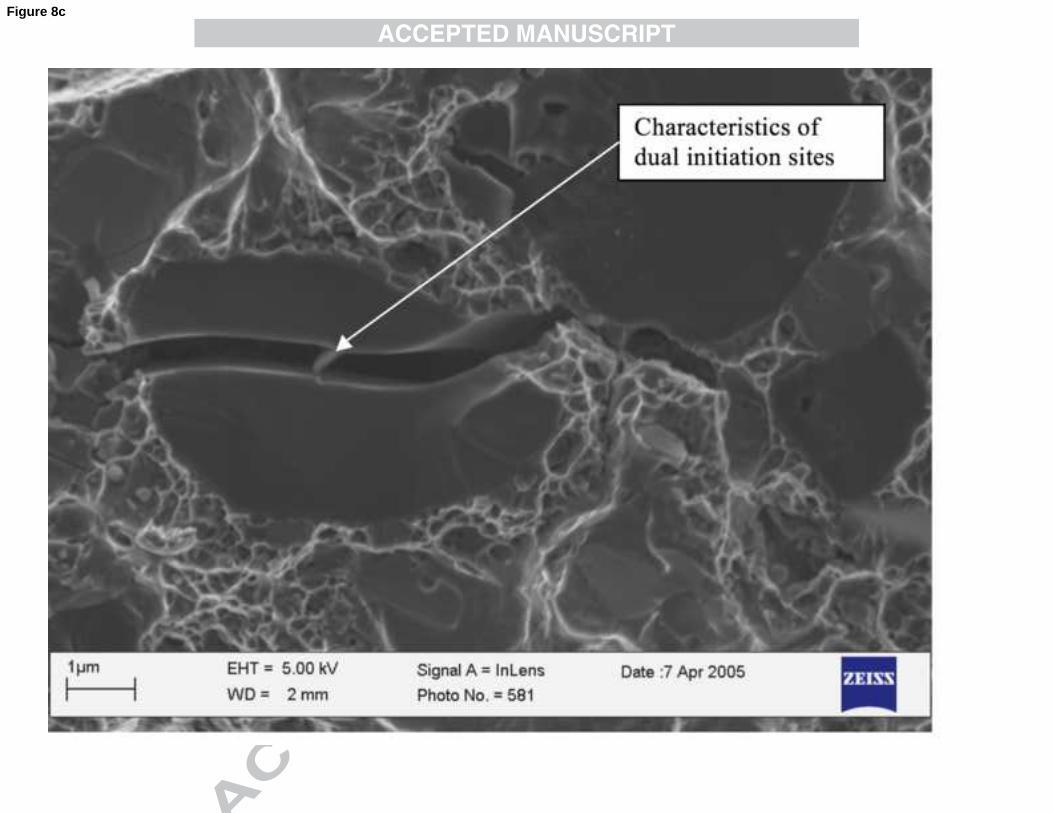
can be noted that a considerable amount of fractured particles showed characteristics of
multiple fracture initiation sites (see Figure 8c). As the typical mechanism of failure for
the reinforcement was fracture and not interfacial debonding (which is supported by
internal stress measurements reported previously [23]), this indicates that the bonding

between the matrix and reinforcement is strong and is not a limiting factor in fatigue
damage. The failure of the reinforcing particles results in increasing amounts of load
being placed onto the matrix, causing it to fail through ductile mechanisms. The ductile
failure is characterised by the formation of micro-voids and resultant dimples within the
matrix on the fatigue surface, attributed to the decohesion of inter-metallic particles within
the steel matrix (Figure 8b). The presence of both brittle and ductile failure micro-
mechanisms has been noted for other MMCs [24].
In order to interpret the failure mechanisms at the crack tip and relate this to the crack
growth rates in the MMC, a quantitative study of the fracture topography was conducted.
The area-% coverage of the three failure modes found on the failure surface was
determined using a grid system. A 10 × 10 grid was placed over the SEM images with
comparable working distances and magnifications to enable an estimation of the
percentage coverage for all failure mechanisms on the fatigued surface. This procedure
was conducted three times for every measured ∆K and an average was then taken, which
is shown in Figure 9. This figure shows the percentage of matrix fatigue, matrix ductile
rupture and TiB2 particle fracture on the crack surface at various values of applied ∆K.
The square data points within this figure refer to failure modes on the fracture surface of a
fracture toughness specimen (where there is no matrix fatigue mechanism).
At low ∆K the crack mainly propagated through the metallic matrix: Figure 10a shows a
typical fatigued surface in the threshold regime (∆K ~ 5.4 MPa√m). Only approximately
5% of the fracture surface is comprised of TiB2 particles intersected by the crack path (of
which all had fractured), far less than the 25% volume fraction in the microstructure. As
the peak stress intensity factor is increased, the stress within the process zone increase,

causing the fracture of TiB2 reinforcing particles; this is seen to occur at stress intensity
factor ranges greater than 13 MPa√m, resulting in an increasing amount of fractured
particles to appear on the fatigued surface and an increase in the ductile rupture of the
surrounding metal matrix. Figure 10b shows a typical fatigued surface for a relatively high
stress intensity range, ∆K ~ 27 MPa√m with a far higher proportion of fractured particles
observed.
This procedure was repeated for loading ratios of 0.3 and 0.5. The fracture topography of
the studied material exhibited the same general features (in terms of the three failure
mechanisms) as were seen at R = 0.1. However it was noted that the presence of fractured
TiB2 particles and ductile rupture of the matrix was observed at lower values of applied
∆K for R = 0.3 (10 MPa√m) and for R = 0.5 (6 MPa√m) compared to ∆K of 13 MPa√m
for R = 0.1.
The influence of the loading ratio on the failure mechanisms observed can be seen in
Figure 11. Figure 11a shows that, as a function of ∆K, there is a decrease in observable
matrix fatigue, and an increase in the coverage of fractured TiB2 particles and the
occurrence of ductile rupture of the matrix. The transition between the different failure
mechanisms occurs at different levels of ∆K for the different R ratios. However, if the data
are plotted as a function of the peak stress intensity during the loading cycle, Kmax, it is
seen that there is identical behaviour at the three R ratios, as seen in figure 11b. There is
clearly a strong dependence on Kmax of the failure mechanisms, which is unsurprising for
the ductile rupture and particle fracture, but it is remarkable for the matrix fatigue.
The plastic region ahead of the crack tip can be divided into two zones: a monotonic
plastic zone and a cyclic plastic zone [25]. As the cyclic plastic zone (which defines the

extent of reversed plastic deformation at the crack tip) is controlled by ∆K, it is this cyclic
plastic zone that influences the advance of the crack within this MMC. Similarly, the
monotonic plastic zone is controlled by Kmax: as the failure modes, and in particular the
fracture of the TiB2 particles, have been shown to be dependent on Kmax, this suggests that
these occur within the monotonic zone. The subsequent failure of the surrounding matrix
will occur by a cyclic plastic fatigue process which at low Kmax values (<10 MPa√m) will
be shown by striation markings on the fatigued surface, and at high Kmax values (>10
MPa√m) by ductile rupture of the metal matrix. As at high applied loads an increasing
amount of TiB2 particles crack ahead of the crack tip, and the surrounding matrix is
fatigued, greater stress will be placed upon the remaining matrix causing it to fracture via
inter-granular failure initiated by the inter-metallic particles within the 316L steel matrix,
which is characterised by ‘cup and cone’ markings on the fracture surface shown in Figure
4.
Thus, the micro-mechanisms of fatigue crack growth in this material may be discussed in
terms of a main crack and a semicohesive zone within the monotonic plastic zone, as
shown in Figure 12. Thus favourably orientated TiB2 particles will fracture ahead of the
crack tip at high stress intensities. Particle cracking ahead of the crack tip has been seen to
occur in other aluminium-based MMCs [26-28] at intermediate stress intensities in the
Paris regime. As the fracture of particles is Kmax controlled, it is triggered primarily in
larger particles, as the larger particles have an increased possibility of containing flaws
and as a consequence are weaker.
At higher values of Kmax, there is a significant increase in the degree of static modes of
fracture. The degree of particle fracture within the semicohesive zone will be controlled
by Kmax. Interestingly the transition from matrix fatigue to particle fracture (at ∆K values
of ~ 12 MPa√m), occurs when the cyclic plastic zone size is equal or greater than the TiB2
particle size of 5 μm, based on a calculation of the cyclic plastic zone size of:
rc = 1
6π∆ K
2σ y
⎛
⎝⎜⎜
⎞
⎠⎟⎟
2
= 1
18.84
12
1200
⎛⎝⎜
⎞⎠⎟
2
= 5.3µm
As noted earlier dual initiation sites were seen on the fracture surface of some TiB2
particles, as shown in Figure 8c. This can be explained by partial fracture of the TiB2
particles in the semicohesive zone. As the matrix surrounding the part-fractured particles
fails either through ductile rupture or through fatigue, the partially fractured particle will
then fully fracture.
At lower stress intensities, the stresses within the monotonic plastic zone are insufficient
to fracture the TiB2 so failure progresses by matrix fatigue in the cyclic plastic zone. From
Figure 11a it can be seen that at R = 0.1, up to Kmax of 15 MPa√m the preferred failure
mechanism in this MMC is through the fatigue of the matrix. Crack growth rates in the
near-threshold regime are controlled by the microstructure of the matrix [27, 29, 30], in
that matrix fatigue will be caused by cyclic plastic deformation and, thus, to a first
approximation, the fatigue resistance will be controlled by the response of the matrix to
cyclic plastic straining. The crack driving force in this regime is typically small and the
crack propagation will follow the weakest path within the material, which is matrix
fatigue, even though the monotonic plastic zone size is relatively large (7.75 μm at 15
MPa√m) when compared to the microstructure of the material (particle size 5 μm). Even
in this low stress intensity regime, 5% of the failure mechanism is still through the
fracture of the TiB2 particles. This roughly constant percentage of particle fracture on the
fatigue surface from threshold intensities up to Kmax values of 15 MPa√m can be explained
again by considering the stress field ahead of the crack tip. At low stress intensities the

crack will grow through the matrix and be deflected by the reinforcing TiB2 particles. This
is true until the crack path coincides directly with a TiB2 particle, and cannot be deflected
around; as the crack tip approaches such particles the crack tip opening displacement will
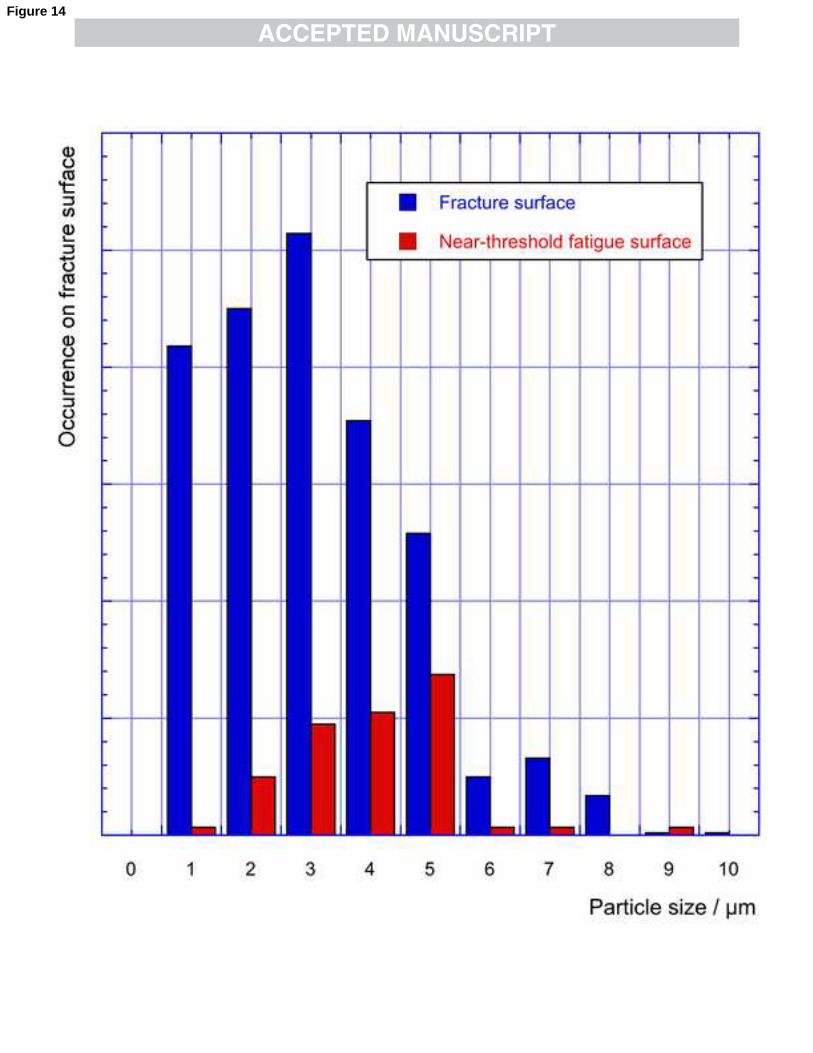
cause the particle to fracture, as illustrated in Figure 13. This is supported by the data
shown in Figure 14, which shows the TiB2 particle sizes on the fracture surfaces for low
stress intensity fatigue compared to a fracture toughness surface. This figure shows that
the majority of particles on the fracture surface at low stress intensities have a diameter of
5μm (particle size ~ 5μm), suggesting that the majority of TiB2 particles that fracture
during crack growth at low intensities fracture through the centre, and are hence in direct
collision with the fatigue crack path. Additionally, it is more likely for the larger particles
to fracture as it is more likely that those particles will contain flaws.
The crack path will only deviate by small amounts around the TiB2 particles, as any major
deviations are reduced by complete particle fracture, even at small stress intensities, thus
producing a relatively planar crack front even at low stress intensities. The production of a
planar crack is in agreement with other literature on similar iron-based systems [31]. This
is unlike many of the aluminium-based MMC systems, where the crack tortuosity is
enhanced in the composite compared to their parent alloy, promoting roughness induced
closure resulting in superior threshold growth rates [22].
The observed striations on the fatigue surface can be used to calculate the microscopic
crack growth rate within the matrix, as one striation is equal to the advancement of the
crack for one cycle (da/dN). These microscopic crack growth rates can then be compared
against the macroscopic closure-corrected fatigue crack growth data illustrated in Figure
7, as shown in Figure 15. Figure 15 shows the crack rates measured from the striations of

the metal matrix (microscopic) to be slightly slower than the growth rates noted for the
macroscopic crack growth data. It is worth noting that the microscopic data from the
different loading ratios again coincides. This difference between microscopic and
macroscopic crack growth data is greater at high ∆K; this is to be expected as there are a
greater number of static failure modes affecting the crack growth rate at high ∆K. This
supports the suggested failure mechanism of TiB2 fracture within the monotonic plastic
zone forming a semicohesive zone ahead of the crack tip. The advance of the crack tip
therefore is produced within the cyclic plastic zone, through the fatigue or local rupture of
the matrix, resulting in ∆K being the main driving force behind crack advance.
The striation-based data for this microscopic crack growth rate could only be obtained for
a restricted number of crack tip intensities, as below ∆K of 13 MPa√m the striations were
too small (below 30 nm) to be seen using the FEGSEM and above ∆K of 22.5 MPa√m the
striations were no longer an easily observed failure mechanism. As the observed
microscopic crack growth rates obtained from the loading ratios R = 0.1 and 0.3 coincide
at similar values of ∆K, this supports the conclusion that fatigue crack growth is
dominated by the cyclic plastic zone ahead of the crack tip.
The fatigue crack growth behaviour described may be rationalised if it is considered that
the reinforcing particle population consists of a distribution of different particle sizes and
interparticle spacings. At low stress intensities the plastic zone at the crack tip will be
insufficient to cause particle fracture and the main failure mode will be matrix fatigue.
TiB2 particles will fracture within this regime only if the TiB2 particle lies directly on the
fatigue crack path. As the stress intensity increases, the plastic zone size may grow large
enough to cause particles to fracture ahead of the crack tip, producing a semicohesive
zone ahead of the crack tip. As stress intensities increase beyond this value then an

increased number of TiB2 particles will fracture. Eventually the majority of the coarse
particles present will be contributing to the fracture process. The advance of the crack is
produced within the cyclic plastic zone, either through matrix fatigue (low ΔK) or matrix
rupture around fractured TiB2 particles (high ΔK).
Thus the inferior fatigue crack growth rates and fracture toughness of this steel-based
MMC can be attributed to the presence of static failure modes (fracture of TiB2 particles)
ahead of the crack tip, which is driven by Kmax, which in turn affects the crack growth
rates which have been shown to primarily be driven by ∆K in this MMC, similar to other
metallic materials [21].
Conclusions
1. Fatigue and fracture processes have been studied in an austenitic stainless steel
reinforced with 25% by volume of titanium diboride particles. A plain strain fracture
toughness of 29.6 MPa√m was obtained for this material. This value is significantly lower
than that of the 316L parent alloy but is adequate for many engineering applications. The
material could find application in components where strength with weight saving is of
value and a lower toughness than other alloys can be tolerated.
2. The fatigue crack growth process is controlled overall by the stress intensity factor
range ΔK, but the damage mechanisms seen on the fracture surface are driven by the peak
stress intensity Kmax.
At low values of Kmax (below 15 MPa√m) the main failure mechanism is matrix fatigue.
Beyond this point there is a steady progressive increase in static failure modes, notably
reinforcement particle fracture. This increase in particle fracture causes a progressive
increase in the ductile rupture of the matrix, as greater stress is placed upon the matrix

with increasing reinforcement particle fracture. Above 25 MPa√m the main failure
mechanism is ductile rupture of the matrix. Also above this stress intensity, 25% of the
fracture surface shows fractured reinforcement particles, which is the same percentage as
the reinforcement volume fraction of this MMC.
3. At low stress intensities the majority of the reinforcing particles seen on the fatigue
surface have sizes of 4-5 μm, as opposed to 2-5 µm on a fast fracture surface. This can be
explained by the fact that at relatively low ∆K the lower stresses at the crack tip will
predispose large particles to fracture, as the large particles are more likely to contain
flaws. There is a process zone of damage that develops ahead of the crack tip in which
particle fracture occurs.
4. In the Paris regime of fatigue, the MMC showed a faster growth rate compared to other
metallic materials, with a gradient m of 5. The faster growth rate in the MMC was due to
the particle cracking ahead of the crack tip within the process zone. Final fracture
occurred at a lower value, consistent with the lower fracture toughness value as static
failure modes dominate crack propagation.
Acknowledgements
We are grateful to AMC Ltd. for the supply of the materials studied. DHB was supported
by a Doctoral Training Award from the UK Engineering and Physical Sciences Research
Council. MEF is supported by a grant through The Open University from The Lloyd's
Register Educational Trust, an independent charity working to achieve advances in
transportation, science, engineering and technology education, training and research
worldwide for the benefit of all.

Figure captions
Figure 1: 3D representation of microstructure of 316L / 25% TiB2 MMC
Figure 2: Compact Tension specimen used for Fracture Toughness measurement
Figure 3: Typical example of (a) the fatigue surface of a pre-crack and (b) the fracture
surface in a fracture toughness specimen
Figure 4: High magnification image of the fracture surface, showing particle fracture and
ductile matrix rupture
Figure 5: Fatigue crack growth rates for the 316L steel-based MMC reinforced with 25%
TiB2 for R = 0.1, 0.3 and 0.5.
Figure 6: Load vs. displacement plot to obtain crack closure levels, for a ∆K of 11
MPa√m, crack length a of 29.9 mm for R = 0.1, from a strain gauge placed behind the
crack tip
Figure 7: ‘Closure free’ crack growth rates for the 316L / TiB2 MMC
Figure 8: (a) Failure mechanism by fatigue of metal matrix; (b) Ductile rupture of metal
matrix typified by cup and cone mechanism; (c) Fracture of TiB2 reinforcing particle
Figure 9: Area coverage of the failure mechanisms on the fatigue crack surface as a
function of ∆K
Figure 10a: Typical fatigue surface for crack growth in the threshold regime (∆K ~ 5.40
MPa√m)
Figure 10b: Typical fatigue surface for crack growth in a high stress intensity regime (∆K
~ 27 MPa√m)
Figure 11a: Comparisons of failure mechanisms on fatigued surface at different loading
ratios as a function of ∆K
Figure 11b: Comparisons of failure mechanisms on fatigued surface at different loading
ratios as a function of Kmax
Figure 12: 2D representation of the semicohesive zone ahead of the crack tip caused by
particle fracture within the monotonic plastic zone

Figure 13: Fatigue crack path at low stress intensities
Figure 14: Comparison of particle sizes on the fast fracture surface of a fracture toughness
specimen, and a fatigue crack growth specimen subjected at a low stress intensity range
(5.4 MPa√m)
Figure 15: Comparisons of macroscopic crack growth rates and microscopic crack growth
rates against stress intensity. The R = 0.1 crack growth rates are closure free rates
References
[1] Tjong SC, Lau KC. Materials Letters 1999;41:153. [2] Tjong SC, Lau KC. Composites Science and Technology 2000;60:1141. [3] Velasco F, Lima WM, Anton N, Abenojar J, Torralba JM. Tribology International 2003;36:547. [4] Zapata WC, Da Costa CE, Torralba JM. J. Mater. Sci. 1998;33:3219. [5] Sigl LS, Schwetz KA. Powder Metallurgy Intl. 1991;23:221. [6] Tanaka K, Oshima T, Saito T. Journal of the Iron and Steel Institute of Japan 1998;84:586. [7] Tanaka T, Saito T. Journal of Phase Equilibria 1999;20:207. [8] Degnan CC, Shipway PH. Met. Mat. Trans. A 2002;33:2973. [9] Sigl LS, Schwetz KA. Powder Metallurgy International 1991;23:221. [10] Terry BS, Chiny Amakobvu OS. Material Science and Technology 1992;8:491. [11] Pagounis E, Lindroos VK. Mater. Sci. Engng 1998;A246:221. [12] Fitzpatrick ME. Composite Materials. In: Fitzpatrick ME, Lodini A, editors. Analysis of Residual Stress using Neutron and Synchrotron Radiation. London: Taylor & Francis, 2003. p.263. [13] Fitzpatrick ME, Hutchings MT, Withers PJ. Acta Mater. 1997;45:4867. [14] Fitzpatrick ME, Withers PJ, Baczmanski A, Hutchings MT, Levy R, Ceretti M, Lodini A. Acta Mater. 2002;50:1031. [15] Metals Handbook, Volume 1 Properties and Selection:Irons and Steels: ASM, 1987. [16] Hong S-J, Kim H-M, Huh D, Suryanarayana C, Chun BS. Materials Science and Engineering A 2003;347:198. [17] Metals Handbook Volume 2 Properties and Selection: Nonferrous Alloys and Pure Metals. Ohio: ASM International, 1990. [18] Campbell JE. Fracture Properties of Wrought Stainless Steels. In: Campbell JE, Gerberich WW, Underwood JH, editors. Application of Fracture Mechanics for the selection of Metallic Structural Materials. OH: ASM, 1982. p.132. [19] Boyer HE, editor Atlas of fatigue curves. Ohio, USA: American Society for Metals, 1986. [20] Murty KL, Mathew MD, Wang Y, Shah VN, Haggag FM. International Journal of Pressure Vessels and Piping 1998;75:834. [21] Martin JW, Edwards L. Micromechanisms in fatigue. In: Lewis MH, Taplin DMR, editors. Micromechanisms of plasticity and fracture. Dublin: Parsons Press, 1983. p.333. [22] Nicoletto G, Pirondi A, Scolari P. Key Engineering Materials 2002;221-2:17. [23] Bacon DH, Edwards L, Moffatt JE, Fitzpatrick ME. Acta Mater. 2011;59:3373.

[24] Srivatsan TS, Annigeri R, Prakash A. Composites Part A: Applied Science and Manufacturing 1997;28:377. [25] Rice JR, editor Mechanics of crack tip deformation and extension by fatigue. Philadelphia: American Society for Testing and Materials, 1967. [26] Shang JK, Ritchie RO. Fatigue of Discontinuously Reinforced Metal Matrix Composite. In: Arsenault RJ, Everett RK, editors. Metal Matrix Composites: Mechanisms and Properties. Academic Press, 1991. p.255. [27] Shang JK, Yu W, Ritchie RO. Materials Science and Engineering 1988;102:181. [28] Shang JK, Ritchie RO. Metall. Trans. 1989;20A:897. [29] Papakyriacou M, Mayer HR, Tchegg-Stanzl SE, Groschl M. Fatigue & Fracture of Engineering Materials & Structures 1995;18:477. [30] Watt DF, Xu XQ, Lloyd DJ. Acta Materialia 1996;44:789. [31] Yang N, Sinclair I. Met. Mat. Trans. A 2001;34A:2003.

Table 1: Tensile properties of the material.
Material Young’s
Modulus E / GPa
0.2% Proof
Stress / MPa
Ultimate Tensile
Strength / MPa
Strain to Failure
/ %
316L 190 200-220 760 15-20
316L/25% TiB2 242 690 1100 2.0
Table 2: Results from fracture toughness tests for the three different thicknesses (24, 12 and 6 mm)
Thickness of C(T) sample B / mm
24 12 6
KQ / MPam
29.72 29.99 30.30
28.94 32.02

Fig 2

• Fatigue and fracture properties determined for an Fe/TiB2 particulate MMC • Fatigue crack growth rates are dependent on •K, and faster than in the steel matrix • Failure mechanisms determined from fracture surface analysis are dependent on K-
max • As K-max increases, particle fracture increases, matrix fatigue decreases • At low •K, larger particles are observed on the fracture surface