Embed Size (px)
Citation preview

1
Fatigue and Residual Strength of Fiber Rope Tuglines
Rafael ChouOctober 23, 2003

2
Presentation Overview
• Fiber, Ropes and Testing• Project Overview • Testing and Analysis • Results and Conclusions

3
Dyneema FiberDyneema Fiber CharacteristicsCharacteristics• Maximum strength/minimal weight – long breaking length
• Low elongation
• Floating
• Excellent tension and bending fatigue
• Good UV and chemical resistance
• High cut and abrasion resistance

4
Amsteel-Blue is a coated 12 strand single braided construction, 100% HMPE fiber rope.

5
Amsteel-Blue• Physical Properties
– Has excellent UV properties– Floats (0.98 Specific Gravity) – Is only one-tenth the weight of an equal
diameter size and strength wire rope• Mechanical Properties
– Has maximum strength-to-weight ratio and is stronger than wire rope
– It has the best flex-fatigue and wear resistance of all HMPE fiber working ropes
– Has less than 1% elastic elongation at 30% of rope breaking load – and approximately 4% elongation at break

6
Samson 1.1 MM lb. Test Machine

7
Synthetic Rope Testing HMPE Rope with and without precycling
50% level pre-cycling
0
5000
10000
15000
20000
25000
30000
35000
0 2 4 6 8Elongation, %
Stre
ngth
, lb
20% level Pre-Cycle
0
5000
10000
15000
20000
25000
30000
35000
0 2 4 6 8Elongation, %
Stre
ngth
, lb
No cycle
0
5000
10000
15000
20000
25000
30000
35000
0 2 4 6 8Elongation, %
Stre
ngth
, lb
HMPE Rope Strength, lbNo cycling 31,782
20% cycling 32,73450% cycling 34,652

8

9

10
Yarn properties; UV-resistance
0
20
40
60
80
100
0 4 8 12 16 20 24
exposure time [months outdoors]
stre
ngth
rete
ntio
n [%
]
Dyneema
aramid
polyester

11
Rope properties; bending fatigue (D/d = 25)
1000
10000
100000
1000000
10000000
0 10 20 30 40 50 60peak load [% MBL]
cycl
es to
failu
re
Dyneema
aramid
polyester
steel wire rope

12
1. 50% of rope’s breaking strength – 1000 cycles2. 60% of rope’s breaking strength – 1000 cycles3. 70% of rope’s breaking strength – 1000 cycles.4. …..continue the procedure at 10% incremental of
breaking strength till rope breaks.
• The results are then used to calculate a TCLL value which theoretically represents the load (expressed as a % of the breaking strength) at which the rope would fail at exactly 1000 cycles.
TESTING METHOD
TCLL – Level of load that fatigues rope to break at the 1000th cycle
- fatigue resistance test

13

14
Amsteel-Blue Application:Tractor Tug Winch line

15
The Application for the Study:Tractor Tug (single drum) Winch Lines
64 mm diameter Amsteel-Blue winch line on Crowley Marine Services Inc. Harbor-Class tractor tug

16
Project Overview• Project Goals:
– Investigate and understand forces of vessel and machinery dynamics on HPME rope
– Create a testing method to inspect, test, catalog and analyze physical changes to HMPE rope
– Determine the residual strength from used ropes under laboratory conditions
– Use laboratory model studies to investigate strength reduction mechanisms
– Create a platform for the modification of the HMPE ropes to provide greater service life

17
Residual Strength Testing
• Phase 1:– Mainlines:
• Ends– Worked for 1000-1700 jobs then End-for-ended– End-for-ended then Worked for 1000-1700 jobs– Worked no bury (~1100 jobs)
• Mid-sections – Pendants
• Phase 2:– Pendants-worked for 6 specific intervals between 100 and 1250
jobs
END ENDMID-SECTIONS
X-HOURS Y-HOURS
PHASE 1 DIAGRAM

18
Residual Strength Testing
Procedure: Pendants were generally used for (1) year and main towlines were used for (2) years – Main lines were used for (1) year – end-for-ended, and used
for another year, thus 2 year life– Visual inspections and break tests were performed– Ropes were re-spliced with new eyes – before each break
test when necessary– Testing was done on the mainline ends and the mainline
midsections– Pendants were cataloged separately– Jobs, hours and notations about service were cataloged for
all samples– All lines were cycled to 10 times to 20% of their published
Minimum Breaking Load prior to failure

19
8” circ. Amsteel BlueResidual Strength - Mid-Sections
0
20
40
60
80
100
120
0 200 400 600 800 1,000 1,200 1,400 1,600 1,800 2,000No. of jobs
% o
f MB
L (5
95,3
50 lb
f)
Mid-Section

20
8” circ. Amsteel BlueResidual Strength - Ends
(Mainline Ends & Pendants)
0
20
40
60
80
100
120
0 200 400 600 800 1,000 1,200 1,400 1,600 1,800 2,000No. of Jobs Worked
% o
f MB
L (5
95,3
50 lb
f)
P1-EndsP1-Pendants *
* Was not buried on winch. No significant drum compression

21
Combined Graph
0
20
40
60
80
100
120
0 200 400 600 800 1,000 1,200 1,400 1,600 1,800 2,000
No. of Jobs Worked
% o
f MB
L (5
95,3
50 lb
f)
All EndsP1-Pendants *P2-Pendants *Upper BoundLower Bound
* Was not buried on winch. No significant drum compression
No Drum Compression

22
Literature HMPE-towline retention strength
Source: “Latest Synthetic Fibre Rope Developments in the Towage Industry”, John Hooker, Marlow Ropes Ltd., 16th ITS, 2000

23
Literature HMPE-towline retention strength
Source: “High Performance Steelite Ropes For Harbour Towing”, Andrew Street, David Potter, Marlow Ropes Ltd., 12th ITS, 1992

24
Possible Mechanisms of strength reduction
• Shock Loading• Twists• Drum Compression• Cyclic Fatigue • Abrasion

25
Strength loss in towing ropes
• Shockloading–Literature on shockloading–Analysis of data of Crowley tugsProtector and Nanuq
–Cyclic shockloading test–Strain rate and fibre properties

26
Shockloading literature“The large difference between the planned
force and the measured value could not be explained.”
“An energy analysis on shock load situations should give reasonable results provided the load / extension curve used is representative of the rope condition.”
Source: “Latest Synthetic Fibre Rope Developments in the Towage Industry
John Hooker, Marlow Ropes Ltd, 16th ITS, 2000
Source: “Experiments with shock load on steel wire ropes
L.Wiek, TU Delft, OIPEEC Bulletin 70, 1995
LAEHgmFimpact
.....2=
Hgvinit ..2=

27
Effects of Shock Loading
Strength loss from shock loading
• The sudden increase in applied load can cause some of the rope’s fibers to uncharacteristically break
• Computerized line-loading strength measuring capability was employed on 3 Crowley VS drive tractor tugs (different classes)

28
Equipment:Marine Services Harbor-Class Tractor Tugs
• 4800 HP• Bollard Pull of 51 tons (US)• West Coast (US) deployment
– Seattle– Long Beach
• Propulsion – “Voith Schneider” drive• Line handling – mainline Amsteel-Blue
on single drum hydraulic winch – going through stainless steel-clad “staple”
29
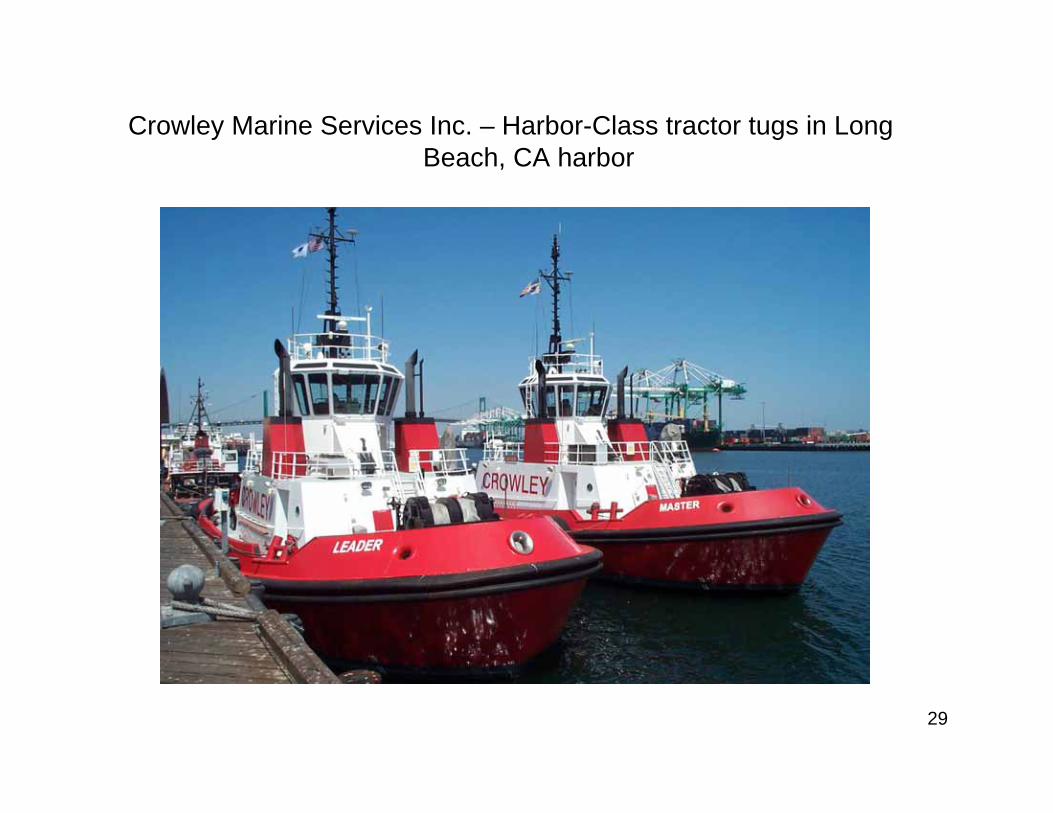
Crowley Marine Services Inc. – Harbor-Class tractor tugs in Long Beach, CA harbor

302-5/8” (64MM) diameter Amsteel-Blue on Crowley Harbor Class

31
Prince William Sound Class Escort Vessel
Nanuq (’99), Tan’erliq (’99)Valdez, Alaska
• 153 ft. Voith-Schneider Escort Tug

32
Crowley Nanuq Line Tension data
5,5% MBS

33
Protector Class ship-assist vessel
• Protector (’96), Guard (’97) Los Angeles / Long Beach
• 123 ft Z-Drive Escort Tug

34
Crowley Protector Line Tension data
18% MBS

35
Crowley Protector Line Tensiondata

36
Crowley Protector Line Tensiondata
58123 lbs / 1,1 sec

37
Crowley Protector Line Tension data
70321 lbs / 1,4 sec

38
Crowley Protector Line Tension data
Extreme Line Tension Buildup:• 60-70,000 lbs in 1-2 sec.
• Towed Vessel height: 15 m.MBS 9-inch rope: 747,495 lbsStrain at break: 3%Tension build-up: 60,000 lbs (8% MBS) in 2 seconds
• Up-angle 75° 30°Line-length 15,5 m. (short) 30 m. (long)
• Impact velocity (Amount of strain / seconds)(8%*3%*15,5 / 2 sec.) (8%*3%*30 / 2 sec.)= 0,02 m/s. = 0,04 m/s

39
Practical Shock Loading Scenarios:• 60-70,000 lbs in 1-2 sec.• Towed Vessel height: 15 m.
MBS 9-inch rope: 747,495 lbsElongation at break: 3%Tension build-up: 60,000 lbs (8% MBS) in 2 seconds
30 m.15,5 m.Line-length
0,04 m/s0,02 m/sImpact Velocity
30°75°Line Angle
Long leadShort lead

40
Shock Loading Simulation Testing
• Loading Rates:– 20 sec sine + 0 sec dwell time– 3 sec sine + 17 sec. dwell time– 1.1-1.8 sec sine + 18-19 sec dwell time
• Laboratory Test Procedure:– 1000 cycles 5-50% BL– 1000 cycles 5-60% BL– 1000 cycles 5-70% BL– 2000 cycles 5-80% BL– Load to failure

41
Effects of Cyclic Fatigue
Residual Strength=134% MBL120 s.sine5-80% BL200020 s.sine5-70% BL100020 s.sine5-60% BL100020 s.sine5-50% BL1000Cycle timeLoad cycle#cycles
5
55
0 .00 20 .00 40 .00 60 .00 80 .00 100 .00
T im e (sec )
Load
(%M
BL)
C yc le 1

42
Effects of Cyclic Fatigue
Residual Strength=139% MBL13 s. sine +17 s.5-80% BL20003 s. sine +17 s.5-70% BL10003 s. sine +17 s.5-60% BL10003 s. sine +17 s.5-50% BL1000Cycle timeLoad cycle#cycles
5
55
0 20 40 60 80 100
T im e (sec)
Load
(%M
BL)
C yc le 2

43
Effects of Cyclic Fatigue
Residual Strength=135% MBL11,8 s. sawtooth+18,25-80% BL20001,6 s. sawtooth+18,45-70% BL10001,4 s. sawtooth+18,65-60% BL10001,1 s. sawtooth+18,95-50% BL1000
Cycle timeLoad cycle#cycles
5
55
0 20 40 60 80 100
T im e (sec )
Load
(%M
BL)
C yc le 3

44
Cyclic shockloading tests13/16 inch AmSteel Blue rope
Break Strength 29,600 kg
OCIMF Thousand Cycle Load Level – test (dry)
#cycles Load cycle Cycle time Cycle Time Cycle time
1000 5-50% BL 20 s.sine 3 s. sine +17 s. 1,1 s. Sawtooth +18,9
1000 5-60% BL 20 s.sine 3 s. sine +17 s. 1,4 s. Sawtooth +18,6
1000 5-70% BL 20 s.sine 3 s. sine +17 s. 1,6 s. Sawtooth +18,4
2000 5-80% BL 20 s.sine 3 s. sine +17 s. 1,8 s. Sawtooth +18,2
Break Strength
39,735 kg 41,096 kg 39,894 kg
134 % 139 % 135 %

45
Literature: Strain rate at other fibres
Source: “Dynamic properties of marine fibre ropes”, G.R.Borwick, G.Elliot, National Engineering Laboratory, 2nd ITC, 1982
Dynamic Breaking Load vs. impact speed Absorbed energy vs. impact speed

46
Strain rate and fibre properties
At increasing deformation rate:Tenacity increases and Elongation at break
decreases

47
Strain rate and fibre properties
At increasing deformation rate:Tenacity increases more at higher
temperatures

48
Strain rate and fibre properties
At increasing deformation rate:Elongation at break decreasesover whole temperature range

49
Strain rate and fibre properties
At increasing deformation rate:E-modulus (stiffness) increases over whole temperature range
0,155 m/s (l=15,5 m.)(75° up-angle)
0,3 m/s (l=30 m.)(30° up-angle)

50
Strength loss & shock loading
• Computerized line-loading strength measuring capability was employed on 3 Crowley VS drive tractor tugs (different classes)– A high-sensitivity, self triggering, frequent-
capture strain gauge attached to winch – Measure loading and velocities on Amsteel-Blue
during ship assists in rough water– Traditional mentality is “shock-loading”, the rapid
loading of synthetic rope, could severely decrease residual strength of the Amsteel-Blue lines

51
Effects of Twist
Strength loss due to line rotation and twist
• Traditional “rope theory” states that twist rapidly decreases strength

52
Line twist

53
Efficiency of a Amsteel Blue RopeTypical Crowley Sample = 3 turns/meter
40.0%
50.0%
60.0%
70.0%
80.0%
90.0%
100.0%
0 2 4 6 8 10 12 14 16
Turns per meter
% R
etai
ned
Stre
ngth
DSM 10mm
SRT 24mm

54Effects of Twist
3-turns per meter5-turns per meter
7-turns per meter

55
TwistTypical Crowley Sample = 1 turns/meter
Normalized to 1” dia = 3 turns/meter
40.0%
50.0%
60.0%
70.0%
80.0%
90.0%
100.0%
0 1 2 3 4 5 6 7 8 9 10
Turns per meter
% R
etai
ned
Stre
ngth
Amsteel 1in dia

56
Conclusions
Line twist–1-1.5 turns/foot equates to a ~15% strength loss
–No data available on effect of twist on fatigue behavior. Study is in progress to understand this effect.

57
Effects of Drum Compression
Deformation of Amsteel-BlueDue to compression
• Compression of Synthetic Fiber ropes cause constructional inefficiencies that could lead to decreased residual breaking strengths

58
Amsteel-Blue deformation

59
Amsteel-Blue

60
Amsteel-Blue

61
Deformation of Amsteel-Blue on winch drum
• HMPE ropes such as 12 strand braided Amsteel-Blue are relatively soft and compliant – This is very good for ergonomics and
high strength– Temporary distortion can be removed
by working the rope

62
Measured strength (burried splice)
65
4
1 -3
At t = 0
Reference 31.500 kg 100 %
At t = 4190 cycles
1. Drum layer 1 24.860 kg 79 %
2. Drum layer 2 24.260 77 %
3. Drum layer 3 26.610 84 %
4. Buried rope 26.750 85 %
5. Horizontal part 31.920 101 %
6. Bending point 30.550 97 %

63
Fatigue

64
Measured strength (fatigue)
Fatigue StudyAt t = 0 Braid (16x1/1760 dtex ) Yarn
Reference 6.300 N 100 % 465 N 100%
At t = 1000 cycles @ 50% breaking strength
1. Drum layer 1 4.915 N 78 % 460 N 99 %
2. Drum layer 5 6.270 99,5 % 440 94,5 %
3. Free end 6,330 100,5 % 450 97 %

65
Cyclic Fatigue
• Testing at NEL Lab Scotland• Control Sample: 5/16” Amsteel Blue w/ 63.4 kN Breaking
Strength• Lifetime Test:
– Load Cycle = 5-75% BL (wet)– Cycle time = 0.5 sec.– Measured lifetime = 426,600 cycles
• Determine Residual Strength at:– 90% Lifetime = ~384,000 cycles– 80% Lifetime = ~341,000 cycles– 30% Lifetime = ~128,000 cycles

66
Cyclic Fatigue• Testing at NEL Lab Scotland
Cyclic fatigue not a major issue up to 80% of lifetime

67
Conclusions
Compression and fatigue on drum–Rope and small braid samples show tohave a 10-15% strength loss due to compression on the drum.
–Rope and do not lose strength after cyclic fatigue/loading

68
Abrasion and Cutting Damage to fiber rope
• Rope contact surfaces aboard tugs were smooth and not promoting cuts –however cutting does occur in client ship’s chocks
• Mechanical damage on test samples was cataloged and analyzed to find a correlation between a percentage loss of rope strength from severity or number of strand and yarn cuts or abraded in the rope

69
Effects of Abrasion
• Pendant (8”circ ASB) analysis
• Two pennants tested: 300 and 1250 jobs
strand
Braiding periodrope
strand

70
Effects of Abrasion
1250 job, fuss but no apparent damage on surface

71
Effects of Abrasion
Cut rope yarns in almost every strand
1250 job

72
Effects of Abrasion
12 %65 %Outside (15 yarns)
21 %42 %
71 %70 %
Averaged (26 yarns)Rope Strength
31 %78 %Middle (9 yarns)
47 %87 %Center (2 yarns)
1250300No of jobs
Rope yarnPosition in strand

73
Conclusions
• 8” Circ. Amsteel Blue– Current retirement practice for both
mainlines and pendants yields an average safety factor of 2.2:1• After 400-500 jobs the residual strength in
the worked end has decreased from a safety factor of 5:1 to an average of 2.2:1
• After 500 jobs there is no further decrease up to 1700 jobs

74
Academic Conclusions• Shock loading
– Not a strong mechanism for the ropes tested.
• Line twist during application– High twist levels adversely effect the residual strength and should be
avoided
• Compression of rope on the winch drum– From Lab experiment data: 10 ~15% strength reduction tested when
compressed.– From Actual sample data: Decrease observed in un-worked (mid-
section) samples, unable to quantify the effects once worked (ends).
• Cyclic Fatigue– Not a strong mechanism for the ropes tested
• Abrasion and cutting damage – Abrasion –Major mechanism in strength reduction

75
Real World Conclusions• OK to retire lines in 2 years• Handle ropes with care – train the people
– avoid cutting– no twist– routine Inspection
• Higher Retained Strength– Increased Volume-Surface Area Ratio
• 8” Circ. Residual strength = 45%• Testing data -
– 9” circ. Residual strength = 50%– 10” circ. Residual Strength = 60%
• However - more weight and still dives on drum– Increased Twist in Strands
• Lower initial strength size-for-size, but higher abrasion resistance

76
Questions & Comments• Cans of worms
• UV?
• Creep?
• Shark biting?
• Melting/fusion?
• Testing induced disturbance? Splicing & handling
• coating degradation?
• longer term to retire – risk management