Embed Size (px)
Citation preview
General rights Copyright and moral rights for the publications made accessible in the public portal are retained by the authors and/or other copyright owners and it is a condition of accessing publications that users recognise and abide by the legal requirements associated with these rights.
Users may download and print one copy of any publication from the public portal for the purpose of private study or research.
You may not further distribute the material or use it for any profit-making activity or commercial gain
You may freely distribute the URL identifying the publication in the public portal If you believe that this document breaches copyright please contact us providing details, and we will remove access to the work immediately and investigate your claim.
Downloaded from orbit.dtu.dk on: Dec 27, 2022
Fatigue behaviors and damage mechanism of a Cr-Mn-N austenitic steel
Lv, Z.; Cai, P.; Yu, Tianbo; Jin, Yi; Zhang, H.; Fu, W.; Zhai, T.
Published in:Journal of Alloys and Compounds
Link to article, DOI:10.1016/j.jallcom.2016.08.228
Publication date:2017
Document VersionPeer reviewed version
Link back to DTU Orbit
Citation (APA):Lv, Z., Cai, P., Yu, T., Jin, Y., Zhang, H., Fu, W., & Zhai, T. (2017). Fatigue behaviors and damage mechanismof a Cr-Mn-N austenitic steel. Journal of Alloys and Compounds, 691, 103-109.https://doi.org/10.1016/j.jallcom.2016.08.228

Fatigue properties and damage mechanism of a Cr-Mn austenite steel
Z.Q. Lv a,d*, P. Caib, T. Yuc, Y. Jinb, H. F. Zhangd, T. Zhaib, W.T. Fua
a State Key Laboratory of Metastable Material Science and Technology, Yanshan University, Qinhuangdao 066004, China.
b Department of Chemical and Materials Engineering, University of Kentucky, Lexington, KY 40513, USA
cDepartment of Wind Energy, Risø Campus, Technical University of Denmark, Roskilde, DK-4000, Denmark
dCollege of Mechanical Engineering, Yanshan University, Qinhuangdao 066004, China
Abstract The fatigue properties and the damage mechanism of a Cr-Mn austenite steel were
investigated using four-point bend fatigue testing. The stress-number of cycles to failure (S-N)
curve of the Cr-Mn austenite steel was measured at room temperature, at the frequency of
f=20 Hz and the stress ratio of R=0.1. The fatigue strength of this Cr-Mn austenite steel was
measured to be 503 MPa in the maximum stress. Multiple cracks are initiated on the sample
surface after fatigue failure tests, and usually only one or two of them can lead to the final
failure of the samples. Most of the cracks are initiated at the {111}<110> primary slip bands,
especially within coarse grains. When a fatigue crack meets a new grain, it adapts to slip
bands in this grain and hardly extends along the foregoing route in the previous grain. A crack
is deflected at a grain boundary by crack plane twisting and tiling on the grain boundary plane,
causing fracture steps on the fracture surface.
Key words: Fatigue strength; slip bands; crack propagation; four-point bend fatigue
1. Introduction
Cr-Mn austenite steels are potential substitutions for the common Cr-Ni austenite steels,
due to lower cost from the low nickel (<5%, or Ni free) content[1,2]. Generally, austenite
stainless steels are metastable, wherein martensite transformation takes place either directly or
indirectly[2-6], even under low cyclic stress [4-6]. In order to enhance the stability of
* Corresponding authors. State key Laboratory of Metastable Material Science and Technology, Yanshan University,
Qinhuangdao 066004, China. E-mail addresses: [email protected] 1

austenite phase and keep the low-cost, nitrogen is added in the steels, which can further
improve the mechanical, chemical and physical properties of these steels [7,8]. Cr-Mn-N
austenite steels with high strength, ductility and toughness are considered as a group of
promising structural materials and biological materials that can be used in many engineering
fields. Recently, the workability, weldability, corrosion resistance and deformation behavior
of these steels were extensively studied [2,7-9]; however the fatigue properties of Cr-Mn-N
austenite steels were rarely reported. While in many engineering applications, fatigue is the
dominant failure mechanism governing the life of a component. The fatigue performance, as
one of the important mechanical indicators of materials, can be investigated using some
fatigue testing methods, such as torsion stress fatigue testing, axial load fatigue testing and
bending fatigue testing. The four-point bend method presents some advantages over the others,
e.g., convenient sample mounting and dismounting, and simple sample geometry. Therefore,
the fatigue damage developed during cyclic loading can be readily monitored and studied.
Using this self-aligning four-point bend testing method, Zhai et al [10-12] have successfully
investigated and characterized the fatigue properties in different Al alloys, including fatigue
crack initiation and early growth, fatigue weak-link (i.e., crack initiation site) density and
strength distribution, and the relation between microstructure and fatigue damage.
In this work, the four-point bend fatigue testes were performed on a Cr-Mn austenite
steel to measure the S-N curve and the density and the strength distribution of fatigue weak
links were then described. Furthermore, the morphology of crack surface was characterized
and the behaviors of initiation and propagation of cracks were discussed.
2. Material and experimental procedure
2.1 Material and samples
The test material (18Mn18Cr0.5N steel) used in this work was melted in a vacuum
induction furnace. After electroslag remelting, its chemical composition was measured to be:
0.09C, 18.70Mn, 18.51Cr, 0.48N, 0.81Si, 0.05V, 0.025P, 0.005S, 0.011Al, and balance Fe in
2

wt.%. After austenitized at 1473 K for 60 min and cooled by water, the specimens were cut
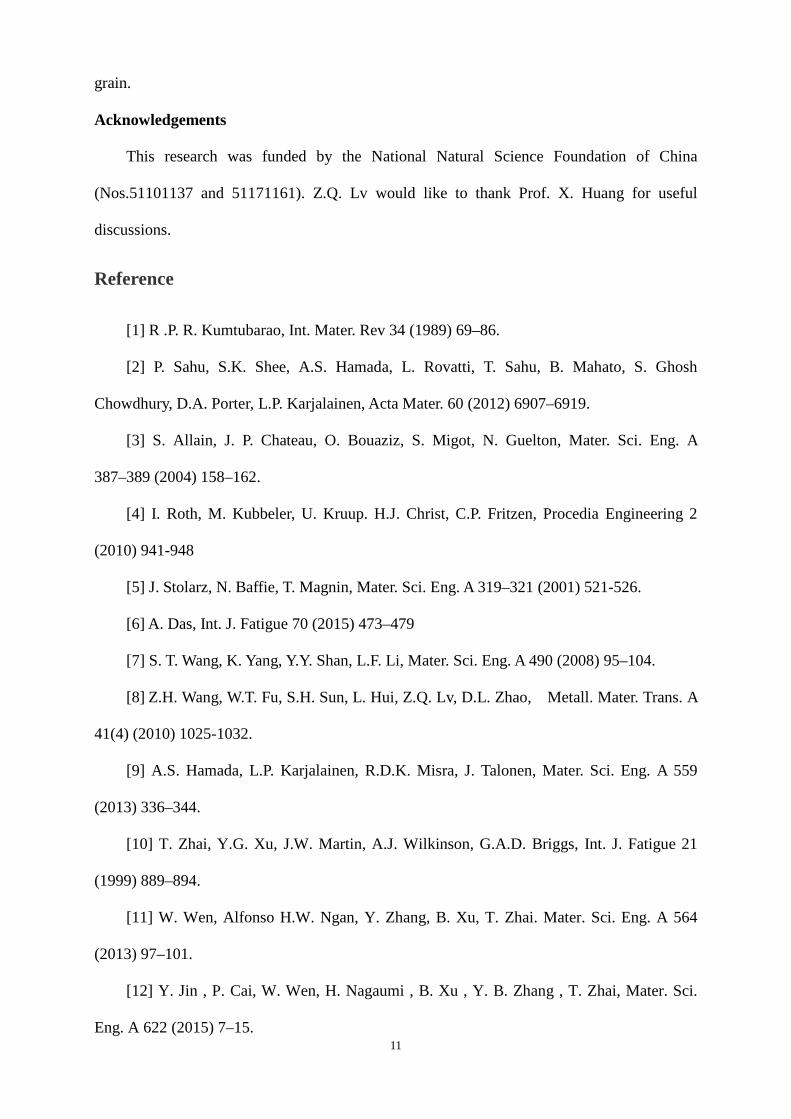
into size of 36.5 ×10 × 4.6 mm3 for four point bend fatigue tests. As shown in Fig. 1, an
average grain size of 102 µm (including twin boundaries) can be observed. Its yield and
ultimate tensile strengths were measured to be 673 and 878 MPa, respectively.
2.2 Fatigue tests
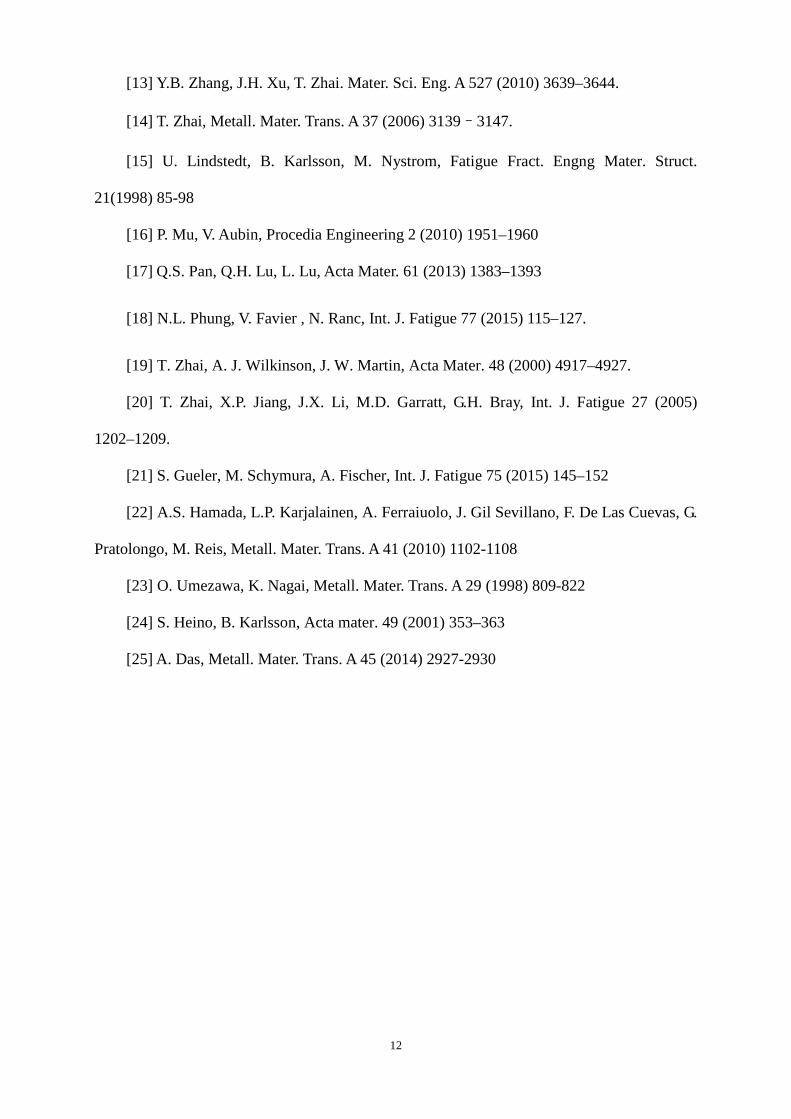
Four-point bend fatigue tests were conducted at room temperature in air, at the stress
ratio of 0.1 and the frequency of 20 Hz, under stress control in a sine wave [10] on an Instron
8802 servo-hydraulic materials testing machine. The run-out number was set to be 5.5×10⁶
cycles for S-N curve measurement. The maximum stress levels used in the fatigue tests were
varied from 105 % to 60 % of the yield strength. The loading state of four-point specimens
and the specimen geometry are shown in Fig.2. The upper surface of the specimen was
subjected to tension. The sample surface was ground and mechanically polished before
fatigue testing.
In order to conveniently observe the morphology of the fatigue cracks, the fatigue tests
were terminated automatically when the sample deflection exceeded a predefined value, 115%
of the maximum deflection amplitude.
2.3 Fatigue crack and fracture surface
The fatigue cracks were characterized by means of optical microscopy (OM), scanning
electron microscopy (SEM) and electron backscatter diffraction (EBSD). SEM analyses were
carried out using a Zeiss Supra-35 SEM, equipped with a field emission gun and an Oxford
Instruments HKL Channel 5 EBSD system. The microscope was operated at 20 kV for both
electron channeling contrast (ECC) imaging and EBSD.
Some of the fatigued specimens were broken in flexural bending by hand along the
dominating crack after crack population observation. The facture surfaces, especially the
crack-initiation sites, were observed in a Zeiss Supra-35 SEM.
3
3. Results and discussions
3.1 S-N curves and crack population
Figure 3 shows the S-N curve of the Cr-Mn austenite steel measured by four-point bend
testing. The fatigue life increased with decreasing stress level, and it showed a linear
relationship between the applied maximum stress and the logarithm of cycles to failure. The
fatigue limit was determined to be 75% yield strength (σs), i.e. 503 MPa.
For those samples subjected under stress level lower than the fatigue limit, slip lines can
be clearly observed on the surfaces, as shown in Fig.4(a), but no crack was found. With
increasing applied stress above the fatigue limit, slip lines became broad, and eventually
fatigue cracks were initiated (Fig. 4(b)). From fig.4(c), multiple cracks were observed on the
surface after the fatigue tests at a stress level over the fatigue limit. Most of the cracks were
initiated from the previous slip lines, especially in coarse grains.
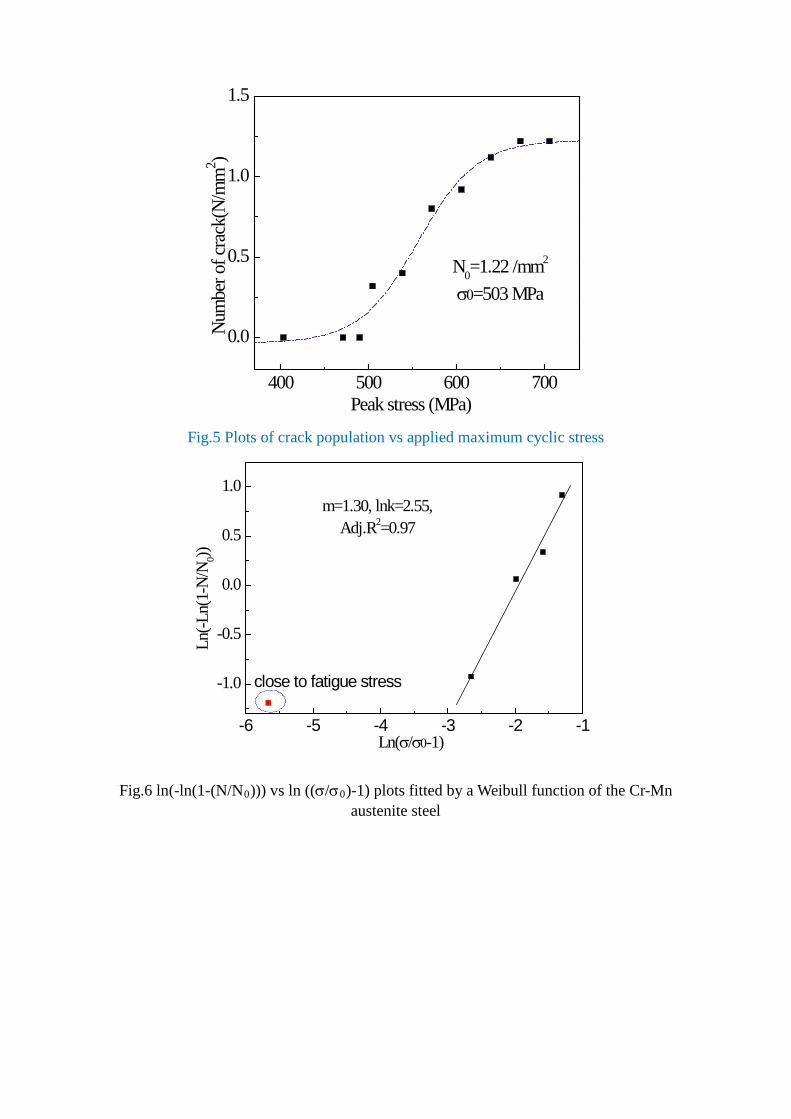
The crack population was subsequently measured from the fatigued samples and plotted
against the applied maximum cyclic stress in the Cr-Mn austenite steel. As shown in fig.5, the
number of cracks increases with the increase of stress level. At those stress levels above the
fatigue limit, there are usually only one or two dominant cracks that lead to the final failure of
samples.
Similar to the analysis done in high strength Al alloys [13,14], the relationship of applied
stress level and total numbers of fatigue cracks on the surface were represented using a
Weibull distribution function for the Cr-Mn austenite steel. In this work, the fitted curve of
crack population vs applied maximum stress is also shown in fig.5. The Weibull function used
in this work is:
]))(exp[1(0
00
mkNNσσσ −
−−= (1)
where N0 is the maximum possible number of cracks per mm2 that can be formed on the
surface, and approximately equals to the crack density observed on the surface in tension
4
(6×10 mm2) at the stress level close to the yield strength (σs), and in the present work,
N0=73/60≈1.22 mm-2; k is a constant; m is the Weibull modulus; and σ0 is the fatigue limit,
σ0=75% σs. The value of k and m could be determined by fitting the crack population vs the
maximum stress level curves using the Weibull function which could be rewritten as :
kmNN ln)1ln())1ln(ln(
00
+−=−−σσ
(2)
The curve in Fig. 5 could be fitted by linear regression method in a ln(-ln(1-N/N0)) vs
ln(σ/σ0-1) plot with m as the slope, as shown in Fig.6. Only the data points of crack
population at relatively higher stress levels were used in the curve fitting, since the data points
close to the fatigue limit were unreliable for the linear curve fitting. The fitting parameters can
be found in Fig.6.
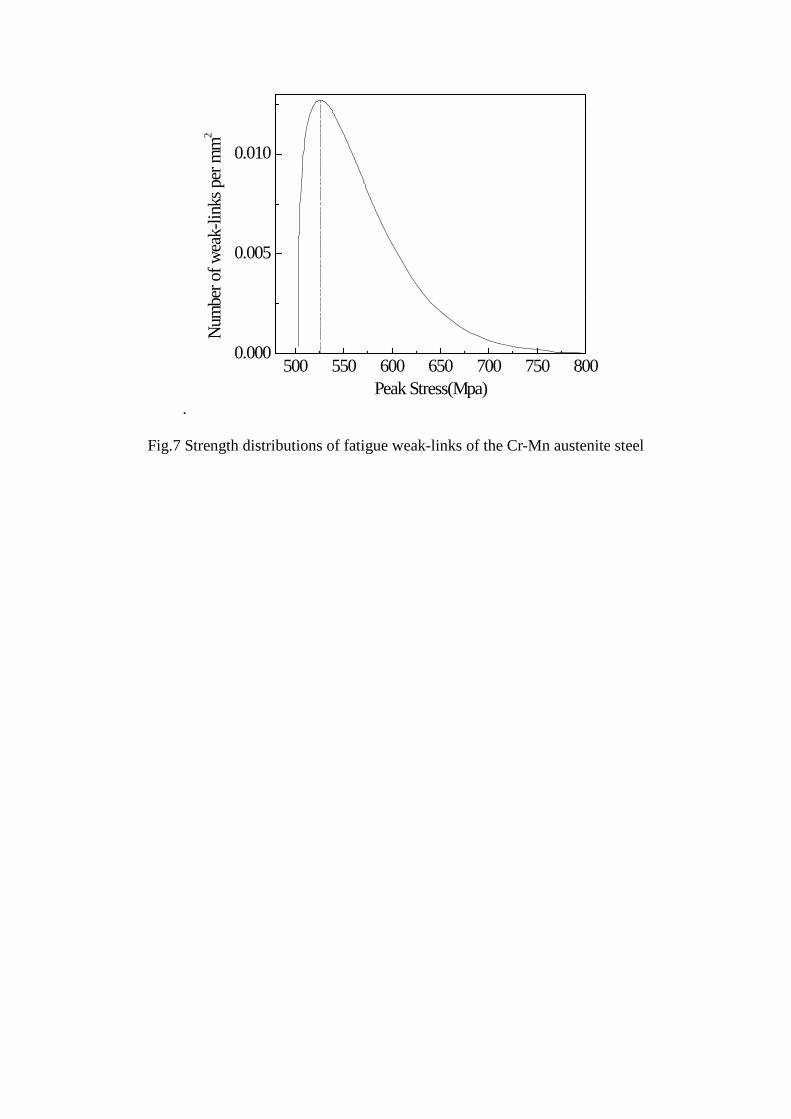
3.2 Strength distribution of fatigue weak links
If a crack is assumed to initiate from one weak link, the crack density value is
approximatively equivalent to fatigue weak link density in the steel. Although these fatigue
cracks were mostly initiated from the previous slip lines, this crack density value was much
smaller than that of the slip lines. In other words, most slip lines in this steel cannot form
fatigue cracks. The fatigue weak link density measured in the present work could be regarded
as the effective weak link density of this steel, which reflects the damage behavior of fatigue
crack initiation in this steel. Consequently, it can be used to evaluate the quality of an alloy in
terms of fatigue crack initiation behaviors.
As depicted in fig.7, the strength distribution of fatigue weak links could also be
determined from the crack population-stress relationship, which was quantified by taking the
derivative of Eq.(1) [12,14]
])(exp[))((0
01
0
0
00
mm kkmCNnσσσ
σσσ
σ−
−−
= − (3)
where
5
∫+∞
=0
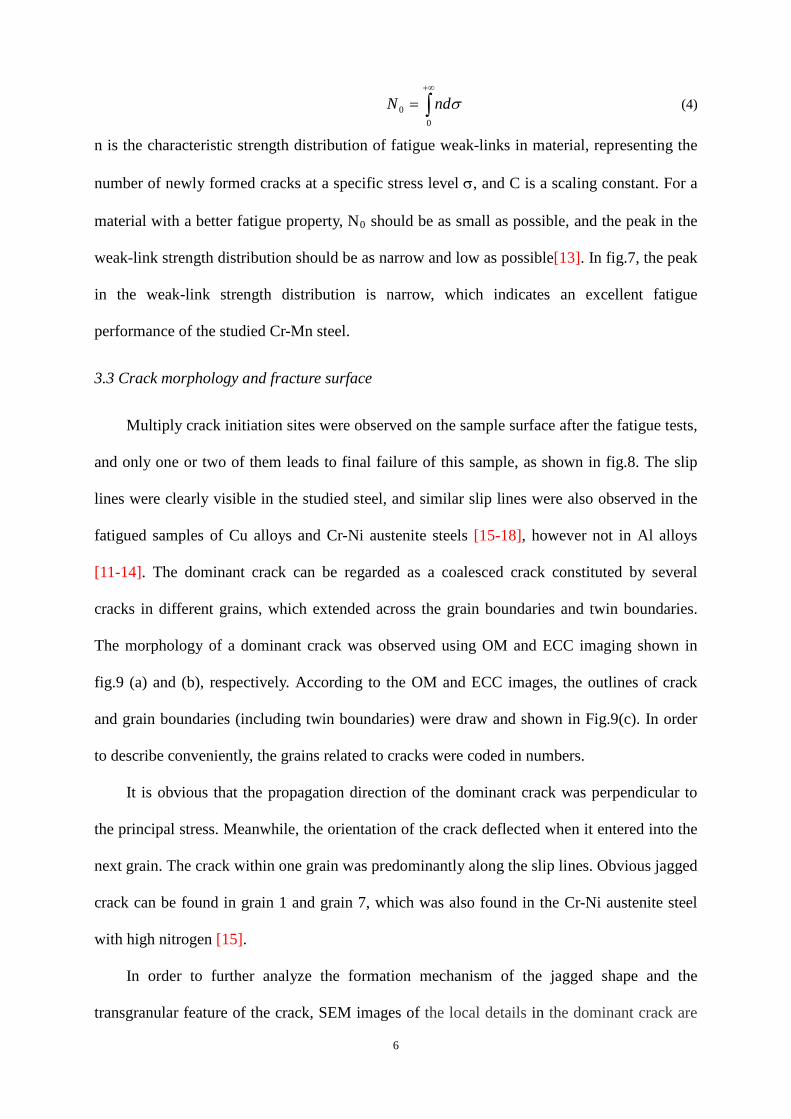
0 σndN (4)
n is the characteristic strength distribution of fatigue weak-links in material, representing the
number of newly formed cracks at a specific stress level σ, and C is a scaling constant. For a
material with a better fatigue property, N0 should be as small as possible, and the peak in the
weak-link strength distribution should be as narrow and low as possible[13]. In fig.7, the peak
in the weak-link strength distribution is narrow, which indicates an excellent fatigue
performance of the studied Cr-Mn steel.
3.3 Crack morphology and fracture surface
Multiply crack initiation sites were observed on the sample surface after the fatigue tests,
and only one or two of them leads to final failure of this sample, as shown in fig.8. The slip
lines were clearly visible in the studied steel, and similar slip lines were also observed in the
fatigued samples of Cu alloys and Cr-Ni austenite steels [15-18], however not in Al alloys
[11-14]. The dominant crack can be regarded as a coalesced crack constituted by several
cracks in different grains, which extended across the grain boundaries and twin boundaries.
The morphology of a dominant crack was observed using OM and ECC imaging shown in
fig.9 (a) and (b), respectively. According to the OM and ECC images, the outlines of crack
and grain boundaries (including twin boundaries) were draw and shown in Fig.9(c). In order
to describe conveniently, the grains related to cracks were coded in numbers.
It is obvious that the propagation direction of the dominant crack was perpendicular to
the principal stress. Meanwhile, the orientation of the crack deflected when it entered into the
next grain. The crack within one grain was predominantly along the slip lines. Obvious jagged
crack can be found in grain 1 and grain 7, which was also found in the Cr-Ni austenite steel
with high nitrogen [15].
In order to further analyze the formation mechanism of the jagged shape and the
transgranular feature of the crack, SEM images of the local details in the dominant crack are
6
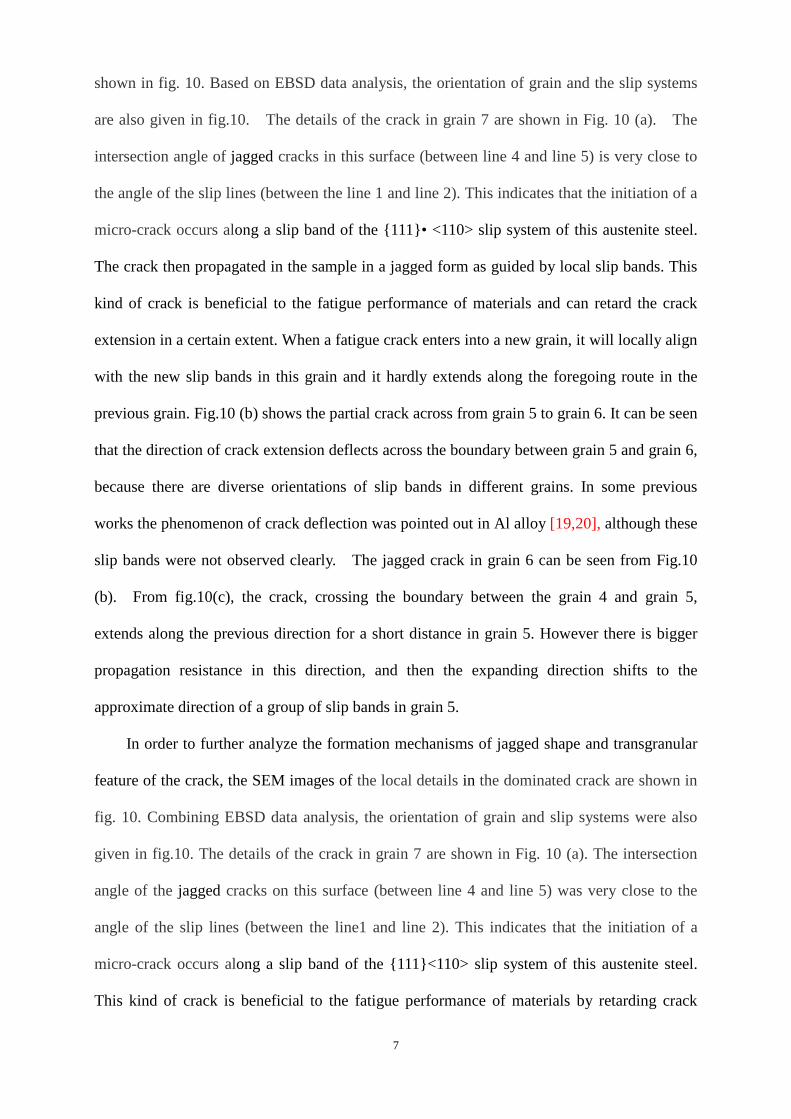
shown in fig. 10. Based on EBSD data analysis, the orientation of grain and the slip systems
are also given in fig.10. The details of the crack in grain 7 are shown in Fig. 10 (a). The
intersection angle of jagged cracks in this surface (between line 4 and line 5) is very close to
the angle of the slip lines (between the line 1 and line 2). This indicates that the initiation of a
micro-crack occurs along a slip band of the {111}• <110> slip system of this austenite steel.
The crack then propagated in the sample in a jagged form as guided by local slip bands. This
kind of crack is beneficial to the fatigue performance of materials and can retard the crack
extension in a certain extent. When a fatigue crack enters into a new grain, it will locally align
with the new slip bands in this grain and it hardly extends along the foregoing route in the
previous grain. Fig.10 (b) shows the partial crack across from grain 5 to grain 6. It can be seen
that the direction of crack extension deflects across the boundary between grain 5 and grain 6,
because there are diverse orientations of slip bands in different grains. In some previous
works the phenomenon of crack deflection was pointed out in Al alloy [19,20], although these
slip bands were not observed clearly. The jagged crack in grain 6 can be seen from Fig.10
(b). From fig.10(c), the crack, crossing the boundary between the grain 4 and grain 5,
extends along the previous direction for a short distance in grain 5. However there is bigger
propagation resistance in this direction, and then the expanding direction shifts to the
approximate direction of a group of slip bands in grain 5.
In order to further analyze the formation mechanisms of jagged shape and transgranular
feature of the crack, the SEM images of the local details in the dominated crack are shown in
fig. 10. Combining EBSD data analysis, the orientation of grain and slip systems were also
given in fig.10. The details of the crack in grain 7 are shown in Fig. 10 (a). The intersection
angle of the jagged cracks on this surface (between line 4 and line 5) was very close to the
angle of the slip lines (between the line1 and line 2). This indicates that the initiation of a
micro-crack occurs along a slip band of the {111}<110> slip system of this austenite steel.
This kind of crack is beneficial to the fatigue performance of materials by retarding crack
7

propagation. The jagged cracks can be regarded as the cracks from intercrossing slip bands
linking together. When a fatigue crack entered next grain, instead of extending along the
foregoing route from previous grain, it preferred to propagate along a new slip bands in this
grain. Fig.10 (b) shows a segment of crack propagated across the grain boundary between
grain 5 to 6. It can be seen that the crack plane deflected at the grain boundary due to the
difference of their slip band orientation. Previous works in the Al alloys have pointed out
similar phenomenon of crack deflection [19,20]. A crystallographic model for fatigue crack
propagation through grain boundaries was established and indicated the key factors (the twist
and tilt angles) controlling the path and growth rate of a short crack [19]. From fig.10(c), the
crack, crossing the boundary between grain 4 and grain 5, extended along the previous
direction for a short distance in grain 5, then the expanding direction shifted to the
approximate direction of a group of slip bands in grain 5.
Fig. 11 shows a typical fracture surface of the Cr-Mn steel after four-point bend fatigue
test. Crack initiation sites, grain boundaries and fracture steps can be observed on the facture
surface, and are marked using arrows in fig.11. From the previous analysis, the initiations of
cracks can be related to the slip planes. Comparing with the both sides of grain boundaries
(red arrows in fig. 11), the deflection of cracks is visible, in agreement with the observations
on the upper surface (see fig. 10). The fracture steps observed on the fracture surface provide
the proof of high resistance to crack growth, according to the crystallographic model of
fracture crack growth [20]. This high resistance to crack propagation may be a main reason
why only one or two dominated cracks exist on the surface, while most of them were arrested
and became non-propagating cracks.
3.4 Discussion
The initiation of the fatigue cracks in Cr-Ni austenite steels, e.g. 304 and 316 steel, was
mainly at twin boundaries[16], slip bands and grain boundaries [4,15] , and the fatigue limit
of 316L steel was 200 MPa (grain size 35 μm) [21]. When the martensitic translation (γ→α') 8
was induced by cyclic strain in a Cr-Ni austenitic steel (Fe-17Cr-13Ni), the nucleation and
propagation of short cracks were found within martensite phases [5]. Fatigue cracks tend to
initiate at grain and annealing twin boundaries in the twinning induced plasticity (TWIP)
steels with high manganese [22]. Umezawa and Nigai [23] suggested that the addition of Mn
(into Cr-Ni-N austenite steel) enhanced grain boundary cracking and provided a weak link in
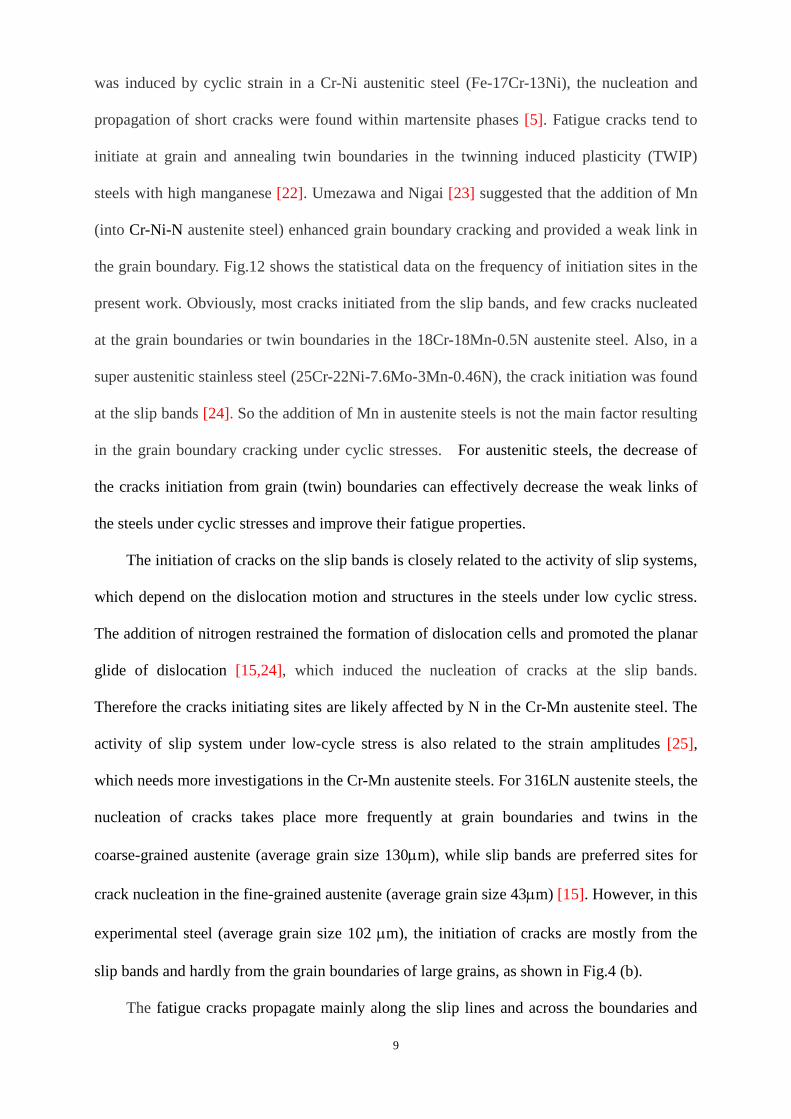
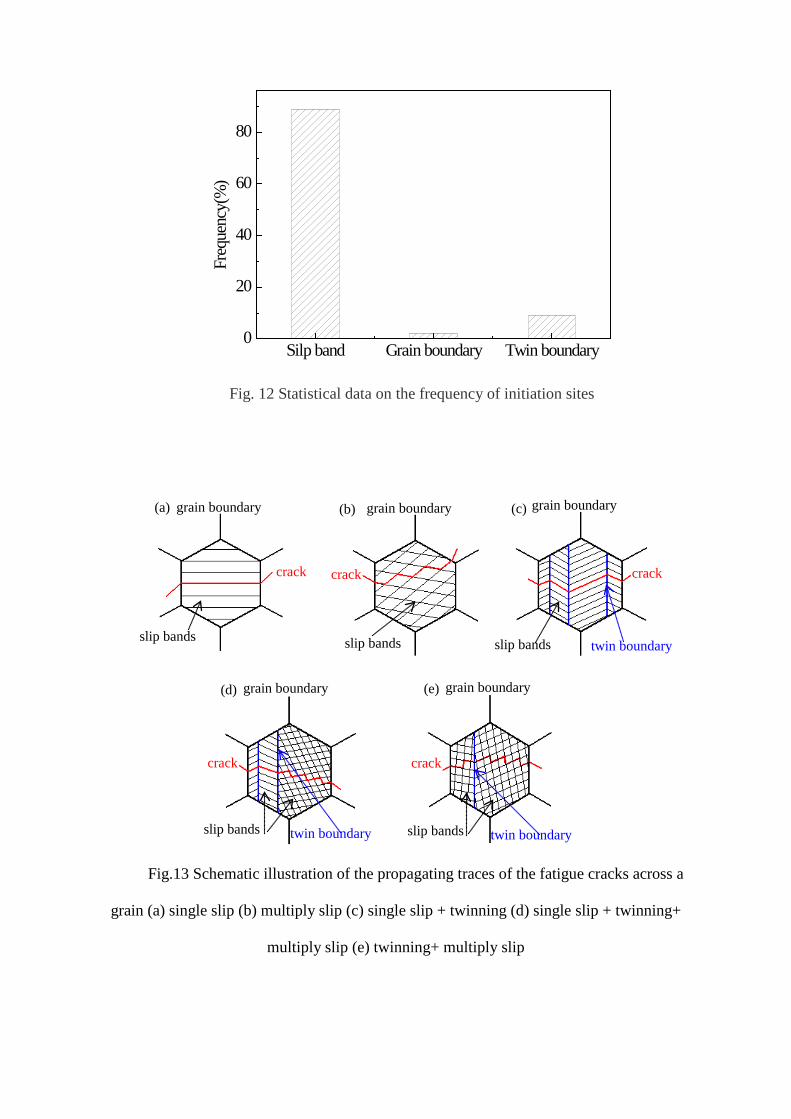
the grain boundary. Fig.12 shows the statistical data on the frequency of initiation sites in the
present work. Obviously, most cracks initiated from the slip bands, and few cracks nucleated
at the grain boundaries or twin boundaries in the 18Cr-18Mn-0.5N austenite steel. Also, in a
super austenitic stainless steel (25Cr-22Ni-7.6Mo-3Mn-0.46N), the crack initiation was found
at the slip bands [24]. So the addition of Mn in austenite steels is not the main factor resulting
in the grain boundary cracking under cyclic stresses. For austenitic steels, the decrease of
the cracks initiation from grain (twin) boundaries can effectively decrease the weak links of
the steels under cyclic stresses and improve their fatigue properties.
The initiation of cracks on the slip bands is closely related to the activity of slip systems,
which depend on the dislocation motion and structures in the steels under low cyclic stress.
The addition of nitrogen restrained the formation of dislocation cells and promoted the planar
glide of dislocation [15,24], which induced the nucleation of cracks at the slip bands.
Therefore the cracks initiating sites are likely affected by N in the Cr-Mn austenite steel. The
activity of slip system under low-cycle stress is also related to the strain amplitudes [25],
which needs more investigations in the Cr-Mn austenite steels. For 316LN austenite steels, the
nucleation of cracks takes place more frequently at grain boundaries and twins in the
coarse-grained austenite (average grain size 130µm), while slip bands are preferred sites for
crack nucleation in the fine-grained austenite (average grain size 43µm) [15]. However, in this
experimental steel (average grain size 102 µm), the initiation of cracks are mostly from the
slip bands and hardly from the grain boundaries of large grains, as shown in Fig.4 (b).
The fatigue cracks propagate mainly along the slip lines and across the boundaries and
9
twin boundaries in the Cr-Mn austenitic steel. The propagating traces of the fatigue cracks are
shown in Fig.13. The crack propagation along a single slip band is easy, as sketched in Fig.
13(a). However, multiply slip activities in this steel were also found, as shown in Fig. 13 (b).
A crack extending along the intercrossing slip bands can lead to a jagged shape, as shown in
Fig.10 (a), which can hinder the extending of the crack. The grain boundaries and twin
boundaries can also retard the extending of the cracks, as shown in Fig.13(c),(d) and (e). In
other words, the increase of the grain boundaries and twin boundaries can enhance the
resistance to the crack propagation. Although the resistance of the grain boundaries and that
of the twin boundaries are not calculated in this work, the difference between them is
probably related to the boundary energy and grain orientation.
For this experimental steel, few cracks initiate from grain boundaries and twin
boundaries, so grain refinement will be an effective method to improve the fatigue properties.
Moreover, promotion of simultaneous activities of multiply slip bands will be another good
method. As indicated in Fig. 13 (d) and (e), the combined action of both twin boundaries and
multiply slips can restrain the extending of cracks more effectively.
4. Conclusions
The fatigue strength of the Cr-Mn austenite steel was measured to be 503 MPa at a
run-out 5.5×10⁶ cycles in four-point fatigue bend. Multiple cracks were observed on the
sample surface after the fatigue failure tests. At each different stress level above the fatigue
limit, there were usually only one or two dominated cracks that can lead to the final failure of
samples. Crack population vs. stress level curve was fitted with a Weibull distribution, from
which the density (N0=1.22 mm-2) and strength distribution (n) of fatigue weak links can be
obtained. Most of the cracks were initiated from the slip bands of the experimental austenite
steel, especially in large grains. When a fatigue crack meets a new grain, it will adapt to the
new slip bands of this grain and hardly extended along the foregoing route in the previous
10
grain.
Acknowledgements
This research was funded by the National Natural Science Foundation of China
(Nos.51101137 and 51171161). Z.Q. Lv would like to thank Prof. X. Huang for useful
discussions.
Reference
[1] R .P. R. Kumtubarao, Int. Mater. Rev 34 (1989) 69–86.
[2] P. Sahu, S.K. Shee, A.S. Hamada, L. Rovatti, T. Sahu, B. Mahato, S. Ghosh
Chowdhury, D.A. Porter, L.P. Karjalainen, Acta Mater. 60 (2012) 6907–6919.
[3] S. Allain, J. P. Chateau, O. Bouaziz, S. Migot, N. Guelton, Mater. Sci. Eng. A
387–389 (2004) 158–162.
[4] I. Roth, M. Kubbeler, U. Kruup. H.J. Christ, C.P. Fritzen, Procedia Engineering 2
(2010) 941-948
[5] J. Stolarz, N. Baffie, T. Magnin, Mater. Sci. Eng. A 319–321 (2001) 521-526.
[6] A. Das, Int. J. Fatigue 70 (2015) 473–479
[7] S. T. Wang, K. Yang, Y.Y. Shan, L.F. Li, Mater. Sci. Eng. A 490 (2008) 95–104.
[8] Z.H. Wang, W.T. Fu, S.H. Sun, L. Hui, Z.Q. Lv, D.L. Zhao, Metall. Mater. Trans. A
41(4) (2010) 1025-1032.
[9] A.S. Hamada, L.P. Karjalainen, R.D.K. Misra, J. Talonen, Mater. Sci. Eng. A 559
(2013) 336–344.
[10] T. Zhai, Y.G. Xu, J.W. Martin, A.J. Wilkinson, G.A.D. Briggs, Int. J. Fatigue 21
(1999) 889–894.
[11] W. Wen, Alfonso H.W. Ngan, Y. Zhang, B. Xu, T. Zhai. Mater. Sci. Eng. A 564
(2013) 97–101.
[12] Y. Jin , P. Cai, W. Wen, H. Nagaumi , B. Xu , Y. B. Zhang , T. Zhai, Mater. Sci.
Eng. A 622 (2015) 7–15. 11
[13] Y.B. Zhang, J.H. Xu, T. Zhai. Mater. Sci. Eng. A 527 (2010) 3639–3644.
[14] T. Zhai, Metall. Mater. Trans. A 37 (2006) 3139–3147.
[15] U. Lindstedt, B. Karlsson, M. Nystrom, Fatigue Fract. Engng Mater. Struct.
21(1998) 85-98
[16] P. Mu, V. Aubin, Procedia Engineering 2 (2010) 1951–1960
[17] Q.S. Pan, Q.H. Lu, L. Lu, Acta Mater. 61 (2013) 1383–1393
[18] N.L. Phung, V. Favier , N. Ranc, Int. J. Fatigue 77 (2015) 115–127.
[19] T. Zhai, A. J. Wilkinson, J. W. Martin, Acta Mater. 48 (2000) 4917–4927.
[20] T. Zhai, X.P. Jiang, J.X. Li, M.D. Garratt, G.H. Bray, Int. J. Fatigue 27 (2005)
1202–1209.
[21] S. Gueler, M. Schymura, A. Fischer, Int. J. Fatigue 75 (2015) 145–152
[22] A.S. Hamada, L.P. Karjalainen, A. Ferraiuolo, J. Gil Sevillano, F. De Las Cuevas, G.
Pratolongo, M. Reis, Metall. Mater. Trans. A 41 (2010) 1102-1108
[23] O. Umezawa, K. Nagai, Metall. Mater. Trans. A 29 (1998) 809-822
[24] S. Heino, B. Karlsson, Acta mater. 49 (2001) 353–363
[25] A. Das, Metall. Mater. Trans. A 45 (2014) 2927-2930
12
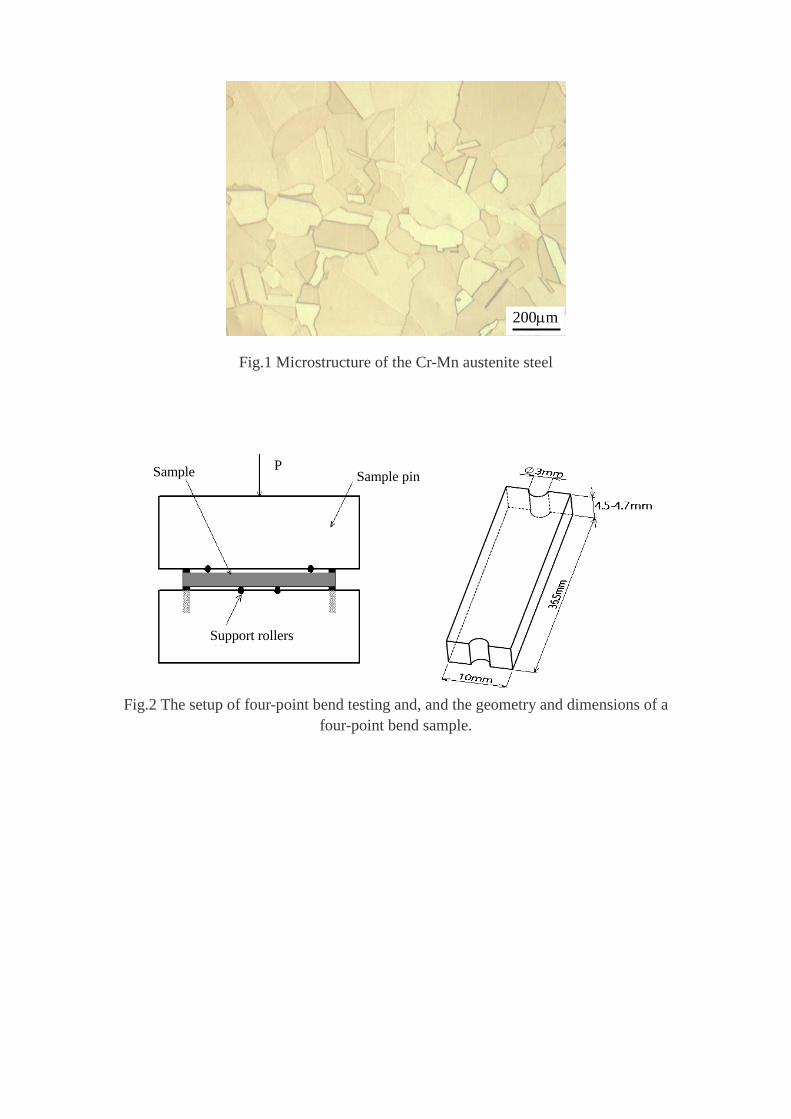
Fig.1 Microstructure of the Cr-Mn austenite steel
Fig.2 The setup of four-point bend testing and, and the geometry and dimensions of a
four-point bend sample.
Sample Sample pin P
Support rollers
200µm
450
500
550
600
650
700
Peak
stre
ss(M
pa)
Number of cycles to failure(log N)105 106 107
Fig 3.S-N curves of the samples of the Cr-Mn austenite steel by four-point bend fatigue
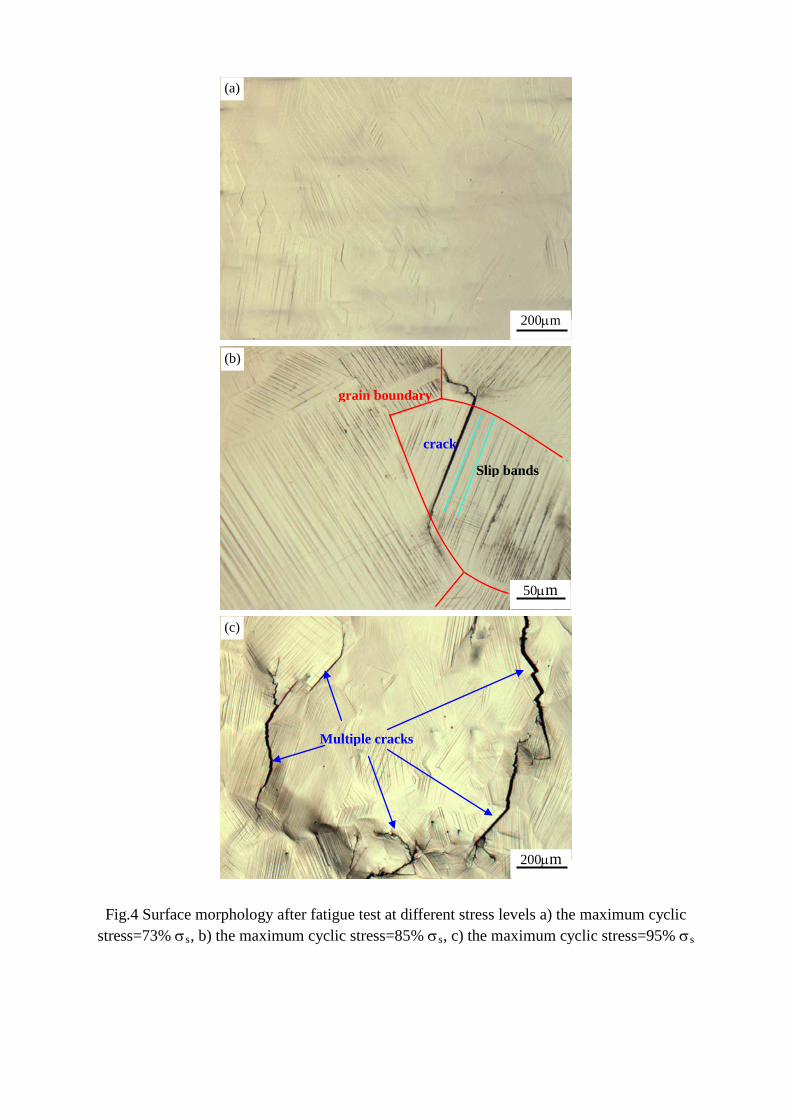
Fig.4 Surface morphology after fatigue test at different stress levels a) the maximum cyclic stress=73% σs, b) the maximum cyclic stress=85% σs, c) the maximum cyclic stress=95% σs
50µm
crack
Slip bands
(b)
grain boundary
200µm
Multiple cracks
(c)
200µm
(a)
400 500 600 700
0.0
0.5
1.0
1.5
N0=1.22 /mm2
σ0=503 MPa
Num
ber o
f cra
ck(N
/mm
2 )
Peak stress (MPa)
Fig.5 Plots of crack population vs applied maximum cyclic stress
-6 -5 -4 -3 -2 -1
-1.0
-0.5
0.0
0.5
1.0m=1.30, lnk=2.55,
Adj.R2=0.97
close to fatigue stress
Ln(-L
n(1-
N/N 0))
Ln(σ/σ0-1)
Fig.6 ln(-ln(1-(N/N0))) vs ln ((σ/σ0)-1) plots fitted by a Weibull function of the Cr-Mn
austenite steel
.
500 550 600 650 700 750 8000.000
0.005
0.010
Num
ber o
f wea
k-lin
ks p
er m
m2
Peak Stress(Mpa)
Fig.7 Strength distributions of fatigue weak-links of the Cr-Mn austenite steel
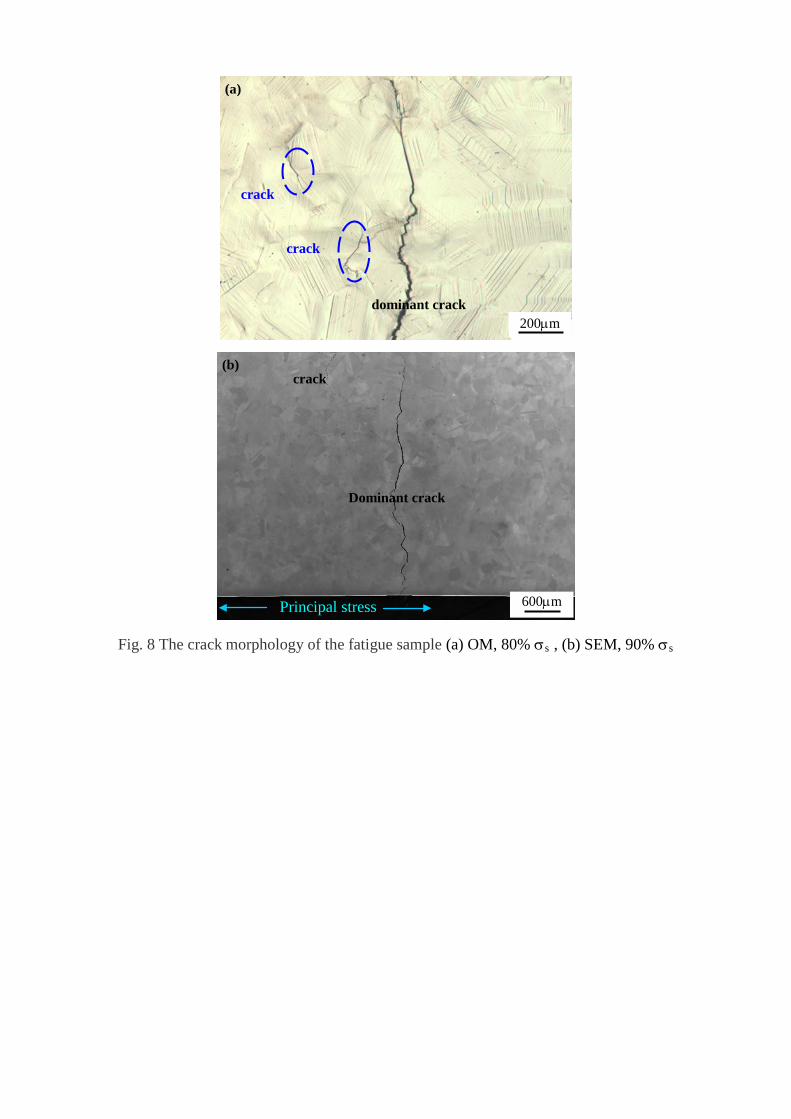
Fig. 8 The crack morphology of the fatigue sample (a) OM, 80% σs , (b) SEM, 90% σs
600µm
(b)
Principal stress
Dominant crack
crack
200µm dominant crack
crack
crack
(a)
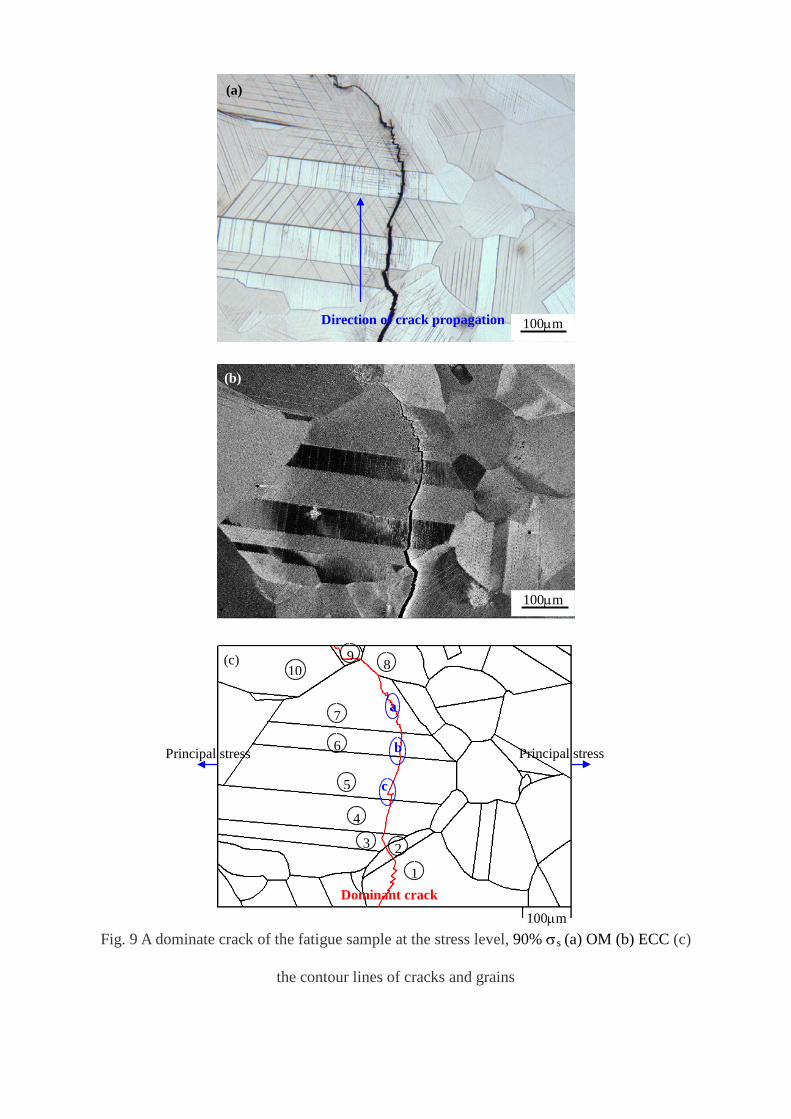
Fig. 9 A dominate crack of the fatigue sample at the stress level, 90% σs (a) OM (b) ECC (c)
the contour lines of cracks and grains
100µm
a
b
1
2 3
4
5
6
7
8 9
Principal stress Principal stress
Dominant crack
(c)
c
10
100µm
(b)
100µm
(a)
Direction of crack propagation

Fig10. SEM of the dominated crack for the local details corresponding to the position a, b and
c in fig.9, respectively
10µm
Slip bands
Twin Boundary
Crack
Slip bands
Normal direction of this face: [2 5 6 ]
Normal direction of this face: [0 1 6]
(c)
grain 5
grain 4
10µm
Slip bands
Twin Boundary
Crack Slip bands
Normal direction of this face: [1 0 6 ]
Normal direction of this face: [2 5 6]
(b)
97.2o
89.4o
grain 6
grain 5
10µm
{1 1 1}• <1 1 0> Slip system
Normal direction of this face: [2 5 6]
67.7o
60.3o
52.0o
60.2o
(a)
line 1 line 2
line 3
line 4
line 5
Jagged crack
grain 7
Principal stress
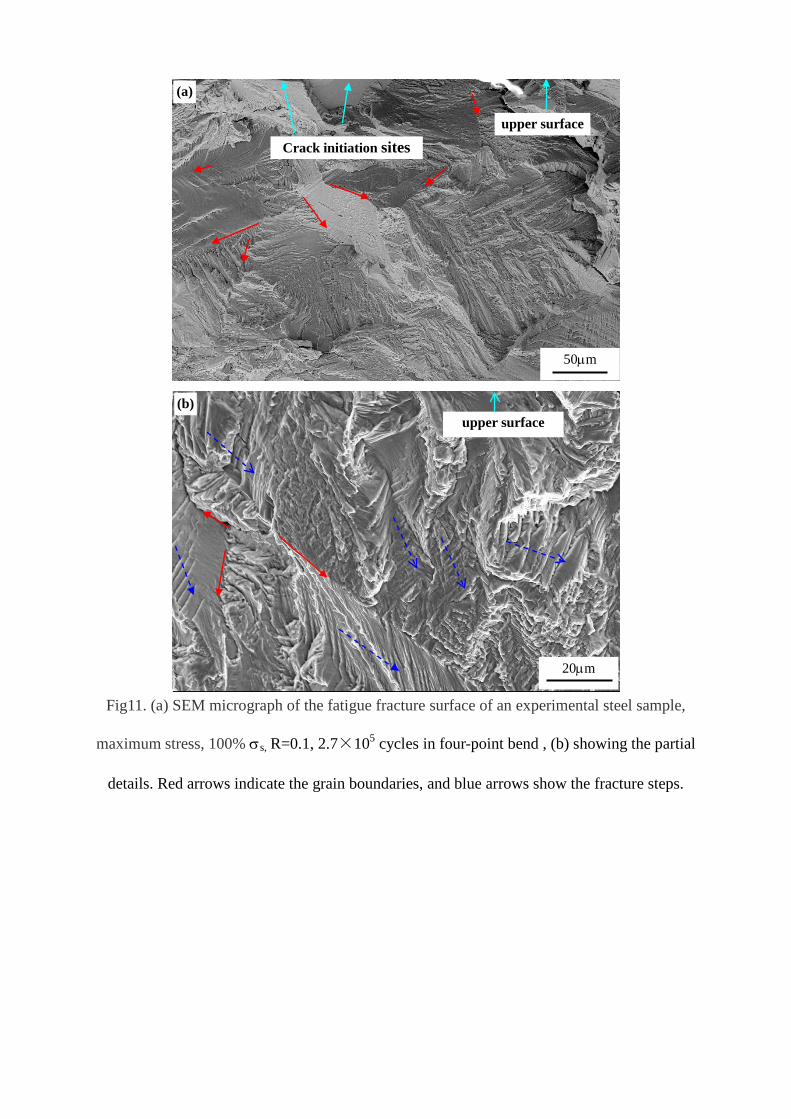
Fig11. (a) SEM micrograph of the fatigue fracture surface of an experimental steel sample,
maximum stress, 100% σs, R=0.1, 2.7×10⁵ cycles in four-point bend , (b) showing the partial
details. Red arrows indicate the grain boundaries, and blue arrows show the fracture steps.
(b)
20µm
upper surface
50µm
(a)
upper surface
Crack initiation sites
Silp band Grain boundary Twin boundary0
20
40
60
80
Freq
uenc
y(%
)
Fig. 12 Statistical data on the frequency of initiation sites
Fig.13 Schematic illustration of the propagating traces of the fatigue cracks across a
grain (a) single slip (b) multiply slip (c) single slip + twinning (d) single slip + twinning+
multiply slip (e) twinning+ multiply slip
crack
grain boundary (e)
slip bands twin boundary
crack
slip bands
grain boundary (a) grain boundary
slip bands
(b)
crack
crack
grain boundary (d)
slip bands twin boundary
grain boundary
crack
slip bands twin boundary
(c)


![An Overview of Elevated Temperature Damage Mechanisms ......the thermomechanical fatigue (TMF) behaviors of the [0 ] and [90 ] systems were examined. Failure and damage mechanisms](https://img.pdfslide.net/doc/110x75/60fb1ad729eeb616044e0de3/an-overview-of-elevated-temperature-damage-mechanisms-the-thermomechanical.jpg)