Embed Size (px)
Citation preview
Advanced Material Lab. in Kyungpook National University
Fatigue Properties of Aluminum Alloy(A6061-T6)with Ultrasonic Nano-crystal Surface Modification
Ri-ichi, Murakami (The Univ. of Tokushima)
Advanced Material Lab. in Kyungpook National University
Contents
1. Introduction
2. Experimental procedure
3. Experimental results & discussion
4. Conclusions
5. Acknowledgments
6. References
Advanced Material Lab. in Kyungpook National University
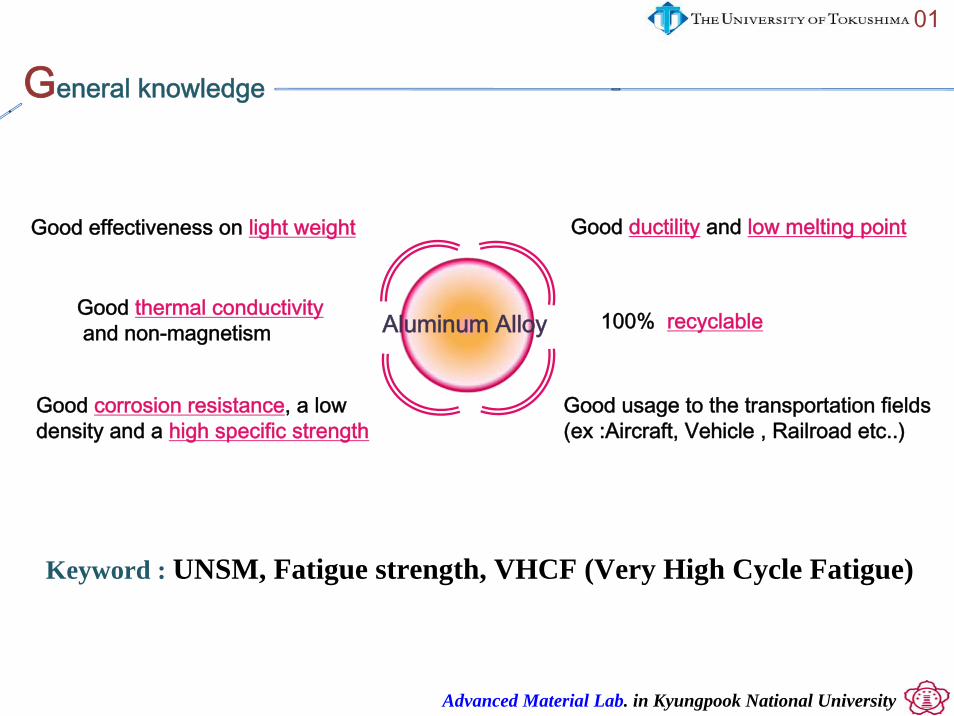
General knowledge
Aluminum Alloy
Good effectiveness on light weight
Good thermal conductivityand non-magnetism
Good usage to the transportation fields (ex :Aircraft, Vehicle , Railroad etc..)
Good corrosion resistance, a low density and a high specific strength
01
100% recyclable
Good ductility and low melting point
Keyword : UNSM, Fatigue strength, VHCF (Very High Cycle Fatigue)
Advanced Material Lab. in Kyungpook National University
Introduction UNSM Technology
02
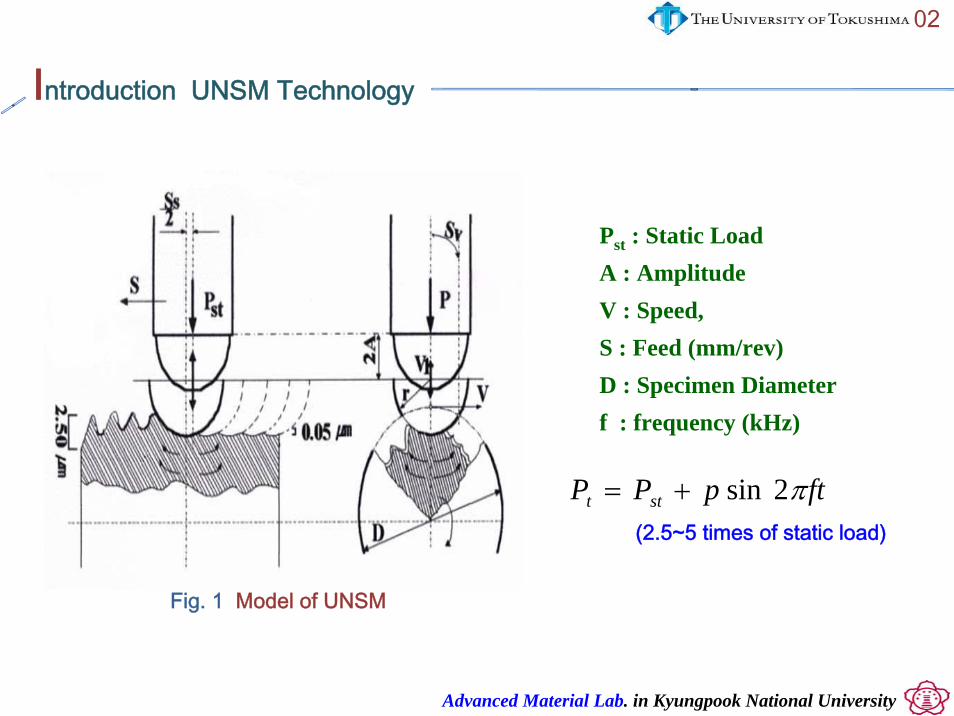
ftpPP stt π2sin+=(2.5~5 times of static load)
Pst : Static Load A : AmplitudeV : Speed, S : Feed (mm/rev)D : Specimen Diameterf : frequency (kHz)
Fig. 1 Model of UNSM
Advanced Material Lab. in Kyungpook National University
UNSM Device
03
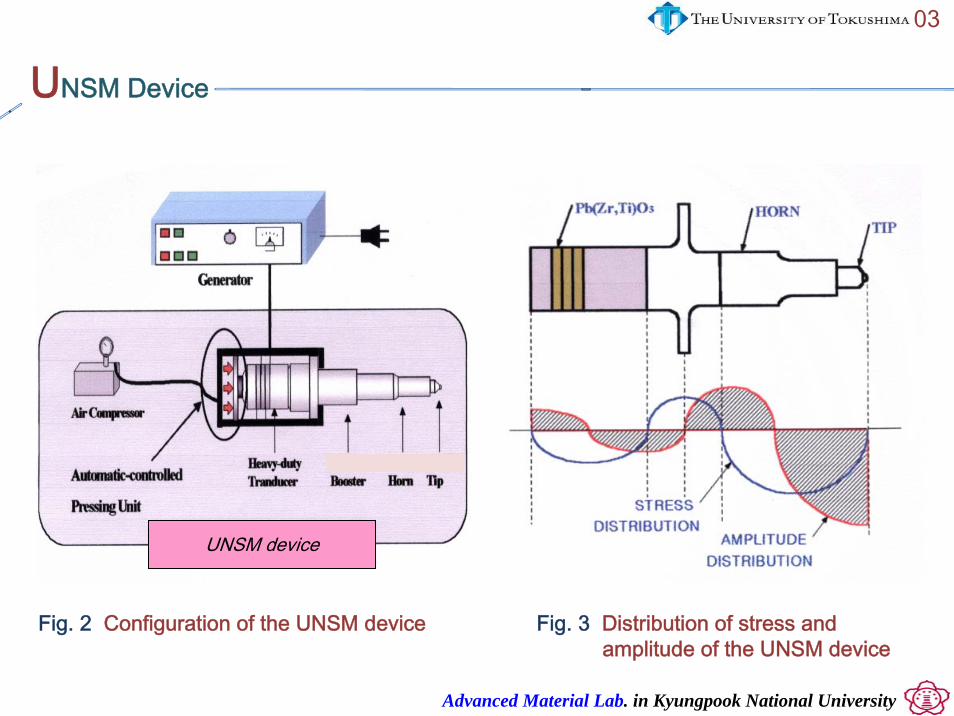
Fig. 2 Configuration of the UNSM device Fig. 3 Distribution of stress and amplitude of the UNSM device
UNSM device
Advanced Material Lab. in Kyungpook National University
Comparison among UNSM and established technologies
04
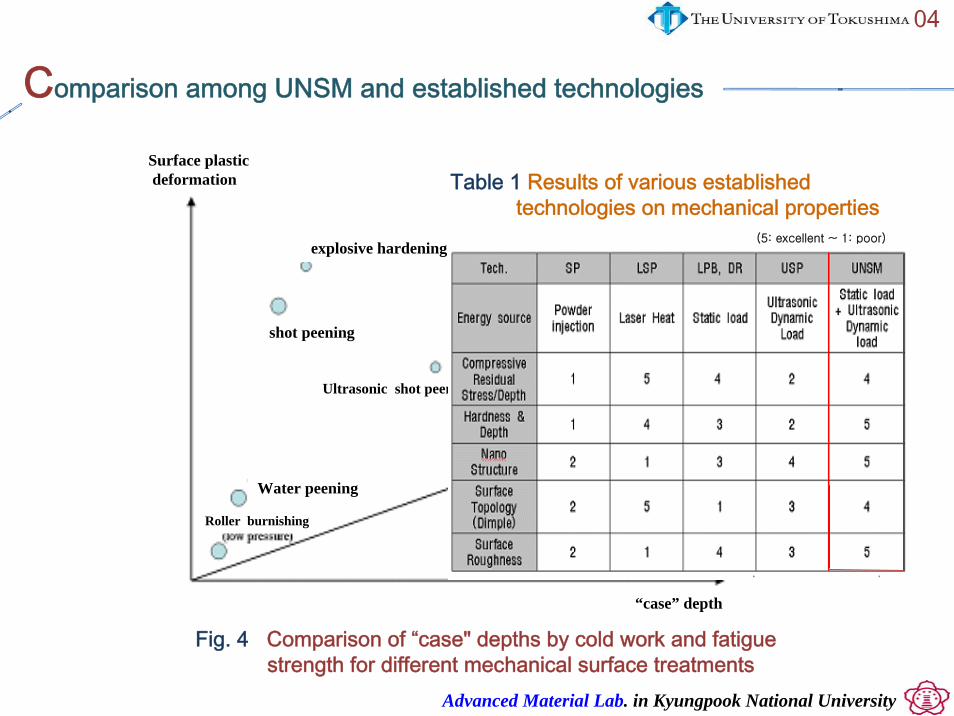
Fig. 4 Comparison of “case" depths by cold work and fatiguestrength for different mechanical surface treatments
Surface plastic deformation
“case” depth
explosive hardening
shot peening
Ultrasonic shot peeningGravity peening
Water peening
Roller burnishing
UNSM
Fatigue strength
Laser shock peening
Deep rolling
Table 1 Results of various established technologies on mechanical properties
(5: excellent ~ 1: poor)
Advanced Material Lab. in Kyungpook National University
Experimental procedure
05
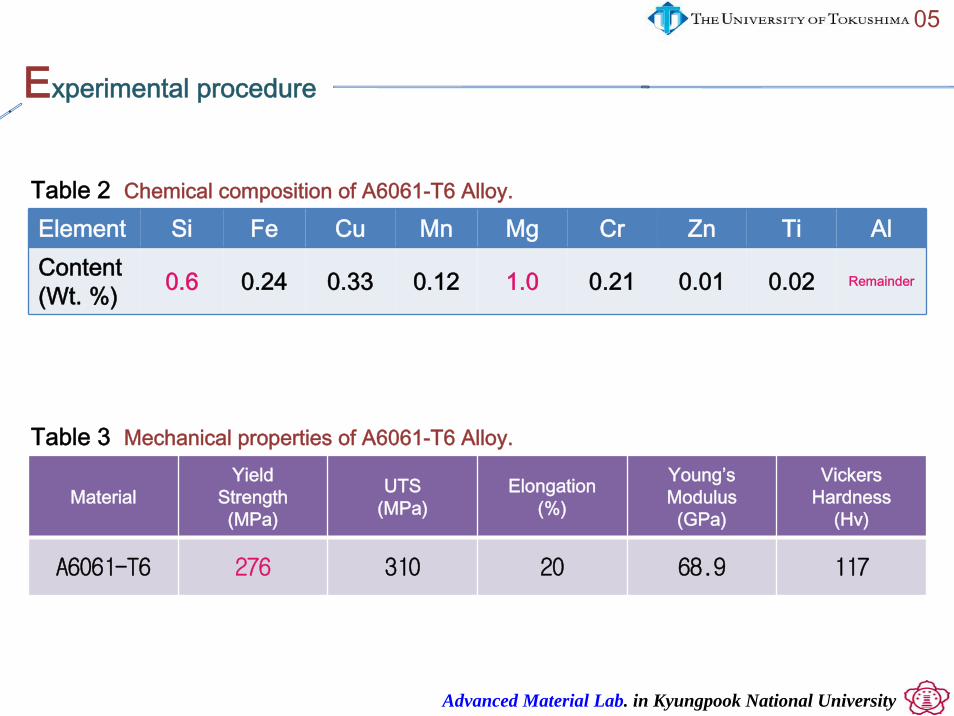
Element Si Fe Cu Mn Mg Cr Zn Ti AlContent(Wt. %) 0.6 0.24 0.33 0.12 1.0 0.21 0.01 0.02 Remainder
Table 2 Chemical composition of A6061-T6 Alloy.
Table 3 Mechanical properties of A6061-T6 Alloy.
MaterialYield
Strength(MPa)
UTS(MPa)
Elongation(%)
Young’sModulus(GPa)
VickersHardness
(Hv)
A6061-T6 276 310 20 68.9 117
Advanced Material Lab. in Kyungpook National University
Experimental procedure
06
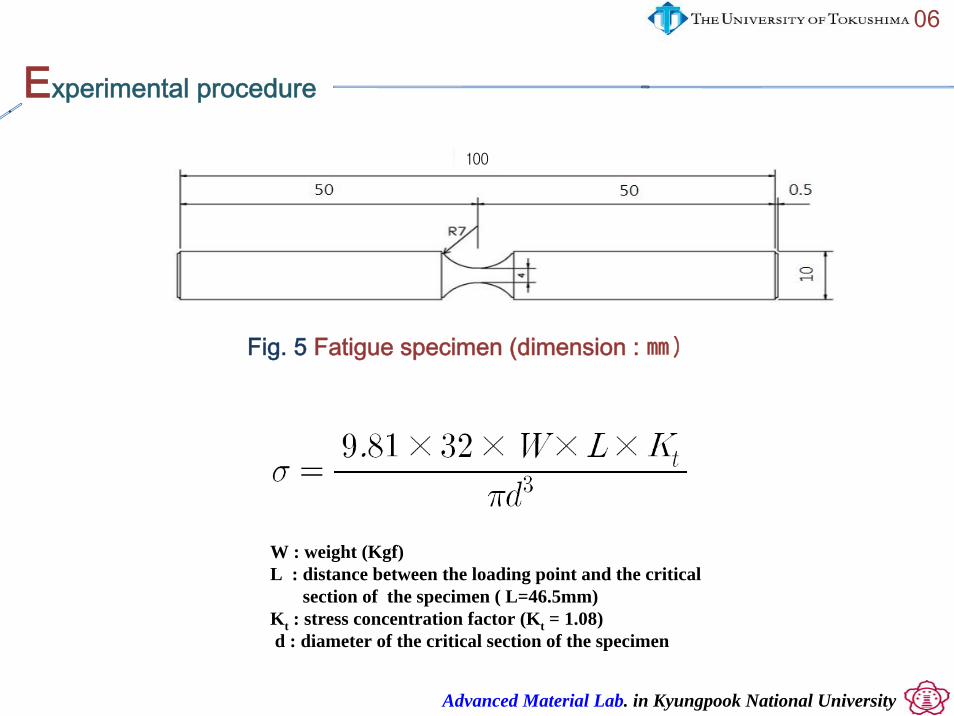
W : weight (Kgf)L : distance between the loading point and the critical
section of the specimen ( L=46.5mm)Kt : stress concentration factor (Kt = 1.08)d : diameter of the critical section of the specimen
Fig. 5 Fatigue specimen (dimension : ㎜)
100
Advanced Material Lab. in Kyungpook National University
07
Experimental procedure
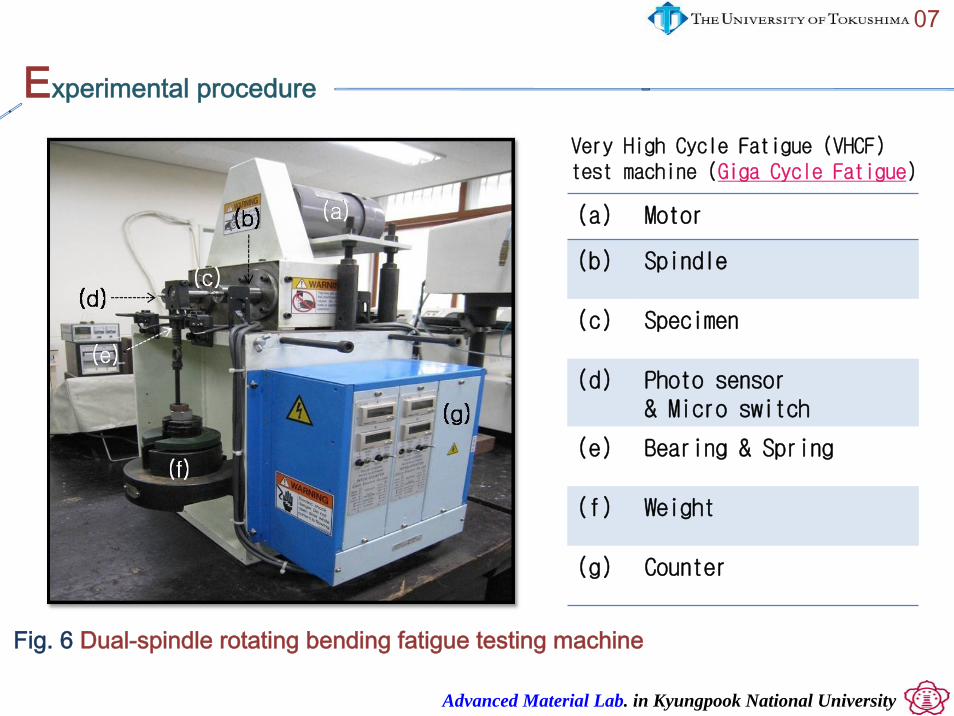
Very High Cycle Fatigue (VHCF) test machine (Giga Cycle Fatigue)
Fig. 6 Dual-spindle rotating bending fatigue testing machine
(a) Motor
(b) Spindle
(c) Specimen
(d) Photo sensor & Micro switch
(e) Bearing & Spring
(f) Weight
(g) Counter
Advanced Material Lab. in Kyungpook National University
Result & Discussion
08
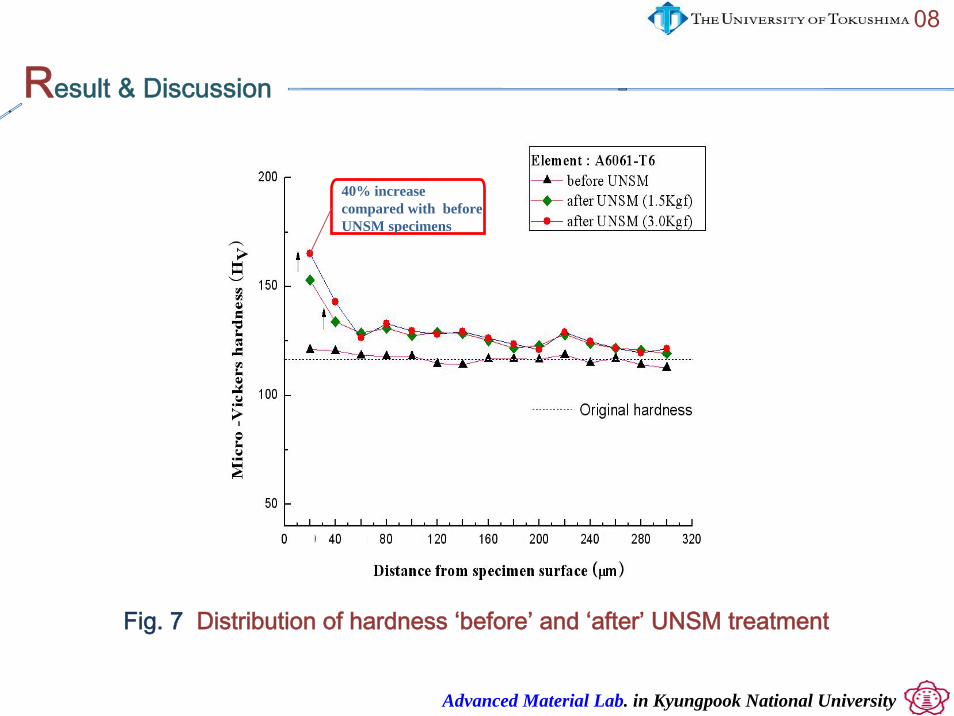
Fig. 7 Distribution of hardness ‘before’ and ‘after’ UNSM treatment
40% increase compared with before UNSM specimens
Advanced Material Lab. in Kyungpook National University
09
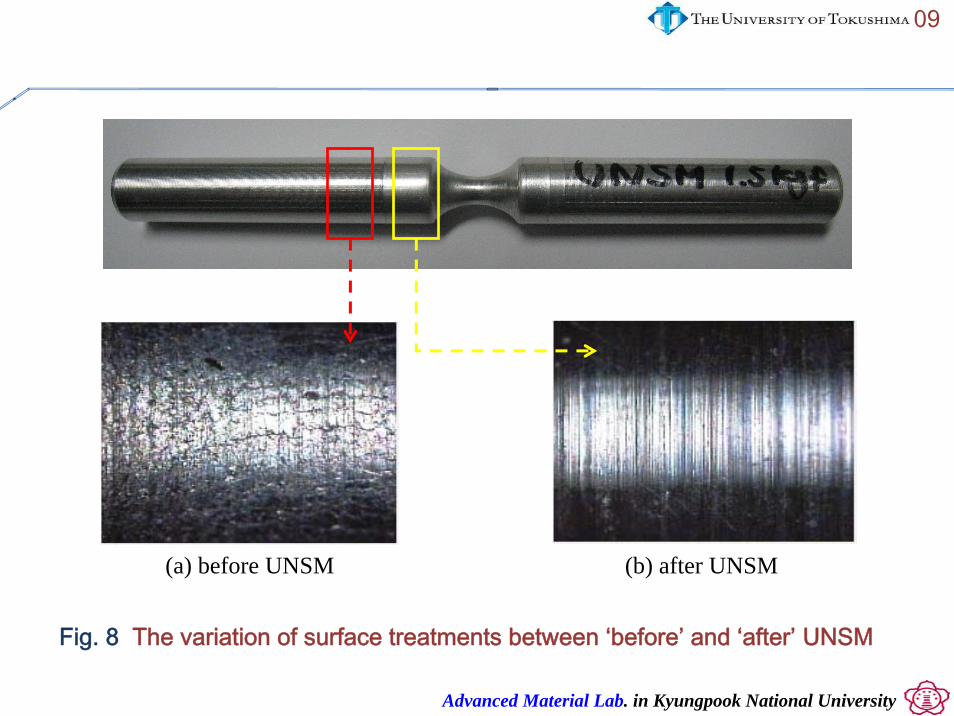
Fig. 8 The variation of surface treatments between ‘before’ and ‘after’ UNSM
(a) before UNSM (b) after UNSM
Advanced Material Lab. in Kyungpook National University
10
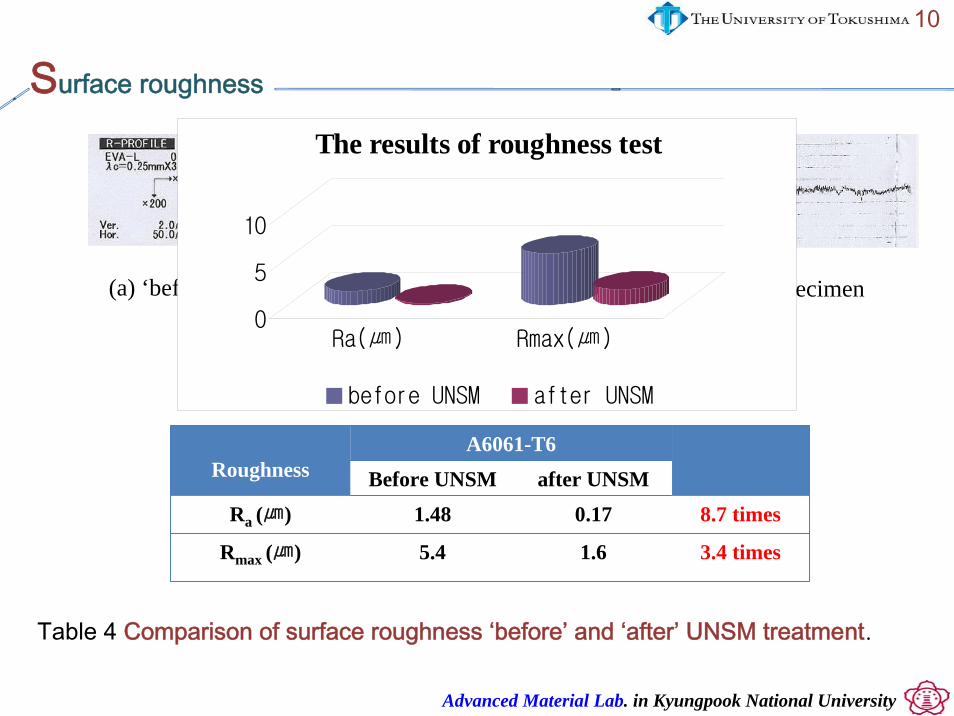
Fig. 9 Profiles of surface roughness test
Surface roughness
(a) ‘before UNSM’ specimen (b) ‘after UNSM’ specimen0
5
10
Ra(㎛) Rmax(㎛)
The results of roughness test
before UNSM after UNSM
A6061-T6Roughness Before UNSM after UNSM
Ra (㎛) 1.48 0.17 8.7 times
Rmax (㎛) 5.4 1.6 3.4 times
Table 4 Comparison of surface roughness ‘before’ and ‘after’ UNSM treatment.
Advanced Material Lab. in Kyungpook National University
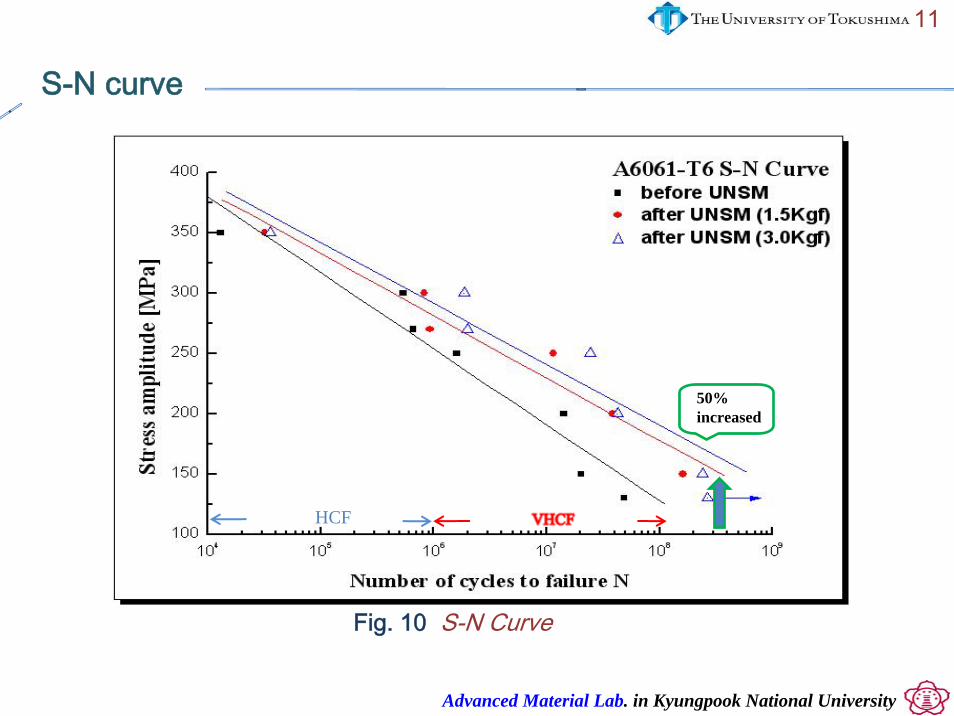
S-N curve
11
Fig. 10 S-N Curve
HCF
50% increased
Advanced Material Lab. in Kyungpook National University
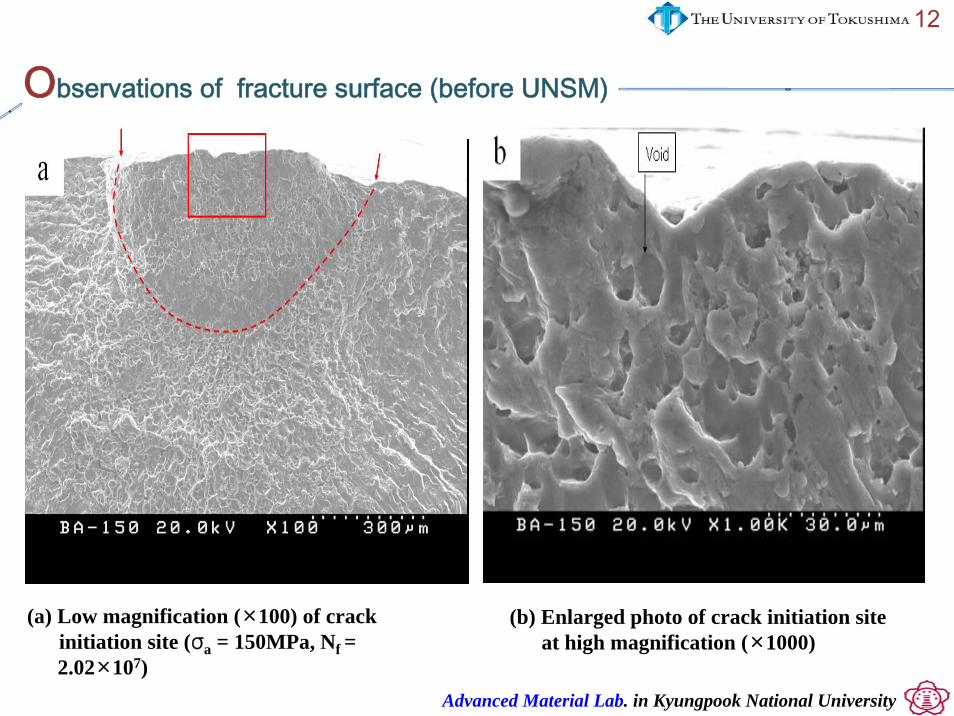
Observations of fracture surface (before UNSM)
12
(a) Low magnification (×100) of crackinitiation site (σa = 150MPa, Nf = 2.02×10⁷)
(b) Enlarged photo of crack initiation site at high magnification (×1000)
Advanced Material Lab. in Kyungpook National University
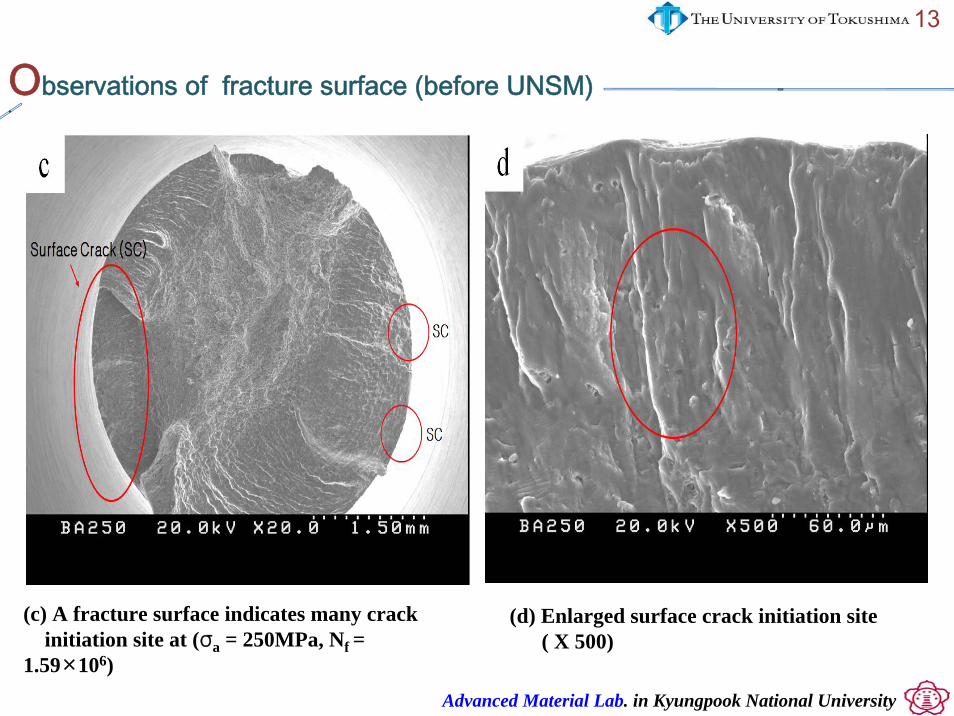
13
(c) A fracture surface indicates many crack initiation site at (σa = 250MPa, Nf =
1.59×10⁶)
(d) Enlarged surface crack initiation site ( X 500)
Observations of fracture surface (before UNSM)
Advanced Material Lab. in Kyungpook National University
14
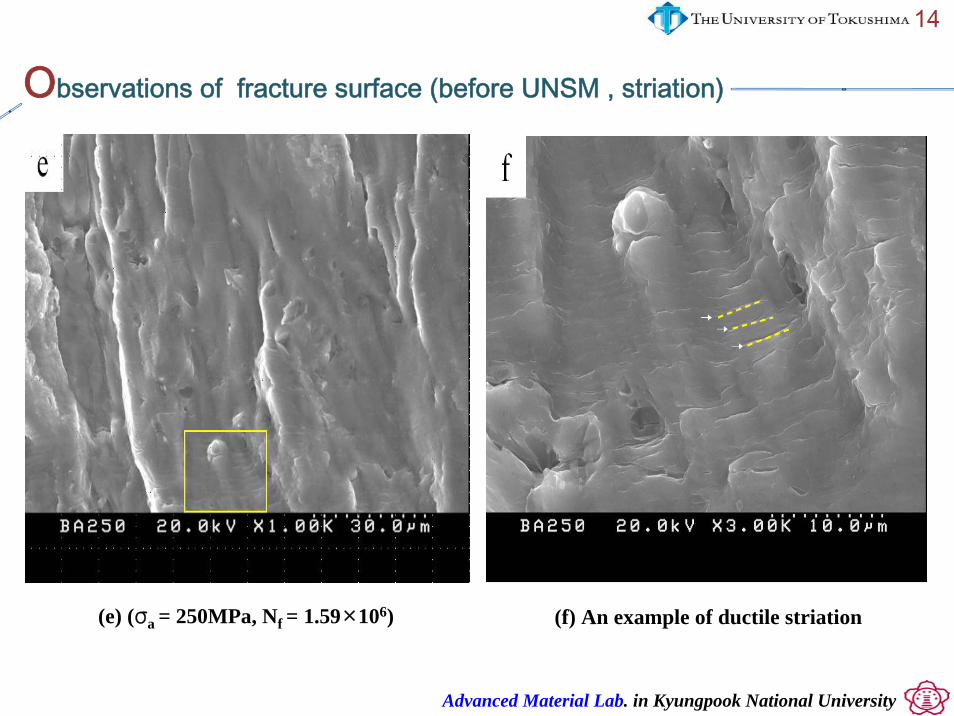
(e) (σa = 250MPa, Nf = 1.59×10⁶) (f) An example of ductile striation
Observations of fracture surface (before UNSM , striation)
Advanced Material Lab. in Kyungpook National University
15
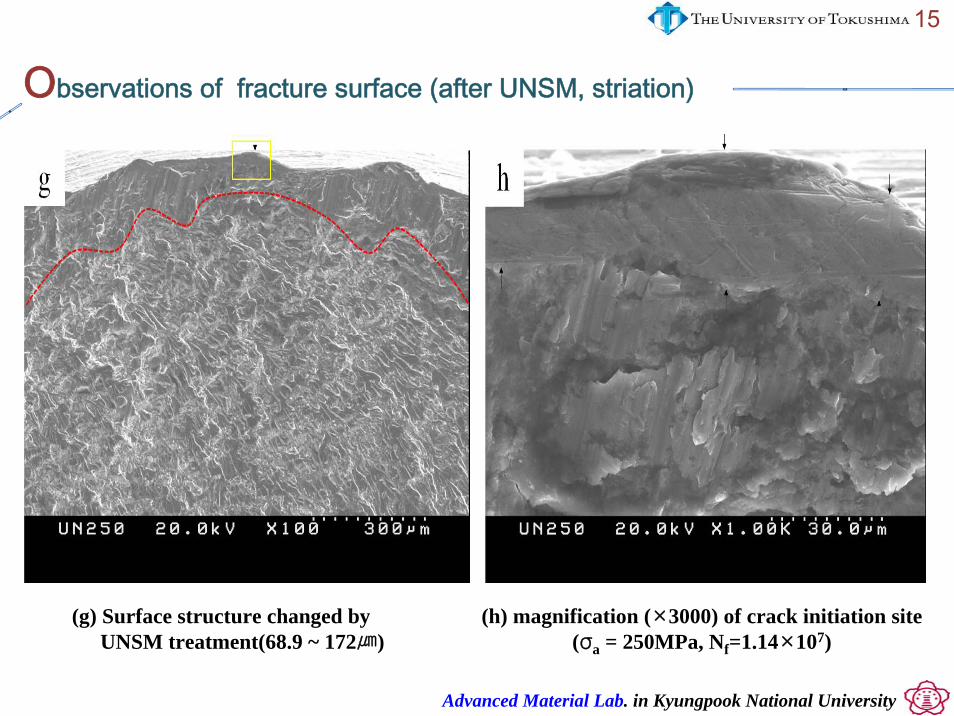
(h) magnification (×3000) of crack initiation site (σa = 250MPa, Nf=1.14×10⁷)
Observations of fracture surface (after UNSM, striation)
(g) Surface structure changed by UNSM treatment(68.9 ~ 172㎛)
Advanced Material Lab. in Kyungpook National University
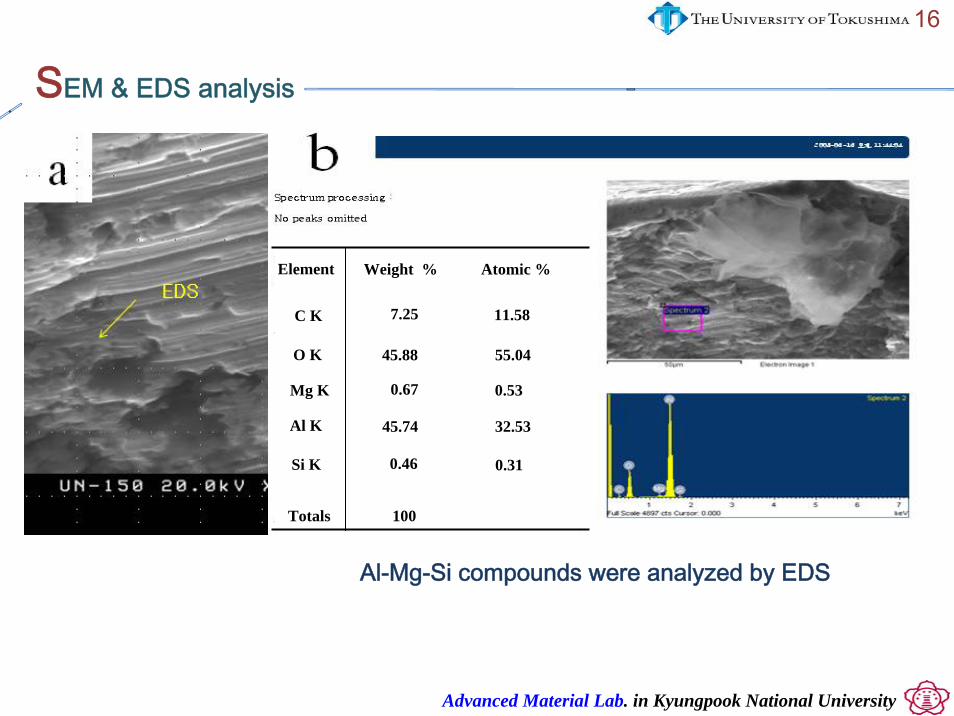
SEM & EDS analysis
16
Al-Mg-Si compounds were analyzed by EDS
Element Weight % Atomic %
Al K
Mg K
O K
C K
Si K
7.25
Totals
11.58
55.0445.88
0.67 0.53
45.74 32.53
0.46 0.31
100
Advanced Material Lab. in Kyungpook National University
17
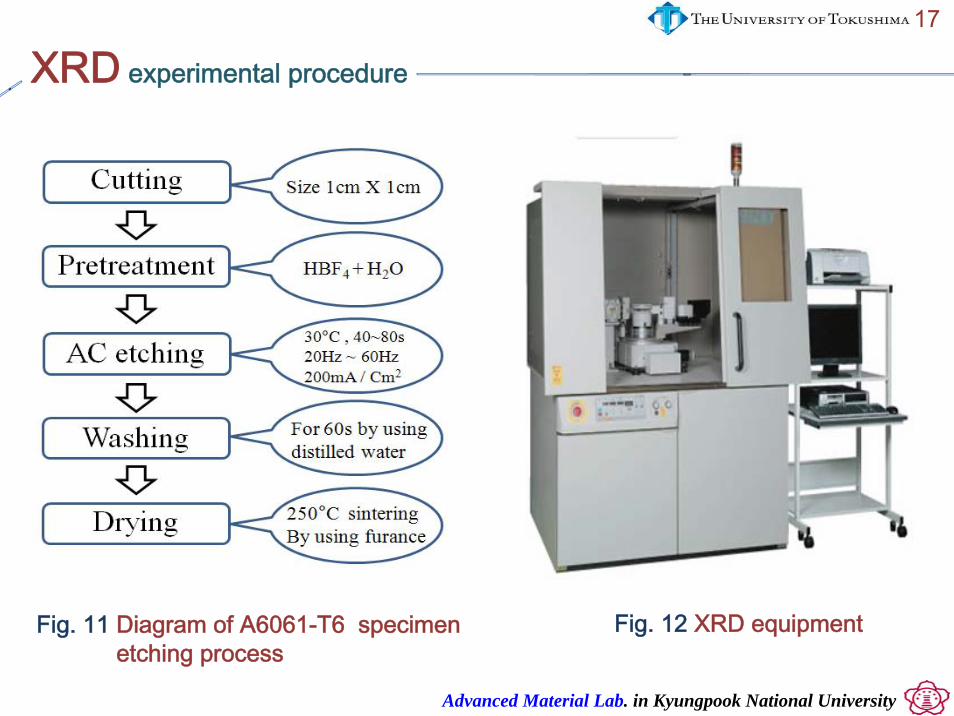
XRD experimental procedure
Fig. 11 Diagram of A6061-T6 specimen etching process
Fig. 12 XRD equipment
Advanced Material Lab. in Kyungpook National University
18
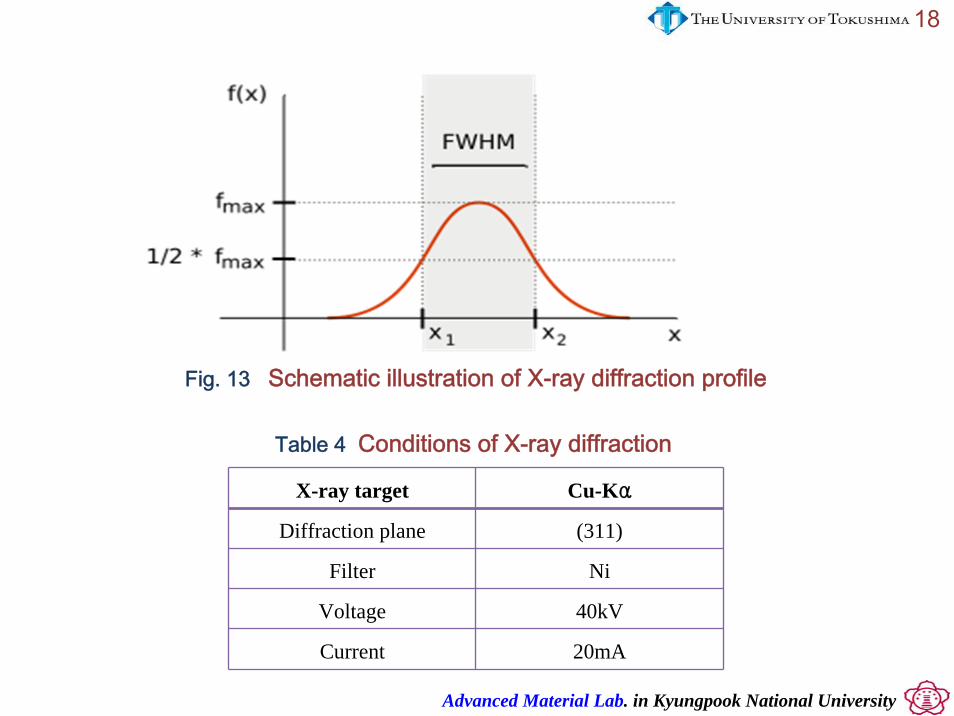
X-ray target Cu-Kα
Diffraction plane (311)
Filter Ni
Voltage 40kV
Current 20mA
Fig. 13 Schematic illustration of X-ray diffraction profile
Table 4 Conditions of X-ray diffraction
Advanced Material Lab. in Kyungpook National University
19
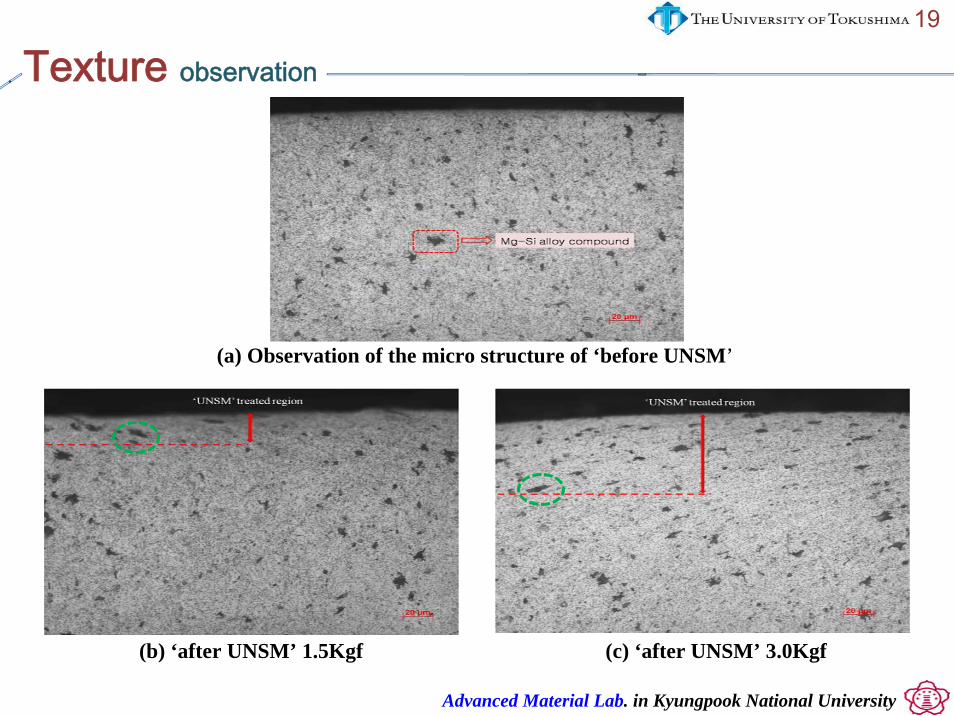
Texture observation
(a) Observation of the micro structure of ‘before UNSM’
(b) ‘after UNSM’ 1.5Kgf (c) ‘after UNSM’ 3.0Kgf
Advanced Material Lab. in Kyungpook National University
20
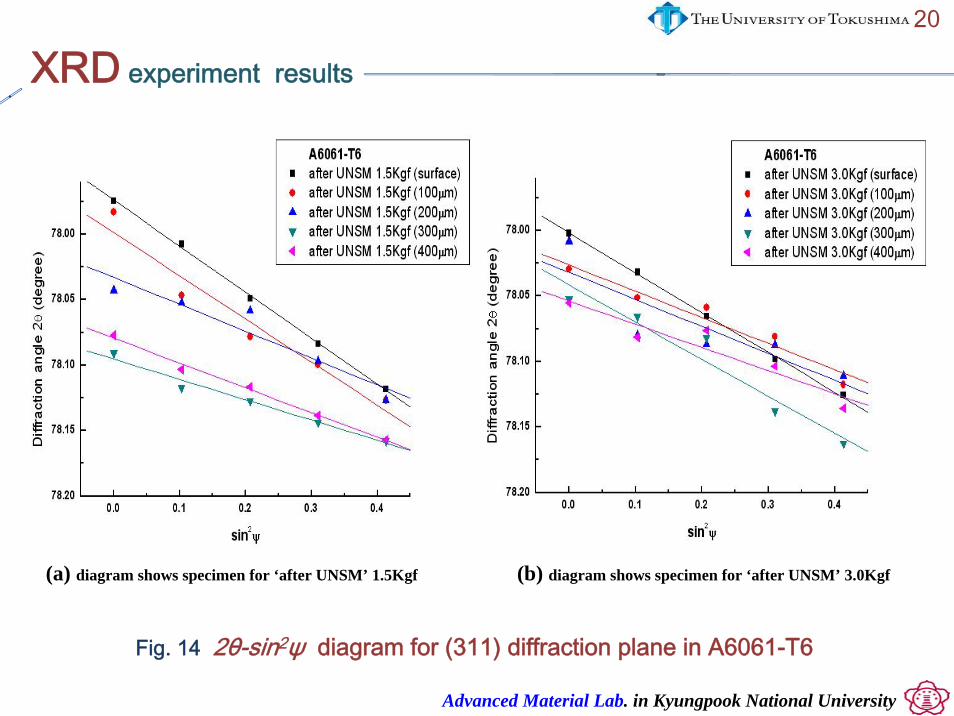
XRD experiment results
(a) diagram shows specimen for ‘after UNSM’ 1.5Kgf (b) diagram shows specimen for ‘after UNSM’ 3.0Kgf
Fig. 14 2θ-sin2ψ diagram for (311) diffraction plane in A6061-T6
Advanced Material Lab. in Kyungpook National University
21
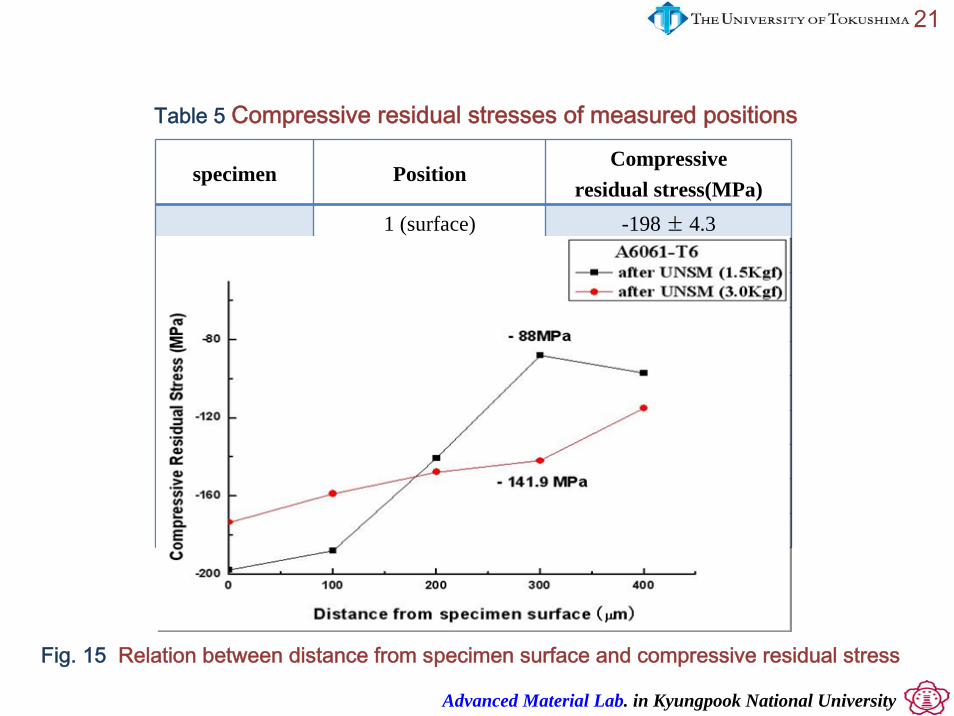
specimen PositionCompressive
residual stress(MPa)1 (surface) -198 ± 4.32 (100μm) -188 ± 3.23 (200μm) -140.6 ± 3.74 (300μm) -88 ± 2.6
after UNSM 1.5Kgf
5 (400μm) -97 ± 6.71 (surface) -173.5 ± 1.92 (100μm) -158.9 ± 3.63 (200μm) -147.7 ± 6.24 (300μm) -141.9 ± 4.7
after UNSM 3.0Kgf
5 (400μm) -115 ± 3.8
Table 5 Compressive residual stresses of measured positions
Fig. 15 Relation between distance from specimen surface and compressive residual stress
Advanced Material Lab. in Kyungpook National University
22
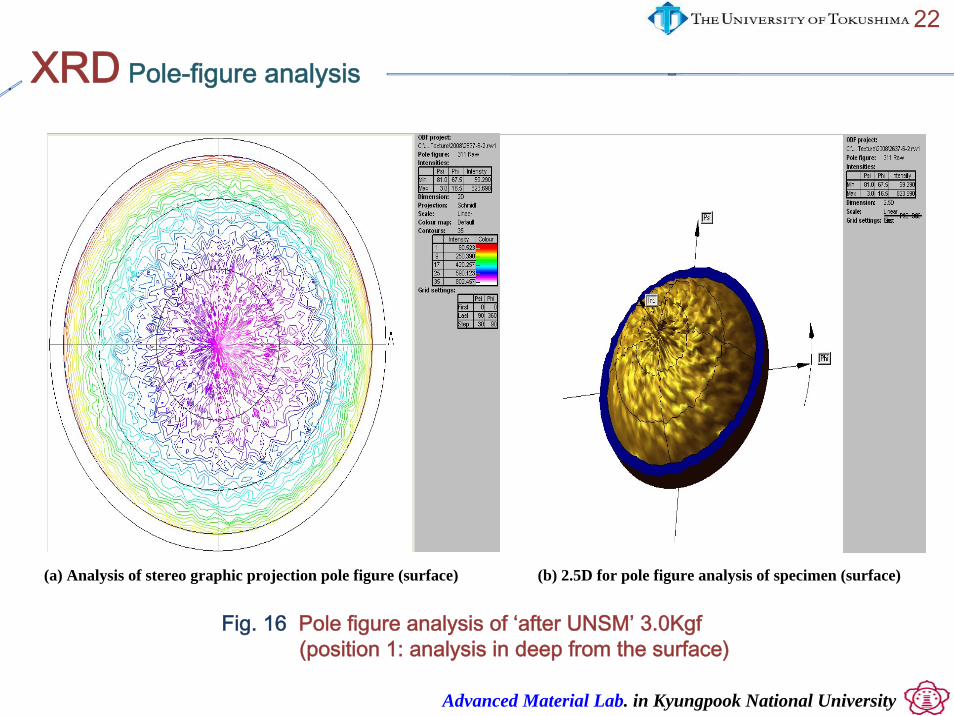
(a) Analysis of stereo graphic projection pole figure (surface) (b) 2.5D for pole figure analysis of specimen (surface)
Fig. 16 Pole figure analysis of ‘after UNSM’ 3.0Kgf (position 1: analysis in deep from the surface)
XRD Pole-figure analysis
Advanced Material Lab. in Kyungpook National University
23
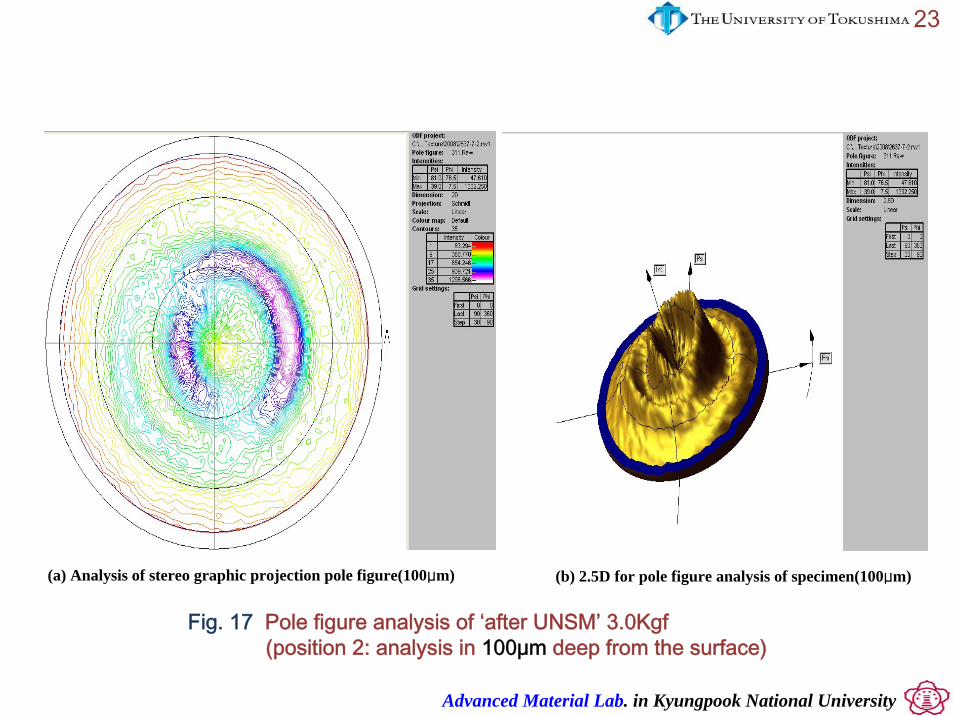
(a) Analysis of stereo graphic projection pole figure(100μm) (b) 2.5D for pole figure analysis of specimen(100μm)
Fig. 17 Pole figure analysis of ‘after UNSM’ 3.0Kgf (position 2: analysis in 100μm deep from the surface)
Advanced Material Lab. in Kyungpook National University
24
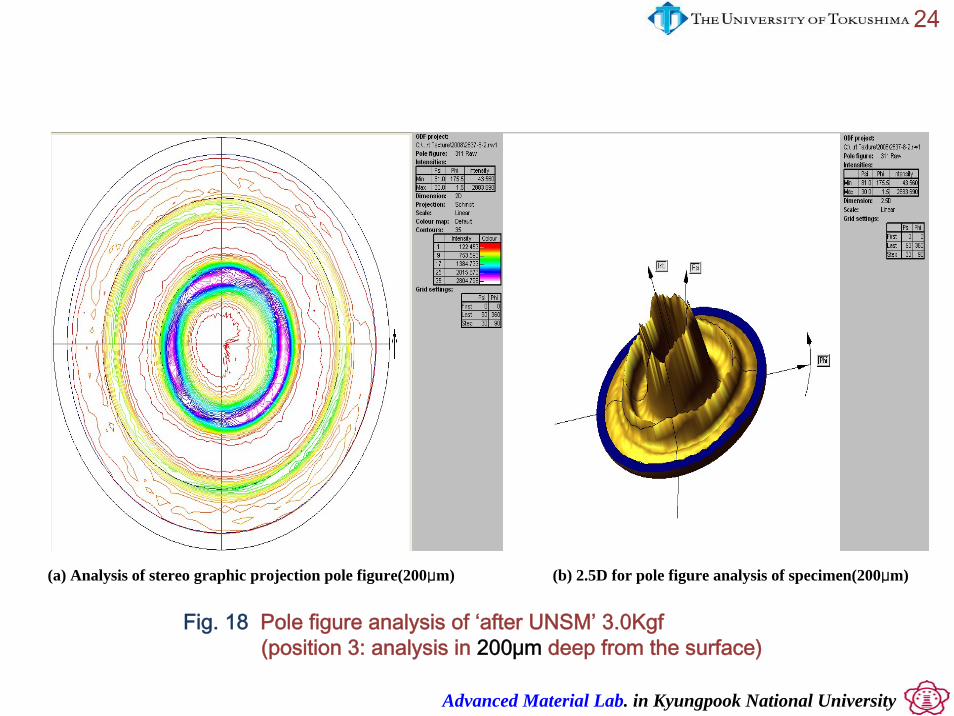
(a) Analysis of stereo graphic projection pole figure(200μm) (b) 2.5D for pole figure analysis of specimen(200μm)
Fig. 18 Pole figure analysis of ‘after UNSM’ 3.0Kgf (position 3: analysis in 200μm deep from the surface)
Advanced Material Lab. in Kyungpook National University
25
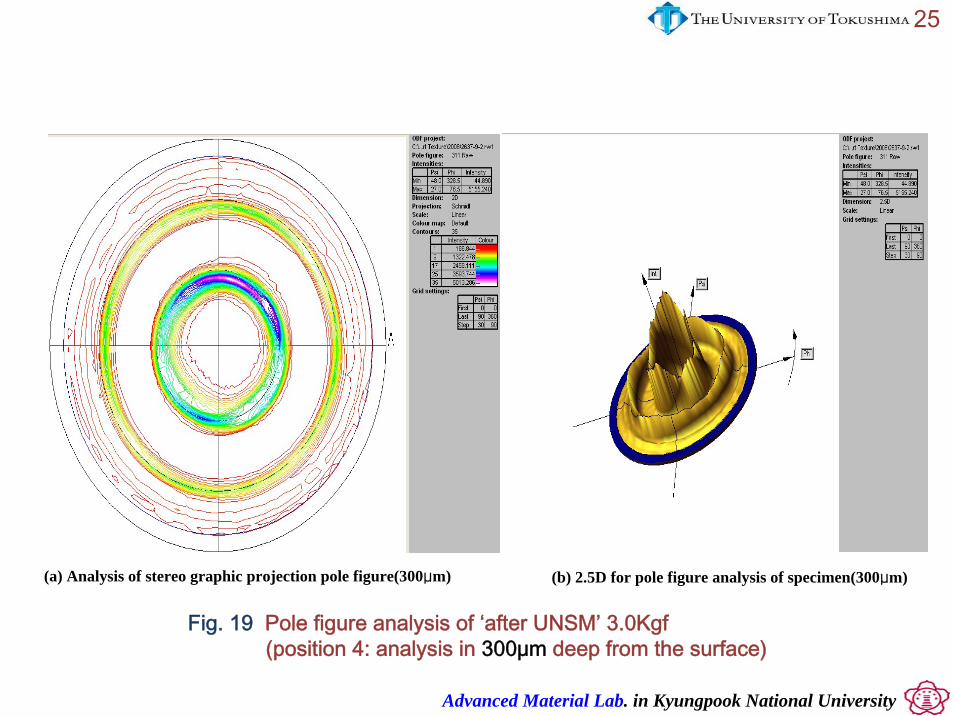
(a) Analysis of stereo graphic projection pole figure(300μm) (b) 2.5D for pole figure analysis of specimen(300μm)
Fig. 19 Pole figure analysis of ‘after UNSM’ 3.0Kgf (position 4: analysis in 300μm deep from the surface)
Advanced Material Lab. in Kyungpook National University
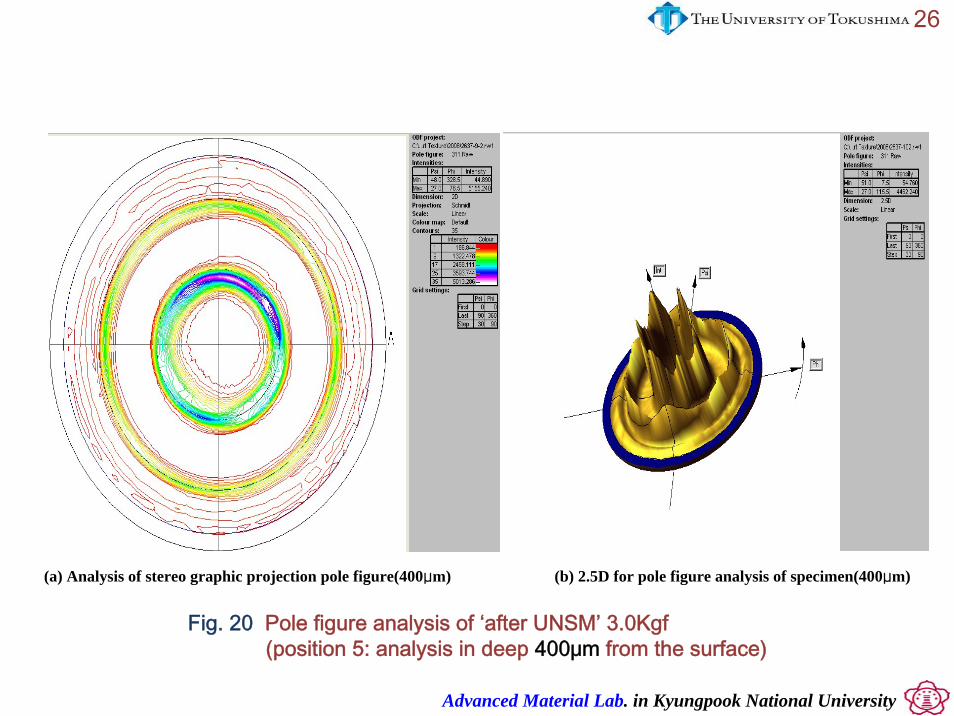
26
(a) Analysis of stereo graphic projection pole figure(400μm) (b) 2.5D for pole figure analysis of specimen(400μm)
Fig. 20 Pole figure analysis of ‘after UNSM’ 3.0Kgf (position 5: analysis in deep 400μm from the surface)
Advanced Material Lab. in Kyungpook National University
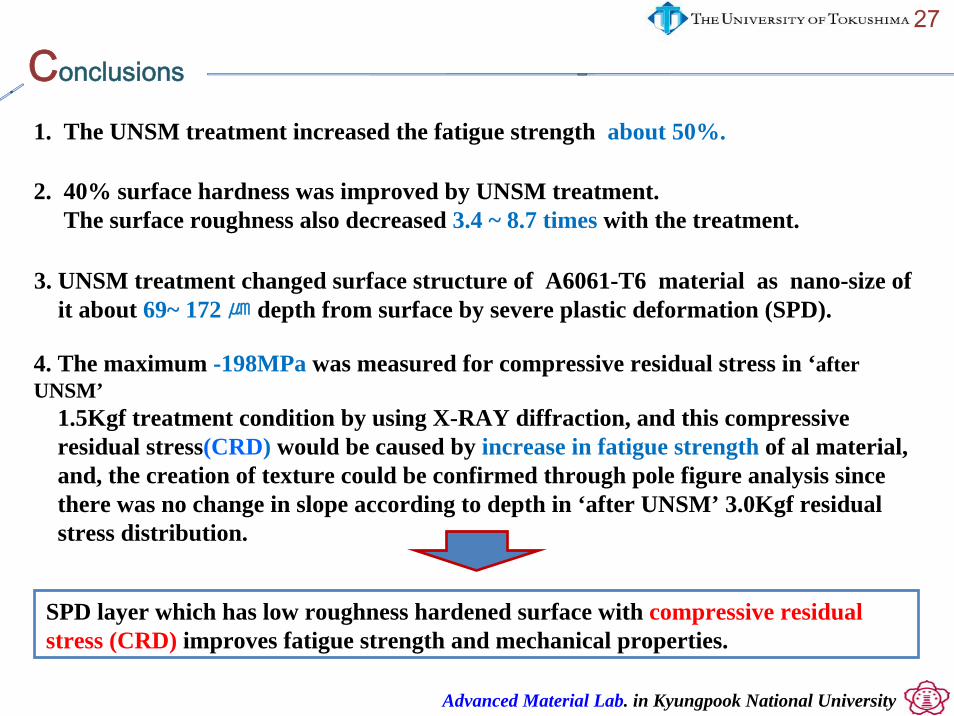
Conclusions
27
2. 40% surface hardness was improved by UNSM treatment. The surface roughness also decreased 3.4 ~ 8.7 times with the treatment.
1. The UNSM treatment increased the fatigue strength about 50%.
3. UNSM treatment changed surface structure of A6061-T6 material as nano-size of it about 69~ 172 ㎛ depth from surface by severe plastic deformation (SPD).
SPD layer which has low roughness hardened surface with compressive residual stress (CRD) improves fatigue strength and mechanical properties.
4. The maximum -198MPa was measured for compressive residual stress in ‘after UNSM’
1.5Kgf treatment condition by using X-RAY diffraction, and this compressive residual stress(CRD) would be caused by increase in fatigue strength of al material, and, the creation of texture could be confirmed through pole figure analysis sincethere was no change in slope according to depth in ‘after UNSM’ 3.0Kgf residualstress distribution.
Advanced Material Lab. in Kyungpook National University
This research was performed under a Double-Degree (DD) program at Kyungpook National University in Koreaand the University of Tokushima in Japan.I would like to deeply appreciate Prof. Chang-Min, Suhand Prof. Ri-ichi, Murakami and who have supervised me during this D.D program.
28
Acknowledgments
Advanced Material Lab. in Kyungpook National University
29References
[1] C. M. Suh, G. H Song, Y. S. Pyoun, " A Study of the Mechanical Characteristics of Ultrasonic Cold Forged SKD 61," I. J. of Modem Physics B, Vo. 2(27), pp. 4541-4546, 2006.
[2] Y. S. Pyoun, K. G. Son, "Development of D2 tool steel trimming knives with nanoscalemicrostructure," AIS-Tech Vol 2, pp. 465~468, 2005.
[3] Y. S. Pyoun,"An application of micro cold forging technology using ultrasonic energy for the nano level surface texture and the improved mechanical properties," Korea-Japan international nano-system, Nov, 2003.
[4] C. S. Lee, I. G. Park, I. S. Cho, et al., Hong, "Ultrasonic Nano Crystal Surface Modification(UNSM) on Structure and Fatigue Characteristics of TI-6AL-4V Alloy," Proceedings of Third Asian Pacific Conference on Biomechanics. No. 126, 2007.
[5] Y. Watanabe, N. Hasegawa, and Duchazeaubeneix 1. M., "Effect of Ultrasonic Shot Peening on Fatigue Strength of High Strength Steel," Proc. 8th Int. Conf. on Shot Peening, Wiley-VCH, Germany, pp. 306-310, 2003.
[6] A. Otsuka, K. Tohgo, and H. Matsutama, "Fatigue Crack Initiation and Growth Under Mixed Mode Loading in Aluminum Alloy 2017-T3 and 7075-T6," Journal of the Society of Materials Science, Japan, Vol. 36, No. 405, pp. 38~44, Jun. 1987.
Advanced Material Lab. in Kyungpook National University
30
[7] H. J. Rack, in Dispersion Strengthened Aluminum Alloys (edited by Y. W. Kim and W. M. Griffith). pp. 64~l. TMS (1988).
[8] S. I. Choi, "Studies on the prevention of damages on the carbody of Aluminum rolling stock," rans. of the KSR, Vol. 3, No. 5, PP. 181~186, 2002.
[9] Y. S. Pyoun, et al., "Application of Ultrasonic Nano-Crystal Surface Modification Technology Which realizes simultaneous improvement of fatigue strength with peening effect and improvement of wear resistance and friction loss with case hardening and micro dimples surface topology," Proceeding of the KSMTE Spring Conference pp. 346~354, 2007.
[10] G. E. Thomson and G.C. Wood, Corrosion Sci. 18, 721, 1978.
[11] J. H. Choi, Kang, D. I. Jang, Y. S. Kim, et al., " A study on the development of welding techique of aluminum alloy for rolling stock," Trans. of the KWS, pp. 220~223, 1997.
[12] W. B. Koster, "Effect of Residual Stress on Fatigue of Structural Alloys," Practical Applications of Residual Stress Technol., Proc. of the Third Int. Conf., Indianapolis, IN, USA. 1, 1991.
[13] L. Wanger, "Mechanical Surface Treatments on Titanium, Aluminum and Magnesium Alloys," Materials Science & Engineering A pp. 263~270, 1999.

Advanced Material Lab. in Kyungpook National University


![FatigueLifeBehaviorofLaserShockPeenedDuplexStainless … · 2019. 10. 30. · tension samples of Al-6061-T6 [2] and 2205 DSS [3]. e ... influence on fatigue behavior. Rubio-gonzalez](https://img.pdfslide.net/doc/110x75/611fab84cbf7c54f7f720942/fatiguelifebehavioroflasershockpeenedduplexstainless-2019-10-30-tension-samples.jpg)