Embed Size (px)
Citation preview
1
2009 AIAA SDM Wind Energy Special Session, paper AIAA-2009-2411, Palm Springs, May, 2009
Fatigue Resistance of Fiberglass Laminates at Thick
Material Transitions
Pancasatya Agastra, Daniel D. Samborsky and John F. Mandell, Department of Chemical and Biological Engineering, Montana State University,
Bozeman, MT, 59717, USA
Abstract
A complex test coupon with ply drops, intended to be representative of blade structure, has been developed with the aid of finite element analysis. The complex coupon can be used to evaluate the static and fatigue performance of infused wind turbine blade laminates containing various fabrics, resins, and material transition choices under tension, compression and reversed uniaxial loading conditions. Static and fatigue test results are presented for polyester, vinyl ester and epoxy resins and a toughened vinyl ester, for both plain and complex coupon geometries. The complex coupon damage sequence involves matrix cracking, ply delamination, load redistribution, and finally ±45o and 0o ply failure. The coupon performance showed significant sensitivity to the resin, with delamination results correlated to the Modes I and II interlaminar toughness. The static and fatigue damage loads varied approximately inversely with the square root of the number of plies dropped at a single position, with up to 5 mm thickness of dropped unidirectional material. Reversed loading in fatigue reduced lifetimes significantly compared to pure tensile or compression loading. The results of the study can be used to estimate the knockdowns and trade-offs associated with resin type and fabrication options.
I. Introduction
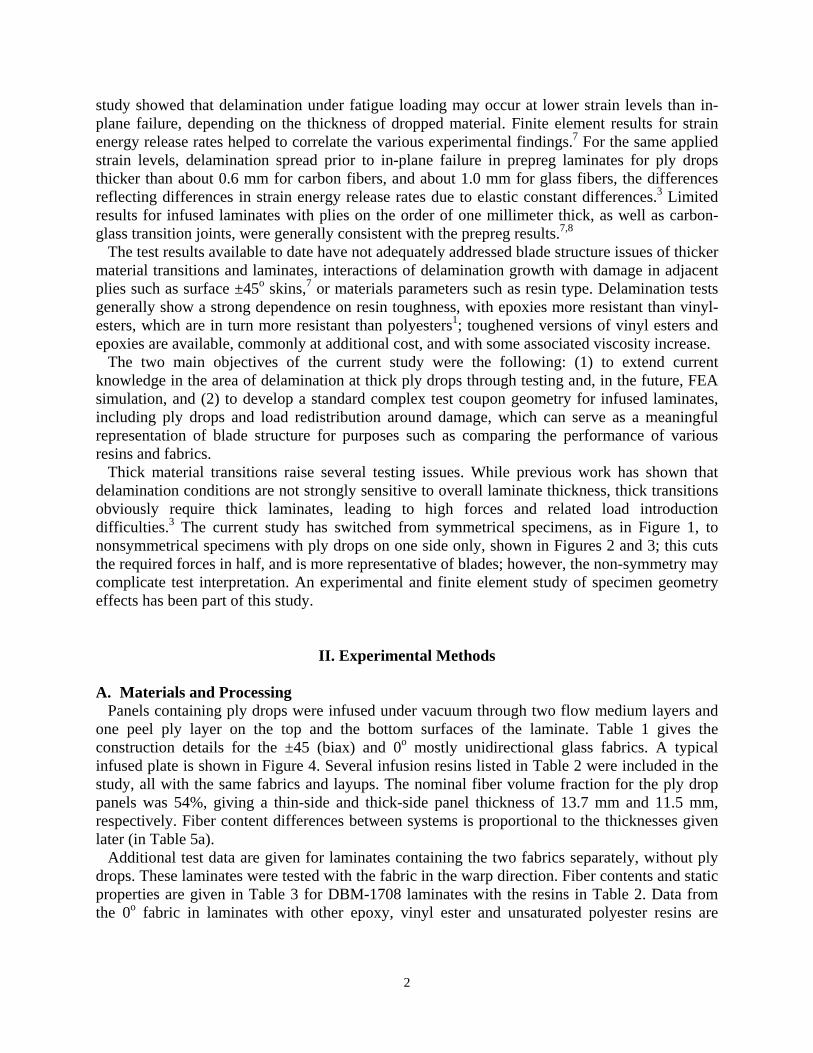
Megawatt-scale wind turbine blades are very large composite structures with relatively thick plies, commonly manufactured by resin infusion processes. Significant material transitions occur at sandwich panel close-outs1, joints1,2 and ply drops.3 Material transitions can be very thick and abrupt, as in thickness tapered areas involving drops of one or more millimeter-thick plies at a single location; these can be sites of crack initiation and damage progression in service. Extensive studies have been reported on delamination at ply drops in aerospace-style prepreg composites with relatively thin plies, in applications like flex beams for helicopter rotors.4 Research related to ply drops and other structural details for wind turbine blade materials has been the subject of recent papers and reports.1,3,5-7 A study involving multiple 0.3 mm thick ply drops of glass and carbon fiber prepregs preceded the present study of thicker infused ply drops as reported by Samborsky, et. al.3 with finite element analysis (FEA) by Wilson.7 Figure 1 shows a typical test specimen from the prepreg study; results were reported for static and fatigue tests under tension, compression, and reversed loading.3 The experimental and FEA results of that
2
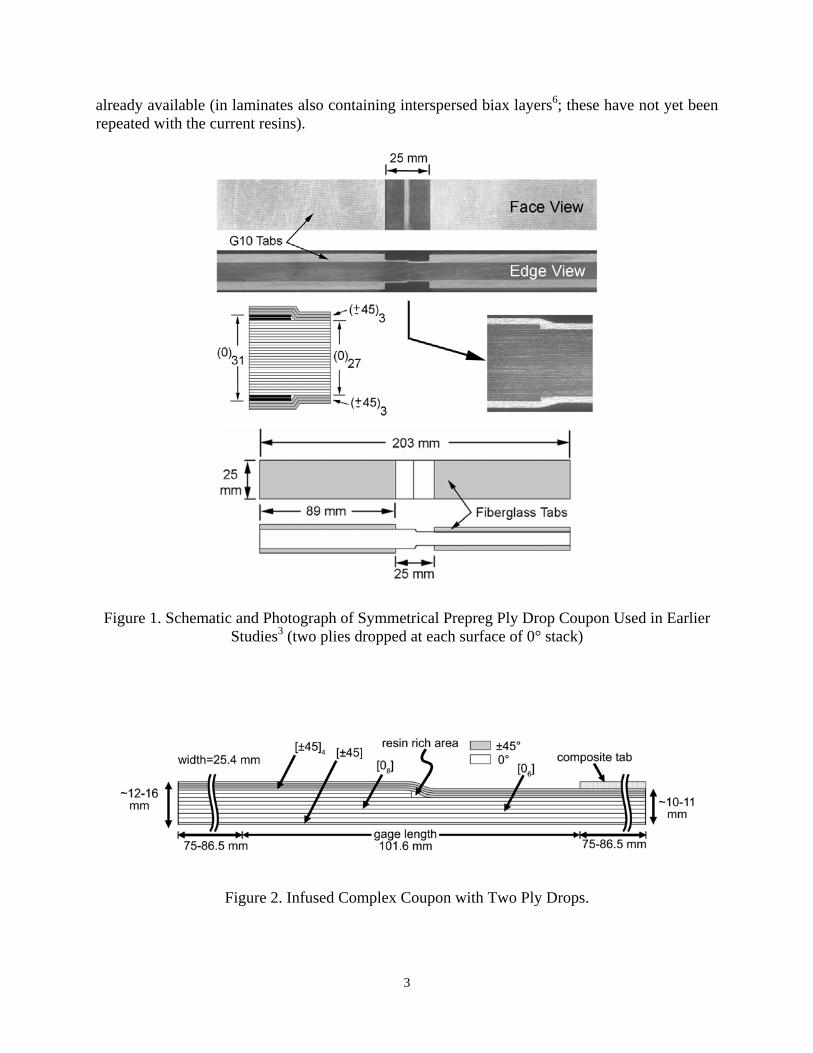
study showed that delamination under fatigue loading may occur at lower strain levels than in-plane failure, depending on the thickness of dropped material. Finite element results for strain energy release rates helped to correlate the various experimental findings.7 For the same applied strain levels, delamination spread prior to in-plane failure in prepreg laminates for ply drops thicker than about 0.6 mm for carbon fibers, and about 1.0 mm for glass fibers, the differences reflecting differences in strain energy release rates due to elastic constant differences.3 Limited results for infused laminates with plies on the order of one millimeter thick, as well as carbon-glass transition joints, were generally consistent with the prepreg results.7,8 The test results available to date have not adequately addressed blade structure issues of thicker material transitions and laminates, interactions of delamination growth with damage in adjacent plies such as surface ±45o skins,7 or materials parameters such as resin type. Delamination tests generally show a strong dependence on resin toughness, with epoxies more resistant than vinyl-esters, which are in turn more resistant than polyesters1; toughened versions of vinyl esters and epoxies are available, commonly at additional cost, and with some associated viscosity increase. The two main objectives of the current study were the following: (1) to extend current knowledge in the area of delamination at thick ply drops through testing and, in the future, FEA simulation, and (2) to develop a standard complex test coupon geometry for infused laminates, including ply drops and load redistribution around damage, which can serve as a meaningful representation of blade structure for purposes such as comparing the performance of various resins and fabrics. Thick material transitions raise several testing issues. While previous work has shown that delamination conditions are not strongly sensitive to overall laminate thickness, thick transitions obviously require thick laminates, leading to high forces and related load introduction difficulties.3 The current study has switched from symmetrical specimens, as in Figure 1, to nonsymmetrical specimens with ply drops on one side only, shown in Figures 2 and 3; this cuts the required forces in half, and is more representative of blades; however, the non-symmetry may complicate test interpretation. An experimental and finite element study of specimen geometry effects has been part of this study.
II. Experimental Methods
A. Materials and Processing Panels containing ply drops were infused under vacuum through two flow medium layers and one peel ply layer on the top and the bottom surfaces of the laminate. Table 1 gives the construction details for the ±45 (biax) and 0o mostly unidirectional glass fabrics. A typical infused plate is shown in Figure 4. Several infusion resins listed in Table 2 were included in the study, all with the same fabrics and layups. The nominal fiber volume fraction for the ply drop panels was 54%, giving a thin-side and thick-side panel thickness of 13.7 mm and 11.5 mm, respectively. Fiber content differences between systems is proportional to the thicknesses given later (in Table 5a). Additional test data are given for laminates containing the two fabrics separately, without ply drops. These laminates were tested with the fabric in the warp direction. Fiber contents and static properties are given in Table 3 for DBM-1708 laminates with the resins in Table 2. Data from the 0o fabric in laminates with other epoxy, vinyl ester and unsaturated polyester resins are
3
already available (in laminates also containing interspersed biax layers6; these have not yet been repeated with the current resins).
Figure 1. Schematic and Photograph of Symmetrical Prepreg Ply Drop Coupon Used in Earlier Studies3 (two plies dropped at each surface of 0° stack)
Figure 2. Infused Complex Coupon with Two Ply Drops.
4
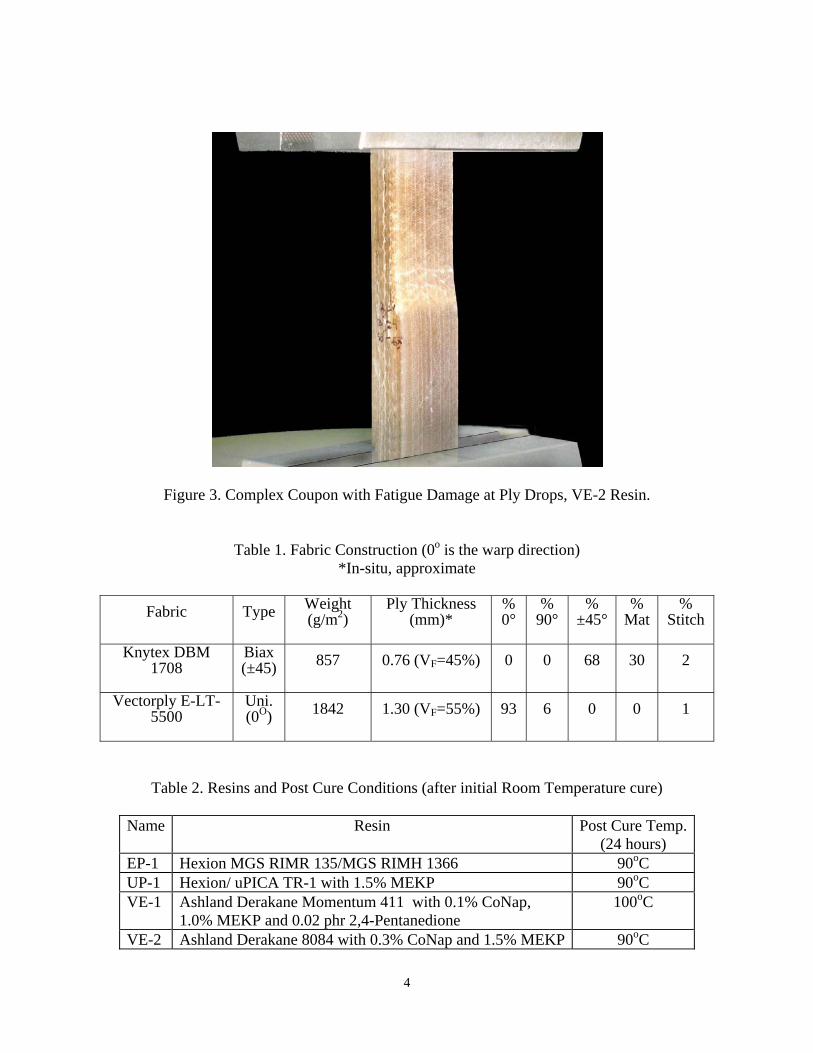
Figure 3. Complex Coupon with Fatigue Damage at Ply Drops, VE-2 Resin.
Table 1. Fabric Construction (0o is the warp direction) *In-situ, approximate
Fabric Type Weight
(g/m2) Ply Thickness
(mm)* % 0°
% 90°
% ±45°
% Mat
% Stitch
Knytex DBM 1708
Biax (±45) 857 0.76 (VF=45%) 0 0 68 30 2
Vectorply E-LT-5500
Uni. (0O) 1842 1.30 (VF=55%) 93 6 0 0 1
Table 2. Resins and Post Cure Conditions (after initial Room Temperature cure)
Name Resin
Post Cure Temp. (24 hours)
EP-1 Hexion MGS RIMR 135/MGS RIMH 1366 90oC UP-1 Hexion/ uPICA TR-1 with 1.5% MEKP 90oC VE-1 Ashland Derakane Momentum 411 with 0.1% CoNap,
1.0% MEKP and 0.02 phr 2,4-Pentanedione 100oC
VE-2 Ashland Derakane 8084 with 0.3% CoNap and 1.5% MEKP 90oC
5
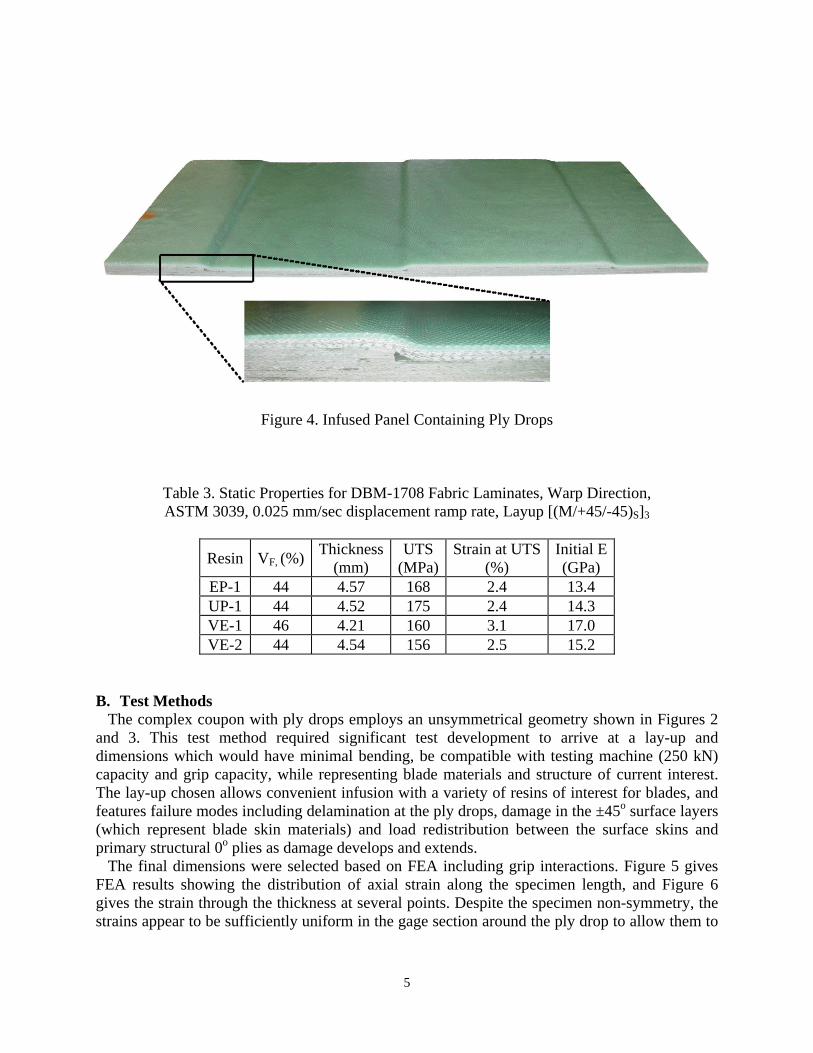
Figure 4. Infused Panel Containing Ply Drops
Table 3. Static Properties for DBM-1708 Fabric Laminates, Warp Direction, ASTM 3039, 0.025 mm/sec displacement ramp rate, Layup [(M/+45/-45)S]3
Resin VF, (%) Thickness
(mm) UTS
(MPa)Strain at UTS
(%) Initial E (GPa)
EP-1 44 4.57 168 2.4 13.4 UP-1 44 4.52 175 2.4 14.3 VE-1 46 4.21 160 3.1 17.0 VE-2 44 4.54 156 2.5 15.2
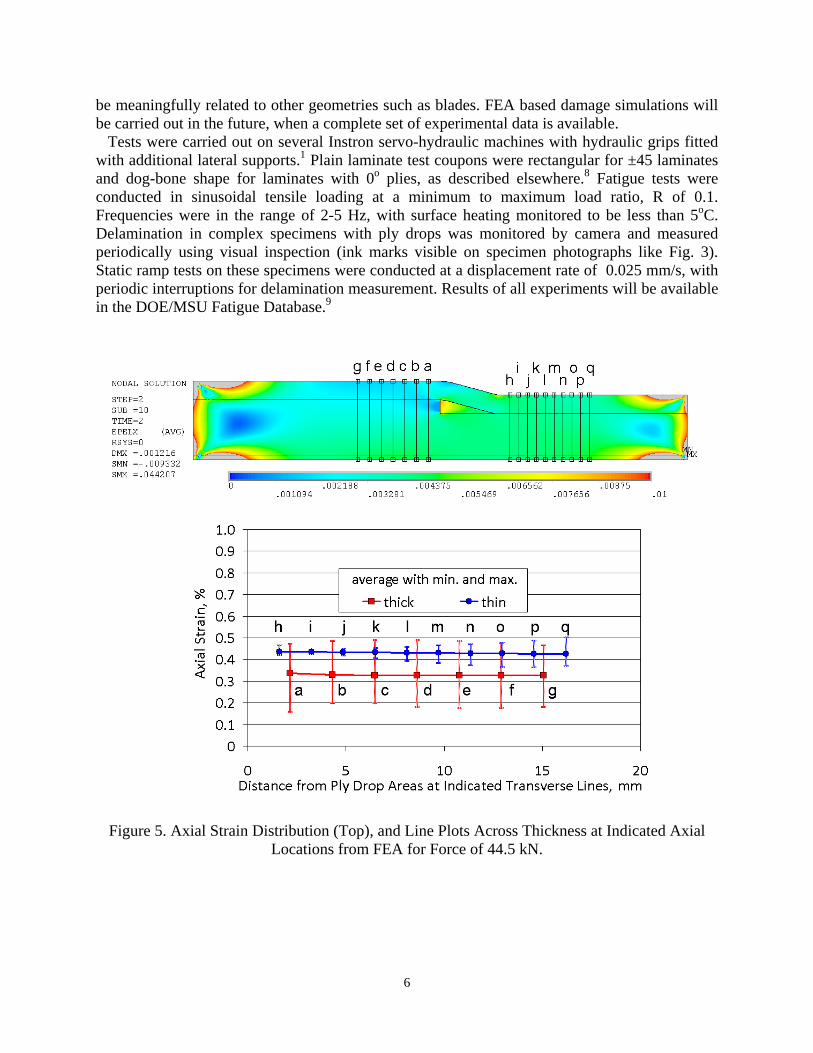
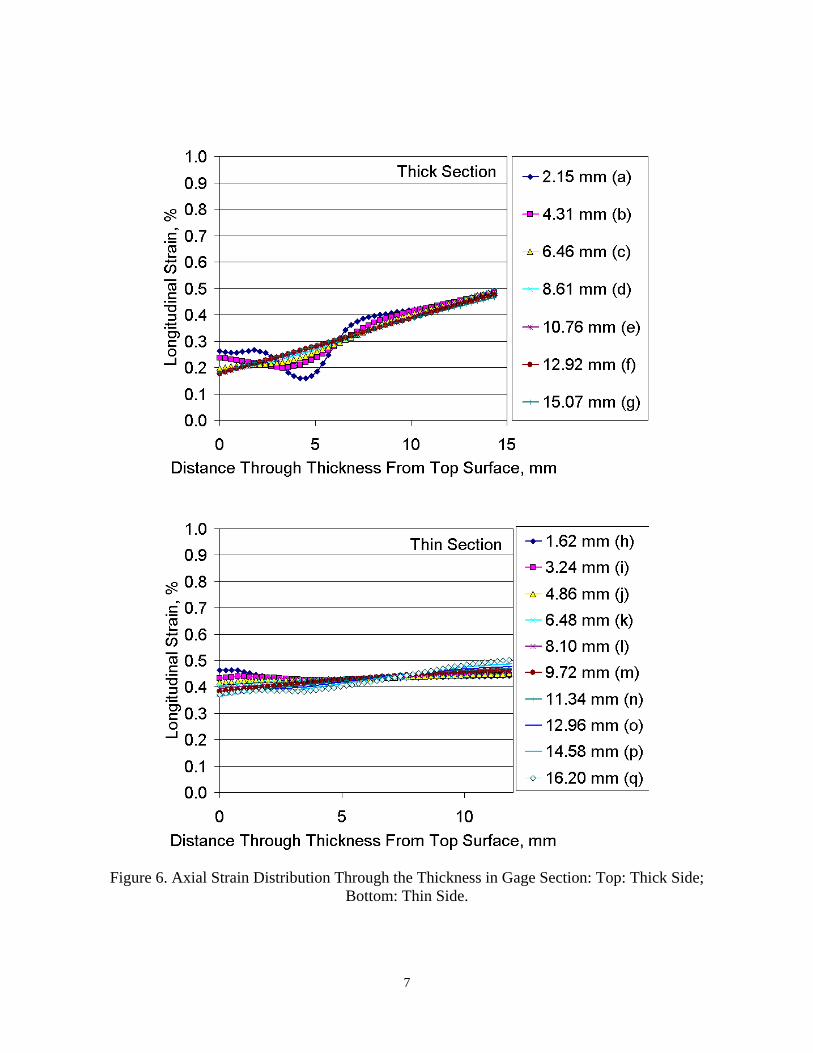
B. Test Methods The complex coupon with ply drops employs an unsymmetrical geometry shown in Figures 2 and 3. This test method required significant test development to arrive at a lay-up and dimensions which would have minimal bending, be compatible with testing machine (250 kN) capacity and grip capacity, while representing blade materials and structure of current interest. The lay-up chosen allows convenient infusion with a variety of resins of interest for blades, and features failure modes including delamination at the ply drops, damage in the ±45o surface layers (which represent blade skin materials) and load redistribution between the surface skins and primary structural 0o plies as damage develops and extends. The final dimensions were selected based on FEA including grip interactions. Figure 5 gives FEA results showing the distribution of axial strain along the specimen length, and Figure 6 gives the strain through the thickness at several points. Despite the specimen non-symmetry, the strains appear to be sufficiently uniform in the gage section around the ply drop to allow them to
6
be meaningfully related to other geometries such as blades. FEA based damage simulations will be carried out in the future, when a complete set of experimental data is available. Tests were carried out on several Instron servo-hydraulic machines with hydraulic grips fitted with additional lateral supports.1 Plain laminate test coupons were rectangular for ±45 laminates and dog-bone shape for laminates with 0o plies, as described elsewhere.8 Fatigue tests were conducted in sinusoidal tensile loading at a minimum to maximum load ratio, R of 0.1. Frequencies were in the range of 2-5 Hz, with surface heating monitored to be less than 5oC. Delamination in complex specimens with ply drops was monitored by camera and measured periodically using visual inspection (ink marks visible on specimen photographs like Fig. 3). Static ramp tests on these specimens were conducted at a displacement rate of 0.025 mm/s, with periodic interruptions for delamination measurement. Results of all experiments will be available in the DOE/MSU Fatigue Database.9
Figure 5. Axial Strain Distribution (Top), and Line Plots Across Thickness at Indicated Axial Locations from FEA for Force of 44.5 kN.
7
Figure 6. Axial Strain Distribution Through the Thickness in Gage Section: Top: Thick Side; Bottom: Thin Side.
8
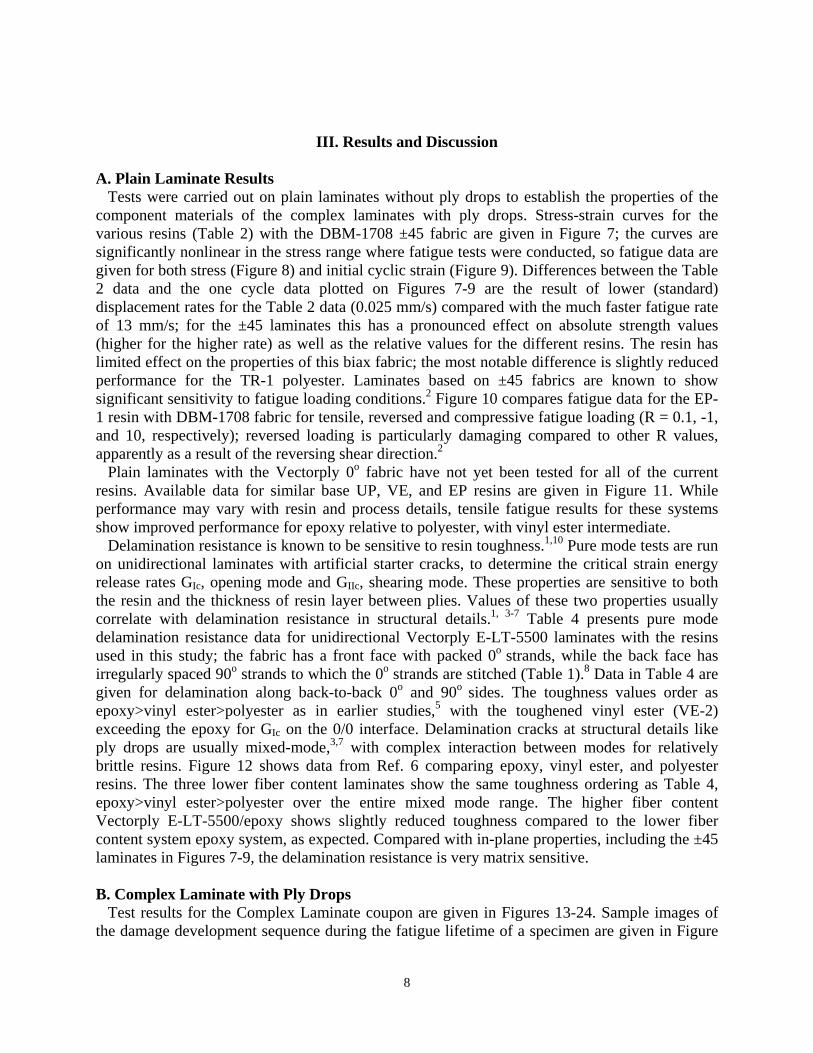
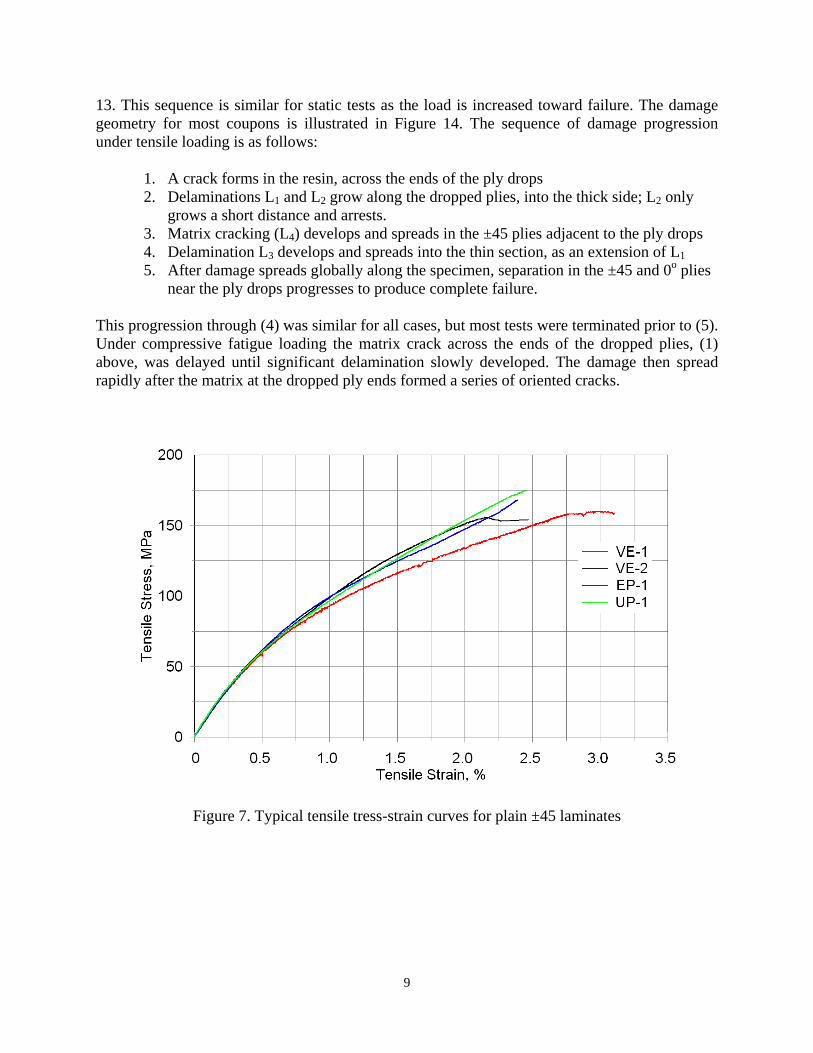
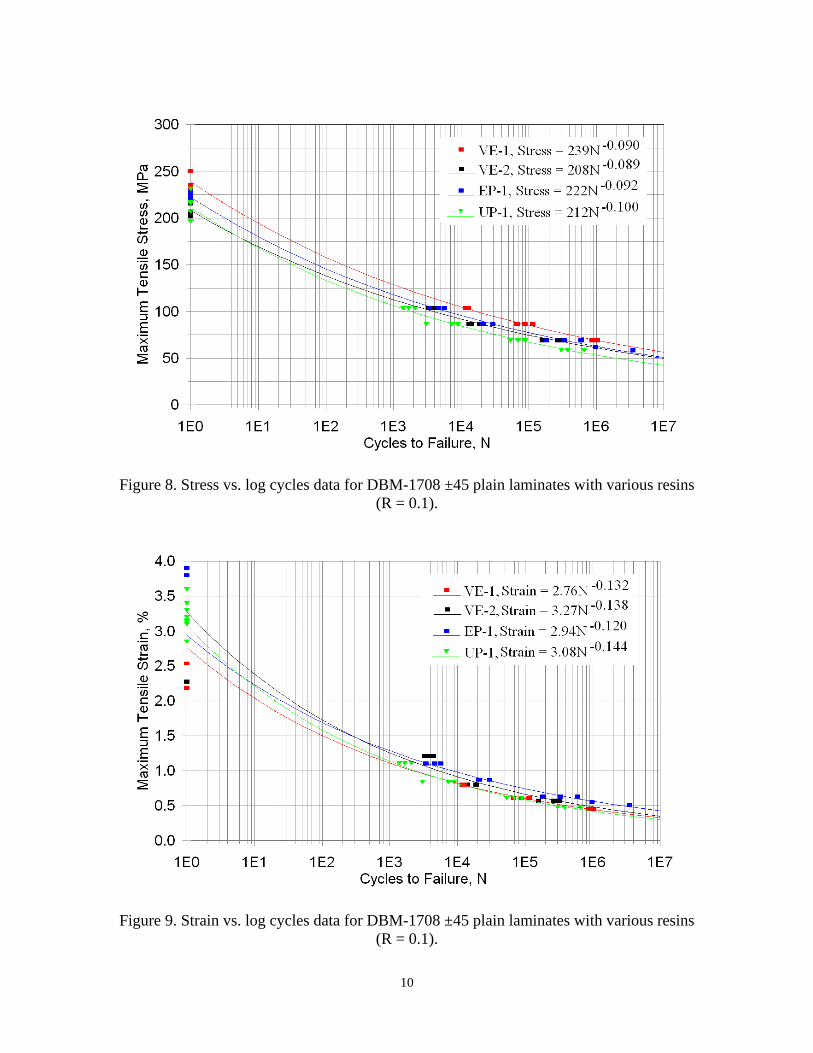
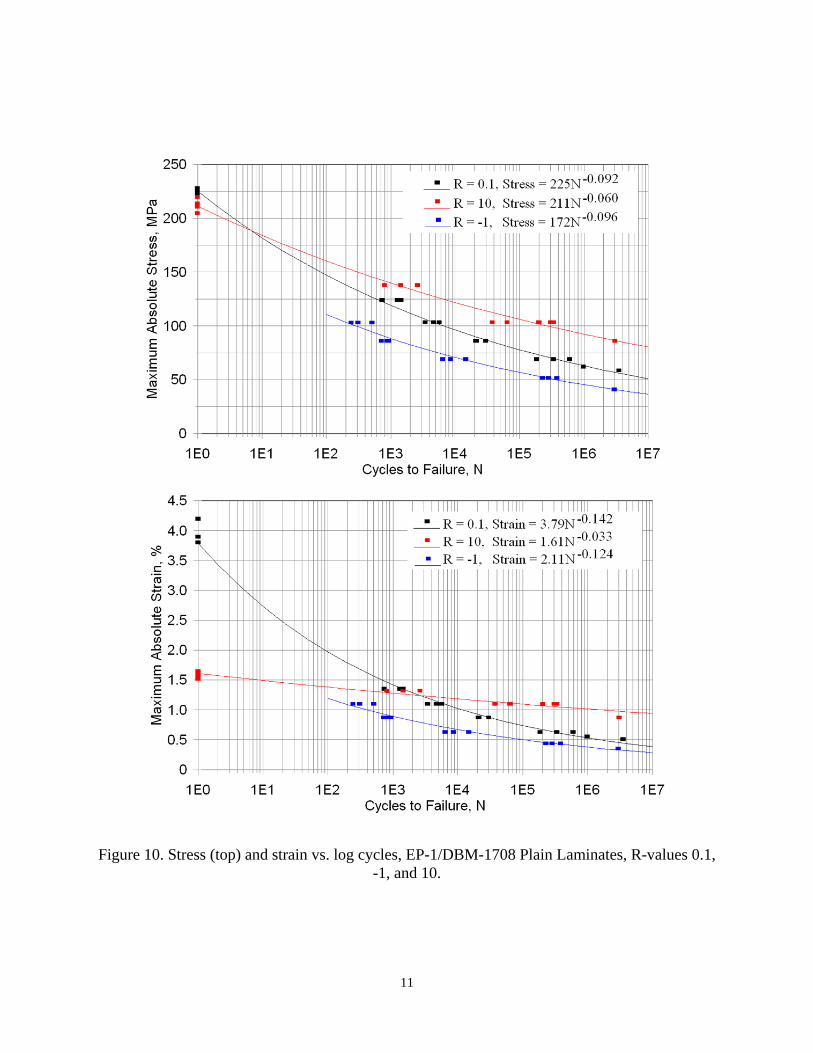
III. Results and Discussion A. Plain Laminate Results Tests were carried out on plain laminates without ply drops to establish the properties of the component materials of the complex laminates with ply drops. Stress-strain curves for the various resins (Table 2) with the DBM-1708 ±45 fabric are given in Figure 7; the curves are significantly nonlinear in the stress range where fatigue tests were conducted, so fatigue data are given for both stress (Figure 8) and initial cyclic strain (Figure 9). Differences between the Table 2 data and the one cycle data plotted on Figures 7-9 are the result of lower (standard) displacement rates for the Table 2 data (0.025 mm/s) compared with the much faster fatigue rate of 13 mm/s; for the ±45 laminates this has a pronounced effect on absolute strength values (higher for the higher rate) as well as the relative values for the different resins. The resin has limited effect on the properties of this biax fabric; the most notable difference is slightly reduced performance for the TR-1 polyester. Laminates based on ±45 fabrics are known to show significant sensitivity to fatigue loading conditions.2 Figure 10 compares fatigue data for the EP-1 resin with DBM-1708 fabric for tensile, reversed and compressive fatigue loading (R = 0.1, -1, and 10, respectively); reversed loading is particularly damaging compared to other R values, apparently as a result of the reversing shear direction.2
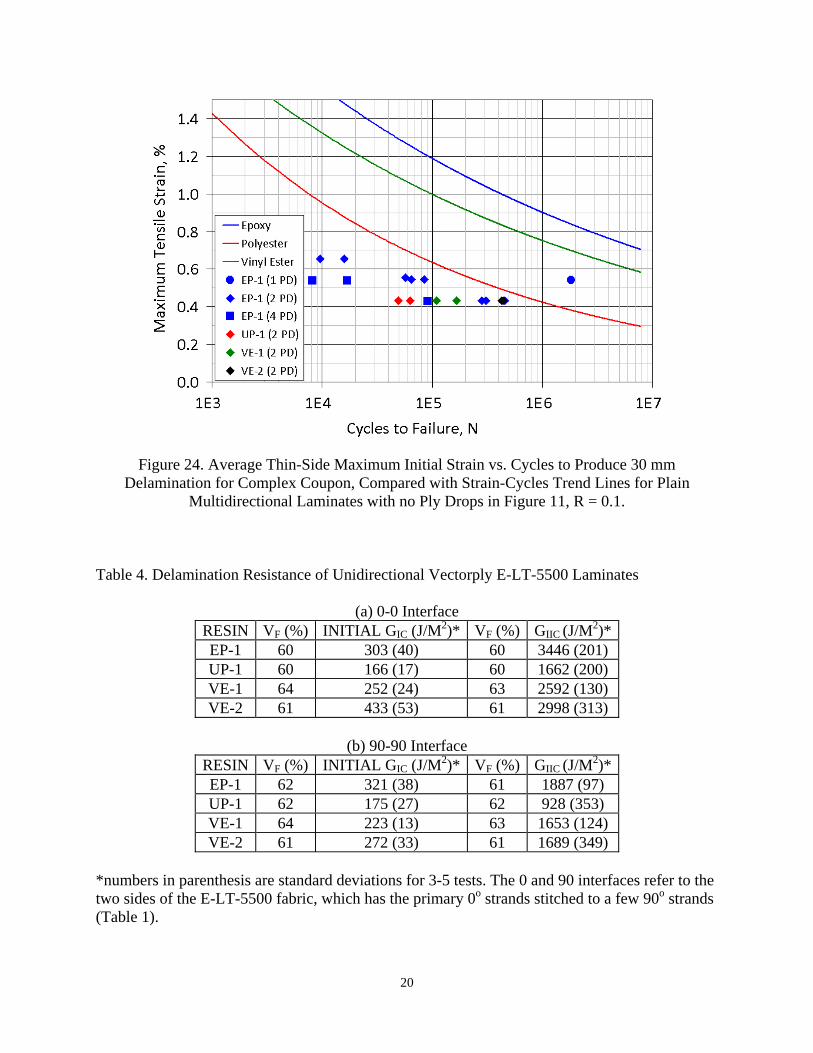
Plain laminates with the Vectorply 0o fabric have not yet been tested for all of the current resins. Available data for similar base UP, VE, and EP resins are given in Figure 11. While performance may vary with resin and process details, tensile fatigue results for these systems show improved performance for epoxy relative to polyester, with vinyl ester intermediate. Delamination resistance is known to be sensitive to resin toughness.1,10 Pure mode tests are run on unidirectional laminates with artificial starter cracks, to determine the critical strain energy release rates GIc, opening mode and GIIc, shearing mode. These properties are sensitive to both the resin and the thickness of resin layer between plies. Values of these two properties usually correlate with delamination resistance in structural details.1, 3-7 Table 4 presents pure mode delamination resistance data for unidirectional Vectorply E-LT-5500 laminates with the resins used in this study; the fabric has a front face with packed 0o strands, while the back face has irregularly spaced 90o strands to which the 0o strands are stitched (Table 1).8 Data in Table 4 are given for delamination along back-to-back 0o and 90o sides. The toughness values order as epoxy>vinyl ester>polyester as in earlier studies,5 with the toughened vinyl ester (VE-2) exceeding the epoxy for GIc on the 0/0 interface. Delamination cracks at structural details like ply drops are usually mixed-mode,3,7 with complex interaction between modes for relatively brittle resins. Figure 12 shows data from Ref. 6 comparing epoxy, vinyl ester, and polyester resins. The three lower fiber content laminates show the same toughness ordering as Table 4, epoxy>vinyl ester>polyester over the entire mixed mode range. The higher fiber content Vectorply E-LT-5500/epoxy shows slightly reduced toughness compared to the lower fiber content system epoxy system, as expected. Compared with in-plane properties, including the ±45 laminates in Figures 7-9, the delamination resistance is very matrix sensitive. B. Complex Laminate with Ply Drops Test results for the Complex Laminate coupon are given in Figures 13-24. Sample images of the damage development sequence during the fatigue lifetime of a specimen are given in Figure
9
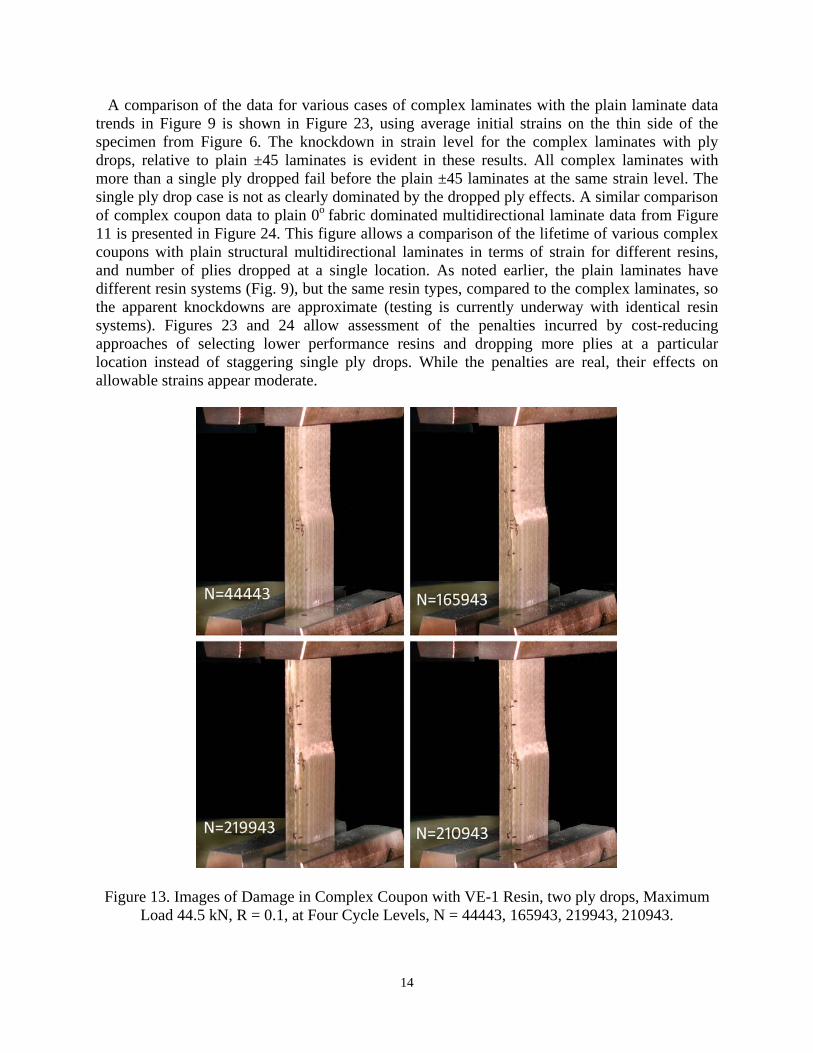
13. This sequence is similar for static tests as the load is increased toward failure. The damage geometry for most coupons is illustrated in Figure 14. The sequence of damage progression under tensile loading is as follows:
1. A crack forms in the resin, across the ends of the ply drops 2. Delaminations L1 and L2 grow along the dropped plies, into the thick side; L2 only
grows a short distance and arrests. 3. Matrix cracking (L4) develops and spreads in the ±45 plies adjacent to the ply drops 4. Delamination L3 develops and spreads into the thin section, as an extension of L1 5. After damage spreads globally along the specimen, separation in the ±45 and 0o plies
near the ply drops progresses to produce complete failure.
This progression through (4) was similar for all cases, but most tests were terminated prior to (5). Under compressive fatigue loading the matrix crack across the ends of the dropped plies, (1) above, was delayed until significant delamination slowly developed. The damage then spread rapidly after the matrix at the dropped ply ends formed a series of oriented cracks.
Figure 7. Typical tensile tress-strain curves for plain ±45 laminates
10
Figure 8. Stress vs. log cycles data for DBM-1708 ±45 plain laminates with various resins (R = 0.1).
Figure 9. Strain vs. log cycles data for DBM-1708 ±45 plain laminates with various resins (R = 0.1).
11
Figure 10. Stress (top) and strain vs. log cycles, EP-1/DBM-1708 Plain Laminates, R-values 0.1, -1, and 10.

12
Figure 11. Strain vs. log cycles data for (±45/0/±45/0/±45) Plain laminates containing Vectorply E-LT-5500 0o fabric and polyester (Ashland AROPOL 1101-006 LGT), vinyl ester (Ashland Momentum 411-200), and epoxy (Huntsman Araldite LY1564/XB3485) resins, from Ref. 8.
Figure 12. Mixed Mode Delamination Resistance for Two E-Glass Fabrics with Three Resins, epoxy (SP Systems Prime 20), vinyl ester (Derakane 411-350), and iso-polyester (CoRezyn 75-
AQ-010).6
13
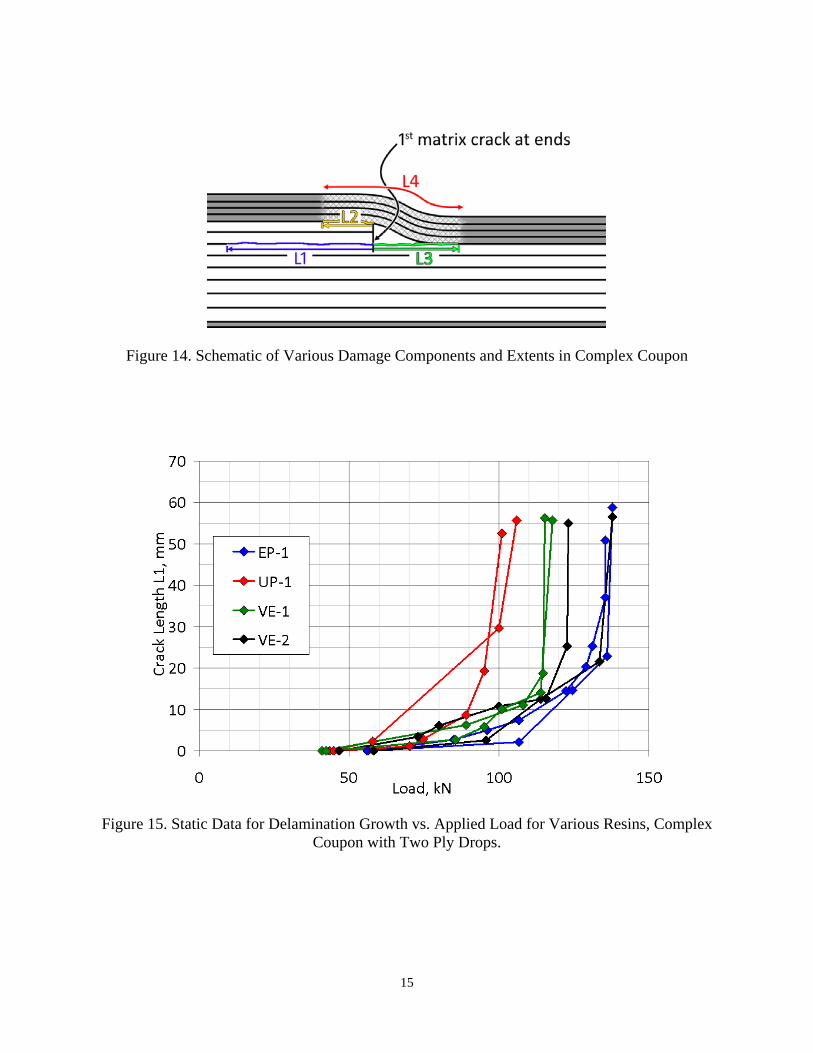
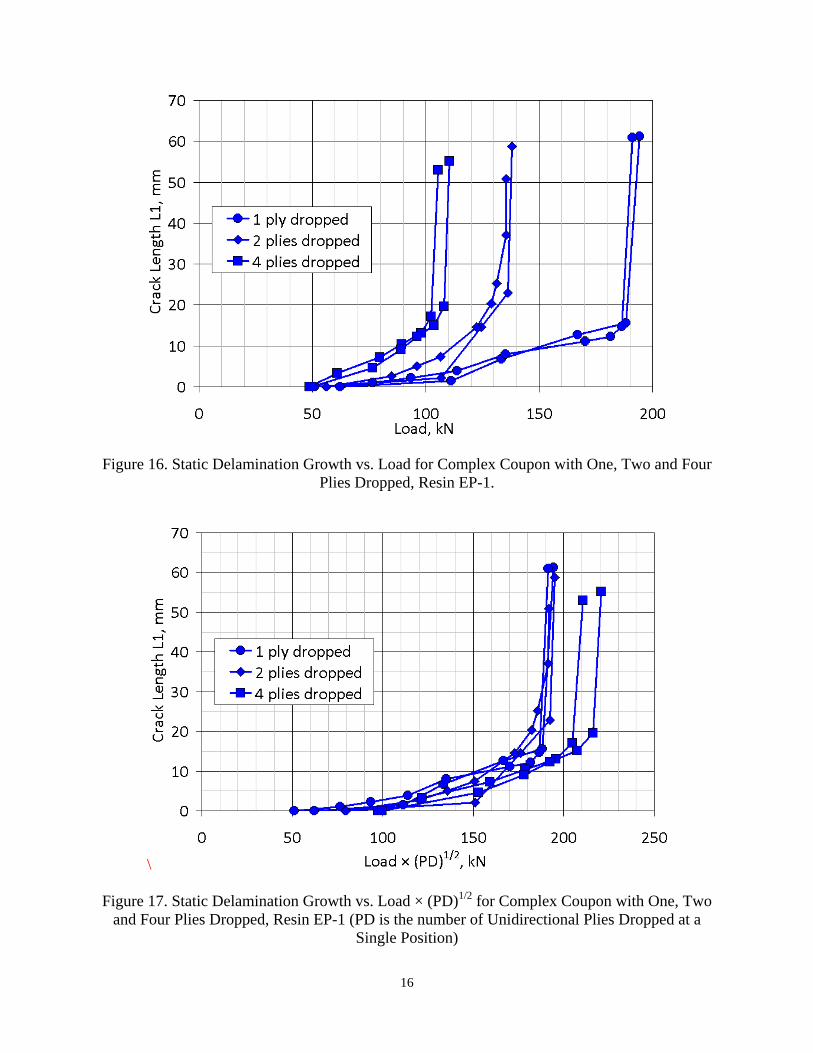
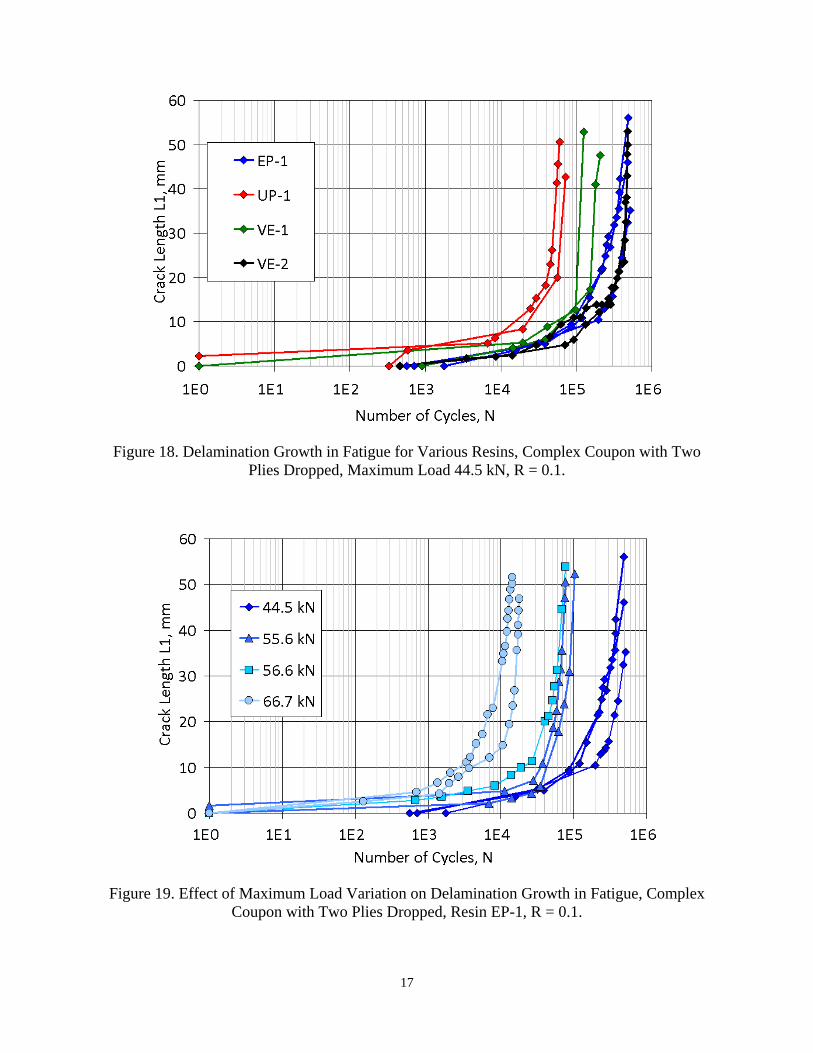
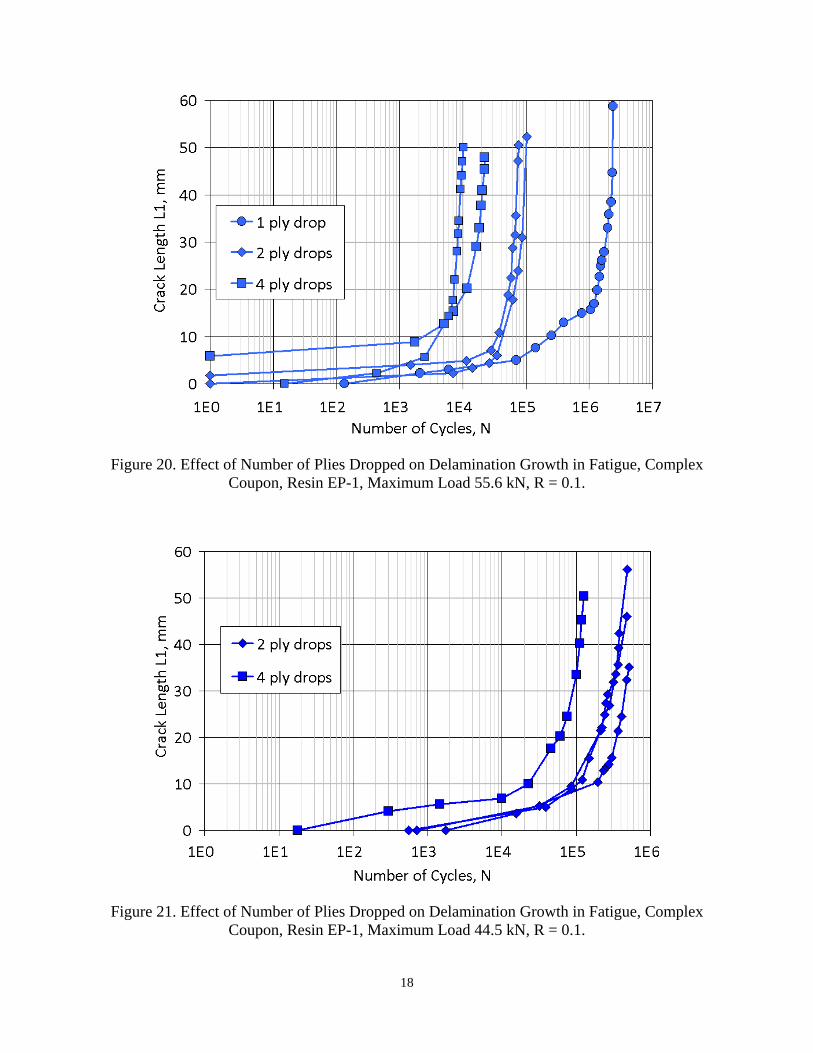
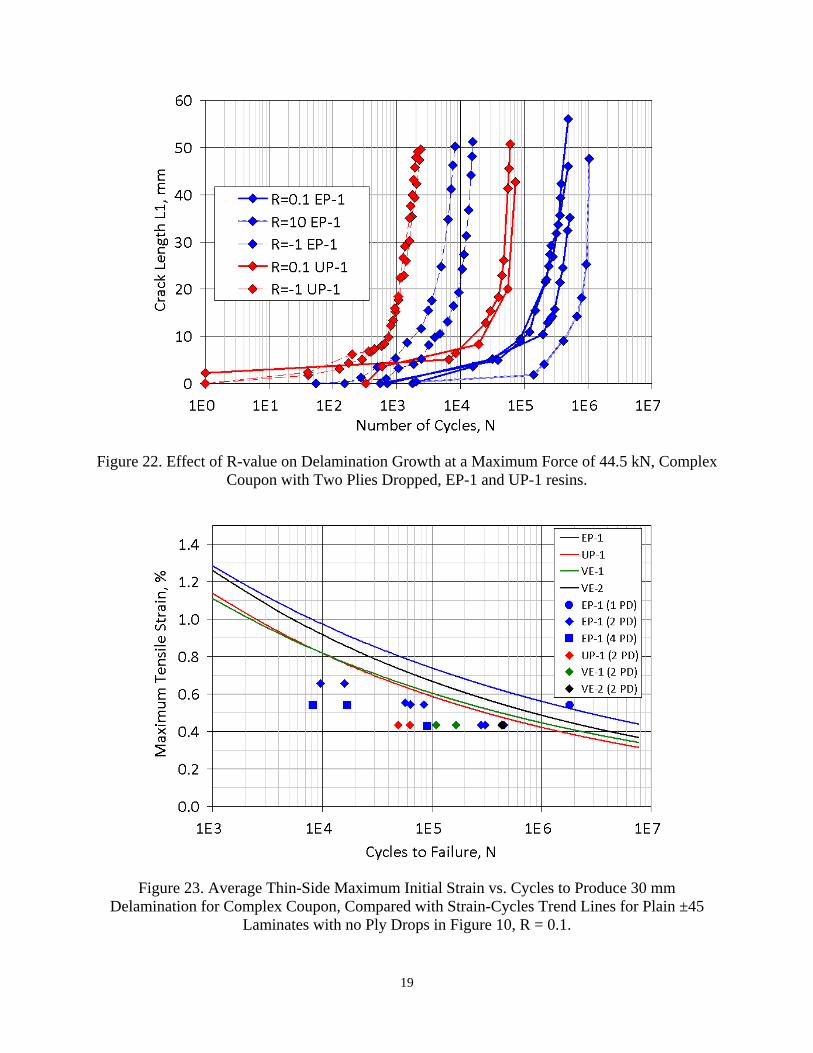
The static and fatigue response of the complex coupon depends on a variety of more basic properties of the resin and reinforcing fabrics, which, together with geometric factors, determine the overall performance. This and previous studies3,7 suggest the mechanisms involved in this damage sequence, and the relevant materials parameters. For linear FEA solutions the stress fields and delamination modes change sign under compression relative to tension loading; shear stresses and deflections change direction. Thus, tensile matrix cracking at the ply ends is suppressed in compression, and shear amplitudes are essentially doubled (with a direction change) in reversed vs. tensile loading. In the damage sequence, the matrix cracking at the ply ends releases the dropped plies to delaminate more freely for a short distance, unloading their strain energy, until this process is restricted by the ±45 plies. When the ±45 plies form matrix cracks and soften, the delamination L1 is able to grow more extensively, and L3 forms. Meanwhile, the 0o and ±45o plies are subjected to accumulating damage, and may fail in a progression through the thickness, completely separating the coupon. The various damage components are expected to depend on matrix strength and toughness, ±45o ply crack resistance, and 0o ply longitudinal strength and fatigue resistance. Prediction of the detailed damage progression requires a full simulation based on a complete set of component properties and geometry. Figures 15 and 16 give static test results for the primary delamination length, L1, as a function of applied load. The results in Figure 15 for different resins with two ply drops indicate the same ordering of delamination resistance as presented for other types of tests, such as Figure 12 and Table 4, epoxy>vinyl ester>polyester for base resin types. The toughened vinyl ester, VE-2, displays significantly greater resistance compared with the base vinyl ester VE-1. In contrast to the plain ±45 laminates in Figures 7-9, the complex laminates show much greater sensitivity to the resin. The data in Figure 16 indicate a strong sensitivity of the static delamination load to the number of plies dropped at the single location for EP-1 resin, corresponding to a total thickness transition range of about 1-4 mm for the 1, 2, and 4 plies dropped. The dropped thickness effect shown here is consistent with that found for prepreg laminates with thinner plies (about 0.3 mm) in earlier work.3 The earlier work, and other studies, demonstrated that the strain energy release rates are approximately proportional to the thickness of material dropped, excluding shape effects, so that delamination loads should vary approximately proportionally with the square root of the thickness of dropped material. When the Figure 16 delamination length is plotted against the load times the square root of the number of ply drops, Load × (PD)1/2, in Figure 17, the data for the one and two ply drop cases show good correlation, while the four ply drop case falls at somewhat higher load. Figures 18-22 present the fatigue results for delamination growth in complex coupons as a function of resin, applied load, thickness of material dropped and R-value. Results for the different resins are consistent with the static data, as are those for the thickness of dropped material. While the delamination rate is generally found to vary with some power of the strain energy release rates,1,3-6 and the strain energy release rates to vary with the square of the load, a full simulation of the progression of all of the damage components is necessary to fully predict the results for load and dropped thickness variations. The effects of loading condition for tensile, reversed, and compressive fatigue (R = 0.1, -1 and 10) for the EP-1 and UP-1 resins with two ply drops in Figure 22 again highlights the sensitivity to reversed loading. This is consistent with both the ±45 laminates (Figure 10) and data for prepreg laminate delamination in Mode II.11
14
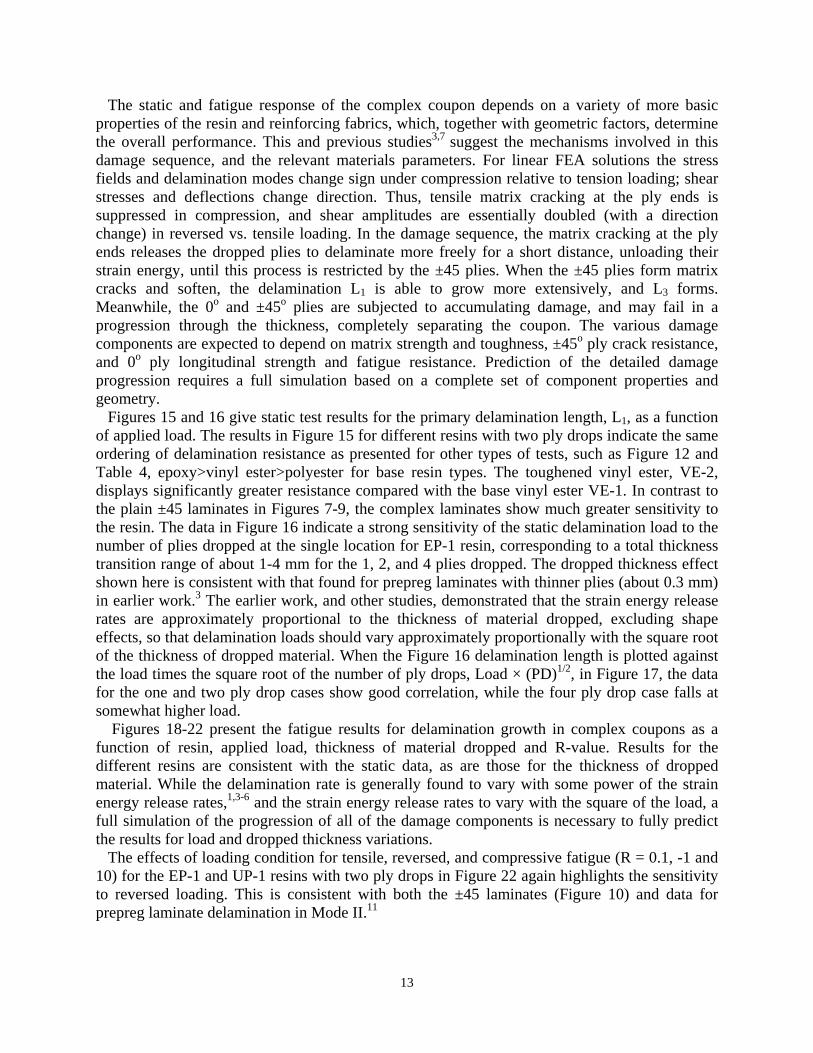
A comparison of the data for various cases of complex laminates with the plain laminate data trends in Figure 9 is shown in Figure 23, using average initial strains on the thin side of the specimen from Figure 6. The knockdown in strain level for the complex laminates with ply drops, relative to plain ±45 laminates is evident in these results. All complex laminates with more than a single ply dropped fail before the plain ±45 laminates at the same strain level. The single ply drop case is not as clearly dominated by the dropped ply effects. A similar comparison of complex coupon data to plain 0o fabric dominated multidirectional laminate data from Figure 11 is presented in Figure 24. This figure allows a comparison of the lifetime of various complex coupons with plain structural multidirectional laminates in terms of strain for different resins, and number of plies dropped at a single location. As noted earlier, the plain laminates have different resin systems (Fig. 9), but the same resin types, compared to the complex laminates, so the apparent knockdowns are approximate (testing is currently underway with identical resin systems). Figures 23 and 24 allow assessment of the penalties incurred by cost-reducing approaches of selecting lower performance resins and dropping more plies at a particular location instead of staggering single ply drops. While the penalties are real, their effects on allowable strains appear moderate.
Figure 13. Images of Damage in Complex Coupon with VE-1 Resin, two ply drops, Maximum Load 44.5 kN, R = 0.1, at Four Cycle Levels, N = 44443, 165943, 219943, 210943.
15
Figure 14. Schematic of Various Damage Components and Extents in Complex Coupon
Figure 15. Static Data for Delamination Growth vs. Applied Load for Various Resins, Complex Coupon with Two Ply Drops.
16
Figure 16. Static Delamination Growth vs. Load for Complex Coupon with One, Two and Four Plies Dropped, Resin EP-1.
\
Figure 17. Static Delamination Growth vs. Load × (PD)1/2 for Complex Coupon with One, Two and Four Plies Dropped, Resin EP-1 (PD is the number of Unidirectional Plies Dropped at a
Single Position)
17
Figure 18. Delamination Growth in Fatigue for Various Resins, Complex Coupon with Two Plies Dropped, Maximum Load 44.5 kN, R = 0.1.
Figure 19. Effect of Maximum Load Variation on Delamination Growth in Fatigue, Complex Coupon with Two Plies Dropped, Resin EP-1, R = 0.1.
18
Figure 20. Effect of Number of Plies Dropped on Delamination Growth in Fatigue, Complex Coupon, Resin EP-1, Maximum Load 55.6 kN, R = 0.1.
Figure 21. Effect of Number of Plies Dropped on Delamination Growth in Fatigue, Complex Coupon, Resin EP-1, Maximum Load 44.5 kN, R = 0.1.
19
Figure 22. Effect of R-value on Delamination Growth at a Maximum Force of 44.5 kN, Complex Coupon with Two Plies Dropped, EP-1 and UP-1 resins.
Figure 23. Average Thin-Side Maximum Initial Strain vs. Cycles to Produce 30 mm Delamination for Complex Coupon, Compared with Strain-Cycles Trend Lines for Plain ±45
Laminates with no Ply Drops in Figure 10, R = 0.1.
20
Figure 24. Average Thin-Side Maximum Initial Strain vs. Cycles to Produce 30 mm Delamination for Complex Coupon, Compared with Strain-Cycles Trend Lines for Plain
Multidirectional Laminates with no Ply Drops in Figure 11, R = 0.1.
Table 4. Delamination Resistance of Unidirectional Vectorply E-LT-5500 Laminates
(a) 0-0 Interface RESIN VF (%) INITIAL GIC (J/M2)* VF (%) GIIC (J/M2)* EP-1 60 303 (40) 60 3446 (201) UP-1 60 166 (17) 60 1662 (200) VE-1 64 252 (24) 63 2592 (130) VE-2 61 433 (53) 61 2998 (313)
(b) 90-90 Interface
RESIN VF (%) INITIAL GIC (J/M2)* VF (%) GIIC (J/M2)* EP-1 62 321 (38) 61 1887 (97) UP-1 62 175 (27) 62 928 (353) VE-1 64 223 (13) 63 1653 (124) VE-2 61 272 (33) 61 1689 (349)
*numbers in parenthesis are standard deviations for 3-5 tests. The 0 and 90 interfaces refer to the two sides of the E-LT-5500 fabric, which has the primary 0o strands stitched to a few 90o strands (Table 1).
21
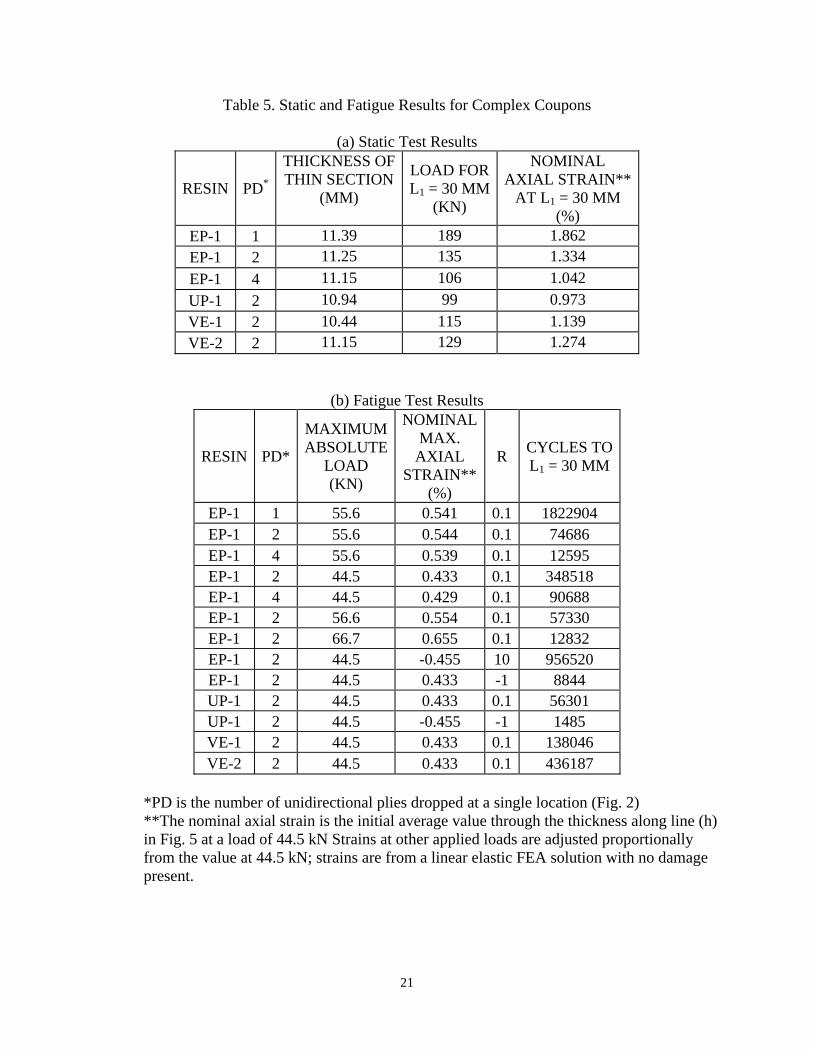
Table 5. Static and Fatigue Results for Complex Coupons
(a) Static Test Results
RESIN PD*
THICKNESS OF THIN SECTION
(MM)
LOAD FOR L1 = 30 MM
(KN)
NOMINAL AXIAL STRAIN**
AT L1 = 30 MM (%)
EP-1 1 11.39 189 1.862 EP-1 2 11.25 135 1.334 EP-1 4 11.15 106 1.042 UP-1 2 10.94 99 0.973 VE-1 2 10.44 115 1.139 VE-2 2 11.15 129 1.274
(b) Fatigue Test Results
RESIN PD*
MAXIMUMABSOLUTE
LOAD (KN)
NOMINALMAX.
AXIAL STRAIN**
(%)
R CYCLES TO L1 = 30 MM
EP-1 1 55.6 0.541 0.1 1822904 EP-1 2 55.6 0.544 0.1 74686 EP-1 4 55.6 0.539 0.1 12595 EP-1 2 44.5 0.433 0.1 348518 EP-1 4 44.5 0.429 0.1 90688 EP-1 2 56.6 0.554 0.1 57330 EP-1 2 66.7 0.655 0.1 12832 EP-1 2 44.5 -0.455 10 956520 EP-1 2 44.5 0.433 -1 8844 UP-1 2 44.5 0.433 0.1 56301 UP-1 2 44.5 -0.455 -1 1485 VE-1 2 44.5 0.433 0.1 138046 VE-2 2 44.5 0.433 0.1 436187
*PD is the number of unidirectional plies dropped at a single location (Fig. 2) **The nominal axial strain is the initial average value through the thickness along line (h) in Fig. 5 at a load of 44.5 kN Strains at other applied loads are adjusted proportionally from the value at 44.5 kN; strains are from a linear elastic FEA solution with no damage present.
22
IV. Conclusions
The complex coupon with ply drops provides a basis for comparing infusion blade material and lay-up parameters for a case which is more representative of real blade structure than are plain laminate tests. The sequence of damage initiation and growth depends on both in-plane properties of the fabric layers and inter-laminar properties, the latter dominated by the resin. The test coupon geometry FEA indicates minimal effects of non-symmetry, which allows for double the thickness compared with earlier symmetrical coupons. Results from the static and fatigue tests indicate improved performance for the epoxy system EP-1 relative to the vinyl ester VE-1 or polyester UP-1; the toughened vinyl ester, VE-2, is significantly improved relative to the base VE-1. The results for various resins with the complex coupon are consistent with data for inter-laminar Modes I and II tests. The results show significantly higher knockdowns for greater thicknesses of dropped material (4 vs. 2 vs. 1 ply dropped at the same position, for approximately 1.3 mm thick plies). The results also show much increased fatigue sensitivity under reversed fatigue loading compared with either tensile or compressive loading alone.
V. Acknowledgements This research was supported by Sandia National Laboratories; Dr. Thomas Ashwill was the technical monitor. The participation of various materials suppliers is also greatly appreciated.
References 1Mandell, J.F., Samborsky, D.D., and Cairns, D.S. "Fatigue of Composite Materials and Substructures for Wind Turbine Blades," Contractor Report SAND2002-0771, Sandia National Laboratories, Albuquerque, NM (2002). 2Samborsky, D.D., Sears, A., Mandell, J.F. and Kils, O., “Static and Fatigue Testing of Thick Adhesive Joints for Wind Turbine Blades,” 2009 ASME Wind Energy Symposium, paper AIAA-2009-1550, Orlando, Fla. 3Samborsky, D.D., Wilson, T.W., Agastra, P., and Mandell, J.F., J. Sol. Energy Eng., 2008 130, paper 031001. 4Murri, G.B., Schaff, J.R. and Dobyns, A.L." Fatigue Life Analysis of Hybrid Composite Tapered Flexbeams," NASA LaRC Technical Library Digital Repository http://hdl.handle.net/2002/15079 5Mandell, J.F., Cairns, D.S., Samborsky, D.D., Morehead, R.B., and Haugen, D.J., J. Sol. Energy Eng., 2003, 125, paper 009304. 6Mandell, J.F., Samborsky, D.D. and Agastra, P., Proc. SAMPE 2008, Long Beach, CA, paper L238, 2008. 7Wilson, T.J., "Modeling of In-Plane and Interlaminar Fatigue Behavior of Glass and Carbon Fiber Composite Materials," MS Thesis, Department of Mechanical Engineering, Montana State University, 2006. 8Samborsky, D.D., Wilson, T.J. and Mandell, J.F., J. Sol. Energy Eng., 2009, 131, paper 011006. 9Mandell, J.F. and Samborsky, D.D., “DOE/MSU Fatigue of Composite Materials Database, 2009 update (www.sandia.gov/wind/other/973002upd0309.pdf).
23
10Hunston, D.L., Moulton, R.J., Johnson, N.J., and Bascom, W.D., Toughened Composites, ASTM STP 937, Norman J. Johnson, Ed., American Society for Testing and Materials, Philadelphia, 1987, pp. 74-94. 11Tanaka, K., and Tanaka, H., Composite Materials: Fatigue and Fracture (Sixth Volume), ASTM STP 1285, E.A. Armanios, Ed., ASTM, 1997, pp. 126-142.