Embed Size (px)
Citation preview
Clemson UniversityTigerPrints
All Dissertations Dissertations
12-2011
FATTY ACIDS AND LIPOGENESIS INRUMINANT ADIPOCYTESTaber BurnsClemson University, [email protected]
Follow this and additional works at: https://tigerprints.clemson.edu/all_dissertations
Part of the Animal Sciences Commons
This Dissertation is brought to you for free and open access by the Dissertations at TigerPrints. It has been accepted for inclusion in All Dissertations byan authorized administrator of TigerPrints. For more information, please contact [email protected].
Recommended CitationBurns, Taber, "FATTY ACIDS AND LIPOGENESIS IN RUMINANT ADIPOCYTES" (2011). All Dissertations. 840.https://tigerprints.clemson.edu/all_dissertations/840
FATTY ACIDS AND LIPOGENESIS IN RUMINANT ADIPOCYTES
A Dissertation
Presented to
the Graduate School of
Clemson University
In Partial Fulfillment
of the Requirements for the Degree
Doctor of Philosophy
Animal and Veterinary Sciences
by
Taber Ashley Poland Burns
December 2011
Accepted by:
Dr. Susan K. Duckett, Committee Chair
Dr. Karen J. L. Burg
Dr. Thomas C. Jenkins
Dr. Scott L. Pratt
ii
ABSTRACT
Obsesity, the excess deposition of white adipose tissue, is a growing problem in
the U.S. and other developed countries. Formerly thought to be inert, adipose tissue is
now recognized as a dynamic endocrine organ with its secretion of adipokines and a
newly proposed class hormone class “lipokine”. Adipocytes are the functional unit of
adipose tissue and can influence the tissue through hyperplasic and hypertrophic growth.
In order to investigate the mechanisms involved in adipogenesis and lipogenesis of
adipose tissue, stromal vascular cultures were isolated from adipose tissue of finishing
cattle for use in experiments.
There is a positive relationship between lipogenic gene expression and increased
energy in steer diets. The objectives of the studies presented in Chapter 2 were to
determine if differences in fatty acid profiles or gene expression exist when adipocytes
are exposed to different, simulated energy sources: linoleic acid, insulin, or both
following differentiation. With limited information in the literature about the timing of
lipid uptake and fatty acid composition in differentiating bovine adipocytes, a secondary
objective of these studies was to evaluate fatty acid composition over time. Overall,
results from these studies indicate that fatty acid composition changes over time post-
differentiation and is modulated by linoleic acid supplementation. Expression of SCD1
mRNA was up-regulated prior to changes in fatty acid desaturation profiles. In addition,
linoleic acid treatment was incorporated into cells and its supplementation decreased
production of de novo fatty acids synthesis or increased -oxidation of fatty acids or both.
iii
Recent evidence links palmitoleic acid to decreased lipogenesis in murine
hepatocytes. Since adipocytes are the primary site of lipogenesis in ruminants, the
objectives of the experiment in Chapter 3 was to determine if a similar effect could be
seen in bovine adipocytes and titrate an effective dose of palmitoleic acid
supplementation. Concurrent with palmitoleic acid, cis-vaccenic (C18:1 cis-11) and
eicosenoic (C20:1 cis-13) acids increased linearly with palmitoleic acid supplementation
in bovine adipocytes. In addition, activity and mRNA expression of several lipogenic
genes were down-regulated and -oxidation was increased in response to palmitoleic acid
supplementation. Therefore, palmitoleic acid was having an anti-lipogenic effect on the
bovine adipocyte cultures.
The elevated presence of suspected elongation products of palmtioleic acid, cis-
vaccenic and eicosenoic acids, in cultures supplemented with palmitoleic acid left doubt
as to which fatty acid contributes to anti-lipogenic effects. The objectives of the studies
performed in Chapter 4 were to confirm cis-vaccenic and eicosenoic acids as elongation
products of palmtioleic acid using a stable isotope tracer and test lipogenic effects of cis-
vaccenic acid. Cis-vaccenic and eicosenoic acids are, indeed, direct elongation products
of palmtioleic acid. In addition, cis-vaccenic acid decreased lipogenesis rates, but did not
affect desaturation. Therefore, palmitoleic acid differentially affects aspects of
lipogenesis relative to its elongation products. Overall, the results of this work advance
our understanding of the biological mechanisms underlying lipogenesis.

iv
DEDICATION
I would like to dedicate this work to my loving and supportive husband.

v
ACKNOWLEDGEMENTS
Thank you, Dr. Duckett, for making this all possible. I have sincerely enjoyed my
time working with you at Clemson University. It has been a wonderful experience that I
intend to share with others. You always had my best interests at heart and pushed me to
excel. I could not have asked for a better mentor. Also, „thank you‟ to my committee
members, Drs. Karen Burg, Tom Jenkins, Scott Pratt, and Steve Ellis (unofficial member)
for their various and invaluable contributions to this work and to my professional
development.
I would like to say a „thank you‟ to everyone who helped me with many aspects
of my projects; although too many people to thank individually, Katie Klein and Maggie
Miller deserve special recognition for their assistance. You both helped me on a number
of occasions, from fatty acids to sheep watch. I would not have been able to do it on my
own! Thank you for your patience and willingness to help. In addition, I would like to
thank Mrs. Nancy Allgood for her guidance in all things life and lab. Also of great help,
were the other graduate students and Marcy Owens, the „Trouble-shooting Queen‟, who
were always willing to brainstorm ideas and reflect on a general love of PCR.
vi
TABLE OF CONTENTS
Page
TITLE PAGE .................................................................................................................... i
ABSTRACT ..................................................................................................................... ii
DEDICATION ................................................................................................................ iv
ACKNOWLEDGEMENTS ............................................................................................. v
LIST OF TABLES ......................................................................................................... vii
LIST OF FIGURES ...................................................................................................... viii
CHAPTER
1. FATTY ACIDS IN RUMINANTS
Introduction .............................................................................................. 1
Fatty Acids and Lipogenesis .................................................................... 4
Adipogenesis .......................................................................................... 10
Fatty Acid Regulation ............................................................................ 16
Literature Cited ...................................................................................... 28
2. GENE EXPRESSION AND FATTY ACID PROFILES DURING
DIFFERENTIATION OF BOVINE ADIPOCYTE CULTURES
SUPPLEMENTED WITH LINOLEIC ACID (C18:2 n-6)
Abstract .................................................................................................. 35
Introduction ............................................................................................ 38
Materials and Methods ........................................................................... 41
Results and Discussion .......................................................................... 45
Literature Cited ...................................................................................... 57
3. SUPPLEMENTAL PALMITOLEIC ACID (C16:1 cis-9) REDUCES
LIPOGENESIS AND DESATURATION IN BOVINE ADIPOCYTE
CULTURES
Abstract .................................................................................................. 60
Introduction ............................................................................................ 62
Materials and Methods ........................................................................... 64
Results and Discussion .......................................................................... 70
Literature Cited ...................................................................................... 84
4. PALMITOLEIC (C16:1 cis-9) AND CIS-VACCENIC ACID (C18:1 cis-11)
ALTER LIPOGENESIS IN BOVINE ADIPOCYTE CULTURES
Abstract .................................................................................................. 88
Introduction ............................................................................................ 90
Materials and Methods ........................................................................... 93
Results and Discussion .......................................................................... 99
Literature Cited .................................................................................... 113
vii
LIST OF TABLES
CHAPTER
Page
1. FATTY ACIDS IN RUMINANTS
1.1 Predominant fatty acids in ruminant tissues: Nomenclature,
primary sources, and implications for human health .....................24
1.2. Lipogenic gene function and regulation ............................................25
2. GENE EXPRESSION AND FATTY ACID PROFILES DURING
DIFFERENTIATION OF BOVINE ADIPOCYTE CULTURES
SUPPLEMENTED WITH LINOLEIC ACID (C18:2 n-6)
2.1. Gravimetric fatty acid composition of bovine adipocytes
supplemented with 0 or 0.3 mM linoleic acid (C18:2 n-6) over
time. ...............................................................................................55
3. SUPPLEMENTAL PALMITOLEIC ACID (C16:1 cis-9) REDUCES
LIPOGENESIS AND DESATURATION IN BOVINE ADIPOCYTE
CULTURES
3.1. Main effect of level of palmitoleic acid supplementation on
palmitic (C16:0), stearic (C18:0), oleic (C18:1 cis-9) acids, and
desaturation index (C18:1 cis-9/C18:0) of bovine adipocytes .......81
4. PALMITOLEIC (C16:1 cis-9) AND CIS-VACCENIC ACID (C18:1 cis-11)
ALTER LIPOGENESIS IN BOVINE ADIPOCYTE CULTURES
4.1. Fatty acid composition of bovine adipocyte cultures treated with 0
M fatty acids (control), 150 M palmitic, palmitoleic, or cis-
vaccenic acid ................................................................................109
viii
LIST OF FIGURES
CHAPTER
Page
1. FATTY ACIDS IN RUMINANTS
1.1. An overview of fatty acid synthesis in the ruminant adipocyte .........26
1.2. Chronological progression of major gene expression changes in
differentiation of 3T3-L1 cells as reviewed by Ntambi and Kim
(2000) .............................................................................................27
2. GENE EXPRESSION AND FATTY ACID PROFILES DURING
DIFFERENTIATION OF BOVINE ADIPOCYTE CULTURES
SUPPLEMENTED WITH LINOLEIC ACID (C18:2 n-6)
2.1. Main effect of linoleic acid supplementation (0 or 0.3 mM
C18:2 n-6) on bovine adipocyte cultures on d 19. .........................52
2.2. Main effect of linoleic acid supplementation (0 or 0.3 mM
C18:2 n-6) on stearoyl-CoA desaturase 1 (SCD1) mRNA
expression in bovine adipocyte cultures on d 19 ...........................53
2.3. Desaturation indices of bovine adipocytes treated with 0 or 0.3
mM linoleic acid ............................................................................54
2.4. Real-time qRT-PCR data of bovine adipocytes cultured to d 2,
6, or 12 with 0 mM or 0.3 mM linoleic acid (C18:2 n-6) ..............56
3. SUPPLEMENTAL PALMITOLEIC ACID (C16:1 cis-9) REDUCES
LIPOGENESIS AND DESATURATION IN BOVINE ADIPOCYTE
CULTURES
3.1. Nomarski interference contrast microscopy at 40X
magnification showed morphological change in cells on d 2
and lipid filling in palmitoleic acid-supplemented cells on d
6 and d 12 post-differentiation .......................................................78
3.2. Scatterplot and linear regression of total fatty acids,
palmitoleic (C16:1), cis-vaccenic (C18:1 cis-11), and
eicosenoic (C20:1 cis-13) acids by level of palmitoleic acid
supplementation .............................................................................79
ix
3.3. Linoleic acid (C18:2n-6) in bovine adipocytes supplemented
with 0, 50, 150, or 300 M palmitoleic acid ..................................80
3.4. Tracer-to-tracee ratio (TTR) and fractional synthetic rate for
the production of 13
C16:0 from 1-13
C2 (lipogenesis) and 1-13
C18:1 cis-9 from 1-13
C18:0 (desaturation) in bovine
adipocyte cultures treated with palmitoleic acid, respectively ......82
3.5. Relative expression of lipogenic genes in cells supplemented
with 0, 50, 150, and 300 M C16:1 to d 6 post-
differentiation .................................................................................83
4. PALMITOLEIC (C16:1 cis-9) AND CIS-VACCENIC ACID (C18:1 cis-11)
ALTER LIPOGENESIS IN BOVINE ADIPOCYTE CULTURES
4.1. Elongation of C16:1 to C18:1 cis-11 in bovine adipocyte
cultures .........................................................................................108
4.2. Lipogenesis in bovine adipocyte cultures treated with 0 M fatty
acid (control), 150 M palmitoleic or cis-vaccenic acid .............110
4.3. Desaturation of C18:0 to C18:1 cis-9 in bovine adipocyte
cultures treated with 0 M fatty acids (control), 150 M
palmitic, palmitoleic, or cis-vaccenic acid. ..................................111
4.4. Relative expression of genes associated with lipogenesis in
bovine adipcytes supplemented with 0 M fatty acids
(control) or 150 M palmitic, palmitoleic or cis-vaccenic acid ..112
1
CHAPTER 1: FATTY ACIDS IN RUMINANTS
INTRODUCTION
Nutrition plays an integral role in animal production systems; it impacts
maintenance, growth, health, and reproduction. Maximizing efficiency and optimizing
nutrient partitioning of the diet are economical goals of most producers. An animal‟s
excess energy is stored as fat in adipocytes, which are the functional, energy-storage units
of the body. Fat has both positive and negative aspects for producers. In the beef
industry, USDA grading standards estimate cutability and eating quality of the lean tissue
to determine carcass value. Yield and quality grades applied to beef carcasses are highly
influenced by the abundance of subcutaneous and intramuscular fat, respectively. Excess
subcutaneous fat can decrease carcass value in addition to wasting dietary energy, an
estimated financial loss of $1.3 billion annually (National Beef Quality Audit, 2000).
However, intramuscular fat, or marbling, is an estimate of eating quality of the meat and
usually results in a premium price. Tenderness, the key determinant of a steak‟s eating
quality, is associated with marbling. In addition, consumers prefer steaks that are high in
marbling rating them better in terms of juiciness, flavor, and overall acceptability than
steaks of the same tenderness level with low marbling scores (Killinger et al., 2004).
Therefore, the abundance of fat in meat products has financial and health implications to
both producers and consumers.
The composition of fat in animal products is also important to consumers and
producers. Meat and milk are the primary end-products of economic importance in
animal-production agriculture. Flavor, a major indicator of consumer acceptability and
2
species-determination, can be greatly affected by fatty acid composition. Health
concerns have arisen in recent years regarding fatty acid composition of animal products
in the human diet. In general, saturated fatty acids (SFA) in the human diet are
associated with elevated cholesterol levels (Hegsted et al., 1965), an exception being
stearic acid (C18:0) (Denke and Grundy, 1991). However, monounsaturated fatty acids
(MUFA) and polyunsaturated fatty acids (PUFA) in the human diet can reduce serum
cholesterol levels (Mattson and Grundy, 1985; Table 1). The composition and quantity
of white adipose tissue found in meat is greatly influenced by the animal‟s nutrition. For
instance, cattle finished on grain have greater MUFA in intramuscular fat compared with
cattle finished on forage, which have greater C18:0 and PUFA (Williams et al., 1983).
The time on feed can also impact quantity and composition of intramuscular fat in cattle
(Duckett et al., 1993). During the finishing-stage in cattle production, approximately 14
to 18 mo. of age, intramuscular fat deposition is the result of both hyperplasia, increase in
cell number, and hypertrophy, increase in cell size (Hood and Allen, 1973). Although
cell number and size both increase during animal maturation, 70% of fat accumulation is
the result of hypertrophy (Robelin et al., 1985) with most hyperplasia of subcutaneous
and perirenal adipose depots complete by 8 mo. of age (Hood and Allen, 1973).
Preadipocytes, cells responsible for hyperplasia, are of mesenchymal lineage and have
the ability to propagate or commit to differentiation (Gesta et al., 2007). With an increase
in excess energy, preadipocytes differentiate into mature adipocytes, which have the
ability to synthesize, take up, and store fat. Adopting feeding, targeted molecular
3
biotechnology strategies, or both to alter abundance and composition of adipose tissue
could improve production efficiency and quality of meat.
Prior to the discovery of leptin (Zhang et al., 1994), the primary effector of
satiety, white adipose tissue was thought to be solely an energy-storage unit, inert, with
no metabolic function as reviewed by McGillis (2005). Since then, adipokines, such as
adiponectin, have been discovered as cell-to-cell signaling hormones which are
exclusively expressed by adipocytes and associated with several inflammatory responses
(MacDougald and Burant, 2007). Additionally, eicosanoids are a class of hormones
derived from essential fatty acids, predominantly arachidonic acid (C20:4n-6). Three
main types of eicosanoids, leukotrienes, thromboxanes, and prostaglandins, have also
been associated with reproduction, inflammatory, and other immune-based physiologic
processes. An even newer concept in the role for adipocytes in whole body metabolism
is that fatty acids, themselves, can act as cell signals. Cao et al. (2008) identified a
particular fatty acid, palmitoleic acid (C16:1 cis-9), present in low levels throughout
bodily tissues that acts as a hormone to regulate lipogenesis and coined the term
“lipokine”. While a full understanding of the regulatory functions of adipocytes and their
constituents has not been realized in the literature, data support adipose tissue to be a
diverse endocrine organ that can affect whole body metabolism in addition to serving as
an energy reservoir. Many disease states are already associated with altered fatty acid
metabolism including cardiovascular disease, type II diabetes, obesity, and some cancers.
Less known are the regulatory functions of adipocytes that maintain homeostasis or
promote health.
4
FATTY ACIDS AND LIPOGENESIS
Fatty acids are generally classified as saturated or unsaturated, based on the
bonding pattern that occurs within the hydrocarbon skeleton of the fatty acid molecule.
Fatty acids are composed of a carboxylic acid group attached to a hydrocarbon chain of
varying length. If each carbon in the chain has the maximum possible number of
hydrogen atoms attached to it, or no double bonds, the fatty acid molecule is considered
saturated. Conversely, if there is at least one double bond between two carbon atoms in
the hydrocarbon chain, the fatty acid is unsaturated. A MUFA has only one double bond
and a PUFA has two or more double bonds present within its hydrocarbon chain. Most
animal fats are high in SFA, whereas plant oils are mostly comprised of PUFA. The two
essential PUFA required by ruminants are linoleic acid (C18:2n-6), an omega-6 fatty
acid, and linolenic acid (C18:3n-3), an omega-3 fatty acid. With the exception of
common names, fatty acid nomenclature uses the carbon length, double bond location,
and geometric structure to designate specific fatty acids. „Lipid numbers‟ is the most
widely used naming system. It uses a Cx:yz structure, where x is the number of carbons,
y is the number of double bonds, and z lists the geometry and location of each double
bond as cis- or trans-, counting from the carboxylic acid end. For example, oleic acid
(C18:1 cis-9) is an 18 carbon fatty acid with one double bond in the cis- position between
the 9th
and 10th
carbons. With some PUFA, in lieu of listing all double bond locations
and geometry, an omega designation is often used. As the name implies, omega refers to
the last carbon in the hydrocarbon chain, or the methyl carbon. Counting back toward the
carboxylic acid end, the location of the first double bond is used for naming. For
5
instance, linolenic acid can be listed as C18:3 cis-9, cis-12, cis-15 or simply C18:3n-3
because the double bond is on the third carbon away from the methyl end.
Fatty acids stored in adipocytes can come from two sources: diet or de novo
synthesis. For most animals, dietary fatty acids are separated from their larger fat
particles and lipid molecules in the lumen of the small intestine by bile salts and
pancreatic lipase. Fatty acids are absorbed into intestinal epithelium, reassembled into
triglycerides, and passed into the bloodstream for transport to the liver before traveling to
the rest of the body as components of lipoproteins. The liver is a critical organ in the
conversion of fatty acids into various forms which are used throughout the body. Dietary
fatty acids are then incorporated into body tissues and fluids where they can play a
dynamic role in hormone synthesis. Due to biohydrogenation of lipids in rumen of
pregastric fermentors, energy metabolism has developed a little differently in these
animals. Ruminants have adapted over thousands of years to digest a wide variety of
feedstuffs with the aid of a symbiotic relationship with microbial organisms in their gut.
These microbes are capable of digesting structural carbohydrates that most mammals are
incapable of utilizing. However, due to the microbial rumen environment, most dietary
nutrients are only available to the animal second-hand. The primary energy substrate
ruminants receive from the diet is not glucose, but volatile fatty acids (VFA), which are
waste products of carbohydrate fermentation by microbes (Vernon, 1980; Smith and
Crouse, 1984). Lipids are another example of a microbially-modified nutrient, as dietary
unsaturated fatty acids undergo biohydrogenation in the rumen.
6
Unsaturated fatty acids are toxic to the rumen‟s microbial population, especially
to those responsible for fiber digestion; therefore, the microbes have adapted the use of
biohydrogenation to solve this problem. Biohydrogenation sequentially removes double
bonds and makes unsaturated fatty acids increasingly more saturated. Biohydrogenation
decreases, but does not eliminate, the amount of PUFA available to the animal. In
forage-based diets, PUFA are in the form of galactolipids. This is a molecule that has
two fatty acids attached to a glycerol backbone with a galactose bound to the third carbon
(monogalactosyl diacylglycerol). Additional galactose residues can be attached to the
glycerol-bound galactose, increasing the fermentability of the galactolipid. In grain-
based diets, triglycerides are the primary form of lipid. A triglyceride is a molecule with
three fatty acids bound to a glycerol backbone. For these lipids to be absorbed, they are
broken down into free fatty acids (FFA), galactose, and glycerol. Microbes produce
galactosidases which cleave galactoses from the glycerol molecule, resulting in free
sugars and diacylglycerol. Microbial lipases cleave the fatty acids from the glycerol.
Also, microbes in the rumen have general esterases and extracellular lipase that result in
the separation of triglycerides and diacylglycerides into FFA and glycerol. Once the fatty
acids are „free‟, they are susceptible to biohydrogenation. There are several pathways for
biohydrogenation, and research has not clearly elucidated all the possible routes of
biohydrogenation. The process by which double bonds are removed from the carbon
backbone are PUFA specific and have evolved to use the least amount of energy based on
the positioning of the bonds. The primary end-product of C18:2n-6 and C18:3n-3
biohydrogenation is C18:0 (Noble et al., 1974; Jenkins and Bridges, 2007; Lee and
7
Jenkins, 2011). However, not all fatty acid molecules are fully saturated during the
biohydrogenation process; PUFA and biohydrogenation intermediates escape the rumen
and can be found in animal plasma, tissue, and milk.
Microbes in the rumen ferment carbohydrates into VFA which are absorbed
across the epithelial lining of the rumen, reticulum, and omasum. There is no active
transport of VFA; they travel by passive diffusion down the concentration gradient. The
rate of absorption, equal for all pregastric stomach compartments, is positively correlated
with decreasing pH and increasing VFA chain length. The three predominant VFA are
acetate, propionate, and butyrate, and each has a distinct fate in metabolism. A small
amount of propionate, about 5%, is converted to lactate by the rumen epithelium and the
majority is sent to the liver for gluconeogenesis. Butyrate is extensively metabolized into
ketone bodies in the rumen epithelium: acetoactetate, -hydroxybutyrate, or acetone.
Approximately 5% of acetate is converted into ketone bodies by the rumen epithelial
cells, but the majority of acetate is transported to the liver where it is converted to acetyl-
CoA. Of this acetyl-CoA, 80% is circulated to the rest of the body while the remaining
20% enters the citric acid cycle for ATP production. In the peripheral tissues, acetyl-
CoA is predominantly used as a substrate for de novo fatty acid synthesis in adipose
tissue (Figure 1). Cattle have very little to no citrate lyase activity. Therefore, they use
very little glucose as a carbon source for fatty acid synthesis, but can utilize acetyl-CoA
directly. However, glucose contributes a relatively greater proportion of acetyl units to
fatty acid biosynthesis in intramuscular adipose tissue compared with subcutaneous
adipose tissue in cattle (Smith and Crouse, 1984). In ruminants, the primary site of fatty
8
acid synthesis is white adipose tissue, as opposed to most nonruminants where the
primary site of fatty acid synthesis is the liver.
Fatty acid synthesis begins with the committed step of adding a carboxyl group to
acetyl-CoA, forming malonyl-CoA, by acetyl-CoA carboxylase (ACC). Fatty acid
synthase (FASN) is a large, multimeric protein that binds acetate and malonyl-CoA or
another fatty acyl-CoA. It uses NADPH in a series of sequential reactions to condense
the substrates into a SFA product that is two carbons longer than the original malonyl- or
fatty acyl-CoA. The process is repeated until the fatty acid reaches a length of 16
carbons, palmitoyl-CoA (Figure 1). Short and medium chain fatty acids can enter this
process at any step. As FASN is not able to elongate fatty acids greater than 16C, a
family of elongase enzymes (ELOVL) is responsible for elongating fatty acids after this
point (Figure 1). Stearoyl-CoA desaturase (SCD) is a 9 desaturase that it inserts a cis-
double bond between carbons 9 and 10 on the hydrocarbon chain, counting from the
carboxyl end (Ntambi, 1999). Animals do not have a 12
or 15
desaturase; therefore,
dietary plant material is the primary source C18:2 n-6 and C18:3 n-3. Arachidonic acid
(C20:4 n-6) is also considered an essential fatty acid in most mammalian species due to a
reduced capacity or inability to synthesize it from C18:2 n-6 in sufficient quantities to
meet the demands of the body. These pathways in combination with dietary fatty acids
subjected to biohydrogenation result in a variety of fatty acid products. In order from
greatest to least, the major fatty acids present in beef are C18:1 cis-9, palmitic acid
(C16:0), C18:0, and C18:2 n-6 (Duckett et al., 1993). The order of predominance
changes if cattle are finished on a forage-based diet compared with the traditional grain-
9
based diet to: C18:1 cis-9, C16:0, C18:0, C16:1, and C18:2 n-6 (Pavan and Duckett,
2008). Other fatty acids of importance to human health that are present in beef are
conjugated linoleic acids (CLA) and omega-3 fatty acids (Table 1). Once synthesized or
processed in adipocytes, free fatty acids can be packaged into triglycerides for storage,
sphingolipids and phospholipids for membrane components, cholesterols and eicosanoids
for hormone production. In addition, fatty acids can undergo -oxidation to provide ATP
as energy to cells and tissues (Figure 1).
10
ADIPOGENESIS
Adipogenesis is defined as the differentiation of preadipocytes into functional
adipocytes. Cellular changes due to adipogenesis are characterized by cell morphology
change, gene and protein expression, and function of the cell. Differentiation is initiated
through extracellular signals altering gene expression at the transcriptional and translation
level. The full developmental origins of preadipose tissue from a single cell are
unknown, but are thought to have mesodermal origins (Ntambi and Kim, 2000;
Cornelius et al., 1994). In humans, preadipocytes begin to differentiate into adipose
tissue during late embryonic development and majority of differentiation occurring
shortly after birth (Burdi et al., 1985). In mice and rats, preadipocytes do not begin to
differentiate until after birth (Ailhaud et al., 1992). Early-onset obesity in humans is a
result of both hyperplasia and hypertrophy of adipose tissue, but adult-onset obesity is
primarily a result of adipocyte hypertrophy (Hirsch and Batchelor, 1976). However,
morbidly obese humans, those greater than 170% of ideal body fat, display both
hyperplasia and hypertrophy of adipocytes (Hirsch and Batchelor, 1976). Fat deposition
in finishing cattle is resultant from a combination hyperplasia and hypertrophy; 70% of
which is due to the latter (Robelin et al., 1985).
Most of the work characterizing adipogenesis has been conducted using murine in
vivo and in vitro models. In cell culture models, a hormone cocktail is commonly used to
initiate differentiation, although fatty acids or sheer confluence of the cells can also
induce a level of differentiation (Ntambi and Kim, 2000). In vivo, the process is less
clear, but assumed to be regulated through energy status signaling. With increasing
11
excess energy, differentiation of cells increases to meet the storage demands (Ntambi and
Kim, 2000). The changes in gene transcription that ultimately lead to altered cell
function as mature adipocytes are initiated by transcription factors (Figure 2). Some of
the first transcription factors to increase at the onset of differentiation are
CCAAT/enhancer binding proteins (C/EBP)- and . The C/EBP- isoform is
thought to be mediated by C/EBP- and – (Ntambi and Kim, 2000). These C/EBP
increase within 1 h and dissipate within 24 h in differentiating cells (Cornelius et al.,
1994). Next, peroxisome proliferator-activated receptor (PPAR)- and – increase and
are also thought to be mediated by C/EBP- and – (Clarke et al., 1997). Based on
mouse research, the master regulator of adipocyte regulation is classically stated as
PPAR . It homodimerizes or heterodimerizes with retinoid X receptor or retinoic acid
receptor to promote transcription of lipogenic genes (Rosen et al., 2000). Adipocyte
protein 2 [aP2, also known as fatty acid binding protein 4 (FABP4)], sterol regulatory
element binding protein (SREBP), and SCD mRNA expression increase around day 2 to
4 after initial differentiation (Amri et al., 1991). Sterol regulatory element binding
protein is proteolytically matured by SREBP-cleavage activating protein which senses
falling sterol levels within the cell and transports SREBP from the membrane of the
endoplasmic reticulum to the Golgi complex. In the Golgi membrane, site 1 protease and
site 2 protease sequentially cleave SREBP into its mature form, n-SREBP, which is
transported to the nucleus of the cell. There, it binds to the sterol response element of
lipogenic genes. The three known isoforms of SREBP are -1a, -1c, and -2. All SREBP-
responsive genes can be induced by SREBP-1a, but SREBP-1c and SREBP-2 specifically
12
activate fatty acid and cholesterol synthesis genes, respectively (Brown and Goldstein,
1997; Horton et al., 2002; Eberlé et al., 2004).
Stearoyl-CoA desaturase could be used as an indicator of differentiation timing in
vivo (Martin et al., 1999). Growing cattle, 5 to 12 mo of age, showed increased SCD
gene expression in subcutaneous adipose tissue that peaked at 12 mo of age (Martin et al.,
1999). Following this peak, cellularity of the adipose tissue changed with increased lipid
filling. As stated earlier, cattle finished on high concentrate diets have altered fatty acid
profiles and lipid deposition rates compared to pasture-finished animals (Pavan and
Duckett, 2008). Therefore, diets of finishing cattle could be used to impact adipose
tissue at the level of differentiating cells, lipid-filling adipocytes, or both. In addition to
diet and depot having an effect on adipogenesis in vivo, the depot of fat that
preadipocytes are cultured from can have a profound effect on their performance in vitro.
For instance, Grant et al. (2008a) reported that cells isolated from subcutaneous fat had
6.4-fold greater percentage of differentiated cells within individual colonies than cells
isolated from intramuscular fat. In addition, cultures derived from subcutaneous fat had
greater response to differentiation media than cultures from omental adipose tissue (Wu
et al., 2000). Wu et al. (2000) found that cells from different tissues responded to
exogenous hormones differently with the greatest degree of hormonally-induced
differentiation in subcutaneous fat. However, Grant and others saw no differential
effects of troglitazone (TRO) on the differentiation of subcutaneous or intramuscular
cells (2008a).
13
A majority of research on the regulation of adipogenesis has been conducted with
murine models and in vitro studies using the immortalized 3T3-L1 cell line derived from
disaggregated Swiss 3T3 mouse embryos (Green and Kehinde, 1974), although, some
research has gone into creating and characterizing primary and clonally-derived bovine
preadipocyte cell lines (Grant et al., 2008a and b; Taniguchi et al., 2008a and b). Classic
hormones used to differentiate cells in vitro are isobutylmethylxanthine (IBMX), insulin,
TRO, and dexamethasone (DEX). The first hormone listed, IBMX, is a
phosphodiesterase inhibitor which increases cAMP and protein kinase A, which are part
of an intracellular signaling cascade that ultimately lead to increased transcription factor
activity including C/EBP- (Ntambi and Kim, 2000). Insulin acts through the insulin-
like growth factor-1 receptor, which is a tyrosine kinase receptor, to stimulate
transcription factor activity. Members of the thiazolindedione drug class, such as TRO,
function as a PPAR agonists (Kim et al., 2000; Grant et al., 2008b). Dexamethasone is a
synthetic glucocorticoid that binds to a glucocorticoid receptor in the nucleus of the cell,
or in cytosol of the cell and translocates to the nucleus (Ntambi and Kim, 2000). Once in
the nucleus, the glucocorticoid-receptor complex homodimerizes and binds to the
glucocorticoid response element on the DNA strand.
There are 2 general methods for isolating stromal-vascular (SV) cultures from
bovine adipose tissue: enzymatic digestion and tissue explants. Each method has its own
positives and negatives. For instance, enzyme digestion yields faster establishment of
cultures, but tissue explants require less starting material and result in „cleaner‟ cultures
with less cellular debris. Fernyhough et al. (2005) detailed methodology of another
14
method of culture isolation where adipocytes, not preadipocytes, are specifically targeted.
The basis of this approach is founded on the potential for adipocytes to „de-differentiate‟,
where mature, lipid-filled adipocytes revert back to a propogative state. The concept of
de-differentiation disputes the idea that once cells accumulate lipid for storage, they are
terminally differentiated. Aso et al. (1995) developed clonal preadipocyte cell lines with
recombinant bovine fibroblast growth factor and differentiated cells with glucose, insulin,
DEX, and acetate. Regardless of the isolation method, several laboratories have
published papers pertaining to the gene expression and differentiation of bovine
adipocytes in vitro. Grant et al. (2008a) demonstrated that bovine preadipocytes were
capable of differentiating in response to combinations of insulin, serum lipids, DEX, and
TRO. They also titrated an optimum level of TRO supplementation in vitro to induce
differentiation in bovine primary SV cultures (2008b). Data used to support the
occurrence of differentiation included Oil Red O staining of lipid in cells and increased
glycerol-3-phosphate dehydrogenase (GPDH) protein and activity. Hirai et al. (2007)
also reported on SV-culture isolation via collagenase digestion and differentiation of
cultures. Using insulin, IBMX, TRO, and DEX, they reported successful differentiation
of cultures evidenced by Oil Red O staining, GPDH activity, Northern blot of aP2 mRNA
expression, and semi-quantitative PCR of C/EBP- ,- and PPAR mRNA. In another
study, insulin, IBMX, and DEX were used to initiate differentiation and followed by the
addition of intralipid or lipoproteins, which enhanced differentiation in cultures (Wu et
al., 2000). Lengi and Corl (2010), who use the tissue explant method of SV isolation,
tested several different reported hormone media for their efficacy to induce
15
differentiation. The objective measures of differentiation used were radiolabeled acetate
incorporation (1,2-14
C2) into cellular lipids, GPDH activity, and mRNA expression of
aP2, PPAR , and ACC (Lengi and Corl, 2010). All media combinations tested positive
for at least parameter of differentiation compared with the no hormone-added controls.
Expression of aP2 and PPAR mRNA was elevated with the Aso et al. (1995) and Wu et
al. (2000) media; whereas, ACC mRNA expression and acetate incorporation were
elevated with the Wu et al. (2000) and Hirai et al. (2007) media. Addition of TRO or
roglitazone, another member of the thiazolidinediones drug class, to the Wu et al. (2000)
media further enhanced differentiation in all parameters tested (Lengi and Corl, 2010).
Despite the amount of literature on differentiation and gene expression, no fatty acid
composition data has been reported in bovine adipocyte cultures to date. As lipogenic
genes are activated during the course of differentiation, the fatty acid composition may be
subject to change also.
16
FATTY ACID REGULATION
Regulation of de novo fatty acid synthesis can occur at many different levels:
transcription of mRNA, translation of message into protein, and activity of the protein.
Each enzyme in the lipogenesis pathway can be regulated (Table 2), in addition to
cellularity of adipose tissue. The first enzyme in fatty acid synthesis acetyl-CoA
carboxylase (ACC) is regulated allosterically and by phosphorylation. Citrate activates
ACC by changing its conformation to a multimeric, filamentous complex, and palmitoyl-
CoA inactivates ACC by promoting a monomeric, or protomer, form. Insulin-activated
protein phosphotase activates ACC by dephosphorylation, and AMP-activated kinase
inactivates it by phosphorylation. Regulation of ACC can also occur at the level of
transcription, but is not the primary mechanism. The next enzyme responsible for de
novo fatty acid synthesis, FASN, is transcriptionally regulated. Insulin stimulates its
expression by mediating upstream regulatory factors and SREBP (Eberlé et al., 2004).
Leptin diminishes its expression inhibiting SREBP and directly blocking FASN
transcription. Regulation of SCD is predominantly at the transcription level; although, it
can be directly inhibited by sterculic acid, a cyclopropenoid fatty acid (Gomez et al.,
2003). Expression of SCD is sensitive to many dietary factors, hormones, and SREBP-1c
activity (Tabor et al., 1999; Ntambi and Miyazaki, 2004). The elongase proteins are also
thought to be regulated at the transcription level (Matsuzaka et al., 2002). Transcription
factors that regulate ELOVL6 include SREBP and PPAR ; ELOVL5 expression is up-
regulated PPAR and not by SREBP (Wang et al., 2006). Allosteric regulation of
17
ELOVL6 is also being investigated using a synthetic, chemical inhibitor (Shimamura et
al., 2009; Shimamura et al., 2010).
Stearoyl-CoA desaturase is the rate-limiting enzyme in the production of MUFA
from SFA. It is one of several markers for differentiation of preadipocytes into mature
adipocytes, along with aP2 and PPAR (Chawla et al., 1994; Ohsaki et al., 2007).
Stearoyl-CoA desaturase is called a 9 desaturase because it inserts a cis-double bond
between the 9th
and 10th
carbons in the hydrocarbon skeleton, counting from the carboxyl
end (Ntambi, 1999). The preferred substrates for SCD are palmitoyl- and stearoyl-CoA,
which become palmitoleoyl- and oleoyl-CoA, respectively. Also, SCD can convert
trans-vaccenic acid (C18:1 trans-11), a biohydrogenation intermediate, to CLA cis-9,
trans-11, a potent anticarcinogen (Parodi, 1997). Because of its role in biosynthesis of
MUFA, SCD can impact membrane fluidity and composition of stored triglycerides by
changing the ratio of SFA: MUFA. While transcription of SCD mRNA is thought to be
controlled primarily by SREBP that binds to sterol response element in the promoter
region of the SCD gene, it is also regulated by many other factors (Eberle et al., 2004;
Lay et al., 2002). As reviewed by Ntambi and Miyazaki (2004), glucose, cholesterol,
vitamins A and D, insulin, and estrogen increase SCD expression, but PUFA, leptin,
glucagon, and thiazolidinediones decrease it. In addition to PUFA‟s control over SCD
expression, SCD is regulated in part by its products and not by the availability of its
substrates (Keating et al., 2006). For instance, the addition of CLA cis-9, trans-11
reduces expression of SCD mRNA, but increasing amounts of C18:1 trans-11 does not.
The promoter region of the SCD gene is thought to contain a fat specific element, PUFA
18
response element, and SREBP-response region (Keating et al., 2006). Decreased SCD
expression seen in murine and mammary cells treated with C20:4 n-6 and CLA trans-10,
cis-12 may be a result of altered promoter binding at the PUFA response element of the
SCD gene.
The majority of research focused on SCD has used the rodent model or the
immortalized cell line 3T3-L1. However, in contrast to the localized, hepatic-expression
of murine SCD, bovine SCD is expressed throughout the body in adipose tissue of
growing animals and also in the mammary gland of lactating animals (Martin et al., 1999;
St John et al., 1991). Four isoforms of SCD have been identified in mice and, thus far,
only two isoforms have been identified for SCD in ruminant species (Lengi and Corl,
2007; Ward et al., 1998). The SCD1 isoforms in cattle, goats, and sheep are homologs
and similar to murine SCD1; the SCD5 isoform, once thought to be unique to primates,
is expressed in the brain and pancreas of humans and cattle (Lengi and Corl, 2007; Wang
et al., 2005). Despite inherent differences in ruminant adipose tissue metabolism that
exist compared to monogastric animals, in terms of glucose uptake and de novo synthesis
of fatty acids from acetate (Aso et al., 1995), they are similar with respect to location of
SCD isoform expression.
There is also a relationship between SCD expression and obesity. High levels of
SCD are seen in obese human patients, as well as the insulin-resistant, obese Zucker rats
(Hulver et al., 2005; Voss et al., 2005). It remains to be determined if elevated SCD is
the causal agent in adiposity or if increased SCD is simply a product of greater
abundance of white adipose tissue in obese animals. Therefore, investigation of SCD
19
over-expression may lead to valuable insights into the role of SCD in vivo, especially in
regards to tumor development, obesity, and type II diabetes. Stearoyl-CoA desaturase
over-expression has been associated with increasing MUFA, decreasing SFA, and
subsequent weakening of cellular membranes (Sun et al., 2003). With increasing
amounts of SCD, the primary products of its enzymatic reaction, C18:1 cis-9 and C16:1,
increase, provided that substrates are available. Increasing ratios of C18:1 cis-9/C18:0
are associated with certain types of tumors, thus implicating SCD in carcinogenesis
(Khoo et al., 1991). In particular, high levels of SCD have also been related to several
conditions that are directly linked with hepatocarcinogenesis in humans, including
hepatosteatosis (Falvella et al., 2002). Research involving over-expression of SCD in
adipocytes is limited, due in part to the difficulties associated with transfecting fat cells.
Gene knock-down and silencing techniques have been used most often to investigate the
role of SCD.
Prime animal models for the study of SCD are the SCD1-deficient asebia mice
and SCD1-knockout mice. Some of the effects of SCD knockdown in mice are visually
evident. Mice with targeted disruption of the SCD1 gene are leaner than their wildtype
counterparts and resistant to diet-induced adiposity (Ntambi et al, 2002). Whole gene
deletions of SCD1 in mice also result in a lean phenotype, but have poor hair coat and dry
eyelids due to atretic sebaceous and meiobium glands thought to be caused by increased
circulation of free cholesterols previously associated with cell death (Ntambi and
Miyazaki, 2004). Other non-visible characteristics of SCD1 depression are increased
insulin sensitivity, glucose transporter 4 (GLUT4) receptors, and metabolic rate (Rahman
20
et al., 2003; Ntambi et al., 2002). Differentiation of non-ruminant preadipocytes
increases insulin-stimulated glucose uptake by GLUT4 (Kaestner et al., 1989). In mice,
SCD knockout increases the levels of GLUT4 in the cellular membranes (Rahman et al.,
2003). However, in bovine preadipocytes and adipocytes, Aso et al. (1995) reported that
GLUT4 was not active. To date, SCD1 or SCD5 knockdown has not been performed on
bovine adipocytes. If SCD is absent, biosynthesis of MUFA from SFA cannot proceed,
and SFA will accumulate in the cell, potentially causing cell death due to lipotoxicity.
Lipotoxicity, an event that triggers apoptosis, has been associated with high levels of
SFA and can be attenuated by supplementation with unsaturated fatty acids (Hardy et al.,
2000; Listenberger et al., 2003). In murine hepatocytes, C16:0 induced apoptosis, but
C18:1 cis-9 rescued cells from C16:0-induced apoptosis and promoted lipid filling in
hepatocytes (Li et al., 2009).
Similar to results seen with SCD1-deficient mice, aP2-deficient mice also show
protection against diet-induced obesity, reduced hepatosteatosis, and improved insulin
sensitivity (Hotamisligil et al., 1996; Newberry et al., 2006). These are interesting
systemic effects as expression of this lipid chaperone, as well as SCD1 expression, is
very tissue specific. In addition, there seems to be depot-specific regulation of lipogenic
genes as mRNA expression of ACC, FASN, SCD1, and ELOVL6 were all down-
regulated in liver and up-regulated in the epididymal fat pad of aP2-knockout mice (Cao
et al., 2008). Analysis of lipid profiles in these tissues revealed palmitoleic acid (C16:1
cis-9), a product of the SCD1 reaction, was significantly elevated in aP2-knockout
compared to wildtype mice for all lipid classes analyzed: free fatty acids, triglycerides,
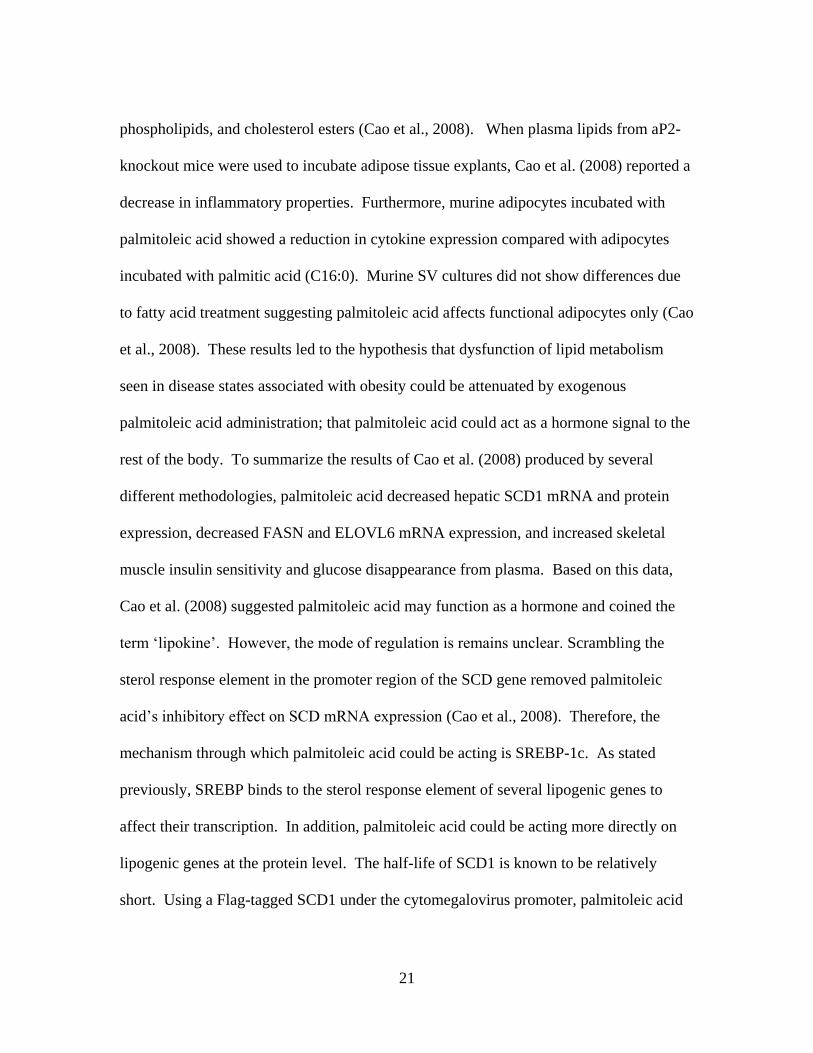
21
phospholipids, and cholesterol esters (Cao et al., 2008). When plasma lipids from aP2-
knockout mice were used to incubate adipose tissue explants, Cao et al. (2008) reported a
decrease in inflammatory properties. Furthermore, murine adipocytes incubated with
palmitoleic acid showed a reduction in cytokine expression compared with adipocytes
incubated with palmitic acid (C16:0). Murine SV cultures did not show differences due
to fatty acid treatment suggesting palmitoleic acid affects functional adipocytes only (Cao
et al., 2008). These results led to the hypothesis that dysfunction of lipid metabolism
seen in disease states associated with obesity could be attenuated by exogenous
palmitoleic acid administration; that palmitoleic acid could act as a hormone signal to the
rest of the body. To summarize the results of Cao et al. (2008) produced by several
different methodologies, palmitoleic acid decreased hepatic SCD1 mRNA and protein
expression, decreased FASN and ELOVL6 mRNA expression, and increased skeletal
muscle insulin sensitivity and glucose disappearance from plasma. Based on this data,
Cao et al. (2008) suggested palmitoleic acid may function as a hormone and coined the
term „lipokine‟. However, the mode of regulation is remains unclear. Scrambling the
sterol response element in the promoter region of the SCD gene removed palmitoleic
acid‟s inhibitory effect on SCD mRNA expression (Cao et al., 2008). Therefore, the
mechanism through which palmitoleic acid could be acting is SREBP-1c. As stated
previously, SREBP binds to the sterol response element of several lipogenic genes to
affect their transcription. In addition, palmitoleic acid could be acting more directly on
lipogenic genes at the protein level. The half-life of SCD1 is known to be relatively
short. Using a Flag-tagged SCD1 under the cytomegalovirus promoter, palmitoleic acid
22
supplementation increased SCD1 degradation in hepatocytes; whereas, palmitic acid
stabilized it (Cao et al., 2008).
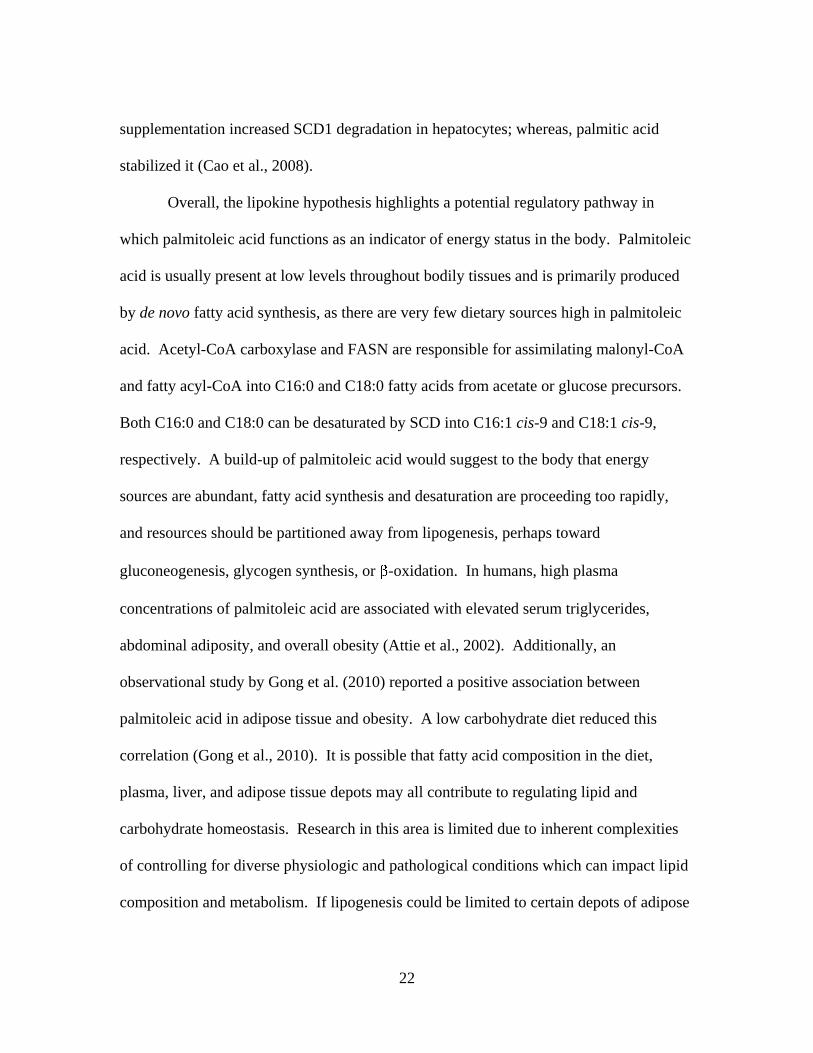
Overall, the lipokine hypothesis highlights a potential regulatory pathway in
which palmitoleic acid functions as an indicator of energy status in the body. Palmitoleic
acid is usually present at low levels throughout bodily tissues and is primarily produced
by de novo fatty acid synthesis, as there are very few dietary sources high in palmitoleic
acid. Acetyl-CoA carboxylase and FASN are responsible for assimilating malonyl-CoA
and fatty acyl-CoA into C16:0 and C18:0 fatty acids from acetate or glucose precursors.
Both C16:0 and C18:0 can be desaturated by SCD into C16:1 cis-9 and C18:1 cis-9,
respectively. A build-up of palmitoleic acid would suggest to the body that energy
sources are abundant, fatty acid synthesis and desaturation are proceeding too rapidly,
and resources should be partitioned away from lipogenesis, perhaps toward
gluconeogenesis, glycogen synthesis, or -oxidation. In humans, high plasma
concentrations of palmitoleic acid are associated with elevated serum triglycerides,
abdominal adiposity, and overall obesity (Attie et al., 2002). Additionally, an
observational study by Gong et al. (2010) reported a positive association between
palmitoleic acid in adipose tissue and obesity. A low carbohydrate diet reduced this
correlation (Gong et al., 2010). It is possible that fatty acid composition in the diet,
plasma, liver, and adipose tissue depots may all contribute to regulating lipid and
carbohydrate homeostasis. Research in this area is limited due to inherent complexities
of controlling for diverse physiologic and pathological conditions which can impact lipid
composition and metabolism. If lipogenesis could be limited to certain depots of adipose

23
tissue and glucose metabolism in skeletal muscle improved with the strategic use of
palmitoleic acid, it might serve as therapy for obesity and type II diabetes in humans, as
well as a tool for improved carcass characteristics and production efficiency in animal
agriculture.
24
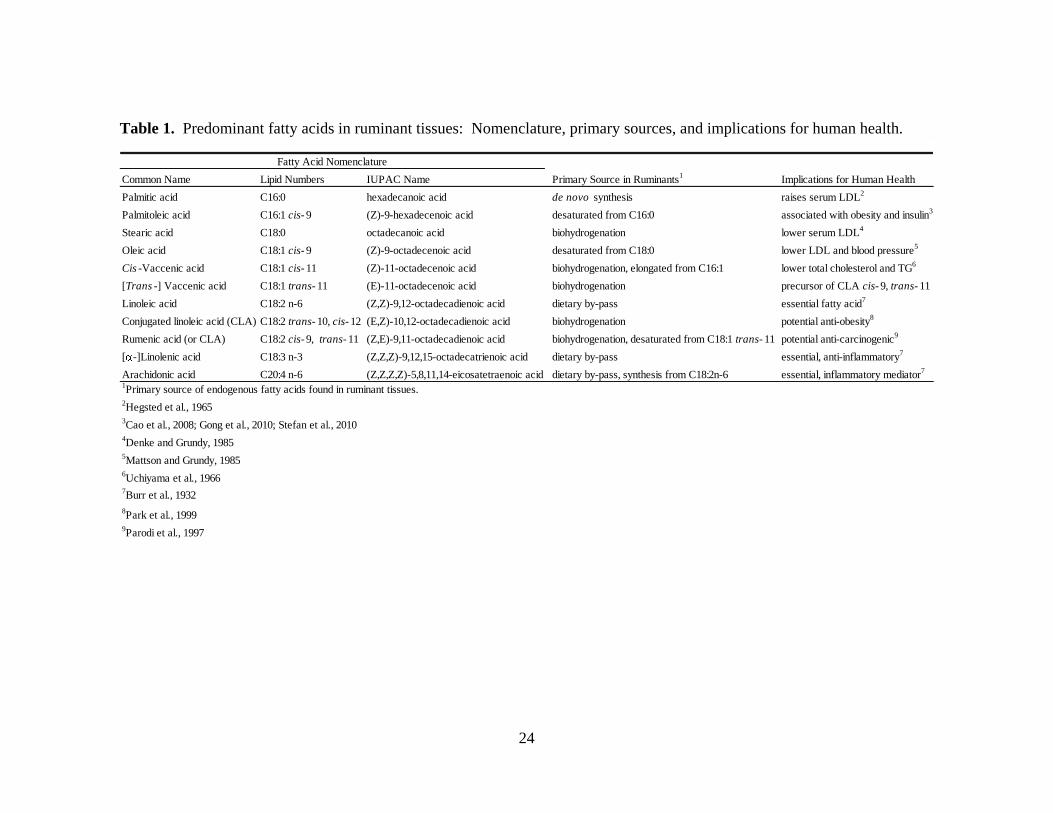
Table 1. Predominant fatty acids in ruminant tissues: Nomenclature, primary sources, and implications for human health.
Common Name Lipid Numbers IUPAC Name Primary Source in Ruminants1
Implications for Human Health
Palmitic acid C16:0 hexadecanoic acid de novo synthesis raises serum LDL2
Palmitoleic acid C16:1 cis- 9 (Z)-9-hexadecenoic acid desaturated from C16:0 associated with obesity and insulin3
Stearic acid C18:0 octadecanoic acid biohydrogenation lower serum LDL4
Oleic acid C18:1 cis- 9 (Z)-9-octadecenoic acid desaturated from C18:0 lower LDL and blood pressure5
Cis -Vaccenic acid C18:1 cis- 11 (Z)-11-octadecenoic acid biohydrogenation, elongated from C16:1 lower total cholesterol and TG6
[Trans -] Vaccenic acid C18:1 trans- 11 (E)-11-octadecenoic acid biohydrogenation precursor of CLA cis- 9, trans- 11
Linoleic acid C18:2 n-6 (Z,Z)-9,12-octadecadienoic acid dietary by-pass essential fatty acid7
Conjugated linoleic acid (CLA) C18:2 trans- 10, cis- 12 (E,Z)-10,12-octadecadienoic acid biohydrogenation potential anti-obesity8
Rumenic acid (or CLA) C18:2 cis- 9, trans- 11 (Z,E)-9,11-octadecadienoic acid biohydrogenation, desaturated from C18:1 trans- 11 potential anti-carcinogenic9
[ -]Linolenic acid C18:3 n-3 (Z,Z,Z)-9,12,15-octadecatrienoic acid dietary by-pass essential, anti-inflammatory7
Arachidonic acid C20:4 n-6 (Z,Z,Z,Z)-5,8,11,14-eicosatetraenoic acid dietary by-pass, synthesis from C18:2n-6 essential, inflammatory mediator7
1Primary source of endogenous fatty acids found in ruminant tissues.
2Hegsted et al., 1965
3Cao et al., 2008; Gong et al., 2010; Stefan et al., 2010
4Denke and Grundy, 1985
5Mattson and Grundy, 1985
6Uchiyama et al., 1966
7Burr et al., 1932
8Park et al., 1999
9Parodi et al., 1997
Fatty Acid Nomenclature
25
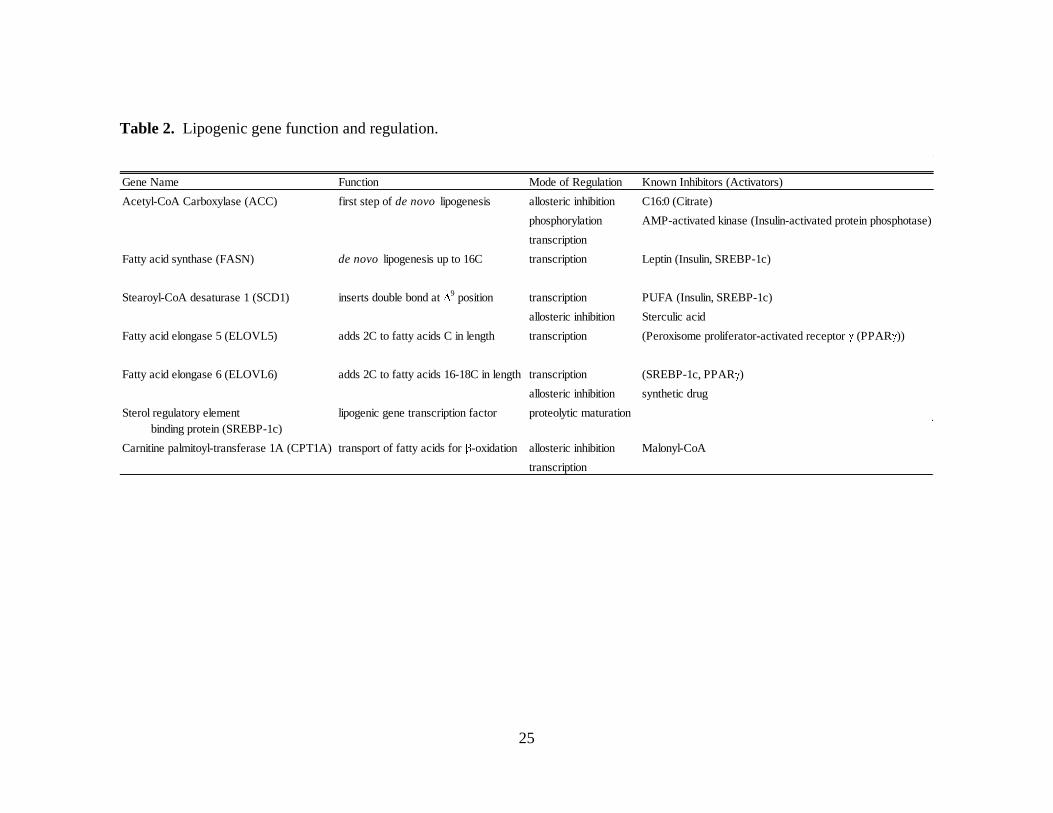
Table 2. Lipogenic gene function and regulation.
Gene Name Function Mode of Regulation Known Inhibitors (Activators)
Acetyl-CoA Carboxylase (ACC) first step of de novo lipogenesis allosteric inhibition C16:0 (Citrate)
phosphorylation AMP-activated kinase (Insulin-activated protein phosphotase)
transcription
Fatty acid synthase (FASN) de novo lipogenesis up to 16C transcription Leptin (Insulin, SREBP-1c)
Stearoyl-CoA desaturase 1 (SCD1) inserts double bond at 9 position transcription PUFA (Insulin, SREBP-1c)
allosteric inhibition Sterculic acid
Fatty acid elongase 5 (ELOVL5) adds 2C to fatty acids C in length transcription (Peroxisome proliferator-activated receptor (PPAR ))
Fatty acid elongase 6 (ELOVL6) adds 2C to fatty acids 16-18C in length transcription (SREBP-1c, PPAR )
allosteric inhibition synthetic drug
Sterol regulatory element lipogenic gene transcription factor proteolytic maturation
binding protein (SREBP-1c)
Carnitine palmitoyl-transferase 1A (CPT1A) transport of fatty acids for -oxidation allosteric inhibition Malonyl-CoA
transcription
26
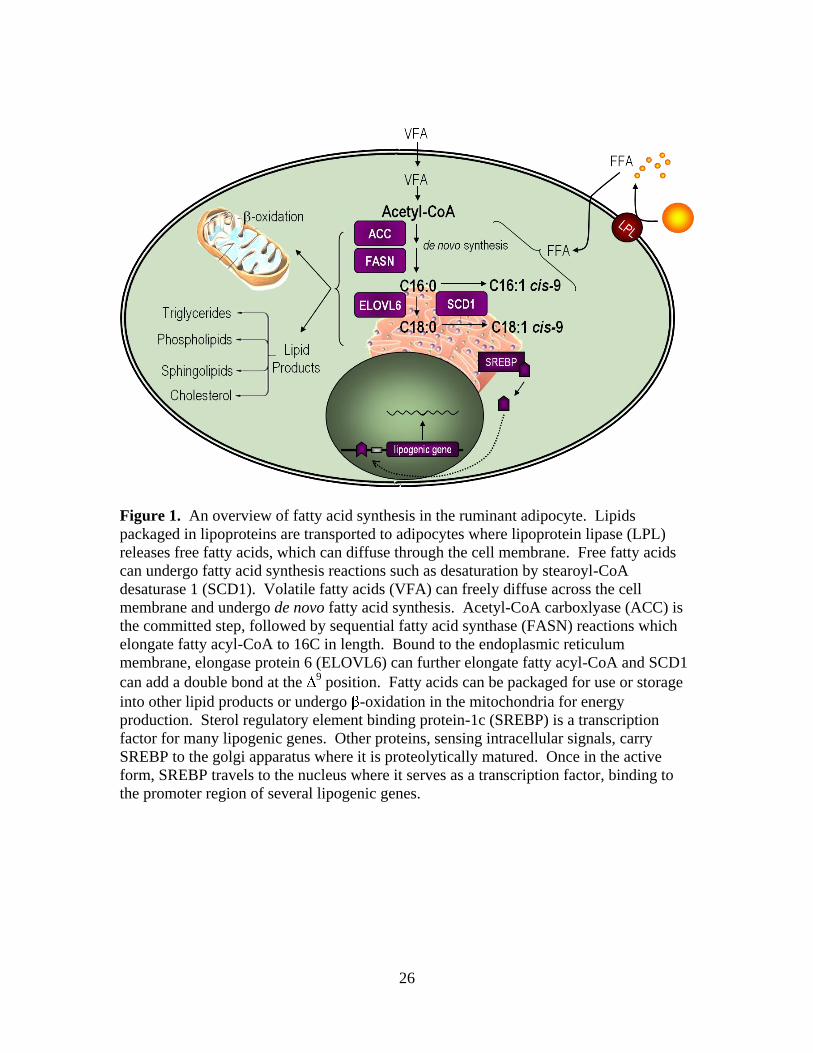
Figure 1. An overview of fatty acid synthesis in the ruminant adipocyte. Lipids
packaged in lipoproteins are transported to adipocytes where lipoprotein lipase (LPL)
releases free fatty acids, which can diffuse through the cell membrane. Free fatty acids
can undergo fatty acid synthesis reactions such as desaturation by stearoyl-CoA
desaturase 1 (SCD1). Volatile fatty acids (VFA) can freely diffuse across the cell
membrane and undergo de novo fatty acid synthesis. Acetyl-CoA carboxlyase (ACC) is
the committed step, followed by sequential fatty acid synthase (FASN) reactions which
elongate fatty acyl-CoA to 16C in length. Bound to the endoplasmic reticulum
membrane, elongase protein 6 (ELOVL6) can further elongate fatty acyl-CoA and SCD1
can add a double bond at the 9 position. Fatty acids can be packaged for use or storage
into other lipid products or undergo -oxidation in the mitochondria for energy
production. Sterol regulatory element binding protein-1c (SREBP) is a transcription
factor for many lipogenic genes. Other proteins, sensing intracellular signals, carry
SREBP to the golgi apparatus where it is proteolytically matured. Once in the active
form, SREBP travels to the nucleus where it serves as a transcription factor, binding to
the promoter region of several lipogenic genes.
27
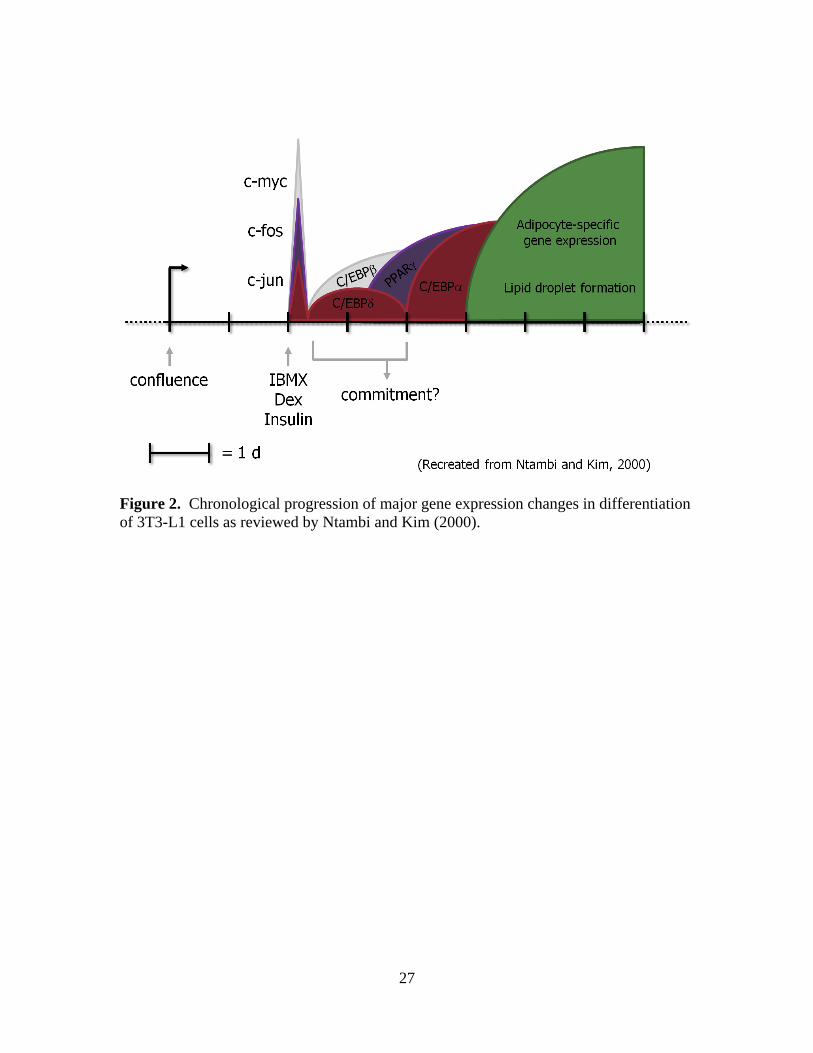
Figure 2. Chronological progression of major gene expression changes in differentiation
of 3T3-L1 cells as reviewed by Ntambi and Kim (2000).
28
LITERATURE CITED
Ailhaud, G., P. Grimaldi, and R. Négrel. 1992. Cellular and molecular aspects of adipose
tissue development. Annu. Rev. Nutr. 12(1): 207-233.
Amri, E., B. Bertrand, G. Ailhaud, and P. Grimaldi. 1991. Regulation of adipose cell
differentiation. I. fatty acids are inducers of the aP2 gene expression. J. Lipid Res.
32(9): 1449-1456.
Aso, H., H. Abe, I. Nakajima, K. Ozutsumi, T. Yamaguchi, Y. Takamori et al. 1995. A
preadipocyte clonal line from bovine intramuscular adipose tissue: Nonexpression of
GLUT-4 protein during adipocyte differentiation. Biochem. Biophys. Res. Commun.
213(2): 369-375.
Attie, A. D., R. M. Krauss, M. P. Gray-Keller, A. Brownlie, M. Miyazaki, J. J. Kastelein
et al. 2002. Relationship between stearoyl-CoA desaturase activity and plasma
triglycerides in human and mouse hypertriglyceridemia. J. Lipid Res. 43(11): 1899-
1907.
Brown, M. S., and J. L. Goldstein. 1997. The SREBP pathway: Regulation of cholesterol
metabolism by proteolysis of a membrane-bound transcription factor. Cell. 89(3):
331-340.
Burdi, A. R., C. M. Poissonnet, S. M. Garn, M. Lavelle, M. D. Sabet, and P. Bridges.
1985. Adipose tissue growth patterns during human gestation: A histometric
comparison of buccal and gluteal fat depots. Inter. J. Obesity. 9(4): 247-256.
Burr, G. O., M. M. Burr, E. S. Miller. 1932. On the fatty acids essential in nutrition III.
J. Biol. Chem. 97(1): 1-9.
Cao, H., K. Gerhold, J. R. Mayers, M. M. Wiest, S. M. Watkins, and G. S. Hotamisligil.
2008. Identification of a lipokine, a lipid hormone linking adipose tissue to systemic
metabolism. Cell. 134(6): 933-944.
Chawla, A., E. J. Schwarz, D. D. Dimaculangan, M. A. Lazar. 1994. Peroxisome
proliferator-activated receptor (PPAR) gamma: adipose- predominant expression and
induction early in adipocyte differentiation. Endocrinology. 135(2): 798-800.
Clarke, S. L., C. E. Robinson, and J. M. Gimble. 1997. CCAAT/Enhancer binding
proteins directly modulate transcription from the peroxisome proliferator- activated
receptor γ2 promoter. Biochem. Biophys. Res. Commun. 240(1): 99-103.
29
Cornelius, P., O. A. MacDougald, and M. D. Lane. 1994. Regulation of adipocyte
development. Annu. Rev. Nutr. 14(1): 99-129.
Denke, M., and S. Grundy. 1991. Effects of fats high in stearic acid on lipid and
lipoprotein concentrations in men. Am. J. Clin. Nutr. 54(6): 1036-1040.
Duckett, S. K., D. G. Wagner, L. D. Yates, H. G. Dolezal, and S. G. May. 1993. Effects
of time on feed on beef nutrient composition. J. Anim. Sci. 71(8): 2079-2088.
Eberlé, D., B. Hegarty, P. Bossard, P. Ferré, and F. Foufelle. 2004. SREBP transcription
factors: Master regulators of lipid homeostasis. Biochimie. 86(11): 839-848.
Falvella, F. S., R. M. Pascale, M. Gariboldi, G. Manenti, M. R. De Miglio, M. M. Simile,
T. A. Dragani, F. Feo. 2002. Stearoyl-CoA desaturase 1 (Scd1) gene overexpression
is associated with genetic predisposition to hepatocarcinogenesis in mice and rats.
Carcinogenesis. 23(11): 1933-1936.
Fernyhough, M., J. Vierck, G. Hausman, P. Mir, E. Okine, and M. Dodson. 2005.
Primary adipocyte culture: Adipocyte purification methods may lead to a new
understanding of adipose tissue growth and development. Cytotechnology. 46(2):
163-172.
Gesta, S., Y. Tseng, and C. R. Kahn. 2007. Developmental origin of fat: Tracking obesity
to its source. Cell. 131(Oct.): 242-256.
Gomez, F. E., D. E. Bauman, J. M. Ntambi, and B. G. Fox. 2003. Effects of sterculic acid
on stearoyl-CoA desaturase in differentiating 3T3-L1 adipocytes. Biochem. Biophys.
Res. Commun. 300(2): 316-326.
Gong, J., H. Campos, S. McGarvey, Z. Wu, R. Goldberg, and A. Baylin. 2010. Adipose
tissue palmitoleic acid and obesity in humans: Does it behave as a lipokine? Am. J.
Clin. Nutr. 93(1):186-191.
Grant, A. C., G. Ortiz-Colon, M. E. Doumit, and D. D. Buskirk. 2008a. Optimization of
in vitro conditions for bovine subcutaneous and intramuscular preadipocyte
differentiation. J. Anim. Sci. 86(1): 73-82.
Grant, A. C., G. Ortiz-Colon, M. E. Doumit, R. J. Tempelman, and D. D. Buskirk. 2008b.
Differentiation of bovine intramuscular and subcutaneous stromal-vascular cells
exposed to dexamethasone and troglitazone. J. Anim. Sci. 86(10): 2531-2538.
Green, H., and O. Kehinde. 1974. Sublines of mouse 3T3 cells that accumulate lipid.
Cell. 1(3): 113-116.
30
Hegsted, D. M., R. B. McGandy, M. L. Myers, and F. J. Stare. 1965. Quantitative effects
of dietary fat on serum cholesterol in man. Am. J. Clin. Nutr. 17(5): 281-295.
Hirai, S., H. Matsumoto, N. Hino, H. Kawachi, T. Matsui, and H. Yano. 2007. Myostatin
inhibits differentiation of bovine preadipocyte. Domest. Anim. Endocrinol. 32(1): 1-
14.
Hirsch, J., and B. Batchelor. 1976. Adipose tissue cellularity in human obesity. Clin.
Endocrinol. Metab. 5(2): 299-311.
Hood, R. L., and C. E. Allen. 1973. Cellularity of bovine adipose tissue. J. Lipid Res.
14(6): 605-610.
Horton, J. D., J. L. Goldstein, and M. S. Brown. 2002. SREBPs: Activators of the
complete program of cholesterol and fatty acid synthesis in the liver. J. Clin. Invest.
109(9): 1125-1131.
Hotamisligil, G. S., R. S. Johnson, R. J. Distel, R. Ellis, V. E. Papaioannou, and B. M.
Spiegelman. 1996. Uncoupling of obesity from insulin resistance through a targeted
mutation in aP2, the adipocyte fatty acid binding protein. Science. 274(5291): 1377-
1379.
Hulver, M. W., J. R. Berggren, M. J. Carper, M. Miyazaki, J. M. Ntambi, E. P. Hoffman,
J. P. Thyfault, R. Stevens, G. L. Dohm, J. A. Houmard, D. M. Muoio. 2005.
Elevated stearoyl-CoA desaturase-1 expression in skeletal muscle contributes to
abnormal fatty acid partitioning in obese humans. Cell Meta. 2(4): 251-261.
Jenkins, T. C., and W. C. Bridges. 2007. Protection of fatty acids against ruminal
biohydrogenation in cattle. European Journal of Lipid Science and Technology.
109(8): 778-789.
Kaestner, K. H., R. J. Christy, J. C. McLenithan, L. T. Braiterman, P. Cornelius, P. H.
Pekala, M. D. Lane. 1989. Sequence, tissue distribution, and differential expression
of mRNA for a putative insulin-responsive glucose transporter in mouse 3T3-L1
adipocytes. Proc. Natl. Acad. Sci. U. S. A. 86(9): 3150-3154.
Keating, A. F., J. J. Kennelly, and F. Zhao. 2006. Characterization and regulation of the
bovine stearoyl-CoA desaturase gene promoter. Biochem. Biophys. Res. Commun.
344(1): 233-240.Killinger, K. M., C. R. Calkins, W. J. Umberger, D. M. Feuz, and
K. M. Eskridge. 2004. Consumer sensory acceptance and value for beef steaks of
similar tenderness, but differing in marbling level. J. Anim. Sci. 82(11): 3294-3301.
31
Khoo, D.E., B. Fermor, J. Miller, C. B. Wood, K. Apostolov, W. Barker, R. C.
Williamson, N. A. Habib. 1991. Manipulation of body fat composition with sterculic
acid can inhibit mammary carcinomas in vivo. Br. J. Cancer. 63(1): 97-101.
Kim, Y., F. E. Gomez, B. G. Fox, and J. M. Ntambi. 2000. Differential regulation of the
stearoyl-CoA desaturase genes by thiazolidinediones in 3T3-L1 adipocytes. J. Lipid
Res. 41(8): 1310-1316.
Lay, S. L., I. Lefrère, C. Trautwein, I. Dugail, and S. Krief. 2002. Insulin and sterol-
regulatory element-binding protein-1c (SREBP-1C) regulation of gene expression in
3T3-L1 adipocytes. J. Biol. Chem. 277(38): 35625-35634.
Lee, Y., and T. C. Jenkins. 2011. Biohydrogenation of linolenic acid to stearic acid by the
rumen microbial population yields multiple intermediate conjugated diene isomers.
J. Nutr. 141(8): 1445-1450.
Lengi, A. J., and B. A. Corl. 2007. Identification and Characterization of a Novel Bovine
Stearoyl-CoA Desaturase Isoform with Homology to Human SCD5. Lipids. 42(6):
499-508.
Lengi, A. J., and B. A. Corl. 2010. Factors influencing the differentiation of bovine
preadipocytes in vitro. J. Anim. Sci. 88(6): 1999-2008.
Li, Z. Z., M. Berk, T. M. McIntyre, and A. E. Feldstein. 2009. Hepatic lipid partitioning
and liver damage in nonalcoholic fatty liver disease. J. Biol. Chem. 284(9): 5637-
5644.
MacDougald, O. A., and C. F. Burant. 2007. The rapidly expanding family of adipokines.
Cell Metabolism. 6(3): 159-161.
Martin, G. S., D. K. Lunt, K. G. Britain, and S. B. Smith. 1999. Postnatal development of
stearoyl coenzyme A desaturase gene expression and adiposity in bovine
subcutaneous adipose tissue. J. Anim. Sci. 77(3): 630-636.
Matsuzaka, T., H. Shimano, N. Yahagi, T. Yoshikawa, M. Amemiya-Kudo, A. H. Hasty
et al. 2002. Cloning and characterization of a mammalian fatty acyl-CoA elongase as
a lipogenic enzyme regulated by SREBPs. J. Lipid Res. 43(6): 911-920.
Mattson, F. H., and S. M. Grundy. 1985. Comparison of effects of dietary saturated,
monounsaturated, and polyunsaturated fatty acids on plasma lipids and lipoproteins
in man. J. Lipid Res. 26(2): 194-202.
McGillis, J. P. 2005. White adipose tissue, inert no more! Endocrinology. 146(5): 2154-
2156.
32
National Beef Quality Audit. 2000. National Cattlemen‟s Beef Association. Englewood,
CO.
Newberry, E. P., Y. Xie, S. M. Kennedy, J. Luo, and N. O. Davidson. 2006. Protection
against western diet-induced obesity and hepatic steatosis in liver fatty acid-binding
protein knockout mice. Hepatology. 44(5): 1191-1205.
Noble, R. C., J. H. Moore, and C. G. Harfoot. 1974. Observations on the pattern on
biohydrogenation of esterified and unesterified linoleic acid in the rumen. Br. J.
Nutr. 31(1): 99-108.
Ntambi, J. M. 1999. Regulation of stearoyl-CoA desaturase by polyunsaturated fatty
acids and cholesterol. J. Lipid Res. 40(9): 1549-1558.
Ntambi, J. M., and Y. Kim. 2000. Adipocyte differentiation and gene expression. J. Nutr.
130(12): 3122S-3126.
Ntambi, J. M., M. Miyazaki, J. P. Stoehr, H. Lan, C. M. Kendziorski, B. S. Yandell, Y.
Song, P. Cohen, J. M. Friedman, A. D. Attie. 2002. Loss of stearoyl–CoA
desaturase-1 function protects mice against adiposity. Proc. Natl. Acad. Sci. U. S. A.
99(17): 11482-11486.
Ntambi, J. M., and M. Miyazaki. 2004. Regulation of stearoyl-CoA desaturases and role
in metabolism. Prog. Lipid Res. 43(2): 91-104.
Ohsaki, H., T. Sawa, S. Sasazaki, K. Kano, M. Taniguchi, F. Mukai et al. 2007. Stearoyl-
CoA desaturase mRNA expression during bovine adipocyte differentiation in
primary culture derived from japanese black and holstein cattle. Comp. Biochem.
Phys. - Part A: Molecular & Integrative Physiology. 148(3): 629-634.
Park, Y., J. Storkson, K. Albright, W. Lui, M. Pariza. 1999. Evidence that trans-10, cis-
12 isomer of conjugated linoleic acid induces body composition changes in mice.
Lipids. 34: 235-241.
Parodi, P. W. 1997. Milk fat conjugated linoleic acid: Can it help prevent breast cancer?
Proc. Nutr. Soc. N. Z. 22: 137--149.
Pavan, E., and S. K. Duckett. 2008. Corn oil or corn grain supplementation to steers
grazing endophyte-free tall fescue. I. effects on in vivo digestibility, performance,
and carcass quality. J. Anim. Sci. 86(11): 3215-3223.
33
Rahman, S. M., A. Dobrzyn, P. Dobrzyn, S. H. Lee, M. Miyazaki, J. M. Ntambi. 2003.
Stearoyl-CoA desaturase 1 deficiency elevates insulin-signaling components and
down-regulates protein-tyrosine phosphatase 1B in muscle. Proc. Natl. Acad. Sci. U.
S. A. 100(19) 11110-11115.
Robelin, J., C. Barboiron, and R. Jailler. 1985. Cellularité des différents dépôts adipeux
des bovins en croissance. Reprod. Nutr. Dévelop. 25(1B): 211-214.
Rosen, E. D., C. J. Walkey, P. Puigserver, and B. M. Spiegelman. 2000. Transcriptional
regulation of adipogenesis. Genes & Development. 14(11): 1293-1307.
Shimamura, K., A. Nagumo, Y. Miyamoto, H. Kitazawa, M. Kanesaka, R. Yoshimoto et
al. 2010. Discovery and characterization of a novel potent, selective and orally active
inhibitor for mammalian ELOVL6. Eur. J. Pharmacol. 630(1-3): 34-41.
Shimamura, K., H. Takahashi, H. Kitazawa, Y. Miyamoto, A. Nagumo, C. Tang et al.
2009. Identification and characterization of a selective radioligand for ELOVL6. J
Biochem. 146(3): 429-437.
Smith, S. B., and J. D. Crouse. 1984. Relative contributions of acetate, lactate and
glucose to lipogenesis in bovine intramuscular and subcutaneous adipose tissue. J.
Nutr. 114(4): 792-800.
St. John, L. C., D. K. Lunt, S. B. Smith. 1991. Fatty acid elongation and desaturation
enzyme activities of bovine liver and subcutaneous adipose tissue microsomes. J.
Anim. Sci. 69(3) 1064-1073.
Sun,Y., M. Hao, Y. Luo, C. P. Liang, D. L. Silver, C. Cheng, F. R. Maxfield, A. R. Tall.
2003. Stearoyl-CoA Desaturase Inhibits ATP-binding Cassette Transporter A1-
mediated Cholesterol Efflux and Modulates Membrane Domain Structure. J. Biol.
Chem. 278(8): 5813-5820.
Tabor, D. E., J. B. Kim, B. M. Spiegelman, and P. A. Edwards. 1999. Identification of
conserved cis-elements and transcription factors required for sterol-regulated
transcription of stearoyl-CoA desaturase 1 and 2. J. Biol. Chem. 274(29): 20603-
20610.
Taniguchi, M., L. L. Guan, B. Zhang, M. V. Dodson, E. Okine, and S. S. Moore. 2008a.
Adipogenesis of bovine perimuscular preadipocytes. Biochem. Biophys. Res.
Commun. 366(1): 54-59.
Taniguchi, M., L. L. Guan, B. Zhang, M. V. Dodson, E. Okine, and S. S. Moore. 2008b.
Gene expression patterns of bovine perimuscular preadipocytes during adipogenesis.
Biochem. Biophys. Res. Commun. 366(2): 346-351.
34
Uchiyama, M., K. Momose, R. Momose, S. Okui. 1966. Cis-vaccenic acid in human
tissues. J. Biochem. 60(5): 589-591.
Vernon, R. G. 1980. Lipid metabolism in the adipose tissue of ruminant animals. Prog.
Lipid Res. 19(1-2): 23-106.
Voss, M., A. Beha, N. Tennagels, G. Tschank, A. Herling and M. Quint, et al. 2005.
Gene expression profiling in skeletal muscle of Zucker diabetic fatty rats:
Implications for a role of stearoyl-CoA desaturase 1 in insulin resistance.
Diabetologia, 48: 2622–2630.
Wang, Y., D. Botolin, J. Xu, B. Christian, E. Mitchell, B. Jayaprakasam et al. 2006.
Regulation of hepatic fatty acid elongase and desaturase expression in diabetes and
obesity. J. Lipid Res. 47(9): 2028-2041.
Wang, J., L. Yu, R. E. Schmidt, C. Su, X. Huang, K. Gould, G. Cao. 2005.
Characterization of HSCD5, a novel human stearoyl-CoA desaturase unique to
primates. Biochem. Biophys. Res. Commun. 332(3) 735-742.
Ward, R. J., M. T. Travers, S. E. Richards, R. G. Vernon, A. M. Salter, P. J. Buttery, M.
C. Barber. 1998. Stearoyl-CoA desaturase mRNA is transcribed from a single gene
in the ovine genome. Biochimica et Biophysica Acta (BBA) - Lipids and Lipid
Metabolism. 1391(2): 145-156.
Williams, J. E., D. G. Wagner, L. E. Walters, G. W. Horn, G. R. Waller, P. L. Sims et al.
1983. Effect of production systems on performance, body compostion and lipid and
mineral profiles of soft tissue in cattle. J. Anim. Sci. 57(4): 1020-1028.
Wu, P., K. Sato, F. Suzuta, Y. Hikasa, and K. Kagota. 2000. Effects of lipid-related
factors on adipocyte differentiation of bovine stromal-vascular cells in primary
culture. J. Vet. Med. Sci. 62(9): 933-939.
Zhang, Y., R. Proenca, M. Maffei, M. Barone, L. Leopold, and J. M. Friedman. 1994.
Positional cloning of the mouse obese gene and its human homologue. Nature.
372(6505): 425-432.
35
CHAPTER 2: GENE EXPRESSION AND FATTY ACID
PROFILES DURING DIFFERENTIATION OF BOVINE
ADIPOCYTE CULTURES SUPPLEMENTED WITH
LINOLEIC ACID (C18:2 n-6)
ABSTRACT
The primary objectives of this study were to determine if fatty acid profiles or
lipogenic gene expression differ when in vitro adipocytes are exposed to supplemented
linoleic acid (C18:2 n-6), insulin, or both following differentiation. With limited
information in the literature about the timing of lipid uptake and composition of fatty
acids in differentiating bovine adipocytes, a secondary objective of this study was to
evaluate fatty acid composition over time. Primary stromal vascular cultures were
isolated from 18 mo. old Angus crossbred steers by collagenase digestion. In the first
experiment, cells were hormonally induced to differentiate on d 0, cultured to d 12, serum
starved for 24 h, and assigned to 1 of 4 treatments in a 2 X 2 factorial design consisting of
linoleic acid (0 mM or 0.3 mM C18:2 n-6) and insulin (0 or 2.5 g/mL) as factors. Cells
were harvested on d 18, following 5 d of incubation with respective treatments, for fatty
acid analysis and gene expression. In a second experiment, cells were assigned to
treatments according to a 2 X 3 factorial design consisting of linoleic acid (0 or 0.3 mM
C18:2 n-6; beginning on d 2) and day of harvest (d 2, 6, or 12) as factors.
Undifferentiated cells harvested on d 2 served as baseline controls. As before, cells were
harvested for fatty acid and gene expression analysis. In the first experiment, total fatty
acids and C18:2 n-6 increased (P < 0.001) and palmitic (C16:0), stearic (C18:0), oleic
36
(C18:1 cis-9), and linolenic (C18:3 n-3) acids decreased (P < 0.05) due to a main effect
of linoleic acid supplementation. Desaturation indices and SCD1 mRNA expression also
decreased (P < 0.05) in response to linoleic acid supplementation. Insulin treated cells
also had decreased (P < 0.05) C18:1 cis-9/C18:0 desaturation ratio compared with 0
g/mL treated cells and tended (P = 0.08) increased C18:2 n-6. In the second
experiment, there was interaction (P < 0.05) of linoleic acid supplementation and day of
harvest for major fatty acids and desaturation indices. With the exeption of C16:0,
individual fatty acids and the ratio of C18:1 cis-9/C18:0 increased over time in
unsupplemented cells and decreased or remained unchanged on d 6 and 12 in linoleic
acid-treated cells. Regardless of linoleic acid supplementation level, analysis of mRNA
expression revealed that fatty acid synthase (FASN), glucose transporter 4 (GLUT4), and
peroxisome proliferator-activated receptor gamma (PPAR ) mRNA expression was
elevated (P < 0.05) in differentiated cells on d 12 compared with undifferentiated cells.
Messenger RNA of stearoyl-CoA desaturase 1 (SCD1) and adipocyte protein 2 (aP2),
differentiation-associated genes, was up-relgulated (P < 0.05) in differentiated cells on d
2 compared with undifferentiated cells and down-regulated (P < 0.05) on d 6 and 12
compared with d 2. A significant interaction existed between time and treatment for
sterol regulatory element binding protein-1c (SREBP). Unsupplemented cultures were
decreased (P < 0.05) in their expression of SREBP mRNA on d 6 and 12 compared with
undifferentiated cells; whereas, linoleic acid-treated cells increased (P < 0.05) over time.
In conclusion, fatty acid composition changes with respect to time following induction of
differentiation and also reflects changes in the composition of the media. Supplementing
37
culture media with linoleic acid reduced SCD1 transcription at d 18 and decreased
desaturation indices at d 6, 12, and 18. Bovine adipocyte cultures were actively
desaturating fatty acids, which led to changes in fatty acid composition of the cultures. In
addition, by d 6 cultures were sensitive to lipogenic regulation by exogenous fatty acid
administration. Based on our data of fatty acid uptake and mRNA expression changes of
differentiation-associated genes, we propose to time future investigations of bovine
adipocytes more closely with differentiation, from d 6 to 12, when cells are fully
functional adipocytes.
38
INTRODUCTION
In the beef industry, USDA grading standards estimate cutability and eating
quality of the lean tissue to determine carcass value. These yield and quality grades
applied to beef carcasses are highly influenced by the abundance of subcutaneous and
intramuscular fat, respectively. During the finishing stage in cattle, fat deposition in the
form of white adipose tissue is the result of both hyperplasia and hypertrophy (Hood and
Allen, 1973). Although cell number and size both increase during animal maturation,
70% of fat accumulation is the result of hypertrophy (Robelin et al., 1985).
Preadipocytes, cells responsible for hyperplasia, are of mesenchymal lineage and have
the ability to propagate or commit to differentiation (Gesta et al., 2007). Upon
stimulation, they differentiate into mature adipocytes, which have the ability to
synthesize, take up, and store fat. The composition and quantity of white adipose tissue
is influenced by animal nutrition. Cattle finished on high concentrate diets have altered
fatty acid profiles and lipid deposition rates compared to pasture-finished animals (Pavan
and Duckett, 2008). Therefore, diets of finishing cattle can potentially impact carcass
value by altering adipose tissue at the level of differentiating preadipocytes, lipid-filling
adipocytes, or both.
Over the past decade, researchers have begun to view white adipose tissue, not as
an inert energy storage site, but as a complex, metabolically active tissue (McGillis,
2005). Obesity is associated with many common medical disorders including
cardiovascular disease and type II diabetes. The amount and location of white adipose
tissue deposits affect disease risk in humans (Gesta et al., 2007). Health professionals and
39
consumers are increasingly concerned about saturated fatty acids (SFA) in beef. By
defining mechanisms through which adipogensis and lipogenesis are controlled, we can
improve the nutritive quality of beef and potentially develop models to enhance our
understanding individual health and obesity-onset in humans.
A majority of research in fatty acid metabolism and adipogenesis has been
conducted with murine models and in vitro studies using the immortalized 3T3-L1 cell
line derived from disaggregated Swiss 3T3 mouse embryos (Green and Kehinde, 1974),
although some research has gone into creating and characterizing primary and clonally-
derived bovine preadipocyte cell lines (Grant et al., 2008a and b; Taniguchi et al., 2008a
and b; Lengi and Corl, 2010). Gene expression during preadipocyte differentiation has
been well documented in 3T3-L1 cells (Ntambi and Kim, 2000). To date, information
regarding early events in bovine preadipocyte differentiation is primarily limited to gene
expression. Inherent differences in site of lipogenesis and substrate utilization in murine
versus ruminant species necessitate investigation in this area. Our objective in this study
was to evaluate the fatty acid profiles and the expression of genes involved in
differentiation and lipogenesis in bovine preadipocytes. Fat is often added to livestock
diets as energy supplements and in vitro cultures are sometimes used to investigate in
vivo effects. Linoleic acid (C18:2 n-6) is an essential fatty acid and is the predominate
fatty acid found in most livestock feedstuffs and commonly used fat supplements, such as
corn oil. Duckett et al. (2009) reported up-regulated stearoyl-CoA desaturase 1 (SCD1)
mRNA expression in adipose tissue of steers fed a corn-based supplement. Insulin is
associated with high-carbohydrate diets and SCD1 activity (Vessby et al., 2002; Flowers

40
and Ntambi, 2009). We hypothesized that supplementing bovine adipocytes cultures
with linoleic acid, insulin, or both would impact gene expression and fatty acid
composition.
41
MATERIALS AND METHODS
Cell Culture. Primary bovine stromal vascular (SV) cultures were harvested from
subcutaneous flank fat of 18 mo old Angus crossbred steers according to Hirai et al.
(2007). At slaughter, ~30 cm3 sections of adipose tissue were excised and minced using
sterile instruments, rinsed with Hank‟s Balanced Salt Solution (HBSS), and digested in
25 mL HBSS containing 2 mg/mL collagenase, type I, and 40 mg/mL bovine serum
albumin under constant shaking at 37°C for 120 min. Remaining tissue fragments and
fat-filled adipocytes were separated from the stromal vascular fraction by filtering
through a 250 m nylon mesh and subsequent centrifugation at 2000 x g for 10 min.
Cells were plated at 1 x 10⁴ cells/cm
2 and passaged every 2 to 4 d when approximately
60% confluent. Cells were incubated at 37°C under 5% CO2 humidified atmosphere with
media [Dulbecco‟s modified eagles medium (DMEM) containing 10% fetal calf serum
(FCS), and 2X antibiotiotic/antimycotic (AB/AM; containing 10,000 U/mL penicillin G,
10,000 g/mL streptomycin, and 25 g/mL amphotericin B)] replaced every 2 d. After 4
passages, cell cultures were harvested and stored in liquid nitrogen at 1 x 10⁶ cells/mL in
freeze media (DMEM, 20% FCS, and 10% dimethyl sulfoxide) for later use.
Experiment 1. Individual SV cultures from 3 steers were used in this study.
Cells were thawed, passaged 3 times, and seeded in plates at 1 x 10⁵ cells/cm
2. Cells
were allowed to reach confluence, held for 2 d, and differentiated on d 0 according to
Hirai et al. (2007) with DMEM containing 5% FCS, 2X AB/AM, insulin at 2.5 g/ml, 0.5
mM 2-isobutyl-1-methylaxanthine (IBMX), 0.25 M dexamethasone (DEX), and 5 M
troglitazone (TRO). Secondary differentiation media (DMEM, 5% FCS, 2X AB/AM,
42
insulin at 2.5 g/mL, 5 M TRO) was applied, beginning on d 2 to d 12. On d 12, the
secondary differentiation media was replaced by a starvation media (DMEM, 0.1% BSA,
2x Ab/Am) for 24 h. Treatments, performed in duplicate for each culture, were applied
in a 2 X 2 Factorial design with bovine insulin (0 g/mL or 2.5 g/mL; Sigma-Aldrich,
St. Louis, MO) and linoleic acid (0 mM or 0.3 mM C18:2 n-6; BD Biosciences, Bedford,
MA) as supplements in culture media. Cells were harvested on d 18 for fatty acid and
gene expression analysis by washing 3 times with PBS followed by trypsin digestion.
Experiment 2. Individual cultures from 2 steers were passaged and plated as
described above. Cells were allowed to reach confluence, held for 2 d, and differentiated
on d 0 as described by Hirai et al. (2007) DMEM containing 5% FCS, 2X AB/AM,
insulin at 2.5 g/ml, 0.5 mM 2-isobutyl-1-methylaxanthine (IBMX), 0.25 M
dexamethasone (DEX), and 5 M troglitazone (TRO) followed by media modifications
described by Pratt et al. (2010). Secondary differentiation media (DMEM, 5% FCS, 2X
AB/AM, insulin at 2.5 g/mL, 5 M TRO) supplemented with 0 mM or 0.3 mM linoleic
acid was applied from d 2 to 12. Undifferentiated cells were harvested on d 2 and
differentiated cells supplemented with or without linoleic acid were harvested on d 2, 6,
and 12 for fatty acid and mRNA expression analysis. All treatments were performed in
duplicate for each SV culture.
Fatty acids. Cellular fatty acids were extracted as described by Folch et al.
(1957) and transmethylated according to Park and Goins (1994). Fatty acid methyl esters
were analyzed using an Agilent 6850 gas chromatograph equipped with an Agilent
7673A automatic sampler (Agilent Technologies, Inc., Santa Clara, CA). Separations

43
were accomplished using a 100-m Supelco SP-2560 (Supelco, Inc., Bellefonte, PA)
capillary column (0.25 mm i.d. and 0.20 m film thickness) according to Duckett et al.
(2002). Individual fatty acids were identified by comparison of retention times with
standards (Sigma, St. Louis, MO; Matreya, Pleasant Gap, PA). Fatty acids were
quantified by incorporating an internal standard, methyl tricosanoic (C23:0) acid, into
each sample during methylation and expressed as a weight percentage of total fatty acids
per well.
Gene Expression. Total cellular RNA was isolated from cells using the mirVana
microRNA Isolation kit (Ambion, Austin, TX) according to manufacturer‟s instructions
and RNA quality as described by Duckett et al. (2009). Quality was assessed using
Nanodrop 2000 Spectrophotometer (Thermo Fisher Scientific, Inc., Waltham, MA);
tcRNA samples used in real-time PCR (qRT-PCR) had a 260:280 absorbance ratio > 1.7.
Real-time qRT-PCR was conducted using an Eppendorf MasterCycler ep realplex
(Westbury, NY) with the QuantiTect SYBR Green RT-PCR One Step Kit (Qiagen,
Valencia, CA) according to the manufacturer‟s directions. Two genes, glyceraldehyde-3-
phosphate dehydrogenase (GAPDH) and β-actin, were evaluated as housekeeping genes
for data normalization (Duckett et al., 2009). To determine the appropriate housekeeping
gene to be used to normalize the data, the cycle threshold values (CT) for GAPDH, β-
actin, and all target genes per sample were entered into the BESTKEEPER program
(http://www.gene-quantification.info). The program determines the most stable
housekeeping gene to be used for normalization by repeated pair-wise correlation and
regression analysis (Pfaffl et al., 2002). Both GAPDH and β-actin exhibited a correlation
44
coefficient of 0.99 (P < 0.001) in the analysis and were suitable for data normalization.
Primers for bovine mRNAs were designed using Primer 3 software
(http://frodo.wi.mit.edu/primer3/). Primer sets were first evaluated according to Duckett
et al. (2009) to verify identity. Genes of interest were those involved in fatty acid
biosynthesis, acetyl-CoA carboxylase (ACC), fatty acid synthase (FASN), and SCD1, as
well as their transcription factors, peroxisome proliferator-activated receptor gamma
(PPAR and sterol regulatory element binding protein (SREBP). Additionally, glucose
transporter 4 (GLUT4) was gene expression was analyzed.
Statistical Analysis. The data were analyzed using Proc GLM procedure of SAS
9.2 (Cary, NC) for treatment comparisons over time. A two-way analysis of variance
(ANOVA) was performed as a completely randomized design with factors consisting of
insulin (0 or 2.5 g/mL) and linoleic acid (0 or 0.3 mM C18:2 n-6) for Experiment 1 and
linoleic acid (0 or 0.3 mM C18:2 n-6) and day of differentiation (d 2, 6, or d 12) for
Experiment 2. Least squares means are computed and separated statistically using
Fisher‟s Protected LSD test. When the overall F-test for the treatment effect was
significant (P ≤ 0.05), a t-test was performed to discern the differences among treatments
by using the PDIFF option of the LSMeans statement. For gene expression data,
normalized CT values were subjected to ANOVA, as described above. Additionally,
relative gene expression data was analyzed using Pair-wise Fixed Reallocation
Randomization Test (Pfaffl et al., 2002) with preplanned treatment comparisons.
45
RESULTS AND DISCUSSION
The differentiation hormones and media used in our experiment have been tested
for their efficacy in inducing differentiation in bovine SV cultures (Aso et al., 1995;
Grant et al., 2008a and b; Lengi and Corl, 2010). Classically, fibroblastic preadipocytes
change shape from stellate to round and accumulate lipid (Napolitano, 1963), in addition
to changes in gene expression (Taniguchi et al., 2008a). Previously, our SV cultures
displayed characteristic changes in morphology, lipid-filling, and adipogenic gene
expression upon hormonal treatment, consistent with adipocyte differentiation (Pratt et
al., 2010). In the current study, cells changed shape from fibroblastic to round following
differentiation and became lipid-filled, especially with fatty acid supplementation (data
not shown).
Experiment 1. There was a main effect of linoleic acid supplementation on
palmitic (C16:0), palmitoleic (C16:1), stearic (C18:0), oleic (C18:1 cis-9), C18:2 n-6,
linolenic acid (C18:3 n-3), and total fatty acid levels (Figure 1). Each fatty acid
identified, with the exception of C18:2 n-6, decreased (P < 0.05) in response to linoleic
acid supplementation. This suggests that the presence of abundant PUFA could decrease
lipogenesis or stimulate -oxidation of endogenous fatty acids. Insulin supplementation
did not affect (P > 0.05) fatty acid composition, although there was a trend (P = 0.07) for
increased C18:2 n-6 in insulin-treated cultures.
Stearoyl-CoA desaturase 1 (SCD1) is the enzyme responsible for creating a
double bond at the 9 position of several fatty-acyl CoA and its preferred substrates are
C16:0 and C18:0 (Enoch et al., 1976). Its transcription and activity can regulated by
46
certain fatty acids, including linoleic acid (Ntambi, 1995). The level of linoleic acid
supplementation used in this study was based on a dose titration by Sessler et al. (1996)
for arachidonic (C20:4 n-6) inhibition on SCD1. They tested the effects of several fatty
acids on SCD1 mRNA expression in 3T3-L1 adipocytes, an immortalized murine cell
line. In addition to arachidonic acid, 0.3 mM linoleic acid and linolenic (C18:3 n-3) acids
reduced SCD1 mRNA expression (Sessler et al., 1996). In our study, we also found
SCD1 mRNA expression to be down-regulated in linoleic acid supplemented cells
(Figure 2), in addition to desaturation indices (Figure 3).
Experiment 2. Indicative of functional adipocytes cultures, total cellular fatty
acids increased (P < 0.001) over time in both groups, but to a greater extent in linoleic
acid-treated cells (P < 0.001, Table 1). Linoleic acid incorporation into the cells was
demonstrated by increased (P < 0.01) C18:2 n-6 in linoleic acid-treated cells compared
with unsupplemented on both a percent and gravimetric basis on d 6 and d 12 (Table 1
and 2). Corresponding with increased C18:2 n-6 in linoleic acid-treated cells, C16:0,
C18:0, C18:1 cis-9, and C18:3 n-3 fatty acids decreased (P < 0.001) on a percent basis
for both d 6 and d 12 compared with unsupplemented cells (Table 2).
Predominate fatty acids of interest in this study were products of de novo fatty
acid synthesis, C16:0 and C18:0, products of desaturation, C16:1 and C18:1 cis-9, and
PUFA, C18:2 n-6 and C18:3 n-3. For each of these fatty acids, there was a significant
interaction (P > 0.05) between linoleic acid supplementation and day, indicating that fatty
acid composition changed over time within differentiating bovine adipocytes and linoleic
acid supplementation affected how that composition changed over time. The most
47
obvious examples of this are the monounsaturated fatty acids (MUFA), C16:1 and C18:1
cis-9. Both MUFA were increased (P < 0.05) on a gravimetric basis by d 6 and were
greatest in d 12 in unsupplemented cells; in linoleic acid-treated cells, however, MUFA
did not change over time (P > 0.05, Table 1). The desaturation indices of the bovine
adipocytes cultures followed a similar pattern. Both MUFA/SFA and C18:1 cis-9/C18:0
indices increased (P < 0.01) over time for unsupplemented cells, but decreased (P < 0.05)
over time in linoleic acid-treated cells. The C16:1/C16:0 ratio also followed this trend
numerically, however, was not statistically significant.
Gene Expression. Messenger RNA levels of SCD1, aP2, and PPAR ,
differentation-associated genes, did not differ (P > 0.05) due to linoleic acid
supplementation compared with unsupplemented cells. An indicator of differentiation
and desaturation, SCD1 mRNA expression was up-regulated (P < 0.05) 2 d after
differentiation media was applied. From d 2 to d 6 SCD gene expression decreased (P <
0.05), but then up-regulated (P < 0.05) to an intermediate level between d 6 and d 12
(Figure 4). Adipocyte protein 2 mRNA was also up-regulated (P < 0.05) on d 2 in
response to differentiation, but lower (P < 0.05) on d 6 and 12 compared with d 2.
Expression of PPAR did not differ (P > 0.05) in d 2 and 6 cells compared with
undifferentiated cells, but was up-regulated (P < 0.05) on d 12. There was an interaction
of linoleic acid supplementation and day of harvest for SREBP, a lipogenic transcription
factor. Gene expression of SREBP was decreased (P < 0.05) in unsupplemented cells on
d 6 and d 12 compared with d 2, but was up-regulated (P < 0.05) in linoleic acid-treated
cells on d 12 compared with d 2 (Figure 4). Other energy-intake and lipogenesis-
48
associated genes were not affected by linoleic acid supplementation. Both GLUT4 and
FASN mRNA were up-regulated (P < 0.05) on d 12 compared with d 2 and
undifferentiated cells.
Primary cell lines were confirmed to have a high proportion of preadipocytes
through observation of morphological changes and staining of organized lipid droplets
within cells, gene expression changes, and lipid profiles. Two days after differentiation
media was applied, cultures demonstrated characteristic shape-change, from fusiform to
spherical, and adipogenic gene expression through up-regulated adipocyte protein 2 (aP2)
and SCD mRNA, which are markers for differentiation along with PPAR (Chawla et al.,
1994; Ohsaki et al., 2007). The master regulator of adipocyte regulation is classically
stated as PPAR ; however, most of this work has been conducted in murine species
(Ntambi and Kim, 2000). We did not observe marked up-regulation of PPAR gene
expression in this study. Similarly, Lengi and Corl (2010), when using the same
hormonal induction of differentiation in primary bovine stromal vascular cultures, failed
to detect up-regulated PPAR gene expression. Despite a lack of PPAR up-reguation in
differentiated cultures, active lipogenesis was confirmed through increased labeled
acetate incorporation into lipids (Lengi and Corl, 2010). Similarly, our cultures
demonstrated lipid-filling, creation de novo lipid synthesis products, C16:0 and C18:0,
and uptake exogenous linoleic acid. Additionally, in the absence of differentiation
media, preadipocyte cultures had limited uptake of supplemented lipid (data not shown)
suggesting our differentiation media was effective at inducing desired changes within the
49
cells. The responses we observed in our differentiated cultures were comparable with the
literature (Aso et al., 1995; Ohsaki et al., 2007; Grant et al., 2008a).
Fatty acid profiles indicated that adipocytes absorbed linoleic acid from the media
and began taking up and synthesizing fat within 6 d of applying the primary
differentiation media. Increased fatty acids over time in unsupplemented cells suggests
fatty acid sythethis, absorption from the media, or both was occurring. Reduced fatty
acids over time due to linoleic acid supplementation could indicate a down-regualtion of
lipogenesis, an up-regulation of -oxidation, or both. Regulation of fatty acid synthesis
can occur at many different levels. Each enzyme in the lipogenesis pathway can be
regulated in addition to cellularity of adipose tissue. Fatty acid synthesis begins with the
committed step of adding a carboxyl group to acetyl-CoA, forming malonyl-CoA, by
ACC, which can be regulated allosterically and by phosphorylation. Fatty acid synthase
is a large, multimeric protein that sequentially adds acetate to malonyl-CoA or a fatty
acyl-CoA until the fatty acid reaches a length of 16 carbons, C16:0. It is primarily
regulated through transcription. Up-regulation of FASN mRNA in differentiated cultures
suggests lipogenic gene expression does not change until d 12; however, micrograms of
fatty acids were increased by d 6. Despite increasing C16:0 over time in linoleic acid-
treated cultures, there was no difference in gene expression of FASN compared with
unsupplemented cells. Therefore, from this data, it is unclear whether linoleic acid
affects fatty acid synthesis. In addition, biosynthesis pathways may be regulated at a
level other than gene transcription. In fact, C16:1, C18:0 and C18:1 cis-9 all decreased
over time in linoleic acid-treated cells compared with control cells suggesting an anti-
50
lipogenic effect of linoleic acid supplementation or an increase in -oxidation. Though
not significant, lipogenic gene and protein expression were numerically greater in bovine
adipocytes treated with 50 M linoleic acid on d 8 compared with non-fatty acid added
controls (Lengi and Corl, 2010). Fatty acid data was not reported by Lengi and Corl
(2010), so comparison of lipid profiles was not possible.
Stearoyl-CoA desaturase is the rate-limiting enzyme in the production of MUFA
from SFA. The preferred substrates for SCD are C16:0 and C18:0, which become C16:1
and C18:1 cis-9, respectively. Because of its role in biosynthesis of MUFA, SCD can
impact membrane fluidity and composition of stored triglycerides by changing the ratio
of MUFA/SFA. Previously, fatty acid indices of MUFA/SFA have been correlated to
SCD mRNA expression (Peter et al., 2009). Even though SCD gene expression was not
affected by linoleic acid supplementation in Experiment 2, desaturase activity appeared to
decrease in linoleic acid-treated cells based on a reduction in the C18:1 cis-9/C18:0 ratio.
In unsupplemented cells, C16:1/C16:0 ratio did not change over time, but the C18:1 cis-
9/C18:0 ratio increased over time, suggesting C18:0 may be a preferential substrate for
desaturation compared with C16:0 in bovine adipocytes cultures or that synthesis rates of
C16:0 closely mimic desaturation rates.
As reviewed by Ntambi and Miyazaki (2004), polyunsaturated fatty acids (PUFA)
decrease SCD expression in murine cells. In bovine adipose tissue, however, increasing
linoleic acid from the diet is associated with up-regulation of SCD mRNA in
subcutaneous adipose tissue (Duckett et al., 2009). Transcription of SCD mRNA is
thought to be controlled primarily by SREBP that binds to sterol response element in the
51
promoter region of the SCD gene, but it is also regulated by many other factors (Eberlé et
al., 2004; Lay et al., 2002). We suspect timing and level of fatty acid supplementation to
have a key role in linoleic acid‟s influence on SCD expression in bovine adipocyte
cultures. Overall, expression of SCD mRNA was up-regulated prior to changes in fatty
acid desaturation indices. However, desaturation indices are not always good indicator of
SCD activity (Archibeque et al., 2005). This could indicate a lag in the translation of
functional SCD1 protein or an additional level of regulation, microRNA for instance.
In conclusion, fatty acid composition changes with respect to time following
induction of differentiation and also reflects changes in fatty acid composition of the
media. Insulin supplemented at the current dose was not effective at altering lipogenic
gene transcription or fatty acid profiles of bovine adipocyte cultures. Supplementing
culture media with linoleic acid reduced SCD1 transcription at d 18 and decreased
desaturation indices at d 6, 12, and 18. Bovine adipocyte cultures actively desaturate
fatty acids, which leads to changes in fatty acid composition of the cultures. In addition,
by d 6, fatty acid profiles of adipocyte cultures are sensitive to lipogenic regulation by
exogenous fatty acid administration. Based on our data of fatty acid uptake and mRNA
expression changes of differentiation-associated proteins, we propose to time future
investigations of bovine adipocytes more closely with differentiation.
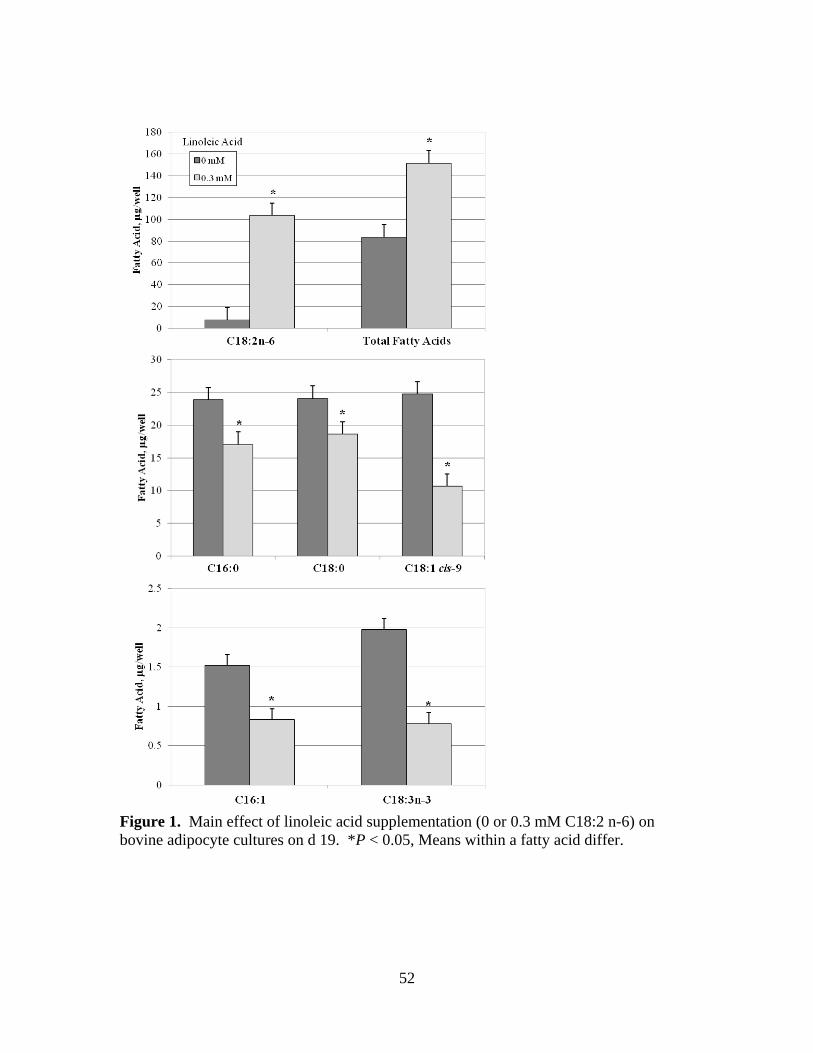
52
Figure 1. Main effect of linoleic acid supplementation (0 or 0.3 mM C18:2 n-6) on
bovine adipocyte cultures on d 19. *P < 0.05, Means within a fatty acid differ.
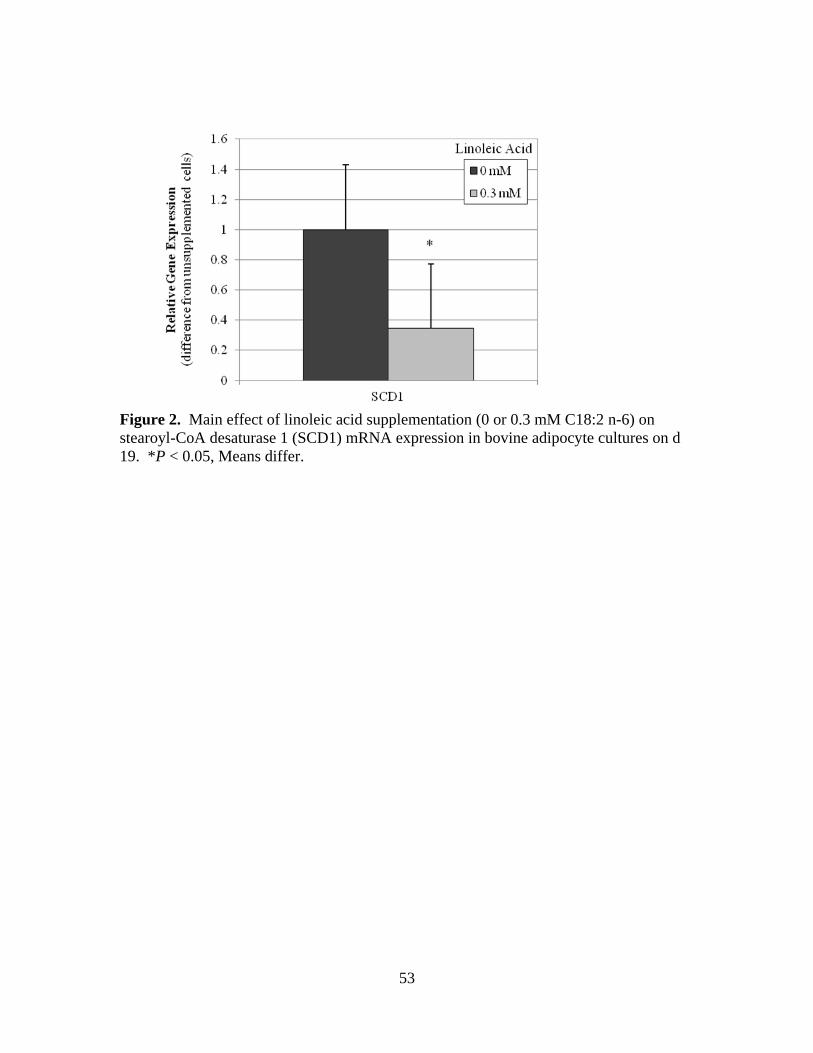
53
Figure 2. Main effect of linoleic acid supplementation (0 or 0.3 mM C18:2 n-6) on
stearoyl-CoA desaturase 1 (SCD1) mRNA expression in bovine adipocyte cultures on d
19. *P < 0.05, Means differ.
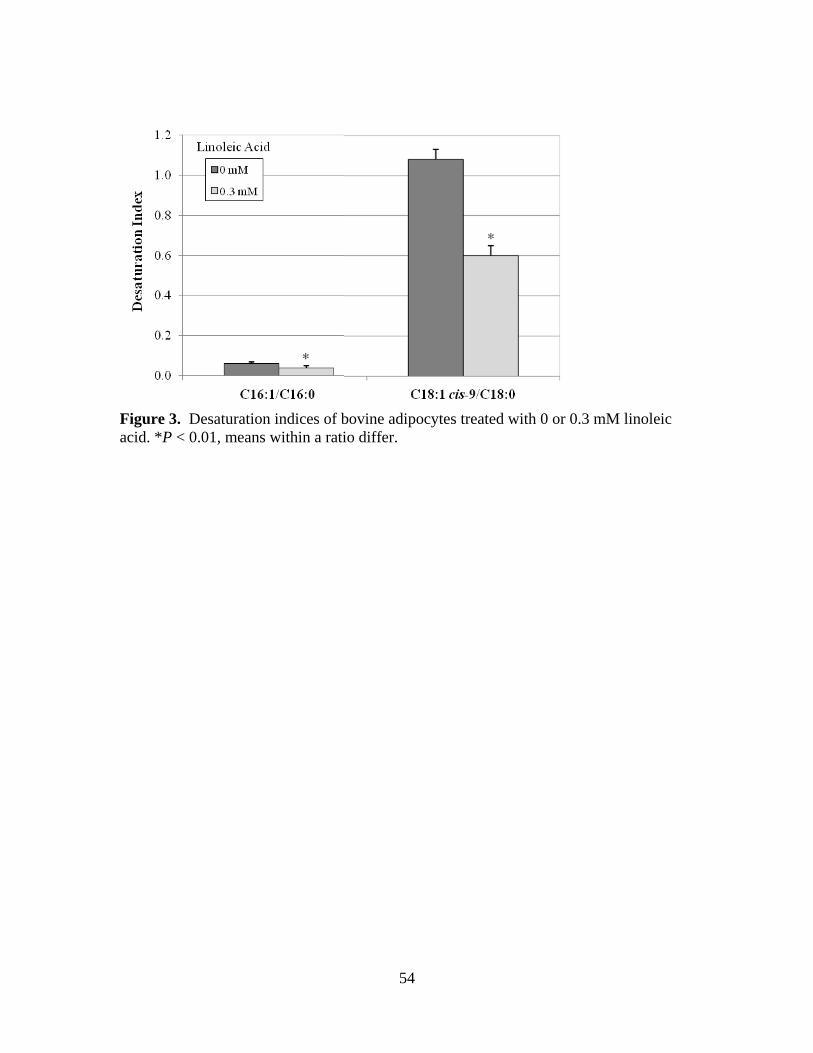
54
Figure 3. Desaturation indices of bovine adipocytes treated with 0 or 0.3 mM linoleic
acid. *P < 0.01, means within a ratio differ.
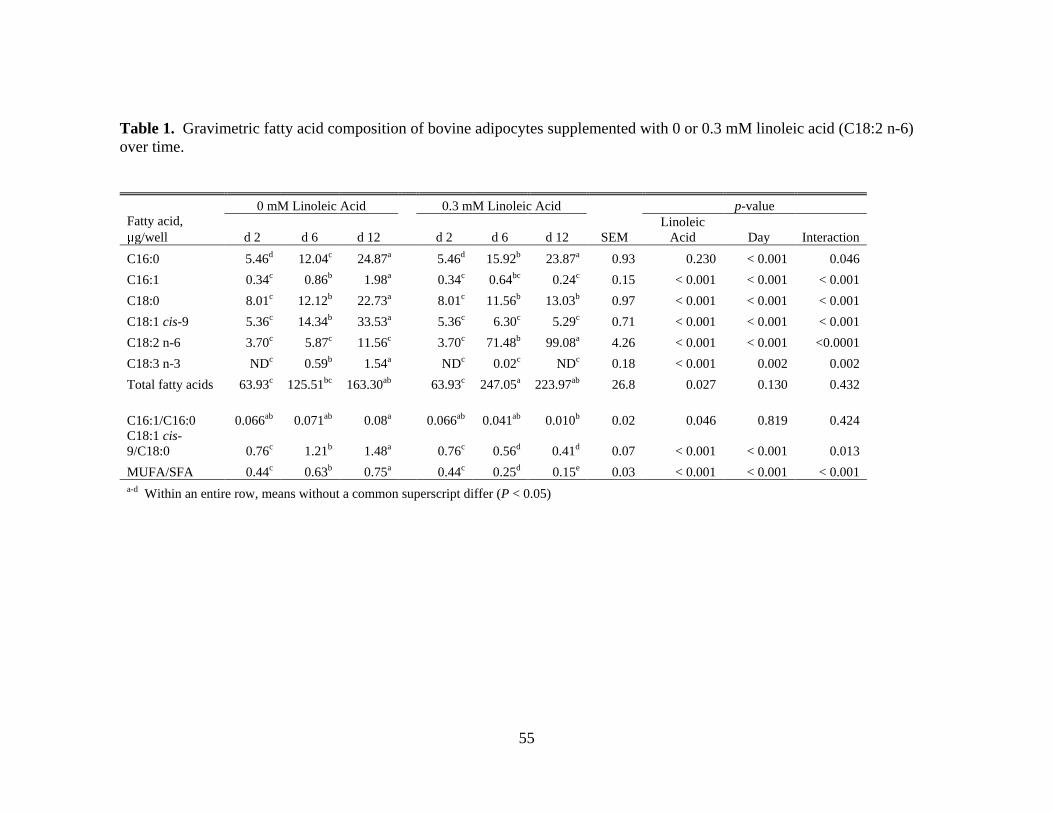
55
Table 1. Gravimetric fatty acid composition of bovine adipocytes supplemented with 0 or 0.3 mM linoleic acid (C18:2 n-6)
over time.
Fatty acid,
g/well
0 mM Linoleic Acid 0.3 mM Linoleic Acid p-value
d 2 d 6 d 12 d 2 d 6 d 12 SEM
Linoleic
Acid Day Interaction
C16:0 5.46d 12.04c 24.87a 5.46d 15.92b 23.87a 0.93 0.230 < 0.001 0.046
C16:1 0.34c 0.86b 1.98a 0.34c 0.64bc 0.24c 0.15 < 0.001 < 0.001 < 0.001
C18:0 8.01c 12.12b 22.73a 8.01c 11.56b 13.03b 0.97 < 0.001 < 0.001 < 0.001
C18:1 cis-9 5.36c 14.34b 33.53a 5.36c 6.30c 5.29c 0.71 < 0.001 < 0.001 < 0.001
C18:2 n-6 3.70c 5.87c 11.56c 3.70c 71.48b 99.08a 4.26 < 0.001 < 0.001 <0.0001
C18:3 n-3 NDc 0.59b 1.54a NDc 0.02c NDc 0.18 < 0.001 0.002 0.002
Total fatty acids 63.93c 125.51bc 163.30ab 63.93c 247.05a 223.97ab 26.8 0.027 0.130 0.432
C16:1/C16:0 0.066ab 0.071ab 0.08a 0.066ab 0.041ab 0.010b 0.02 0.046 0.819 0.424
C18:1 cis-
9/C18:0 0.76c 1.21b 1.48a 0.76c 0.56d 0.41d 0.07 < 0.001 < 0.001 0.013
MUFA/SFA 0.44c 0.63b 0.75a 0.44c 0.25d 0.15e 0.03 < 0.001 < 0.001 < 0.001
a-d Within an entire row, means without a common superscript differ (P < 0.05)
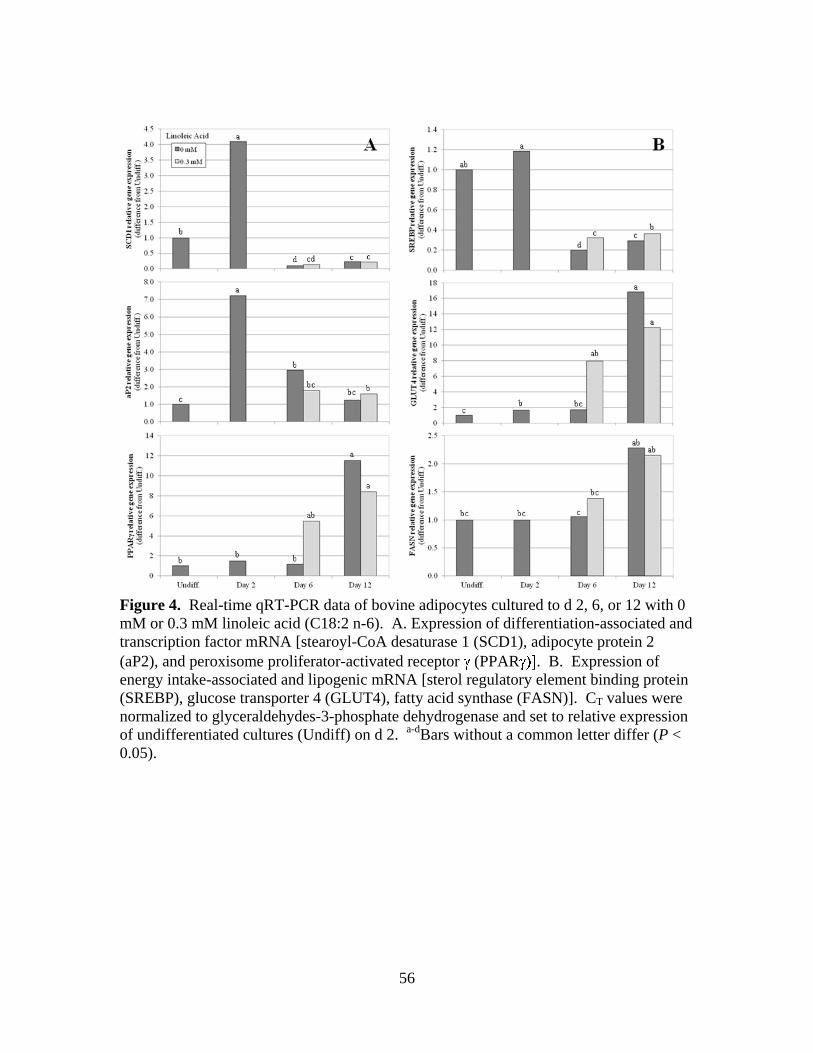
56
Figure 4. Real-time qRT-PCR data of bovine adipocytes cultured to d 2, 6, or 12 with 0
mM or 0.3 mM linoleic acid (C18:2 n-6). A. Expression of differentiation-associated and
transcription factor mRNA [stearoyl-CoA desaturase 1 (SCD1), adipocyte protein 2
(aP2), and peroxisome proliferator-activated receptor (PPAR . B. Expression of
energy intake-associated and lipogenic mRNA [sterol regulatory element binding protein
(SREBP), glucose transporter 4 (GLUT4), fatty acid synthase (FASN)]. CT values were
normalized to glyceraldehydes-3-phosphate dehydrogenase and set to relative expression
of undifferentiated cultures (Undiff) on d 2. a-d
Bars without a common letter differ (P <
0.05).
57
LITERATURE CITED
Archibeque, S. L., D. K. Lunt, C. D. Gilbert, R. K. Tume, and S. B. Smith. 2005. Fatty
acid indices of stearoyl-CoA desaturase do not reflect actual stearoyl-CoA
desaturase enzyme activities in adipose tissues of beef steers finished with corn-,
flaxseed-, or sorghum-based diets. J. Anim. Sci. 83(5): 1153-1166.
Aso, H., H. Abe, I. Nakajima, K. Ozutsumi, T. Yamaguchi, Y. Takamori et al. 1995. A
preadipocyte clonal line from bovine intramuscular adipose tissue: Nonexpression of
GLUT-4 protein during adipocyte differentiation. Biochem. Biophys. Res. Commun.
213(2): 369-375.
Chawla, A., E. J. Schwarz, D. D. Dimaculangan, M. A. Lazar. 1994. Peroxisome
proliferator-activated receptor (PPAR) gamma: adipose- predominant expression and
induction early in adipocyte differentiation. Endocrinology. 135(2): 798-800.
Duckett, S. K., J. G. Andrae, and F. N. Owens. 2002. Effect of high-oil corn or added
corn oil on ruminal biohydrogenation of fatty acids and conjugated linoleic acid
formation in beef steers fed finishing diets. J. Anim. Sci. 80(12): 3353-3360.
Duckett, S. K., S. L. Pratt, and E. Pavan. 2009. Corn oil or corn grain supplementation to
steers grazing endophyte-free tall fescue. II. effects on subcutaneous fatty acid
content and lipogenic gene expression. J. Anim. Sci. 87(3): 1120-1128.
Eberlé, D., B. Hegarty, P. Bossard, P. Ferré, and F. Foufelle. 2004. SREBP transcription
factors: Master regulators of lipid homeostasis. Biochimie. 86(11): 839-848.
Enoch, H. G., A. Catalá, and P. Strittmatter. 1976. Mechanism of rat liver microsomal
stearyl-CoA desaturase. studies of the substrate specificity, enzyme-substrate
interactions, and the function of lipid. J. Biol. Chem. 251(16): 5095-5103.
Flowers, M. T., and J. M. Ntambi. 2009. Stearoyl-CoA desaturase and its relation to high-
carbohydrate diets and obesity. Biochimica Et Biophysica Acta (BBA) - Molecular
and Cell Biology of Lipids. 1791(2): 85-91.
Folch, J., M. Lees, and G. H. S. Stanley. 1957. A simple method for the isolation and
purification of total lipides from animal tissues. J. Biol. Chem. 226(1): 497-509.
Gesta, S., Y. Tseng, and C. R. Kahn. 2007. Developmental origin of fat: Tracking obesity
to its source. Cell. 131(Oct.): 242-256.
58
Grant, A. C., G. Ortiz-Colon, M. E. Doumit, and D. D. Buskirk. 2008a. Optimization of
in vitro conditions for bovine subcutaneous and intramuscular preadipocyte
differentiation. J. Anim. Sci. 86(1): 73-82.
Grant, A. C., G. Ortiz-Colon, M. E. Doumit, R. J. Tempelman, and D. D. Buskirk. 2008b.
Differentiation of bovine intramuscular and subcutaneous stromal-vascular cells
exposed to dexamethasone and troglitazone. J. Anim. Sci. 86(10): 2531-2538.
Green, H., and O. Kehinde. 1974. Sublines of mouse 3T3 cells that accumulate lipid.
Cell. 1(3): 113-116.
Hirai, S., H. Matsumoto, N. Hino, H. Kawachi, T. Matsui, and H. Yano. 2007. Myostatin
inhibits differentiation of bovine preadipocyte. Domest. Anim. Endocrinol. 32(1): 1-
14.
Hood, R. L., and C. E. Allen. 1973. Cellularity of bovine adipose tissue. J. Lipid Res.
14(6): 605-610.
Lay, S. L., I. Lefrère, C. Trautwein, I. Dugail, and S. Krief. 2002. Insulin and sterol-
regulatory element-binding protein-1c (SREBP-1C) regulation of gene expression in
3T3-L1 adipocytes. J. Biol. Chem. 277(38): 35625-35634.
Lengi, A. J., and B. A. Corl. 2010. Factors influencing the differentiation of bovine
preadipocytes in vitro. J. Anim. Sci. 88(6): 1999-2008.
McGillis, J. P. 2005. White adipose tissue, inert no more! Endocrinology. 146(5): 2154-
2156.
Napolitano, L. 1963. The differentiation of white adipose cells: An electron microsope
study. J. Cell Bio. 18: 663-679.
Ntambi, J. M. 1995. The regulation of stearoyl-CoA desaturase (SCD). Prog. Lipid Res.
34(2): 139-150.
Ntambi, J. M., and Y. Kim. 2000. Adipocyte differentiation and gene expression. J. Nutr.
130(12): 3122S-3126.
Ntambi, J. M., and M. Miyazaki. 2004. Regulation of stearoyl-CoA desaturases and role
in metabolism. Prog. Lipid Res. 43(2): 91-104.
Ohsaki, H., T. Sawa, S. Sasazaki, K. Kano, M. Taniguchi, F. Mukai et al. 2007. Stearoyl-
CoA desaturase mRNA expression during bovine adipocyte differentiation in
primary culture derived from japanese black and holstein cattle. Comp. Biochem.
Phys. - Part A: Molecular & Integrative Physiology. 148(3): 629-634.
59
Park, P. W., and R. E. Goins. 1994. In situ preparation of FAME for analysis of fattyacid
composition in foods. J. Food Sci. 59: 1262-1266.
Pavan, E., and S. K. Duckett. 2008. Corn oil or corn grain supplementation to steers
grazing endophyte-free tall fescue. I. effects on in vivo digestibility, performance,
and carcass quality. J. Anim. Sci. 86(11): 3215-3223.
Peter, A., A. Cegan, S. Wagner, R. Lehmann, N. Stefan, A. Konigsrainer et al. 2009.
Hepatic lipid composition and stearoyl-coenzyme A desaturase 1 mRNA expression
can be estimated from plasma VLDL fatty acid ratios. Clin. Chem. 55(12): 2113-
2120.
Pfaffl, M. W., G. W. Horgan, and L. Dempfle. 2002. Relative expression software tool
(REST©) for group-wise comparison and statistical analysis of relative expression
results in real-time PCR. Nuc. Acids Res. 30(9): e36-e36.
Pratt, S. L., T. A. Burns, E. Curry, and S. K. Duckett. 2010. Expression of microRNA
during bovine adipogenesis. J. Nuc. Acids Invest. 1(e12): 62-70.
Robelin, J., C. Barboiron, and R. Jailler. 1985. Cellularité des différents dépôts adipeux
des bovins en croissance. Reprod. Nutr. Dévelop. 25(1B): 211-214.
Sessler, A. M., N. Kaur, J. P. Palta, and J. M. Ntambi. 1996. Regulation of stearoyl-CoA
desaturase 1 mRNA stability by polyunsaturated fatty acids in 3T3-L1 adipocytes. J.
Biol. Chem. 271(47): 29854-29858.
Taniguchi, M., L. L. Guan, B. Zhang, M. V. Dodson, E. Okine, and S. S. Moore. 2008a.
Adipogenesis of bovine perimuscular preadipocytes. Biochem. Biophys. Res.
Commun. 366(1): 54-59.
Taniguchi, M., L. L. Guan, B. Zhang, M. V. Dodson, E. Okine, and S. S. Moore. 2008b.
Gene expression patterns of bovine perimuscular preadipocytes during adipogenesis.
Biochem. Biophys. Res. Commun. 366(2): 346-351.
Vessby, B., I. B. Gustafsson, S. Tengblad, M. Boberg, and A. Andersson. 2002.
Desaturation and elongation of fatty acids and insulin action. Ann. N. Y. Acad. Sci.
967(Lipids and insulin resistance: the role of fatty acid metabolism and fuel
partitioning): 183-195.
60
CHAPTER 3: SUPPLEMENTAL PALMITOLEIC ACID
(C16:1 cis-9) REDUCES LIPOGENESIS AND
DESATURATION IN BOVINE ADIPOCYTE CULTURES
ABSTRACT
Our objective was to determine if palmitoleic (C16:1 cis-9) acid supplementation
to primary bovine adipocytes regulates lipogenic gene expression and rates of
lipogenesis. Stromal vascular cells were isolated from 3 cattle, propagated, and frozen
for use in this study. Cells were passaged 4 times, allowed to reach confluence, held for
2 d, and then differentiated with a standard hormone cocktail (d 0). At d 2, secondary
differentiation media containing 1 of 4 levels of palmitoleic acid (0, 50, 150, or 300 μM)
was added for 10 d. Cells were harvested on d 6 and 12 to assess fatty acid levels and
gene expression. In addition, 13
C2 and 13
C18:0 stable isotopes were added on d 6 to
measure lipogenesis and desaturase activity, respectively. Levels of C16:1 and total fatty
acids increased (P < 0.05) linearly in response to palmitoleic acid supplement. Levels of
C18:1 cis-11 and C20:1 cis-13 also increased (P < 0.01) in response to supplementation
suggesting elongation of palmitoleic acid in vitro. Levels of C16:1, C18:1 cis-11 and
total fatty acids were also greater (P < 0.05) at d 12 compared to d 6. In contrast, C16:0,
C18:0, and C18:1 cis-9 levels decreased (P < 0.05) in response to palmitoleic acid
supplementation and were not affected (P > 0.05) by harvest day. The ratio of C18:1 cis-
9/C18:0 and fractional synthetic rate (FSR) of desaturation decreased (P < 0.05) in
response to increasing palmitoleic acid supplementation. In addition, FSR of lipogenesis
was reduced (P < 0.05) in palmitoleic acid-treated cells. Messenger RNA levels as
61
determined by qRT-PCR for stearoyl-CoA desaturase 1 (SCD1), fatty acid synthase
(FASN), and elongase protein 6 (ELOVL6) genes were reduced (P < 0.05) by palmitoleic
acid supplementation. Expression of a -oxidation gene, carnitine palmitoyltransferase
1A (CPT1A), was up-regulated (P < 0.05) with palmitoleic acid supplementation in a
dose response manner. Supplementation of palmitoleic acid to bovine adipocytes results
in increased incorporation of this fatty acid and its elongation products into the adipocyte,
which down-regulates SCD1, FASN, and ELOVL6 to decrease lipogenesis and
desaturation and up-regulates CPT1A to increase β-oxidation. These results suggest that
palmitoleic acid, an end-product of desaturation, can act as a regulator of lipogenesis,
desaturation, and β-oxidation in bovine adipocytes.
62
INTRODUCTION
Over the past decade, researchers have begun to view white adipose tissue, not as
an inert energy storage site, but as a complex, metabolically active tissue (McGillis,
2005). Excess adipose tissue is not advantageous to human health, with regard to
common medical disorders associated with obesity, or to livestock producers, who strive
for a balance between maximal intramuscular fat and minimal subcutaneous fat which
influence beef quality and yield grades, respectively. In addition, interest in fatty acid
composition of meat and milk products has increased with concerns of saturated fatty
acids (SFA) in the human diet. Research shows that adipocytes in white adipose tissue
produce and secrete leptin (Flier, 1998), adipokines (MacDougald and Burant, 2007),
and lipokines (Cao et al., 2008) that coordinate systemic metabolism.
Cao et al. (2008) identified palmitoleic (C16:1 cis-9) acid as a lipokine that
increases insulin sensitivity in skeletal muscle and decreases lipogenesis in liver of mice.
In this study, exogenous administration of palmitoleic acid to mice reduced lipogenic
gene expression in the liver and increased insulin signaling in skeletal muscle. In
humans, circulating palmitoleic acid level is strongly associated with abdominal obesity
in children (Okada et al., 2005) and adults (Gong et al., 2010), and predictor of insulin
sensitivity in adults (Stefan et al., 2010). In finishing beef cattle, the correlation between
tissue palmitoleic and oleic (C18:1 cis-9) acid concentrations and carcass fat content are
high (r = 0.68 and 0.81, respectively; Duckett unpublished data). In rodents and non-
obese humans, the liver serves as the primary site of de novo lipogenesis; conversely,
adipose tissue serves as the primary site of de novo lipogenesis in ruminants (Vernon,
63
1980; Smith and Crouse, 1984). Palmitoleic acid in circulation and adipose tissues
originates predominately from de novo fatty acid synthesis as dietary sources of C16:1
are minor. Therefore, we hypothesize that palmitoleic acid supplementation to bovine
adipocytes will decrease lipogenic gene expression and lipogenic rates in vitro.
64
MATERIALS AND METHODS
Cell Culture. Primary bovine stromal vascular (SV) cultures were harvested from
adipose tissue of 18 mo old Angus crossbred cattle as described by Pratt et al. (2010)
using slight modifications of methods described by Hirai et al. (2007). Cells were plated
at 1 x 10⁴ cells/cm
2 and passaged every 2 to 4 d when 60% confluent. Cells were
incubated at 37°C under 5% CO2 humidified atmosphere with media [Dulbecco‟s
modified eagles medium (DMEM) containing 10% fetal calf serum (FCS), and 2X
antibiotic/antimycotic (AB/AM; containing 10,000 U/mL penicillin G, 10,000 g/mL
streptomycin, and 25 g/mL amphotericin B)] replacement every 2 d. After 4 passages,
cell lines were stored in liquid nitrogen at 1 x 10⁶ cells/mL in freezing media (DMEM,
20% FCS, and 10% dimethyl sulfoxide) for later use.
Treatments. Individual cultures from 3 animals were used in duplicate for this
study. Cells were thawed, passaged 3 times, and seeded in 6-well plates (1.6 cm2/well) at
1 x 10⁵ cells/cm
2. Cells were allowed to reach confluence, held for 2 d, and differentiated
on d 0 with DMEM containing 5% FCS, 2X AB/AM, 2.5 g/ml insulin, 0.5 mM 2-
isobutyl-1-methylaxanthine (IBMX), 0.25 M dexamethasone (DEX), 5 M troglitazone
(TRO), and 10 mM acetate (Hirai et al., 2007; Pratt et al., 2010). Secondary
differentiation media (DMEM, 5% FCS, 2X AB/AM, 2.5 g/mL insulin, 5 M TRO, and
10 mM acetate) was applied for 4 (d 6) or 10 d (d 12) along with palmitoleic acid (C16:1
cis-9) at varying levels (0, 50, 150, or 300 M). Palmitoleic acid was bound to bovine
serum albumin (2:1, w/w) according to Van Harken et al. (1969) prior to media addition.
65
Cells were harvested on d 6 and d 12 for fatty acid composition and lipogenic gene
expression. Before trypsin was applied, media was removed and cells were rinsed 3
times with PBS.
The differentiation hormones and media used in our experiment have been tested
for their efficacy in inducing differentiation in bovine SV cultures (Aso et al., 1995;
Grant et al., 2008a and b; Lengi and Corl, 2010). Classically, preadipocytes change
shape from fibroblastic to round and accumulate lipid (Napolitano, 1963), in addition to
changes in gene expression (Taniguchi et al., 2008). Previously, our SV cultures
displayed characteristic changes in morphology, lipid-filling, and adipogenic gene
expression upon hormonal treatment, consistent with adipocyte differentiation (Pratt et
al., 2010). In the current study, cells changed shape from fibroblastic to round following
differentiation and became lipid-filled with fatty acid supplementation (Figure 1).
Fatty acids. Cellular fatty acids were extracted and transmethylated as described
by Folch et al. (1957) and Park and Goins (1994), respectively. Fatty acid methyl esters
(FAME) were analyzed using an Agilent 6850 gas chromatograph (GC) equipped with an
Agilent 7673A automatic sampler (Agilent Technologies, Inc., Santa Clara, CA).
Separations were accomplished using a 100-m Supelco SP-2560 (Supelco, Inc.,
Bellefonte, PA) capillary column (0.25 mm i.d. and 0.20 m film thickness) according to
Duckett et al. (2002). Individual fatty acids were identified by comparison of retention
times with standards (Sigma, St. Louis, MO; Matreya, Pleasant Gap, PA). Fatty acids
were quantified by incorporating an internal standard, methyl tricosanoic (C23:0) acid,
66
into each sample during methylation and expressed as a weight percentage of total fatty
acids per well.
Lipogenesis. To measure lipogenesis in vitro, we added stable isotope labeled
acetate (2.5 mM 1-13
C2) to cultures treated with 0, 150, and 300 C16:1 on d 6 for 0,
6, 12, and 24 h. At harvest, cells were placed directly into 2:1 chloroform:methanol
(vol/vol) to terminate all enzymatic activity. Fatty acid methyl esters were prepared as
stated above for analysis with an Agilent 6890N GC equipped with an Agilent 5973 mass
spectrometer (MS) using a 100-m Varian CP7489 (Varian Instruments Inc., Walnut
Creek, CA) capillary column (0.25 mm i.d. and 0.20 μm film thickness). Samples were
run in the chemical ionization mode with He as the carrier gas and CH4 as the reagent
gas. Ions of mass-to-charge ratio (m/z) 270 (m), 271 (m + 1), and 272 (m + 2) were
selectively measured to calculate the isotopic enrichments of C16:0.
Enrichment of a sample treated with stable isotope can be calculated by several
different methods. Because we were interested in calculating lipogenic rate in terms of
the formation of a fatty acid polymer, C16:0, from repeating units of acetate, we used
Mass Isotopomer Distribution Analysis (MIDA), which is ideal in this application (Wolfe
and Chinkes, 2005). In essence, MIDA estimates the precursor enrichment pool
(MPEprecursor) based on probabilities and uses it to calculate a fractional synthetic rate
(FSR) of the product. We calculated the relative abundance (RA) of singly (m + 1) and
doubly (m + 2) labeled C16:0 to unlabeled (m) C16:0 isotopomers. To account for
background noise and natural abundance of 13
C isotope, the tracer-to-tracee ratio (TTR)
was calculated as TTRC16:0 = (RAsample – RAblank) * (1 – A)n , where A was the natural
67
abundance of 13
C, A = 0.011, and n was the number of C in the fatty acid molecule, n =
16 (Wolfe and Chinkes, 2005). Samples that were not exposed to labeled isotope served
as „blanks‟. Precursor enrichment in molar percent excess (MPE) was estimated by:
MPEprecursor = 2 × (TTR(m + 2) / TTR(m + 1))
(p – 1) + (2 × (TTR(m + 2) / TTR(m + 1))
where, p is the number of precursor monomers present in the polymer, p = 8. Finally, our
estimate of lipogenesis could be derived by calculating FSR (Wolfe and Chinkes, 2005).
FSRlipogenesis = TTRC16:0, time1 – TTRC16:0, time0
(p × MPEprecursor) (1 - MPEprecursor)p-1
(time1 – time0)
Desaturation. Stearoyl-CoA desaturase 1 (SCD1) is the enzyme responsible for
creating a double bond at the 9 position of several fatty-acyl CoA and its preferred
substrates are C16:0 and C18:0 (Enoch et al., 1976). Stearoyl-CoA desaturase
transcription and activity can regulated by certain fatty acids (Ntambi, 1995), but the
effect of palmitoleic acid supplementation on SCD1 activity has not been reported to
date. Traditionally, western blotting is used to detect protein abundance; however, we
have not been successful in blotting for bovine SCD1 using commercially available
antibodies designed for human and mouse. Therefore, we focused our efforts on in vitro
measurement of SCD1 activity using stable isotopes. Initially, we added 20 M 1-
13C18:0 to cultures on d 6 as described above. Enrichment of C18:0 was detected by 6 h
post-inclusion of tracer; however, TTR of C18:1 cis-9 was not evident in cultures (data
not shown). Therefore, we repeated the experiment with 2 cell lines treated with 0 or 150
68
C16:1 and increased the amount of tracer to 100 M 1-13
C18:0 on d 6. Samples were
prepared and analyzed as described above for analysis with GC-MS. Ions of mass-to-
charge ratio (m/z) 298 (m) and 299 (m + 1) were selectively measured to calculate the
isotopic enrichments of C18:0. Similarly, isotope abundance of 296 (m) and 297 (m + 1)
was measured for C18:1 cis-9. Since tracer enrichment can be measured in this case and
the product of the SCD reaction is not a polymer of the tracer, it was not necessary to use
MIDA. The FSR was calculated for rate of desaturation using the precursor enrichment,
MPEC18:0.
FSRdesaturation = TTRC18:1 cis-9, time1 – TTR C18:1 cis-9, time0
MPEC18:0 × (time1 – time0)
Gene Expression. Total cellular RNA was isolated from cells using the mirVana
microRNA Isolation kit (Ambion, Austin, TX) according to manufacturer‟s instructions
and RNA quality as described by Duckett et al. (2009). Quality was assessed using
Nanodrop 2000 Spectrophotometer (Thermo Fisher Scientific, Inc., Waltham, MA) and
Agilent Bioanalyzer 2100. All tcRNA samples used in real-time PCR (qRT-PCR) had a
260:280 absorbance ratio > 1.8 on the Nanodrop and RNA integrity number > 8.0 (1.0 to
10.0 scale) using Agilent RNA 6000 Nano kit. Real-time qRT-PCR was conducted using
an Eppendorf MasterCycler ep realplex (Westbury, NY) with the QuantiTect SYBR
Green RT-PCR One Step Kit (Qiagen, Valencia, CA) according to the manufacturer‟s
directions. Two genes, glyceraldehyde-3-phosphate dehydrogenase (GAPDH) and β-
actin, were evaluated as housekeeping genes for data normalization (Duckett et al., 2009).
To determine the appropriate housekeeping gene to be used to normalize the data, the
69
cycle threshold values (CT) for GAPDH, β-actin, and all target genes per sample were
entered into the BESTKEEPER program (http://www.gene-quantification.info). The
program determines the most stable housekeeping gene to be used for normalization by
repeated pair-wise correlation and regression analysis (Pfaffl et al., 2002). Both GAPDH
and β-actin exhibited a correlation coefficient of 0.99 (P < 0.001) in the analysis and
were suitable for data normalization. Primers for bovine mRNAs were designed using
Primer 3 software (http://frodo.wi.mit.edu/primer3/). Primer sets were first evaluated
according to Duckett et al. (2009) to verify identity. Genes of interest for this study were
those involved in fatty acid biosynthesis including acetyl-CoA carboxylase (ACC), fatty
acid synthase (FASN), fatty acid elongase (ELOVL) -5 and -6, SCD1, sterol regulatory
element binding protein-1c (SREBP), and carnitine palmitoyl-transferase 1A (CPT1A).
Statistical Analysis. The data were analyzed using Proc GLM procedure of SAS
9.2 (SAS Institute Inc., Cary, NC) for treatment comparisons over time. A two-way
analysis of variance (ANOVA) was performed as a completely randomized design with
factors fatty acid level (0, 50, 150, and 300 M C16:1), day (d 6 and d 12) or time (0, 6,
12, and 24 h), and two-way interaction. Least squares means were computed and
separated statistically using Fisher‟s Protected LSD test. In addition, linear regression
was performed using the bivariate fit model of JMP Version 7 (SAS Institute Inc.).
Relative gene expression data was analyzed using Pair-wise Fixed Reallocation
Randomization Test (Pfaffl et al., 2002) with preplanned treatment comparisons.
70
RESULTS AND DISCUSSION
Fatty acids. We successfully incorporated our fatty acid supplement into bovine
adipocyte cultures based on detection of increasing amounts of C16:1 in palmitoleic acid-
treated cells after all media was removed (Figure 2). Rates of palmitoleic acid
incorporation into the adipocytes were 0.24 and 0.61 μg/well per M supplemented
palmitoleic acid for d 6 and 12 respectively. After completion of the fatty acid analysis,
we discovered high concentrations of fatty acids believed to be C18:1 cis-11 and C20:1
cis-13. In order to confirm identity, ion masses were checked with GC-MS and samples
were spiked with standards of known identity. The identity of these peaks were
confirmed as being C18:1 cis-11 and C20:1 cis-13. A significant interaction (P < 0.001)
between level of palmitoleic acid supplementation and day of harvest was present for
total fatty acids, C16:1, C18:1 cis-11, and C20:1 cis-13 (Figure 2). Each of these fatty
acids gravimetrically increased (P < 0.01) in response to higher levels of palmitoleic acid
supplementation and the magnitude of response was greater (P < 0.01) on d 12 than d 6.
No other fatty acid peaks detected showed a similar pattern of response (P > 0.05). As
C18:1 cis-11 and C20:1 cis-13 were not present in high concentrations in control cells
and they increased dramatically in cultures supplemented with palmitoleic acid, we
suspect they were elongated from palmitoleic acid.
After accounting for any endogenous levels of C16:1, C18:1 cis-11, and C20:1
cis-13 in our cultures, we estimated the percentage of supplemental palmitoleic acid that
was elongated. In the 50 M palmitoleic acid-treated cells on d 6, 66 ± 2% of palmitoleic
acid was elongated to C18:1 cis-11 and C20:1 cis-13. With higher levels of palmitoleic
71
acid supplementation, the percent of palmitoleic acid converted to C18:1 cis-11 and
C20:1 cis-13 decreased (P < 0.01) to 55 ± 2% and 49 ± 2% for 150 and 300 M
treatment levels, respectively. Results were similar for d 12 cultures in that the percent of
palmitoleic acid elongated was 69 ± 3%, 63 ± 2%, and 54 ± 2% for the 50, 150, and 300
M palmitoleic acid treatment levels, respectively. Despite the linear incorporation of
C16:1 into the adipocytes, the percentage elongated into C18:1 cis-11 and C20:1 cis-13 in
bovine adipocytes was curvilinear suggesting that the elongase reaction was limited by
another factor other than substrate availability.
There was also an interaction (P < 0.05) between level of palmitoleic acid
supplementation and day of harvest for linoleic (C18:2 n-6) acid (Figure 3). On d 12,
linoleic acid content did not differ (P > 0.05) with palmitoleic acid supplementation
(Table 1). On d 6, linoleic acid content decreased (P < 0.05) with palmitoleic acid
supplementation. Stearic (C18:0) acid content was lower (P < 0.05) at 50 and 300 μM
compared to controls (0 μM). Oleic (C18:1 cis-9) and arachidonic (C20:4 n-6) acids
were lower (P < 0.05) in palmitoleic acid supplemented cells, regardless of
supplementation level. Palmitic (C16:0) acid content did not differ (P > 0.05) with
palmitoleic acid supplementation.
Lipogenesis. We were able to detect enrichment of C16:0, calculated by TTR, in
cells treated with 1-13
C2 in the media on d 6. There was a significant interaction (P <
0.01) of TTRC16:0 between level of palmitoleic acid supplementation and time of labeled
acetate incubation. All palmitoleic acid treatment levels had TTRC16:0 greater than zero
(P < 0.01) at 12 h, but cells treated with 150 M palmitoleic acid had reduced (P < 0.05)
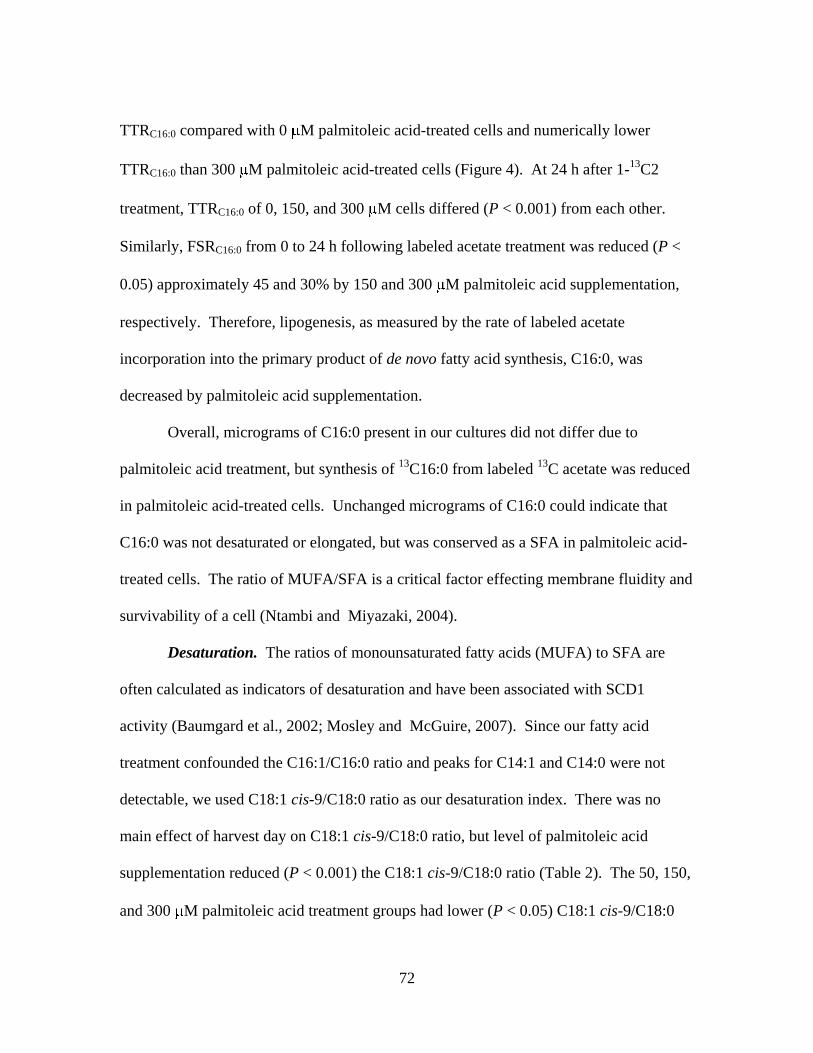
72
TTRC16:0 compared with 0 M palmitoleic acid-treated cells and numerically lower
TTRC16:0 than 300 M palmitoleic acid-treated cells (Figure 4). At 24 h after 1-13
C2
treatment, TTRC16:0 of 0, 150, and 300 M cells differed (P < 0.001) from each other.
Similarly, FSRC16:0 from 0 to 24 h following labeled acetate treatment was reduced (P <
0.05) approximately 45 and 30% by 150 and 300 M palmitoleic acid supplementation,
respectively. Therefore, lipogenesis, as measured by the rate of labeled acetate
incorporation into the primary product of de novo fatty acid synthesis, C16:0, was
decreased by palmitoleic acid supplementation.
Overall, micrograms of C16:0 present in our cultures did not differ due to
palmitoleic acid treatment, but synthesis of 13
C16:0 from labeled 13
C acetate was reduced
in palmitoleic acid-treated cells. Unchanged micrograms of C16:0 could indicate that
C16:0 was not desaturated or elongated, but was conserved as a SFA in palmitoleic acid-
treated cells. The ratio of MUFA/SFA is a critical factor effecting membrane fluidity and
survivability of a cell (Ntambi and Miyazaki, 2004).
Desaturation. The ratios of monounsaturated fatty acids (MUFA) to SFA are
often calculated as indicators of desaturation and have been associated with SCD1
activity (Baumgard et al., 2002; Mosley and McGuire, 2007). Since our fatty acid
treatment confounded the C16:1/C16:0 ratio and peaks for C14:1 and C14:0 were not
detectable, we used C18:1 cis-9/C18:0 ratio as our desaturation index. There was no
main effect of harvest day on C18:1 cis-9/C18:0 ratio, but level of palmitoleic acid
supplementation reduced (P < 0.001) the C18:1 cis-9/C18:0 ratio (Table 2). The 50, 150,
and 300 M palmitoleic acid treatment groups had lower (P < 0.05) C18:1 cis-9/C18:0
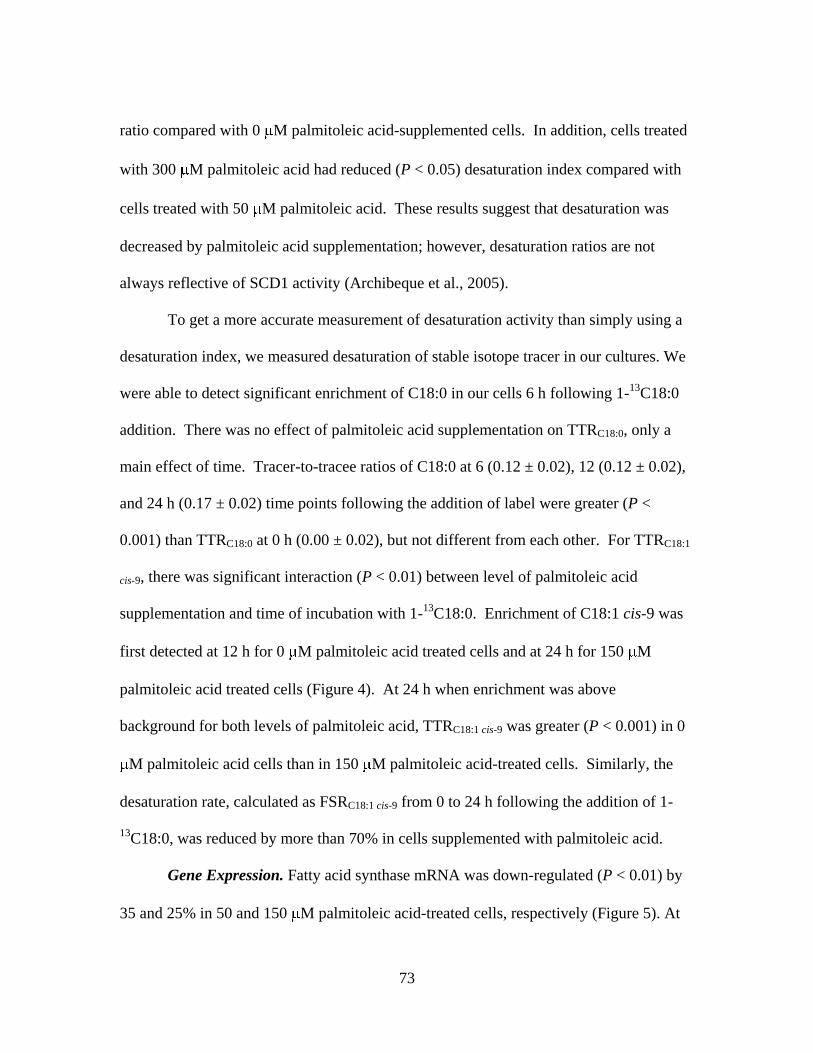
73
ratio compared with 0 M palmitoleic acid-supplemented cells. In addition, cells treated
with 300 M palmitoleic acid had reduced (P < 0.05) desaturation index compared with
cells treated with 50 M palmitoleic acid. These results suggest that desaturation was
decreased by palmitoleic acid supplementation; however, desaturation ratios are not
always reflective of SCD1 activity (Archibeque et al., 2005).
To get a more accurate measurement of desaturation activity than simply using a
desaturation index, we measured desaturation of stable isotope tracer in our cultures. We
were able to detect significant enrichment of C18:0 in our cells 6 h following 1-13
C18:0
addition. There was no effect of palmitoleic acid supplementation on TTRC18:0, only a
main effect of time. Tracer-to-tracee ratios of C18:0 at 6 (0.12 ± 0.02), 12 (0.12 ± 0.02),
and 24 h (0.17 ± 0.02) time points following the addition of label were greater (P <
0.001) than TTRC18:0 at 0 h (0.00 ± 0.02), but not different from each other. For TTRC18:1
cis-9, there was significant interaction (P < 0.01) between level of palmitoleic acid
supplementation and time of incubation with 1-13
C18:0. Enrichment of C18:1 cis-9 was
first detected at 12 h for 0 M palmitoleic acid treated cells and at 24 h for 150 M
palmitoleic acid treated cells (Figure 4). At 24 h when enrichment was above
background for both levels of palmitoleic acid, TTRC18:1 cis-9 was greater (P < 0.001) in 0
M palmitoleic acid cells than in 150 M palmitoleic acid-treated cells. Similarly, the
desaturation rate, calculated as FSRC18:1 cis-9 from 0 to 24 h following the addition of 1-
13C18:0, was reduced by more than 70% in cells supplemented with palmitoleic acid.
Gene Expression. Fatty acid synthase mRNA was down-regulated (P < 0.01) by
35 and 25% in 50 and 150 M palmitoleic acid-treated cells, respectively (Figure 5). At
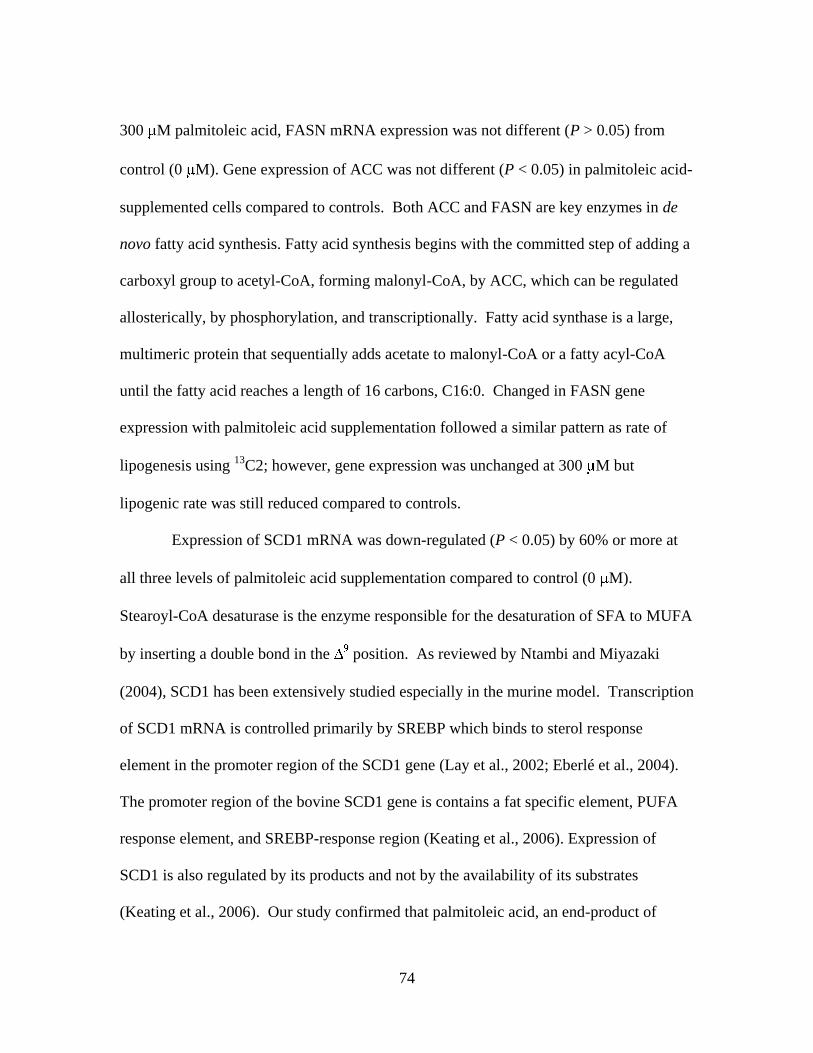
74
300 M palmitoleic acid, FASN mRNA expression was not different (P > 0.05) from
control (0 M). Gene expression of ACC was not different (P < 0.05) in palmitoleic acid-
supplemented cells compared to controls. Both ACC and FASN are key enzymes in de
novo fatty acid synthesis. Fatty acid synthesis begins with the committed step of adding a
carboxyl group to acetyl-CoA, forming malonyl-CoA, by ACC, which can be regulated
allosterically, by phosphorylation, and transcriptionally. Fatty acid synthase is a large,
multimeric protein that sequentially adds acetate to malonyl-CoA or a fatty acyl-CoA
until the fatty acid reaches a length of 16 carbons, C16:0. Changed in FASN gene
expression with palmitoleic acid supplementation followed a similar pattern as rate of
lipogenesis using 13
C2; however, gene expression was unchanged at 300 M but
lipogenic rate was still reduced compared to controls.
Expression of SCD1 mRNA was down-regulated (P < 0.05) by 60% or more at
all three levels of palmitoleic acid supplementation compared to control (0 M).
Stearoyl-CoA desaturase is the enzyme responsible for the desaturation of SFA to MUFA
by inserting a double bond in the position. As reviewed by Ntambi and Miyazaki
(2004), SCD1 has been extensively studied especially in the murine model. Transcription
of SCD1 mRNA is controlled primarily by SREBP which binds to sterol response
element in the promoter region of the SCD1 gene (Lay et al., 2002; Eberlé et al., 2004).
The promoter region of the bovine SCD1 gene is contains a fat specific element, PUFA
response element, and SREBP-response region (Keating et al., 2006). Expression of
SCD1 is also regulated by its products and not by the availability of its substrates
(Keating et al., 2006). Our study confirmed that palmitoleic acid, an end-product of
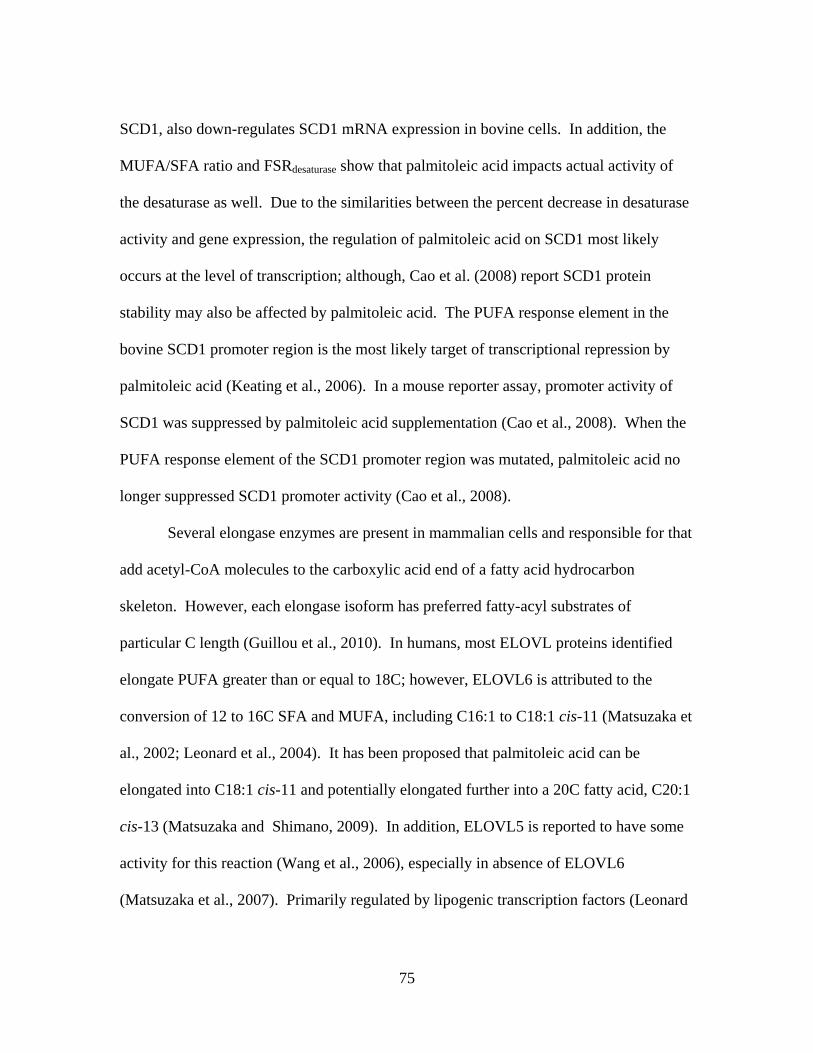
75
SCD1, also down-regulates SCD1 mRNA expression in bovine cells. In addition, the
MUFA/SFA ratio and FSRdesaturase show that palmitoleic acid impacts actual activity of
the desaturase as well. Due to the similarities between the percent decrease in desaturase
activity and gene expression, the regulation of palmitoleic acid on SCD1 most likely
occurs at the level of transcription; although, Cao et al. (2008) report SCD1 protein
stability may also be affected by palmitoleic acid. The PUFA response element in the
bovine SCD1 promoter region is the most likely target of transcriptional repression by
palmitoleic acid (Keating et al., 2006). In a mouse reporter assay, promoter activity of
SCD1 was suppressed by palmitoleic acid supplementation (Cao et al., 2008). When the
PUFA response element of the SCD1 promoter region was mutated, palmitoleic acid no
longer suppressed SCD1 promoter activity (Cao et al., 2008).
Several elongase enzymes are present in mammalian cells and responsible for that
add acetyl-CoA molecules to the carboxylic acid end of a fatty acid hydrocarbon
skeleton. However, each elongase isoform has preferred fatty-acyl substrates of
particular C length (Guillou et al., 2010). In humans, most ELOVL proteins identified
elongate PUFA greater than or equal to 18C; however, ELOVL6 is attributed to the
conversion of 12 to 16C SFA and MUFA, including C16:1 to C18:1 cis-11 (Matsuzaka et
al., 2002; Leonard et al., 2004). It has been proposed that palmitoleic acid can be
elongated into C18:1 cis-11 and potentially elongated further into a 20C fatty acid, C20:1
cis-13 (Matsuzaka and Shimano, 2009). In addition, ELOVL5 is reported to have some
activity for this reaction (Wang et al., 2006), especially in absence of ELOVL6
(Matsuzaka et al., 2007). Primarily regulated by lipogenic transcription factors (Leonard
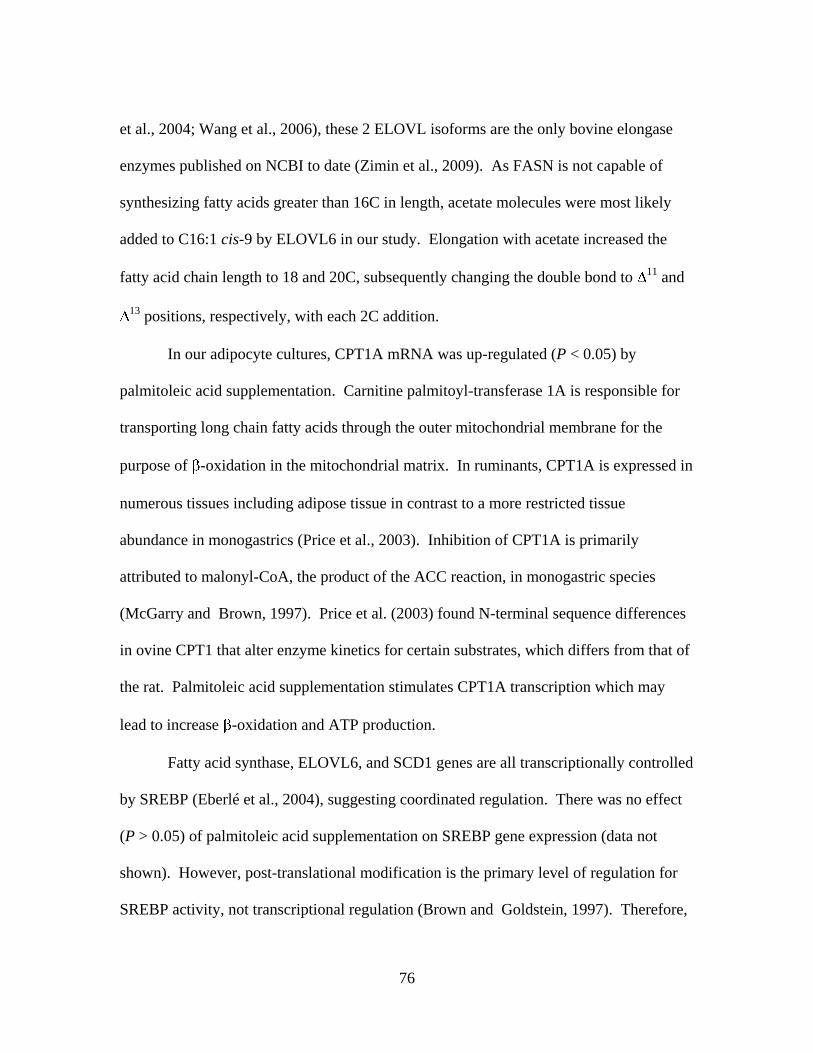
76
et al., 2004; Wang et al., 2006), these 2 ELOVL isoforms are the only bovine elongase
enzymes published on NCBI to date (Zimin et al., 2009). As FASN is not capable of
synthesizing fatty acids greater than 16C in length, acetate molecules were most likely
added to C16:1 cis-9 by ELOVL6 in our study. Elongation with acetate increased the
fatty acid chain length to 18 and 20C, subsequently changing the double bond to 11
and
13 positions, respectively, with each 2C addition.
In our adipocyte cultures, CPT1A mRNA was up-regulated (P < 0.05) by
palmitoleic acid supplementation. Carnitine palmitoyl-transferase 1A is responsible for
transporting long chain fatty acids through the outer mitochondrial membrane for the
purpose of -oxidation in the mitochondrial matrix. In ruminants, CPT1A is expressed in
numerous tissues including adipose tissue in contrast to a more restricted tissue
abundance in monogastrics (Price et al., 2003). Inhibition of CPT1A is primarily
attributed to malonyl-CoA, the product of the ACC reaction, in monogastric species
(McGarry and Brown, 1997). Price et al. (2003) found N-terminal sequence differences
in ovine CPT1 that alter enzyme kinetics for certain substrates, which differs from that of
the rat. Palmitoleic acid supplementation stimulates CPT1A transcription which may
lead to increase -oxidation and ATP production.
Fatty acid synthase, ELOVL6, and SCD1 genes are all transcriptionally controlled
by SREBP (Eberlé et al., 2004), suggesting coordinated regulation. There was no effect
(P > 0.05) of palmitoleic acid supplementation on SREBP gene expression (data not
shown). However, post-translational modification is the primary level of regulation for
SREBP activity, not transcriptional regulation (Brown and Goldstein, 1997). Therefore,
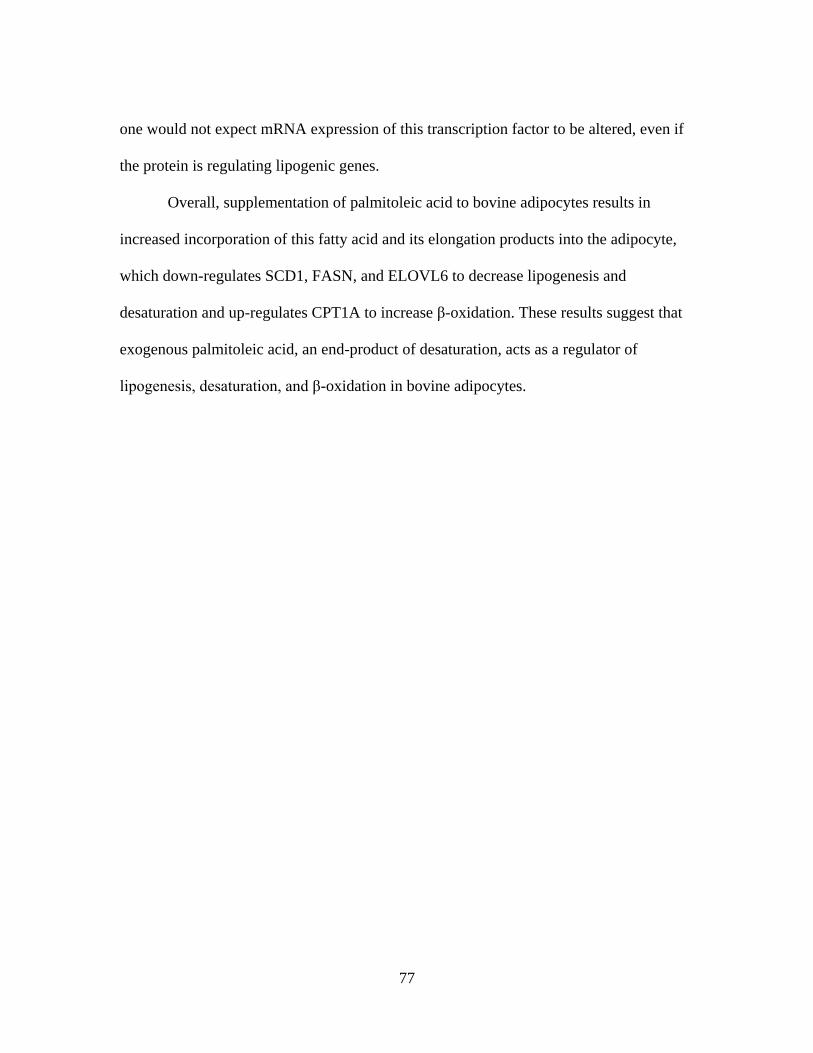
77
one would not expect mRNA expression of this transcription factor to be altered, even if
the protein is regulating lipogenic genes.
Overall, supplementation of palmitoleic acid to bovine adipocytes results in
increased incorporation of this fatty acid and its elongation products into the adipocyte,
which down-regulates SCD1, FASN, and ELOVL6 to decrease lipogenesis and
desaturation and up-regulates CPT1A to increase β-oxidation. These results suggest that
exogenous palmitoleic acid, an end-product of desaturation, acts as a regulator of
lipogenesis, desaturation, and β-oxidation in bovine adipocytes.
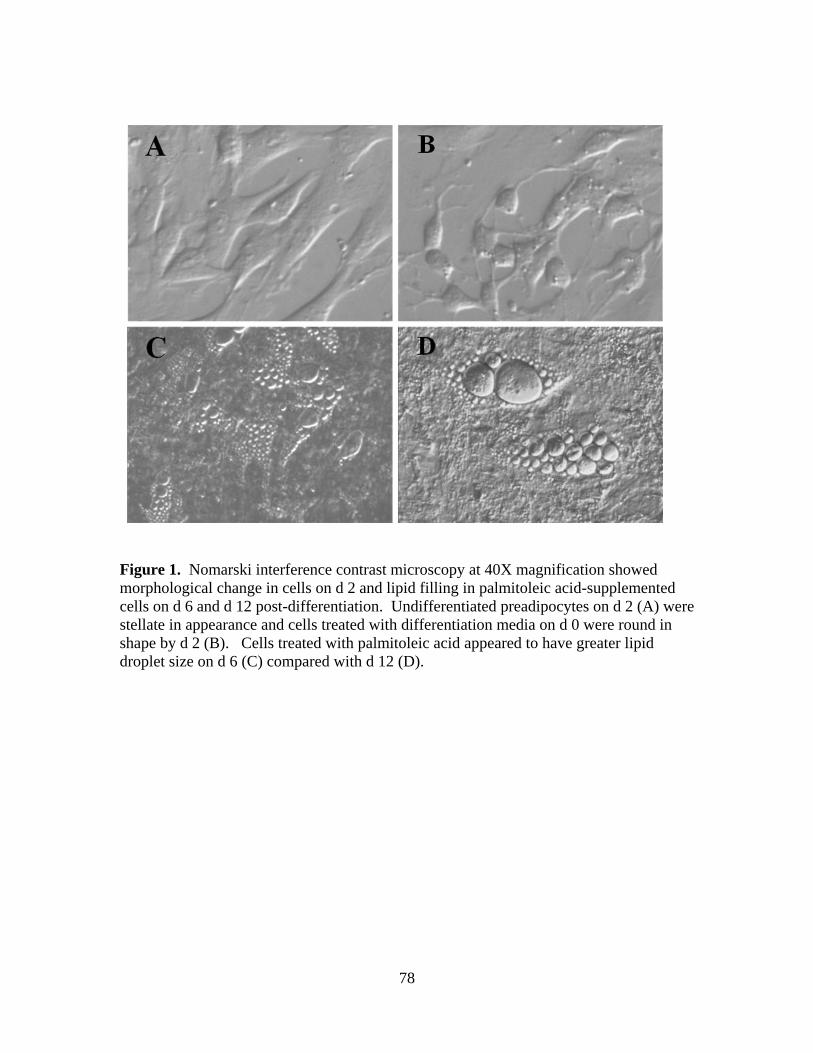
78
Figure 1. Nomarski interference contrast microscopy at 40X magnification showed
morphological change in cells on d 2 and lipid filling in palmitoleic acid-supplemented
cells on d 6 and d 12 post-differentiation. Undifferentiated preadipocytes on d 2 (A) were
stellate in appearance and cells treated with differentiation media on d 0 were round in
shape by d 2 (B). Cells treated with palmitoleic acid appeared to have greater lipid
droplet size on d 6 (C) compared with d 12 (D).
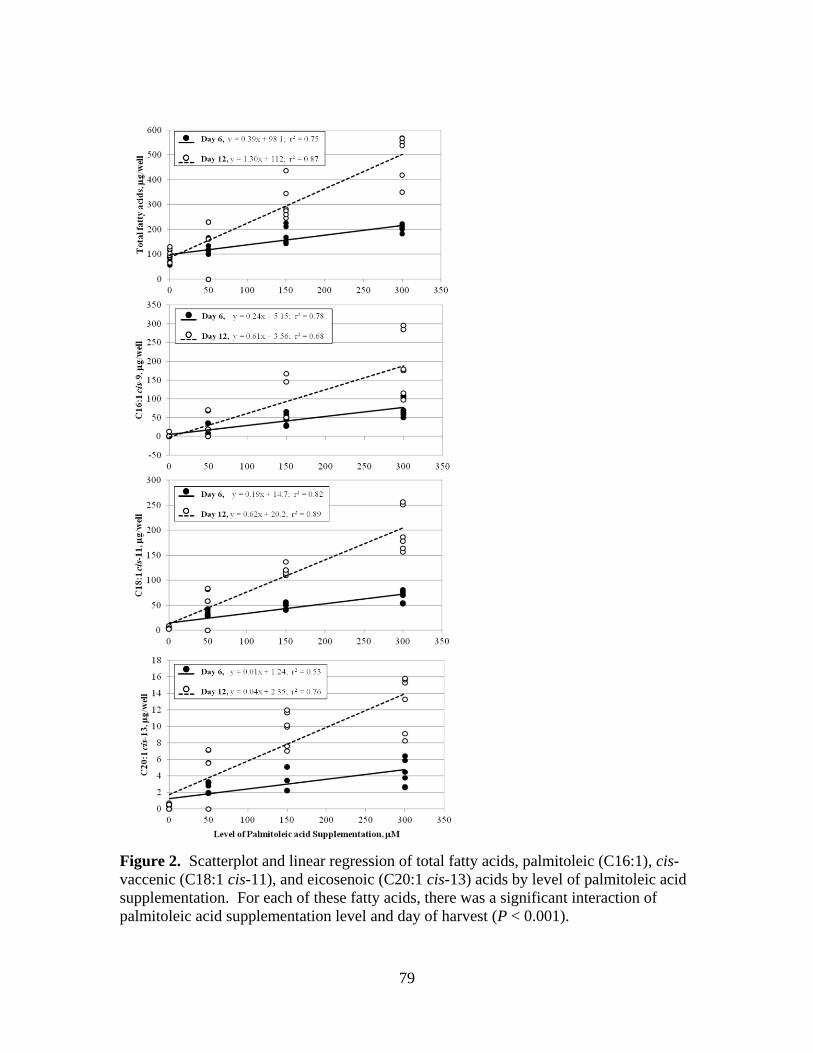
79
Figure 2. Scatterplot and linear regression of total fatty acids, palmitoleic (C16:1), cis-
vaccenic (C18:1 cis-11), and eicosenoic (C20:1 cis-13) acids by level of palmitoleic acid
supplementation. For each of these fatty acids, there was a significant interaction of
palmitoleic acid supplementation level and day of harvest (P < 0.001).
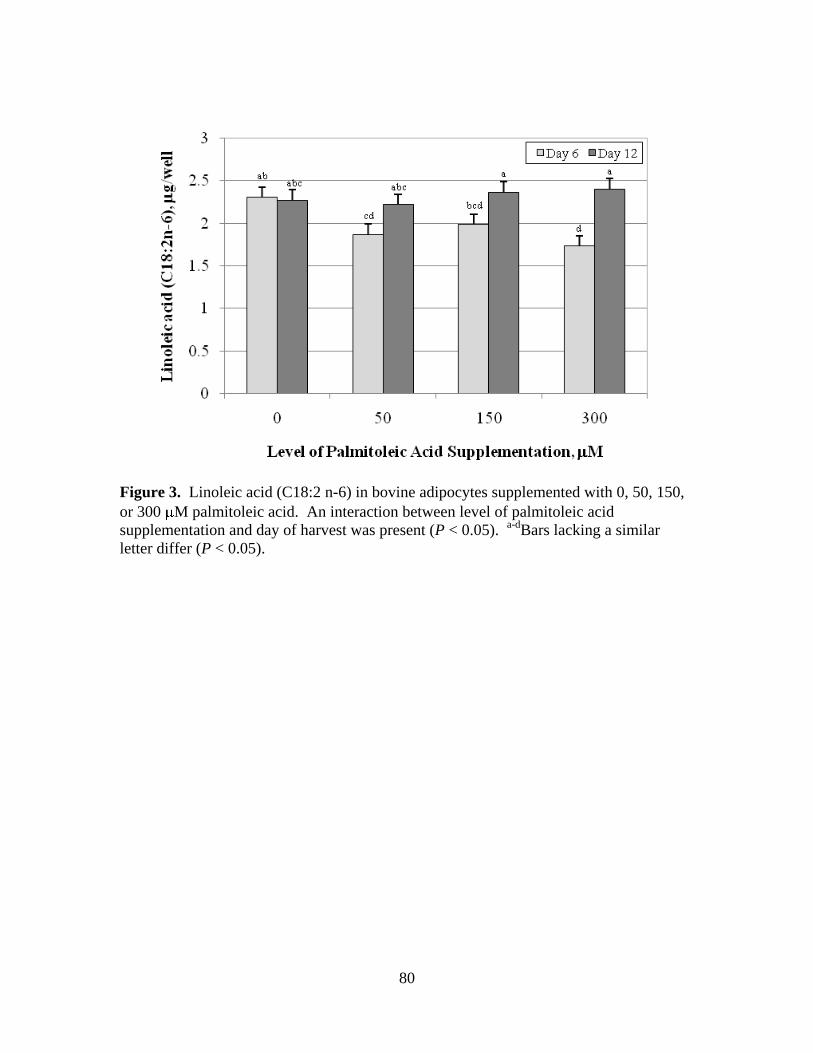
80
Figure 3. Linoleic acid (C18:2 n-6) in bovine adipocytes supplemented with 0, 50, 150,
or 300 M palmitoleic acid. An interaction between level of palmitoleic acid
supplementation and day of harvest was present (P < 0.05). a-d
Bars lacking a similar
letter differ (P < 0.05).

81
Table 1. Main effect of level of palmitoleic acid supplementation on palmitic (C16:0),
stearic (C18:0), oleic (C18:1 cis-9) acids, and desaturation index (C18:1 cis-9/C18:0) of
bovine adipocytes.
0 M 50 M 150 M 300 M SEM p -value*
C16:0 14.83 12.79 16.13 13.24 1.52 0.433
C18:0 15.41a
11.20b
13.45ab
10.84b
1.10 0.023
C18:1 cis- 9 15.35a
9.42b
11.02b
7.34b
1.37 0.002
C20:4 6.57a
5.27b
5.10b
5.22b
0.19 < 0.001
C18:1 cis- 9/C18:0 1.01a
0.84b
0.78bc
0.68c
0.04 < 0.001
a-f Within a row, means without a common superscript differ (P < 0.05)
* Probability of type I error with null hypothesis of all treatment means being equal.
Fatty acid,
g/well
Level of Palmitoleic Acid Supplementation
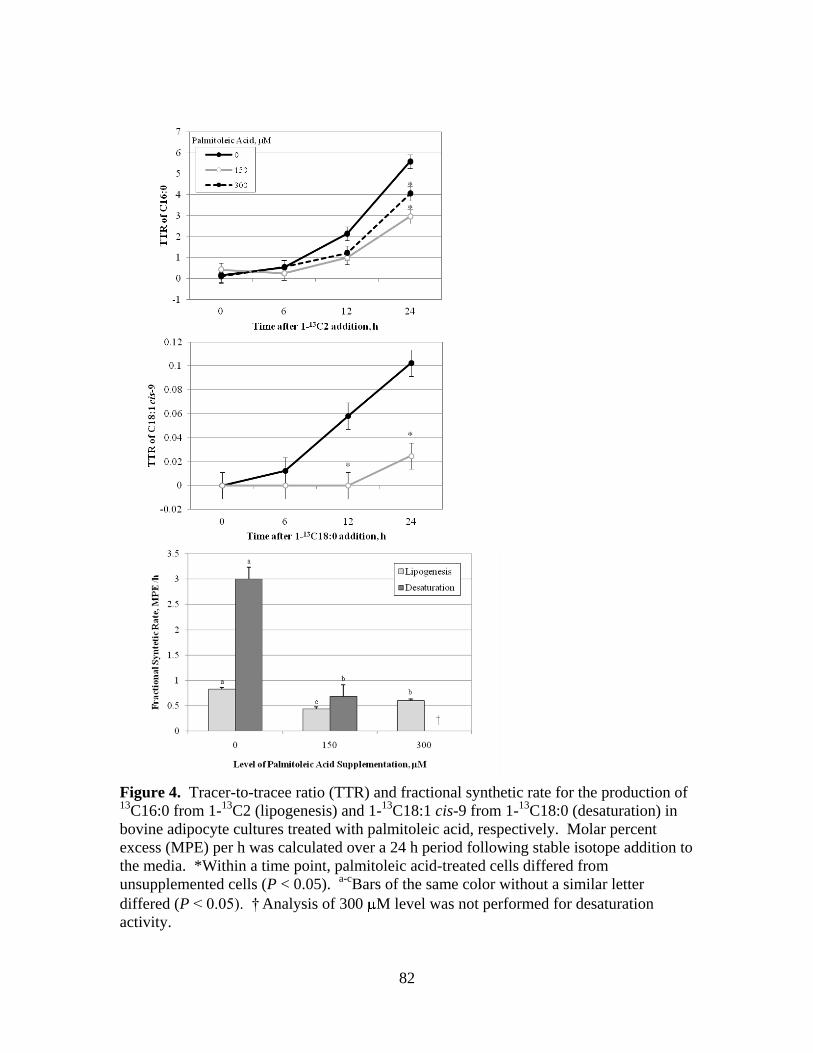
82
Figure 4. Tracer-to-tracee ratio (TTR) and fractional synthetic rate for the production of 13
C16:0 from 1-13
C2 (lipogenesis) and 1-13
C18:1 cis-9 from 1-13
C18:0 (desaturation) in
bovine adipocyte cultures treated with palmitoleic acid, respectively. Molar percent
excess (MPE) per h was calculated over a 24 h period following stable isotope addition to
the media. *Within a time point, palmitoleic acid-treated cells differed from
unsupplemented cells (P < 0.05). a-c
Bars of the same color without a similar letter
differed (P < 0.05). † Analysis of 300 M level was not performed for desaturation
activity.
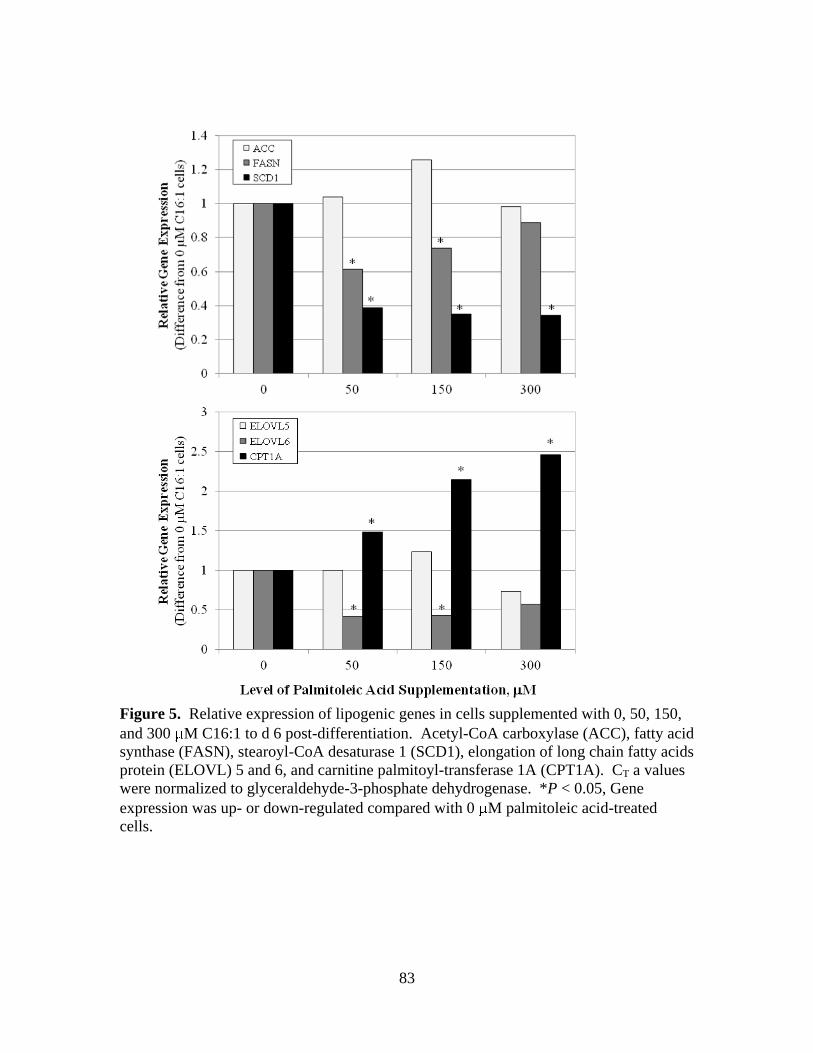
83
Figure 5. Relative expression of lipogenic genes in cells supplemented with 0, 50, 150,
and 300 M C16:1 to d 6 post-differentiation. Acetyl-CoA carboxylase (ACC), fatty acid
synthase (FASN), stearoyl-CoA desaturase 1 (SCD1), elongation of long chain fatty acids
protein (ELOVL) 5 and 6, and carnitine palmitoyl-transferase 1A (CPT1A). CT a values
were normalized to glyceraldehyde-3-phosphate dehydrogenase. *P < 0.05, Gene
expression was up- or down-regulated compared with 0 M palmitoleic acid-treated
cells.
84
LITERATURE CITED
Archibeque, S. L., D. K. Lunt, C. D. Gilbert, R. K. Tume, and S. B. Smith. 2005. Fatty
acid indices of stearoyl-CoA desaturase do not reflect actual stearoyl-CoA
desaturase enzyme activities in adipose tissues of beef steers finished with corn-,
flaxseed-, or sorghum-based diets. J. Anim. Sci. 83(5): 1153-1166.
Aso, H., H. Abe, I. Nakajima, K. Ozutsumi, T. Yamaguchi, Y. Takamori et al. 1995. A
preadipocyte clonal line from bovine intramuscular adipose tissue: Nonexpression of
GLUT-4 protein during adipocyte differentiation. Biochem. Biophys. Res. Commun.
213(2): 369-375.
Baumgard, L. H., E. Matitashvili, B. A. Corl, D. A. Dwyer, and D. E. Bauman. 2002.
Trans-10, cis-12 conjugated linoleic acid decreases lipogenic rates and expression of
genes involved in milk lipid synthesis in dairy cows. J. Dairy Sci. 85(9): 2155-2163.
Brown, M. S., and J. L. Goldstein. 1997. The SREBP pathway: Regulation of cholesterol
metabolism by proteolysis of a membrane-bound transcription factor. Cell. 89(3):
331-340.
Cao, H., K. Gerhold, J. R. Mayers, M. M. Wiest, S. M. Watkins, and G. S. Hotamisligil.
2008. Identification of a lipokine, a lipid hormone linking adipose tissue to systemic
metabolism. Cell. 134(6): 933-944.
Duckett, S. K., J. G. Andrae, and F. N. Owens. 2002. Effect of high-oil corn or added
corn oil on ruminal biohydrogenation of fatty acids and conjugated linoleic acid
formation in beef steers fed finishing diets. J. Anim. Sci. 80(12): 3353-3360.
Duckett, S. K., S. L. Pratt, and E. Pavan. 2009. Corn oil or corn grain supplementation to
steers grazing endophyte-free tall fescue. II. effects on subcutaneous fatty acid
content and lipogenic gene expression. J. Anim. Sci. 87(3): 1120-1128.
Eberlé, D., B. Hegarty, P. Bossard, P. Ferré, and F. Foufelle. 2004. SREBP transcription
factors: Master regulators of lipid homeostasis. Biochimie. 86(11): 839-848.
Enoch, H. G., A. Catalá, and P. Strittmatter. 1976. Mechanism of rat liver microsomal
stearyl-CoA desaturase. studies of the substrate specificity, enzyme-substrate
interactions, and the function of lipid. J. Biol. Chem. 251(16): 5095-5103.
Flier, J. S. 1998. What's in a name? In search of leptin's physiologic role. J. Clin.
Endocrinol. Metab. 83(5): 1407-1413.
85
Folch, J., M. Lees, and G. H. S. Stanley. 1957. A simple method for the isolation and
purification of total lipides from animal tissues. J. Biol. Chem. 226(1): 497-509.
Gong, J., H. Campos, S. McGarvey, Z. Wu, R. Goldberg, and A. Baylin. 2010. Adipose
tissue palmitoleic acid and obesity in humans: Does it behave as a lipokine? Am. J.
Clin. Nutr. 93(1):186-91.
Grant, A. C., G. Ortiz-Colon, M. E. Doumit, and D. D. Buskirk. 2008a. Optimization of
in vitro conditions for bovine subcutaneous and intramuscular preadipocyte
differentiation. J. Anim. Sci. 86(1): 73-82.
Grant, A. C., G. Ortiz-Colon, M. E. Doumit, R. J. Tempelman, and D. D. Buskirk. 2008b.
Differentiation of bovine intramuscular and subcutaneous stromal-vascular cells
exposed to dexamethasone and troglitazone. J. Anim. Sci. 86(10): 2531-2538.
Guillou, H., D. Zadravec, P. G. P. Martin, and A. Jacobsson. 2010. The key roles of
elongases and desaturases in mammalian fatty acid metabolism: Insights from
transgenic mice. Prog. Lipid Res. 49(2): 186-199.
Hirai, S., H. Matsumoto, N. Hino, H. Kawachi, T. Matsui, and H. Yano. 2007. Myostatin
inhibits differentiation of bovine preadipocyte. Domest. Anim. Endocrinol. 32(1): 1-
14.
Keating, A. F., J. J. Kennelly, and F. Zhao. 2006. Characterization and regulation of the
bovine stearoyl-CoA desaturase gene promoter. Biochem. Biophys. Res. Commun.
344(1): 233-240.
Lay, S. L., I. Lefrère, C. Trautwein, I. Dugail, and S. Krief. 2002. Insulin and sterol-
regulatory element-binding protein-1c (SREBP-1C) regulation of gene expression in
3T3-L1 adipocytes. J. Biol. Chem. 277(38): 35625-35634.
Lengi, A. J., and B. A. Corl. 2010. Factors influencing the differentiation of bovine
preadipocytes in vitro. J. Anim. Sci. 88(6): 1999-2008.
Leonard, A. E., S. L. Pereira, H. Sprecher, and Y. Huang. 2004. Elongation of long-chain
fatty acids. Prog. Lipid Res. 43(1): 36-54.
MacDougald, O. A., and C. F. Burant. 2007. The rapidly expanding family of adipokines.
Cell Metabolism. 6(3): 159-161.
Matsuzaka, T., and H. Shimano. 2009. Elovl6: A new player in fatty acid metabolism and
insulin sensitivity. J. Mol. Med. 87(4): 379-384.
86
Matsuzaka, T., H. Shimano, N. Yahagi, T. Kato, A. Atsumi, T. Yamamoto et al. 2007.
Crucial role of a long-chain fatty acid elongase, Elovl6, in obesity-induced insulin
resistance. Nat. Med. 13(10): 1193-1202.
Matsuzaka, T., H. Shimano, N. Yahagi, T. Yoshikawa, M. Amemiya-Kudo, A. H. Hasty
et al. 2002. Cloning and characterization of a mammalian fatty acyl-CoA elongase as
a lipogenic enzyme regulated by SREBPs. J. Lipid Res. 43(6): 911-920.
McGarry, J. D., and N. F. Brown. 1997. The mitochondrial carnitine palmitoyltransferase
system: From concept to molecular analysis. Euro. J. Biochem. 244(1): 1-14.
McGillis, J. P. 2005. White adipose tissue, inert no more! Endocrinology. 146(5): 2154-
2156.
Mosley, E., and M. McGuire. 2007. Methodology for the in vivo measurement of the Δ9-
desaturation of myristic, palmitic, and stearic acids in lactating dairy cattle. Lipids.
42(10): 939-945.
Napolitano, L. 1963. The differentiation of white adipose cells: An electron microsope
study. J. Cell Bio. 18: 663-679.
Ntambi, J. M. 1995. The regulation of stearoyl-CoA desaturase (SCD). Prog. Lipid Res.
34(2): 139-150.
Ntambi, J. M., and M. Miyazaki. 2004. Regulation of stearoyl-CoA desaturases and role
in metabolism. Prog. Lipid Res. 43(2): 91-104.
Okada, T., N. Furuhashi, Y. Kuromori, M. Miyashita, F. Iwata, and K. Harada. 2005.
Plasma palmitoleic acid content and obesity in children. Am. J. Clin. Nutr. 82(4):
747-750.
Park, P. W., and R. E. Goins. 1994. In situ preparation of FAME for analysis of fattyacid
composition in foods. J. Food Sci. 59: 1262-1266.
Pfaffl, M. W., G. W. Horgan, and L. Dempfle. 2002. Relative expression software tool
(REST©) for group-wise comparison and statistical analysis of relative expression
results in real-time PCR. Nuc. Acids Res. 30(9): e36-e36.
Pratt, S. L., T. A. Burns, E. Curry, and S. K. Duckett. 2010a. Expression of microRNA
during bovine adipogenesis. J. Nuc. Acids Invest. 1(e12): 62-70.
87
Price, N. T., V. N. Jackson, F. R. van der Leij, J. M. Cameron, M. T. Travers, B. Bartelds
et al. 2003. Cloning and expression of the liver and muscle isoforms of ovine
carnitine palmitoyltransferase 1: Residues within the N-terminus of the muscle
isoform influence the kinetic properties of the enzyme. Biochem. J. 372(Pt 3): 871–
879.
Smith, S. B., and J. D. Crouse. 1984. Relative contributions of acetate, lactate and
glucose to lipogenesis in bovine intramuscular and subcutaneous adipose tissue. J.
Nutr. 114(4): 792-800.
Stefan, N., K. Kantartzis, N. Celebi, H. Staiger, J. Machann, F. Schick et al. 2010.
Circulating palmitoleate strongly and independently predicts insulin sensitivity in
humans. Diabetes Care. 33(2): 405-407.
Taniguchi, M., L. L. Guan, B. Zhang, M. V. Dodson, E. Okine, and S. S. Moore. 2008.
Adipogenesis of bovine perimuscular preadipocytes. Biochem. Biophys. Res.
Commun. 366(1): 54-59.
Van Harken, D. R., C. W. Dixon, and M. Heimberg. 1969. Hepatic lipid metabolism in
experimental diabetes. J. Biol. Chem. 244(9): 2278-2285.
Vernon, R. G. 1980. Lipid metabolism in the adipose tissue of ruminant animals. Prog.
Lipid Res. 19(1-2): 23-106.
Wang, Y., D. Botolin, J. Xu, B. Christian, E. Mitchell, B. Jayaprakasam et al. 2006.
Regulation of hepatic fatty acid elongase and desaturase expression in diabetes and
obesity. J. Lipid Res. 47(9): 2028-2041.
Wolfe, R. R., and D. L. Chinkes. 2005. Mass Isotopomer Distribution Analysis. Pages
203-213 in Isotope Tracers in Metabolic Research: Principles and Practice of Kinetic
Analysis. Second ed. Wiley-Liss, Hoboken, NJ.
Zimin, A. V., A. L. Delcher, L. Florea, D. R. Kelley, M. C. Schatz, D. Puiu et al. 2009. A
whole-genome assembly of the domestic cow, Bos taurus. Genome Biology. 10(4):
R42.1-R42.10.
88
CHAPTER 4: PALMITOLEIC (C16:1 cis-9) AND CIS-
VACCENIC ACID (C18:1 cis-11) ALTER LIPOGENESIS IN
BOVINE ADIPOCYTE CULTURES
ABSTRACT
Our objectives were to confirm elongation products palmitoleic acid (C16:1 cis-9)
and determine if palmitoleic acid or its elongation products or both are responsible for
decreased desaturation and lipogenesis rates previously observed in cultured bovine
adipocytes supplemented with palmitoleic acid. Stromal vascular cells were isolated
from 3 cattle, propagated, and frozen for use in this study. Cells were passaged 4 times,
allowed to reach confluence, held for 2 d, and then differentiated with a standard
hormone cocktail (d 0). At d 2, secondary differentiation media containing 1 of 4 levels
of fatty acid [0 μM fatty acid (control), or 150 μM palmitic (C16:0), palmitoleic, or cis-
vaccenic (C18:1 cis-11)] for 4 d. On d 6, cells were harvested for fatty acid analysis. In
addition, cells were incubated with 13
C16:1, 13
C2, or 13
C18:0 on d 6 to estimate
lipogenesis and desaturation rates and confirm elongation products of palmitoleic acid
using gas chromatography-mass spectrometry. Incorporation of 13
C16:1 into cells and
presence of 13
C label in C18:1 cis-11 confirmed it as an elongation product of palmitoleic
acid in bovine adipocytes. Additionally, 13
C label was seen in C20:1 cis-13 and CLA cis-
9, cis-11. The rate of 13
C16:1 elongation to 13
C18:1 cis-11 was greater (P < 0.01) in
control cells compared with cell supplemented with palmitoleic acid prior to d 6. In
addition, the elongation rate of control cells increased (P 0.05) over 36 h; whereas,
elongation in palmitoleic acid-treated cells remained constant over the 36 h period. In
89
palmitoleic acid-supplemented cells, C16:1, C18:1 cis-11, and C20:1 cis-13 were
elevated (P < 0.05) compared with control cells. In cis-vaccenic acid-supplemented cells,
C18:1 cis-11 and C20:1 cis-13 were elevated (P < 0.05) compared with controls, but
C16:1 was not. Synthesis of 13
C16:0 from 13
C2 was reduced (P < 0.05) in palmitoleic
acid and cis-vaccenic acid-treated compared with control cells following 36 h incubation.
The C18:1 cis-9/C18:0 ratio was decreased (P < 0.05) in palmitoleic acid-treated cells
compared with all other treatments. By 12 h of 13
C18:0 incubation, cells supplemented
with palmitoleic acid had reduced (P < 0.05) 13
C18:1 cis-9 compared with all other
treatments. Therefore, palmitoleic acid is actively elongated in vitro and its elongation
product, cis-vaccenic acid, can also reduce lipogenesis. However, inhibition of
desaturation previously reported by our lab can be directly attributed to palmitoleic acid
and not its elongation products, C18:1 cis-11 or, by extension, C20:1 cis-13.
90
INTRODUCTION
Excess adipose tissue can be detrimental to human health with regard to common
medical disorders associated with obesity. In addition, excess adipose tissue
accumulation in livestock animals is costly to producers as wasted feed resources and
discounts or loss of premiums for carcass cutability. As components of both human and
livestock diets, fatty acids have become a recent focus in energy metabolism research. In
the public eye, interest in fatty acid composition of meat and milk products has increased
in recent years with rising concerns of saturated fatty acids (SFA) in the human diet.
Generally perceived, SFA are bad for human health; whereas, monounsaturated fatty
acids (MUFA) and polyunsaturated fatty acids (PUFA) are beneficial.
White adipose tissue is not longer considered an inert energy storage site, but a
complex, metabolically active tissue (McGillis, 2005). The functional unit of white
adipose tissue, the adipocyte, synthesizes and stores fatty acids and secretes hormones.
Hormones produced by adipocytes include leptin (Flier, 1998), adipokines (MacDougald
and Burant, 2007), and a newly, proposed class of hormone, “lipokine”, in which fatty
acids can act as signals to other body tissues (Cao et al., 2008). Whether as a component
of human or livestock diets, palmitoleic acid may act to regulate metabolism. A
lipidomic study by Cao et al. (2008) identified palmitoleic acid (C16:1 cis-9) as another
fatty acid that may act a hormone. They reported palmitoleic acid functioned as a
lipokine which increased insulin sensitivity in skeletal muscle and decreased lipogenesis
in liver of mice. In contrast to murine animals, cattle synthesize fatty acids de novo from
acetate, predominately in adipose tissue (Vernon, 1980; Smith and Crouse, 1984).
91
Similarly, we found palmitoleic acid functioned to reduce de novo fatty acid synthesis
and reduce lipogenic gene expression in cultured bovine adipocytes (Burns et al., 2010).
Supplementing bovine adipocyte cultures with palmitoleic acid resulted increased C16:1,
cis-vaccenic (C18:1 cis-11) and eicosenoic acid (C20:1 cis-13). We hypothesize that
C18:1 cis-11 and C20:1 cis-13 are being elongated from palmitoleic acid and could be
responsible for the lipokine effects seen with palmitoleic acid supplementation in bovine
adipocytes. Therefore, the objectives of this study were to trace palmitoleic acid
elongation in bovine adipocytes and test lipogenesis and desaturation effects of C18:1
cis-11.
92
MATERIALS AND METHODS
Cell Culture. Primary bovine stromal vascular (SV) cultures were harvested from
adipose tissue of 18 mo old Angus crossbred cattle as described by Pratt et al. (2010)
using slight modifications of methods described by Hirai et al. (2007). Cells were plated
at 1 x 10⁴ cells/cm
2 and passaged every 2 to 4 d when 60% confluent. Cells were
incubated at 37°C under 5% CO2 humidified atmosphere with media [Dulbecco‟s
modified eagles medium (DMEM) containing 10% fetal calf serum (FCS), and 2X
antibiotic/antimycotic (AB/AM; containing 10,000 U/mL penicillin G, 10,000 g/mL
streptomycin, and 25 g/mL amphotericin B)] replacement every 2 d. After 4 passages,
cell lines were stored in liquid nitrogen at 1 x 10⁶ cells/mL in freezing media (DMEM,
20% FCS, and 10% dimethyl sulfoxide) for later use.
Treatments. Individual cultures from 2 animals were used in duplicate for each
of these 2 experiments. Cells were thawed, passaged 3 times, and seeded in plates at 1 x
105 cells/cm
2. Cells were allowed to reach confluence, held for 2 d, and differentiated on
d 0 with DMEM containing 5% FCS, 2X AB/AM, 2.5 g/ml insulin, 0.5 mM 2-isobutyl-
1-methylaxanthine (IBMX), 0.25 M dexamethasone (DEX), 5 M troglitazone (TRO),
and 10 mM acetate (Hirai et al., 2007; Pratt et al., 2010). Secondary differentiation
media (DMEM, 5% FCS, 2X AB/AM, 2.5 g/mL insulin, 5 M TRO, and 10 mM
acetate) was applied for 4 (d 6) along with 0 M additional fatty acids (control) or 150
M fatty acids. According to the objectives of the experiment, cells were either
harvested on d 6 for fatty acid composition and lipogenic gene expression or treated with
93
stable isotopes on d 6 for enzymatic activity assays. Previously, our stromal vascular
cultures displayed characteristic changes in morphology, lipid-filling, and adipogenic
gene expression upon hormonal treatment, consistent with adipocyte differentiation by d
6 (Pratt et al., 2010).
Experiment 1. Previously, our palmitoleic acid-treated cultures showed a
dramatic increase in C18:1 cis-11 and C20:1 cis-13. It has been proposed that
palmitoleic acid can be elongated into C18:1 cis-11 and potentially elongated further into
a 20C fatty acid (Matsuzaka and Shimano, 2009). To confirm C18:1 cis-11 and C20:1
cis-13 as elongation products and to measure elongation in vitro, we added stable isotope
labeled palmitoleic acid (150 M U-13
C16:1) on d 6 for 0, 6, 12, 24, and 36 h to
adipocytes cultures which had been treated until d 6 with 0 (control) or 150
palmitoleic acid. At harvest, cells were washed 3 times with PBS, removed with trypsin,
and placed directly into 2:1 chloroform:methanol (vol/vol) to terminate all enzymatic
activity. Cellular fatty acids were extracted using Folch et al. (1957) and transmethylated
according to Park and Goins (1994). Fatty acid methyl esters were analyzed using an
Agilent 6890N gas chromatograph (GC; Agilent Technologies, Inc., Santa Clara, CA)
equipped with an Agilent 5973 mass spectrometer (MS) using a 100-m Varian CP7489
(Varian Instruments Inc., Walnut Creek, CA) capillary column (0.25 mm i.d. and 0.20
μm film thickness). Samples were run in the chemical ionization mode with He as the
carrier gas and CH4 as the reagent gas.
Ions of mass-to-charge ratio (m/z) 268 (m) and 284 (m + 16) were selectively
measured to calculate the isotopic enrichments of C16:1. Similarly, ion abundance of
94
298 (m) and 312 (m + 16) were measured for C18:1 cis-11. We calculated the relative
abundance (RA) of labeled (m + 16) to unlabeled (m) isotopomers of C16:1 and C18:1
cis-11. Fatty acid enrichment was calculated as tracer-to-tracee ratio (TTR), according to
Wolfe and Chinkes (2005).
TTRsample = (RAsample – RAblank)
Samples that were not exposed to labeled isotope served as „blanks‟. Molar percent
excess (MPE) of C16:1 was calculated by TTR/(TTR + 1) and fractional synthetic rate
(FSR) of elongation was calculated from TTRC18:1cis11 and MPEC16:1.
FSRelongation = TTRC18:1 cis-11, time1 – TTR C18:1 cis-11, time0
MPEC16:1 × (time1 – time0)
Experiment 2. The objective of this experiment was to determine if palmitoleic
acid or an elongation product was responsible for changes in lipogenesis. Therefore, we
treated adipocytes cultures with 0 M fatty acids (control) or 150 M palmitic (C16:0),
palmitoleic, or cis-vaccenic acids on d 2 to d 6. Fatty acid methyl esters (FAME) were
prepared from cultures on d 6 as stated above for analysis with an Agilent 6850 GC
equipped with an Agilent 7673A automatic sampler. Separations were accomplished
using a 100-m Supelco SP-2560 (Supelco, Inc., Bellefonte, PA) capillary column (0.25
mm i.d. and 0.20 m film thickness) according to Duckett et al. (2002). Individual fatty
acids were identified by comparison of retention times with standards (Sigma, St. Louis,
MO; Matreya, Pleasant Gap, PA). Fatty acids were quantified by incorporating an
internal standard, methyl tricosanoic (C23:0) acid, into each sample during methylation
and expressed as a weight percentage of total fatty acids per well.
95
Lipogenesis. To measure lipogenesis in vitro, we substituted unlabeled acetate in
the culture media on d 6 with stable isotope labeled acetate (10 mM 1-13
C2) to cultures
treated with 0 M fatty acids (control) or 150 M palmitoleic or cis-vaccenic acid for 0,
12, 24, and 36 h. Cells were harvested and FAME prepared as described above. Ions of
mass-to-charge ratio (m/z) 270 (m), 271 (m + 1), and 272 (m + 2) were selectively
measured to calculate the isotopic enrichments of C16:0, the primary product of de novo
lipogenesis.
The formation of a fatty acid polymer, C16:0, from repeating units of acetate is an
ideal application of Mass Isotopomer Distribution Analysis (MIDA; Wolfe and Chinkes,
2005). Therefore, we used this approach to estimate enrichment in our precursor pool
and calculate FSR of lipogenesis. First, we calculated RA of singly (m + 1) and doubly
(m + 2) labeled C16:0 to unlabeled (m) C16:0 isotopomers. To account for background
noise and natural abundance of 13
C isotope when using a singly-labeled tracer, the
enrichment of C16:0 was calculated as TTRC16:0 = (RAsample – RAblank) * (1 – A)n , where
A was the natural abundance of 13
C, A = 0.011, and n was the number of C in the fatty
acid molecule, n = 16 (Wolfe and Chinkes, 2005). Samples that were not exposed to
labeled isotope served as „blanks‟. Precursor enrichment in molar percent excess (MPE)
was estimated by:
MPEprecursor = 2 × (TTR(m + 2) / TTR(m + 1))
(p – 1) + (2 × (TTR(m + 2) / TTR(m + 1))
where, p is the number of precursor monomers present in the polymer, p = 8. Finally, our
estimate of lipogenesis could be derived by calculating FSR (Wolfe and Chinkes, 2005).
96
FSRlipogenesis = TTRC16:0, time1 – TTRC16:0, time0
(p × MPEprecursor) (1 - MPEprecursor)p-1
(time1 – time0)
Desaturation. Stearoyl-CoA desaturase 1 (SCD1) is the enzyme responsible for
creating a double bond at the 9 position of several fatty-acyl CoA and its preferred
substrates are C16:0 and C18:0 (Enoch et al., 1976). Its transcription and activity can
regulated by certain fatty acids (Ntambi, 1995), including palmitoleic acid (Burns et al.,
2010). In order to measure desaturation rates in vitro, we added 100 M U-13
C18:0 to
cultures treated with 0 M fatty acid (control) or 150 M palmitic, palmitoleic, or cis-
vaccenic acid on d 6 for 0, 12, and 24 h. Samples were prepared and analyzed as
described above for analysis with GC-MS. Ions of mass-to-charge ratio (m/z) 298 (m)
and 316 (m + 18) were selectively measured to calculate the isotopic enrichments of
C18:0. Similarly, isotope abundance of 296 (m) and 314 (m + 18) was measured for
C18:1 cis-9. Since tracer enrichment can be measured in this case and the product of the
SCD reaction is not a polymer of the tracer, it was not necessary to use MIDA. The FSR
was calculated for rate of desaturation using the precursor enrichment, MPEC18:0.
FSRdesaturation = TTRC18:1 cis-9, time1 – TTR C18:1 cis-9, time0
MPEC18:0 × (time1 – time0)
Gene Expression. Total cellular RNA was isolated from cells using the mirVana
microRNA Isolation kit (Ambion, Austin, TX) according to manufacturer‟s instructions
and RNA quality as described by Duckett et al. (2009). Quality was assessed using
Nanodrop 2000 Spectrophotometer (Thermo Fisher Scientific, Inc., Waltham, MA) and
Agilent Bioanalyzer 2100. All tcRNA samples used in real-time PCR had a 260:280
97
absorbance ratio > 1.9 on the Nanodrop and RNA integrity number > 9.0 (1.0 to 10.0
scale) using Agilent RNA 6000 Nano kit. Superscript III reverse transcriptase
(Invitrogen Corp., Carlsbad, CA) was used to synthesize first strand cDNA. Real-time
PCR was conducted using an Eppendorf MasterCycler ep realplex (Westbury, NY) with
the QuantiTect SYBR Green RT-PCR Two Step Kit (Qiagen, Valencia, CA) according to
the manufacturer‟s directions. Two genes, glyceraldehyde-3-phosphate dehydrogenase
(GAPDH) and β-actin, were evaluated as housekeeping genes for data normalization
(Duckett et al., 2009). To determine the appropriate housekeeping gene to be used to
normalize the data, the cycle threshold values (CT) for GAPDH, β-actin, and all target
genes per sample were entered into the BESTKEEPER program (http://www.gene-
quantification.info). The program determines the most stable housekeeping gene to be
used for normalization by repeated pair-wise correlation and regression analysis (Pfaffl et
al., 2002). Both GAPDH and β-actin exhibited a correlation coefficient of 0.99 (P <
0.001) in the analysis and were suitable for data normalization. Primers for bovine
mRNAs were designed using Primer 3 software (http://frodo.wi.mit.edu/primer3/).
Primer sets were first evaluated according to Duckett et al. (2009) to verify identity.
Genes of interest for this study were those involved in fatty acid biosynthesis including
acetyl-CoA carboxylase (ACC), fatty acid synthase (FASN), fatty acid elongase
(ELOVL) -5 and -6, SCD1, sterol regulatory element binding protein-1c (SREBP), and
carnitine palmitoyl-transferase 1A (CPT1A).
Statistical Analysis. The data were analyzed using Proc GLM procedure of SAS
9.2 (SAS Institute Inc., Cary, NC) for treatment comparisons over time. A two-way
98
analysis of variance (ANOVA) was performed as a completely randomized design with
factors fatty acid (control, palmitic, palmitoleic, and cis-vaccenic), time (0, 12, 24, and 36
h), and two-way interaction. Least squares means were computed and separated
statistically using Fisher‟s Protected LSD test. Relative gene expression data was
analyzed using Pair-wise Fixed Reallocation Randomization Test (Pfaffl et al., 2002)
with preplanned treatment comparisons.
99
RESULTS AND DISCUSSION
Experiment 1. Incubating bovine adipocytes with U-13
C16:1 resulted in
enrichment (P < 0.001) of C16:1 and C18:1 cis-11 fatty acids over time. Tracer-to-tracee
ratio of C16:1 was greater than zero (P < 0.01) 6 h after U-13
C16:1 addition to the media
and remained elevated (P < 0.01) to 36 h (Figure 1). Enrichment of C18:1 cis-11 as TTR
was also greater than zero (P < 0.05) by 6 h and continued to increase (P < 0.01) above 6
h levels at 24 and 36 h. The presence of tracer definitively shows that C16:1 is taken in
by bovine adipocytes and elongated to C18:1 cis-11 in palmitoleic acid-supplemented
cells. When adipocytes were exposed to unlabeled palmitoleic acid from d 2 to d 6 and
U-13
C16:1 on d 6, the FSRelongation did not change (P > 0.05) over the 36 h period and was
lower (P < 0.01) throughout the period compared with control cells. The FSRelongation
increased (P < 0.05) over the 36 h period in control adipocytes, those cells which were
newly exposed to palmitoleic acid (Figure 1).
In addition to label appearing in C16:1 and C18:1 cis-11 fatty acids following
incubation with U-13
C16:1, enrichment was seen in C20:1 cis-13 and CLA cis-9, cis-11
(data not shown). Statistical analysis was not performed because fatty acid peaks for
C20:1 cis-13 and CLA cis-9, cis-11 were only detectable in a few samples. However,
when detectable, fatty acid peaks contained masses consistent with m + 16 enrichment
from U-13
C16:1. The formation of these fatty acids is possible through established fatty
acid pathways. Once palmitoleic acid is elongated to C18:1 cis-11, it can be further
elongated to C20:1 cis-13 or desaturated by SCD1 to CLA cis-9, cis-11.
100
Experiment 2. We successfully incorporated our fatty acid supplements into
bovine adipocyte cultures based on detection of increased levels (P < 0.01) of treatment
fatty acids in cells after all media was removed. Comparing fatty acid data between
control, palmitic, palmitoleic, and cis-vaccenic acid-treated cells, there was a main effect
of fatty acid treatment (P < 0.01) for total fatty acids (Table 1). Micrograms of total fatty
acids were greatest (P < 0.001) in palmitoleic and cis-vaccenic acid-treated cells at about
2X greater than control cells (Table 1). Palmitic acid-treated cells also had higher (P <
0.05) levels of total fatty acids compared with controls, but lower (P < 0.05) than
palmitoleic and cis-vaccenic acid-treated cells, despite being supplemented at the same
level. Reduced total fatty acids in palmitic acid-treated cells compared with MUFA-
treated cells is most likely due to an apoptitic effect of palmitic acid supplementation. In
murine adipocytes, palmitic acid induces apoptosis (Guo et al., 2007). Similarly, we
suspected that palmitic acid-supplementation in our bovine adipocyte cultures induced
apoptosis, resulting in reduced total lipid accumulation and treatment fatty acid inclusion
compared with MUFA-supplemented cells. To test this hypothesis, we treated
differentiated adipocytes with palmitic and palmitoleic acid to d 6 and assayed cell
viability using Cell Counting Kit-8 (Dojindo Molecular Technologies, Inc., Rockville,
MD) according to manufacturer‟s instructions. Relative cell viability was greater (P <
0.05) for palmitoleic acid-treated cells compared with palmitic acid-treated cells (data not
shown). Despite a reduction in cell viability, palmitic acid-treated cells had increased (P
< 0.05) levels of C16:0, C18:0, C18:1 cis-9, and C18:2n-6 compared with all other
treatment groups.
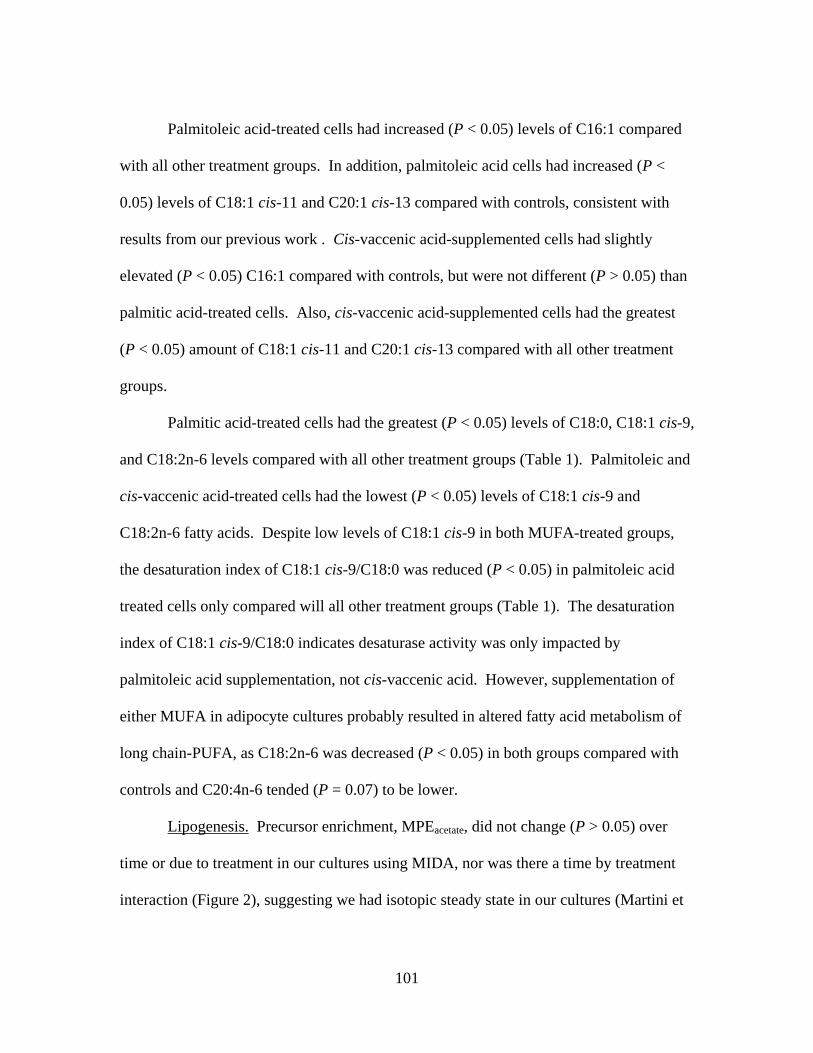
101
Palmitoleic acid-treated cells had increased (P < 0.05) levels of C16:1 compared
with all other treatment groups. In addition, palmitoleic acid cells had increased (P <
0.05) levels of C18:1 cis-11 and C20:1 cis-13 compared with controls, consistent with
results from our previous work . Cis-vaccenic acid-supplemented cells had slightly
elevated (P < 0.05) C16:1 compared with controls, but were not different (P > 0.05) than
palmitic acid-treated cells. Also, cis-vaccenic acid-supplemented cells had the greatest
(P < 0.05) amount of C18:1 cis-11 and C20:1 cis-13 compared with all other treatment
groups.
Palmitic acid-treated cells had the greatest (P < 0.05) levels of C18:0, C18:1 cis-9,
and C18:2n-6 levels compared with all other treatment groups (Table 1). Palmitoleic and
cis-vaccenic acid-treated cells had the lowest (P < 0.05) levels of C18:1 cis-9 and
C18:2n-6 fatty acids. Despite low levels of C18:1 cis-9 in both MUFA-treated groups,
the desaturation index of C18:1 cis-9/C18:0 was reduced (P < 0.05) in palmitoleic acid
treated cells only compared will all other treatment groups (Table 1). The desaturation
index of C18:1 cis-9/C18:0 indicates desaturase activity was only impacted by
palmitoleic acid supplementation, not cis-vaccenic acid. However, supplementation of
either MUFA in adipocyte cultures probably resulted in altered fatty acid metabolism of
long chain-PUFA, as C18:2n-6 was decreased (P < 0.05) in both groups compared with
controls and C20:4n-6 tended (P = 0.07) to be lower.
Lipogenesis. Precursor enrichment, MPEacetate, did not change (P > 0.05) over
time or due to treatment in our cultures using MIDA, nor was there a time by treatment
interaction (Figure 2), suggesting we had isotopic steady state in our cultures (Martini et
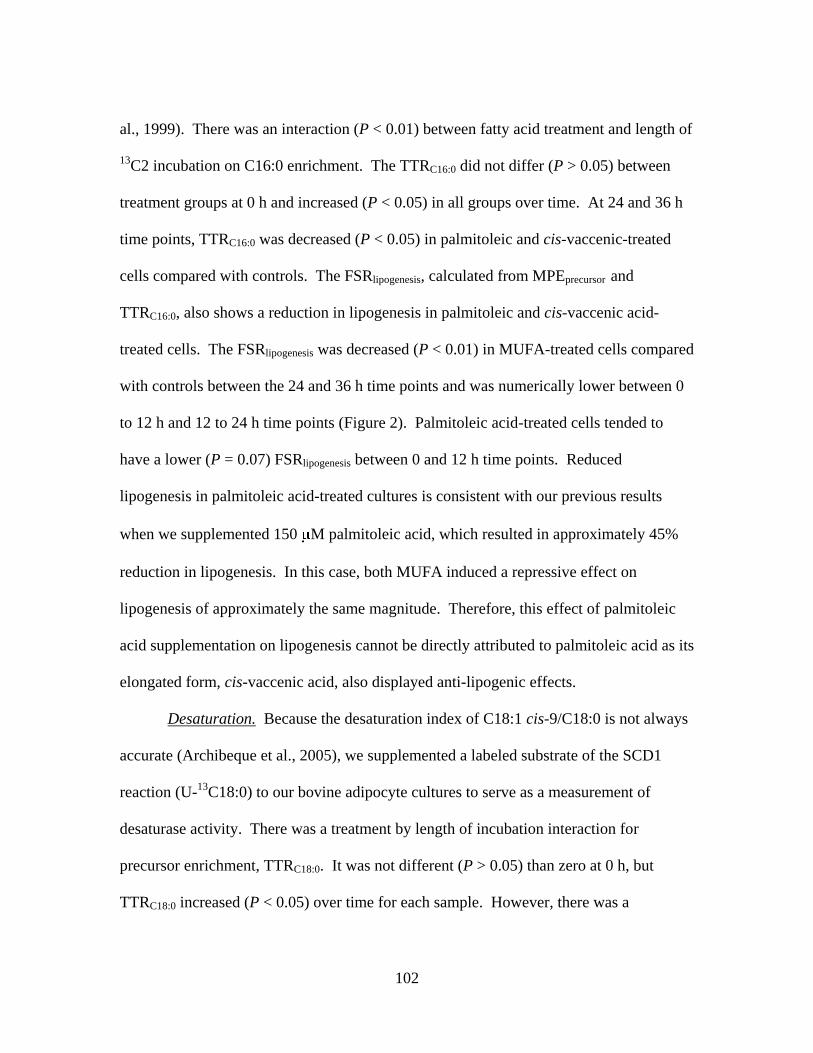
102
al., 1999). There was an interaction (P < 0.01) between fatty acid treatment and length of
13C2 incubation on C16:0 enrichment. The TTRC16:0 did not differ (P > 0.05) between
treatment groups at 0 h and increased (P < 0.05) in all groups over time. At 24 and 36 h
time points, TTRC16:0 was decreased (P < 0.05) in palmitoleic and cis-vaccenic-treated
cells compared with controls. The FSRlipogenesis, calculated from MPEprecursor and
TTRC16:0, also shows a reduction in lipogenesis in palmitoleic and cis-vaccenic acid-
treated cells. The FSRlipogenesis was decreased (P < 0.01) in MUFA-treated cells compared
with controls between the 24 and 36 h time points and was numerically lower between 0
to 12 h and 12 to 24 h time points (Figure 2). Palmitoleic acid-treated cells tended to
have a lower (P = 0.07) FSRlipogenesis between 0 and 12 h time points. Reduced
lipogenesis in palmitoleic acid-treated cultures is consistent with our previous results
when we supplemented 150 M palmitoleic acid, which resulted in approximately 45%
reduction in lipogenesis. In this case, both MUFA induced a repressive effect on
lipogenesis of approximately the same magnitude. Therefore, this effect of palmitoleic
acid supplementation on lipogenesis cannot be directly attributed to palmitoleic acid as its
elongated form, cis-vaccenic acid, also displayed anti-lipogenic effects.
Desaturation. Because the desaturation index of C18:1 cis-9/C18:0 is not always
accurate (Archibeque et al., 2005), we supplemented a labeled substrate of the SCD1
reaction (U-13
C18:0) to our bovine adipocyte cultures to serve as a measurement of
desaturase activity. There was a treatment by length of incubation interaction for
precursor enrichment, TTRC18:0. It was not different (P > 0.05) than zero at 0 h, but
TTRC18:0 increased (P < 0.05) over time for each sample. However, there was a
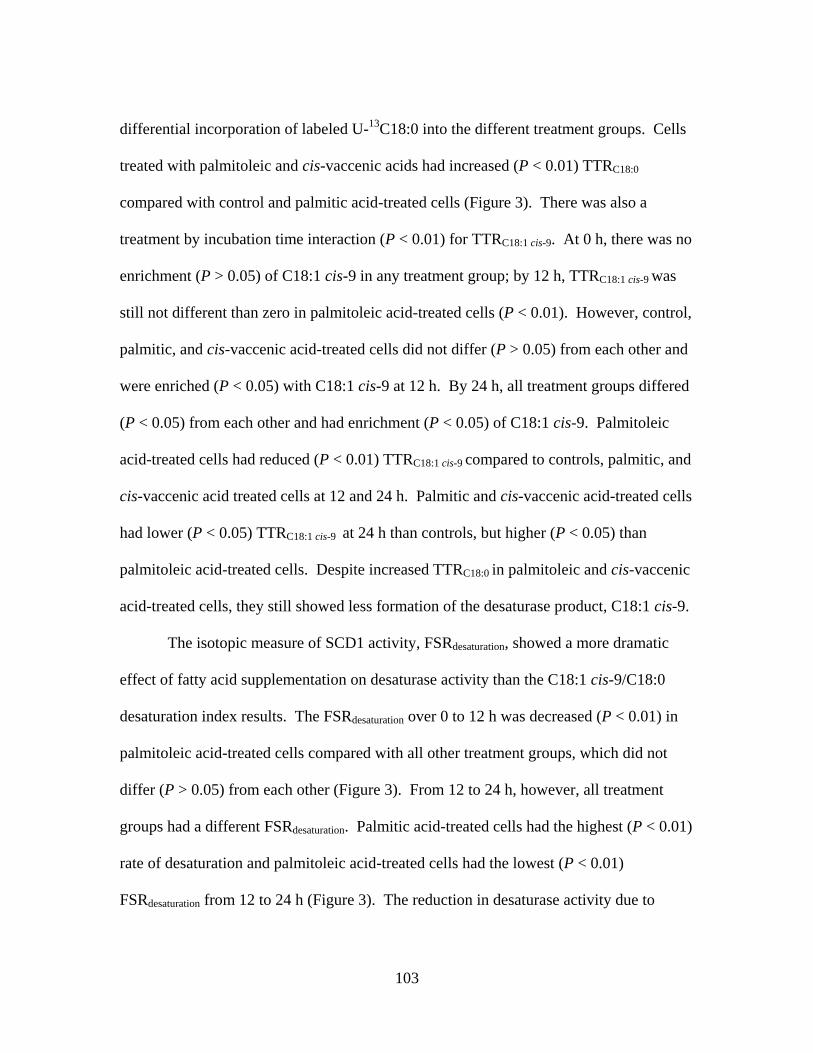
103
differential incorporation of labeled U-13
C18:0 into the different treatment groups. Cells
treated with palmitoleic and cis-vaccenic acids had increased (P < 0.01) TTRC18:0
compared with control and palmitic acid-treated cells (Figure 3). There was also a
treatment by incubation time interaction (P < 0.01) for TTRC18:1 cis-9. At 0 h, there was no
enrichment (P > 0.05) of C18:1 cis-9 in any treatment group; by 12 h, TTRC18:1 cis-9 was
still not different than zero in palmitoleic acid-treated cells (P < 0.01). However, control,
palmitic, and cis-vaccenic acid-treated cells did not differ (P > 0.05) from each other and
were enriched (P < 0.05) with C18:1 cis-9 at 12 h. By 24 h, all treatment groups differed
(P < 0.05) from each other and had enrichment (P < 0.05) of C18:1 cis-9. Palmitoleic
acid-treated cells had reduced (P < 0.01) TTRC18:1 cis-9 compared to controls, palmitic, and
cis-vaccenic acid treated cells at 12 and 24 h. Palmitic and cis-vaccenic acid-treated cells
had lower (P < 0.05) TTRC18:1 cis-9 at 24 h than controls, but higher (P < 0.05) than
palmitoleic acid-treated cells. Despite increased TTRC18:0 in palmitoleic and cis-vaccenic
acid-treated cells, they still showed less formation of the desaturase product, C18:1 cis-9.
The isotopic measure of SCD1 activity, FSRdesaturation, showed a more dramatic
effect of fatty acid supplementation on desaturase activity than the C18:1 cis-9/C18:0
desaturation index results. The FSRdesaturation over 0 to 12 h was decreased (P < 0.01) in
palmitoleic acid-treated cells compared with all other treatment groups, which did not
differ (P > 0.05) from each other (Figure 3). From 12 to 24 h, however, all treatment
groups had a different FSRdesaturation. Palmitic acid-treated cells had the highest (P < 0.01)
rate of desaturation and palmitoleic acid-treated cells had the lowest (P < 0.01)
FSRdesaturation from 12 to 24 h (Figure 3). The reduction in desaturase activity due to
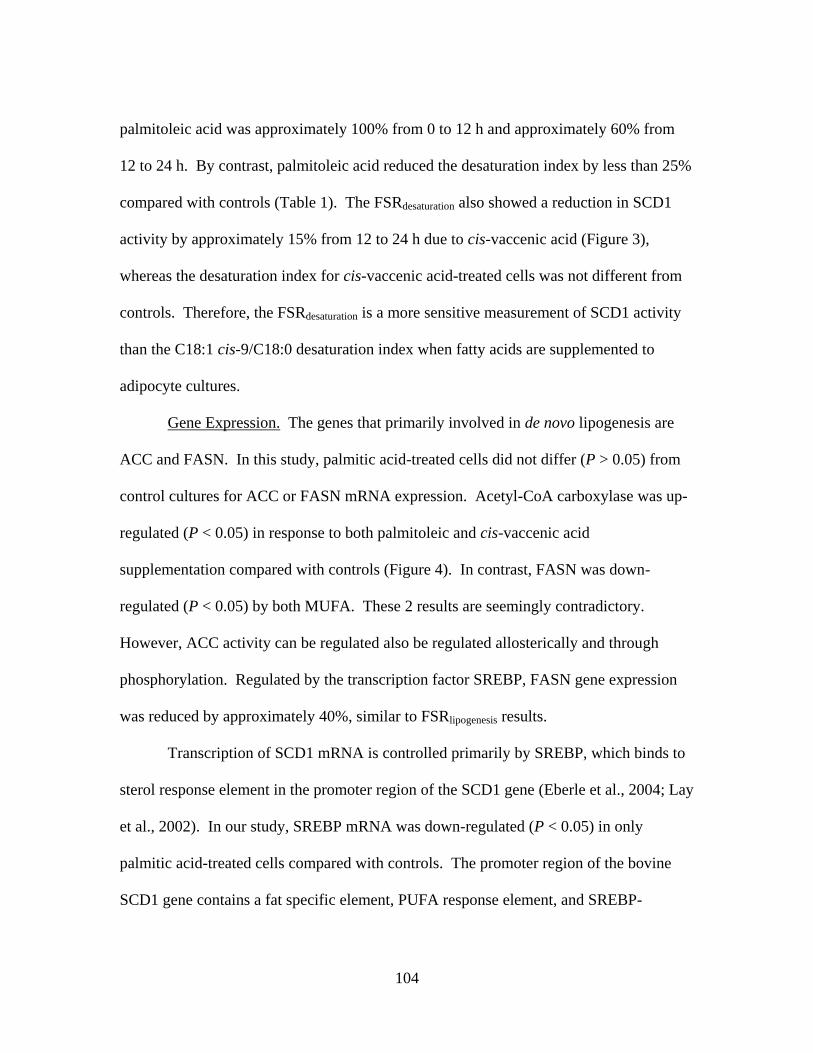
104
palmitoleic acid was approximately 100% from 0 to 12 h and approximately 60% from
12 to 24 h. By contrast, palmitoleic acid reduced the desaturation index by less than 25%
compared with controls (Table 1). The FSRdesaturation also showed a reduction in SCD1
activity by approximately 15% from 12 to 24 h due to cis-vaccenic acid (Figure 3),
whereas the desaturation index for cis-vaccenic acid-treated cells was not different from
controls. Therefore, the FSRdesaturation is a more sensitive measurement of SCD1 activity
than the C18:1 cis-9/C18:0 desaturation index when fatty acids are supplemented to
adipocyte cultures.
Gene Expression. The genes that primarily involved in de novo lipogenesis are
ACC and FASN. In this study, palmitic acid-treated cells did not differ (P > 0.05) from
control cultures for ACC or FASN mRNA expression. Acetyl-CoA carboxylase was up-
regulated (P < 0.05) in response to both palmitoleic and cis-vaccenic acid
supplementation compared with controls (Figure 4). In contrast, FASN was down-
regulated (P < 0.05) by both MUFA. These 2 results are seemingly contradictory.
However, ACC activity can be regulated also be regulated allosterically and through
phosphorylation. Regulated by the transcription factor SREBP, FASN gene expression
was reduced by approximately 40%, similar to FSRlipogenesis results.
Transcription of SCD1 mRNA is controlled primarily by SREBP, which binds to
sterol response element in the promoter region of the SCD1 gene (Eberle et al., 2004; Lay
et al., 2002). In our study, SREBP mRNA was down-regulated (P < 0.05) in only
palmitic acid-treated cells compared with controls. The promoter region of the bovine
SCD1 gene contains a fat specific element, PUFA response element, and SREBP-
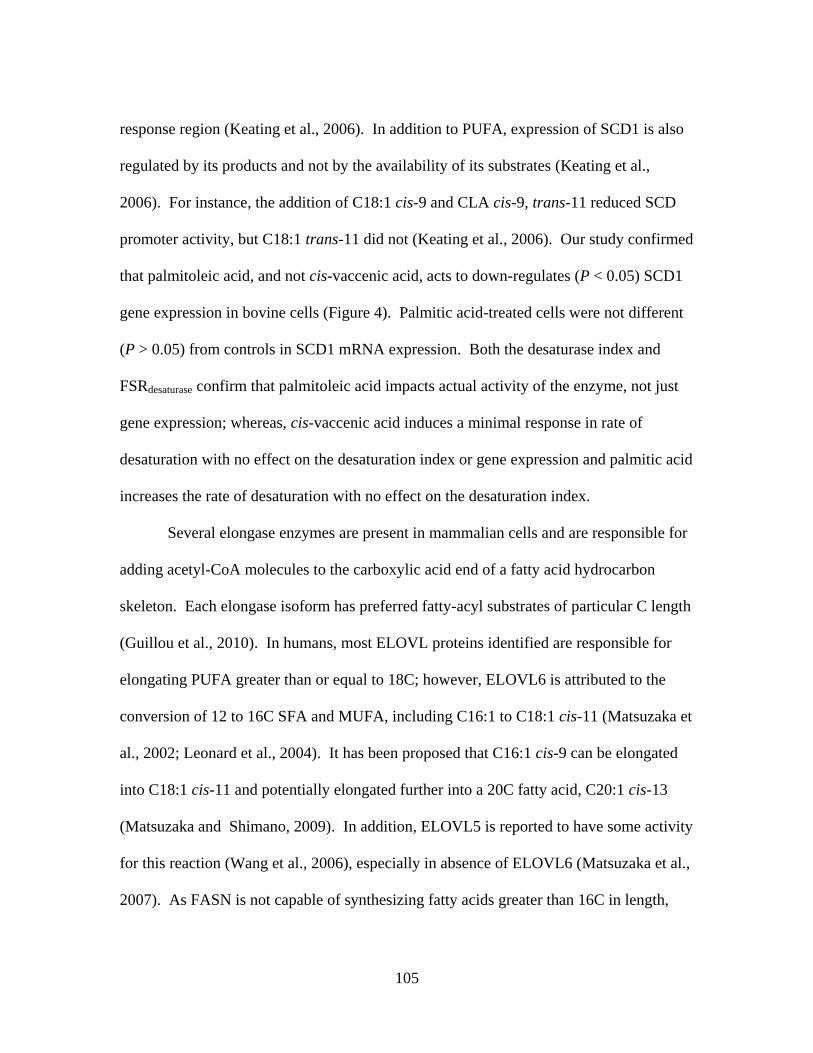
105
response region (Keating et al., 2006). In addition to PUFA, expression of SCD1 is also
regulated by its products and not by the availability of its substrates (Keating et al.,
2006). For instance, the addition of C18:1 cis-9 and CLA cis-9, trans-11 reduced SCD
promoter activity, but C18:1 trans-11 did not (Keating et al., 2006). Our study confirmed
that palmitoleic acid, and not cis-vaccenic acid, acts to down-regulates (P < 0.05) SCD1
gene expression in bovine cells (Figure 4). Palmitic acid-treated cells were not different
(P > 0.05) from controls in SCD1 mRNA expression. Both the desaturase index and
FSRdesaturase confirm that palmitoleic acid impacts actual activity of the enzyme, not just
gene expression; whereas, cis-vaccenic acid induces a minimal response in rate of
desaturation with no effect on the desaturation index or gene expression and palmitic acid
increases the rate of desaturation with no effect on the desaturation index.
Several elongase enzymes are present in mammalian cells and are responsible for
adding acetyl-CoA molecules to the carboxylic acid end of a fatty acid hydrocarbon
skeleton. Each elongase isoform has preferred fatty-acyl substrates of particular C length
(Guillou et al., 2010). In humans, most ELOVL proteins identified are responsible for
elongating PUFA greater than or equal to 18C; however, ELOVL6 is attributed to the
conversion of 12 to 16C SFA and MUFA, including C16:1 to C18:1 cis-11 (Matsuzaka et
al., 2002; Leonard et al., 2004). It has been proposed that C16:1 cis-9 can be elongated
into C18:1 cis-11 and potentially elongated further into a 20C fatty acid, C20:1 cis-13
(Matsuzaka and Shimano, 2009). In addition, ELOVL5 is reported to have some activity
for this reaction (Wang et al., 2006), especially in absence of ELOVL6 (Matsuzaka et al.,
2007). As FASN is not capable of synthesizing fatty acids greater than 16C in length,
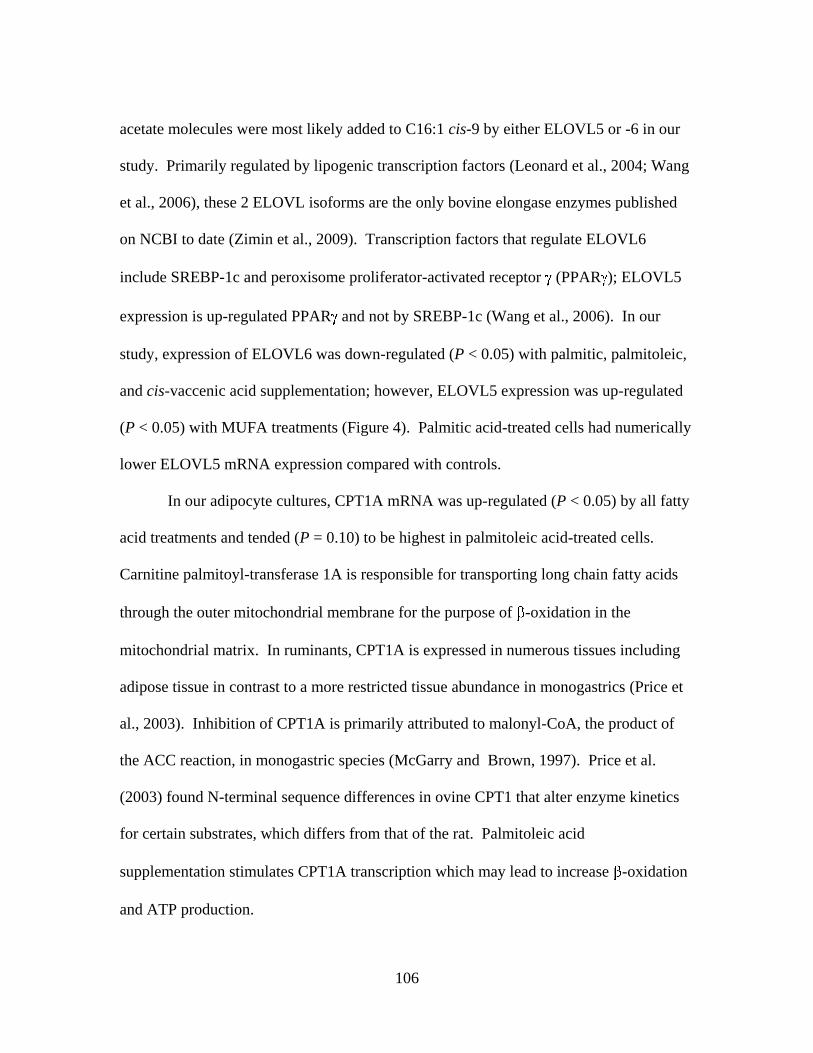
106
acetate molecules were most likely added to C16:1 cis-9 by either ELOVL5 or -6 in our
study. Primarily regulated by lipogenic transcription factors (Leonard et al., 2004; Wang
et al., 2006), these 2 ELOVL isoforms are the only bovine elongase enzymes published
on NCBI to date (Zimin et al., 2009). Transcription factors that regulate ELOVL6
include SREBP-1c and peroxisome proliferator-activated receptor (PPAR ); ELOVL5
expression is up-regulated PPAR and not by SREBP-1c (Wang et al., 2006). In our
study, expression of ELOVL6 was down-regulated (P < 0.05) with palmitic, palmitoleic,
and cis-vaccenic acid supplementation; however, ELOVL5 expression was up-regulated
(P < 0.05) with MUFA treatments (Figure 4). Palmitic acid-treated cells had numerically
lower ELOVL5 mRNA expression compared with controls.
In our adipocyte cultures, CPT1A mRNA was up-regulated (P < 0.05) by all fatty
acid treatments and tended (P = 0.10) to be highest in palmitoleic acid-treated cells.
Carnitine palmitoyl-transferase 1A is responsible for transporting long chain fatty acids
through the outer mitochondrial membrane for the purpose of -oxidation in the
mitochondrial matrix. In ruminants, CPT1A is expressed in numerous tissues including
adipose tissue in contrast to a more restricted tissue abundance in monogastrics (Price et
al., 2003). Inhibition of CPT1A is primarily attributed to malonyl-CoA, the product of
the ACC reaction, in monogastric species (McGarry and Brown, 1997). Price et al.
(2003) found N-terminal sequence differences in ovine CPT1 that alter enzyme kinetics
for certain substrates, which differs from that of the rat. Palmitoleic acid
supplementation stimulates CPT1A transcription which may lead to increase -oxidation
and ATP production.
107
In this study, we confirmed C18:1 cis-11 and C20:1 cis-13 as products of
palmitoleic acid elongation in vitro and that CLA cis-9, cis-11 can also be produced
through elongation and desaturation of palmitoleic acid. Palmitoleic acid and cis-
vaccenic supplementation reduces lipogenesis and FASN gene expression. However,
palmitoleic acid only reduces SCD1 gene expression and desaturation activity.
Therefore, palmitoleic acid is actively elongated in vitro and its elongation product, cis-
vaccenic, can also reduce lipogenesis, but only palmitoleic acid can reduce desaturation
rates.
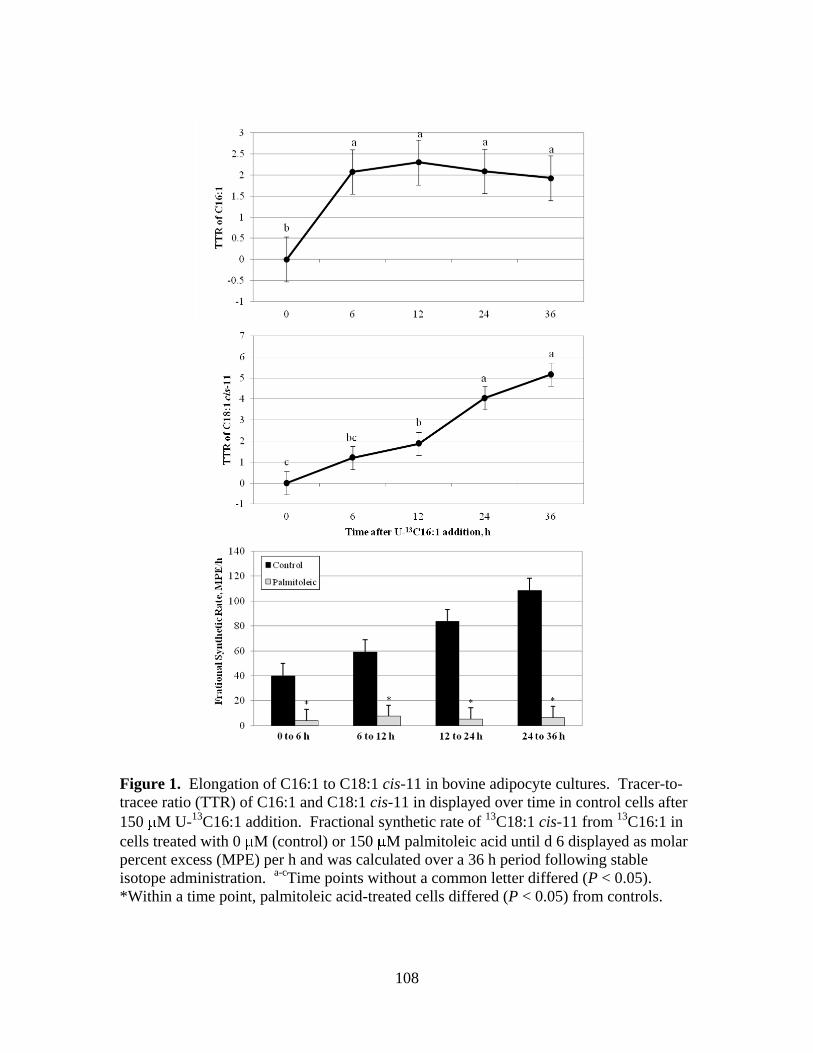
108
Figure 1. Elongation of C16:1 to C18:1 cis-11 in bovine adipocyte cultures. Tracer-to-
tracee ratio (TTR) of C16:1 and C18:1 cis-11 in displayed over time in control cells after
150 M U-13
C16:1 addition. Fractional synthetic rate of 13
C18:1 cis-11 from 13
C16:1 in
cells treated with 0 M (control) or 150 M palmitoleic acid until d 6 displayed as molar
percent excess (MPE) per h and was calculated over a 36 h period following stable
isotope administration. a-c
Time points without a common letter differed (P < 0.05).
*Within a time point, palmitoleic acid-treated cells differed (P < 0.05) from controls.
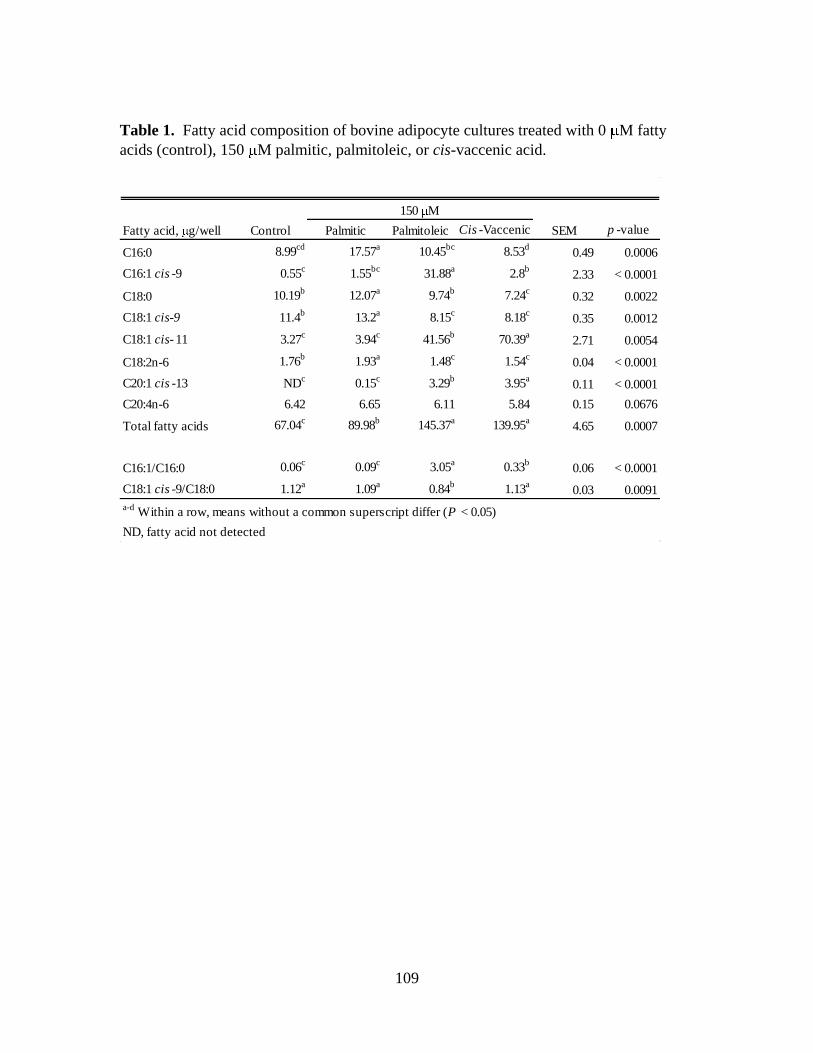
109
Table 1. Fatty acid composition of bovine adipocyte cultures treated with 0 M fatty
acids (control), 150 M palmitic, palmitoleic, or cis-vaccenic acid.
Control Palmitic Palmitoleic Cis -Vaccenic SEM p -value
C16:0 8.99cd
17.57a
10.45bc
8.53d
0.49 0.0006
C16:1 cis -9 0.55c
1.55bc
31.88a
2.8b
2.33 < 0.0001
C18:0 10.19b
12.07a
9.74b
7.24c
0.32 0.0022
C18:1 cis-9 11.4b
13.2a
8.15c
8.18c
0.35 0.0012
C18:1 cis- 11 3.27c
3.94c
41.56b
70.39a
2.71 0.0054
C18:2n-6 1.76b
1.93a
1.48c
1.54c
0.04 < 0.0001
C20:1 cis -13 NDc
0.15c
3.29b
3.95a
0.11 < 0.0001
C20:4n-6 6.42 6.65 6.11 5.84 0.15 0.0676
Total fatty acids 67.04c
89.98b
145.37a
139.95a
4.65 0.0007
C16:1/C16:0 0.06c
0.09c
3.05a
0.33b
0.06 < 0.0001
C18:1 cis -9/C18:0 1.12a
1.09a
0.84b
1.13a
0.03 0.0091
ND, fatty acid not detected
a-d Within a row, means without a common superscript differ (P < 0.05)
Fatty acid, g/well
150 M
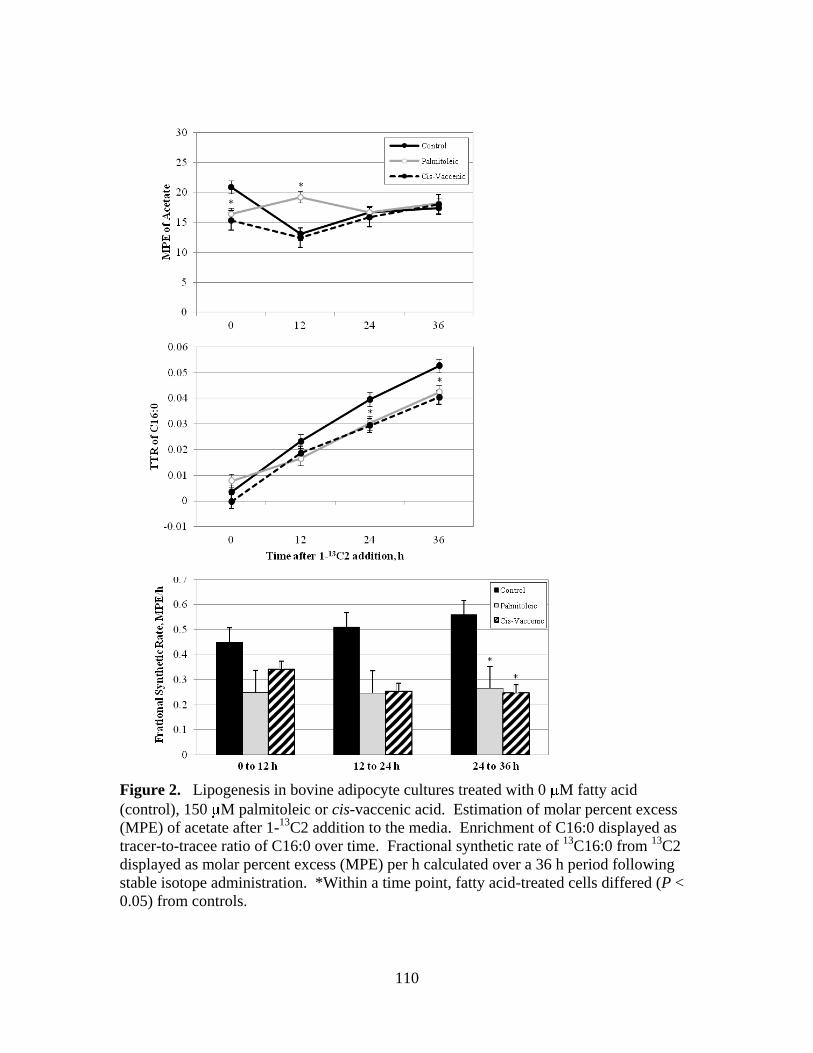
110
Figure 2. Lipogenesis in bovine adipocyte cultures treated with 0 M fatty acid
(control), 150 M palmitoleic or cis-vaccenic acid. Estimation of molar percent excess
(MPE) of acetate after 1-13
C2 addition to the media. Enrichment of C16:0 displayed as
tracer-to-tracee ratio of C16:0 over time. Fractional synthetic rate of 13
C16:0 from 13
C2
displayed as molar percent excess (MPE) per h calculated over a 36 h period following
stable isotope administration. *Within a time point, fatty acid-treated cells differed (P <
0.05) from controls.
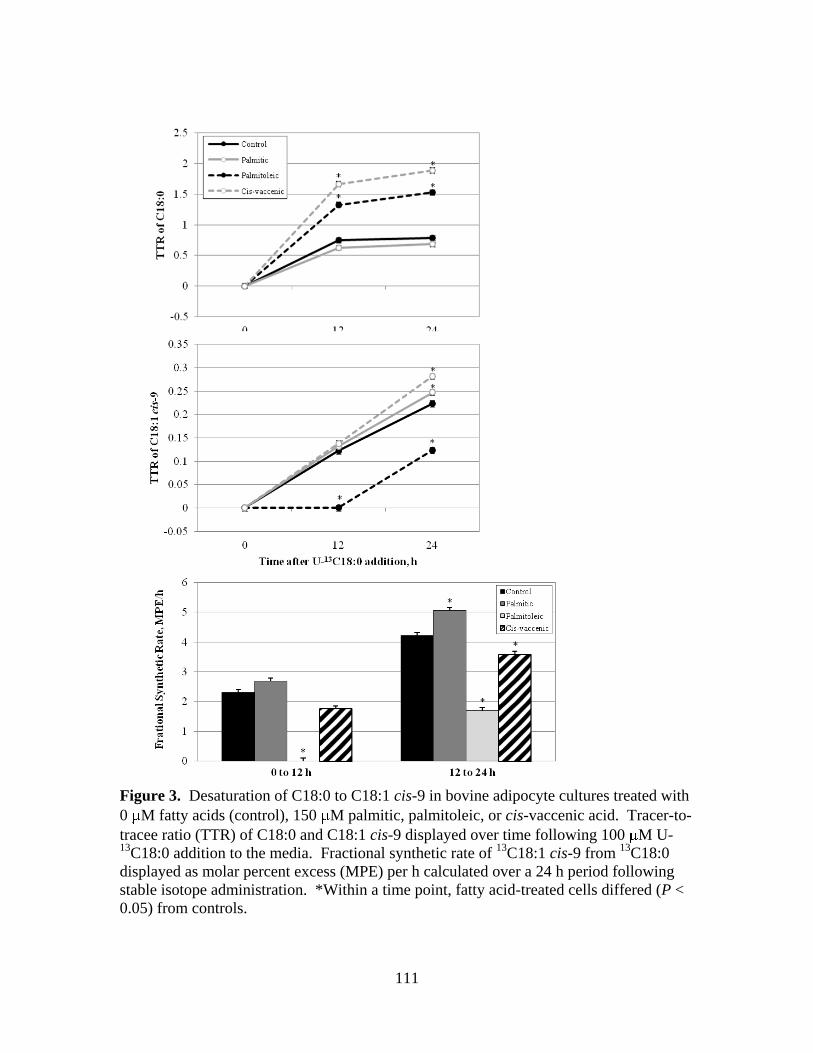
111
Figure 3. Desaturation of C18:0 to C18:1 cis-9 in bovine adipocyte cultures treated with
0 M fatty acids (control), 150 M palmitic, palmitoleic, or cis-vaccenic acid. Tracer-to-
tracee ratio (TTR) of C18:0 and C18:1 cis-9 displayed over time following 100 M U-13
C18:0 addition to the media. Fractional synthetic rate of 13
C18:1 cis-9 from 13
C18:0
displayed as molar percent excess (MPE) per h calculated over a 24 h period following
stable isotope administration. *Within a time point, fatty acid-treated cells differed (P <
0.05) from controls.
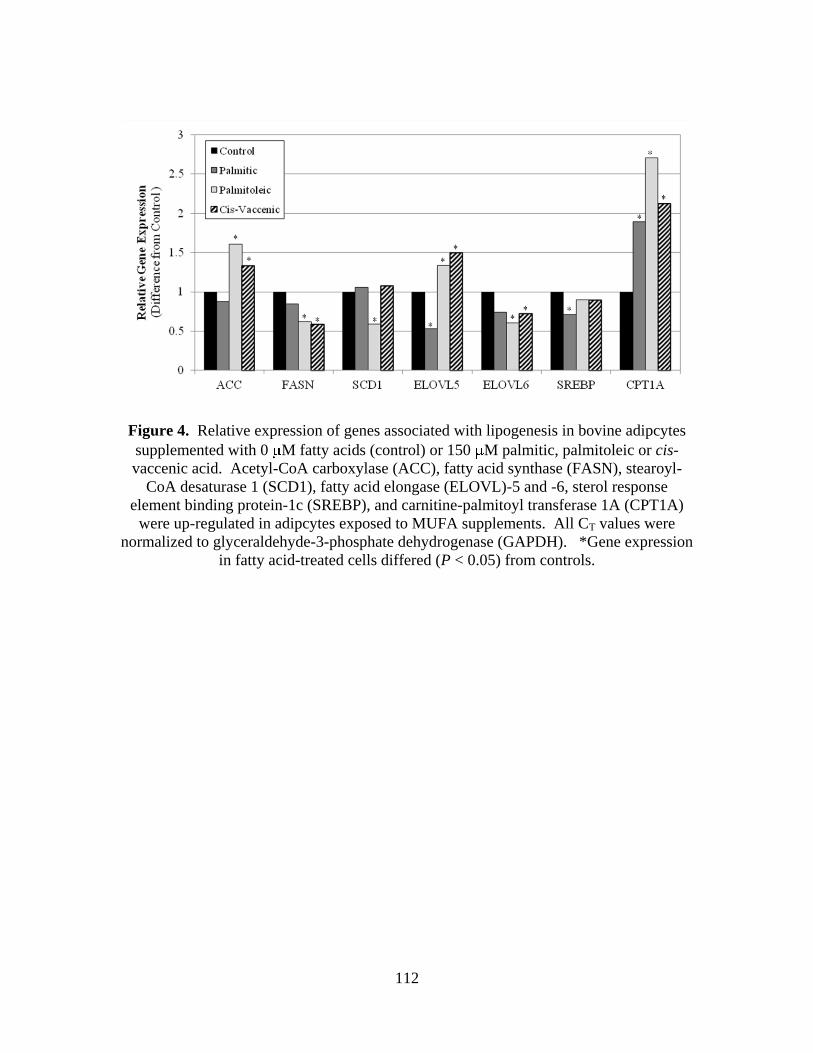
112
Figure 4. Relative expression of genes associated with lipogenesis in bovine adipcytes
supplemented with 0 M fatty acids (control) or 150 M palmitic, palmitoleic or cis-
vaccenic acid. Acetyl-CoA carboxylase (ACC), fatty acid synthase (FASN), stearoyl-
CoA desaturase 1 (SCD1), fatty acid elongase (ELOVL)-5 and -6, sterol response
element binding protein-1c (SREBP), and carnitine-palmitoyl transferase 1A (CPT1A)
were up-regulated in adipcytes exposed to MUFA supplements. All CT values were
normalized to glyceraldehyde-3-phosphate dehydrogenase (GAPDH). *Gene expression
in fatty acid-treated cells differed (P < 0.05) from controls.
113
LITERATURE CITED
Archibeque, S. L., D. K. Lunt, C. D. Gilbert, R. K. Tume, and S. B. Smith. 2005. Fatty
acid indices of stearoyl-CoA desaturase do not reflect actual stearoyl-CoA
desaturase enzyme activities in adipose tissues of beef steers finished with corn-,
flaxseed-, or sorghum-based diets. J. Anim. Sci. 83(5): 1153-1166.
Burns, T. A., S. K. Duckett, & S. L. Pratt. 2010. Palmitoleic acid (C16:1) changes fatty
acid profiles and alters gene expression in bovine adipocyte cultures. Journal of
Animal Science. 88(E-suppl. 2): 758. (Abstr.)
Cao, H., K. Gerhold, J. R. Mayers, M. M. Wiest, S. M. Watkins, and G. S. Hotamisligil.
2008. Identification of a lipokine, a lipid hormone linking adipose tissue to systemic
metabolism. Cell. 134(6): 933-944.
Duckett, S. K., J. G. Andrae, and F. N. Owens. 2002. Effect of high-oil corn or added
corn oil on ruminal biohydrogenation of fatty acids and conjugated linoleic acid
formation in beef steers fed finishing diets. J. Anim. Sci. 80(12): 3353-3360.
Duckett, S. K., S. L. Pratt, and E. Pavan. 2009. Corn oil or corn grain supplementation to
steers grazing endophyte-free tall fescue. II. effects on subcutaneous fatty acid
content and lipogenic gene expression. J. Anim. Sci. 87(3): 1120-1128.
Eberlé, D., B. Hegarty, P. Bossard, P. Ferré, and F. Foufelle. 2004. SREBP transcription
factors: Master regulators of lipid homeostasis. Biochimie. 86(11): 839-848.
Enoch, H. G., A. Catalá, and P. Strittmatter. 1976. Mechanism of rat liver microsomal
stearyl-CoA desaturase. studies of the substrate specificity, enzyme-substrate
interactions, and the function of lipid. J. Biol. Chem. 251(16): 5095-5103.
Flier, J. S. 1998. What's in a name? in search of leptin's physiologic role. J. Clin.
Endocrinol. Metab. 83(5): 1407-1413.
Folch, J., M. Lees, and G. H. S. Stanley. 1957. A simple method for the isolation and
purification of total lipides from animal tissues. J. Biol. Chem. 226(1): 497-509.
Guillou, H., D. Zadravec, P. G. P. Martin, and A. Jacobsson. 2010. The key roles of
elongases and desaturases in mammalian fatty acid metabolism: Insights from
transgenic mice. Prog. Lipid Res. 49(2): 186-199.
114
Guo, W., S. Wong, W. Xie, T. Lei, and Z. Luo. 2007. Palmitate modulates intracellular
signaling, induces endoplasmic reticulum stress, and causes apoptosis in mouse 3T3-
L1 and rat primary preadipocytes. Am. J. Physiol. Endocrinol. Metab. 293(2): E576-
586.
Hirai, S., H. Matsumoto, N. Hino, H. Kawachi, T. Matsui, and H. Yano. 2007. Myostatin
inhibits differentiation of bovine preadipocyte. Domest. Anim. Endocrinol. 32(1): 1-
14.
Keating, A. F., J. J. Kennelly, and F. Zhao. 2006. Characterization and regulation of the
bovine stearoyl-CoA desaturase gene promoter. Biochem. Biophys. Res. Commun.
344(1): 233-240.
Lay, S. L., I. Lefrère, C. Trautwein, I. Dugail, and S. Krief. 2002. Insulin and sterol-
regulatory element-binding protein-1c (SREBP-1C) regulation of gene expression in
3T3-L1 adipocytes. J. Biol. Chem. 277(38): 35625-35634.
Leonard, A. E., S. L. Pereira, H. Sprecher, and Y. Huang. 2004. Elongation of long-chain
fatty acids. Prog. Lipid Res. 43(1): 36-54.
MacDougald, O. A., and C. F. Burant. 2007. The rapidly expanding family of adipokines.
Cell Metabolism. 6(3): 159-161.
Martini, W. Z., D. L. Chinkes, R. E. Barrow, E. D. Murphey, and R. R. Wolfe. 1999.
Lung surfactant kinetics in conscious pigs. American Journal of Physiology -
Endocrinology and Metabolism. 277(1): E187-E195.
Matsuzaka, T., and H. Shimano. 2009. Elovl6: A new player in fatty acid metabolism and
insulin sensitivity. Journal of Molecular Medicine. 87(4): 379-384.
Matsuzaka, T., H. Shimano, N. Yahagi, T. Kato, A. Atsumi, T. Yamamoto et al. 2007.
Crucial role of a long-chain fatty acid elongase, Elovl6, in obesity-induced insulin
resistance. Nat. Med. 13(10): 1193-1202.
Matsuzaka, T., H. Shimano, N. Yahagi, T. Yoshikawa, M. Amemiya-Kudo, A. H. Hasty
et al. 2002. Cloning and characterization of a mammalian fatty acyl-CoA elongase as
a lipogenic enzyme regulated by SREBPs. J. Lipid Res. 43(6): 911-920.
McGarry, J. D., and N. F. Brown. 1997. The mitochondrial carnitine palmitoyltransferase
system: From concept to molecular analysis. Euro. J. Biochem. 244(1): 1-14.
McGillis, J. P. 2005. White adipose tissue, inert no more! Endocrinology. 146(5): 2154-
2156.
115
Ntambi, J. M. 1995. The regulation of stearoyl-CoA desaturase (SCD). Prog. Lipid Res.
34(2): 139-150.
Park, P. W., and R. E. Goins. 1994. In situ preparation of FAME for analysis of fattyacid
composition in foods. J. Food Sci. 59: 1262-1266.
Pfaffl, M. W., G. W. Horgan, and L. Dempfle. 2002. Relative expression software tool
(REST©) for group-wise comparison and statistical analysis of relative expression
results in real-time PCR. Nuc. Acids Res. 30(9): e36-e36.
Pratt, S. L., T. A. Burns, E. Curry, and S. K. Duckett. 2010. Expression of microRNA
during bovine adipogenesis. J. Nuc. Acids Invest. 1(e12): 62-70.
Price, N. T., V. N. Jackson, F. R. van der Leij, J. M. Cameron, M. T. Travers, B. Bartelds
et al. 2003. Cloning and expression of the liver and muscle isoforms of ovine
carnitine palmitoyltransferase 1: Residues within the N-terminus of the muscle
isoform influence the kinetic properties of the enzyme. Biochem. J. 372(Pt 3): 871–
879.
Smith, S. B., and J. D. Crouse. 1984. Relative contributions of acetate, lactate and
glucose to lipogenesis in bovine intramuscular and subcutaneous adipose tissue. J.
Nutr. 114(4): 792-800.
Vernon, R. G. 1980. Lipid metabolism in the adipose tissue of ruminant animals. Prog.
Lipid Res. 19(1-2): 23-106.
Wang, Y., D. Botolin, J. Xu, B. Christian, E. Mitchell, B. Jayaprakasam et al. 2006.
Regulation of hepatic fatty acid elongase and desaturase expression in diabetes and
obesity. J. Lipid Res. 47(9): 2028-2041.
Wolfe, R. R., and D. L. Chinkes. 2005. Mass Isotopomer Distribution Analysis. Pages
203-213 in Isotope Tracers in Metabolic Research: Principles and Practice of Kinetic
Analysis. Second ed. Wiley-Liss, Hoboken, NJ.
Zimin, A. V., A. L. Delcher, L. Florea, D. R. Kelley, M. C. Schatz, D. Puiu et al. 2009. A
whole-genome assembly of the domestic cow, Bos taurus. Genome Biology. 10(4):
R42.1-R42.10.