Embed Size (px)
Citation preview

Fault Detection and Condition Monitoring in District Heating UsingSmart Meter Data
Felix Theusch1, Patrick Klein1, Ralph Bergmann1, 2, Wolfgang Wilke1, 3, Wolfgang Bock3 and Adrian Weber3
1 Business Information Systems II, University of Trier, 54296 Trier, Germany{theusch, kleinp, bergmann, wilke}@uni-trier.de
2 German Research Center for Artificial Intelligence (DFKI), Branch University of Trier, 54296 Trier, [email protected]
3 msg systems AG, 50354 Hurth, Germany{wolfgang.wilke, wolfgang.bock, adrian.weber}@msg.group
ABSTRACT
Currently, large amounts of smart meter data are mainly usedfor billing purposes only, although they could also be valu-able for decision support and business process optimizationin customer service and maintenance. Therefore, this paperpresents several relevant use cases for prognostics and healthmanagement based on a case study of a real meter data set ofa medium-sized geothermal district heating network in south-ern Germany. First, we show the implementation of a ma-chine learning algorithm for automatic fault detection basedon cluster analysis and regression. Thereby, the district heat-ing substation’s control behaviour is learned and deviationsdue to a malfunction or failure can be detected before thecustomer notices them. In addition, we discuss the useful-ness of two key performance indicators (return temperatureand supply-return temperature difference) that can be com-puted relatively simple but resulting in very effective insightsfor condition-based maintenance and identifying substationswith highly negative effects on the overall network. Our find-ings’ correctness and usefulness were verified by the corre-sponding domain experts of the geothermal district heatingcompany. Finally, we provide an outlook on smart meterdata’s role for the further development of intelligent districtheating networks and the realization of highly complex ap-proaches such as smart grids. To foster future research, weprovide exemplary our RapidMiner processes.
1. INTRODUCTION
The anthropogenic climate change is the most pressing chal-lenge of our time and is now showing itself in increasingly
Felix Theusch et al. This is an open-access article distributed under the termsof the Creative Commons Attribution 3.0 United States License, which per-mits unrestricted use, distribution, and reproduction in any medium, providedthe original author and source are credited.
dramatic effects e.g. rising seas, melting ice or extremeweather events. This development is caused by the steady in-crease of greenhouse gas emissions since the beginning of in-dustrialisation. According to the Fifth Assessment Report ofthe Intergovernmental Panel on Climate Change (IPCC), in-direct CO2 emissions for the generation of electricity and heatfor building use accounts for 12% of global greenhouse gasemissions (Pachauri et al., 2014). Against this background,it is necessary to convert the heat supply to sustainable andresource-saving forms of energy.
The supply of heat to individual buildings by a central powerplant is generally referred as district heating and contributesto the heat supply in almost all regions of the world. In manycountries of Central, Northern and Eastern Europe, it is one ofthe most important types of heating, for example in Scandi-navia, where its share is partly over 90% (Sayegh et al., 2017).In particular, by using non-fossil energy sources, for examplegeothermal energy (Rybach, 2003) or waste heat from indus-trial processes, district heating systems can make a significantcontribution to reduce greenhouse gas emissions.
To further increase the acceptance and distribution of dis-trict heating networks (DHNs), they need to be operated effi-ciently and economically. Therefore (Lund et al., 2014) havedefined the concept of the 4th Generation District Heating(4GDH). 4GDH networks rely as much as possible on sus-tainable energy generation and highly efficient heat distribu-tion. To achieve this, the main challenge is to reduce the net-work’s temperature level drastically compared to today’s sys-tems. Especially, district heating substations (DHS), whereheat is transferred from the DHN to the building’s own heat-ing system, can make a substantial contribution to this. How-ever, faulty components can cause significant performancedrops or the breakdown of DHS and must therefore be iden-
1
EUROPEAN CONFERENCE OF THE PROGNOSTICS AND HEALTH MANAGEMENT SOCIETY 2021
tified as soon as possible.
Since recently all DHSs will be equipped with smart metersthat send data to the network operator for billing purposes,this paper examines whether and how these data can also beused for condition monitoring and network optimization. Ourmain contribution is the implementation of a fault detectionapproach that extends existing solutions with automated de-tection, as well as the application of two key performance in-dicators to determine inefficient and potentially faulty DHSs.Moreover, our findings are evaluated by means of case stud-ies and the results are verified by several technical experts ofthe network operator. Furthermore, our implementation usedfor analysis is publicly available in the form of RapidMinerworkflows at: https://github.com/FeTheu/RM-fault-detection-in-dhs.
The paper is structured as follows: we first describe the es-sential basics of district heating substations and smart metersin Sect. 2 and summarise selected related work. The focus ofthis paper in Sect. 3 is to demonstrate different data-drivenuse cases for fault detection and condition management usinga real smart meter dataset of a medium-sized district heatingnetwork in Southern Germany.
2. FOUNDATIONS AND RELATED WORK
2.1. District Heating Substation
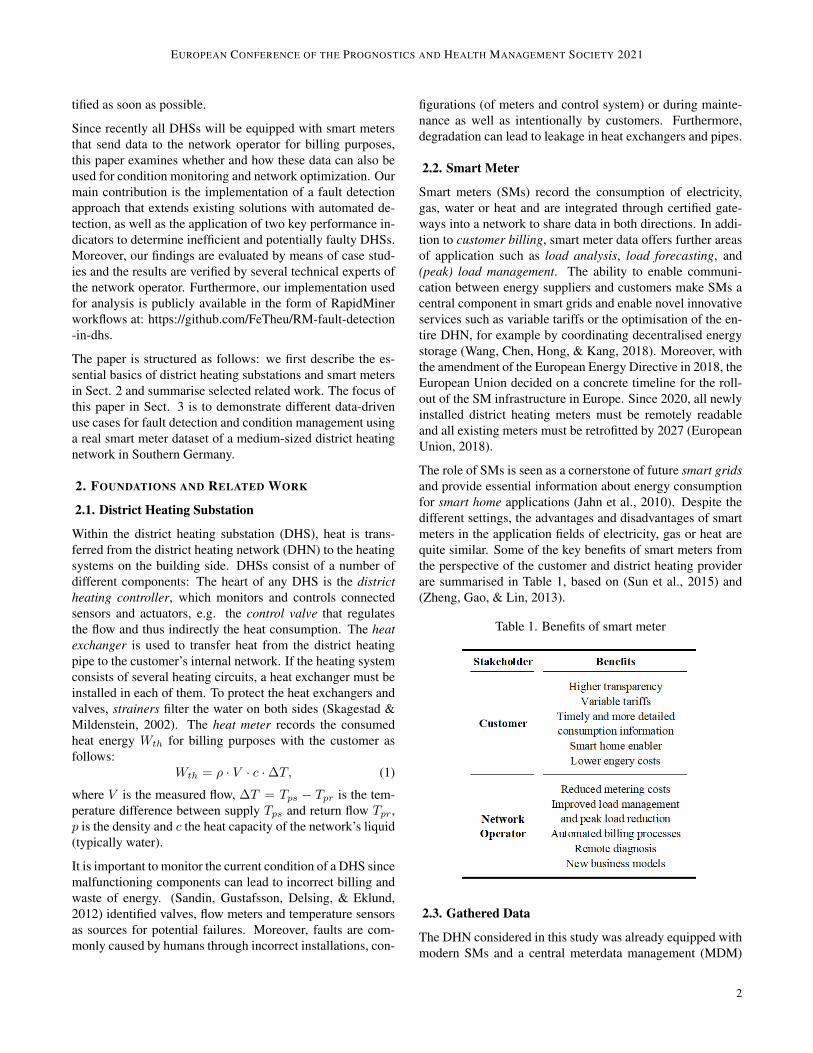
Within the district heating substation (DHS), heat is trans-ferred from the district heating network (DHN) to the heatingsystems on the building side. DHSs consist of a number ofdifferent components: The heart of any DHS is the districtheating controller, which monitors and controls connectedsensors and actuators, e.g. the control valve that regulatesthe flow and thus indirectly the heat consumption. The heatexchanger is used to transfer heat from the district heatingpipe to the customer’s internal network. If the heating systemconsists of several heating circuits, a heat exchanger must beinstalled in each of them. To protect the heat exchangers andvalves, strainers filter the water on both sides (Skagestad &Mildenstein, 2002). The heat meter records the consumedheat energy Wth for billing purposes with the customer asfollows:
Wth = ρ · V · c · ∆T, (1)
where V is the measured flow, ∆T = Tps − Tpr is the tem-perature difference between supply Tps and return flow Tpr,p is the density and c the heat capacity of the network’s liquid(typically water).
It is important to monitor the current condition of a DHS sincemalfunctioning components can lead to incorrect billing andwaste of energy. (Sandin, Gustafsson, Delsing, & Eklund,2012) identified valves, flow meters and temperature sensorsas sources for potential failures. Moreover, faults are com-monly caused by humans through incorrect installations, con-
figurations (of meters and control system) or during mainte-nance as well as intentionally by customers. Furthermore,degradation can lead to leakage in heat exchangers and pipes.
2.2. Smart Meter
Smart meters (SMs) record the consumption of electricity,gas, water or heat and are integrated through certified gate-ways into a network to share data in both directions. In addi-tion to customer billing, smart meter data offers further areasof application such as load analysis, load forecasting, and(peak) load management. The ability to enable communi-cation between energy suppliers and customers make SMs acentral component in smart grids and enable novel innovativeservices such as variable tariffs or the optimisation of the en-tire DHN, for example by coordinating decentralised energystorage (Wang, Chen, Hong, & Kang, 2018). Moreover, withthe amendment of the European Energy Directive in 2018, theEuropean Union decided on a concrete timeline for the roll-out of the SM infrastructure in Europe. Since 2020, all newlyinstalled district heating meters must be remotely readableand all existing meters must be retrofitted by 2027 (EuropeanUnion, 2018).
The role of SMs is seen as a cornerstone of future smart gridsand provide essential information about energy consumptionfor smart home applications (Jahn et al., 2010). Despite thedifferent settings, the advantages and disadvantages of smartmeters in the application fields of electricity, gas or heat arequite similar. Some of the key benefits of smart meters fromthe perspective of the customer and district heating providerare summarised in Table 1, based on (Sun et al., 2015) and(Zheng, Gao, & Lin, 2013).
Table 1. Benefits of smart meter
2.3. Gathered Data
The DHN considered in this study was already equipped withmodern SMs and a central meterdata management (MDM)
2
EUROPEAN CONFERENCE OF THE PROGNOSTICS AND HEALTH MANAGEMENT SOCIETY 2021
system during its development phase. All DHSs are equippedwith a Modbus-capable controller that collects the data fromthe controller itself and from the heat meter. These data areretrieved at 3-minute intervals via the gateways.
The analysed data set is a subset from the MDM of a medium-sized southern German geothermal DHN with over 2000 con-nected office and household buildings. It includes data from896 DHSs over a heating period (04.11.2019 to 31.03.2020).For each connected heating circuit (e.g. one circuit for heat-ing and one for domestic hot water), different actuator, pa-rameter, and sensor attributes are written in the MDM. Typ-ical actuator values are the signal for the control valve po-sition or the operating mode of the circulation pump (ac-tive/inactive), which are steered by the controller. Tab. 2shows the sensor values used in the analyses during Sect. 3and their notation.
Table 2. Selection of available sensor values
Since the DHN’s data acquisition was just launched, the re-corded data still revealed some issues. The most commonproblem, which can be observed in different intensity in al-most all DHSs, is an interrupted data transmission to the MDM.For example, in 137 out of 896 DHS, less than 90% of datais transmitted to the MDM via the gateway. This results intime series with missing and unequally sampled observations,which needs to be considered when choosing the algorithmsfor fault detection and is discussed in Sect. 3.1.
2.4. Related Work
Although the data of the MDM was designed especially formonitoring and billing energy consumption, related work e.g.,(Seem, 2005), (Sandin, Gustafsson, & Delsing, 2013) haveshown its suitability for fault detection and diagnosis. A provenapproach to fault detection in heating, ventilation and air-conditioning (HVAC) is the detection of deviations from theregular intraday and intraweek load cycles. (Seem, 2005)and (Li, Bowers, & Schnier, 2009) therefore develop clus-ter analyses to classify the households with regard to theirintraday and intraweek cycles. (Kiluk, 2012) further usesdata on the size of the heated building area for a cluster anal-ysis in combination with a piecewise regression. Throughk-means clustering and logistic regression, (Gianniou, Liu,Heller, Nielsen, & Rode, 2018) segment meter data from single-family households into different consumption groups. (Xue
et al., 2017) combine clustering with association analysis andidentify faulty DHSs and those with significant optimisationpotential. Unlike the previous studies, (Mansson, Kallion-iemi, Sernhed, & Thern, 2018) use the volume flow as thetarget variable in conjunction with a gradient boosting regres-sor. The analysis pipeline is additionally optimised by a tree-based pipeline optimisation tool (TPOT). This automaticallygenerates different input constellations and evaluates whichone provides the best results. To identify faulty DHSs, (Gadd& Werner, 2014) use the temperature difference between flowand return depending on the outdoor temperature. However,this approach can only be used at lower outdoor temperaturesup to approx. 10 °C, as above that the domestic hot waterheating becomes a dominant factor. In summary, the mostapproaches apply cluster analysis combined with regressionanalysis to learn the normal behaviour and use deviants todetect faults. However, to the best of the authors’ knowl-edge, no regression analysis approach has yet been presentedin previous work on how these deviants can be detected auto-matically.
3. CASE STUDIES ON FAULT DETECTION AND CONDI-TION MONITORING
The aim of our study is to demonstrate possible applicationsof smart meter data with regard to advanced maintenance inthe field of district heating. The methods presented here canbe implemented using only standard energy metering data anddo not require any additional information. We first describe amachine learning (ML) approach to detect failures and mal-functions of the components of a DHS mentioned in subsec-tion 2.1 and then discuss possibilities of condition monitor-ing.
3.1. Fault Detection
The heat demand of a DHS (measured via P ) depends on sev-eral factors from which the outside temperature Tout as wellas the individual user behaviour are the most dominant ones.Since user behaviour cannot be measured directly, the heatdemand is subject to strong fluctuations in the course of theday and week. For this reason, the goal of the following MLapproach is to learn a regular load profile that represents thenormal behaviour and then to detect automatically deviationsdue to a malfunction or failure.
3.1.1. Approach
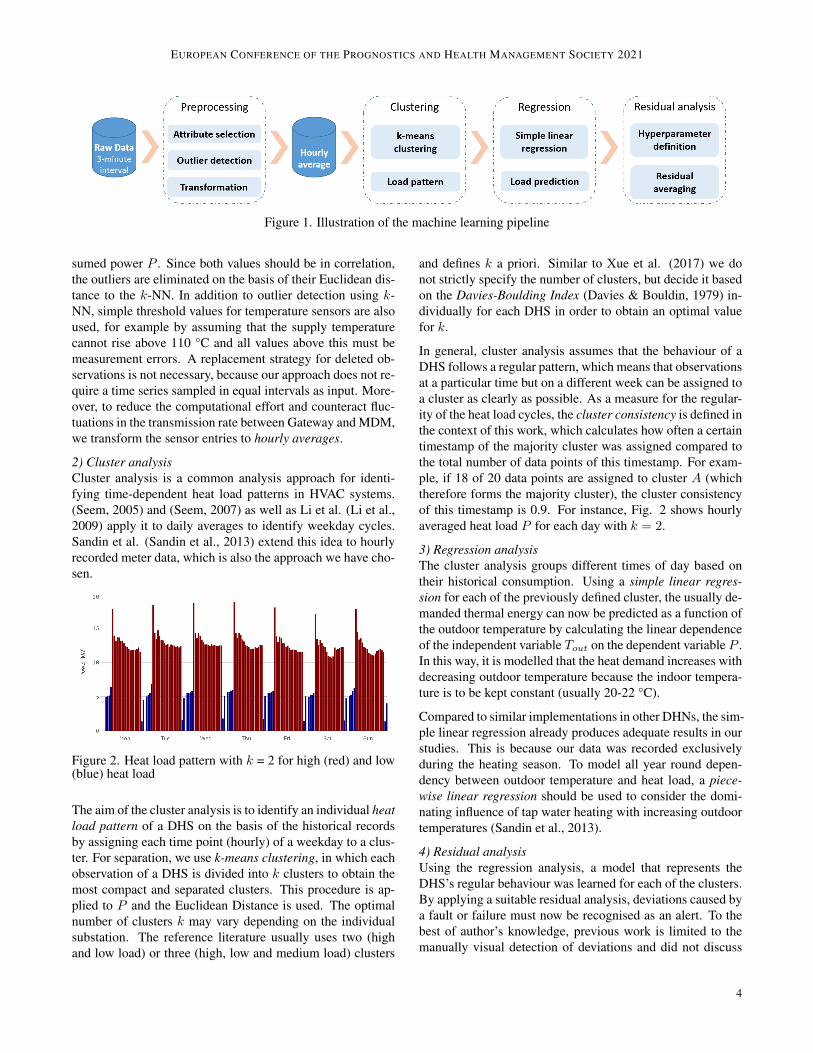
As shown in Fig. 1, the machine learning pipeline splits intofour separate steps.
1) Preprocessing and transformationThe goal of preprocessing and transformation is to generatea suitable data set for the further analysis steps. Initially, anoutlier detection using k-nearest neighbour (k-NN) classifi-cation is applied to the outdoor temperature Tout and con-
3
EUROPEAN CONFERENCE OF THE PROGNOSTICS AND HEALTH MANAGEMENT SOCIETY 2021
Figure 1. Illustration of the machine learning pipeline
sumed power P . Since both values should be in correlation,the outliers are eliminated on the basis of their Euclidean dis-tance to the k-NN. In addition to outlier detection using k-NN, simple threshold values for temperature sensors are alsoused, for example by assuming that the supply temperaturecannot rise above 110 °C and all values above this must bemeasurement errors. A replacement strategy for deleted ob-servations is not necessary, because our approach does not re-quire a time series sampled in equal intervals as input. More-over, to reduce the computational effort and counteract fluc-tuations in the transmission rate between Gateway and MDM,we transform the sensor entries to hourly averages.
2) Cluster analysisCluster analysis is a common analysis approach for identi-fying time-dependent heat load patterns in HVAC systems.(Seem, 2005) and (Seem, 2007) as well as Li et al. (Li et al.,2009) apply it to daily averages to identify weekday cycles.Sandin et al. (Sandin et al., 2013) extend this idea to hourlyrecorded meter data, which is also the approach we have cho-sen.
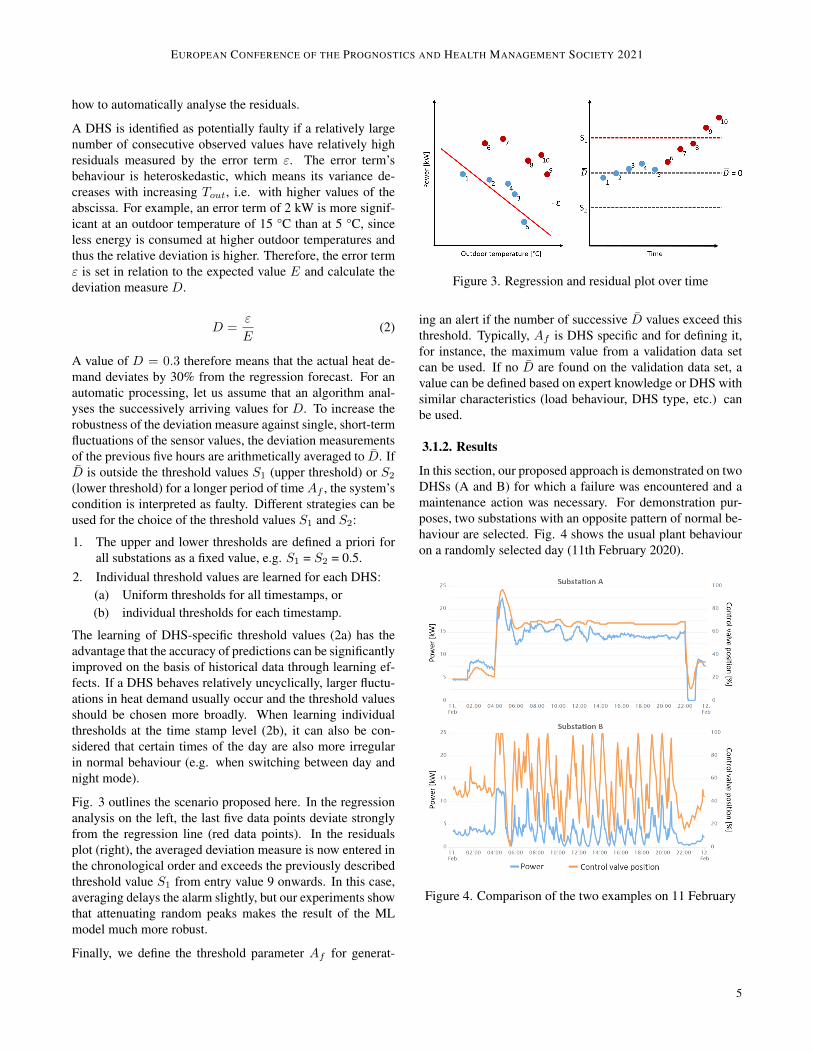
Figure 2. Heat load pattern with k = 2 for high (red) and low(blue) heat load
The aim of the cluster analysis is to identify an individual heatload pattern of a DHS on the basis of the historical recordsby assigning each time point (hourly) of a weekday to a clus-ter. For separation, we use k-means clustering, in which eachobservation of a DHS is divided into k clusters to obtain themost compact and separated clusters. This procedure is ap-plied to P and the Euclidean Distance is used. The optimalnumber of clusters k may vary depending on the individualsubstation. The reference literature usually uses two (highand low load) or three (high, low and medium load) clusters
and defines k a priori. Similar to Xue et al. (2017) we donot strictly specify the number of clusters, but decide it basedon the Davies-Boulding Index (Davies & Bouldin, 1979) in-dividually for each DHS in order to obtain an optimal valuefor k.
In general, cluster analysis assumes that the behaviour of aDHS follows a regular pattern, which means that observationsat a particular time but on a different week can be assigned toa cluster as clearly as possible. As a measure for the regular-ity of the heat load cycles, the cluster consistency is defined inthe context of this work, which calculates how often a certaintimestamp of the majority cluster was assigned compared tothe total number of data points of this timestamp. For exam-ple, if 18 of 20 data points are assigned to cluster A (whichtherefore forms the majority cluster), the cluster consistencyof this timestamp is 0.9. For instance, Fig. 2 shows hourlyaveraged heat load P for each day with k = 2.
3) Regression analysisThe cluster analysis groups different times of day based ontheir historical consumption. Using a simple linear regres-sion for each of the previously defined cluster, the usually de-manded thermal energy can now be predicted as a function ofthe outdoor temperature by calculating the linear dependenceof the independent variable Tout on the dependent variable P .In this way, it is modelled that the heat demand increases withdecreasing outdoor temperature because the indoor tempera-ture is to be kept constant (usually 20-22 °C).
Compared to similar implementations in other DHNs, the sim-ple linear regression already produces adequate results in ourstudies. This is because our data was recorded exclusivelyduring the heating season. To model all year round depen-dency between outdoor temperature and heat load, a piece-wise linear regression should be used to consider the domi-nating influence of tap water heating with increasing outdoortemperatures (Sandin et al., 2013).
4) Residual analysisUsing the regression analysis, a model that represents theDHS’s regular behaviour was learned for each of the clusters.By applying a suitable residual analysis, deviations caused bya fault or failure must now be recognised as an alert. To thebest of author’s knowledge, previous work is limited to themanually visual detection of deviations and did not discuss
4
EUROPEAN CONFERENCE OF THE PROGNOSTICS AND HEALTH MANAGEMENT SOCIETY 2021
how to automatically analyse the residuals.
A DHS is identified as potentially faulty if a relatively largenumber of consecutive observed values have relatively highresiduals measured by the error term ε. The error term’sbehaviour is heteroskedastic, which means its variance de-creases with increasing Tout, i.e. with higher values of theabscissa. For example, an error term of 2 kW is more signif-icant at an outdoor temperature of 15 °C than at 5 °C, sinceless energy is consumed at higher outdoor temperatures andthus the relative deviation is higher. Therefore, the error termε is set in relation to the expected value E and calculate thedeviation measure D.
D =ε
E(2)
A value of D = 0.3 therefore means that the actual heat de-mand deviates by 30% from the regression forecast. For anautomatic processing, let us assume that an algorithm anal-yses the successively arriving values for D. To increase therobustness of the deviation measure against single, short-termfluctuations of the sensor values, the deviation measurementsof the previous five hours are arithmetically averaged to D. IfD is outside the threshold values S1 (upper threshold) or S2
(lower threshold) for a longer period of timeAf , the system’scondition is interpreted as faulty. Different strategies can beused for the choice of the threshold values S1 and S2:
1. The upper and lower thresholds are defined a priori forall substations as a fixed value, e.g. S1 = S2 = 0.5.
2. Individual threshold values are learned for each DHS:(a) Uniform thresholds for all timestamps, or(b) individual thresholds for each timestamp.
The learning of DHS-specific threshold values (2a) has theadvantage that the accuracy of predictions can be significantlyimproved on the basis of historical data through learning ef-fects. If a DHS behaves relatively uncyclically, larger fluctu-ations in heat demand usually occur and the threshold valuesshould be chosen more broadly. When learning individualthresholds at the time stamp level (2b), it can also be con-sidered that certain times of the day are also more irregularin normal behaviour (e.g. when switching between day andnight mode).
Fig. 3 outlines the scenario proposed here. In the regressionanalysis on the left, the last five data points deviate stronglyfrom the regression line (red data points). In the residualsplot (right), the averaged deviation measure is now entered inthe chronological order and exceeds the previously describedthreshold value S1 from entry value 9 onwards. In this case,averaging delays the alarm slightly, but our experiments showthat attenuating random peaks makes the result of the MLmodel much more robust.
Finally, we define the threshold parameter Af for generat-
Figure 3. Regression and residual plot over time
ing an alert if the number of successive D values exceed thisthreshold. Typically, Af is DHS specific and for defining it,for instance, the maximum value from a validation data setcan be used. If no D are found on the validation data set, avalue can be defined based on expert knowledge or DHS withsimilar characteristics (load behaviour, DHS type, etc.) canbe used.
3.1.2. Results
In this section, our proposed approach is demonstrated on twoDHSs (A and B) for which a failure was encountered and amaintenance action was necessary. For demonstration pur-poses, two substations with an opposite pattern of normal be-haviour are selected. Fig. 4 shows the usual plant behaviouron a randomly selected day (11th February 2020).
Figure 4. Comparison of the two examples on 11 February
5

EUROPEAN CONFERENCE OF THE PROGNOSTICS AND HEALTH MANAGEMENT SOCIETY 2021
DHS A: circulator pump breakdownOn this substation, the circulation pump suddenly fails on21.03.2020, which was noticed by the customer the next daywhen the room temperature cooled down and was remediedby replacing the pump. This system does not heat domes-tic hot water. As can be seen in the upper time series inFig. 4, the substation behaves very steadily, with the excep-tion of the changes between day and night mode (between 4and 5 o’clock). This means that only a few consecutive ob-servation points with high error terms should be significantto detect a potential failure, which can also be seen in thehigh cluster consistency of 0.94. Fig. 5 shows the regressionanalysis for both clusters. From the pump defect onwards,the measured sensor values are far away from the predictedvalue, as can be seen from the red data points at the bottom ofthe diagram. Also, for the ”high load” cluster (red triangle)as well as for the ”low load” cluster (blue), individual datapoints with larger deviations from the regression line can berecognised. These can be explained by the changes betweenday and night mode, where small deviations occur for a shorttime.
Figure 5. Regression analysis for pump failure of DHS A
Due to the averaging of the deviation measure D (cf. Sect.3.1.1), these short-term deviations do not lead to any falsealarm, as can be seen in the upper time series in Fig. 6. In theentire time series, the algorithm only detects a deviation inthe period in which the circulator pump breaks down. The al-gorithm detects the failure already three hours after the pumphas broken down. This means that this fault can be detectedmuch earlier than it is noticed by the customer.
DHS B: leaking control valveSubstation B comprises a heating circuit for building heatingand domestic hot water heating including a buffer tank. On16.01.2020, the customer reports an insufficient temperatureof the tap water and the radiators. A close look at the sensordata reveals that the leakage already exists from 10.01.2020and thus a few days before the customer noticed it. Duringthe inspection by the service technician, a leaking screw con-nection on the control valve was identified and repaired onthe same day by replacing the seal. Based on the Davies-Bouldin Index, the heat load pattern of this DHS is divided
into three clusters (high, medium, low heat demand). In con-trast to A, the control signal of the volume flow control fluc-tuates strongly between the extreme states 100% (maximumflow) and 0% (no flow), which is expressed in a poor clusterconsistency of 0.57 (vs. 0.94 for DHS A). This is demon-strated in the lower time series in Fig. 4, which shows theperformance of a randomly selected day. The reason for theunsteady behaviour is that the buffer tank is heated with anadditional heat source, which massively affects the controlloop of the DHS controller.
The time series at the bottom in Fig. 6 shows the sensor valueP and the intervals identified as potentially faulty by the algo-rithm. It can be seen that many false alarms occur, e.g. when acertain level of P is predicted according to the learned model,but the DHS takes much less energy from the district heatingnetwork due to the additional heat source. For clarification,the length of the longest intervals leading to a false alarmis given (square brackets; in hours). To avoid false alarmscaused by unstable system behaviour, the threshold value Af
can be defined as in Sect. 3.1.1 before a signal is consideredas a fault. Even if the DHS failure can be noticed before thecustomer due to the long failure interval (130 hours), statisti-cal methods only work to a limited extent for DHS with suchunsteady behaviour.
3.1.3. Discussion
Our approach combines various methods from related liter-ature and extends them at different points, for example, theautomatic analysis of the regression result by using residualsanalysis. Compared to deep learning methods, which oftenlack explainability, the method proposed here makes it easierto understand the results of the algorithm. For example, inthe case of a failure notification, the expert can see from theregression plot why the algorithm is reporting an alarm. Inaddition to power P , the designed ML pipeline can also beapplied to all other sensors whose values correlate with theoutdoor temperature Tout. For example, if the heating sys-tem consists of several heating circuits, the power consump-tion can be analysed for each of them using the describedmethodology and, in the event of a fault, the affected part ofthe system can be diagnosed. The algorithm is also very ro-bust against the transmission failures between gateway andMDM described in Sect. 2.3, as it does not require a con-sistent recording of the sensor values to train the ML model,unlike representatives of time series analysis such as MatrixProfile which assume an equally sampled, complete time se-ries (Yeh et al., 2016). The cluster consistency can be usedas an indicator for a suitable hyperparameterization and theestimation of the analysis accuracy. This allows the identifi-cation of DHSs in advance where the algorithm is not suitableor where the length of the fault intervals must be significantlylonger to reliably detect a fault. On the other hand, DHSswith high cluster consistency should be given stricter thresh-
6

EUROPEAN CONFERENCE OF THE PROGNOSTICS AND HEALTH MANAGEMENT SOCIETY 2021
Figure 6. Comparison of the detected fault intervals for DHS A (top) and DHS B (bottom)
olds S1 and S2 to react to faults that have a lower impact onthe sensor values. Nevertheless, one focus of the further de-velopment of the approach should be an efficient and, in thebest case, an automated hyperparameter optimization (Feurer& Hutter, 2019). In this way, an optimal balance betweenrecall and precision can be found.
As the example of DHS B shows, our model currently doesnot consider the influence of additional heat sources, suchas solar thermal energy. In this case, the regression analy-sis could, for example, be supplemented by the independentvariable of solar radiation (multivariate regression). More-over, our case study also revealed the limitations of our MDMdata, e.g. for predicting the remaining useful life (RUL). Forexample, we could not detect any patterns in the data thatcould be used as indicator of minor leaks in advance of thefailure at DHS B. Thus, additional sensors (e.g. humidity)would have to be installed and made available to the MDMdata in order to be able to act in advance. Especially for thecase of DHS A, measuring current or vibration of the pumpcould be helpful to detect wear in advance (Fausing Olesen &Shaker, 2020).
3.2. Condition Monitoring
The objective of the machine learning pipeline presented inSect. 3.1 is to detect unexpected failures of the substationsand to initiate corrective maintenance as soon as possible.
These failures typically lead to an insufficient heat supply,which is noticed by the customer after some time due to thedrop in room temperature and a reduced tap water tempera-ture.
From the DHN operator’s point of view, however, it is alsoof great interest to work with low flow and temperature lev-els and to identify substations that cause a significant dropin overall grid efficiency and thus have a negative impacton its profitability. Up to now, a time-based maintenancestrategy (Selcuk, 2017) is applied in the examined DHN, inwhich all DHS are maintained once a year according to afixed scheme. This includes, among other things, a visualor functional check of the pipes, valves and the heat meter aswell as the cleaning of the strainers. The disadvantage of thisstrategy is that maintenance is done regardless of the condi-tion of the DHS and thus the remaining useful life cannot beoptimally utilised. In modern DHNs, the permanent and cen-tralised monitoring of the DHS offers new possibilities forcondition-based maintenance. The following subsections de-scribe two key performance indicators (KPI) for assessing theneed of maintenance of DHSs using condition monitoring.
3.2.1. High Return Temperature
Increased return temperatures often have a negative impact onthe overall efficiency of a DHN, especially when geothermalenergy is used. Analogous to Eq. 1, the output of a geother-
7
EUROPEAN CONFERENCE OF THE PROGNOSTICS AND HEALTH MANAGEMENT SOCIETY 2021
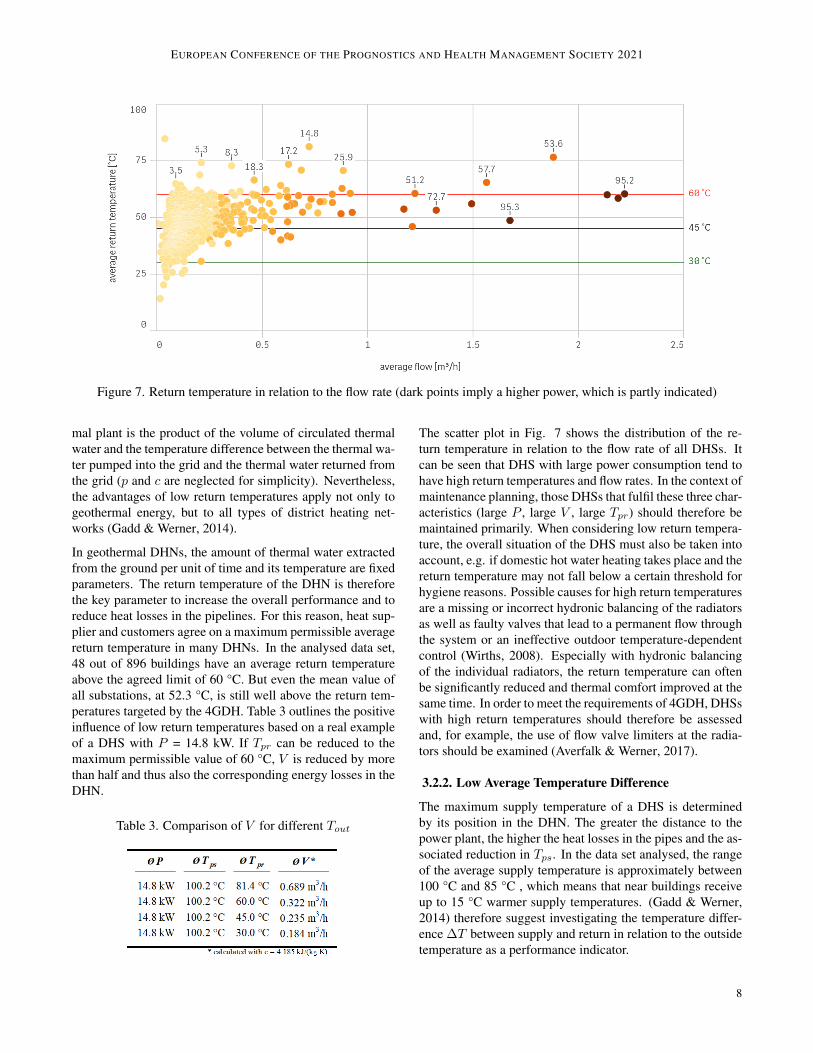
Figure 7. Return temperature in relation to the flow rate (dark points imply a higher power, which is partly indicated)
mal plant is the product of the volume of circulated thermalwater and the temperature difference between the thermal wa-ter pumped into the grid and the thermal water returned fromthe grid (p and c are neglected for simplicity). Nevertheless,the advantages of low return temperatures apply not only togeothermal energy, but to all types of district heating net-works (Gadd & Werner, 2014).
In geothermal DHNs, the amount of thermal water extractedfrom the ground per unit of time and its temperature are fixedparameters. The return temperature of the DHN is thereforethe key parameter to increase the overall performance and toreduce heat losses in the pipelines. For this reason, heat sup-plier and customers agree on a maximum permissible averagereturn temperature in many DHNs. In the analysed data set,48 out of 896 buildings have an average return temperatureabove the agreed limit of 60 °C. But even the mean value ofall substations, at 52.3 °C, is still well above the return tem-peratures targeted by the 4GDH. Table 3 outlines the positiveinfluence of low return temperatures based on a real exampleof a DHS with P = 14.8 kW. If Tpr can be reduced to themaximum permissible value of 60 °C, V is reduced by morethan half and thus also the corresponding energy losses in theDHN.
Table 3. Comparison of V for different Tout
The scatter plot in Fig. 7 shows the distribution of the re-turn temperature in relation to the flow rate of all DHSs. Itcan be seen that DHS with large power consumption tend tohave high return temperatures and flow rates. In the context ofmaintenance planning, those DHSs that fulfil these three char-acteristics (large P , large V , large Tpr) should therefore bemaintained primarily. When considering low return tempera-ture, the overall situation of the DHS must also be taken intoaccount, e.g. if domestic hot water heating takes place and thereturn temperature may not fall below a certain threshold forhygiene reasons. Possible causes for high return temperaturesare a missing or incorrect hydronic balancing of the radiatorsas well as faulty valves that lead to a permanent flow throughthe system or an ineffective outdoor temperature-dependentcontrol (Wirths, 2008). Especially with hydronic balancingof the individual radiators, the return temperature can oftenbe significantly reduced and thermal comfort improved at thesame time. In order to meet the requirements of 4GDH, DHSswith high return temperatures should therefore be assessedand, for example, the use of flow valve limiters at the radia-tors should be examined (Averfalk & Werner, 2017).
3.2.2. Low Average Temperature Difference
The maximum supply temperature of a DHS is determinedby its position in the DHN. The greater the distance to thepower plant, the higher the heat losses in the pipes and the as-sociated reduction in Tps. In the data set analysed, the rangeof the average supply temperature is approximately between100 °C and 85 °C , which means that near buildings receiveup to 15 °C warmer supply temperatures. (Gadd & Werner,2014) therefore suggest investigating the temperature differ-ence ∆T between supply and return in relation to the outsidetemperature as a performance indicator.
8
EUROPEAN CONFERENCE OF THE PROGNOSTICS AND HEALTH MANAGEMENT SOCIETY 2021
The achievable temperature difference of a DHS depends verymuch on the conditions of the heated building. The average∆T is 44 °C, with the best DHS reaching 67 °C and theworst only 15.2 °C. However, since no precise informationis available about the buildings (e.g. year of construction orheated living space) and the heating system, no target valuesfor well-functioning DHS can be given. (Gadd & Werner,2015) therefore propose a target value of 45 °C as a thresholdvalue for identifying installations to be inspected.
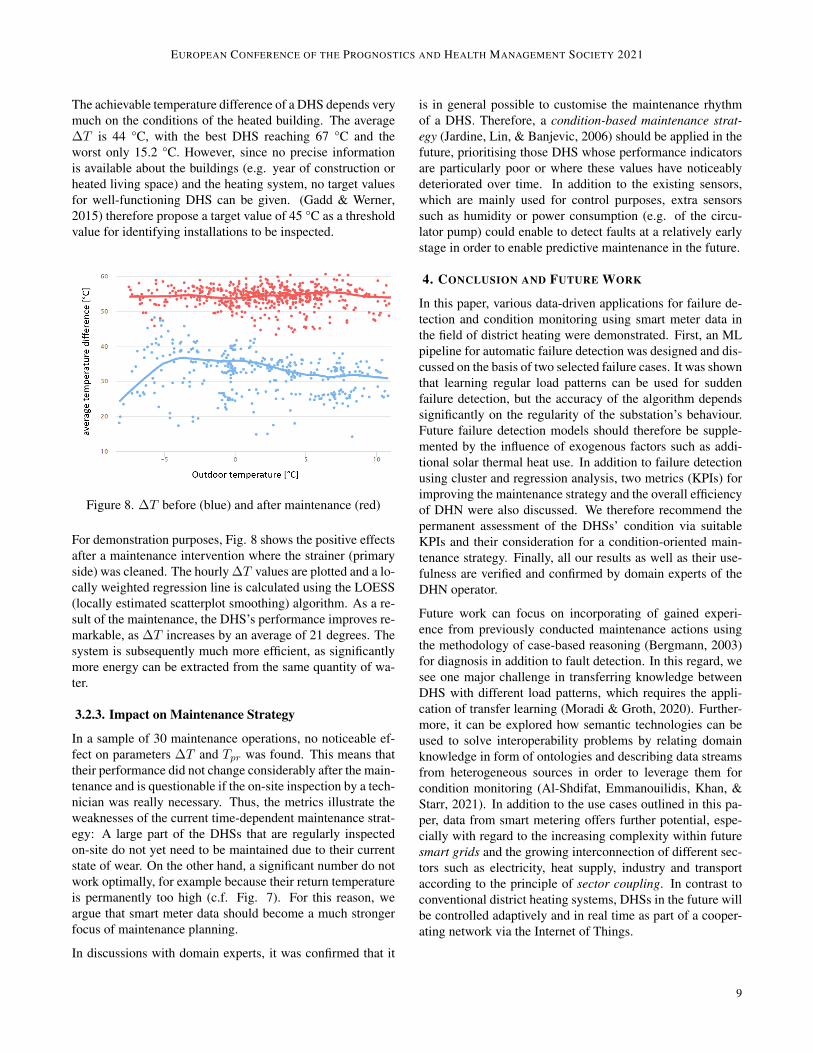
Figure 8. ∆T before (blue) and after maintenance (red)
For demonstration purposes, Fig. 8 shows the positive effectsafter a maintenance intervention where the strainer (primaryside) was cleaned. The hourly ∆T values are plotted and a lo-cally weighted regression line is calculated using the LOESS(locally estimated scatterplot smoothing) algorithm. As a re-sult of the maintenance, the DHS’s performance improves re-markable, as ∆T increases by an average of 21 degrees. Thesystem is subsequently much more efficient, as significantlymore energy can be extracted from the same quantity of wa-ter.
3.2.3. Impact on Maintenance Strategy
In a sample of 30 maintenance operations, no noticeable ef-fect on parameters ∆T and Tpr was found. This means thattheir performance did not change considerably after the main-tenance and is questionable if the on-site inspection by a tech-nician was really necessary. Thus, the metrics illustrate theweaknesses of the current time-dependent maintenance strat-egy: A large part of the DHSs that are regularly inspectedon-site do not yet need to be maintained due to their currentstate of wear. On the other hand, a significant number do notwork optimally, for example because their return temperatureis permanently too high (c.f. Fig. 7). For this reason, weargue that smart meter data should become a much strongerfocus of maintenance planning.
In discussions with domain experts, it was confirmed that it
is in general possible to customise the maintenance rhythmof a DHS. Therefore, a condition-based maintenance strat-egy (Jardine, Lin, & Banjevic, 2006) should be applied in thefuture, prioritising those DHS whose performance indicatorsare particularly poor or where these values have noticeablydeteriorated over time. In addition to the existing sensors,which are mainly used for control purposes, extra sensorssuch as humidity or power consumption (e.g. of the circu-lator pump) could enable to detect faults at a relatively earlystage in order to enable predictive maintenance in the future.
4. CONCLUSION AND FUTURE WORK
In this paper, various data-driven applications for failure de-tection and condition monitoring using smart meter data inthe field of district heating were demonstrated. First, an MLpipeline for automatic failure detection was designed and dis-cussed on the basis of two selected failure cases. It was shownthat learning regular load patterns can be used for suddenfailure detection, but the accuracy of the algorithm dependssignificantly on the regularity of the substation’s behaviour.Future failure detection models should therefore be supple-mented by the influence of exogenous factors such as addi-tional solar thermal heat use. In addition to failure detectionusing cluster and regression analysis, two metrics (KPIs) forimproving the maintenance strategy and the overall efficiencyof DHN were also discussed. We therefore recommend thepermanent assessment of the DHSs’ condition via suitableKPIs and their consideration for a condition-oriented main-tenance strategy. Finally, all our results as well as their use-fulness are verified and confirmed by domain experts of theDHN operator.
Future work can focus on incorporating of gained experi-ence from previously conducted maintenance actions usingthe methodology of case-based reasoning (Bergmann, 2003)for diagnosis in addition to fault detection. In this regard, wesee one major challenge in transferring knowledge betweenDHS with different load patterns, which requires the appli-cation of transfer learning (Moradi & Groth, 2020). Further-more, it can be explored how semantic technologies can beused to solve interoperability problems by relating domainknowledge in form of ontologies and describing data streamsfrom heterogeneous sources in order to leverage them forcondition monitoring (Al-Shdifat, Emmanouilidis, Khan, &Starr, 2021). In addition to the use cases outlined in this pa-per, data from smart metering offers further potential, espe-cially with regard to the increasing complexity within futuresmart grids and the growing interconnection of different sec-tors such as electricity, heat supply, industry and transportaccording to the principle of sector coupling. In contrast toconventional district heating systems, DHSs in the future willbe controlled adaptively and in real time as part of a cooper-ating network via the Internet of Things.
9
EUROPEAN CONFERENCE OF THE PROGNOSTICS AND HEALTH MANAGEMENT SOCIETY 2021
REFERENCES
Al-Shdifat, A., Emmanouilidis, C., Khan, M., & Starr, A. G.(2021). Ontology-based context modeling in physi-cal asset integrity management. Data-Driven Cogni-tive Manufacturing-Applications in Predictive Mainte-nance and Zero Defect Manufacturing.
Averfalk, H., & Werner, S. (2017). Essential improvements infuture district heating systems. Energy Procedia, 116,217–225.
Bergmann, R. (2003). Experience management: foundations,development methodology, and internet-based applica-tions (Vol. 2432). Springer.
Davies, D. L., & Bouldin, D. W. (1979). A cluster separationmeasure. IEEE transactions on Pattern Analysis andMachine Intelligence(2), 224–227.
European Union. (2018). Directive 2018/2002of the European Parliament and of the Coun-cil of 11 December 2018 amending Directive2012/27/EU on energy efficiency. Retrieved 2021-03-22, from https://eur-lex.europa.eu/legal-content/EN/TXT/HTML/?uri=CELEX:32018L2002
Fausing Olesen, J., & Shaker, H. R. (2020). Predictive main-tenance for pump systems and thermal power plants:State-of-the-art review, trends and challenges. Sensors,20(8).
Feurer, M., & Hutter, F. (2019). Hyperparameter opti-mization. In Automated machine learning (pp. 3–33).Springer, Cham.
Gadd, H., & Werner, S. (2014). Achieving low return tem-peratures from district heating substations. Applied En-ergy, 136, 59–67.
Gadd, H., & Werner, S. (2015). Fault detection in districtheating substations. Applied Energy, 157, 51–59.
Gianniou, P., Liu, X., Heller, A., Nielsen, P. S., & Rode, C.(2018). Clustering-based analysis for residential dis-trict heating data. Energy conversion and management,165, 840–850.
Jahn, M., Jentsch, M., Prause, C. R., Pramudianto, F., Al-Akkad, A., & Reiners, R. (2010). The energy awaresmart home. In 5th International Conference on FutureInformation Technology (pp. 1–8).
Jardine, A. K., Lin, D., & Banjevic, D. (2006). A review onmachinery diagnostics and prognostics implementingcondition-based maintenance. Mechanical systems andsignal processing, 20(7), 1483–1510.
Kiluk, S. (2012). Algorithmic acquisition of diagnostic pat-terns in district heating billing system. Applied Energy,91(1), 146–155.
Li, X., Bowers, C. P., & Schnier, T. (2009). Classification ofenergy consumption in buildings with outlier detection.IEEE Transactions on Industrial Electronics, 57(11),3639–3644.
Lund, H., Werner, S., Wiltshire, R., Svendsen, S., Thorsen,
J. E., Hvelplund, F., & Mathiesen, B. V. (2014). 4thGeneration District Heating (4GDH): Integrating smartthermal grids into future sustainable energy systems.Energy, 68, 1–11.
Mansson, S., Kallioniemi, P.-O. J., Sernhed, K., & Thern, M.(2018). A machine learning approach to fault detectionin district heating substations. Energy Procedia, 149,226–235.
Moradi, R., & Groth, K. (2020). On the application of trans-fer learning in prognostics and health management. An-nual Conference of the PHM Society, 12(1).
Pachauri, R. K., Allen, M. R., Barros, V. R., Broome, J.,Cramer, W., Christ, R., . . . others (2014). Climatechange 2014: synthesis report. Contribution of Work-ing Groups I, II and III to the fifth assessment report ofthe Intergovernmental Panel on Climate Change. In-tergovernmental Panel on Climate Change (IPCC).
Rybach, L. (2003). Geothermal energy: sustainability andthe environment. Geothermics, 32(4-6), 463–470.
Sandin, F., Gustafsson, J., & Delsing, J. (2013). Fault de-tection with hourly district energy data: Probabilis-tic methods and heuristics for automated detection andranking of anomalies. Svensk Fjarrvarme.
Sandin, F., Gustafsson, J., Delsing, J., & Eklund, R. (2012).Basic methods for automated fault detection and en-ergy data validation in existing district heating systems.In International Symposium on District Heating andCooling.
Sayegh, M., Danielewicz, J., Nannou, T., Miniewicz, M., Jad-wiszczak, P., Piekarska, K., & Jouhara, H. (2017).Trends of european research and development in dis-trict heating technologies. Renewable and SustainableEnergy Reviews, 68, 1183–1192.
Seem, J. E. (2005). Pattern recognition algorithm for deter-mining days of the week with similar energy consump-tion profiles. Energy and Buildings, 37(2), 127–139.
Seem, J. E. (2007). Using intelligent data analysis to de-tect abnormal energy consumption in buildings. Energyand Buildings, 39(1), 52–58.
Selcuk, S. (2017). Predictive maintenance, its implementa-tion and latest trends. Proceedings of the Institution ofMechanical Engineers, Part B: Journal of EngineeringManufacture, 231(9), 1670–1679.
Skagestad, B., & Mildenstein, P. (2002). District heating andcooling connection handbook. NOVEM, NetherlandsAgency for Energy and the Environment.
Sun, Q., Li, H., Ma, Z., Wang, C., Campillo, J., Zhang, Q.,. . . Guo, J. (2015). A comprehensive review of smartenergy meters in intelligent energy networks. IEEE In-ternet of Things Journal, 3(4), 464–479.
Wang, Y., Chen, Q., Hong, T., & Kang, C. (2018). Reviewof smart meter data analytics: Applications, method-ologies, and challenges. IEEE Transactions on SmartGrid, 10(3), 3125–3148.
10

EUROPEAN CONFERENCE OF THE PROGNOSTICS AND HEALTH MANAGEMENT SOCIETY 2021
Wirths, A. (2008). Einfluss der Netzrucklauftemperatur aufdie Effizienz von Fernwarmesystemen. In 13. DresdnerFernwarme-Kolloquium.
Xue, P., Zhou, Z., Fang, X., Chen, X., Liu, L., Liu, Y., & Liu,J. (2017). Fault detection and operation optimization indistrict heating substations based on data mining tech-niques. Applied Energy, 205, 926–940.
Yeh, C.-C. M., Zhu, Y., Ulanova, L., Begum, N., Ding, Y.,
Dau, H. A., . . . Keogh, E. (2016). Matrix profile i: allpairs similarity joins for time series: a unifying viewthat includes motifs, discords and shapelets. In 2016IEEE 16th International Conference on Data Mining(ICDM) (pp. 1317–1322).
Zheng, J., Gao, D. W., & Lin, L. (2013). Smart meters insmart grid: An overview. In 2013 IEEE Green Tech-nologies Conference (GreenTech) (pp. 57–64).
11