Embed Size (px)
Citation preview
INTERNATIONAL JOURNAL OF MULTIDISCIPLINARY SCIENCES AND ENGINEERING, VOL. 6, NO. 11, NOVEMBER 2015
[ISSN: 2045-7057] www.ijmse.org 12
Abstract—The main aim of this paper is to analyze belt drive
using Vibration Monitoring (VM) method. A belt drive
experimental setup was designed, fabricated and used for
experimental work to obtain realistic vibration data for different
working condition. Three different faults such as side-cut-out,
side-cut-in and loose & side-cut-out were created in the belt to
study and to understand the behavior of the system during
healthy and fault running condition. The experiments were
conducted for healthy and faulty conditions at different speeds,
lower speed of 540 rpm and at higher speed of 1000 rpm. The
vibration signals were acquire using NI DAQ system with
LabVIEW software. The results were presented for all the cases
in the comparative manner and discussed. From the results it is
found that the nature of belt fault has an effect on the
characteristic frequency at 1X running speed for both driver and
driven shaft. At the higher speeds the intensity of vibration is
more for various faults and will be increasing as the fault
increases.
Keywords—Rotating Machinery, Running Speed, V Belt and
Vibration Monitoring
I. INTRODUCTION
achines are very important in our lives and it simplifies
the work of people. Furthermore, now a day we use
machines to the maximum extent in our daily life activities.
The most important factor for the longevity of the machines is
maintenance of machines to work with maximum safely and
reliably. In addition, to do the maintenance it needs a
Abdul Rahman Al Bulushi is with the Caledonian College of Engineering,
Muscat, Oman, Phone: +968-95194391; fax: +968-24535675;
(Email: [email protected])
G.R. Rameshkumar is with the Caledonian College of Engineering,
Muscat, Oman. Phone: +968-958791917; fax: +968-24535675;
(Email: [email protected])
M. Lokesh is with ,Department of Mechanical Engineering, Mangalore
Institute of Technology And Engineering, Moodbidri, India, Phone:
+918748952450; (Email: [email protected])
professional person or mechanic who is having experience and
knowledge about the equipment or the machine to keep it in
good health condition. Any equipments/machines are needed
to be maintained at a certain point and that depend on the
behavior of the machine and health of the machine itself,
otherwise it may fail. Now a day worldwide engineers are
focusing on the design and the material used for developing
machine and schedule the maintenance tasks to make sure the
machine will work until the maximum time. Moreover, by
applying the concept of Condition Monitoring (CM)
techniques the running condition of the machine can be
analyzed. The Vibration Monitoring (VM) is the most
commonly used analysis method to analyze the running
condition of machine and it may provide the clear
identification of most of the faults in the machine.
Belt conveyors are the equipment widely used in coal mines
and other manufacturing industries, whose main components
are a number of idlers. The faults of belt conveyors can
directly influence the daily production. A fault diagnosis
method combining wavelet packet decomposition (WPD) and
support vector machine (SVM) is proposed [1] for monitoring
belt conveyors with the focus on the detection of idler faults.
The proposed fault diagnosis method is firstly tested on a test
bed and then an online monitoring and finally fault diagnosis
system is designed for belt conveyors. A multi sensor data
collection and Principal Component Analysis (PCA) are
proposed [2] to develop a framework for impeller fault
detection. Ahmed et al. [3] investigated the use of time domain
vibration features for detection and diagnosis of different
faults from a multi stage reciprocating compressor. Bajrić et al
[4] made an evaluation of vibration analysis techniques as a
method for the gear and gear pairs condition assessment.
In this paper an experimental investigation has been carried
out on belt drive experimental setup to analyze the behavior of
the system under various belt defects conditions. The results
were analyzed and presented.
Fault Diagnosis in Belts using Time and
Frequency based Signal Processing Techniques
M
1Abdulrahman Abdulshakoor Al Bulushi,
2G.R. Rameshkumar and
3M. Lokesha
1,2Department of Mechanical & Industrial Engineering, Caledonian College of Engineering, P.O. Box 2322, CPO 111,
Muscat, Sultanate of Oman 3Professor, Department of Mechanical Engineering, Mangalore Institute of Technology and Engineering, Moodbidri, India
INTERNATIONAL JOURNAL OF MULTIDISCIPLINARY SCIENCES AND ENGINEERING, VOL. 6, NO. 11, NOVEMBER 2015
[ISSN: 2045-7057] www.ijmse.org 13
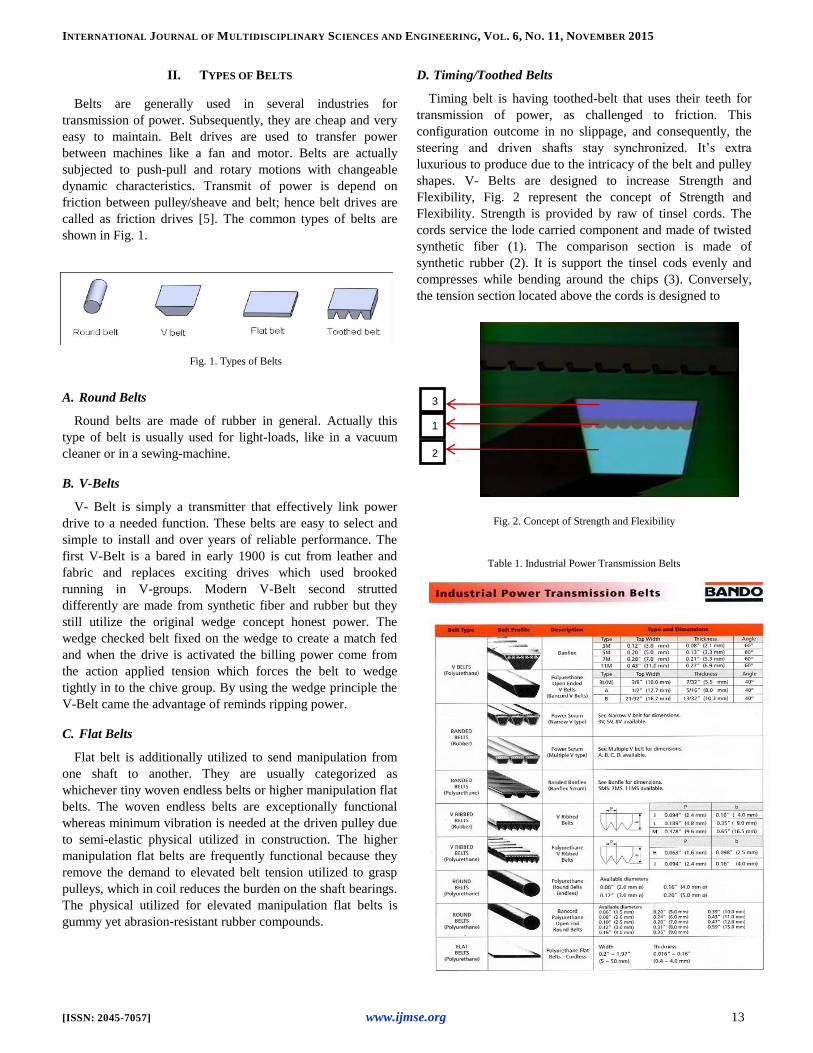
II. TYPES OF BELTS
Belts are generally used in several industries for
transmission of power. Subsequently, they are cheap and very
easy to maintain. Belt drives are used to transfer power
between machines like a fan and motor. Belts are actually
subjected to push-pull and rotary motions with changeable
dynamic characteristics. Transmit of power is depend on
friction between pulley/sheave and belt; hence belt drives are
called as friction drives [5]. The common types of belts are
shown in Fig. 1.
Fig. 1. Types of Belts
A. Round Belts
Round belts are made of rubber in general. Actually this
type of belt is usually used for light-loads, like in a vacuum
cleaner or in a sewing-machine.
B. V-Belts
V- Belt is simply a transmitter that effectively link power
drive to a needed function. These belts are easy to select and
simple to install and over years of reliable performance. The
first V-Belt is a bared in early 1900 is cut from leather and
fabric and replaces exciting drives which used brooked
running in V-groups. Modern V-Belt second strutted
differently are made from synthetic fiber and rubber but they
still utilize the original wedge concept honest power. The
wedge checked belt fixed on the wedge to create a match fed
and when the drive is activated the billing power come from
the action applied tension which forces the belt to wedge
tightly in to the chive group. By using the wedge principle the
V-Belt came the advantage of reminds ripping power.
C. Flat Belts
Flat belt is additionally utilized to send manipulation from
one shaft to another. They are usually categorized as
whichever tiny woven endless belts or higher manipulation flat
belts. The woven endless belts are exceptionally functional
whereas minimum vibration is needed at the driven pulley due
to semi-elastic physical utilized in construction. The higher
manipulation flat belts are frequently functional because they
remove the demand to elevated belt tension utilized to grasp
pulleys, which in coil reduces the burden on the shaft bearings.
The physical utilized for elevated manipulation flat belts is
gummy yet abrasion-resistant rubber compounds.
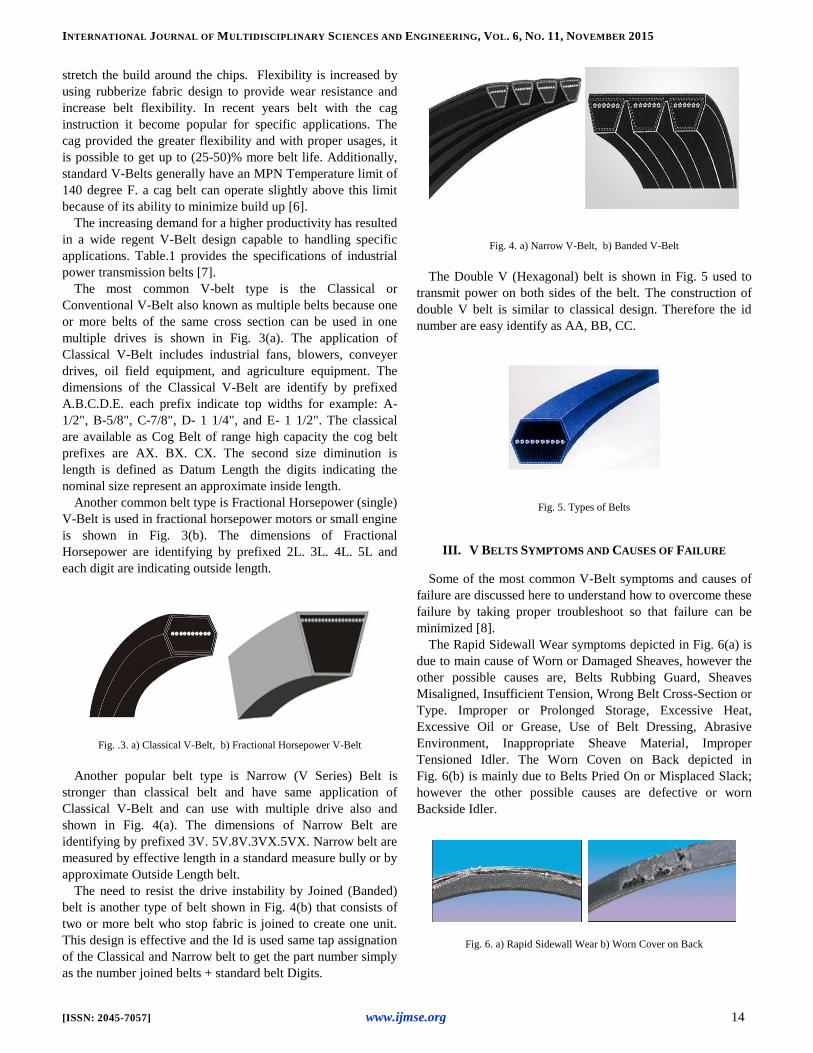
D. Timing/Toothed Belts
Timing belt is having toothed-belt that uses their teeth for
transmission of power, as challenged to friction. This
configuration outcome in no slippage, and consequently, the
steering and driven shafts stay synchronized. It’s extra
luxurious to produce due to the intricacy of the belt and pulley
shapes. V- Belts are designed to increase Strength and
Flexibility, Fig. 2 represent the concept of Strength and
Flexibility. Strength is provided by raw of tinsel cords. The
cords service the lode carried component and made of twisted
synthetic fiber (1). The comparison section is made of
synthetic rubber (2). It is support the tinsel cods evenly and
compresses while bending around the chips (3). Conversely,
the tension section located above the cords is designed to
Fig. 2. Concept of Strength and Flexibility
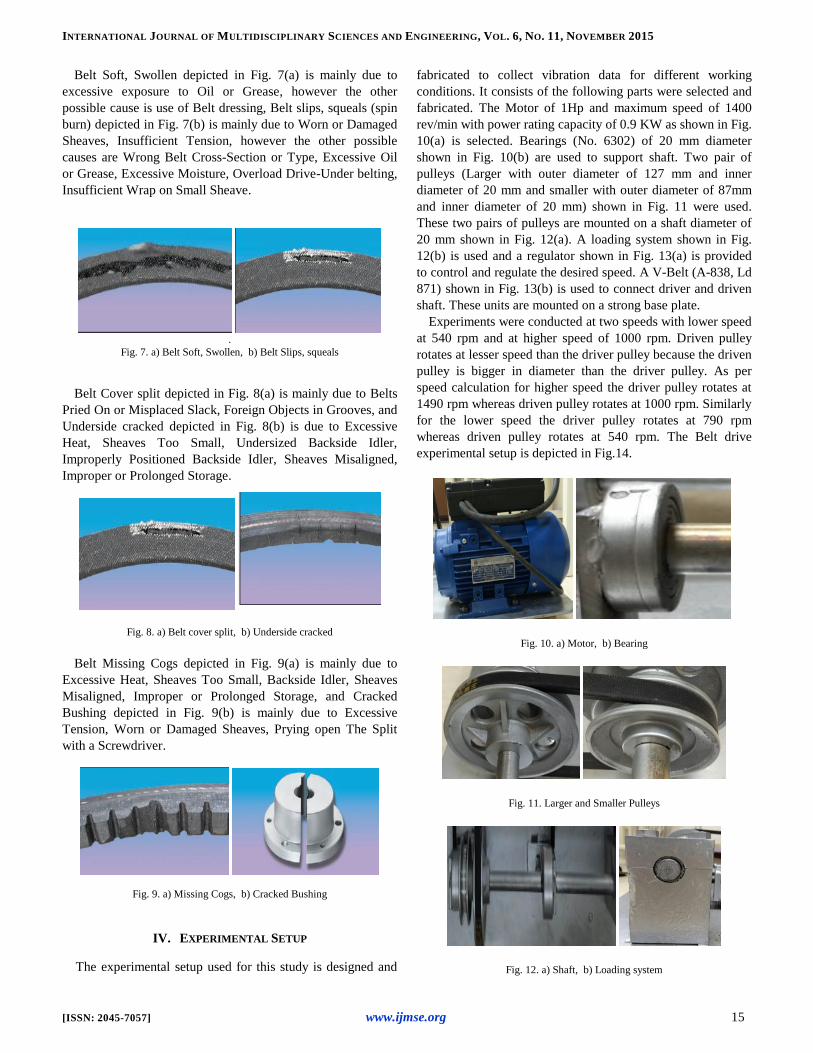
Table 1. Industrial Power Transmission Belts
1
3
2
INTERNATIONAL JOURNAL OF MULTIDISCIPLINARY SCIENCES AND ENGINEERING, VOL. 6, NO. 11, NOVEMBER 2015
[ISSN: 2045-7057] www.ijmse.org 14
stretch the build around the chips. Flexibility is increased by
using rubberize fabric design to provide wear resistance and
increase belt flexibility. In recent years belt with the cag
instruction it become popular for specific applications. The
cag provided the greater flexibility and with proper usages, it
is possible to get up to (25-50)% more belt life. Additionally,
standard V-Belts generally have an MPN Temperature limit of
140 degree F. a cag belt can operate slightly above this limit
because of its ability to minimize build up [6].
The increasing demand for a higher productivity has resulted
in a wide regent V-Belt design capable to handling specific
applications. Table.1 provides the specifications of industrial
power transmission belts [7].
The most common V-belt type is the Classical or
Conventional V-Belt also known as multiple belts because one
or more belts of the same cross section can be used in one
multiple drives is shown in Fig. 3(a). The application of
Classical V-Belt includes industrial fans, blowers, conveyer
drives, oil field equipment, and agriculture equipment. The
dimensions of the Classical V-Belt are identify by prefixed
A.B.C.D.E. each prefix indicate top widths for example: A-
1/2", B-5/8", C-7/8", D- 1 1/4", and E- 1 1/2". The classical
are available as Cog Belt of range high capacity the cog belt
prefixes are AX. BX. CX. The second size diminution is
length is defined as Datum Length the digits indicating the
nominal size represent an approximate inside length.
Another common belt type is Fractional Horsepower (single)
V-Belt is used in fractional horsepower motors or small engine
is shown in Fig. 3(b). The dimensions of Fractional
Horsepower are identifying by prefixed 2L. 3L. 4L. 5L and
each digit are indicating outside length.
Fig. .3. a) Classical V-Belt, b) Fractional Horsepower V-Belt
Another popular belt type is Narrow (V Series) Belt is
stronger than classical belt and have same application of
Classical V-Belt and can use with multiple drive also and
shown in Fig. 4(a). The dimensions of Narrow Belt are
identifying by prefixed 3V. 5V.8V.3VX.5VX. Narrow belt are
measured by effective length in a standard measure bully or by
approximate Outside Length belt.
The need to resist the drive instability by Joined (Banded)
belt is another type of belt shown in Fig. 4(b) that consists of
two or more belt who stop fabric is joined to create one unit.
This design is effective and the Id is used same tap assignation
of the Classical and Narrow belt to get the part number simply
as the number joined belts + standard belt Digits.
Fig. 4. a) Narrow V-Belt, b) Banded V-Belt
The Double V (Hexagonal) belt is shown in Fig. 5 used to
transmit power on both sides of the belt. The construction of
double V belt is similar to classical design. Therefore the id
number are easy identify as AA, BB, CC.
Fig. 5. Types of Belts
III. V BELTS SYMPTOMS AND CAUSES OF FAILURE
Some of the most common V-Belt symptoms and causes of
failure are discussed here to understand how to overcome these
failure by taking proper troubleshoot so that failure can be
minimized [8].
The Rapid Sidewall Wear symptoms depicted in Fig. 6(a) is
due to main cause of Worn or Damaged Sheaves, however the
other possible causes are, Belts Rubbing Guard, Sheaves
Misaligned, Insufficient Tension, Wrong Belt Cross-Section or
Type. Improper or Prolonged Storage, Excessive Heat,
Excessive Oil or Grease, Use of Belt Dressing, Abrasive
Environment, Inappropriate Sheave Material, Improper
Tensioned Idler. The Worn Coven on Back depicted in
Fig. 6(b) is mainly due to Belts Pried On or Misplaced Slack;
however the other possible causes are defective or worn
Backside Idler.
Fig. 6. a) Rapid Sidewall Wear b) Worn Cover on Back
INTERNATIONAL JOURNAL OF MULTIDISCIPLINARY SCIENCES AND ENGINEERING, VOL. 6, NO. 11, NOVEMBER 2015
[ISSN: 2045-7057] www.ijmse.org 15
Belt Soft, Swollen depicted in Fig. 7(a) is mainly due to
excessive exposure to Oil or Grease, however the other
possible cause is use of Belt dressing, Belt slips, squeals (spin
burn) depicted in Fig. 7(b) is mainly due to Worn or Damaged
Sheaves, Insufficient Tension, however the other possible
causes are Wrong Belt Cross-Section or Type, Excessive Oil
or Grease, Excessive Moisture, Overload Drive-Under belting,
Insufficient Wrap on Small Sheave.
.
Fig. 7. a) Belt Soft, Swollen, b) Belt Slips, squeals
Belt Cover split depicted in Fig. 8(a) is mainly due to Belts
Pried On or Misplaced Slack, Foreign Objects in Grooves, and
Underside cracked depicted in Fig. 8(b) is due to Excessive
Heat, Sheaves Too Small, Undersized Backside Idler,
Improperly Positioned Backside Idler, Sheaves Misaligned,
Improper or Prolonged Storage.
Fig. 8. a) Belt cover split, b) Underside cracked
Belt Missing Cogs depicted in Fig. 9(a) is mainly due to
Excessive Heat, Sheaves Too Small, Backside Idler, Sheaves
Misaligned, Improper or Prolonged Storage, and Cracked
Bushing depicted in Fig. 9(b) is mainly due to Excessive
Tension, Worn or Damaged Sheaves, Prying open The Split
with a Screwdriver.
Fig. 9. a) Missing Cogs, b) Cracked Bushing
IV. EXPERIMENTAL SETUP
The experimental setup used for this study is designed and
fabricated to collect vibration data for different working
conditions. It consists of the following parts were selected and
fabricated. The Motor of 1Hp and maximum speed of 1400
rev/min with power rating capacity of 0.9 KW as shown in Fig.
10(a) is selected. Bearings (No. 6302) of 20 mm diameter
shown in Fig. 10(b) are used to support shaft. Two pair of
pulleys (Larger with outer diameter of 127 mm and inner
diameter of 20 mm and smaller with outer diameter of 87mm
and inner diameter of 20 mm) shown in Fig. 11 were used.
These two pairs of pulleys are mounted on a shaft diameter of
20 mm shown in Fig. 12(a). A loading system shown in Fig.
12(b) is used and a regulator shown in Fig. 13(a) is provided
to control and regulate the desired speed. A V-Belt (A-838, Ld
871) shown in Fig. 13(b) is used to connect driver and driven
shaft. These units are mounted on a strong base plate.
Experiments were conducted at two speeds with lower speed
at 540 rpm and at higher speed of 1000 rpm. Driven pulley
rotates at lesser speed than the driver pulley because the driven
pulley is bigger in diameter than the driver pulley. As per
speed calculation for higher speed the driver pulley rotates at
1490 rpm whereas driven pulley rotates at 1000 rpm. Similarly
for the lower speed the driver pulley rotates at 790 rpm
whereas driven pulley rotates at 540 rpm. The Belt drive
experimental setup is depicted in Fig.14.
Fig. 10. a) Motor, b) Bearing
Fig. 11. Larger and Smaller Pulleys
Fig. 12. a) Shaft, b) Loading system
INTERNATIONAL JOURNAL OF MULTIDISCIPLINARY SCIENCES AND ENGINEERING, VOL. 6, NO. 11, NOVEMBER 2015
[ISSN: 2045-7057] www.ijmse.org 16
Fig. 13. a) Speed Regulator, b) V-Belt
LabVIEW7® (Laboratory Virtual Instrument Electronic
Workbench NI-National Instrument) application software
model, developed (LabVIEWTM
7, 2003) with FFT analyzer is
used to acquire vibration signals data through four channel
sensor input module Data Acquisition Device (NI-DAQ-
National Instruments-NI SCXI-1000 chassis through SCXI-
1530-channel 0, SCXI-1530-channel 1 and SCXI-1530-
channel 2). The photographic view of LabVIEW® software
integrated with DAQ module and computer is shown in Fig.
15.
Fig. 14. Belt drive experimental setup
Fig. 15. LabVIEW® software integrated with DAQ module
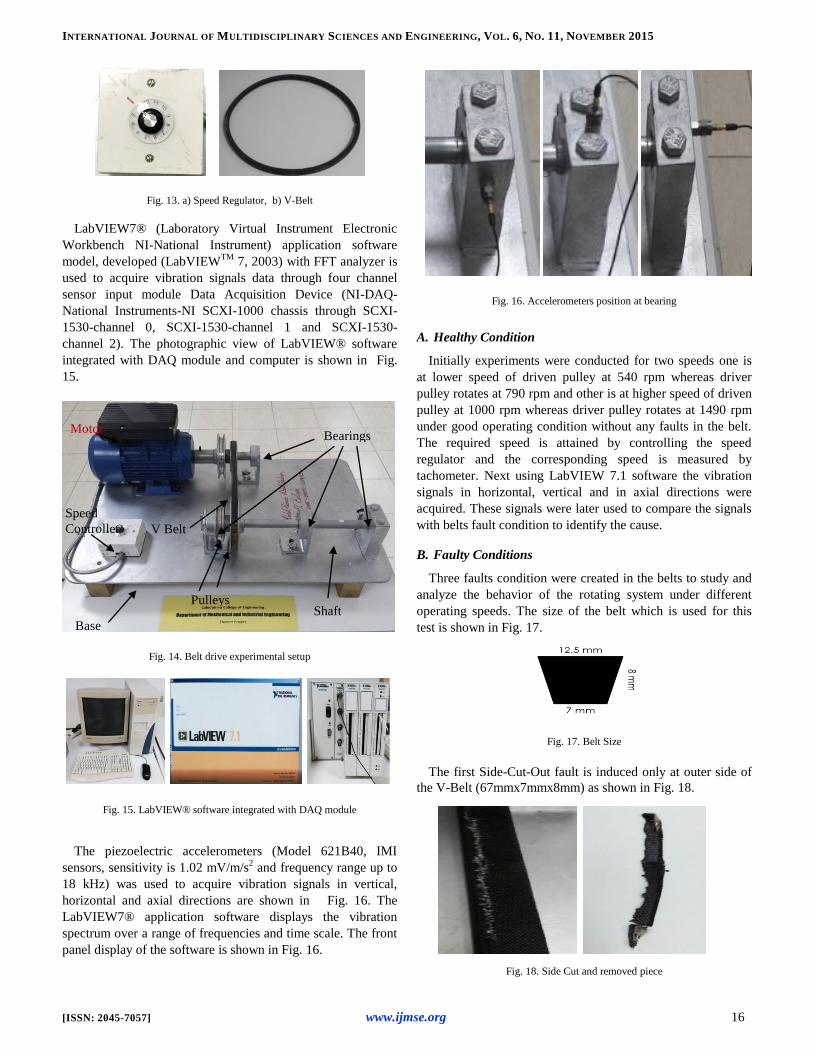
The piezoelectric accelerometers (Model 621B40, IMI
sensors, sensitivity is 1.02 mV/m/s2 and frequency range up to
18 kHz) was used to acquire vibration signals in vertical,
horizontal and axial directions are shown in Fig. 16. The
LabVIEW7® application software displays the vibration
spectrum over a range of frequencies and time scale. The front
panel display of the software is shown in Fig. 16.
Fig. 16. Accelerometers position at bearing
A. Healthy Condition
Initially experiments were conducted for two speeds one is
at lower speed of driven pulley at 540 rpm whereas driver
pulley rotates at 790 rpm and other is at higher speed of driven
pulley at 1000 rpm whereas driver pulley rotates at 1490 rpm
under good operating condition without any faults in the belt.
The required speed is attained by controlling the speed
regulator and the corresponding speed is measured by
tachometer. Next using LabVIEW 7.1 software the vibration
signals in horizontal, vertical and in axial directions were
acquired. These signals were later used to compare the signals
with belts fault condition to identify the cause.
B. Faulty Conditions
Three faults condition were created in the belts to study and
analyze the behavior of the rotating system under different
operating speeds. The size of the belt which is used for this
test is shown in Fig. 17.
Fig. 17. Belt Size
The first Side-Cut-Out fault is induced only at outer side of
the V-Belt (67mmx7mmx8mm) as shown in Fig. 18.
Fig. 18. Side Cut and removed piece
Speed
Controller
Base
Motor Bearings
Shaft
V Belt
Pulleys
INTERNATIONAL JOURNAL OF MULTIDISCIPLINARY SCIENCES AND ENGINEERING, VOL. 6, NO. 11, NOVEMBER 2015
[ISSN: 2045-7057] www.ijmse.org 17
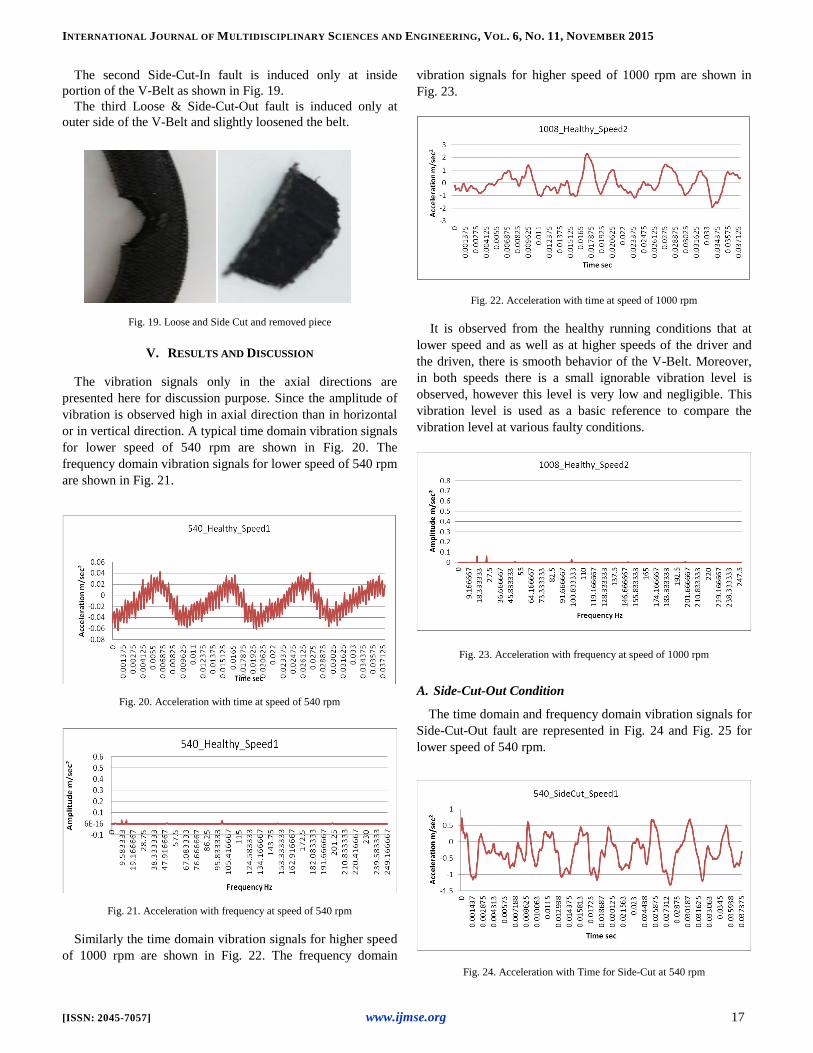
The second Side-Cut-In fault is induced only at inside
portion of the V-Belt as shown in Fig. 19.
The third Loose & Side-Cut-Out fault is induced only at
outer side of the V-Belt and slightly loosened the belt.
Fig. 19. Loose and Side Cut and removed piece
V. RESULTS AND DISCUSSION
The vibration signals only in the axial directions are
presented here for discussion purpose. Since the amplitude of
vibration is observed high in axial direction than in horizontal
or in vertical direction. A typical time domain vibration signals
for lower speed of 540 rpm are shown in Fig. 20. The
frequency domain vibration signals for lower speed of 540 rpm
are shown in Fig. 21.
Fig. 20. Acceleration with time at speed of 540 rpm
Fig. 21. Acceleration with frequency at speed of 540 rpm
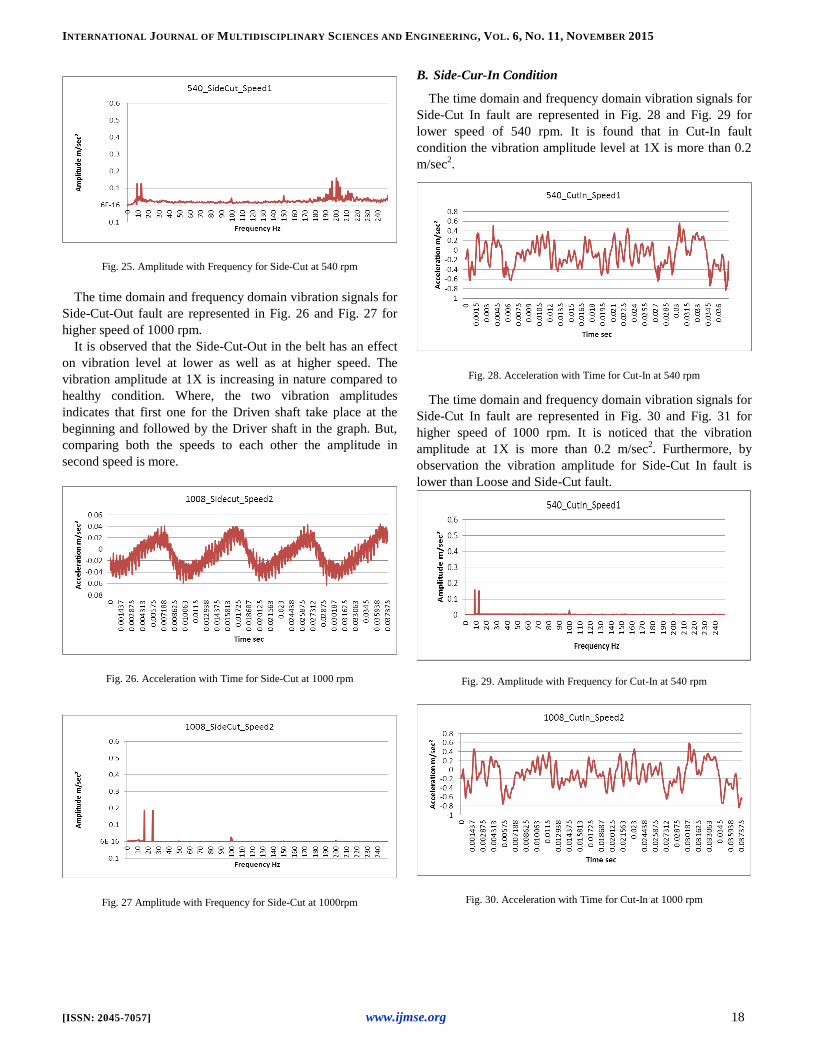
Similarly the time domain vibration signals for higher speed
of 1000 rpm are shown in Fig. 22. The frequency domain
vibration signals for higher speed of 1000 rpm are shown in
Fig. 23.
Fig. 22. Acceleration with time at speed of 1000 rpm
It is observed from the healthy running conditions that at
lower speed and as well as at higher speeds of the driver and
the driven, there is smooth behavior of the V-Belt. Moreover,
in both speeds there is a small ignorable vibration level is
observed, however this level is very low and negligible. This
vibration level is used as a basic reference to compare the
vibration level at various faulty conditions.
Fig. 23. Acceleration with frequency at speed of 1000 rpm
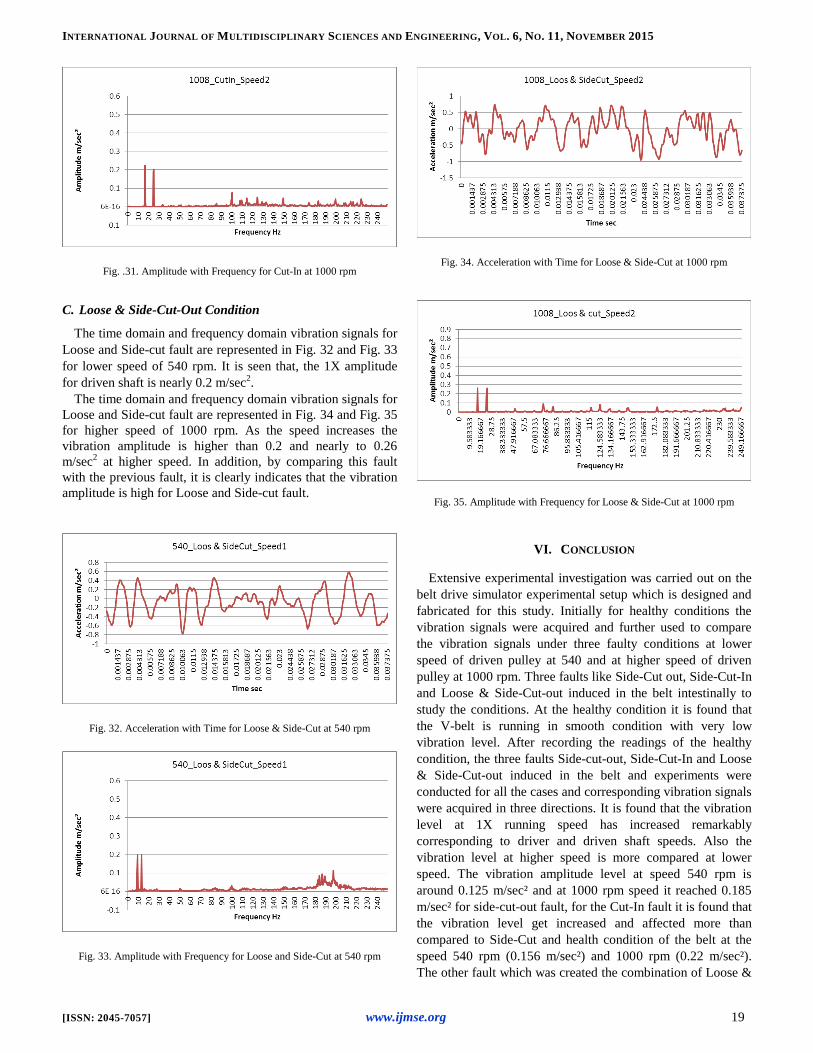
A. Side-Cut-Out Condition
The time domain and frequency domain vibration signals for
Side-Cut-Out fault are represented in Fig. 24 and Fig. 25 for
lower speed of 540 rpm.
Fig. 24. Acceleration with Time for Side-Cut at 540 rpm
INTERNATIONAL JOURNAL OF MULTIDISCIPLINARY SCIENCES AND ENGINEERING, VOL. 6, NO. 11, NOVEMBER 2015
[ISSN: 2045-7057] www.ijmse.org 18
Fig. 25. Amplitude with Frequency for Side-Cut at 540 rpm
The time domain and frequency domain vibration signals for
Side-Cut-Out fault are represented in Fig. 26 and Fig. 27 for
higher speed of 1000 rpm.
It is observed that the Side-Cut-Out in the belt has an effect
on vibration level at lower as well as at higher speed. The
vibration amplitude at 1X is increasing in nature compared to
healthy condition. Where, the two vibration amplitudes
indicates that first one for the Driven shaft take place at the
beginning and followed by the Driver shaft in the graph. But,
comparing both the speeds to each other the amplitude in
second speed is more.
Fig. 26. Acceleration with Time for Side-Cut at 1000 rpm
Fig. 27 Amplitude with Frequency for Side-Cut at 1000rpm
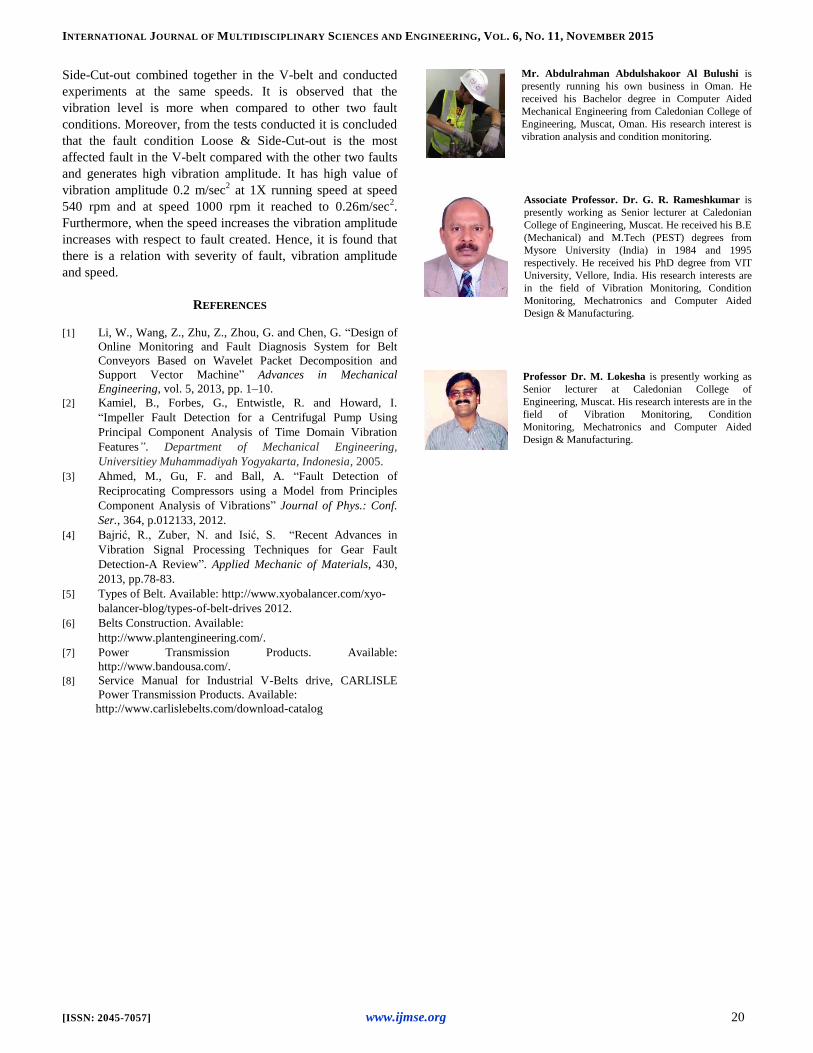
B. Side-Cur-In Condition
The time domain and frequency domain vibration signals for
Side-Cut In fault are represented in Fig. 28 and Fig. 29 for
lower speed of 540 rpm. It is found that in Cut-In fault
condition the vibration amplitude level at 1X is more than 0.2
m/sec2.
Fig. 28. Acceleration with Time for Cut-In at 540 rpm
The time domain and frequency domain vibration signals for
Side-Cut In fault are represented in Fig. 30 and Fig. 31 for
higher speed of 1000 rpm. It is noticed that the vibration
amplitude at 1X is more than 0.2 m/sec2. Furthermore, by
observation the vibration amplitude for Side-Cut In fault is
lower than Loose and Side-Cut fault.
Fig. 29. Amplitude with Frequency for Cut-In at 540 rpm
Fig. 30. Acceleration with Time for Cut-In at 1000 rpm
INTERNATIONAL JOURNAL OF MULTIDISCIPLINARY SCIENCES AND ENGINEERING, VOL. 6, NO. 11, NOVEMBER 2015
[ISSN: 2045-7057] www.ijmse.org 19
Fig. .31. Amplitude with Frequency for Cut-In at 1000 rpm
C. Loose & Side-Cut-Out Condition
The time domain and frequency domain vibration signals for
Loose and Side-cut fault are represented in Fig. 32 and Fig. 33
for lower speed of 540 rpm. It is seen that, the 1X amplitude
for driven shaft is nearly 0.2 m/sec2.
The time domain and frequency domain vibration signals for
Loose and Side-cut fault are represented in Fig. 34 and Fig. 35
for higher speed of 1000 rpm. As the speed increases the
vibration amplitude is higher than 0.2 and nearly to 0.26
m/sec2 at higher speed. In addition, by comparing this fault
with the previous fault, it is clearly indicates that the vibration
amplitude is high for Loose and Side-cut fault.
Fig. 32. Acceleration with Time for Loose & Side-Cut at 540 rpm
Fig. 33. Amplitude with Frequency for Loose and Side-Cut at 540 rpm
Fig. 34. Acceleration with Time for Loose & Side-Cut at 1000 rpm
Fig. 35. Amplitude with Frequency for Loose & Side-Cut at 1000 rpm
VI. CONCLUSION
Extensive experimental investigation was carried out on the
belt drive simulator experimental setup which is designed and
fabricated for this study. Initially for healthy conditions the
vibration signals were acquired and further used to compare
the vibration signals under three faulty conditions at lower
speed of driven pulley at 540 and at higher speed of driven
pulley at 1000 rpm. Three faults like Side-Cut out, Side-Cut-In
and Loose & Side-Cut-out induced in the belt intestinally to
study the conditions. At the healthy condition it is found that
the V-belt is running in smooth condition with very low
vibration level. After recording the readings of the healthy
condition, the three faults Side-cut-out, Side-Cut-In and Loose
& Side-Cut-out induced in the belt and experiments were
conducted for all the cases and corresponding vibration signals
were acquired in three directions. It is found that the vibration
level at 1X running speed has increased remarkably
corresponding to driver and driven shaft speeds. Also the
vibration level at higher speed is more compared at lower
speed. The vibration amplitude level at speed 540 rpm is
around 0.125 m/sec² and at 1000 rpm speed it reached 0.185
m/sec² for side-cut-out fault, for the Cut-In fault it is found that
the vibration level get increased and affected more than
compared to Side-Cut and health condition of the belt at the
speed 540 rpm (0.156 m/sec²) and 1000 rpm (0.22 m/sec²).
The other fault which was created the combination of Loose &
INTERNATIONAL JOURNAL OF MULTIDISCIPLINARY SCIENCES AND ENGINEERING, VOL. 6, NO. 11, NOVEMBER 2015
[ISSN: 2045-7057] www.ijmse.org 20
Side-Cut-out combined together in the V-belt and conducted
experiments at the same speeds. It is observed that the
vibration level is more when compared to other two fault
conditions. Moreover, from the tests conducted it is concluded
that the fault condition Loose & Side-Cut-out is the most
affected fault in the V-belt compared with the other two faults
and generates high vibration amplitude. It has high value of
vibration amplitude 0.2 m/sec2 at 1X running speed at speed
540 rpm and at speed 1000 rpm it reached to 0.26m/sec2.
Furthermore, when the speed increases the vibration amplitude
increases with respect to fault created. Hence, it is found that
there is a relation with severity of fault, vibration amplitude
and speed.
REFERENCES
[1] Li, W., Wang, Z., Zhu, Z., Zhou, G. and Chen, G. “Design of
Online Monitoring and Fault Diagnosis System for Belt
Conveyors Based on Wavelet Packet Decomposition and
Support Vector Machine” Advances in Mechanical
Engineering, vol. 5, 2013, pp. 1–10.
[2] Kamiel, B., Forbes, G., Entwistle, R. and Howard, I.
“Impeller Fault Detection for a Centrifugal Pump Using
Principal Component Analysis of Time Domain Vibration
Features”. Department of Mechanical Engineering,
Universitiey Muhammadiyah Yogyakarta, Indonesia, 2005.
[3] Ahmed, M., Gu, F. and Ball, A. “Fault Detection of
Reciprocating Compressors using a Model from Principles
Component Analysis of Vibrations” Journal of Phys.: Conf.
Ser., 364, p.012133, 2012.
[4] Bajrić, R., Zuber, N. and Isić, S. “Recent Advances in
Vibration Signal Processing Techniques for Gear Fault
Detection-A Review”. Applied Mechanic of Materials, 430,
2013, pp.78-83.
[5] Types of Belt. Available: http://www.xyobalancer.com/xyo-
balancer-blog/types-of-belt-drives 2012.
[6] Belts Construction. Available:
http://www.plantengineering.com/.
[7] Power Transmission Products. Available:
http://www.bandousa.com/.
[8] Service Manual for Industrial V-Belts drive, CARLISLE
Power Transmission Products. Available:
http://www.carlislebelts.com/download-catalog
Mr. Abdulrahman Abdulshakoor Al Bulushi is
presently running his own business in Oman. He
received his Bachelor degree in Computer Aided
Mechanical Engineering from Caledonian College of
Engineering, Muscat, Oman. His research interest is
vibration analysis and condition monitoring.
Associate Professor. Dr. G. R. Rameshkumar is
presently working as Senior lecturer at Caledonian
College of Engineering, Muscat. He received his B.E
(Mechanical) and M.Tech (PEST) degrees from
Mysore University (India) in 1984 and 1995
respectively. He received his PhD degree from VIT
University, Vellore, India. His research interests are
in the field of Vibration Monitoring, Condition
Monitoring, Mechatronics and Computer Aided
Design & Manufacturing.
Professor Dr. M. Lokesha is presently working as
Senior lecturer at Caledonian College of
Engineering, Muscat. His research interests are in the
field of Vibration Monitoring, Condition
Monitoring, Mechatronics and Computer Aided
Design & Manufacturing.