Embed Size (px)
Citation preview
Fault tolerant control in marine energy systems: A wave energy
perspective
Maynooth Wave Energy Workshop
20th January 2017
RON J PATTON
School of Engineering & Computer Science
University of Hull
Thanks to Bingyong Guo for great help & advice
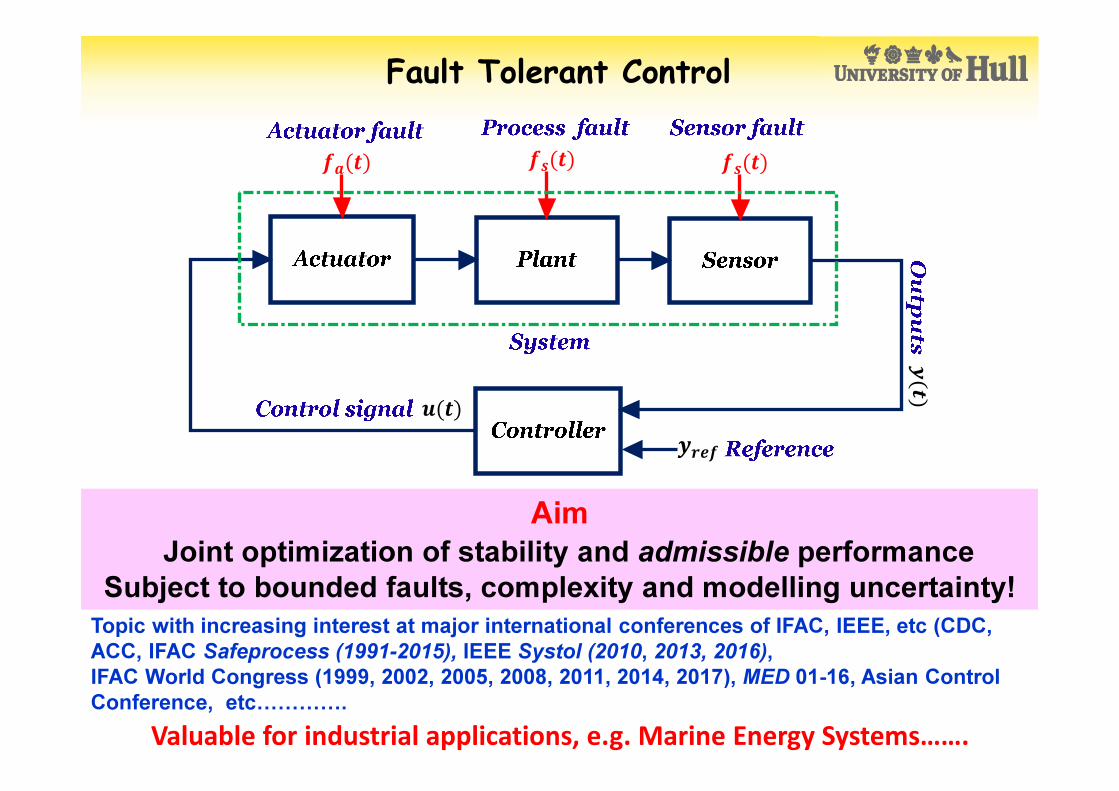
Aim
Joint optimization of stability and admissible performance
Subject to bounded faults, complexity and modelling uncertainty!
Topic with increasing interest at major international conferences of IFAC, IEEE, etc (CDC,
ACC, IFAC Safeprocess (1991-2015), IEEE Systol (2010, 2013, 2016),
IFAC World Congress (1999, 2002, 2005, 2008, 2011, 2014, 2017), MED 01-16, Asian Control
Conference, etc)))).
Fault Tolerant Control
Valuable for industrial applications, e.g. Marine Energy Systems…….
��(�)
����
�(�)
�(�)
��(�) �
�(�)
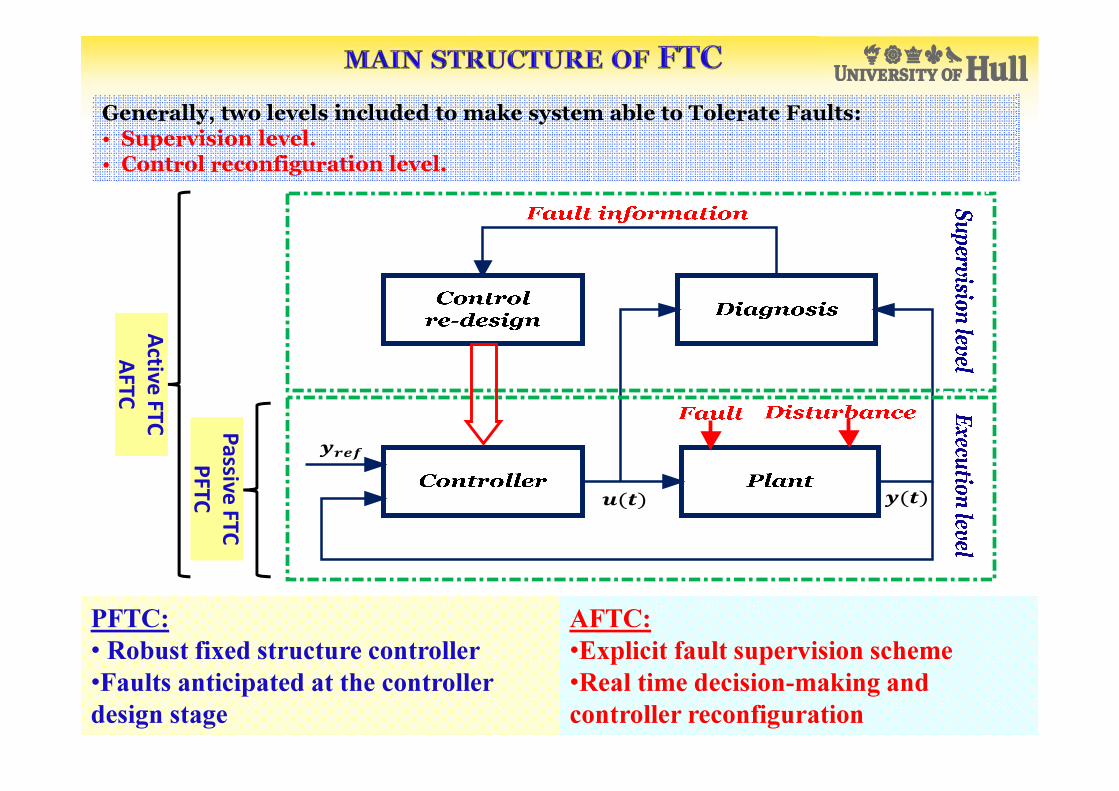
Generally, two levels included to make system able to Tolerate Faults:• Supervision level.• Control reconfiguration level.
����
�(�) �(�)
Pa
ssiv
e F
TC
PF
TC
Activ
e F
TC
AF
TC
PFTC:
• Robust fixed structure controller
•Faults anticipated at the controller
design stage
AFTC:
•Explicit fault supervision scheme
•Real time decision-making and
controller reconfiguration
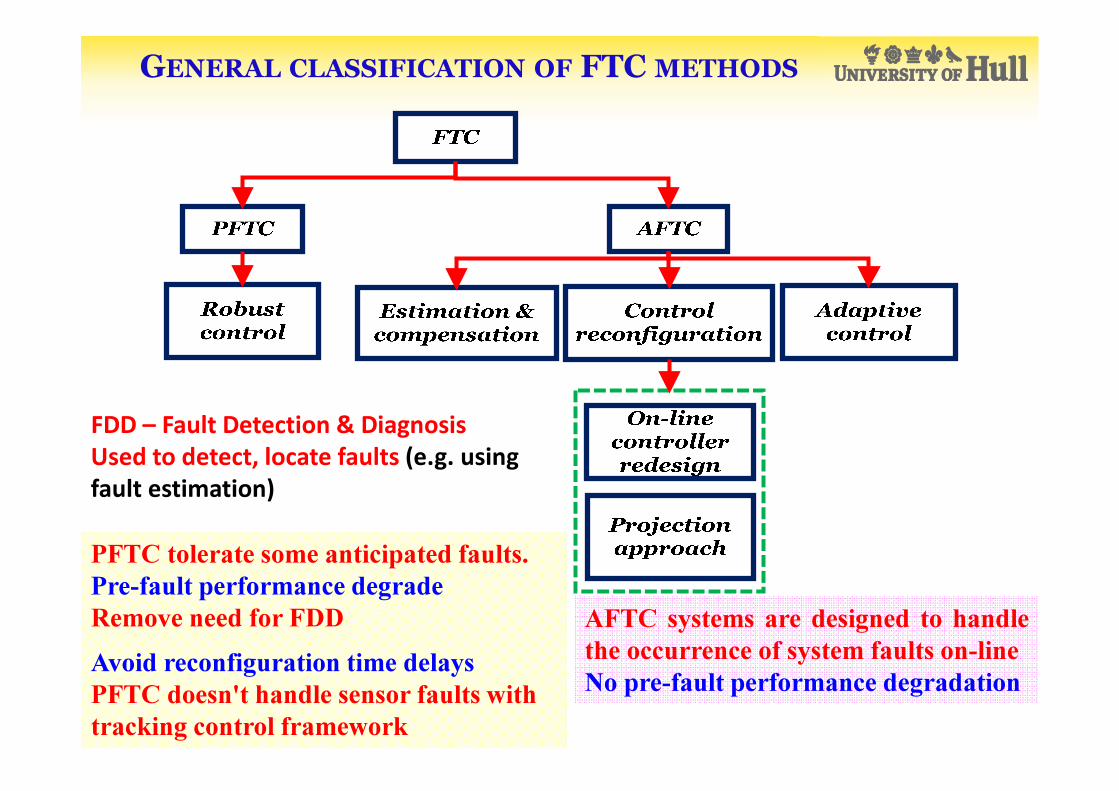
GENERAL CLASSIFICATION OF FTC METHODS
PFTC tolerate some anticipated faults.
Pre-fault performance degrade
Remove need for FDD
Avoid reconfiguration time delays
PFTC doesn't handle sensor faults with
tracking control framework
AFTC systems are designed to handle
the occurrence of system faults on-line
No pre-fault performance degradation
FDD – Fault Detection & Diagnosis
Used to detect, locate faults (e.g. using
fault estimation)

Sensors, actuators and reliabilitySENSOR FAULTS
• Generator speed (scaling), Rotor speed (scaling), Torque (offset), Low speed
shaft position encoder (bit error), Yaw misalignment (stuck drive, wind vane
[nacelle/hub, along blade / Lidar]), Accelerometer (offsets), Loads & Deflections
(blade root bending moment scaling), Wind speed (anemometer [nacelle/hub] /
along blade / Lidar), Pitch angle sensors (stuck), Blade root bending moments
(scaling)
ACTUATOR FAULTS
• Pitch actuators (leakage, air content, stuck actuation), Generator/power
converter, Yaw motor.
Faults may result in power reduction, down-time, increased O&M cost
FAULT CONSEQUENCES
Pitch actuator fault - Pitch feathering vital for safety; “Pitch runaway” often
drives extreme loads.
Torque actuator fault - Loss of load, turbine shut down using pitch; power surge;
gearbox overload
Yaw actuator failure:
• Turbine shuts down – not urgent, could even wait until yaw
misalignment is excessive.
FTC Research on Wind Turbines
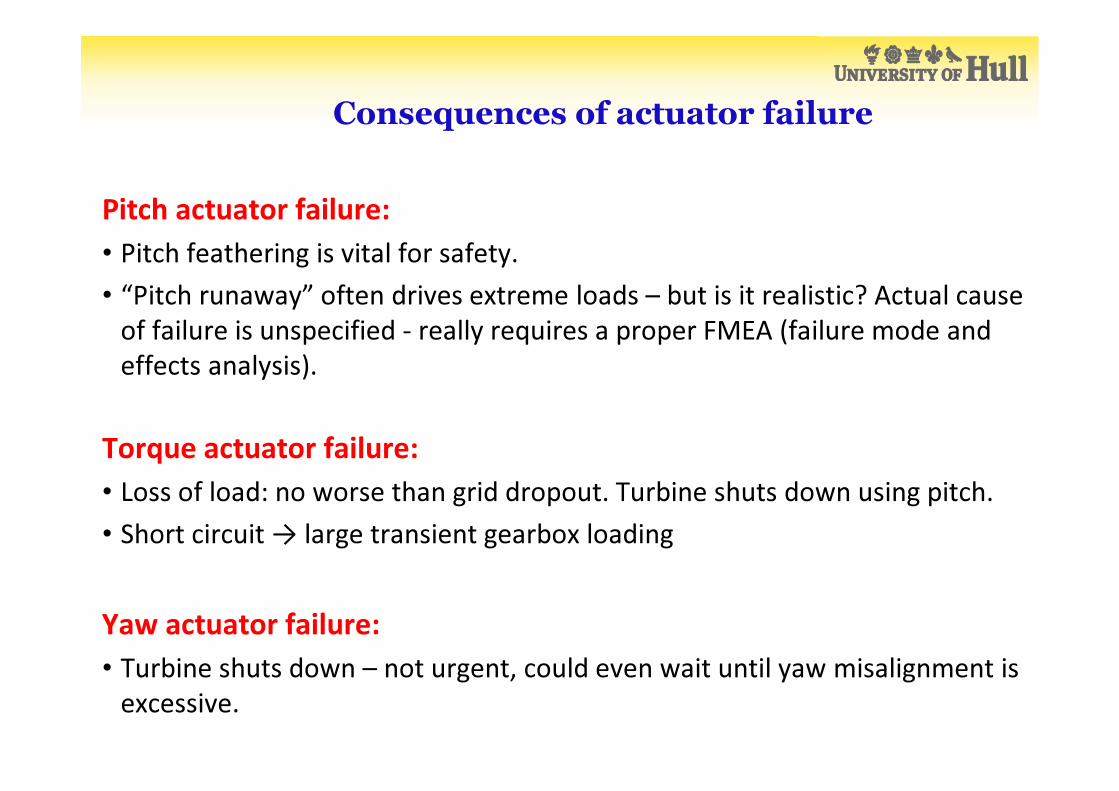
Consequences of actuator failure
Pitch actuator failure:
• Pitch feathering is vital for safety.
• “Pitch runaway” often drives extreme loads – but is it realistic? Actual cause
of failure is unspecified - really requires a proper FMEA (failure mode and
effects analysis).
Torque actuator failure:
• Loss of load: no worse than grid dropout. Turbine shuts down using pitch.
• Short circuit → large transient gearbox loading
Yaw actuator failure:
• Turbine shuts down – not urgent, could even wait until yaw misalignment is
excessive.

Wind turbine maintenance types
Predictive maintenance
Preventive maintenance
Corrective maintenance
OFFSHORE WIND TURBINE MAINTENANCE
Detection based maintenance
Schedule based maintenance
Unplanned maintenance
Reduction of maintenance effort is essential when locating wind turbines offshore
• Offshore work between 5-10 times more expensive than work on land.
• Predictive maintenance preferable. Technical reports (Verbruggen,
2003) show that signal based monitoring techniques not suitable for wind
turbine applications because of stochastic nature of wind affecting fault
decision-making.
• Site inaccessibility.
Van Bussel, G. J. W. & Zaaijer, M. B. Year. Reliability, Availability and Maintenance Aspects of Large-Scale Offshore Wind
Farms, a Concepts Study. In: MAREC 2001 Marine Renewable Energies Conference Newcastle 119-126.
Verbruggen, T. W. 2003. Wind turbine operation and maintenance based on condition monitoring. Petten, the
Netherlands: Energy Research Center of the Netherlands.

Aim:
Increase multi MWatt wind turbine reliability
Existing problem:Trade-off the annual power production
with lifetime and cost
Build monitoring systems using model based techniques
Suggestions
Fault Tolerant Controlsystem
Increases lifetime & decreases cost
Reliable multi MWatt wind turbine
“SUSTAINABLE WIND TURBINE”
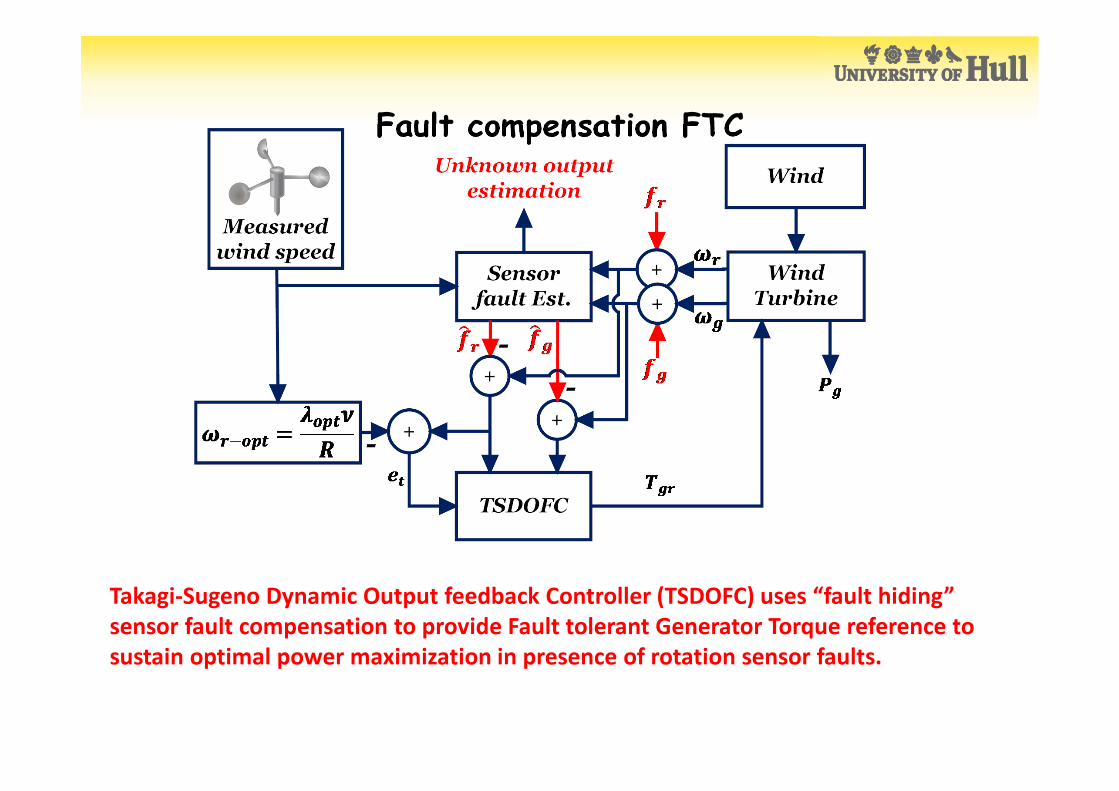
Fault compensation FTC
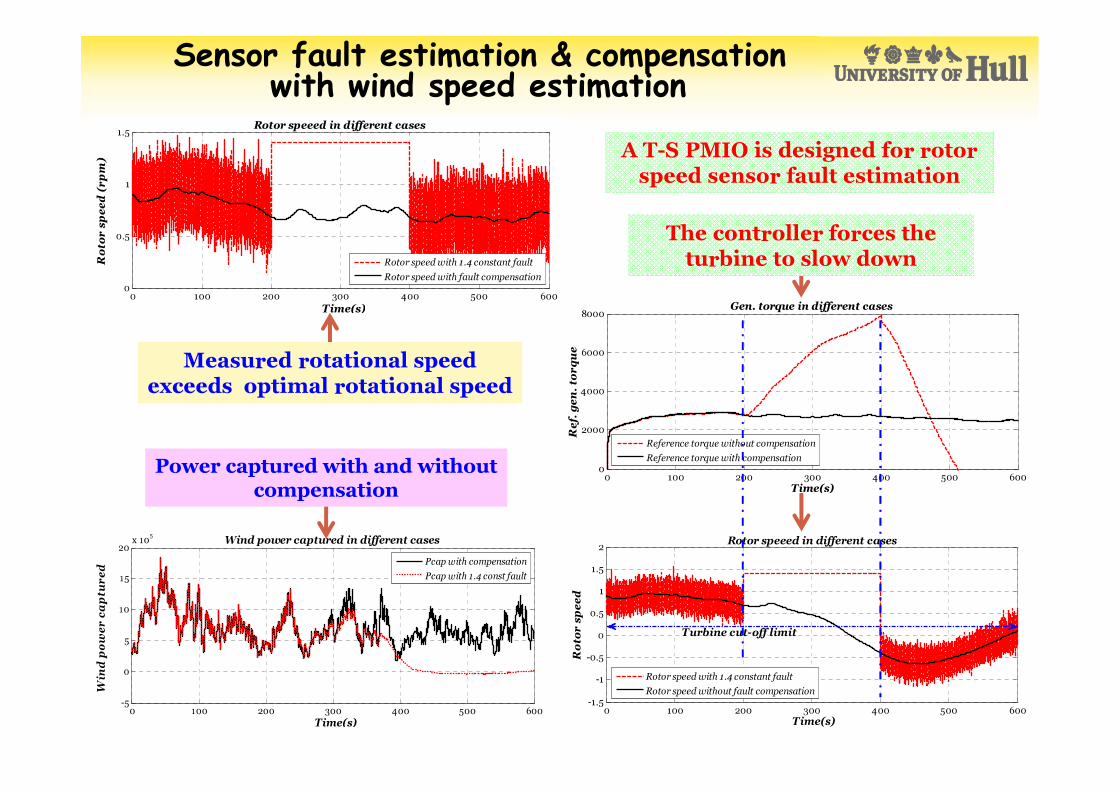
Takagi-Sugeno Dynamic Output feedback Controller (TSDOFC) uses “fault hiding”
sensor fault compensation to provide Fault tolerant Generator Torque reference to
sustain optimal power maximization in presence of rotation sensor faults.
0 100 200 300 400 500 600-1.5
-1
-0.5
0
0.5
1
1.5
2Rotor speeed in different cases
Time(s)
Ro
tor
sp
ee
d
Rotor speed with 1.4 constant fault
Rotor speed without fault compensation
Turbine cut-off limit
The controller forces the turbine to slow down
0 100 200 300 400 500 600-5
0
5
10
15
20x 10
5
Wind power captured in different cases
Time(s)
Win
d p
ow
er
ca
ptu
re
d
Pcap with compensation
Pcap with 1.4 const fault
0 100 200 300 400 500 6000
0.5
1
1.5Rotor speeed in different cases
Time(s)
Ro
tor
sp
ee
d (
rp
m)
Rotor speed with 1.4 constant fault
Rotor speed with fault compensation
Measured rotational speed exceeds optimal rotational speed
Power captured with and without compensation
Sensor fault estimation & compensationwith wind speed estimation
A T-S PMIO is designed for rotor speed sensor fault estimation
0 100 200 300 400 500 6000
2000
4000
6000
8000Gen. torque in different cases
Time(s)
Re
f. g
en
. to
rq
ue
Reference torque without compensation
Reference torque with compensation
WHAT ABOUT “SUSTAINABLE WEC”?
Different actuators, sensors, components, WEC devices
• But similar problems of reliability, sustainability, O & M Cost
Reduction …..
Research shows that the “fault estimation & compensation”
strategy can even be used to tune the power conversion efficiency –
compensate for non-linearity as well as faults!
A common feature between wind & wave energy problems is
absence of repeated (hardware) redundancy. Signals can be
estimated in different ways using Analytical Redundancy , this
provides a way to estimate fault effects.

1/50 Scale Prototype & Tank Tests
Wave
GaugesPressure
Sensors
LVDT
Accelerometer
Tank: 13m long, 6m
wide, 2m height with 1m
water depth.
Buoy:
r=0.15m
h=0.56m
d=0.28m
Wave-maker:
regular/irregular waves:
f=0.4-1.2Hz, A=2-10cm
DAQ: NI
USB-6210 Data collected
via LabView
fs=100Hz
Some results
shown in [1].
1. Guo, B., et al. A continuous control approach to point absorber wave energy conversion. in Control (CONTROL), 2016 UKACC 11th
International Conference on. 2016. IEEE.
Control Architecture
Σ FloaterΣ
-km(t)Fhs(t)
Controller
Reference
GenerationΣ
Fw(t)
Fu(t) or Fpto(t)
ObserverFe1(t)
Fe3(t)
z(t)
Pressure
sensorsΣ
Fw(t) Fe2(t)
Fhs(t)
Estimation
Fhs(t)
Predictor ke(t-tc)η (t) η (t+tc) Fe(t)
Excitation
Wave
Gauges
Fr(t)
Fr(t)
Estimation
a(t) v(t)
Fe(t)
V(t)
e(t)
Vref(t)
-kr(t)
−Μ∞
Radiation
Σ Fr(t)WEC
Excitation Force Estimation 1
Excitation Force Estimation 2
Excitation Force
Estimation 3
z(t)
a(t)
z(t)
a(t)
z(t)a(t)
Controller
z(t)a(t)
Feedback
Measure
ments
LVDT
Accelerometer
SProc
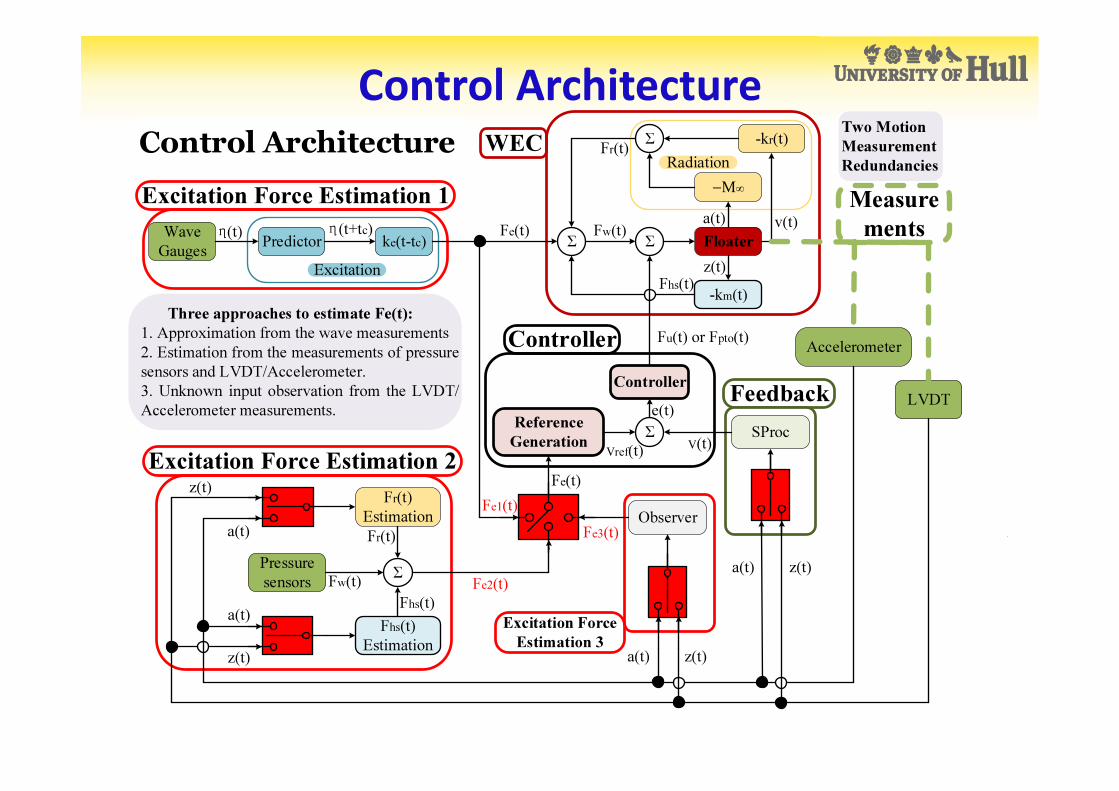
Three approaches to estimate Fe(t):
1. Approximation from the wave measurements
2. Estimation from the measurements of pressure
sensors and LVDT/Accelerometer.
3. Unknown input observation from the LVDT/
Accelerometer measurements.
Two Motion
Measurement
Redundancies
Control Architecture

Three Excitation Force Methods
To estimate the wave excitation force:
(1) From wave measurement and its prediction via AR model (to overcome the non-causality of the excitation problem).
(2) From measurements of pressure sensors, LVDT/accelerometer. Total wave force can be calculated from the pressure sensors fixed at buoy bottom.
• The radiation force can be approximated from the accelerometer measurements, according to Cummins Equation.
• The hydrostatic force is proportional to the displacement measurement.
Hence, excitation force approximates wave force by subtracting the estimated radiation and hydrostatic forces.
(3) The excitation force can also be observed as an “unknown input” from LVDT and Acc measurements
……..and Estimated…a new approach in control.
These provide “analytical redundancy” for potential FTC application.
Either scheme can be applied as a feedback signal to give Fault Tolerant Control.
Redundancy also exists in motion measurements, displacement and acceleration.
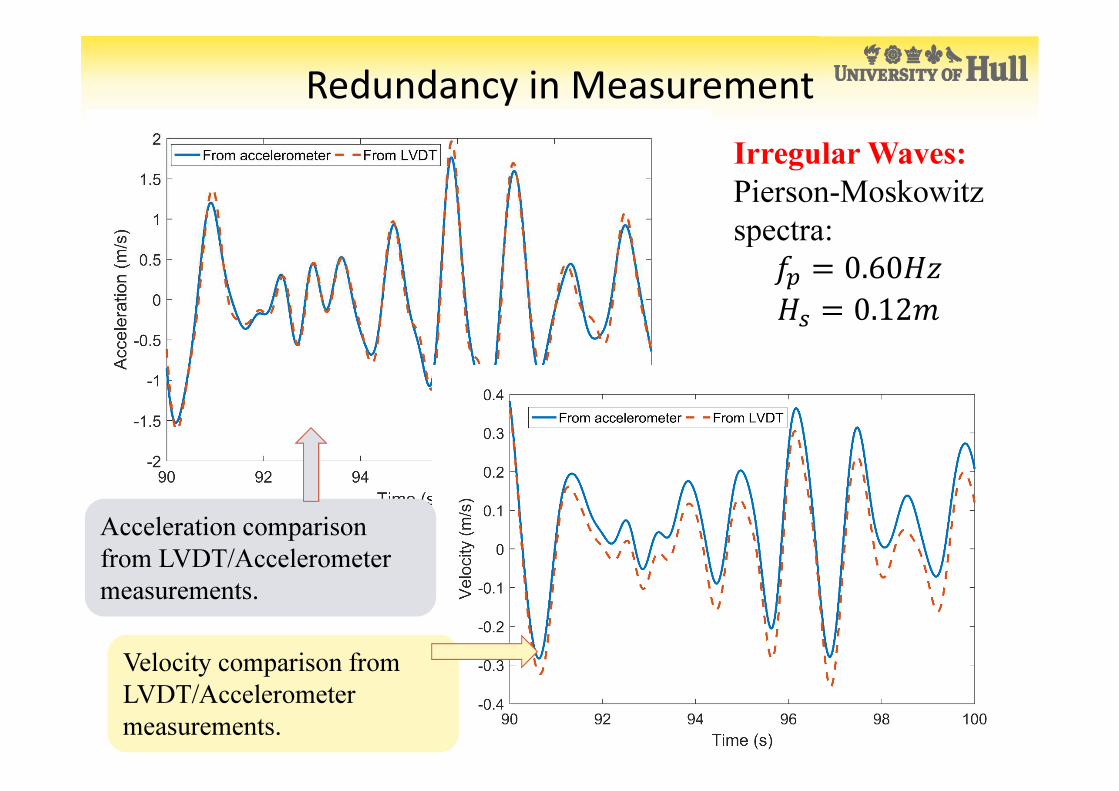
Redundancy in Measurement
Irregular Waves:
Pierson-Moskowitz
spectra:
�� � 0.60��
�� � 0.12
Acceleration comparison
from LVDT/Accelerometer
measurements.
Velocity comparison from
LVDT/Accelerometer
measurements.
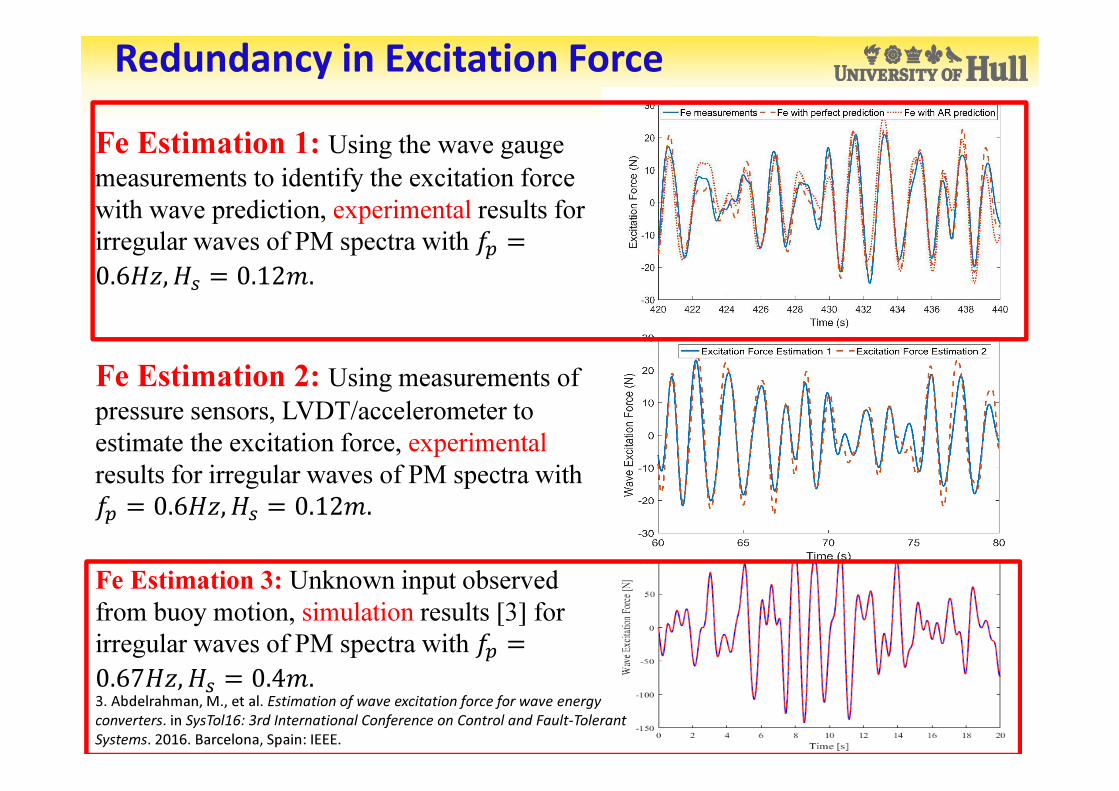
Redundancy in Excitation Force
Fe Estimation 3: Unknown input observed
from buoy motion, simulation results [3] for
irregular waves of PM spectra with �� �
0.67��, �� � 0.4�.
Fe Estimation 2: Using measurements of
pressure sensors, LVDT/accelerometer to
estimate the excitation force, experimental
results for irregular waves of PM spectra with
�� � 0.6��, �� � 0.12�.
Fe Estimation 1: Using the wave gauge
measurements to identify the excitation force
with wave prediction, experimental results for
irregular waves of PM spectra with �� �
0.6��, �� � 0.12�.
3. Abdelrahman, M., et al. Estimation of wave excitation force for wave energy
converters. in SysTol16: 3rd International Conference on Control and Fault-Tolerant
Systems. 2016. Barcelona, Spain: IEEE.
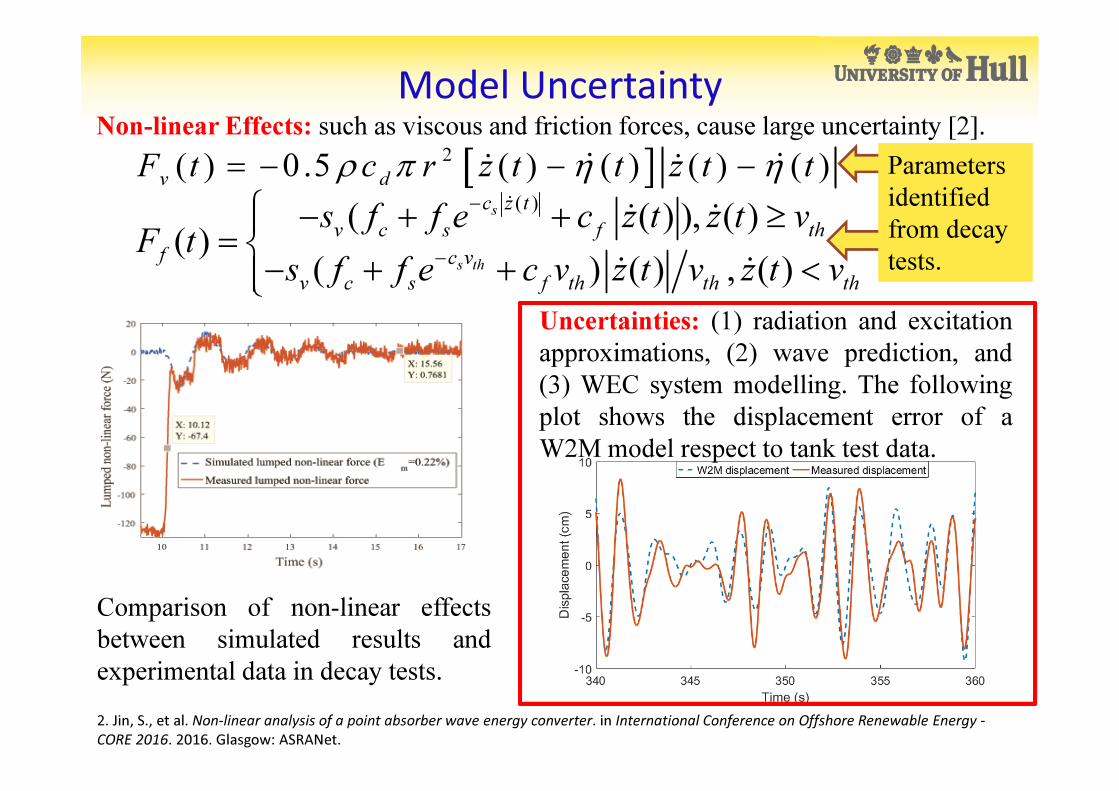
Model Uncertainty
[ ]2( ) 0 .5 ( ) ( ) ( ) ( )
v dF t c r z t t z t tρ π η η= − − −& && &
( )( ( ) ), ( )
( )( ) ( ) , ( )
s
s th
c z t
v c s f th
f c v
v c s f th th th
s f f e c z t z t vF t
s f f e c v z t v z t v
−
−
− + + ≥=
− + + <
&
& &
& &
Parameters
identified
from decay
tests.
Non-linear Effects: such as viscous and friction forces, cause large uncertainty [2].
Uncertainties: (1) radiation and excitation
approximations, (2) wave prediction, and
(3) WEC system modelling. The following
plot shows the displacement error of a
W2M model respect to tank test data.
Comparison of non-linear effects
between simulated results and
experimental data in decay tests.
2. Jin, S., et al. Non-linear analysis of a point absorber wave energy converter. in International Conference on Offshore Renewable Energy -
CORE 2016. 2016. Glasgow: ASRANet.

Tests with Regular Waves

Tests with Irregular Waves