Embed Size (px)
Citation preview
Fazli R. Awan
Characterization of a Mouse Model of Sandhoff Disease by Magnetic
Resonance Methods
Supervisors
Dr Fran M Platt
Prof Peter Styles
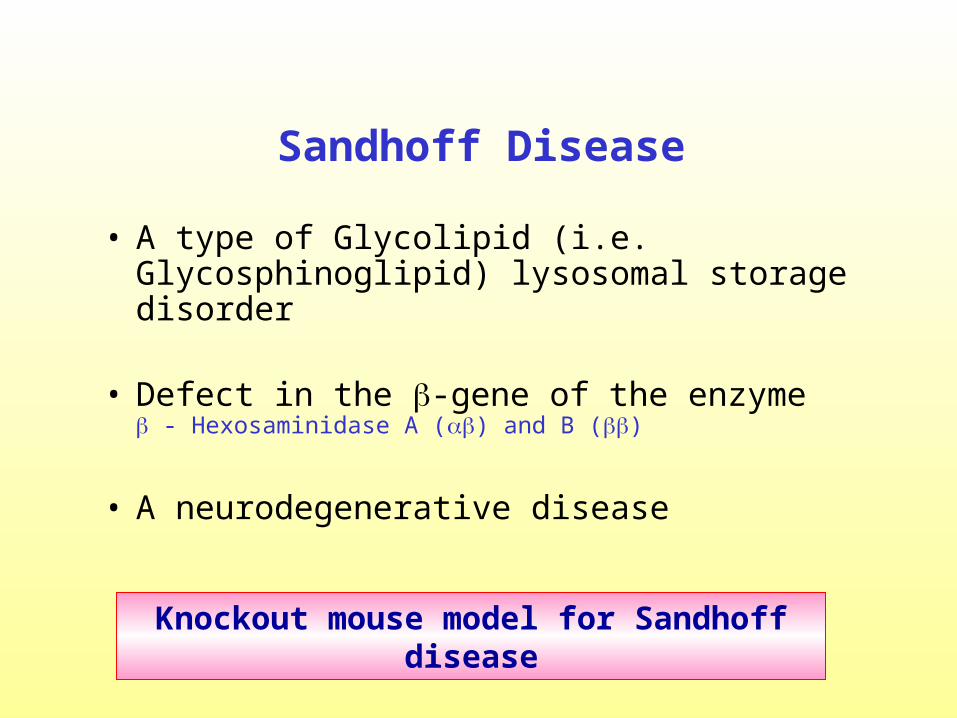
Sandhoff Disease
• A type of Glycolipid (i.e. Glycosphinoglipid) lysosomal storage disorder
• Defect in the -gene of the enzyme - Hexosaminidase A () and B ()
• A neurodegenerative disease
Knockout mouse model for Sandhoff disease
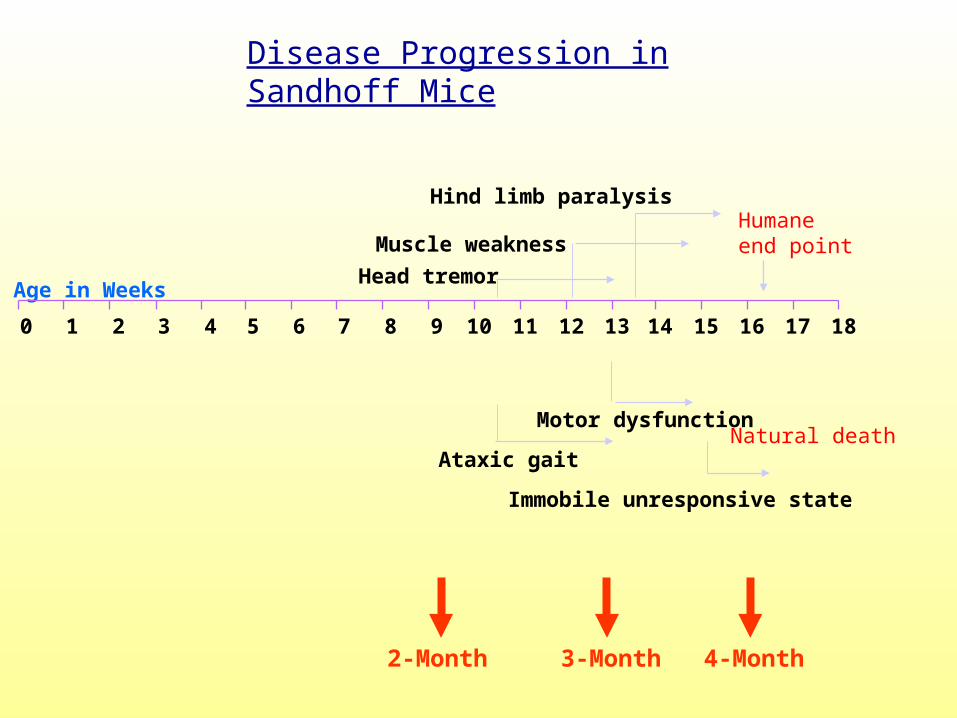
Head tremor
Muscle weakness
Ataxic gait
Motor dysfunction
Hind limb paralysis
Immobile unresponsive state
Humane end point
Natural death
Age in Weeks
1817161514131211109876543210
Disease Progression in Sandhoff Mice
2-Month 3-Month 4-Month
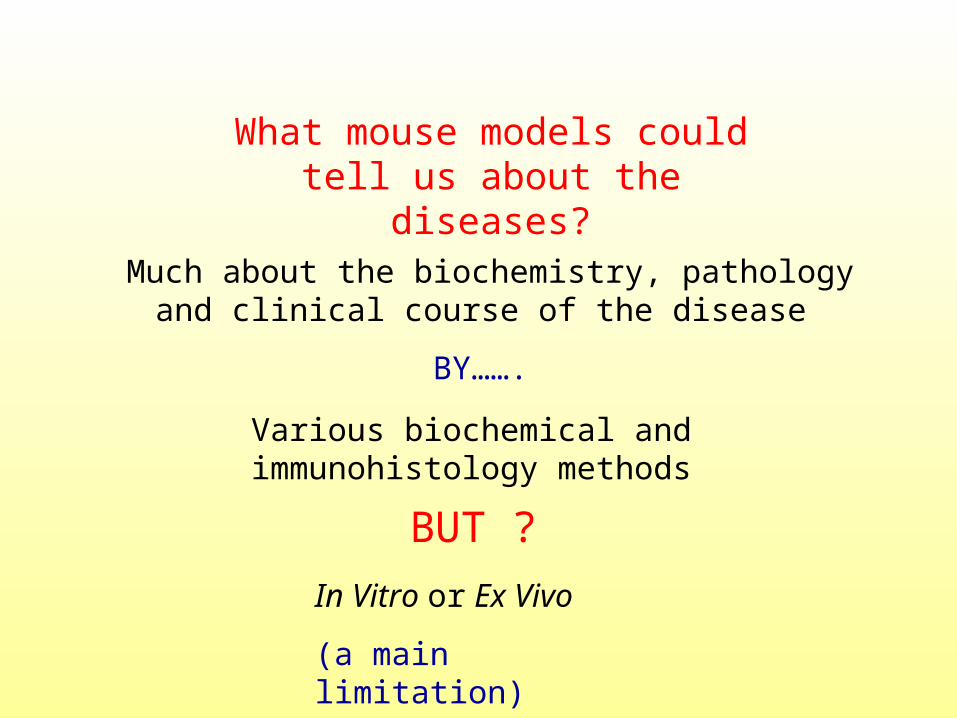
What mouse models could tell us about the diseases?
Much about the biochemistry, pathology and clinical course of the disease
BY…….
Various biochemical and immunohistology methods
In Vitro or Ex Vivo
(a main limitation)
BUT ?
To find out disease related changes in
Sandhoff mice by in vivo MR methods
Aim
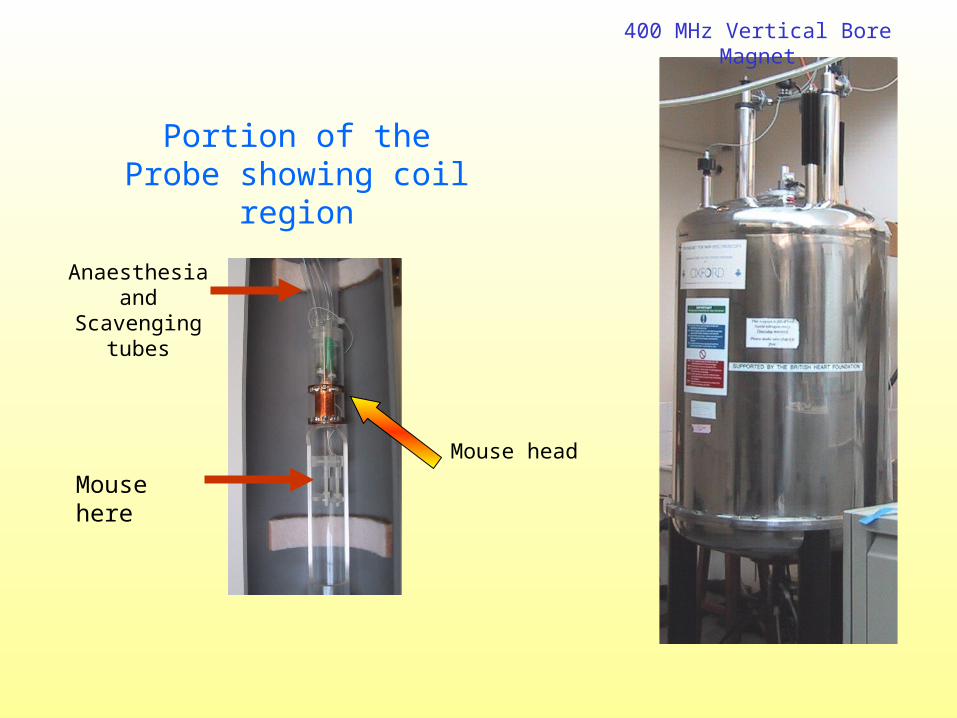
400 MHz Vertical Bore Magnet
Mouse head
Mouse here
Anaesthesia and Scavenging
tubes
Portion of the Probe showing coil region
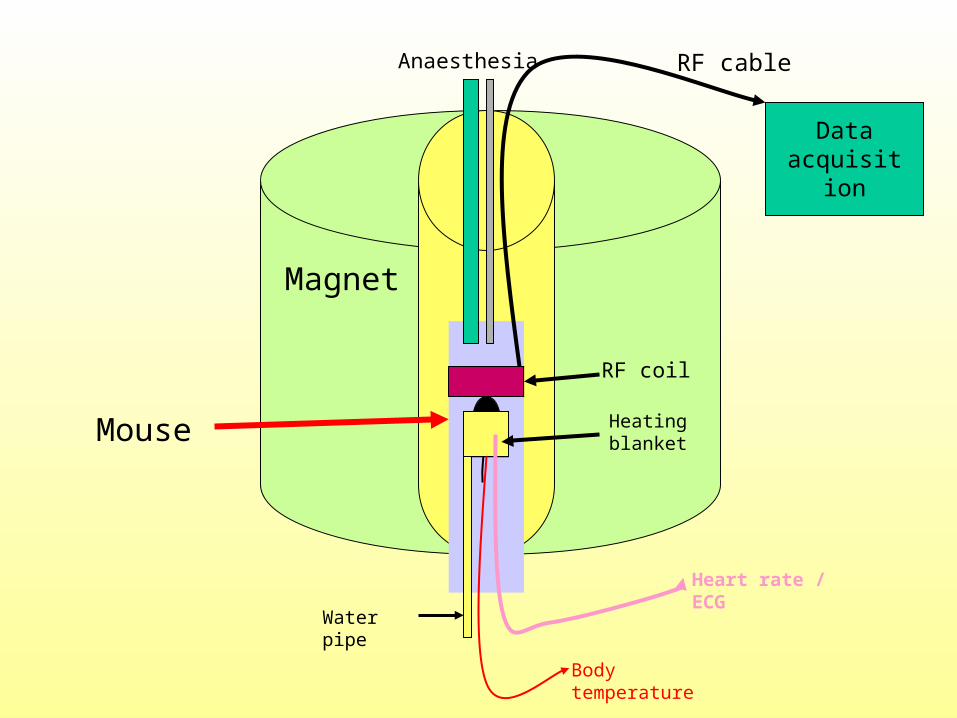
Anaesthesia RF cable
Data acquisition
Magnet
RF coil
Heating blanket
Water pipe
Body temperature
Heart rate / ECG
Mouse
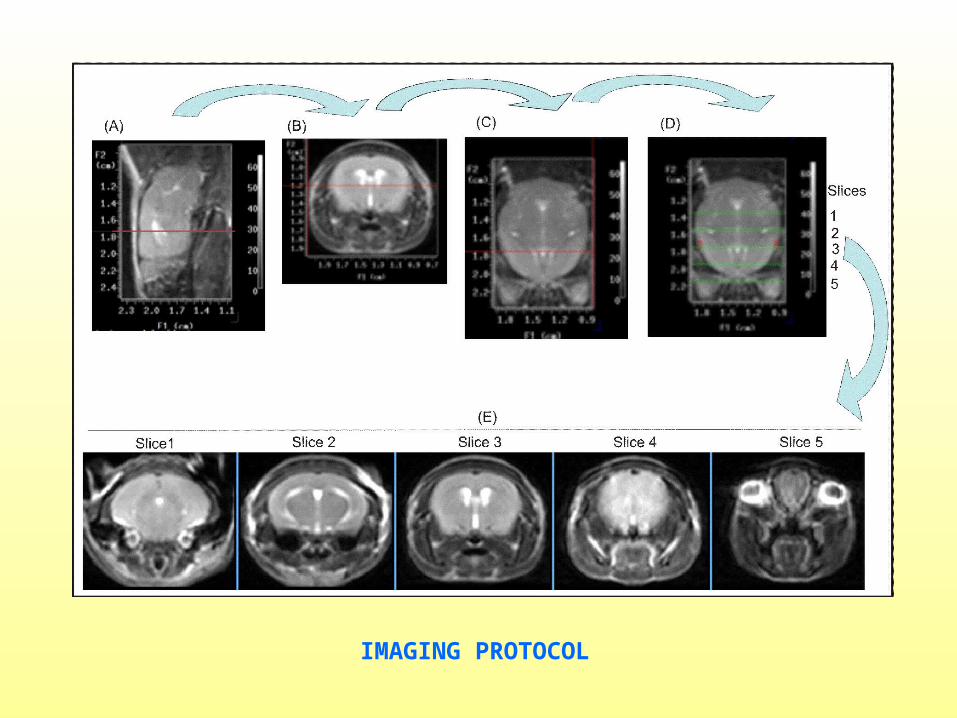
IMAGING PROTOCOL
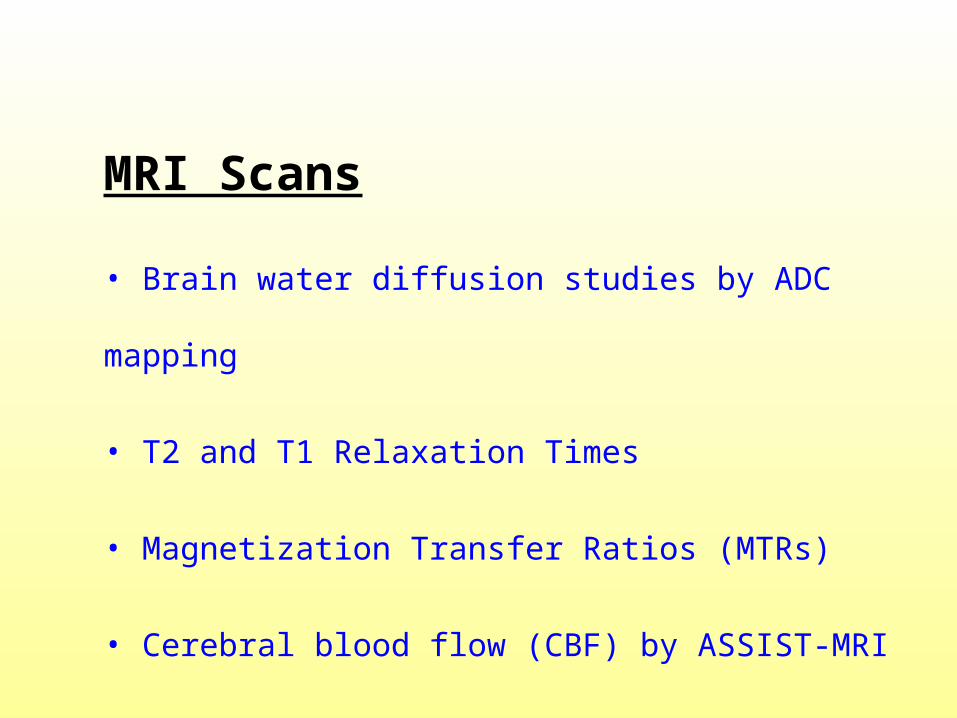
MRI Scans
• Brain water diffusion studies by ADC mapping
• T2 and T1 Relaxation Times
• Magnetization Transfer Ratios (MTRs)
• Cerebral blood flow (CBF) by ASSIST-MRI
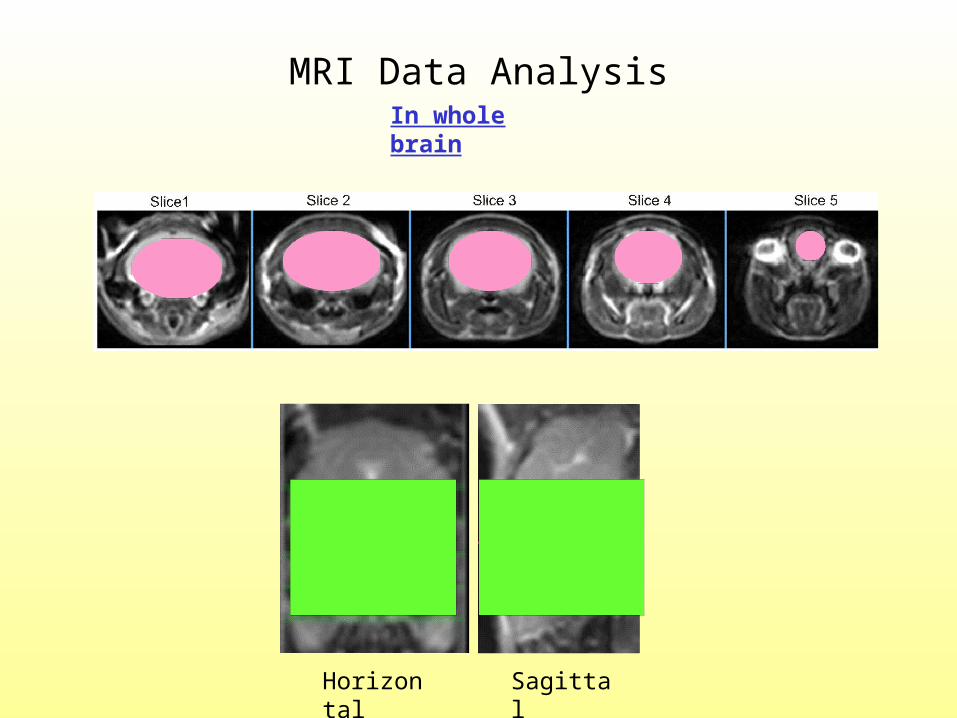
MRI Data AnalysisIn whole brain
Horizontal Sagittal
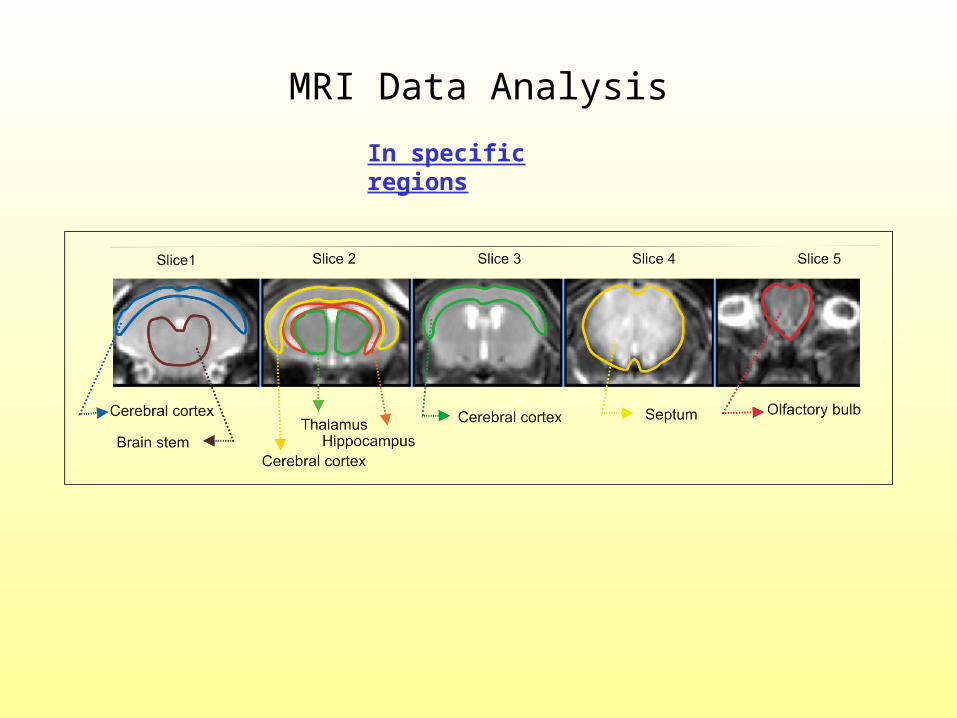
MRI Data Analysis
In specific regions
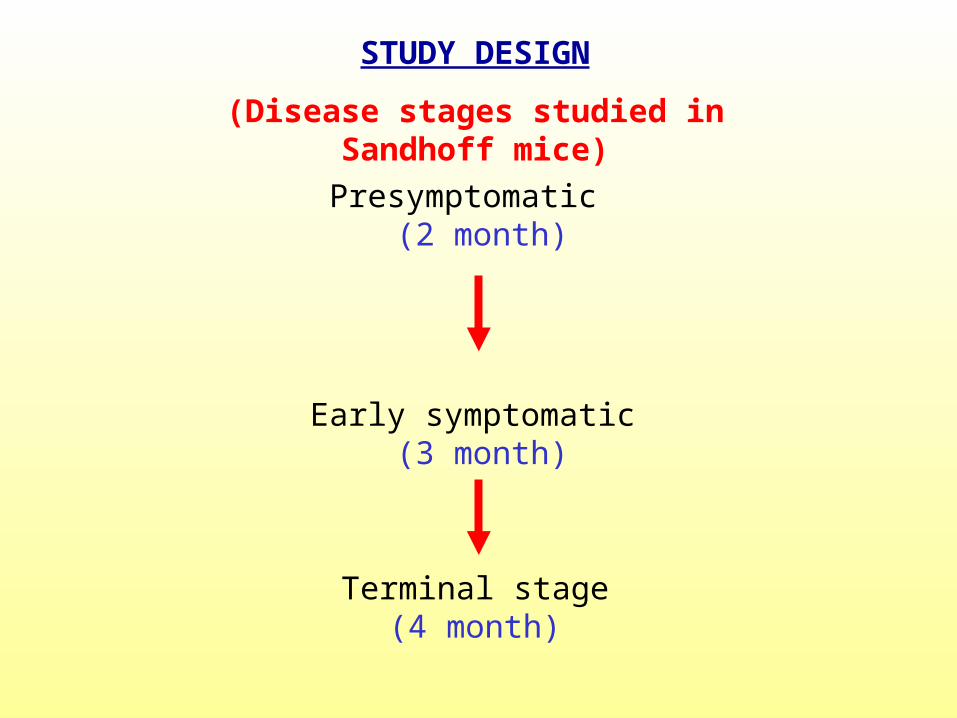
STUDY DESIGN
(Disease stages studied in Sandhoff mice)
Presymptomatic (2 month)
Early symptomatic (3 month)
Terminal stage(4 month)
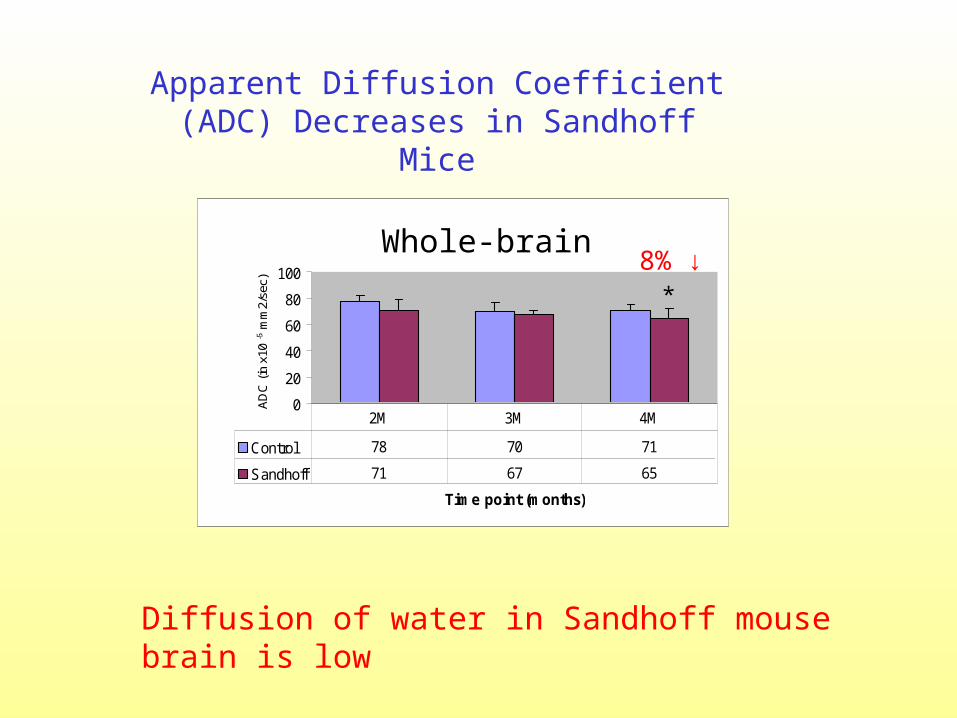
Apparent Diffusion Coefficient (ADC) Decreases in Sandhoff Mice
0
20
40
60
80
100
Time point (months)
AD
C (
in x
10-5
mm
2/se
c)
Control 78 70 71
Sandhoff 71 67 65
2M 3M 4M
*
Whole-brain8% ↓
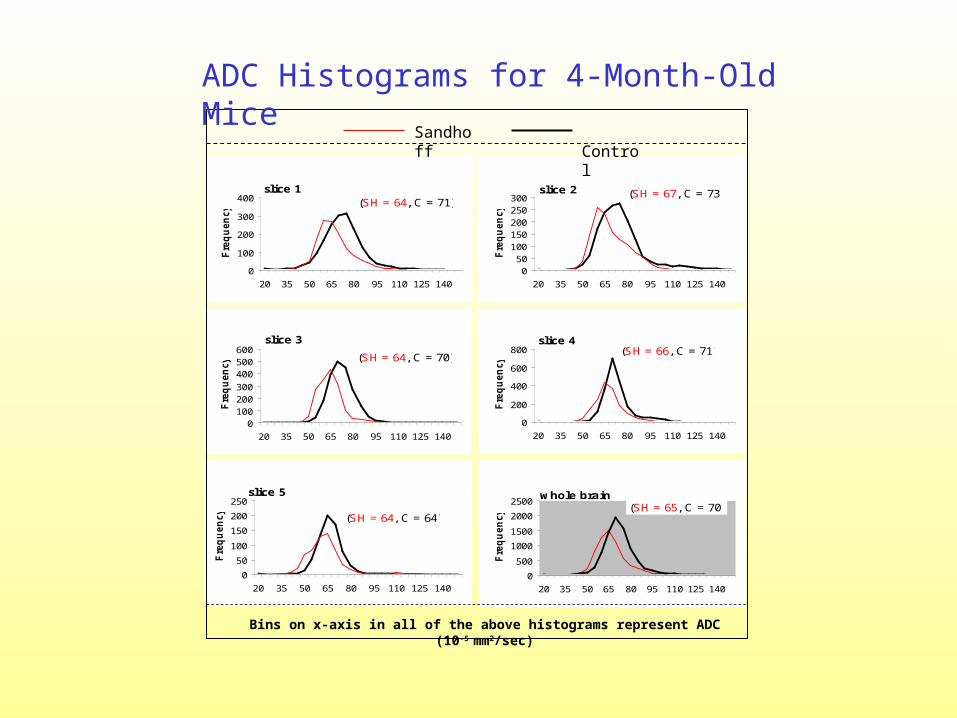
Diffusion of water in Sandhoff mouse brain is low
slice 1
0
100
200
300
400
20 35 50 65 80 95 110 125 140
Fre
qu
en
cy
slice 2
050
100150200250300
20 35 50 65 80 95 110 125 140
Fre
qu
en
cy
slice 3
0100200300
400500600
20 35 50 65 80 95 110 125 140
Fre
qu
en
cy
slice 4
0
200
400
600
800
20 35 50 65 80 95 110 125 140
Fre
qu
en
cy
slice 5
0
50
100
150
200
250
20 35 50 65 80 95 110 125 140
Fre
qu
en
cy
whole brain
0
500
1000
1500
2000
2500
20 35 50 65 80 95 110 125 140
Fre
qu
en
cy
(SH = 65, C = 70)(SH = 64, C = 64)
(SH = 64, C = 70)(SH = 66, C = 71)
(SH = 67, C = 73)(SH = 64, C = 71)
Sandhoff Control
Bins on x-axis in all of the above histograms represent ADC (10-5 mm2/sec)
ADC Histograms for 4-Month-Old Mice
0
20
40
60
80
100
2 Month 3 Month 4 Month
Time points
ADC
(10
-5 m
m/s
ec)
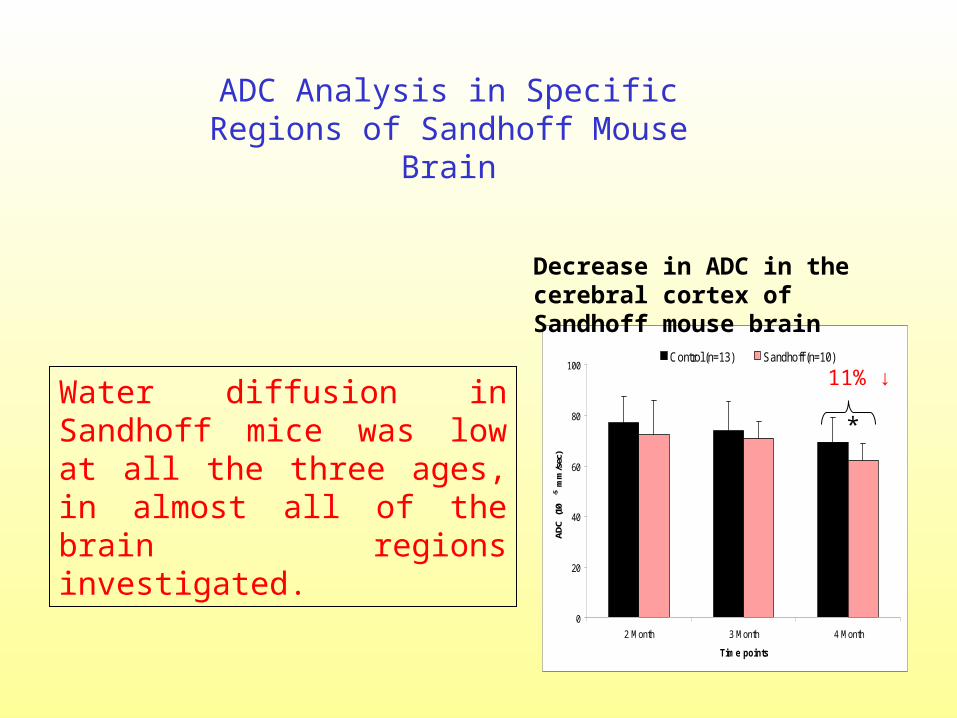
Control (n=13) Sandhoff (n=10)
*
Decrease in ADC in the cerebral cortex of Sandhoff mouse brain
ADC Analysis in Specific Regions of Sandhoff Mouse Brain
Water diffusion in Sandhoff mice was low at all the three ages, in almost all of the brain regions investigated.
11% ↓
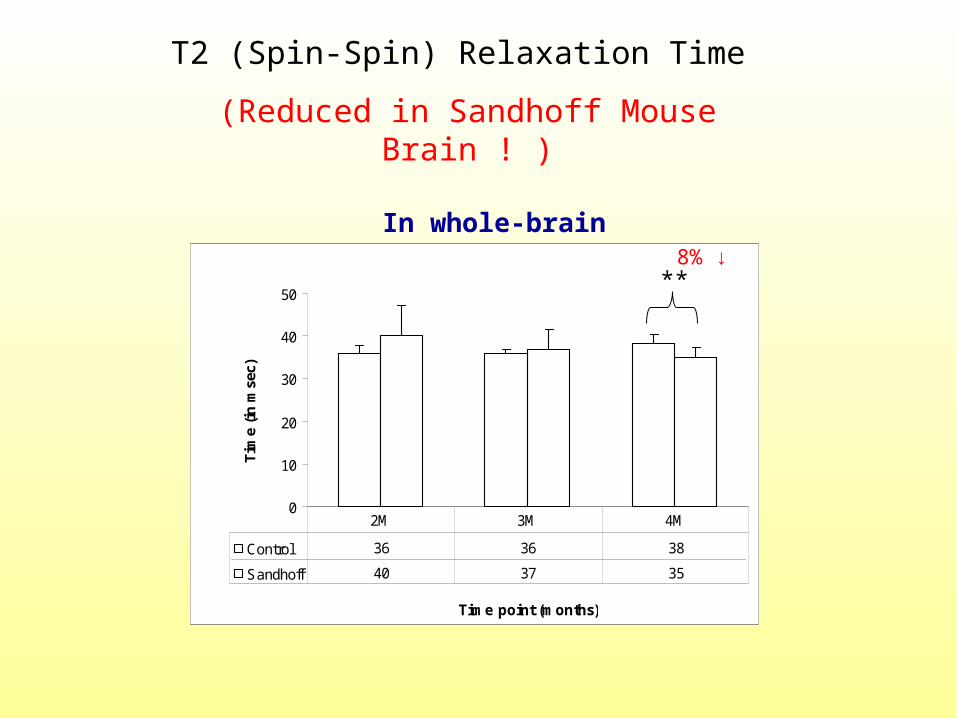
T2 (Spin-Spin) Relaxation Time
(Reduced in Sandhoff Mouse Brain ! )
0
10
20
30
40
50
Time point (months)
Tim
e (i
n m
sec)
Control 36 36 38
Sandhoff 40 37 35
2M 3M 4M
**
In whole-brain8% ↓
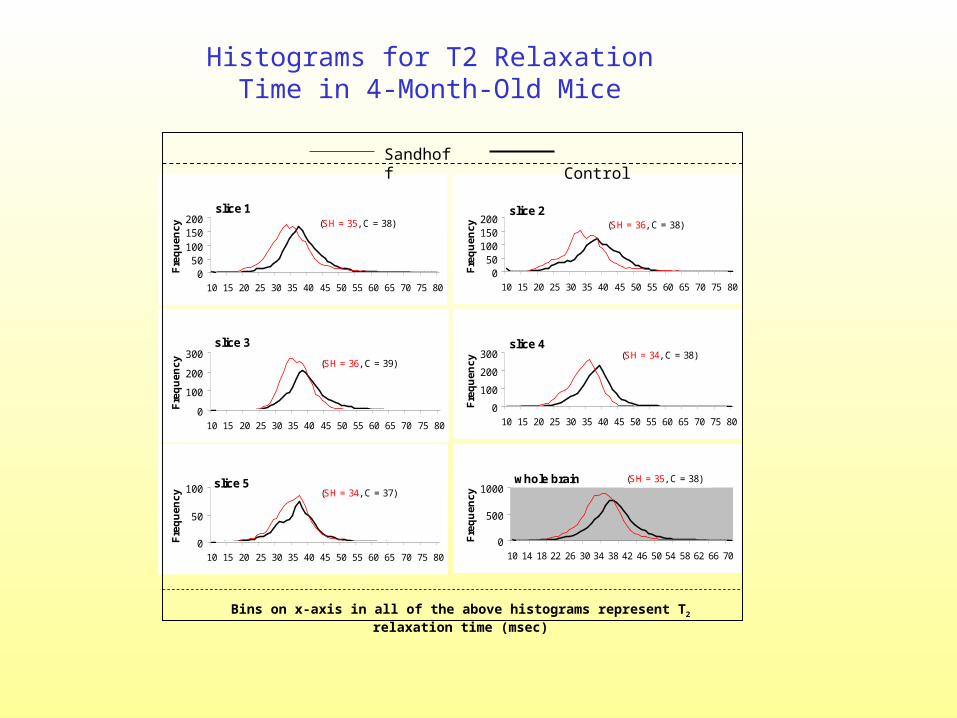
Histograms for T2 Relaxation Time in 4-Month-Old Mice
slice 1
050
100150200
10 15 20 25 30 35 40 45 50 55 60 65 70 75 80
Fre
qu
en
cy
slice 2
050
100150200
10 15 20 25 30 35 40 45 50 55 60 65 70 75 80
Fre
qu
en
cy
slice 3
0
100
200
300
10 15 20 25 30 35 40 45 50 55 60 65 70 75 80
Fre
qu
en
cy
slice 4
0
100
200
300
10 15 20 25 30 35 40 45 50 55 60 65 70 75 80
Fre
qu
en
cyslice 5
0
50
100
10 15 20 25 30 35 40 45 50 55 60 65 70 75 80
Fre
qu
en
cy
whole brain
0
500
1000
10 14 18 22 26 30 34 38 42 46 50 54 58 62 66 70
Fre
qu
enc
y
(SH = 35, C = 38) (SH = 36, C = 38)
(SH = 34, C = 38)(SH = 36, C = 39)
(SH = 34, C = 37)
(SH = 35, C = 38)
Sandhoff Control
Bins on x-axis in all of the above histograms represent T2 relaxation time (msec)
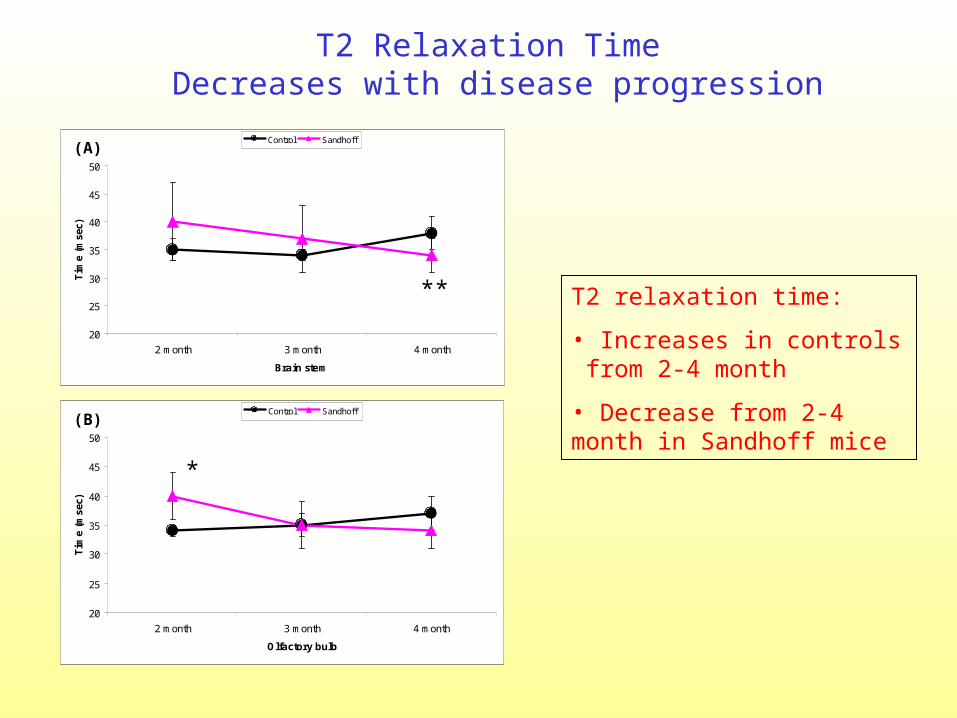
T2 Relaxation Time Decreases with disease progression
20
25
30
35
40
45
50
2 month 3 month 4 month
Olfactory bulb
Tim
e (m
sec)
Control Sandhoff
*
20
25
30
35
40
45
50
2 month 3 month 4 month
Brain stem
Tim
e (m
sec)
Control Sandhoff
**
(A)
(B)
T2 relaxation time:
• Increases in controls from 2-4 month
• Decrease from 2-4 month in Sandhoff mice
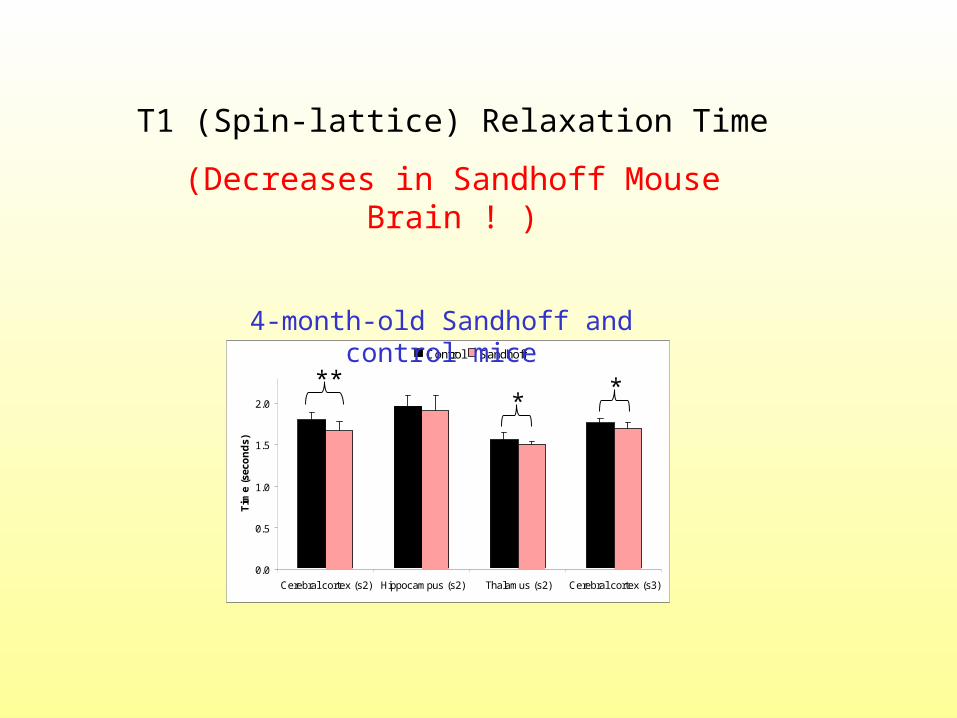
T1 (Spin-lattice) Relaxation Time
(Decreases in Sandhoff Mouse Brain ! )
0.0
0.5
1.0
1.5
2.0
Cerebral cortex (s2) Hippocampus (s2) Thalamus (s2) Cerebral cortex (s3)
Tim
e (s
eco
nd
s)
Control Sandhoff
**
**
4-month-old Sandhoff and control mice
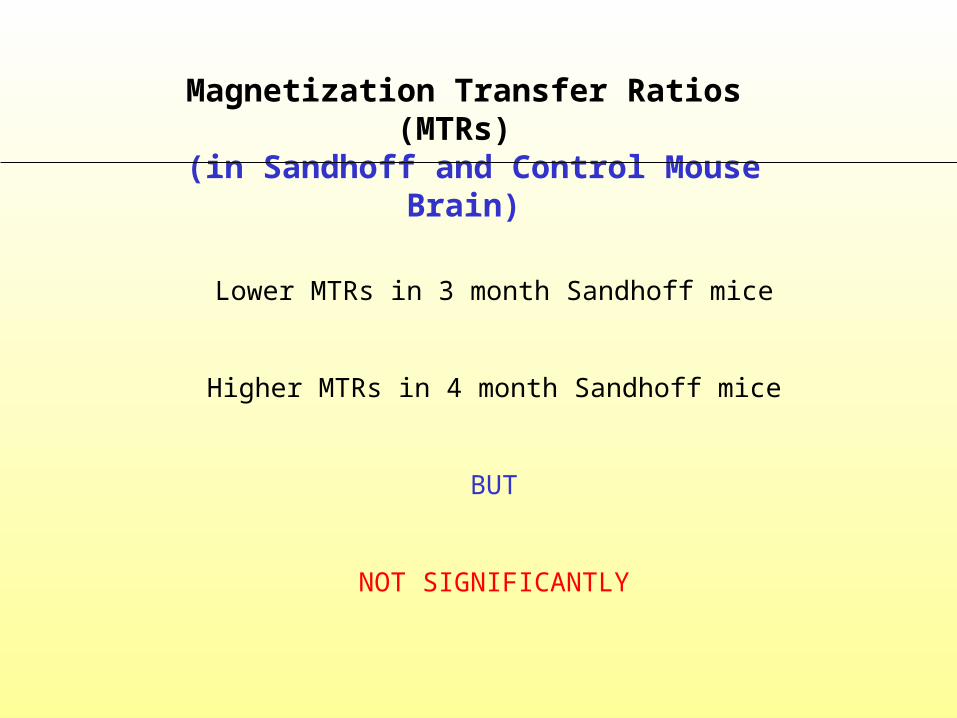
Magnetization Transfer Ratios (MTRs) (in Sandhoff and Control Mouse Brain)
Lower MTRs in 3 month Sandhoff mice
Higher MTRs in 4 month Sandhoff mice
BUT
NOT SIGNIFICANTLY
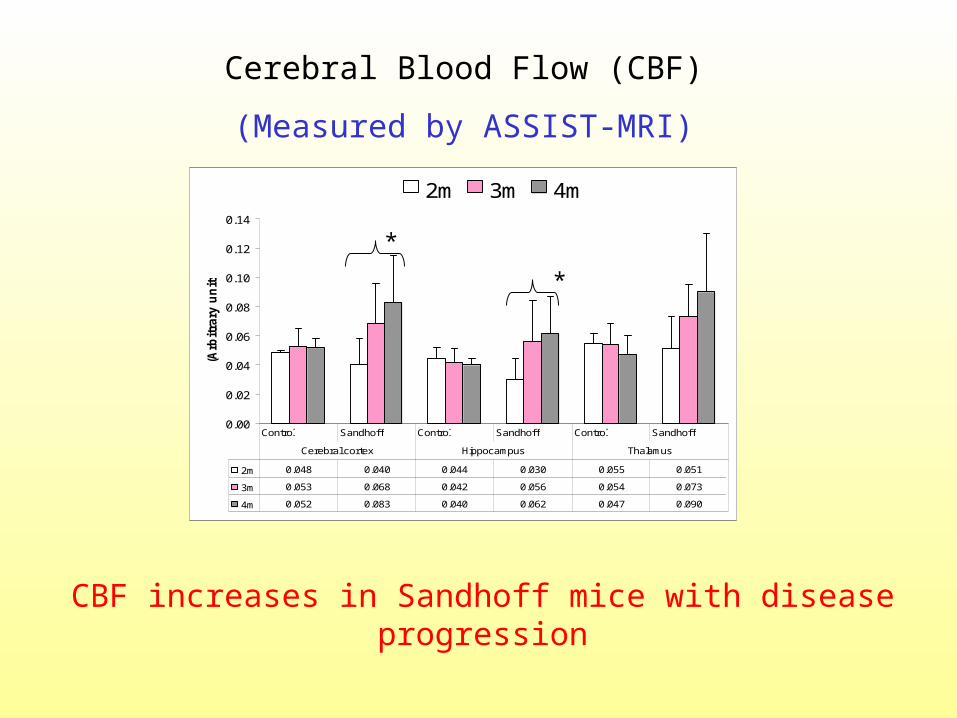
Cerebral Blood Flow (CBF)
(Measured by ASSIST-MRI)
0.00
0.02
0.04
0.06
0.08
0.10
0.12
0.14(A
rbit
rary
un
its)
2m 3m 4m
2m 0.048 0.040 0.044 0.030 0.055 0.051
3m 0.053 0.068 0.042 0.056 0.054 0.073
4m 0.052 0.083 0.040 0.062 0.047 0.090
Control Sandhoff Control Sandhoff Control Sandhoff
Cerebral cortex Hippocampus Thalamus
*
*
CBF increases in Sandhoff mice with disease progression
0.00
0.02
0.04
0.06
0.08
0.10
0.12
0.14
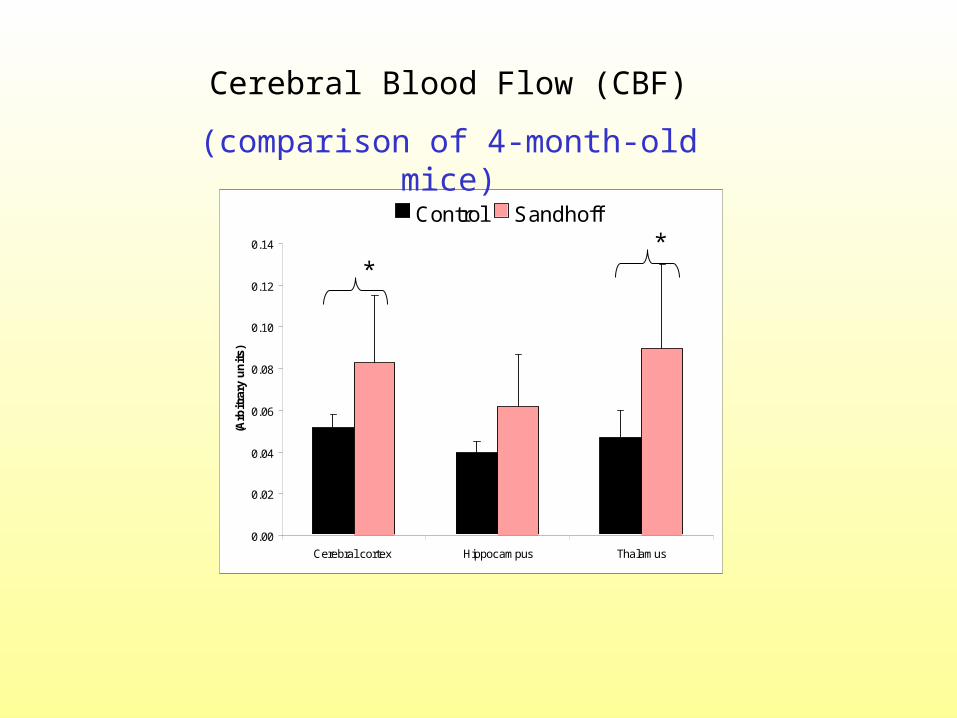
Cerebral cortex Hippocampus Thalamus
(Arb
itra
ry u
nit
s)
Control Sandhoff
* *
Cerebral Blood Flow (CBF)
(comparison of 4-month-old mice)
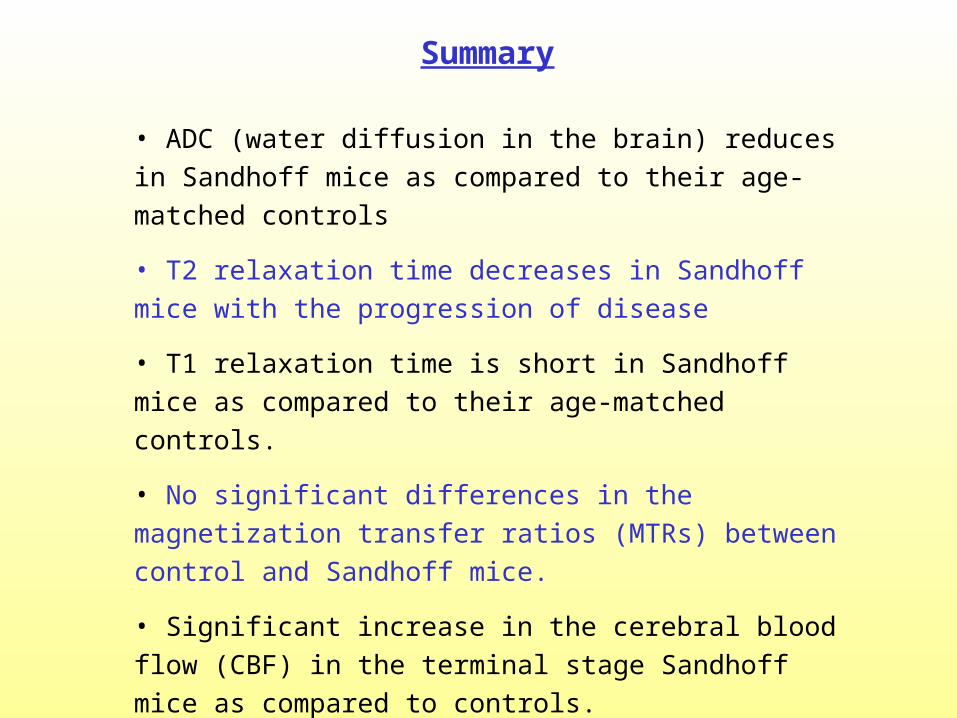
Summary
• ADC (water diffusion in the brain) reduces in Sandhoff mice
as compared to their age-matched controls
• T2 relaxation time decreases in Sandhoff mice with the
progression of disease
• T1 relaxation time is short in Sandhoff mice as compared to
their age-matched controls.
• No significant differences in the magnetization transfer
ratios (MTRs) between control and Sandhoff mice.
• Significant increase in the cerebral blood flow (CBF) in the
terminal stage Sandhoff mice as compared to controls.
• This increase in the CBF appears to progress with the
disease
Conclusions
• This is the first time MRI study of Sandhoff mouse brain, and only limited data is available from clinical studies.
• These findings may have applications for disease diagnosis and therapy monitoring by non-invasive MRI methods.
Acknowledgements
Members of 1st. Floor
Mr David Smith
Dr M. Jeyakumar
Dr David Neville
Dr Terry Butters
Prof Raymond Dwek
Dr Fran PlattProf Peter Styles
Members of ENG
Dr Niki Sibson
Dr Kerry Broom
Dr John Lowe
Dr AM Blamire
Dr Justin Smith
Mr Andre ThomasMr Phillip Bradford
(Members of BSU)
Experimental Neuroimaging Group (ENG), University Lab. of Physiology