Embed Size (px)
Citation preview


MHalf Year June 30, 2016 MHalf Year June 30, 2016 1
Registered Office
Faysal House, ST-2, Sharah-e-Faisal, Karachi
Tel: 021-32795200 Fax: 021-32795234
Condensed Interim Statement of Financial Position
Condensed Interim Profit and Loss Account
Condensed Interim Statement of Comprehensive Income
Condensed Interim Cash Flow Statement
Condensed Interim Statement of Changes in Equity
Notes to and Forming part of the Financial InformationCondensed Interim
Corporate Information
Directors' Review
2
4
10
11
12
13
14
15
CONTENTS
Auditors' Report 9
MHalf Year June 30, 2016 MHalf Year June 30, 20162 3
Board of Directors
Board Audit & Corporate Governance Committee
Board Risk Management Committee
Recruitment Nomination and Remuneration Committee
Board Strategic Planning and Business
Transformation Committee
Mr. Farooq Rahmatullah Chairman/Independent Director
Mr. Ahmed Abdulrahim Mohamed Abdulla Bucheery Vice Chairman/Non-Executive Director
Mr. Nauman Ansari President & CEO
Mian Muhammad Younis Independent Director
Mr. Imtiaz Ahmad Pervez Non-Executive Director
Mr. Juma Hasan Ali Abul Non-Executive Director
Mr. Abdulelah Ebrahim Mohamed AlQasimi Non-Executive Director
Mr. Abdulla Abdulaziz Ali Taleb Non-Executive Director
Mian Muhammad Younis Chairman
Mr. Ahmed Abdulrahim Mohamed Abdulla Bucheery Member
Mr. Juma Hasan Ali Abul Member
Mr. Imtiaz Ahmad Pervez Chairman
Mr. Abdulelah Ebrahim Mohamed AlQasimi Member
Mr. Abdulla Abdulaziz Ali Taleb Member
Mr. Nauman Ansari Member
Mr. Ahmed Abdulrahim Mohamed Abdulla Bucheery Chairman
Mr. Juma Hasan Ali Abul Member
Mian Muhammad Younis Member
Mr. Farooq Rahmatullah Member
Mr. Nauman Ansari Member
Mr. Farooq Rahmatullah Chairman
Mr. Ahmed Abdulrahim Mohamed Abdulla Bucheery Member
Mr. Juma Hasan Ali Abul Member
Mr. Nauman Ansari Member
CORPORATE INFORMATION
Syed Majid Ali Chief Financial Officer
Mr. Aurangzeb Amin Company Secretary & Head of Legal
M/s. A.F. Ferguson & Co, Chartered Accountants Auditors
M/s. Mohsin Tayebaly & Co, Advocate Legal Advisors
Faysal Bank Limited M/s. Central Depository Company of
Pakistan LimitedFaysal House, St-02, Commercial Lain,(Share Registrar Department)Main Shahrah-e-Faisal,CDC House, 99-B, Block-B,Karachi-PakistanSMCHS, Main Shahra-e-Faisal,
Karachi-74400
UAN : (92-21) 111-747-747
Tel : (92-21) 3279-5200 Tel: (92-21) 111-111-500
Fax : (92-21) 3279-5226 Fax: (92-21) 34326053
Website: www.faysalbank.com Email: [email protected]
Registered Office Share Registrar
CORPORATE INFORMATION
MHalf Year June 30, 2016 MHalf Year June 30, 20164 5
DIRECTORS’ REVIEW
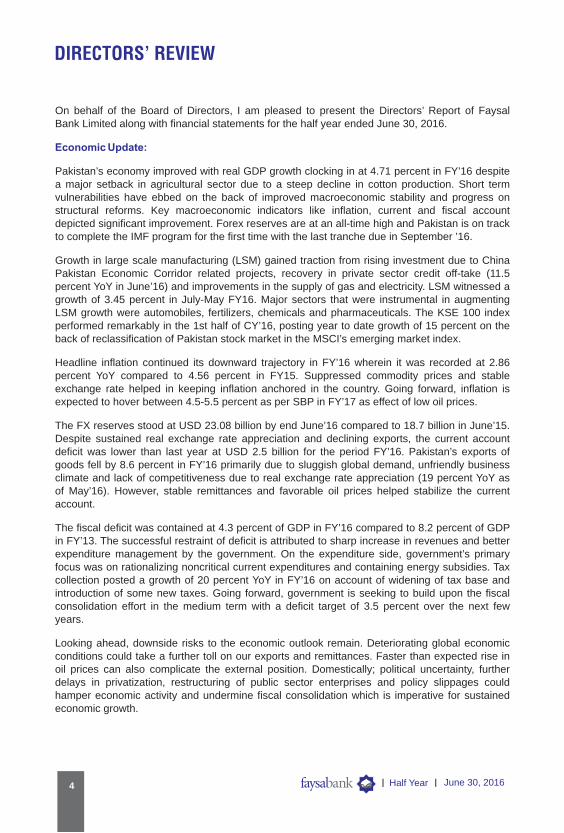
On behalf of the Board of Directors, I am pleased to present the Directors’ Report of Faysal Bank Limited along with financial statements for the half year ended June 30, 2016.
Pakistan’s economy improved with real GDP growth clocking in at 4.71 percent in FY’16 despite a major setback in agricultural sector due to a steep decline in cotton production. Short term vulnerabilities have ebbed on the back of improved macroeconomic stability and progress on structural reforms. Key macroeconomic indicators like inflation, current and fiscal account depicted significant improvement. Forex reserves are at an all-time high and Pakistan is on track to complete the IMF program for the first time with the last tranche due in September ’16.
Growth in large scale manufacturing (LSM) gained traction from rising investment due to China Pakistan Economic Corridor related projects, recovery in private sector credit off-take (11.5 percent YoY in June’16) and improvements in the supply of gas and electricity. LSM witnessed a growth of 3.45 percent in July-May FY16. Major sectors that were instrumental in augmenting LSM growth were automobiles, fertilizers, chemicals and pharmaceuticals. The KSE 100 index performed remarkably in the 1st half of CY’16, posting year to date growth of 15 percent on the back of reclassification of Pakistan stock market in the MSCI’s emerging market index.
Headline inflation continued its downward trajectory in FY’16 wherein it was recorded at 2.86 percent YoY compared to 4.56 percent in FY15. Suppressed commodity prices and stable exchange rate helped in keeping inflation anchored in the country. Going forward, inflation is expected to hover between 4.5-5.5 percent as per SBP in FY’17 as effect of low oil prices.
The FX reserves stood at USD 23.08 billion by end June’16 compared to 18.7 billion in June’15. Despite sustained real exchange rate appreciation and declining exports, the current account deficit was lower than last year at USD 2.5 billion for the period FY’16. Pakistan’s exports of goods fell by 8.6 percent in FY’16 primarily due to sluggish global demand, unfriendly business climate and lack of competitiveness due to real exchange rate appreciation (19 percent YoY as of May’16). However, stable remittances and favorable oil prices helped stabilize the current account.
The fiscal deficit was contained at 4.3 percent of GDP in FY’16 compared to 8.2 percent of GDP in FY’13. The successful restraint of deficit is attributed to sharp increase in revenues and better expenditure management by the government. On the expenditure side, government’s primary focus was on rationalizing noncritical current expenditures and containing energy subsidies. Tax collection posted a growth of 20 percent YoY in FY’16 on account of widening of tax base and introduction of some new taxes. Going forward, government is seeking to build upon the fiscal consolidation effort in the medium term with a deficit target of 3.5 percent over the next few years.
Looking ahead, downside risks to the economic outlook remain. Deteriorating global economic conditions could take a further toll on our exports and remittances. Faster than expected rise in oil prices can also complicate the external position. Domestically; political uncertainty, further delays in privatization, restructuring of public sector enterprises and policy slippages could hamper economic activity and undermine fiscal consolidation which is imperative for sustained economic growth.
Economic Update:
Bank’s Performance:
Project Financing & Syndication
Infrastructure Development
Product development & New Initiatives
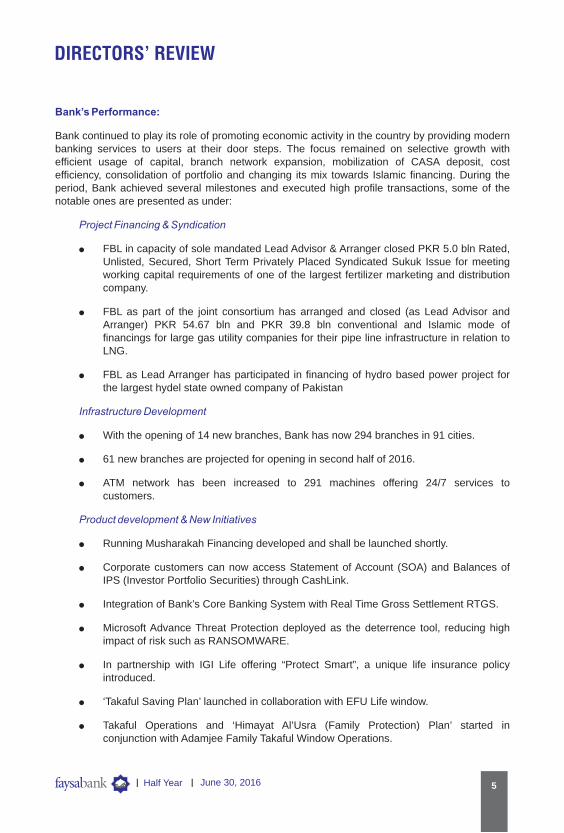
Bank continued to play its role of promoting economic activity in the country by providing modern banking services to users at their door steps. The focus remained on selective growth with efficient usage of capital, branch network expansion, mobilization of CASA deposit, cost efficiency, consolidation of portfolio and changing its mix towards Islamic financing. During the period, Bank achieved several milestones and executed high profile transactions, some of the notable ones are presented as under:
lFBL in capacity of sole mandated Lead Advisor & Arranger closed PKR 5.0 bln Rated, Unlisted, Secured, Short Term Privately Placed Syndicated Sukuk Issue for meeting working capital requirements of one of the largest fertilizer marketing and distribution company.
lFBL as part of the joint consortium has arranged and closed (as Lead Advisor and Arranger) PKR 54.67 bln and PKR 39.8 bln conventional and Islamic mode of financings for large gas utility companies for their pipe line infrastructure in relation to LNG.
lFBL as Lead Arranger has participated in financing of hydro based power project for the largest hydel state owned company of Pakistan
lWith the opening of 14 new branches, Bank has now 294 branches in 91 cities.
l61 new branches are projected for opening in second half of 2016.
lATM network has been increased to 291 machines offering 24/7 services to customers.
lRunning Musharakah Financing developed and shall be launched shortly.
lCorporate customers can now access Statement of Account (SOA) and Balances of IPS (Investor Portfolio Securities) through CashLink.
lIntegration of Bank’s Core Banking System with Real Time Gross Settlement RTGS.
lMicrosoft Advance Threat Protection deployed as the deterrence tool, reducing high impact of risk such as RANSOMWARE.
lIn partnership with IGI Life offering “Protect Smart”, a unique life insurance policy introduced.
l‘Takaful Saving Plan’ launched in collaboration with EFU Life window.
lTakaful Operations and ‘Himayat Al’Usra (Family Protection) Plan’ started in conjunction with Adamjee Family Takaful Window Operations.
DIRECTORS’ REVIEW
MHalf Year June 30, 2016 MHalf Year June 30, 20164 5
DIRECTORS’ REVIEW
On behalf of the Board of Directors, I am pleased to present the Directors’ Report of Faysal Bank Limited along with financial statements for the half year ended June 30, 2016.
Pakistan’s economy improved with real GDP growth clocking in at 4.71 percent in FY’16 despite a major setback in agricultural sector due to a steep decline in cotton production. Short term vulnerabilities have ebbed on the back of improved macroeconomic stability and progress on structural reforms. Key macroeconomic indicators like inflation, current and fiscal account depicted significant improvement. Forex reserves are at an all-time high and Pakistan is on track to complete the IMF program for the first time with the last tranche due in September ’16.
Growth in large scale manufacturing (LSM) gained traction from rising investment due to China Pakistan Economic Corridor related projects, recovery in private sector credit off-take (11.5 percent YoY in June’16) and improvements in the supply of gas and electricity. LSM witnessed a growth of 3.45 percent in July-May FY16. Major sectors that were instrumental in augmenting LSM growth were automobiles, fertilizers, chemicals and pharmaceuticals. The KSE 100 index performed remarkably in the 1st half of CY’16, posting year to date growth of 15 percent on the back of reclassification of Pakistan stock market in the MSCI’s emerging market index.
Headline inflation continued its downward trajectory in FY’16 wherein it was recorded at 2.86 percent YoY compared to 4.56 percent in FY15. Suppressed commodity prices and stable exchange rate helped in keeping inflation anchored in the country. Going forward, inflation is expected to hover between 4.5-5.5 percent as per SBP in FY’17 as effect of low oil prices.
The FX reserves stood at USD 23.08 billion by end June’16 compared to 18.7 billion in June’15. Despite sustained real exchange rate appreciation and declining exports, the current account deficit was lower than last year at USD 2.5 billion for the period FY’16. Pakistan’s exports of goods fell by 8.6 percent in FY’16 primarily due to sluggish global demand, unfriendly business climate and lack of competitiveness due to real exchange rate appreciation (19 percent YoY as of May’16). However, stable remittances and favorable oil prices helped stabilize the current account.
The fiscal deficit was contained at 4.3 percent of GDP in FY’16 compared to 8.2 percent of GDP in FY’13. The successful restraint of deficit is attributed to sharp increase in revenues and better expenditure management by the government. On the expenditure side, government’s primary focus was on rationalizing noncritical current expenditures and containing energy subsidies. Tax collection posted a growth of 20 percent YoY in FY’16 on account of widening of tax base and introduction of some new taxes. Going forward, government is seeking to build upon the fiscal consolidation effort in the medium term with a deficit target of 3.5 percent over the next few years.
Looking ahead, downside risks to the economic outlook remain. Deteriorating global economic conditions could take a further toll on our exports and remittances. Faster than expected rise in oil prices can also complicate the external position. Domestically; political uncertainty, further delays in privatization, restructuring of public sector enterprises and policy slippages could hamper economic activity and undermine fiscal consolidation which is imperative for sustained economic growth.
Economic Update:
Bank’s Performance:
Project Financing & Syndication
Infrastructure Development
Product development & New Initiatives
Bank continued to play its role of promoting economic activity in the country by providing modern banking services to users at their door steps. The focus remained on selective growth with efficient usage of capital, branch network expansion, mobilization of CASA deposit, cost efficiency, consolidation of portfolio and changing its mix towards Islamic financing. During the period, Bank achieved several milestones and executed high profile transactions, some of the notable ones are presented as under:
lFBL in capacity of sole mandated Lead Advisor & Arranger closed PKR 5.0 bln Rated, Unlisted, Secured, Short Term Privately Placed Syndicated Sukuk Issue for meeting working capital requirements of one of the largest fertilizer marketing and distribution company.
lFBL as part of the joint consortium has arranged and closed (as Lead Advisor and Arranger) PKR 54.67 bln and PKR 39.8 bln conventional and Islamic mode of financings for large gas utility companies for their pipe line infrastructure in relation to LNG.
lFBL as Lead Arranger has participated in financing of hydro based power project for the largest hydel state owned company of Pakistan
lWith the opening of 14 new branches, Bank has now 294 branches in 91 cities.
l61 new branches are projected for opening in second half of 2016.
lATM network has been increased to 291 machines offering 24/7 services to customers.
lRunning Musharakah Financing developed and shall be launched shortly.
lCorporate customers can now access Statement of Account (SOA) and Balances of IPS (Investor Portfolio Securities) through CashLink.
lIntegration of Bank’s Core Banking System with Real Time Gross Settlement RTGS.
lMicrosoft Advance Threat Protection deployed as the deterrence tool, reducing high impact of risk such as RANSOMWARE.
lIn partnership with IGI Life offering “Protect Smart”, a unique life insurance policy introduced.
l‘Takaful Saving Plan’ launched in collaboration with EFU Life window.
lTakaful Operations and ‘Himayat Al’Usra (Family Protection) Plan’ started in conjunction with Adamjee Family Takaful Window Operations.
DIRECTORS’ REVIEW
MHalf Year June 30, 2016 MHalf Year June 30, 20166 7
Training & Development
Corporate Social Responsibility
Significant Achievements
Financial Perspective
Management Information
Future Outlook:
l
acquisition as well as internal talent channel.
lRelationship Managers were trained in a 12 day training program, trainees were also sent to various branches for 3 months on job training.
lCritical staff were sent for NIBAF’s Islamic Banking Certificate Course.
l5 day Islamic Banking Certification Programs were arranged for 127 new staff at Karachi, Lahore and Islamabad.
lEnrolled new educational NPOs i.e. Education Trust Nasra Schools, School of Leadership Foundation and Hilal Public Schools System.
lSponsored bed elevators at Burns Centre.
lDialysis machine donated to ‘Welfare Society for Patient Care’.
lDeposits have crossed PKR 300 bln.
lBalance sheet footing has crossed PKR 450 bln.
lBank recoverey drive from delinquent clients has paid dividends and contributed PKR 581M towards profitability.
lFaysal Bank debit card activity increased by 28%.
lMobit – Mobile Banking Application for both iOS and Android mobile devices was launched.
lMobit – Internet Banking subscribers have increased by 97% during last six months.
The Financial Control Unit has developed numerous tailor made MIS reports in QlikView with drill down capability to provide timely and accurate data. Developed dashboards provide multidimensional reports with regards to deposits, credit & trade. Businesses have been provided with their customer wise profitability to evaluate their relationships and to explore cross sale opportunities.
The bank has adopted a strategy of sharp focus on growing Islamic business. In this regard, it has been decided that going forward all branch expansion shall be under Islamic window. In line with Bank’s strategy, Bank has already opened 14 of out of 75 planned branches and work at a
Talent pool created for recruiting staff in new branches through external talent
DIRECTORS’ REVIEW
rapid pace is going on for opening of remaining branches in 2016. Branches are expected to bear low cost core deposits and assist in reducing cost of funds. Through this initiative, Bank will be able to cater banking requirements of local businessmen and increase its reach to far flung areas. Branches have also been transformed to a multiproduct selling hub through facilitation, persuasion and training.
Bank has earned Profit after Tax (PAT) of PKR 2.818 bln during 1st half of 2016 against PKR 2.568 bln for corresponding period of 2015, reflecting 10% improvement. This result is achieved despite imposition of Super Tax of PKR 347 mln in federal budget. EPS of the Bank increased to PKR 2.35 from PKR 2.14 as compared to corresponding period last year.
The banking industry is witnessing a period of low spreads and its impact can be seen at the operating profit level as given above. To improve spreads in low interest rate scenario, Bank’s efforts is to aggressively pursue delinquent clients, mobilize low cost core deposit and achieve cost efficiency. Bank has increased CASA deposits mix by 113 bps i.e. from 67.25% of Dec’ 15 to 68.38% as of June 2016. Resultantly, cost of funds reduced by 58 bps making significant contribution towards spread. NPLs recoveries contributed PKR 581 mln to the profitability and due to expenses management bank’s expense to revenue ratio is 52.7% percent.
The Bank’s is showing a growth in non-funded income and exploring avenues of sustainable generation of fees & commission from trade business and consumers.
NPL coverage stands at a healthy level of 80.7% against 79.1% for Dec’15 which reflects that the bank has taken sufficient provision on impaired assets and there is low likelihood of any significant provision charge in coming years.
On the balance sheet side capital base increased due to internal generation. Deposits are at PKR 315.1 bln, showing a growth of 7.9%, while focus remains on mobilizing low cost core deposits. Total assets of your Bank are in excess of PKR 450 bln.
Financial Highlights:
DIRECTORS’ REVIEW
June2016
June2015
PKR in million
Operating profit 5,347
Provision for non-performing advances (454) (725)
Provision for diminution in value of investments (259)
Provision against off balance sheet obligations
(441) (984)
Profit before taxation 4,364 4,363
Provision for taxation (1,546) (1,795)
Profit after taxation 2,568
Earnings per share – Rupees 2.14
-
9
4
4,805
2,818
2.35

MHalf Year June 30, 2016 MHalf Year June 30, 20168 9
In conclusion, Bank’s balance sheet composition and earnings are in line with Strategy.
JCR-VIS Credit Rating Company Limited (JCR) and Pakistan Credit Rating Agency Limited (PACRA) have re-affirmed the following entity ratings as of December 31, 2015:
Long-Term AA
Short-Term A1+
Stable outlook has been assigned to the ratings by both the rating agencies.
Definitions of JCR-VIS for the assigned ratings are reproduced below:
“AA: High credit quality. Protection factors are strong. Risk is modest but may vary slightly from time to time because of economic conditions.
A1+: High certainty of timely payment. Short term liquidity including internal operating factors and/or access to alternative sources of funds; is outstanding and safety is just below risk free Government of Pakistan short-term obligations.”
Definitions of PACRA for the assigned ratings are reproduced below:
“AA: Very high credit quality. “AA” rating denotes a very low expectation of credit risk. It indicates very strong capacity for timely payment of financial commitments. This capacity is not significantly vulnerable to foreseeable events.
A1+: Obligations supported by the highest capacity for timely repayment.”
I would like to take this opportunity to thank on behalf of the Board and Management of the bank, the shareholders for the trust they have reposed in the Bank. I am also grateful to the State Bank of Pakistan and Securities and Exchange Commission of Pakistan for their continued support and guidance and the customers for their patronage. I would also like to express sincere appreciation for the employees of the Bank for their dedication and hard work.
On behalf of the Board of DirectorsPresident & CEO
KarachiDated: August 25, 2016
Credit Rating:
Acknowledgement:
DIRECTORS’ REVIEW
Introduction
Scope of Review
Conclusion
We have reviewed the accompanying condensed interim statement of financial position of Faysal Bank Limited as at June 30, 2016 and the related condensed interim profit and loss account, condensed interim statement of comprehensive income, condensed interim statement of changes in equity, condensed interim cash flow statement and notes to the accounts for the half year then ended (here-in-after referred to as the “condensed interim financial information”). Management is responsible for the preparation and presentation of this condensed interim financial information in accordance with approved accounting standards as applicable in Pakistan for interim financial reporting. Our responsibility is to express a conclusion on this condensed interim financial information based on our review. The figures of the condensed interim profit and loss account and condensed interim statement of comprehensive income for the quarters ended March 31, 2016 and March 31, 2015 have not been reviewed, as we are required to review only the cumulative figures for the half year ended June 30, 2016.
We conducted our review in accordance with International Standard on Review Engagements 2410, ‘Review of Interim Financial Information Performed by the Independent Auditor of the Entity.’ A review of interim financial information consists of making inquiries, primarily of persons responsible for financial and accounting matters, and applying analytical and other review procedures. A review is substantially less in scope than an audit conducted in accordance with International Standards on Auditing and consequently does not enable us to obtain assurance that we would become aware of all significant matters that might be identified in an audit. Accordingly, we do not express an audit opinion.
Based on our review, nothing has come to our attention that causes us to believe that the accompanying condensed interim financial information as of and for the half year ended June 30, 2016 is not prepared, in all material respects, in accordance with approved accounting standards as applicable in Pakistan for interim financial reporting.
Chartered Accountants Engagement Partner: Noman Abbas Sheikh
Dated: August 29, 2016Karachi
INDEPENDENT AUDITORS’ REPORT ON REVIEW OF CONDENSED INTERIM FINANCIAL INFORMATION TO THE MEMBERS

MHalf Year June 30, 2016 MHalf Year June 30, 201610 11
CONDENSED INTERIM STATEMENT OF FINANCIAL POSITIONAS AT JUNE 30, 2016
PRESIDENT & CEO DIRECTOR DIRECTOR DIRECTOR
Note
Un-auditedJune 30,
2016
AuditedDecember 31,
2015
ASSETS
Cash and balances with treasury banks 27,186,191 26,084,007
Balances with other banks 9 1,243,785 1,068,451
Lendings to financial institutions 396,981 250,000Investments 10 205,645,877 195,515,642
Advances 11 195,295,168 181,089,804Operating fixed assets 12 10,657,695 11,342,980
Deferred tax assets - net 3,034,106 3,087,325Other assets 13 11,634,651
430,072,860
LIABILITIES
Bills payable 6,868,891 6,009,238Borrowings 90,843,226 90,565,242
Deposits and other accounts 14 315,082,596 292,130,258Sub-ordinated loans 2,245,500 2,994,000
Liabilities against assets subject to finance lease - -Deferred tax liabilities - net - -
Other liabilities 8,021,649
399,720,387NET ASSETS 30,352,473
REPRESENTED BY
Share capital 11,997,601 11,997,601
Reserves 6,360,328 6,422,761Unappropriated profit 7,638,330
26,058,692Surplus on revaluation of assets - net of tax 15 4,581,889 4,293,781
30,352,473
CONTINGENCIES AND COMMITMENTS 16
The annexed notes 1 to 29 form an integral part of this condensed interim financial information.
-------------------Rupees '000------------------
12,409,515
455,869,318
8,570,517
423,610,73032,258,588
9,318,770
27,676,699
32,258,588
CONDENSED INTERIM PROFIT AND LOSS ACCOUNT (UN-AUDITED)FOR THE QUARTER AND HALF YEAR ENDED JUNE 30, 2016
PRESIDENT & CEO DIRECTOR DIRECTOR DIRECTOR
Note June 30,2016
June 30,2015
June 30,2016
June 30,2015
Mark-up / return / interest earned 17 8,103,216 16,536,332Mark-up / return / interest expensed 18 4,647,331 9,315,434Net mark-up / interest income 3,455,885 7,220,898
Provision against non-performing loans and advances - net 11.2 376,634 642,749 503,268 780,993Provision / (reversal) for consumer and small enterprise
loans - general 11.3 5,713 (1,501) 1,220 (3,960)(Reversal) / provision against off balance sheet obligations (4,285) - (4,086) -(Reversal) / provision for diminution in value of investments - net 10.6 (2,610) 131,662 (8,865) 258,714Recoveries against written-off debts - net (25,660) (23,150) (50,664) (51,878)
349,792 749,760 440,873 983,869Net mark-up / interest income after provisions 2,706,125 6,237,029
Non mark-up / interest incomeFee, commission and brokerage income 767,988 592,796 1,342,271 1,202,774Dividend income 19 127,542 144,550 180,366 205,409Income from dealing in foreign currencies 20 279,916 217,885 522,203 471,403Gain on sale of securities - net 21 1,396,033 398,851 2,110,773 1,667,991Unrealised gain / (loss) on revaluation of investments
classified as held for trading - net (7,998) (11,622) 6,192 (100,107)Other income 22 72,322 140,629 155,452 176,560Total non mark-up / interest income 2,635,803 1,483,089 4,317,257 3,624,030
4,189,214 9,861,059Non mark-up / interest expensesAdministrative expenses 2,695,421 5,402,401Other provisions / (reversals) - net (35,265) (12,839)Other charges 40,757 105,869Total non mark-up / interest expenses 2,700,913 5,495,431
1,488,301 4,365,628Share of (loss) / profit from associate (2,545) 461 (9,797) (2,527)Extraordinary / unusual items - - - -Profit before taxation 1,488,762 4,363,101
Taxation - Current 752,057 626,689 1,597,875 1,743,874Taxation - Prior years (393,128) 264,797 (393,128) 264,797Taxation - Deferred (90,722) (213,470)
800,764 1,795,201Profit after taxation 687,998 2,567,900
Basic earnings per share 23 2.14
The annexed notes 1 to 29 form an integral part of this condensed interim financial information.
Half year endedQuarter ended
0.57
6,512,7523,596,7512,916,181
13,280,6057,219,2676,061,338
2,566,389 5,620,465
5,202,192 9,937,722
2,876,21310,02036,699
2,922,9322,279,260
2,276,715
5,466,77010,02086,870
5,563,6604,374,062
4,364,265
457,036815,965
1,460,750
341,4021,546,1492,818,116
1.22 2.35
FOR THE YEAR ENDED DECEMBER 31, 2015
CONTENTS
Rupees `000
Rupees `000
lFBL has successfully closed as Joint Mandated Lead Arranger and Structuring Agent an SBLC amounting to PKR Equivalent of USD 16 Mln on behalf of an upcoming indigenous coal base
---------------------------Rupees '000------------------------
------------------------------Rupees ---------------------------
MHalf Year June 30, 2016 MHalf Year June 30, 201612 13
PRESIDENT & CEO DIRECTOR DIRECTOR DIRECTOR
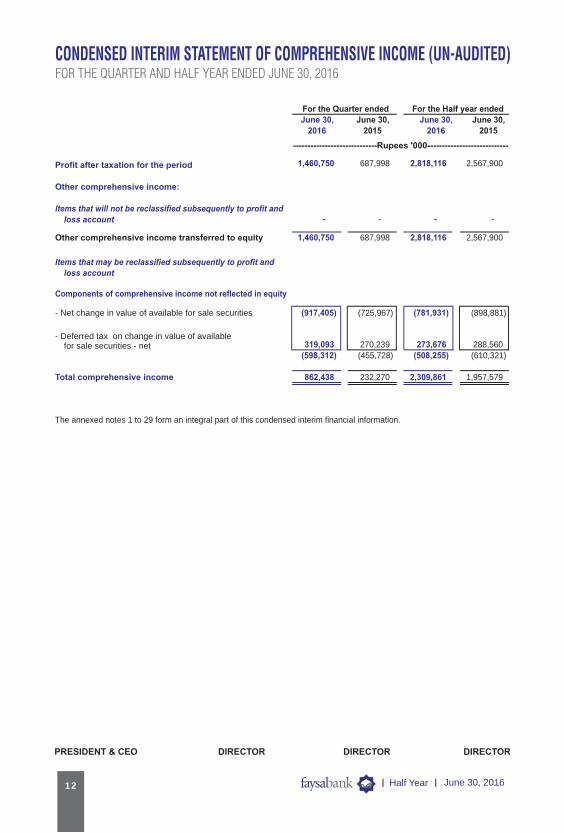
CONDENSED INTERIM STATEMENT OF COMPREHENSIVE INCOME (UN-AUDITED)FOR THE QUARTER AND HALF YEAR ENDED JUNE 30, 2016
June 30, June 30, June 30, June 30,
2016 2015 2016 2015
Profit after taxation for the period 687,998 2,567,900
Other comprehensive income:
Items that will not be reclassified subsequently to profit and- - - -loss account
Other comprehensive income transferred to equity 687,998 2,567,900
Items that may be reclassified subsequently to profit and
loss account
Components of comprehensive income not reflected in equity
- Net change in value of available for sale securities (917,405) (725,967) (781,931) (898,881)
- Deferred tax on change in value of available for sale securities - net 319,093 270,239 273,676 288,560
(598,312) (455,728) (508,255) (610,321)
Total comprehensive income 232,270 1,957,579
The annexed notes 1 to 29 form an integral part of this condensed interim financial information.
For the Half year endedFor the Quarter ended
1,460,750
1,460,750
862,438
2,818,116
2,818,116
2,309,861
-----------------------------Rupees '000----------------------------
PRESIDENT & CEO DIRECTOR DIRECTOR DIRECTOR
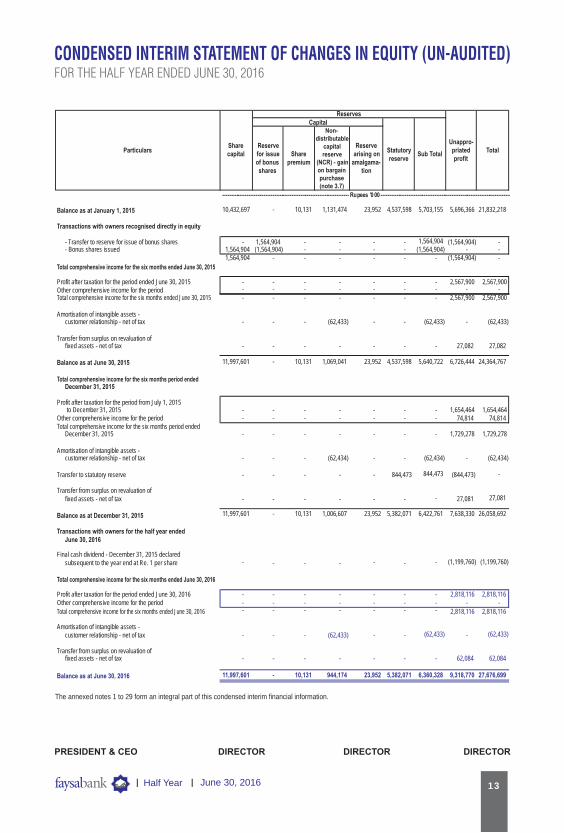
CONDENSED INTERIM STATEMENT OF CHANGES IN EQUITY (UN-AUDITED)FOR THE HALF YEAR ENDED JUNE 30, 2016
Balance as at January 1, 2015 10,432,697 - 10,131 1,131,474 23,952 4,537,598 5,703,155 5,696,366 21,832,218
Transactions with owners recognised directly in equity
- Transfer to reserve for issue of bonus shares - 1,564,904 - - - - 1,564,904 (1,564,904) -- Bonus shares issued 1,564,904 (1,564,904) - - - - (1,564,904) - -
1,564,904 - - - - - - (1,564,904) -
Total comprehensive income for the six months ended June 30, 2015
Profit after taxation for the period ended June 30, 2015 - - - - - - - 2,567,900 2,567,900Other comprehensive income for the period - - - - - - - - -Total comprehensive income for the six months ended June 30, 2015 - - - - - - - 2,567,900 2,567,900
Amortisation of intangible assets -customer relationship - net of tax - - - (62,433) - - (62,433) - (62,433)
Transfer from surplus on revaluation offixed assets - net of tax - - - - - - - 27,082 27,082
Balance as at June 30, 2015 11,997,601 - 10,131 1,069,041 23,952 4,537,598 5,640,722 6,726,444 24,364,767
Total comprehensive income for the six months period ended December 31, 2015
Profit after taxation for the period from July 1, 2015 to December 31, 2015 - - - - - - - 1,654,464 1,654,464
Other comprehensive income for the period - - - - - - - 74,814 74,814Total comprehensive income for the six months period ended
December 31, 2015 - - - - - - - 1,729,278 1,729,278
Amortisation of intangible assets -customer relationship - net of tax - - - (62,434) - - (62,434) - (62,434)
Transfer to statutory reserve - - - - - 844,473 844,473 (844,473) -
Transfer from surplus on revaluation offixed assets - net of tax - - - - - - - 27,081 27,081
Balance as at December 31, 2015 11,997,601 - 10,131 1,006,607 23,952 5,382,071 6,422,761 7,638,330 26,058,692
Transactions with owners for the half year endedJune 30, 2016
Final cash dividend - December 31, 2015 declaredsubsequent to the year end at Re. 1 per share - - - - - - - (1,199,760) (1,199,760)
Total comprehensive income for the six months ended June 30, 2016
Profit after taxation for the period ended June 30, 2016 - - - - - - -Other comprehensive income for the period - - - - - - - - -
Total comprehensive income for the six months ended June 30, 2016 - - - - - - -
Amortisation of intangible assets -customer relationship - net of tax - - - (62,433) - - (62,433) - (62,433)
Transfer from surplus on revaluation offixed assets - net of tax - - - - - - - 62,084 62,084
Balance as at June 30, 2016 11,997,601 - 10,131 944,174 23,952 5,382,071 6,360,328
The annexed notes 1 to 29 form an integral part of this condensed interim financial information.
ParticularsSharecapital
Reservefor issueof bonus shares
Unappro-priatedprofit
Statutoryreserve
TotalReserve
arising on amalgama-
tion
Reserves
Sub Total
CapitalNon-
distributable capital reserve
(NCR) - gain on bargain purchase (note 3.7)
Share premium
2,818,116 2,818,116
2,818,116 2,818,116
9,318,770 27,676,699
MHalf Year June 30, 2016 MHalf Year June 30, 201612 13
PRESIDENT & CEO DIRECTOR DIRECTOR DIRECTOR
CONDENSED INTERIM STATEMENT OF COMPREHENSIVE INCOME (UN-AUDITED)FOR THE QUARTER AND HALF YEAR ENDED JUNE 30, 2016
June 30, June 30, June 30, June 30,
2016 2015 2016 2015
Profit after taxation for the period 687,998 2,567,900
Other comprehensive income:
Items that will not be reclassified subsequently to profit and- - - -loss account
Other comprehensive income transferred to equity 687,998 2,567,900
Items that may be reclassified subsequently to profit and
loss account
Components of comprehensive income not reflected in equity
- Net change in value of available for sale securities (917,405) (725,967) (781,931) (898,881)
- Deferred tax on change in value of available for sale securities - net 319,093 270,239 273,676 288,560
(598,312) (455,728) (508,255) (610,321)
Total comprehensive income 232,270 1,957,579
The annexed notes 1 to 29 form an integral part of this condensed interim financial information.
For the Half year endedFor the Quarter ended
1,460,750
1,460,750
862,438
2,818,116
2,818,116
2,309,861
-----------------------------Rupees '000----------------------------
PRESIDENT & CEO DIRECTOR DIRECTOR DIRECTOR
CONDENSED INTERIM STATEMENT OF CHANGES IN EQUITY (UN-AUDITED)FOR THE HALF YEAR ENDED JUNE 30, 2016
Balance as at January 1, 2015 10,432,697 - 10,131 1,131,474 23,952 4,537,598 5,703,155 5,696,366 21,832,218
Transactions with owners recognised directly in equity
- Transfer to reserve for issue of bonus shares - 1,564,904 - - - - 1,564,904 (1,564,904) -- Bonus shares issued 1,564,904 (1,564,904) - - - - (1,564,904) - -
1,564,904 - - - - - - (1,564,904) -
Total comprehensive income for the six months ended June 30, 2015
Profit after taxation for the period ended June 30, 2015 - - - - - - - 2,567,900 2,567,900Other comprehensive income for the period - - - - - - - - -Total comprehensive income for the six months ended June 30, 2015 - - - - - - - 2,567,900 2,567,900
Amortisation of intangible assets -customer relationship - net of tax - - - (62,433) - - (62,433) - (62,433)
Transfer from surplus on revaluation offixed assets - net of tax - - - - - - - 27,082 27,082
Balance as at June 30, 2015 11,997,601 - 10,131 1,069,041 23,952 4,537,598 5,640,722 6,726,444 24,364,767
Total comprehensive income for the six months period ended December 31, 2015
Profit after taxation for the period from July 1, 2015 to December 31, 2015 - - - - - - - 1,654,464 1,654,464
Other comprehensive income for the period - - - - - - - 74,814 74,814Total comprehensive income for the six months period ended
December 31, 2015 - - - - - - - 1,729,278 1,729,278
Amortisation of intangible assets -customer relationship - net of tax - - - (62,434) - - (62,434) - (62,434)
Transfer to statutory reserve - - - - - 844,473 844,473 (844,473) -
Transfer from surplus on revaluation offixed assets - net of tax - - - - - - - 27,081 27,081
Balance as at December 31, 2015 11,997,601 - 10,131 1,006,607 23,952 5,382,071 6,422,761 7,638,330 26,058,692
Transactions with owners for the half year endedJune 30, 2016
Final cash dividend - December 31, 2015 declaredsubsequent to the year end at Re. 1 per share - - - - - - - (1,199,760) (1,199,760)
Total comprehensive income for the six months ended June 30, 2016
Profit after taxation for the period ended June 30, 2016 - - - - - - -Other comprehensive income for the period - - - - - - - - -
Total comprehensive income for the six months ended June 30, 2016 - - - - - - -
Amortisation of intangible assets -customer relationship - net of tax - - - (62,433) - - (62,433) - (62,433)
Transfer from surplus on revaluation offixed assets - net of tax - - - - - - - 62,084 62,084
Balance as at June 30, 2016 11,997,601 - 10,131 944,174 23,952 5,382,071 6,360,328
The annexed notes 1 to 29 form an integral part of this condensed interim financial information.
ParticularsSharecapital
Reservefor issueof bonus shares
Unappro-priatedprofit
Statutoryreserve
TotalReserve
arising on amalgama-
tion
Reserves
Sub Total
CapitalNon-
distributable capital reserve
(NCR) - gain on bargain purchase (note 3.7)
Share premium
2,818,116 2,818,116
2,818,116 2,818,116
9,318,770 27,676,699

MHalf Year June 30, 2016 MHalf Year June 30, 201614 15
PRESIDENT & CEO DIRECTOR DIRECTOR DIRECTOR
CONDENSED INTERIM CASH FLOW STATEMENT (UN-AUDITED)FOR THE HALF YEAR ENDED JUNE 30, 2016
CASH FLOWS FROM OPERATING ACTIVITIESProfit before taxation 4,363,101Less: Dividend income (180,366) (205,409)
4,157,692Adjustments for non-cash and other items:
Depreciation 334,401 302,942Amortisation 106,852 111,696Workers' Welfare Fund 93,171 101,684Provision against non-performing loans and advances - net 503,268 780,993Provision / (reversal) for consumer and small enterprise loans - general 1,220 (3,960)(Reversal) / provision for diminution in value of investments - net (8,865) 258,714Charge / (reversal) of other provisions - net 10,020 (12,839)(Reversal) / provision against off balance sheet obligations (4,086) -Unrealised (gain) / loss on revaluation of investments classified as held for trading (6,192) 100,107Net profit on disposal of property and equipment (53,490) (4,655)Net gain on disposal of non-banking assets - (103,798)Charge for defined benefit plan 44,702 50,407Amortisation of prepaid employee benefits 19,118 68,920Recoveries against written-off debts (50,664) (51,878)Share of loss of associate 9,797 2,527
999,252 1,600,8605,758,552
(Increase) / decrease in operating assetsLendings to financial institutions (146,981) (7,820,125)Held for trading securities (4,884,110) 15,066,086Advances (14,659,188) (5,643,364)Other assets (950,838) (1,675,143)
(20,641,117) (72,546)Increase / (decrease) in operating liabilities
Bills payable 859,653 852,070Borrowings 522,499 47,773,836Deposits and other accounts 22,952,338 12,809,919Other liabilities 543,928 (711,047)
24,878,418 60,724,7789,420,452 66,410,784
Income tax paid (243,587) (515,643)Net cash generated from operating activities 65,895,141
CASH FLOWS FROM INVESTING ACTIVITIESNet investment in available for sale securities (3,386,129) (62,685,316)Net investment in held to maturity securities (2,636,667) 352,514Dividend income received 99,748 95,552Investment in operating fixed assets (330,001) (499,365)Proceeds realised on disposal of operating fixed assets 537,450 5,805Proceeds realised on disposal of non-banking assets - 177,124Net cash used in investing activities (5,715,599) (62,553,686)
CASH FLOWS FROM FINANCING ACTIVITIESPayments of sub-ordinated loan (748,500) (600)Dividends paid (1,190,733) (32)Net cash used in financing activities (1,939,233) (632)
Increase in cash and cash equivalents 1,522,033 3,340,823Cash and cash equivalents at the beginning of the period 26,335,872 20,666,451
Cash and cash equivalents at the end of the period 27,857,905 24,007,274
The annexed notes 1 to 29 form an integral part of this condensed interim financial information.
June 30,
2016
June 30
2015-------------------Rupees '000------------------
4,364,265
4,183,899
5,183,151
9,176,865
NOTES TO AND FORMING PART OF THE CONDENSED INTERIM FINANCIAL INFORMATION (UN-AUDITED)FOR THE HALF YEAR ENDED JUNE 30, 2016
1 STATUS AND NATURE OF BUSINESS
1.1
1.2
2 BASIS OF PRESENTATION
2.1
2.2
3 STATEMENT OF COMPLIANCE
3.1
3.2
3.3
3.4
3.5
Faysal Bank Limited (the Bank) was incorporated in Pakistan on October 3, 1994 as a public limited company under the provisions of the Companies Ordinance, 1984. Its shares are listed on the Pakistan Stock Exchange Limited. The Bank is mainly engaged in Corporate, Commercial and Consumer banking activities. The Bank has a network of 294 branches (2015: 280); including 82 Islamic banking branches (2015: 68) and 1 Islamic sub-branch (2015: 1) in Pakistan.
The Registered Office of the Bank is located at Faysal House, ST-02, Shahra-e-Faisal, Karachi.
Ithmaar Bank B.S.C., a Bahrain based retail bank, is the parent company of the Bank, holding, directly and indirectly through subsidiaries 66.78% (2015: 66.78%) of the shareholding of the Bank. Dar Al-Maal Al-Islami Trust (DMIT), (ultimate parent of the Bank) is the holding company of Ithmaar Bank B.S.C. The DMIT group owns and operates an international network of Islamic Banks, Investment Banks and Insurance Companies.
Based on the financial statements of the Bank for the year ended December 31, 2015, the Pakistan Credit Rating Agency Limited (PACRA) and JCR-VIS Credit Rating Company Limited have determined the Bank's long-term rating as 'AA' (December 31, 2014: 'AA') and the short term rating as 'A1+' (December 31, 2014: 'A1+').
In accordance with the directives of the Federal Government regarding the shifting of the banking system to Islamic modes, the State Bank of Pakistan (SBP) has issued various circulars from time to time. Permissible forms of trade related modes of financing include purchase of goods by banks from their customers and immediate resale to them at appropriate mark-up in price on deferred payment basis. The purchases and sales arising under these arrangements are not reflected in these financial statements as such but are restricted to the amount of facility actually utilised and the appropriate portion of mark-up thereon.
The results of the Islamic banking branches have been consolidated in this condensed interim financial information for reporting purposes only. Inter branch transactions and balances have been eliminated. In accordance with the directives issued by the SBP, the key financial figures of islamic banking branches are disclosed in note 27 to this condensed interim financial information.
This condensed interim financial information has been prepared in accordance with the approved accounting standards as applicable in Pakistan. The approved accounting standards comprise of such International Financial Reporting Standards (IFRSs) issued by the International Accounting Standards Board (IASB) and Islamic Financial Accounting Standards (IFASs) issued by the Institute of Chartered Accountants of Pakistan, as are notified under the Companies Ordinance, 1984, the requirements of the Companies Ordinance, 1984, the requirements of the Banking Companies Ordinance, 1962, or the directives issued by the Securities & Exchange Commission of Pakistan (SECP) and the SBP. Wherever the requirements of the Companies Ordinance, 1984, the Banking Companies Ordinance, 1962, the IFAS notified under the Companies Ordinance, 1984 or the directives issued by the SECP and the SBP differ with the requirements of IFRSs, the requirements of the Companies Ordinance, 1984, the Banking Companies Ordinance, 1962, IFAS notified under the Companies Ordinance, 1984 or the requirements of the said directives issued by the SECP and the SBP prevail.
The SBP has deferred the applicability of International Accounting Standard (IAS) 39, 'Financial Instruments: Recognition and Measurement' and International Accounting Standard (IAS) 40, 'Investment Property' for Banking Companies through BSD Circular Letter No. 10 dated August 26, 2002 till further instructions. Further, the SECP has also deferred the applicability of International Financial Reporting Standard (IFRS) 7, 'Financial Instruments: Disclosures' through its S.R.O. 633(I)/2014 dated July 10, 2014. Accordingly, the requirements of these standards have not been considered in the preparation of this condensed interim financial information. However, investments have been classified and valued in accordance with the requirements prescribed by the SBP through various circulars.
IFRS 8, 'Operating Segments' is effective for the Bank's accounting period beginning on or after January 1, 2009. All banking companies in Pakistan are required to prepare their condensed interim financial information in line with the format prescribed under BSD Circular Letter No. 2 dated May 12, 2004. The management of the Bank believes that as the SBP has defined the segment categorisation in the above mentioned circular, the SBP's requirements prevail over the requirements specified in IFRS 8. Accordingly, segment information disclosed in this condensed interim financial information is based on the requirements laid down by the SBP.
The SBP vide its BSD Circular No. 07 dated April 20, 2010 has clarified that for the purpose of preparation of financial statements in accordance with International Accounting Standard - 1 (Revised), 'Presentation of Financial Statements', two statement approach shall be adopted i.e. separate 'Profit and Loss Account' and 'Statement of Comprehensive Income' shall be presented, and Balance Sheet shall be renamed as 'Statement of Financial Position'. Furthermore, only the surplus / (deficit) on revaluation of available for sale (AFS) securities, may be included in the 'Statement of Comprehensive Income'. However, it should continue to be shown separately in the statement of financial position below equity. Accordingly, the above requirements have been adopted in the preparation of this condensed interim financial information.
IFRS 10, 'Consolidated financial statements’, builds on existing principles by identifying the concept of control as the determining factor in whether an entity should be included within the consolidated financial statements of the parent

MHalf Year June 30, 2016 MHalf Year June 30, 201616 17
company. The standard provides additional guidance to assist where the determination of control is difficult to assess. There is no impact of the applicability of this standard on this condensed interim financial information of the Bank as the SECP has directed that the requirements of IFRS 10, 'Consolidated Financial Statements' are not applicable in case of investments by companies in mutual funds established under Trust Deed structure.
The disclosures made in this condensed interim financial information have been limited based on the format prescribed by the State Bank of Pakistan through BSD Circular Letter No. 2 dated May 12, 2004 and the requirements of International Accounting Standard 34, "Interim Financial Reporting". They do not include all of the information required for the full annual financial statements and this condensed interim financial information should be read in conjunction with the financial statements of the Bank for the year ended December 31, 2015.
As per the directive of the SBP through its letter BPRD (R&P-02)/625-99/2011/3744 dated March 28, 2011, gain arising on bargain purchase of Pakistan operations of Royal Bank of Scotland (ex-RBS Pakistan) was credited directly into equity as Non-Distributable Capital Reserve (NCR). The SBP allowed the Bank to adjust the amortisation of intangible assets against the portion of reserve which arose on account of such assets. Accordingly, during the period ended June 30, 2016 the Bank has adjusted amortisation of intangible assets amounting to Rs. 62.433 million (net of tax) from the Non-distributable Capital Reserve.
There are certain new and amended standards and interpretations that are mandatory for the Bank's accounting periods beginning on or after January 1, 2016 but are considered not to be relevant or do not have any significant effect on the Bank's operations and are, therefore, not disclosed in these condensed interim financial information.
This condensed interim financial information has been prepared under the historical cost convention, except that certain fixed assets are carried at revalued amounts and certain investments and derivative contracts have been marked to market and are carried at fair value. In addition, obligation in respect of staff retirement benefit is carried at present value.
Items included in this condensed interim financial information are measured using the currency of the primary economic environment in which the Bank operates. This condensed interim financial information is presented in Pakistani Rupees, which is the Bank's functional and presentation currency.
The accounting policies applied in the preparation of this condensed interim financial information are the same as those applied in the preparation of the annual financial statements of the Bank for the year ended December 31, 2015, except as specified below;
The Bank has changed its accounting policy effective from January 1, 2016 for recording of non-banking assets acquired in satisfaction of claims in order to comply with the requirements of the 'Regulations for Debt Property Swap' (the regulations) issued by the SBP. In line with the guidance provided in the Regulations, the non-banking assets acquired in satisfaction of claims are now carried at revalued amounts less accumulated depreciation and accumulated impairment (if any). These assets are revalued by professionally qualified valuers with sufficient regularity to ensure that their net carrying value does not differ materially from their fair value. A surplus arising on revaluation of non-banking assets acquired in satisfaction of claims is credited to the surplus on revaluation of assets account. Any deficit arising on revaluation is first set off against the surplus account for that non-banking assets, if any, or if no surplus exists, is charged to the profit and loss account. Legal fees, transfer costs and direct costs of acquiring title to the non-banking assets are charged to the profit and loss account and these are not capitalised as part of non-banking assets. Previously, non-banking assets acquired in satisfaction of claims were carried at cost (including legal fees, transfer costs and direct costs less impairment, if any). Had the accounting policy not been changed, non-banking assets as at June 30, 2016 (included in other assets in the statement of financial position) would have been lower by Rs 867.570 million while surplus on revaluation of assets (net of tax) and deferred tax assets would have been lower by Rs 855.711 million and Rs 21.842 million respectively whereas profit before tax would have been higher by Rs 9.983 million.
The basis and the methods used for critical accounting estimates and judgments adopted in this condensed interim financial information are the same as those applied in the preparation of the annual financial statements of the Bank for the year ended December 31, 2015.
The Bank's Financial Risk Management objectives and policies are consistent with those disclosed in the annual financial statements for the year ended December 31, 2015.
These include Rs 62.395 million (December 31, 2015: Rs 76.307 million) placed as per arrangements permissible under shariah.
3.6
3.7
3.8 Standards, interpretations and amendments to published approved accounting standards that are effective in the current period:
4 BASIS OF MEASUREMENT
5 FUNCTIONAL AND PRESENTATION CURRENCY
6 SUMMARY OF SIGNIFICANT ACCOUNTING POLICIES
7 CRITICAL ACCOUNTING ESTIMATES AND JUDGMENTS
8 FINANCIAL RISK MANAGEMENT
9 BALANCES WITH OTHER BANKS
NOTES TO AND FORMING PART OF THE CONDENSED INTERIM FINANCIAL INFORMATION (UN-AUDITED)FOR THE HALF YEAR ENDED JUNE 30, 2016
10 INVESTMENTS
10.1 Investments by type Note
Held for trading securities
Market Treasury Bills 2,118,365 - 2,118,365 3,204,619 - 3,204,619
Pakistan Investment Bonds 8,365,612 103,412 8,469,024 3,150,437 - 3,150,437
Fully paid up ordinary shares / certificates
of closed end mutual funds 1,134,259 - 1,134,259 482,482 - 482,482
11,618,236 103,412 11,721,648 6,837,538 - 6,837,538Available for sale securities
Market Treasury Bills 24,212,755 62,160,496 86,373,251 48,839,635 41,360,610 90,200,245
Pakistan Investment Bonds 42,952,405 14,031,314 56,983,719 19,778,584 28,710,039 48,488,623
Ijara Sukuk Bonds 4,474,933 - 4,474,933 5,919,200 - 5,919,200
Sukuk Bonds 125,000 - 125,000 - - -
Units of open end mutual funds
- Faysal Balanced Growth Fund * 12,480 - 12,480 12,480 - 12,480
- Faysal Income Growth Fund * 87,544 - 87,544 87,544 - 87,544
- Faysal Savings Growth Fund * 730,606 - 730,606 680,606 - 680,606
- Faysal Islamic Savings Growth Fund * 34,498 - 34,498 95,848 - 95,848
- Faysal Money Market Fund * 100,183 - 100,183 312,111 - 312,111
- Faysal Asset Allocation Fund * 74,691 - 74,691 75,947 - 75,947
- Faysal Financial Sector Opportunity Fund * 34,000 - 34,000 34,000 - 34,000
Fully paid up ordinary shares / modaraba certificates /
certificates of closed end mutual funds 10.2 & 10.4 4,633,617 - 4,633,617 4,271,736 - 4,271,736
Fully paid up preference shares 22,490 - 22,490 122,490 - 122,490
Term finance certificates 10.3 839,748 - 839,748 839,801 - 839,801
78,334,950 76,191,810 154,526,760 81,069,982 70,070,649 151,140,631
Held to maturity securities
Pakistan Investment Bonds 19,867,301 - 19,867,301 19,776,284 - 19,776,284
Term finance certificates 2,680,943 - 2,680,943 2,364,514 - 2,364,514
Sukuk Bonds 6,989,586 - 6,989,586 4,760,365 - 4,760,365
Other Federal Government securities 11,838,403 - 11,838,403 11,838,403 - 11,838,403
41,376,233 - 41,376,233 38,739,566 - 38,739,566
Associate *
Fully paid up ordinary shares of
Faysal Asset Management Limited 10.5 58,285 - 58,285 68,082 - 68,082
Investments at cost 131,387,704 76,295,222 207,682,926 126,715,168 70,070,649 196,785,817
Less: provision for diminution in the value of investments 10.6 &11.2.2 (3,273,898) - (3,273,898) (3,282,763) - (3,282,763)
Investments (net of provisions) 128,113,806 76,295,222 204,409,028 123,432,405 70,070,649 193,503,054
(Deficit) / surplus on revaluation of investments
classified as held for trading - net (5,983) 1,529 (4,454) (10,646) - (10,646)
Surplus on revaluation of investments
classified as available for sale - net 10.7 1,197,206 44,097 1,241,303 852,230 1,171,004 2,023,234
Total investments - net 129,305,029 76,340,848 205,645,877 124,273,989 71,241,653 195,515,642* related parties
AuditedUn-audited
TotalHeld by
Bank
Given as
collateralTotal
June 30, 2016 December 31, 2015
Held by
Bank
Given as
collateral
NOTES TO AND FORMING PART OF THE CONDENSED INTERIM FINANCIAL INFORMATION (UN-AUDITED)FOR THE HALF YEAR ENDED JUNE 30, 2016

MHalf Year June 30, 2016 MHalf Year June 30, 201618 19
10.2
10.3
10.4
10.5
These include 1,670,685 equity shares (December 31, 2015: Nil) of Agritech Limited (AGL) acquired at the rate of Rs 35 each, as a result of the exercise of put option in pursuance of the investors buy-back agreement dated July 20, 2012. The Bank has availed the relaxation provided by the SBP vide letter no BPR/BRD/Policy/2016-14898 dated June 14, 2016 in recording impairment against these shares. The Bank is required to maintain atleast 10%, 25%, 50%, 75% and 100% of the required impairment as at June 30, 2016, September 30, 2016, December 31, 2016, March 31, 2017 and June 30, 2017 respectively. Accordingly, the Bank has recorded an impairment of Rs 4.414 million against these shares during the period ended June 30, 2016. Had the SBP not provided this relaxation the profit before taxation would have been lower by 39.725 million and provision for diminution in the value of investment higher by the same amount.
These include Pre IPO investment of Rs 500 million (December 31, 2015: Rs 500 million) made in the unlisted term finance certificates (TFCs) of Dewan Cement Limited. The State Bank of Pakistan through its letter BPRD/BLRD-3/DMG/2011-1035 had advised the Banks to maintain provision at least at the level of 90% in five quarters (commencing from December 31, 2010) by December 31, 2011. The Bank as per the above directive had availed the relaxation and maintained a provision of Rs 450 million against this investment. Had the provision been made as per the time based criteria specified in the Prudential Regulations issued by the SBP, the provision for diminution in the value of investments for the period ended June 30, 2016 would have been higher by Rs 50 million (June 30, 2015: Rs 50 million) and the profit before taxation for the period ended June 30, 2016 would have been lower by Rs 50 million (June 30, 2015: Rs 50 million).
These include an investment of the Bank in unlisted shares of DHA Cogen Limited (DHA) (a related party of the Bank) representing 19.1% (2015: 19.1%) equity holding of DHA.
Investment of the Bank in Faysal Asset Management Limited (FAML) has been accounted for under the equity method of accounting as per the requirement of IAS 28 - Investment in associates and joint ventures. The Bank's share of post acquisition profit or loss is recognised using the latest available un-audited financial statements of FAML which relate to the period ended June 30, 2016 with a corresponding adjustment to the carrying amount of investment. The details of the Bank's investment, post acquisition changes and certain other details relating to FAML are as under:
10.5.1 Faysal Asset Management Limited -
percentage holding 30% (December 31, 2015: 30%)
At January 1 68,082
75,084
Post acquisition changes during the period / year
- recognised in the profit and loss account (9,797)
(7,002)
Closing Balance 58,285 68,082
Cost of investment 45,000
45,000
10.5.2 Particulars of the assets and liabilities of the associate
Assets 194,168
264,195
Liabilities (114) 38,218
Revenue 65,809 129,954
Loss (31,695) (23,291)
NOTES TO AND FORMING PART OF THE CONDENSED INTERIM FINANCIAL INFORMATION (UN-AUDITED)FOR THE HALF YEAR ENDED JUNE 30, 2016
Un-auditedJune 30,
2016
AuditedDecember 31,
2015
-------------------Rupees '000------------------
10.6 Particulars of provision for diminution in the value of investments
Opening balance 3,282,763 2,828,212
Charge during the period / year 11,239
601,616
Reversals during the period / year (20,104)
(147,065) (8,865)
454,551
Closing balance 3,273,898 3,282,763
10.7 This includes surplus of Rs 120.172 million (December 31, 2015: Rs 253.403 million) on revaluation of available for sale securities placed as per arrangements permissible under Shariah.
Note
11 ADVANCES
Loans, cash credits, running finances, etc. – in Pakistan 174,940,182 170,731,644
Net investment in finance lease – in Pakistan 10,302,312 9,796,173
185,242,494 180,527,817
Bills discounted and purchased (excluding government
treasury bills)
- Payable in Pakistan 5,900,462 3,376,937
- Payable outside Pakistan 1,259,777 1,098,911
7,160,239 4,475,848
Islamic financing and related assets 11.4 27,838,331 20,532,158
Margin financing / reverse repo transactions 88,200 88,200
Gross advances 220,329,264 205,624,023
Provision against non-performing advances 11.1 & 11.2 (24,600,204) (24,101,547)
Provision against consumer and small enterprise
loans - general 11.3 (433,892) (432,672)
(25,034,096) (24,534,219)
Advances - net of provision 195,295,168 181,089,804
NOTES TO AND FORMING PART OF THE CONDENSED INTERIM FINANCIAL INFORMATION (UN-AUDITED)FOR THE HALF YEAR ENDED JUNE 30, 2016
Un-auditedJune 30,
2016
AuditedDecember 31,
2015
-------------------Rupees '000------------------
Un-auditedJune 30,
2016
AuditedDecember 31,
2015
-------------------Rupees '000------------------
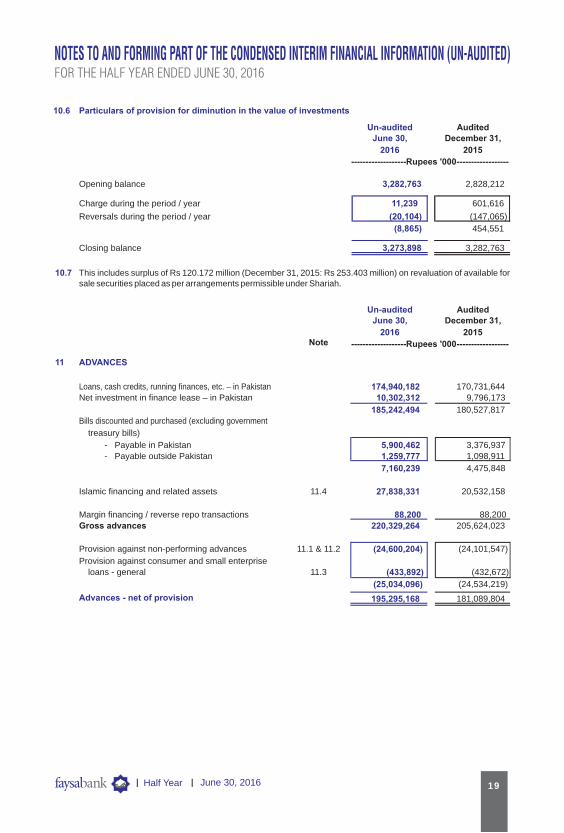

MHalf Year June 30, 2016 MHalf Year June 30, 201620 21
11.1 Advances includes Rs. 30,458 million (2015: Rs. 30,469 million) which have been placed under non-performing status as detailed below:
11.1.1 This represents non-performing portfolio of agricultural, housing and small enterprise financing classified as OAEM as per the requirements of the Prudential Regulations for agricultural, housing and small enterprise financing issued by the SBP.
Domestic Overseas Total Domestic Overseas Total Domestic Overseas Total
Category of classification
Other Assets Especially
Mentioned (OAEM) 11.1.1 351,956 - 351,956 193 - 193 193 - 193
Substandard 2,307,148 - 2,307,148 383,254 - 383,254 383,254 - 383,254
Doubtful 1,706,418 - 1,706,418 470,953 - 470,953 470,953 - 470,953
Loss 26,092,245 - 26,092,245 23,745,804 - 23,745,804 23,745,804 - 23,745,804
30,457,767 - 30,457,767 24,600,204 - 24,600,204 24,600,204 - 24,600,204
Domestic Overseas Total Domestic Overseas Total Domestic Overseas Total
Category of classification
Other Assets Especially
Mentioned (OAEM) 11.1.1 428,735 - 428,735 830 - 830 830 - 830
Substandard 2,691,103 - 2,691,103 373,023 - 373,023 373,023 - 373,023
Doubtful 1,792,035 - 1,792,035 498,651 - 498,651 498,651 - 498,651
Loss 25,556,979 - 25,556,979 23,229,043 - 23,229,043 23,229,043 - 23,229,043
30,468,852 - 30,468,852 24,101,547 - 24,101,547 24,101,547 - 24,101,547
NoteProvision held
Particulars NoteProvision held
December 31, 2015 (Audited)
June 30, 2016 (Un-audited)
Classified Advances Provision required
Classified Advances Provision requiredParticulars
11.2 Particulars of provision against non-performing advances
Opening balance 24,101,547 23,011,743
Recognised in the profit & loss account
Charge for the period / year 1,300,100 2,342,060
Reversals during the period / year (796,832) (1,315,932)
Net charge 503,268 1,026,128
Transfer of provision -
69,999
Amounts written off (4,611) (6,323)
Closing balance 24,600,204 24,101,547
NOTES TO AND FORMING PART OF THE CONDENSED INTERIM FINANCIAL INFORMATION (UN-AUDITED)FOR THE HALF YEAR ENDED JUNE 30, 2016
Un-auditedJune 30,
2016
AuditedDecember 31,
2015
-------------------Rupees '000------------------
11.2.1 This includes Bank’s exposure to Power Holding (Pvt) Limited amounting to Rs 11,309.900 million which is guaranteed by the Government of Pakistan. Out of this, exposure amounting to Rs 588.240 million is overdue, as at June 30, 2016, but has not been classified as non-performing in accordance with the relaxation given by the SBP. Had the classification been made in accordance with the requirements of the prudential regulations, the non-performing advances would have been higher by Rs 588.240 million.
11.3 Particulars of provision against consumer loans and
small enterprise - general
Opening balance 432,672 439,524
Charge / (reversal) during the period / year 1,220 (6,852)
Closing balance 433,892 432,672
11.4 These represent financing and related assets placed under shariah permissible modes.
12
449,645 627,098
8,479,844 8,812,777
1,728,206 1,903,105
10,657,695 11,342,980
Un-audited
Half year ended
June 30, June 30,
2016 2015
12.1 Additions to operating fixed assets - cost
Leasehold property and improvements 63,449 24,690
Office furniture, fixtures, equipment and computers 415,919 60,967
Vehicles 5,698 7,105
Tangible fixed assets
Intangible assets
OPERATING FIXED ASSETS
Capital work-in-progress
Capital work-in-progress 330,460 399,447
NOTES TO AND FORMING PART OF THE CONDENSED INTERIM FINANCIAL INFORMATION (UN-AUDITED)FOR THE HALF YEAR ENDED JUNE 30, 2016
11.2.2 As allowed by the SBP the Bank has availed benefit of Forced Sale Value (FSV) of collaterals held as security of Rs 2,502.679 million (December 31, 2015: Rs 2,730.690 million) relating to advances, Rs 4.326 million (December 31, 2015: Rs 4.326 million) relating to investments and Rs 10.516 million (December 31,2015: Rs 9.308 million) relating to off-balance sheet items while determining the provisioning requirement against non-performing financing (including investments) as at June 30, 2016. The additional profit arising from availing the FSV benefit - net of tax as at June 30, 2016 which is not available for distribution as either cash or stock dividend to shareholders and bonus to employees amounted to approximately Rs 1,636.389 million (December 31, 2015: Rs 1,783.813 million).
Un-auditedJune 30,
2016
AuditedDecember 31,
2015
-------------------Rupees '000------------------
-------------------Rupees '000------------------
12.2 Disposals of operating fixed assets - cost
Freehold land 455,000 -
Office furniture, fixtures, equipment and computers 12,343 61,603
Vehicles 51,695 4,487
13 OTHER ASSETS
This include provision amounting to Rs 138.97 million (December 31, 2015: Rs 232.37 million) in respect of fraud and forgeries incidents.
Un-auditedJune 30,
2016
AuditedDecember 31,
2015
-------------------Rupees '000------------------

MHalf Year June 30, 2016 MHalf Year June 30, 201622 23
14 DEPOSITS AND OTHER ACCOUNTS
CustomersFixed deposits 93,664,581 90,461,529
Saving deposits 101,245,860 95,584,670Current accounts – Remunerative 2,101,581 2,054,101
Current accounts – Non-remunerative 99,333,683 89,476,774
Margin accounts 2,188,536 2,005,605298,534,241 279,582,679
Financial institutionsRemunerative deposits 16,387,291 12,204,384
Non-remunerative deposits 161,064 343,19516,548,355 12,547,579
315,082,596 292,130,258
15 SURPLUS ON REVALUATION OF ASSETS - NET OF TAX
Surplus / (deficit) arising on revaluation of:- Fixed assets 3,808,075 3,884,739
- Non banking assets 877,553 -- Available for sale securities 1,241,303 2,023,234
5,926,931 5,907,973Less: deferred tax thereon (1,345,042) (1,614,192)
4,581,889 4,293,781
14.1 Deposits include Rs 37,303 million (December 31, 2015: Rs 31,759 million) placed under shariah permissible modes.
NOTES TO AND FORMING PART OF THE CONDENSED INTERIM FINANCIAL INFORMATION (UN-AUDITED)FOR THE HALF YEAR ENDED JUNE 30, 2016
Un-auditedJune 30,
2016
AuditedDecember 31,
2015
-------------------Rupees '000------------------
Un-auditedJune 30,
2016
AuditedDecember 31,
2015
-------------------Rupees '000------------------
Contingent liability in respect of guarantees favouring:
- Banking companies and other financial institutions 482,165 497,327
Acceptances- Others 9,735,464 6,609,326
16 CONTINGENCIES AND COMMITMENTS
16.1 Direct credit substitutes
16.2 Transaction-related contingent liabilities
Contingent liability in respect of performance bonds, bid bonds, shipping
guarantees and standby letters of credit etc. favouring:- Government 9,717,963 8,994,355
- Banking companies and other financial institutions 201,943 12,267- Others 2,674,228 2,846,359
12,594,134 11,852,981
16.3 Trade-related contingent liabilities
Letters of credit
- Government 7,284,591 12,708,525
- Others 11,563,580 10,813,163
18,848,171 23,521,688
These mainly represent counter claims filed by the borrowers for restricting the Bank from disposal of assets (such as mortgaged / pledged assets kept as security), cases where the Bank was proforma defendant for defending its interest in the underlying collateral kept by it at the time of financing and certain cases filed by ex- employees of the Bank for damages sustained by them consequent to the termination from the Bank's employment. The above also includes an amount of Rs 25,299 million in respect of a suit filed against the Bank for declaration, recovery of monies, release of securities, rendition of account and damages.
Based on legal advice and / or internal assessments, management is confident that the matters will be decided in the Bank's favour and the possibility of any outcome against the Bank is remote and accordingly no provision has been made in this condensed interim financial information.
(iv) Income tax assessments of the Bank have been finalised upto the tax year 2015 (accounting year 2014).
The department and the Bank have disagreements on certain matters in different tax years. These include taxability of gain on bargain purchase, allocation of expenses relating to dividends and capital gain, allowability of provision against loans and advances, provision against investments and provision against other assets. The additional tax liability on these matters is Rs 3,034.641 million. Both the Bank and the department have filed appeals before the various appellate forums with respect to the aforementioned matters. The management of the Bank, in consultation with its tax advisor, is confident that the decision in respect of these matters will be in the Bank’s favour and accordingly no provision has been made in this condensed interim financial information with respect thereto.
(v) The Finance Act, 2016 has made certain amendments in the Income Tax Ordinance, 2001. Under these amendments, super tax at the rate of 4 percent on the taxable income of the Bank has been extended for the tax year 2016 (accounting year 2015). The Bank has provided the liability for the half year ended June 30, 2016.
The Bank makes commitments to extend credit (including to related parties) in the normal course of its business but these being revocable commitments do not attract any significant penalty or expense if the facility is unilaterally withdrawn except for Rs 30,989 million (December 31, 2015: Rs 10,951 million) which are irrevocable in nature.
16.5 Commitments to extend credits
NOTES TO AND FORMING PART OF THE CONDENSED INTERIM FINANCIAL INFORMATION (UN-AUDITED)FOR THE HALF YEAR ENDED JUNE 30, 2016
Un-auditedJune 30,
2016
AuditedDecember 31,
2015
-------------------Rupees '000------------------
iii) Claims against the Bank not acknowledged as debt 30,761,659 31,539,971
16.4 Other contingencies
i) Suit filed by a customer for recovery of alleged losses suffered which is
pending in the High Court of Sindh. The Bank’s legal advisors are
confident that the Bank has a strong case 2,510,000 2,510,000
ii) Indemnity issued favouring the High Court in the above case 457,543 457,543
Un-auditedJune 30,
2016
AuditedDecember 31,
2015
-------------------Rupees '000------------------
16.6 Commitments in respect of forward exchange contracts
Purchase
- Customers 1,068,671 848,576
- Banks 25,956,358 23,268,341
27,025,029 24,116,917
Sale 18,342 782,309
- Customers 11,055,973 9,166,680
- Banks 11,074,315 9,948,989
16.7 Commitments for the acquisition of operating fixed assets 169,496 82,419

MHalf Year June 30, 2016 MHalf Year June 30, 201624 25
17.1
17.2
This includes profit of Rs 798.134 million (June 30, 2015: Rs 745.602 million) earned from financing activities as per arrangements permissible under Shariah.
This includes income of Rs 632.238 million (June 30, 2015: Rs 926.602 million) earned from investments as per arrangements permissible under Shariah.
NOTES TO AND FORMING PART OF THE CONDENSED INTERIM FINANCIAL INFORMATION (UN-AUDITED)FOR THE HALF YEAR ENDED JUNE 30, 2016
Un-auditedJune 30,
2016
AuditedDecember 31,
2015
-------------------Rupees '000------------------
Un-audited
Half year ended
Note June 30, June 30,
2016 2015
17 MARK-UP / RETURN / INTEREST EARNED
a) On financing 17.1 9,605,465
b) On investments 17.2
i) held for trading securities 148,991 277,902
ii) available for sale securities 3,943,693 5,159,264
iii) held to maturity securities 1,766,690 1,454,727
6,891,893
c) On deposits with treasury bank and financial institutions 3,199 5,466
d) On securities purchased under resale agreements 18,486 33,508
16,536,332
Repurchase 76,381,113 71,239,393
Resale 704,701 306,889
16.9 Others
Cross currency swaps (notional principal) 839,673 -
16.8 Commitments in respect of repo transactions
7,399,546
5,859,374
13,280,605
18 MARK-UP / RETURN / INTEREST EXPENSED
Deposits 6,243,178
Securities sold under repurchase agreements 1,849,413
Other short term borrowings 466,857 540,055
SBP borrowings 217,969 506,208
Sub-ordinated loans 130,462 176,580
9,315,434
5,358,188
1,045,791
7,219,267
-------------------Rupees '000------------------
Un-audited
Half year ended
June 30, June 30,
2016 2015-------------------Rupees '000------------------
19 DIVIDEND INCOME
Ordinary Shares
Abbott Laboratories (Pakistan) Limited - 5
Adamjee Insurance Company Limited 2,123 1,500
Akzo Nobel Pakistan Limited 3,988 3,270
Askari Bank Limited - 3,198
Bank Al-Falah Limited - 3,118
Bank Al Habib Limited - 2,777
Cherat Cement Company Limited 782 -
Dawood Hercules Corporation Limited 180 -
Engro Corporation Limited 17,690 8,258
Engro Fertilizers Limited 3,438 2,455
Fauji Cement Company Limited 1,406 1,073
Fauji Fertilizer Bin Qasim Limited 7,742 742
Fauji Fertilizer Company Limited 3,512 8,908
GlaxoSmithKline Pakistan Limited 140 125
Habib Bank Limited 4,279 5,459
Hascol Petroleum Limited 245 -
Habib Metropolitan Bank Limited - 9,845
Honda Atlas Cars (Pakistan) Limited - 310
Hub Power Company Limited (Hubco) 2,228 4,434
Indus Motor Company Limited 7,639 -
Kot Addu Power Company Limited (Kapco) 1,849 3,268
Maple Leaf Cement Factory Limited 2,444 507
Mari Petroleum Company Limited 36 -
MCB Bank Limited 1,942 3,136
National Bank Of Pakistan - 8,531
Nishat Chunian Power Limited 1,571 1,571
Oil and Gas Development Company Limited 1,594 2,226
Packages Limited 5,303 -
NOTES TO AND FORMING PART OF THE CONDENSED INTERIM FINANCIAL INFORMATION (UN-AUDITED)FOR THE HALF YEAR ENDED JUNE 30, 2016
Un-audited
Half year ended
June 30, June 30,
2016 2015-------------------Rupees '000------------------
Pak Suzuki Motor Company Limited 446 25
Pakistan Oilfields Limited 14,547 8,323
Pakistan Petroleum Limited 1,470 3,519
Pakistan State Oil Company 1,934 4,118
Pakistan Telecommunication Company 1,713 3,825
Pioneer Cement Limited 206 608
Siemens Pakistan Engineering Co. Limited 390 390
United Bank Limited 2,683 7,770
Visa Inc. 478 79
Mutual Funds
Faysal Asset Allocation Fund - 7,066
Faysal Balance Growth Fund 732 2,033
Faysal Financial Sector Opportunity Fund 2,121 2,514
Faysal Income Growth Fund 7,799 6,783
Faysal Islamic Saving Growth Fund 5,222 6,800
Faysal Money Market Fund 16,246 46,152
Faysal Saving Growth Fund 54,248 30,688
180,366 205,409

MHalf Year June 30, 2016 MHalf Year June 30, 201626 27
20 INCOME FROM DEALING IN FOREIGN CURRENCIES
Gain / (loss) from dealing in:
Foreign currencies 208,108 (217,342)Derivative financial instruments 314,095 688,745
522,203 471,403
21 GAIN ON SALE OF SECURITIES - NET
This includes gain on certain shares that were held by the Bank which have been included in the All Share Islamic Index. Capital gain on sale of these investments amounted to Rs. 248.520 million (June 30, 2015: Rs 155.153 million).
22 OTHER INCOME
Rent on property 90,218 62,013Net gain on disposal of operating fixed assets 53,490 4,655
Net gain on disposal of non-banking assets - 103,798Income on derivative contracts - net 8,630 349
Income from disposal of scrap 273 3,809Others 2,841 1,936
155,452 176,560
NOTES TO AND FORMING PART OF THE CONDENSED INTERIM FINANCIAL INFORMATION (UN-AUDITED)FOR THE HALF YEAR ENDED JUNE 30, 2016
Un-audited
Half year ended
June 30, June 30,
2016 2015-------------------Rupees '000------------------
Un-audited
Half year ended
June 30, June 30,
2016 2015-------------------Rupees '000------------------
23 EARNINGS PER SHARE
June 30, June 30, June 30, June 30,
2016 2015 2016 2015
Profit after tax for the period
Weighted average number of ordinary shares 1,199,760 1,199,760 1,199,760 1,199,760
Earnings per share - basic 0.57 2.14
-------------------- Number of shares in thousands ----------------
-------------------------------- Un-audited ---------------------------------
Quarter ended
-------------------------------- Rupees '000 --------------------------------
Half year ended
687,998 2,567,900
----------------------------------- Rupees -----------------------------------
1.22
1,460,750
2.35
2,818,116
23.1
24 SEGMENT DETAILS WITH RESPECT TO BUSINESS ACTIVITIES
Diluted earning per share has not been presented as the Bank does not have any convertible instruments in issue at June 30, 2016 and June 30, 2015 which would have any effect on the earning per share if the option to convert is exercised.
Primary segment information
The Bank is organised into four major business segments:
- Corporate Finance- Trading and Sales- Retail Banking- Corporate & Commercial Banking
All assets, liabilities, off balance sheet items and items of income and expense are distributed in primary segments in accordance with the core functions performed by the business groups.
June 30, 2016 - Un-audited
Total income *** 337,606 5,299,979 10,591,244
Total expenses (135,139) (2,942,959) (10,233,629)
Net income / (loss) 202,467 2,357,020 357,615
Segment assets (Gross) - 204,519,320 94,220,048 185,894,303 484,633,671
Segment non performing loans - - 6,117,783 24,339,984 30,457,767
Segment provision required against loans ** - - (3,343,240) (21,690,856) (25,034,096)
Segment liabilities - (78,484,261) (318,092,211) (27,034,258) (423,610,730)
Segment return on assets (ROA) (%) * - 2.76% 0.88% -0.14%
Segment cost of funds (%) * - 5.01% 3.89% 5.78%
June 30, 2015 - Un-audited
Total income *** 108,306 5,905,066 12,442,006 1,702,457 20,157,835
Total expenses (60,635) (3,943,915) (11,803,859) (1,781,526) (17,589,935)
Net income 47,671 1,961,151 638,147 (79,069) 2,567,900
Corporate
Finance
Trading &
Sales
Retail
Banking
Corporate &
Commercial
Banking
Total
NOTES TO AND FORMING PART OF THE CONDENSED INTERIM FINANCIAL INFORMATION (UN-AUDITED)FOR THE HALF YEAR ENDED JUNE 30, 2016
1,359,236
(1,458,222)
(98,986)
17,588,065
(14,769,949)
2,818,116
Segment assets (Gross) - 195,988,770 92,575,975 169,930,474 458,495,219
Segment non performing loans - - 5,968,091 24,360,763 30,328,854
Segment provision required against loans ** - - (3,150,015) (21,314,205) (24,464,220)
Segment liabilities - (76,923,939) (300,294,580) (22,501,868) (399,720,387)
Segment return on assets (ROA) (%) * - 1.65% 1.33% -0.04%
Segment cost of funds (%) * - 5.42% 4.75% 7.05%
Corporate
Finance
Trading &
Sales
Retail
Banking Commercial Total
December 31, 2015 - Audited
Total income *** 171,314 10,511,436 23,968,640 3,218,501 37,869,891
Total expenses (93,741) (7,460,330) (22,804,437) (3,289,019) (33,647,527)
Net income / (loss) 77,573 3,051,106 1,164,203 (70,518) 4,222,364
Banking
*These percentages have been computed based on average balances.**includes general provision***Net of share of loss of associate
25 RELATED PARTY TRANSACTIONS
The Bank has related party relationship with its holding company, associated undertaking, associated company, group companies, retirement benefit plans, directors, key management personnel and entities over which the directors or key management personnel are able to exercise significant influence.
Banking transactions with the related parties are executed substantially on the same terms, except transactions with directors and key management personnel that are as per their terms of employment, including mark-up rates and collateral, as those prevailing at the time of comparable transactions with unrelated parties and do not involve more than a normal risk.
Details of transaction with related parties during the period, other than those which have been disclosed elsewhere in these condensed interim financial information are as follows:
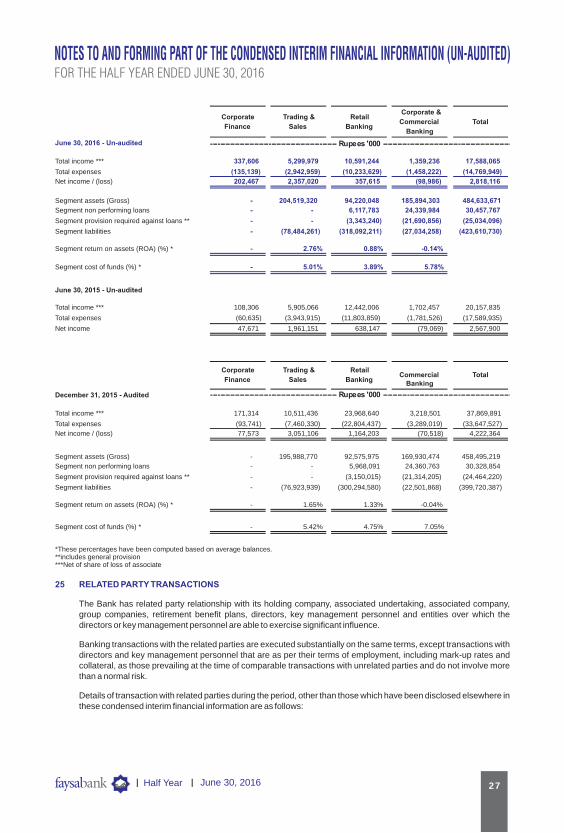
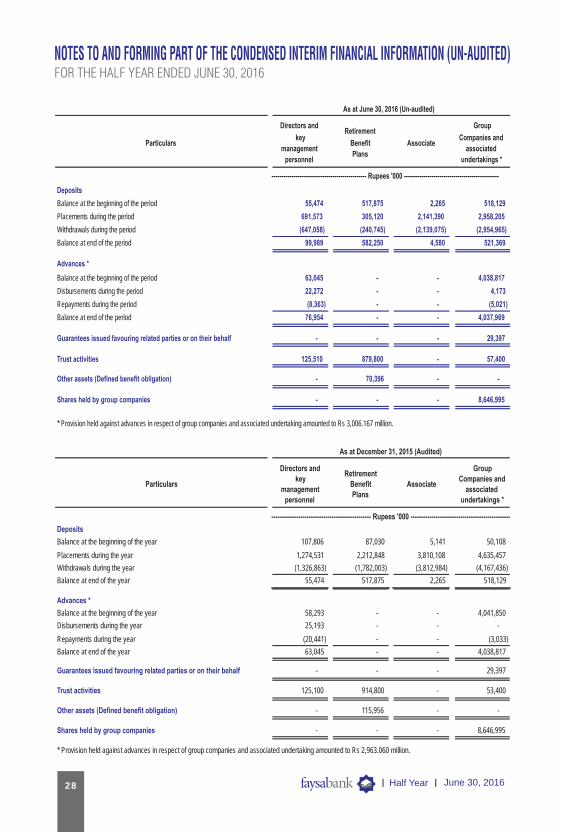
MHalf Year June 30, 2016 MHalf Year June 30, 201628 29
Deposits
Balance at the beginning of the period 55,474 517,875 2,265 518,129
Placements during the period 691,573 305,120 2,141,390 2,958,205
Withdrawals during the period (647,058) (240,745) (2,139,075) (2,954,965)
Balance at end of the period 99,989 582,250 4,580 521,369
Advances *
Balance at the beginning of the period 63,045 - - 4,038,817
Disbursements during the period 22,272 - - 4,173
Repayments during the period (8,363) - - (5,021)
Balance at end of the period 76,954 - - 4,037,969
Guarantees issued favouring related parties or on their behalf - - - 29,397
Trust activities 125,510 879,800 - 57,400
Other assets (Defined benefit obligation) - 70,396 - -
Shares held by group companies - - - 8,646,995
* Provision held against advances in respect of group companies and associated undertaking amounted to Rs 3,006.167 million.
------------------------------------------------ Rupees '000 ------------------------------------------------
As at June 30, 2016 (Un-audited)
Particulars
Directors and
key
management
personnel
Retirement
Benefit
Plans
Associate
Group
Companies and
associated
undertakings *
NOTES TO AND FORMING PART OF THE CONDENSED INTERIM FINANCIAL INFORMATION (UN-AUDITED)FOR THE HALF YEAR ENDED JUNE 30, 2016
Deposits
Balance at the beginning of the year 107,806 87,030 5,141 50,108
Placements during the year 1,274,531 2,212,848 3,810,108 4,635,457
Withdrawals during the year (1,326,863) (1,782,003) (3,812,984) (4,167,436)
Balance at end of the year 55,474 517,875 2,265 518,129
Advances *
Balance at the beginning of the year 58,293 - - 4,041,850
Disbursements during the year 25,193 - - -
Repayments during the year (20,441) - - (3,033)
Balance at end of the year 63,045 - - 4,038,817
Guarantees issued favouring related parties or on their behalf - - - 29,397
Trust activities 125,100 914,800 - 53,400
Other assets (Defined benefit obligation) - 115,956 - -
Shares held by group companies - - - 8,646,995
* Provision held against advances in respect of group companies and associated undertaking amounted to Rs 2,963.060 million.
------------------------------------------------ Rupees '000 ------------------------------------------------
As at December 31, 2015 (Audited)
Particulars
Directors and
key
management
personnel
Retirement
Benefit
Plans
Associate
Group
Companies and
associated
undertakings *
Shares / units purchased during the period - - - 245,352
Shares / units sold during the period - - - 405,638
Government securities purchased during the period 314,980 - - -
Government securities sold during the period 283,036 - - 245,709
Profit paid / accrued 1,037 16,332 134 8,794
Profit return / earned 1,562 - - 26,918
Remuneration of the key management personnel
- Salaries and other short-term employee benefits 180,337 - - -
- Post-employment benefits 9,256 - - -
- Directors fee 27,962
Contribution / charge relating to staff retirement benefits - 108,240 - -
Dividend income - - - 86,613
Capital gain - - - 347
Share of loss from associate - - 9,797 -
Dividend paid - - - 864,698
For the six months period ended June 30, 2016 (Un-audited)
Particulars
Directors and
key
management
personnel
Retirement
Benefit
Plans
------------------------------------------------ Rupees '000 ------------------------------------------------
Associate
Group
Companies and
associated
undertakings
NOTES TO AND FORMING PART OF THE CONDENSED INTERIM FINANCIAL INFORMATION (UN-AUDITED)FOR THE HALF YEAR ENDED JUNE 30, 2016
Shares / units purchased during the period -
-
-
740,000 Shares / units sold during the period -
-
-
5,409
Government securities purchased during the period 236,757
305,674
-
-
Government securities sold during the period 294,135
-
-
-
Profit paid / accrued 1,695
4,633
166
9,694
Profit return / earned 2,224
-
-
125,895
Remuneration of the key management personnel
- Salaries and other short-term employee benefits 178,580
-
-
-
- Post-employment benefits 8,384
-
-
-
- Directors fee 29,384
Contribution / charge relating to staff retirement benefits -
111,442
-
-
Dividend income -
-
-
102,036
Capital gain - - - 409
Share of loss from associate - - 2,527 -
Bonus shares issued - - - 1,044,999
For the six months period ended June 30, 2015 (Un-audited)
Retirement
Benefit
Plans
Associate
Group
Companies and
associated
undertakings
Directors and
key
management
personnel
------------------------------------------------ Rupees '000 ------------------------------------------------
Particulars
- - -
- - -
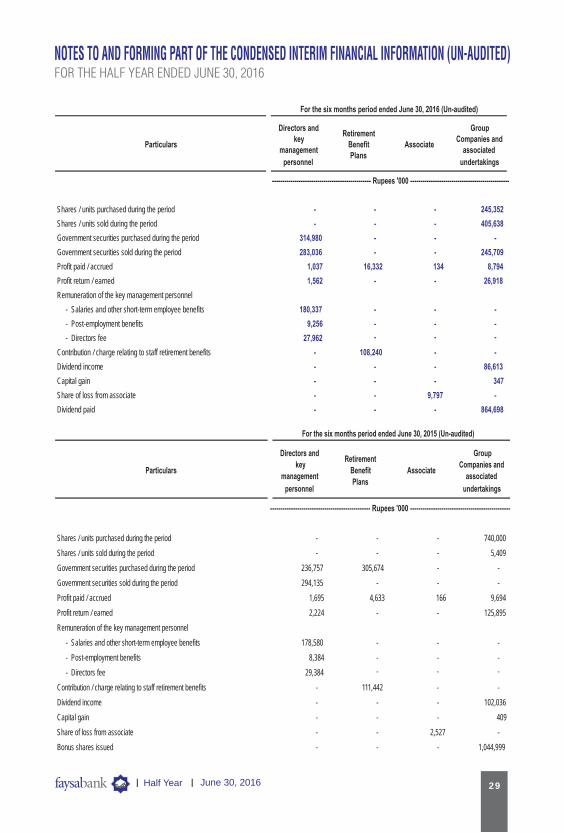

MHalf Year June 30, 2016 MHalf Year June 30, 201630 31
25.1
26 FAIR VALUE DISCLOSURES
26.1 Fair value hierarchy
Balances pertaining to parties that were related at the beginning of the period but ceased to be so related during any part of the current period are not reflected as part of the closing balance. The same are accounted for through the movement presented above.
Fair value is the price that would be received to sell an asset or paid to transfer a liability in an orderly transaction between market participants at the measurement date.
The table below analyses financial assets carried at fair value. The different levels have been defined as follows:
- Quoted prices (unadjusted) in active markets for identical assets or liabilities (Level 1).
- Inputs other than quoted prices included within level 1 that are observable for the asset or liability, either directly (that is, as prices) or indirectly (that is, derived from prices) (Level 2).
- Inputs for the assets or liabilities that are not based on observable market data (i.e. unobservable inputs e.g. estimated future cash flows) (Level 3).
NOTES TO AND FORMING PART OF THE CONDENSED INTERIM FINANCIAL INFORMATION (UN-AUDITED)FOR THE HALF YEAR ENDED JUNE 30, 2016
Level 1 Level 2 Level 3 Total
Recurring fair value measurements
Financial assets
Investments - net
Market Treasury Bills - 88,552,639 - 88,552,639
Pakistan Investment Bonds - 66,560,166 - 66,560,166
Ijara Sukuk Bonds - 4,428,460 - 4,428,460
Fully Paid up Ordinary Shares 4,767,404 - - 4,767,404
Term Finance Certificates - 315,299 - 315,299
Units of Open end Mutual Funds 1,049,359 - - 1,049,359
Sukuk Certificates - 125,000 - 125,000
Commitments in respect of forward exchange contracts
Forward purchase of foreign exchange - 26,873,839 - 26,873,839
Forward sale of foreign exchange - 11,126,802 - 11,126,802
Non-recurring fair value measurements
Non - financial assets
Non Banking Assets (NBA) - 2,643,009 - 2,643,009
- 8,918,110 - 8,918,110
June 30, 2016
Operating fixed assets (land and buildings)
Level 1 Level 2 Level 3 Total
Recurring fair value measurements
Financial assets
Investments - net
Market Treasury Bills - 93,481,729 - 93,481,729
Pakistan Investment Bonds - 53,588,627 - 53,588,627
Ijara Sukuk Bonds - 5,924,997 - 5,924,997
Fully Paid up Ordinary Shares 3,566,953 - - 3,566,953
Term Finance Certificates - 314,964 - 314,964
Units of Open end Mutual Funds 1,323,180 - - 1,323,180
Commitments in respect of forward exchange contracts
Forward purchase of foreign exchange - 24,968,147 - 24,968,147
Forward sale of foreign exchange - 9,099,387 - 9,099,387
Non-recurring fair value measurements
Non - financial assets
Non Banking Assets (NBA) - 2,642,251 - 2,642,251
- 7,782,226 - 7,782,226
December 31, 2015
Operating fixed assets (land and buildings)
NOTES TO AND FORMING PART OF THE CONDENSED INTERIM FINANCIAL INFORMATION (UN-AUDITED)FOR THE HALF YEAR ENDED JUNE 30, 2016
The Bank's policy is to recognise transfers into and out of the different fair value hierarchy levels at the date when the event or change in circumstances require Bank to exercise such transfers.
There were no transfers between levels 1 and 2 during the year.
Valuation techniques used in determination of fair values within level 2
Item Valuation approach and input used
Pakistan Investment Bonds / Market Treasury Bills Fair values of Pakistan Investment Bonds and Treasury Bills are derived using the PKRV rates.
Ijara Sukuk Fair values of GoP Ijarah Sukuk are derived using the PKISRV rates announced by the Financial Market Association (FMA) through Reuters. These rates denote an average of quotes received from eight different pre-defined / approved dealers / brokers.
Term Finance Certificates (TFCs) and Sukuk Certificates Fair values of TFCs and Sukuk Certificates are determined using the MUFAP rates.
Forward foreign exchange The valuation has been determined by interpolating the mid rates announced by the State Bank of Pakistan.
Non Banking Assets (NBA) Non banking assets are revalued by professionally qualified valuers listed on the panel of the Pakistan Banks' Association. The valuation is based on their assessment of market value of the properties.
Operating fixed assets (land and building) Land and buildings are revalued by professionally qualified valuers listed on the panel of the Pakistan Banks' Association. The valuation is based on their assessment of market value of the properties.
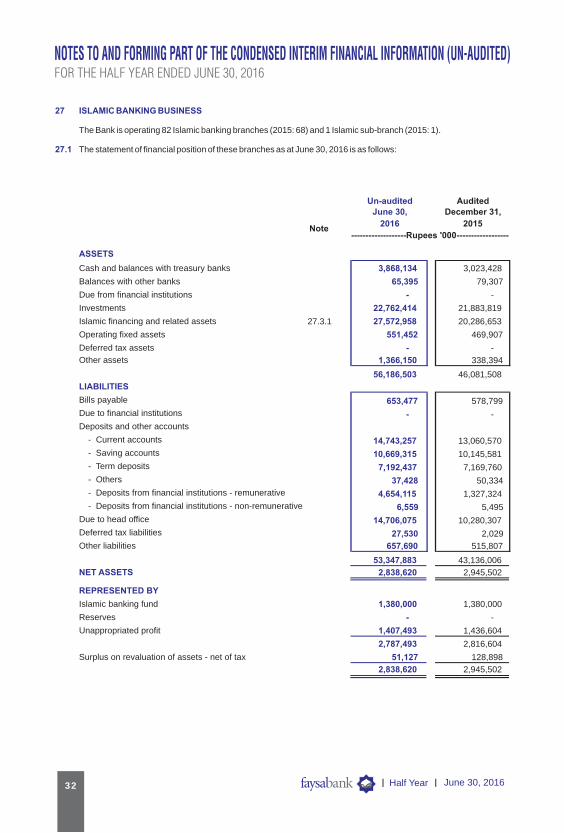
MHalf Year June 30, 2016 MHalf Year June 30, 201632 33
NOTES TO AND FORMING PART OF THE CONDENSED INTERIM FINANCIAL INFORMATION (UN-AUDITED)FOR THE HALF YEAR ENDED JUNE 30, 2016
27 ISLAMIC BANKING BUSINESS
27.1
The Bank is operating 82 Islamic banking branches (2015: 68) and 1 Islamic sub-branch (2015: 1).
The statement of financial position of these branches as at June 30, 2016 is as follows:
Note
ASSETS
Cash and balances with treasury banks 3,868,134 3,023,428
Balances with other banks 65,395 79,307
Due from financial institutions - -
Investments 22,762,414 21,883,819
Islamic financing and related assets 27.3.1 27,572,958 20,286,653
Operating fixed assets 551,452 469,907
Deferred tax assets - -
Other assets 1,366,150 338,394
56,186,503 46,081,508
LIABILITIES
Bills payable 653,477 578,799
Due to financial institutions - -
Deposits and other accounts
- Current accounts 14,743,257 13,060,570
- Saving accounts 10,669,315 10,145,581
- Term deposits 7,192,437 7,169,760
- Others 37,428 50,334
- Deposits from financial institutions - remunerative 4,654,115 1,327,324
- Deposits from financial institutions - non-remunerative 6,559 5,495
Due to head office 14,706,075 10,280,307
Deferred tax liabilities 27,530 2,029
Other liabilities 657,690 515,807
53,347,883 43,136,006
NET ASSETS 2,838,620 2,945,502
REPRESENTED BY
Islamic banking fund 1,380,000 1,380,000
Reserves - -
Unappropriated profit 1,407,493 1,436,604
2,787,493 2,816,604
Surplus on revaluation of assets - net of tax 51,127 128,898
2,838,620 2,945,502
Un-auditedJune 30,
2016
AuditedDecember 31,
2015
-------------------Rupees '000------------------
27.2 The profit and loss account of the Bank's Islamic Banking branches for the half year ended June 30, 2016 is as follows:
Profit / return earned on financing and investments 1,426,197 1,635,547Profit / return expensed 862,717 743,404
Net spread earned 563,480 892,143
Provision against non-performing financings - net 12,448 21,731
Provision against consumer financings - general 7,420 4,376Recoveries against written off debts (220) -
19,648 26,107
543,832 866,036Other Income
Fee, commission and brokerage income 67,361 59,994Income from dealing in foreign currencies - net (5,797) 2,918Other income 595 764
Total other income 62,159 63,676
605,991 929,712
Other expenses
Administrative expenses 603,748 464,801Other provision / write-offs 31,336 -
Other charges 18 -
Total other expenses 635,102 464,801
(29,111) 464,911
Extraordinary items / unusual items - -(Loss) / profit for the period (29,111) 464,911Unappropriated profit brought forward 1,436,604 921,429
Unappropriated profit carried forward 1,407,493 1,386,340
Remuneration to shariah advisor 2,450 1,850
CHARITY FUND
Opening balance 1,034 337
Additions during the period / year 1,255 1,597
Payments / utilization during the period / year (1,800) (900)
Closing balance 489 1,034
Sector wise details of charity disbursement
Health
Education
Social Work
1,300 700
200 100
300 1001,800 900
The charity has been paid by the Bank on account of late payment penalties received from customers and profit earned thereon.
NOTES TO AND FORMING PART OF THE CONDENSED INTERIM FINANCIAL INFORMATION (UN-AUDITED)FOR THE HALF YEAR ENDED JUNE 30, 2016
Un-audited
Half year ended
June 30, June 30,
2016 2015-------------------Rupees '000------------------
Un-auditedJune 30,
2016
AuditedDecember 31,
2015
-------------------Rupees '000------------------

MHalf Year June 30, 2016 MHalf Year June 30, 201634 8
28 GENERAL
28.1
28.2
29 DATE OF AUTHORISATION FOR ISSUE
Comparative information has been re-classified, re-arranged or additionally incorporated in this condensed interim financial information, wherever necessary, to facilitate comparison and to conform with changes in presentation in the current period.
The Bank, as per BPRD Circular Letter No. 05 of 2016 dated February 29, 2016, has reclassified the following comparative figures:
- Bai Muajjal of Rs 11,838.403 million has been reclassified from lendings to financial institutions to Investments.
- Islamic financing and related assets of Rs 3,010.720 million have been reclassified from other assets to advances.
No other major reclassifications were made during the period.
Figures have been rounded off to the nearest thousand rupees unless other wise stated.
This condensed interim financial information was authorised for issue on August 25, 2016 by the Board of Directors of the Bank.
Note
27.3 Islamic Financing and Related Assets 27.3.1 27,572,958 20,286,653
27.3.1 Islamic Mode of Financing
Financing
Murabaha 976,901 1,120,081
Musharika cum Ijara 11,523 11,637
Diminishing Musharika 17,121,283 15,371,340
Fixed Assets Ijara Financing (net) 734,664 948,381
18,844,370 17,451,439
Advance against Financing
Advance against Murabaha Financing 31,597 331,498
Advance against Diminishing Musharika 7,832,614 2,164,556
Advance against Ijara 1,129,750 584,665
8,993,961 3,080,719
Gross Islamic financing and related assets 27,838,331 20,532,158
Provision against Islamic financing and related assets (265,373) (245,505)
27,572,958 20,286,653
PRESIDENT & CEO DIRECTOR DIRECTOR DIRECTOR
NOTES TO AND FORMING PART OF THE CONDENSED INTERIM FINANCIAL INFORMATION (UN-AUDITED)FOR THE HALF YEAR ENDED JUNE 30, 2016
Un-auditedJune 30,
2016
AuditedDecember 31,
2015
-------------------Rupees '000------------------
MHalf Year June 30, 2016 MHalf Year June 30, 20167 6
.352.214
4805L(454)
9
4
(441)
4364L(1546)L2818L
5347L(725)
(259)
(984)
4363L(1795)L2568L
-

MHalf Year June 30, 2016 MHalf Year June 30, 20167 6
.352.214
4805L(454)
9
4
(441)
4364L(1546)L2818L
5347L(725)
(259)
(984)
4363L(1795)L2568L
-
MHalf Year June 30, 2016 MHalf Year June 30, 20165 4

MHalf Year June 30, 2016 MHalf Year June 30, 20165 4

MHalf Year June 30, 2016 MHalf Year June 30, 20163 2

MHalf Year June 30, 2016 MHalf Year June 30, 20163 2
MHalf Year June 30, 2016 MHalf Year June 30, 20161