Embed Size (px)
Citation preview
ISO-NE PUBLIC
Fei Zeng, Anthony Giacomoni and Peter Wong R E S O U R C E A D E Q U A C Y
FCA 11 MRI Based System-wide and Zonal Sloped Demand Curves
R E L I A B I L I T Y C O M M I T T E E M E E T I N G
O C T O B E R 4 , 2 0 1 6 | T E L E C O N F E R E N C E
Reliability Committee (Revised)

ISO-NE PUBLIC
2
FOREWORD
We thank the staff of Market Operations and Market Development for their involvement in the development of the Marginal Reliability Impact (MRI) based demand curves for the Forward Capacity Auction for 2020-2021 (FCA 11).

ISO-NE PUBLIC
3
FCM Demand Curves (Revised)
For Forward Capacity Commitment Period 2020-2021
• The ISO is presenting the system and zonal demand curves for FCA 11 – Curves developed according to market rule filed with the FERC on April
15, 2016, which were approved by FERC on June 28, 2016 – Curves revised from the ones presented to you on September 20, 2016
• This meeting: – Review the revised assumptions used to develop the FCA 11 demand
curves – Review the updated system-wide and zonal demand curves for FCA 11 – Answer any questions you may have regarding these curves – Review the comparison of the “Original” and the “Updated” demand
curves, if you desire – Recap the MRI based demand curves theory, if you desire

ISO-NE PUBLIC ISO-NE PUBLIC
ISO RECOMMENDED DEMAND CURVES FOR FCA 11
4

ISO-NE PUBLIC
System-wide and Zonal Demand Curves
The ISO has developed System-wide and Zonal Demand Curves for FCA 11
For FCA 11, ISO determined that: • NEMA/Boston, SEMA and Rhode Island Load Zones should be
combined to form an import-constrained Capacity Zone named Southeast New England (SENE) Capacity Zone, and
• Maine, New Hampshire and Vermont Load Zones should be combined to form an export-constrained Capacity Zone named the Northern New England (NNE) Capacity Zone
Therefore, zonal demand curves are developed for the SENE import-constrained and NNE export-constrained Capacity Zones.
5
• See the link for the May 26, 2016 PSPC Meeting presentation on Capacity Zone determinations at: http://www.iso-ne.com/static-assets/documents/2016/05/PSPC_FCA11_Zone_Formation.pdf.

ISO-NE PUBLIC 6
FCA 11 Demand Curves – Assumptions (Revised) • MRI Simulations – simulations conducted to develop system-
wide and zonal MRI curves
– The same load and resource assumptions used for the development of the Installed Capacity Requirement (ICR) values for FCA 11 are used to develop the MRI simulations
• Zonal MRI simulations used the following assumptions:
– SENE Import • N-1 Import Limit = 5,700 MW • N-1-1 Import Limit = 4,600 MW • LRA Requirement = 9,580 MW • TSA Requirement = 9,810 MW • Capacity transfer capability assumption for SENE zonal MRI
calculations is: 5,700 – max(9,810 TSA - 9,580 LRA, 0) = 5,470 MW
– NNE Export (North-South Interface)
• N-1 export limit = 2,725 MW

ISO-NE PUBLIC 7
FCA 11 Demand Curves – Assumptions, cont.
• Cost of New Entry (CONE) – CONE for FCA11:
• Gross CONE = $14.387/kW-month • Net CONE = $11.640/kW-month
See link for Forward Capacity Market (FCM) parameters by Capacity Commitment Period (CCP): http://www.iso-ne.com/markets-operations/markets/forward-capacity-market • Links to presentations relating to the assumptions used in the
development of the MRI and demand curves Transmission transfer capability limits – presented at the Planning Advisory Committee (PAC) meeting on March 22, 2016 (http://www.iso-ne.com/static-assets/documents/2016/03/a2_fca11_zonal_boundary_determinations.pdf) Load and resource assumptions – presented at the PSPC meeting on July 28, 2016 (http://www.iso-ne.com/static-assets/documents/2016/06/FCA11_ICR_Assumptions_Update.pdf) FCA 11 ICR Values – presented at the PSPC meeting on August 25, 2016 (http://www.iso-ne.com/static-assets/documents/2016/08/PSPC08252016_FCA11_ICR_Values_Results.pdf) and (http://www.iso-ne.com/static-assets/documents/2016/08/PSPC08252016_FCA11_TSA_Reqt.pdf)

ISO-NE PUBLIC ISO-NE PUBLIC
SYSTEM-WIDE DEMAND CURVES FOR FCA 11
8

ISO-NE PUBLIC 9
FCA 11 Demand Curves
An EXCEL spreadsheet containing granular demand curve data for the system and for the capacity zones has been posted on the ISO Website under PSPC meeting materials. These data are similar in format to the EXCEL file with “indicative” demand curves that were provided to the stakeholders in the Markets Committee during the design of MRI demand curves.

ISO-NE PUBLIC
FCA 11 System-wide MRI Curve (Revised)
10
0.0
0.4
0.8
1.2
1.6
2.0
2.4
2.8
3.2
3.6
32.0 32.5 33.0 33.5 34.0 34.5 35.0 35.5 36.0 36.5 37.0 37.5 38.0
-Mar
gina
l Rel
iabi
lity
Impa
ct (h
ours
/yea
r)
System Capacity (GW)

ISO-NE PUBLIC
FCA 11 System-wide Demand Curve Prior to Transition Adjustment (Revised)
11
$0
$2
$4
$6
$8
$10
$12
$14
$16
$18
$20
$22
32.0 32.5 33.0 33.5 34.0 34.5 35.0 35.5 36.0 36.5 37.0 37.5 38.0
Pric
e ($
/kW
-mon
th)
System Capacity (GW)
Net ICR = 34,075 MW
ISO-NE PUBLIC 12
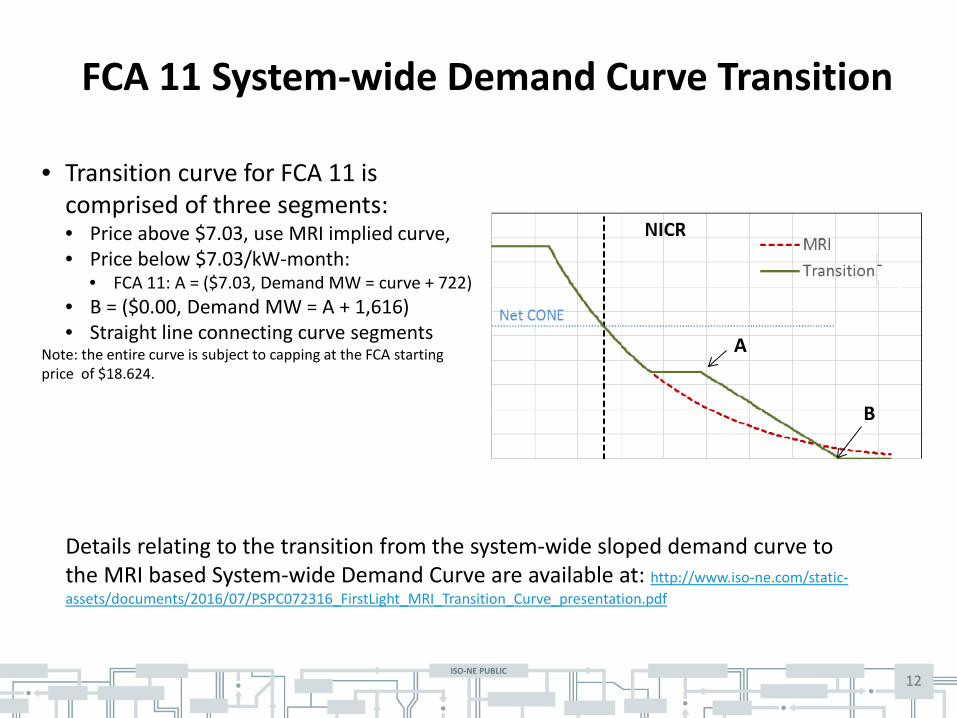
FCA 11 System-wide Demand Curve Transition
• Transition curve for FCA 11 is comprised of three segments: • Price above $7.03, use MRI implied curve, • Price below $7.03/kW-month:
• FCA 11: A = ($7.03, Demand MW = curve + 722) • B = ($0.00, Demand MW = A + 1,616) • Straight line connecting curve segments
Note: the entire curve is subject to capping at the FCA starting price of $18.624.
A
B
Details relating to the transition from the system-wide sloped demand curve to the MRI based System-wide Demand Curve are available at: http://www.iso-ne.com/static-assets/documents/2016/07/PSPC072316_FirstLight_MRI_Transition_Curve_presentation.pdf

ISO-NE PUBLIC 13
FCA 11 Final System-wide Demand Curve (Revised)
$0
$2
$4
$6
$8
$10
$12
$14
$16
$18
$20
$22
32.0 32.5 33.0 33.5 34.0 34.5 35.0 35.5 36.0 36.5 37.0 37.5 38.0
Pric
e ($
/kW
-mon
th)
System Capacity (GW)
Net ICR = 34,075 MW

ISO-NE PUBLIC 14
FCA 11 System-wide Demand Curve Parameters (Revised)
FCA Starting Price ($/kW-m)* 18.624
Net ICR (MW) 34,075
Net CONE ($/kW-m) 11.640 System MRI @ Net ICR (hr/yr) -0.649
Scaling Factor [($/kW-m)/(hr/yr)]** 17.922
Starting Quantity (MW) Ending Quantity (MW)
Starting Price ($/kW-m)
Ending Price ($/kW-m)
0 33,457 18.624 18.624
33,457 34,718 18.624 7.030
34,718 35,437 7.030 7.030
35,437 37,053 7.030 0.000
Condition for triggering transition: NICR (34,075 MW) < 34,151 MW + 722 MW
*Starting Price equals Net CONE x 1.6 **Scaling Factor equals -1 * Net CONE / System MRI @ Net ICR

ISO-NE PUBLIC ISO-NE PUBLIC
FCA 11 SENE DEMAND CURVE
15

ISO-NE PUBLIC
FCA 11 SENE Demand Curve (Revised)
16
P_SYS + $0
P_SYS + $2
P_SYS + $4
P_SYS + $6
P_SYS + $8
P_SYS + $10
P_SYS + $12
P_SYS + $14
P_SYS + $16
P_SYS + $18
P_SYS + $20
P_SYS + $22
8.00 8.25 8.50 8.75 9.00 9.25 9.50 9.75 10.00 10.25 10.50 10.75 11.00 11.25 11.50
SENE Capacity (GW)
maximum total price is $18.624
LSR = 9,810 MW

ISO-NE PUBLIC ISO-NE PUBLIC
FCA 11 NNE DEMAND CURVE
17

ISO-NE PUBLIC
FCA 11 NNE Demand Curve (Revised)
18
-$22 + P_SYS
-$20 + P_SYS
-$18 + P_SYS
-$16 + P_SYS
-$14 + P_SYS
-$12 + P_SYS
-$10 + P_SYS
-$8 + P_SYS
-$6 + P_SYS
-$4 + P_SYS
-$2 + P_SYS
$0 + P_SYS8.00 8.25 8.50 8.75 9.00 9.25 9.50 9.75 10.00 10.25 10.50
NNE Capacity (GW)
MCL= 8,980 MW
minimum total price is $0.00

ISO-NE PUBLIC ISO-NE PUBLIC
APPENDIX BACKGROUND - MARGINAL RELIABILITY IMPACT BASED DEMAND CURVES Reliability foundation for deriving demand curves
19

ISO-NE PUBLIC 20
FCM’s Sloped Demand Curves Aim to Satisfy
1. Reliability. Meet the ISO’s reliability planning obligations – System LOLE of 0.1 or less, on average (over the long-term)
2. Sustainability. Over the long-term, the FCA’s average clearing price should be sufficient to attract entry when needed – Competitive new suppliers recover their fixed entry costs (Net CONE) – Both in the system and import-constrained zones
3. Cost-Effectiveness. Procure capacity in zones cost-effectively – Zonal curves should allocate capacity purchases among zones, given
bid prices, to meet the system’s reliability requirements at least-cost

ISO-NE PUBLIC 21
Marginal Reliability Impact of Capacity • ISO’s planning models can calculate expected energy not served
(EENS) as a measure of the expected ‘lost load’ – Calculated on a MWh per year basis – EENS depends on capacity in system overall, and in each capacity zone
• Marginal reliability impact (MRI) is the change in EENS (expected ‘lost load’) with another 1 MW of capacity – Differs for system and each zone
• Methodology calculates the MRI at the system and zonal level for range of capacity values – May be greater in import-constrained zones where capacity can serve
system or zone
32000 33000 34000 35000 36000 37000 38000
Capacity (MW)
-3.5
-3
-2.5
-2
-1.5
-1
-0.5
0
MR
I (hr
s/yr
)
Smoothed Piecewise linear MRI- System (hrs/yr)

ISO-NE PUBLIC 22
Marginal Reliability Impact of Capacity, cont.
• MRI (after sign change) declines smoothly with capacity, as shown below
• ISO’s planning models can calculate this function

ISO-NE PUBLIC 23
Scaling Factor Translates Relative Slopes into Demand Curves • Graphically, it ‘stretches’ the MRI curves vertically
• Demand Curve = -[Scaling factor] × [MRI curve]
• Stretch demand curves to procure capacity to meet 1-day-in-10 at price of Net CONE

ISO-NE PUBLIC 24
Scaling Factor Ensures Curves Meet Reliability Criteria • Scaling factor is not assumed. It is derived, and is the (lowest)
value that ensures the curves satisfy the reliability criteria and pay an average of estimated Net CONE – If less than the derived value, the demand curves would not meet the
reliability criteria – If greater than the derived value, consumers would buy more
reliability than the criteria requires
• Scaling factor is constant across zones and capacity values

ISO-NE PUBLIC 25
Demand Curves Based on the Marginal Reliability Impact
• When the system is short, deficiencies can occur more frequently, so an additional MW of capacity significantly reduces EENS because – At low MW quantities, MRI value is high – As capacity is added, the MRI decreases quickly meaning the slope is
relatively steep
• When the system is long, deficiencies are infrequent, so an additional MW of capacity has a small impact on EENS because – At high MW quantities, MRI value is low and relatively flat
• Consistent with these properties, the demand curves will be based on the MRI functions

ISO-NE PUBLIC
• The methodology captures the difference in relative impact of additional capacity in different zones
26
Relative Impact
Rest-of-Pool
Import Constrained
Zone

ISO-NE PUBLIC 27
System Demand Curve Transition • Transition curve will be comprised of
three segments: • Price above $7.03, use MRI curve, • Price below $7.03/kw-month:
• FCA 11: A = ($7.03, MRI MW = 722) • FCA 12: A = ($7.03, MRI MW = 375) • FCA 13: A = ($7.03, MRI MW = 150)
• B = ($0.00, A= 1,616) • Horizontal line connecting curve segments
• Transition ends at the earlier of:
• 3 year (full MRI curve no later than FCA 14), or
• When the sum of the MRI curve MW value at $7.03 exceeds A
Details relating to the transition from the system-wide sloped demand curve to the MRI based System-wide
Demand Curve are available at: http://www.iso-ne.com/static-assets/documents/2016/07/PSPC072316_FirstLight_MRI_Transition_Curve_presentation.pdf

ISO-NE PUBLIC ISO-NE PUBLIC
BACKGROUND - DEMAND CURVES FOR CAPACITY ZONES
28

ISO-NE PUBLIC
Marginal Reliability Impact Relating to Capacity Zones • Curves in all constrained zones are based on the marginal
reliability impact of shifting a MW of capacity from the rest-of-system zone into the constrained zone
• Shift of capacity into import-constrained zones improves system reliability (reduces EENS)
• Under this methodology, the total MRI value for a MW in the import-constrained zone is equal to the sum of the system value and the zonal value
29
ISO-NE PUBLIC
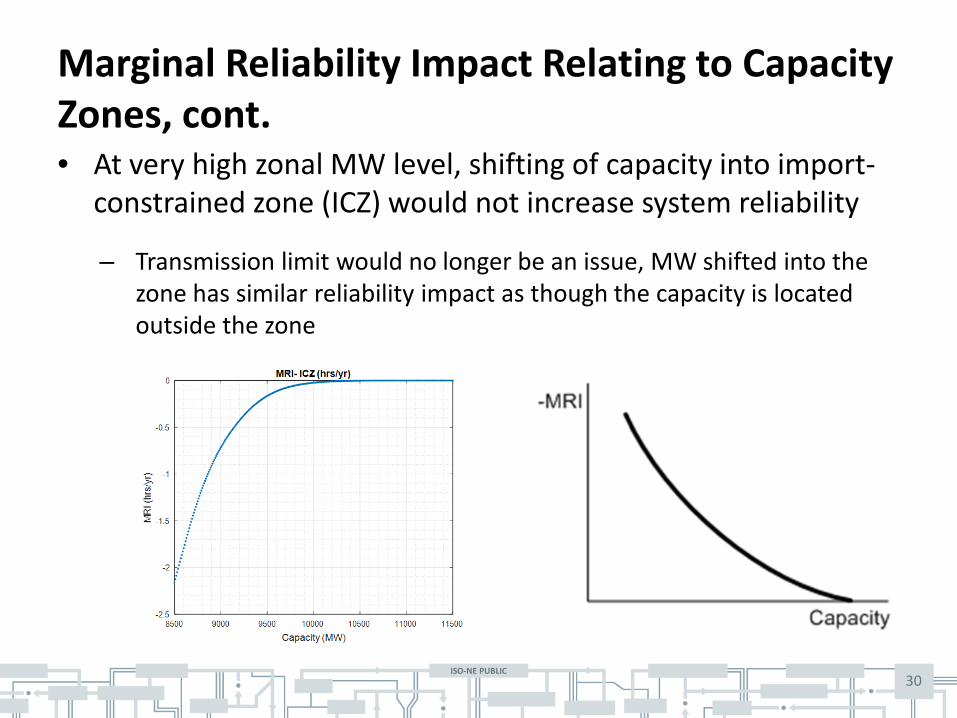
Marginal Reliability Impact Relating to Capacity Zones, cont. • At very high zonal MW level, shifting of capacity into import-
constrained zone (ICZ) would not increase system reliability
– Transmission limit would no longer be an issue, MW shifted into the zone has similar reliability impact as though the capacity is located outside the zone
30

ISO-NE PUBLIC 31
Marginal Reliability Impact Relating to Capacity Zones, cont.
• ISO’s modeling assumption builds on the methodology used to generate the Local Sourcing Requirement based on both the Transmission Security Analysis (TSA) and Local Resource Adequacy (LRA) Requirement values
– “For each import-constrained Capacity Zone, the Local Sourcing Requirement shall be the amount needed to satisfy the higher of: (i) the Local Resource Adequacy Requirement as determined pursuant to Section III.12.2.1.1; or (ii) the Transmission Security Analysis Requirement as determined pursuant to Section III.12.2.1.2.”
• MRI calculations will use a capacity transfer capability of: (N-1 limit) – max(TSA-LRA,0)
– Starts with N-1 limit, but includes adjustment based on the positive difference between TSA and LRA

ISO-NE PUBLIC
8000 8500 9000 9500 10000 10500 11000
Capacity (MW)
0
0.5
1
1.5
2
2.5
MR
I (hr
s/yr
)
MRI in ECZ (hrs/yr)
Marginal Reliability Impact Relating to Capacity Zones, cont. • Shift of capacity into export-constrained zone (ECZ) decreases system
reliability (increases EENS)
• MRI function is zero for low MW quantities as capacity in export-constrained zone provides equal reliability value to that in rest-of-system
• At very high zonal MW level, the MRI function slopes upward because (negative) marginal reliability impact of capacity in the zone increases
32

ISO-NE PUBLIC 33