Embed Size (px)
Citation preview

Assessment and School PerformanceFlorida Department of Education
Tallahassee, Florida
Copyright © 2008 State of Florida Department of State 1
2
3
4
5
6
7
8
9
1011
12A
B
C
D
E
FCATScience Lessons Learned:2003–2006 Data Analyses and Instructional Im
plications
FCAT08_LL_Sci_Cvr_fnl2 5/15/08 9:49 AM Page 1
FCAT Science Lessons Learned:2003–2006 Data Analyses and Instructional Implications
less
ons lear
ned
999-8570-67-0

FCAT08_LL_Sci_Cvr_fnl2 5/15/08 9:49 AM Page 2
Acknowledgments
Great appreciation is extended to the following people for their contributions to the development of this document. The individuals listed below worked together to share their expertise and insights about student performance, to compile the information, and to prepare it for publication. We are grateful for the contributions of everyone involved in the development and production of FCAT Science Lessons Learned: 2003–2006 Data Analyses and
Instructional Implications.
Gladys BarrioMiami-Dade County
Susan BorlandLeon County
Rebecca Braaten Polk County
Melissa Brinson Suwannee County
Pia CarswellDuval County
Linda DeCarlo Broward County
Cynthia Dunham-Derheimer Charlotte County
Mary Gregory St. Lucie County
Christopher Harvey Leon County
Liz HunnicuttHillsborough County
Shari MageeLeon County
Dave Murphy Monroe County
Cathy Organt Escambia County
Susie Quillan Orange County
Claudia Rowe Lake County
Jacquelyn Speake Charlotte County
Barbara Thames Clay County
Nora Ugalde Palm Beach County
Florida Department of Education Assessment & School Performance Test Development Center
Pearson Assessment & Information
Copyright Statement for This Assessment and School Performance Publication
Authorization for reproduction of this document is hereby granted to persons acting in an official capacity within the Uniform System of Public K–12 Schools as defined in Section 1000.01(4), Florida Statutes. The copyright notice at the bottom of this page must be included in all copies.
All trademarks and trade names found in this publication are the property of their respective owners and are not associated with the publishers of this publication.
Permission is NOT granted for distribution or reproduction outside the Uniform System of Public K–12 Schools or for commercial distribution of the copyrighted materials without written authorization from the Florida Department of Education. Questions regarding use of these copyrighted materials should be sent to the following:
The Administrator Assessment and School Performance
Florida Department of Education 325 West Gaines Street
Tallahassee, Florida 32399-0400
Copyright © 2008State of Florida
Department of State

FCAT08_LL_Sci_r9d1 5/6/08 4:39 PM Page i
Table of Contents
TABLE OF CONTENTS LESSONS LEARNED
1 Introduction 1 Purpose 2 Rationale 2 Historical Background
5 Report Development 5 Lessons Learned Task Force 6 Premises 7 Structure of FCAT Science Lessons Learned
10 Navigating This Publication
11 Statistical Considerations 11 Data Analysis Process 12 Limitations 13 Effect Size and FCAT Results 15 Scale Scores (SS)
17 Statewide Achievement Results by Grade Level 17 Achievement Levels 21 Grade 5 Results 25 Grade 8 Results 29 Grade 11 Results
33 Statewide Achievement Longitudinal Results 34 Grade 5 Cohort Results 35 Grade 8 Cohort Results 36 Grade 10 Cohort Results 37 Longitudinal Analysis Summary
39 Statewide Achievement Results by Reporting Cluster with Instructional Implications 40 Reporting Cluster 1–Physical and Chemical Sciences
62 Reporting Cluster 2–Earth and Space Sciences
78 Reporting Cluster 3–Life and Environmental Sciences
95 Reporting Cluster 4–Scientific Thinking
113 Conclusion
Copyright © 2008 Florida Department of Education | FCAT Science Lessons Learned i

FCAT08_LL_Sci_r9d1 5/6/08 4:39 PM Page ii
115 FCAT Science References 116 Grade 8 FCAT Science Reference Sheet 117 Grade 11 FCAT Science Reference Sheet 118 Periodic Table of the Elements119 FCAT Science Short-Response Rubric 120 FCAT Science Extended-Response Rubric
121 FCAT Resources 121 FCAT Publications and Products 126 Online FCAT Data Resources
Index of Graphs Graph
Page Number Graph Title 15 S-1 Science Grades 5, 8, and 11 Mean Scale Score 21 S-2 Science Grade 5 Percent of Students in Levels 3–5 22 S-3 Science Grade 5 Percent of Students by Achievement Level 23 S-4 Science Grade 5 Percent of Students by Achievement Level 24 S-5 Science Grade 5 Mean Percent Correct by Reporting Cluster 25 S-6 Science Grade 8 Percent of Students in Levels 3–5 26 S-7 Science Grade 8 Percent of Students by Achievement Level 27 S-8 Science Grade 8 Percent of Students by Achievement Level 28 S-9 Science Grade 8 Mean Percent Correct by Reporting Cluster 29 S-10 Science Grade 11 Percent of Students in Levels 3–5 30 S-11 Science Grade 11 Percent of Students by Achievement Level 31 S-12 Science Grade 11 Percent of Students by Achievement Level 32 S-13 Science Grade 11 Mean Percent Correct by Reporting Cluster 34 S-14 Science Grade 5, 2003 Cohort Percent of Students in Levels 3–5 35 S-15 Science Grade 8, 2003 Cohort Percent of Students in Levels 3–5 36 S-16 Science Grade 10, 2004 Cohort Percent of Students in Levels 3–5 40 S-17 Science Grade 5 Mean Percent Correct for Reporting Cluster 1 47 S-18 Science Grade 8 Mean Percent Correct for Reporting Cluster 1 54 S-19 Science Grade 11 Mean Percent Correct for Reporting Cluster 1 62 S-20 Science Grade 5 Mean Percent Correct for Reporting Cluster 2 68 S-21 Science Grade 8 Mean Percent Correct for Reporting Cluster 2 72 S-22 Science Grade 11 Mean Percent Correct for Reporting Cluster 2 78 S-23 Science Grade 5 Mean Percent Correct for Reporting Cluster 3 83 S-24 Science Grade 8 Mean Percent Correct for Reporting Cluster 3 88 S-25 Science Grade 11 Mean Percent Correct for Reporting Cluster 3 95 S-26 Science Grade 5 Mean Percent Correct for Reporting Cluster 4 100 S-27 Science Grade 8 Mean Percent Correct for Reporting Cluster 4 106 S-28 Science Grade 11 Mean Percent Correct for Reporting Cluster 4
TABLE OF CONTENTS LESSONS LEARNED
FCAT Science Lessons Learned | Copyright © 2008 Florida Department of Education ii
FCAT08_LL_Sci_r9d1 5/6/08 4:39 PM Page iii
TABLE OF CONTENTS LESSONS LEARNED
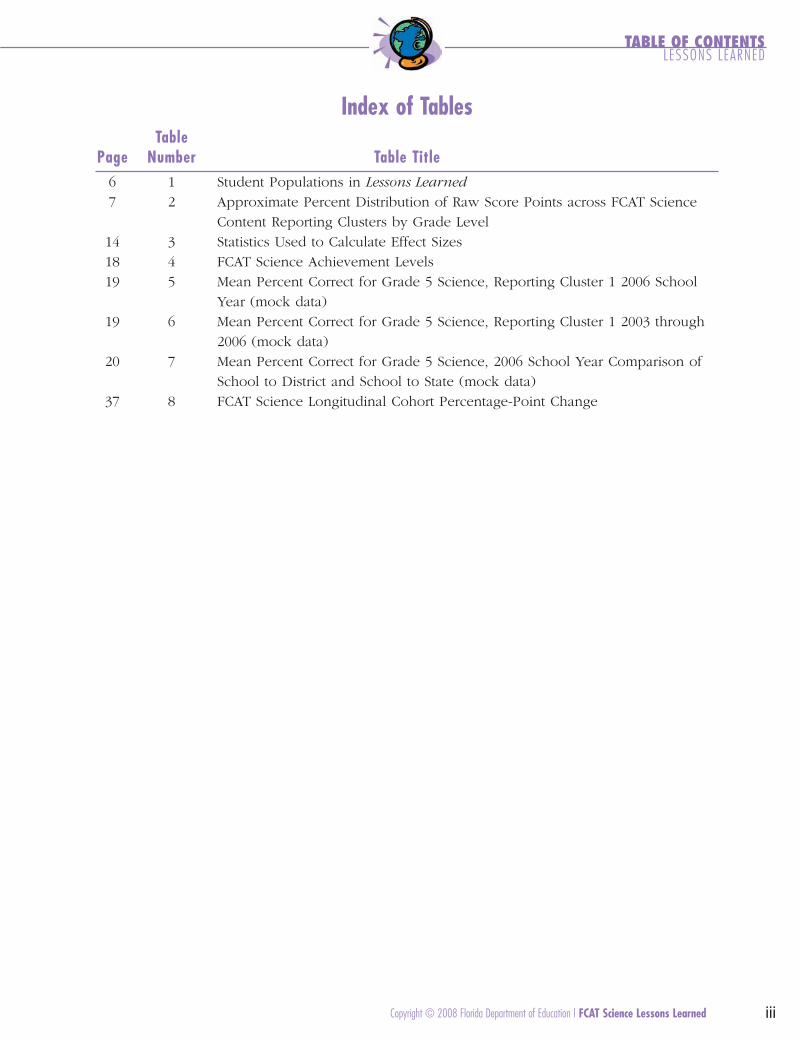
Index of Tables Table
Page Number Table Title 6 1 Student Populations in Lessons Learned
7 2 Approximate Percent Distribution of Raw Score Points across FCAT Science Content Reporting Clusters by Grade Level
14 3 Statistics Used to Calculate Effect Sizes 18 4 FCAT Science Achievement Levels 19 5 Mean Percent Correct for Grade 5 Science, Reporting Cluster 1 2006 School
Year (mock data) 19 6 Mean Percent Correct for Grade 5 Science, Reporting Cluster 1 2003 through
2006 (mock data) 20 7 Mean Percent Correct for Grade 5 Science, 2006 School Year Comparison of
School to District and School to State (mock data) 37 8 FCAT Science Longitudinal Cohort Percentage-Point Change
Copyright © 2008 Florida Department of Education | FCAT Science Lessons Learned iii

FCAT08_LL_Sci_r9d1 5/6/08 4:39 PM Page iv
FCAT Science Lessons Learned | Copyright © 2008 Florida Department of Education iv

FCAT08_LL_Sci_r9d1 5/6/08 4:39 PM Page 1
Lessons Learned INTRODUCTION
Introduction to FCAT Science Lessons Learned:2003 –2006 Data Analyses and Instructional Implications
Purpose
The purpose of this FCAT Science Lessons Learned report on the Florida Comprehensive Assessment Test® (FCAT) is to provide a summary and analysis of the trends in student achievement of the Sunshine State Standards (SSS) in science (Grades 5, 8, and 11) from 2003 through 2006. It is important to note that the science test was administered to Grades 5, 8, and 10 in 2003 and 2004, but beginning in 2005, it was administered to Grades 5, 8, and 11; therefore, Grade 10 students who took the science test in 2004 also took the test with different items in 2005 as Grade 11 students. While the FCAT consistently measures the same scientific concepts drawn from the Sunshine State Standards, individual test items vary each year. In this volume, the high school test and its results are labeled “Grade 11” for ease of reference.
The goals of this report are to inform education stakeholders of the academic progress made by Florida students in science and to provide guidance for educators that can be used to effect positive change and enhance program effectiveness. Though this publication is the first Lessons
Learned report for FCAT Science, it is the fourth in the Lessons Learned series. The first FCAT Lessons Learned publication covered FCAT Reading and FCAT Mathematics data from 1998 through 2000 and FCAT Writing data from 1993 through 2000. In 2007, the Florida Department of Education (DOE) released separate FCAT Reading Lessons Learned and FCAT Mathematics
Lessons Learned reports covering FCAT Reading and Mathematics data from 2001 through 2005. These publications are available online at http://fcat.fldoe.org/lessonslearned.asp. The next volume in the set will be FCAT Writing Lessons Learned. Unless otherwise indicated in this publication, Lessons Learned refers to this science volume.
Copyright © 2008 Florida Department of Education | FCAT Science Lessons Learned 1

FCAT08_LL_Sci_r9d1 5/6/08 4:39 PM Page 2
INTRODUCTION LESSONS LEARNED
The information in this report provides Floridians who are interested in education with a comprehensive view of student achievement in Florida. Postsecondary educators working in teacher education will also benefit from the insights of this report. Other persons for whom these insights may be meaningful include parents, students, legislators, media representatives, and business organizations; however, the report places the highest priority on supporting those charged with improving student performance in Florida: teachers, administrators, curriculum specialists, school advisory councils, and district leaders.
Rationale
The phrase lessons learned implies a historical look at student achievement with thoughtful consideration given to how well students have learned the content of the assessed standards and how these results could be improved. This was accomplished by first collecting FCAT results and identifying trends, then convening a representative group of Florida educators to interpret the trends and identify instructional implications. The insights provided in this document may be used to identify and implement modifications in curriculum, instruction, and assessment practices in classrooms and schools throughout the state.
Historical Background
In 1996, the Florida educational community identified a core body of knowledge and skills that all Florida students should acquire. This body of knowledge, called the Sunshine State Standards, spanned seven content areas (language arts, mathematics, science, social studies, health and
May 1996, the Florida Board of Education defined a clear set of standards upon which to buildan equitable system of student assessment and school accountability.
In 1995 and 1996, the Florida Educational Reform and Accountability Commission recommended the development of a statewide assessment system. These recommendations, called the FloridaComprehensive Assessment Design, led to the development of the Florida ComprehensiveAssessment Test® (FCAT). The development of FCAT Reading and FCAT Mathematics questions began in 1996, and questions were field tested in 1997. In 1998, the first results of the assessment
physical education, foreign language, and the arts). By adopting the Sunshine State Standards in
were reported for students and schools. In 1999, the law related to student assessment was revised to require an annual assessment of all students in Grades 3–10. This legislation, called the A+ Plan for Education, required that tests in reading and mathematics be developed for the grades not previously tested. Newly assessed grades for reading included Grades 3, 5, 6, 7, and 9; for mathematics, Grades 3, 4, 6, 7, and 9 were included in the state assessment.
The A+ Plan also required a science assessment for students in Grades 5, 8, and 10. Development of science test items began in 2000, and a field test of these items was conducted in a representative sample of Florida schools in Spring 2002. The first operational assessment and reporting of student scores took place in Spring 2003. Beginning in Spring 2005, FCAT Science was administered in Grade 11 instead of Grade 10. This change was in response to requests by Florida science educators to allow an additional year for students to receive high-school-level science instruction.
FCAT Science Lessons Learned | Copyright © 2008 Florida Department of Education 2

FCAT08_LL_Sci_r9d1 5/6/08 4:39 PM Page 3
INTRODUCTION LESSONS LEARNED
In the 2001 FCAT administration, first steps were taken to create reading and mathematics developmental scale scores (DSS) that could provide educators with valuable information about student growth across grades. The DSS places scale scores for all grades on one vertical scale, allowing educators to track longitudinal growth and more accurately compare results across grades. The appropriateness of using the DSS for reading and mathematics is due to the number of adjacent grade levels that are assessed (e.g., Grades 3–10). Because the science test is currently assessed only in Grades 5, 8, and 11, the DSS would provide little, if any, useful information about the longitudinal growth across these grades; therefore, DSS have not been developed for science.
A detailed chronology of the FCAT program is included in the FCAT Handbook—A Resource
for Educators, which is available on the Department of Education’s website at http://fcat.fldoe.org/handbk/fcathandbook.asp.
Copyright © 2008 Florida Department of Education | FCAT Science Lessons Learned 3

FCAT08_LL_Sci_r9d1 5/6/08 4:39 PM Page 4
FCAT Science Lessons Learned | Copyright © 2008 Florida Department of Education 4
FCAT08_LL_Sci_r9d1 5/6/08 4:39 PM Page 5
Lessons Learned REPORT DEVELOPMENT
FCAT Science Lessons Learned Report Development
Lessons Learned Task Force
For this Lessons Learned volume, the DOE analyzed data and identified statewide trends in student science performance based on FCAT Science scores for Grades 5, 8, and 11 from 2003 through 2006. (As previously mentioned, FCAT Science was assessed at Grade 10 in 2003 and 2004 and in Grade 11 in 2005 and 2006.) In September 2007, the DOE convened a task force of Florida educators to review the data analyses from the 2003–2006 FCAT administrations, review test items, generate implications for student instruction, and make observations. The task force included classroom teachers, curriculum supervisors, resource teachers, and school administrators. For the purpose of data analysis and test item review, the larger task force was divided into elementary, middle, and high school focus groups. The task force members had extensive experience with the Sunshine State Standards, the FCAT, and classroom instruction. The work of the task force included reviewing overall test, reporting cluster, and item-level results. DOE staff and the DOE’s test development contractor assisted task force members in understanding student performance data and facilitated the production of this report. Additional details of the report development process are outlined in the Statistical Considerations section of this publication.
The report contains results and implications for instruction derived from the synthesis and analysis of two types of data: the percent of students at Achievement Levels 3, 4, and 5, and the mean percent correct by reporting cluster (i.e., average percentage of points obtained on each reporting cluster). The data presented in this report are from the FCAT Science test administrations from 2003 through 2006; however, special ad hoc analyses of these data were conducted specifically for Lessons Learned and have not been reported previously. These ad hoc analyses incorporate results from all student curriculum groups except Home Education.
Copyright © 2008 Florida Department of Education | FCAT Science Lessons Learned 5

FCAT08_LL_Sci_r9d1 5/6/08 4:39 PM Page 6
REPORT DEVELOPMENT LESSONS LEARNED
The following table illustrates the student populations that were included in this Lessons Learned
report and in the state-level score reports for regular FCAT administrations.
Table 1: Student Populations in Lessons Learned
Student Populations
Lessons Learned
2003–2006
FCAT Regular Administration
State-Level Results
Standard Curriculum ELL1 for more than 2 yrs Nondisabled ESE2
Gifted Speech Impaired Hospital/Homebound
✓ ✓
ESE2 ✓ ✓
ELL1 ✓ ✓
Home Education
1 English Language Learner (ELL) 2 Exceptional Student Education (ESE)
Premises
The results contained in this document are based on several important premises that the users of this report should consider carefully.
• The first premise is that this kind of data analysis project could be conducted accurately. The authors presumed that if professional Florida educators were provided the opportunity to analyze the FCAT test results and the FCAT test questions, meaningful conclusions related to student learning could be reached. It is believed that the task force’s conclusions contained in this document validate this premise.
• The second premise is that Florida educators and others want to know what the FCAT results reveal about education in the state. The authors recognized that classroom teachers are continually seeking to improve student learning and to help students meet the challenging expectations presented in the Sunshine State Standards. The structure and content of FCAT Science Lessons Learned is intended to facilitate these processes.
• The third premise concerns the FCAT data. The authors presumed that overall student effort after the field-test year remained constant. That is, students were consistently giving their best performance on the state assessments. Any variations in performance from year to year should not be explained as the result of varied student effort but, instead, as the result of other factors, such as decline or improvement in student learning.
FCAT Science Lessons Learned | Copyright © 2008 Florida Department of Education 6

FCAT08_LL_Sci_r9d1 5/6/08 4:39 PM Page 7
REPORT DEVELOPMENT LESSONS LEARNED
• The final premise about the FCAT data is that the content assessed by the test remains stable from year to year. Because of the large number of Sunshine State Standards science benchmarks assessed by the FCAT, some benchmarks are assessed annually, while the content of others is sampled (assessed) only periodically. Supporting the presumption of year-to-year stability, it is important to note that the FCAT consistently measures the same scientific concepts drawn from the Sunshine State Standards, even though individual test items and assessed benchmarks vary. Year-to-year comparability at the overall test level is further supported by the use of sophisticated statistical models that account for any variance in test difficulty.
Structure of FCAT Science Lessons Learned The guiding principle for the development of this publication has been an emphasis on the importance of “teaching to the standards” (the Sunshine State Standards) rather than “teaching to the test” (the FCAT). In support of this principle, Lessons Learned is organized using the same structure as the Sunshine State Standards. Results are presented for overall achievement as well as for the science reporting clusters assessed on the FCAT:
Reporting Cluster 1: Physical and Chemical Sciences
Reporting Cluster 2: Earth and Space Sciences
Reporting Cluster 3: Life and Environmental Sciences
Reporting Cluster 4: Scientific Thinking
The following table provides the approximate percent distribution of raw score points across science reporting clusters by grade level.
Table 2: Approximate Percent Distribution of Raw Score Points across FCAT Science Content Reporting Clusters by Grade Level
Grade Physical and
Chemical Sciences
Earth and Space Sciences
Life and Environmental
Sciences
Scientific Thinking
5 20–35% 20–35% 20–30% 20–35%
8 20–35% 20–35% 20–35% 20–35%
11 20–35% 20–35% 20–35% 20–35%
Lessons Learned contains an analysis of statewide trends based on Achievement Levels as well as student performance in each reporting cluster by year. A longitudinal comparison of data is also presented. Longitudinal analysis provides comparable data in the sense that the number of students tested from year to year is relatively similar (minus the movement of students in and out of the state), unless otherwise noted. Based on the grades assessed by the science test, this Lessons Learned report compares Grade 5 results in 2003 to Grade 8 results in 2006, Grade 8 results in 2003 to Grade 11 results in 2006, and Grade 10 results in 2004 to Grade 11 results in 2005.
Copyright © 2008 Florida Department of Education | FCAT Science Lessons Learned 7
FCAT08_LL_Sci_r9d1 5/6/08 4:39 PM Page 8
REPORT DEVELOPMENT LESSONS LEARNED
Observations about students’ academic strengths and weaknesses are provided for science reporting clusters and for the strands that comprise each reporting cluster. This report also presents sample FCAT questions that reflect the kinds of skills students are expected to demonstrate and provides instructional strategies to help teachers move students toward greater mastery.
Also, the results at the reporting-cluster level are not equated; therefore, generalizing results at this level can be somewhat misleading. It is recommended that readers pay attention to student performance across reporting clusters for a more appropriate evaluation of the individual reporting clusters. Readers should not overinterpret student performance on the reporting clusters across years because the difficulty of test questions will vary within a reporting cluster from one year to the next.
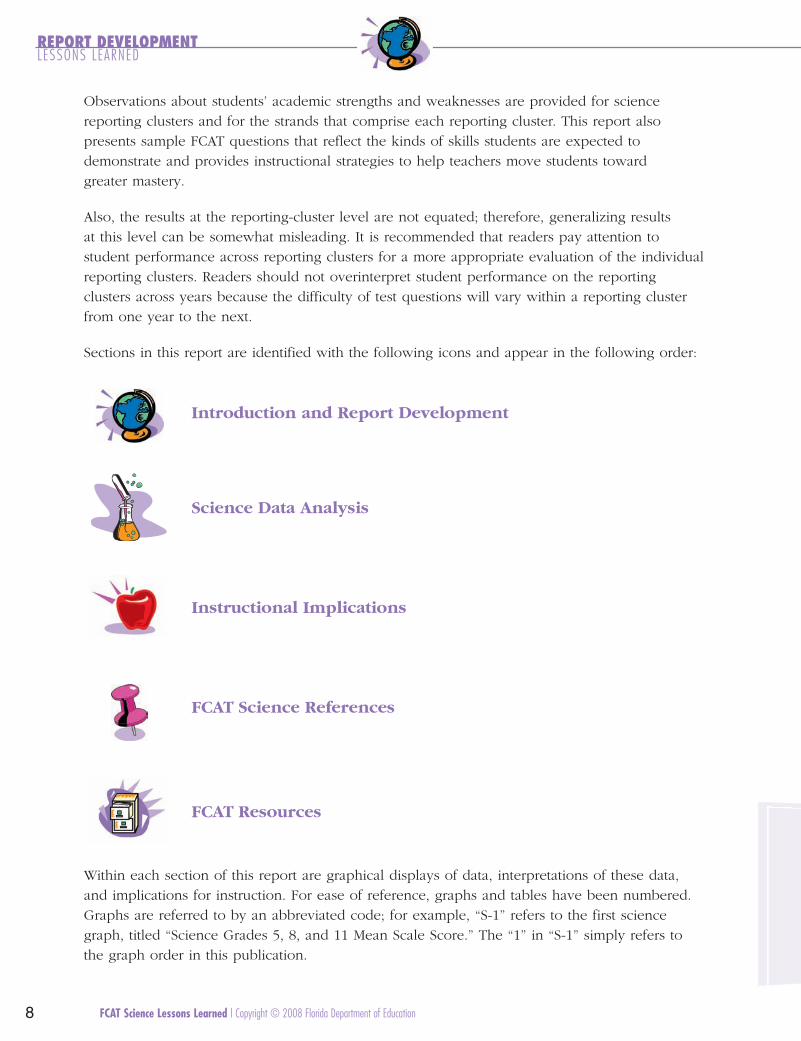
Sections in this report are identified with the following icons and appear in the following order:
Introduction and Report Development
Science Data Analysis
Instructional Implications
FCAT Science References
FCAT Resources
Within each section of this report are graphical displays of data, interpretations of these data, and implications for instruction. For ease of reference, graphs and tables have been numbered. Graphs are referred to by an abbreviated code; for example, “S-1” refers to the first science graph, titled “Science Grades 5, 8, and 11 Mean Scale Score.” The “1” in “S-1” simply refers to the graph order in this publication.
FCAT Science Lessons Learned | Copyright © 2008 Florida Department of Education 8

FCAT08_LL_Sci_r9d1 5/6/08 4:39 PM Page 9
Sample test items (i.e., questions) are included throughout this document to help the reader gain as much insight as possible about students’ academic strengths and weaknesses. These questions are presented in boxes using distinguishable type. They were selected from several sources, including actual questions from previous test administrations and from the Florida Inquires!
series of reports on the yearly FCAT Science released items (Grades 5, 8, and 11). For each question used as an example, the performance statistics from its most recent use are presented with the question to provide additional insights regarding students’ academic strengths, weaknesses, and most common mistakes or misconceptions. The correct answer is indicated by a pointing hand symbol (≥). For performance tasks (i.e., short- or extended-response items), an example of a top-score response is provided.
The terms questions and items are used interchangeably in this publication. Item types are abbreviated as follows: MC (multiple-choice question), GR (gridded-response question), SR (short-response question), and ER (extended-response question). In Grade 5, students are administered MC, SR, and ER questions. In Grades 8 and 11, students are administered MC, GR, SR, and ER questions. On the FCAT, the icons below help students identify various item types. In this publication, the same icons appear next to GR, SR, and ER items. For detailed information about FCAT Science test items, see the FCAT Science Test Item Specifications on the DOE website at http://fcat.fldoe.org/fcatis01.asp.
FCAT Science gridded-response (GR) question
READ INQUIRE EXPLAIN
REPORT DEVELOPMENT LESSONS LEARNED
FCAT Science short-response (SR) question
READINQUIREEXPLAIN
Copyright © 2008 Florida Department of Education | FCAT Science Lessons Learned
FCAT Science extended-response (ER) question
By examining and reporting the historical results of the FCAT Science test, information about statewide trends in achievement of the Sunshine State Standards as measured by the FCAT can be provided to educators charged with improving students’ performance. The objective of this report is to translate this information into insights about student progress within Florida classrooms and schools.
9
FCAT08_LL_Sci_r9d1 5/6/08 4:39 PM Page 10
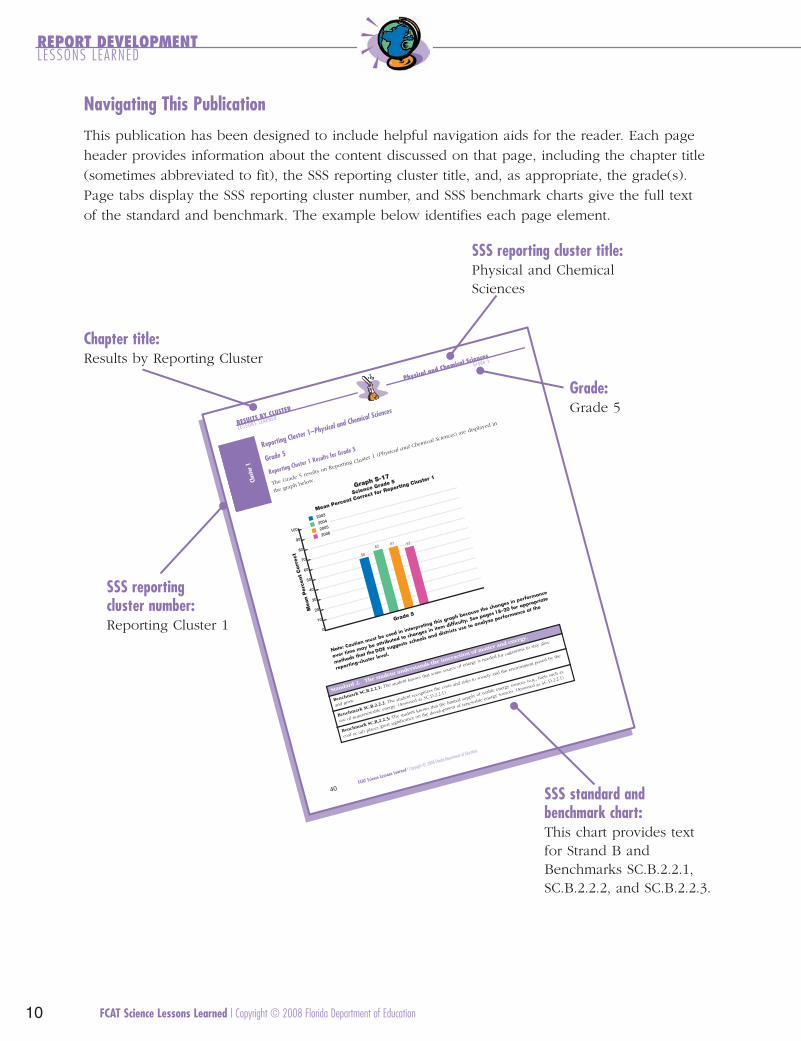
Navigating This Publication
This publication has been designed to include helpful navigation aids for the reader. Each page header provides information about the content discussed on that page, including the chapter title (sometimes abbreviated to fit), the SSS reporting cluster title, and, as appropriate, the grade(s). Page tabs display the SSS reporting cluster number, and SSS benchmark charts give the full text of the standard and benchmark. The example below identifies each page element.
SSS reporting cluster title: Physical and Chemical Sciences
Chapter title:
Reporting Cluster 1–Physical and Chemical Sciences
Grade 5
Reporting Cluster 1 Results for Grade 5
The Grade 5 results on Reporting Cluster 1 (Physical and Chemical Sciences) aredisplayed in
the graph below.
Note: Caution must be used in interpreting this graph because the changes in performance
over time may be attributed to changes in item difficulty. See pages 18–20 for appropriate
methods that the DOE suggests schools and district
s use to analyze performance at the
reporting-cluster level.
58
62 61 57
80
70
100
90
60
50
40
30
20
10
0
Mean
Perc
ent
Corr
ect
Grade 5
Graph S-17
Science Grade 5
Mean Percent Correct for Reporting Cluster 1
2003
2004
2005
2006
FCAT Science Lessons Learned | Copyright © 2008 Florida Department of Education
40
RESULTS BY CLUSTER
Physical and Chemical Sciences
LESSONS LEARNED
Grade 5
Clus
ter1
Standard 2. The student understands the interaction of matter and energy.
Benchmark SC.B.2.2.1: The student knows that some source of energy is needed for organisms to stay alive
and grow.
Benchmark SC.B.2.2.2: The student recognizes the costs and risks to society and the environment posed by the
use of nonrenewable energy. (Assessed as SC.D.2.2.1)
Benchmark SC.B.2.2.3: The student knows that the limited supply of usable energy sources (e.g., fuels such as
coal or oil) places great significance on the development of renewable energy sources. (Assessed as SC.D.2.2.1)
Results by Reporting Cluster
SSS reporting cluster number: Reporting Cluster 1
Grade: Grade 5
SSS standard and benchmark chart: This chart provides text for Strand B and Benchmarks SC.B.2.2.1, SC.B.2.2.2, and SC.B.2.2.3.
REPORT DEVELOPMENT LESSONS LEARNED
FCAT Science Lessons Learned | Copyright © 2008 Florida Department of Education 10

FCAT08_LL_Sci_r9d1 5/6/08 4:39 PM Page 11
Lessons Learned STATISTICAL CONSIDERATIONS
Statistical Considerations and the FCAT
Data Analysis Process
The task force analyzed results from 2003 through 2006 to identify trends in student performance.
In doing so, the task force identified some areas of growth as well as other areas needing further attention. Question-by-question analyses revealed the extent to which changes in student performance reflected gains in skills associated with science. Task force members were reminded that changes in performance at the reporting-cluster level may be attributed to variations in the difficulty level of questions from one year to another. Overall changes in difficulty are accounted for with a statistical technique known as equating;1
Test equating is the process by which scores from two administrations are made comparable—that is, placed on the same scale (e.g., the FCAT 100–500 scale). Students tested in two different years take tests that have different questions; however, the tests have a common set of questions called anchor questions. The data used in the statistical equating procedures are gathered from student results on the anchor questions from year to year.
1
however, at the reporting-cluster level, there may be some variation in difficulty that cannot be accounted for with equating.
Student results are provided in different ways and at different content levels: average scale scores, percent of students who achieve at the proficient level or above (Levels 3, 4, or 5) for the entire test, percent of students achieving in each Achievement Level (Levels 1–5) within each year, and mean percent of questions answered correctly at the reporting-cluster level.
For the first metric listed above, data are reported for students who scored in Levels 3, 4, or 5. For example, if 15% of students scored in Level 3, 10% in Level 4, and 5% in Level 5, the reported percent would be 30%. This implies that the percent of students who did not meet the minimal acceptable level of achievement (Level 3) was 70% (i.e., 100% minus 30%).
Copyright © 2008 Florida Department of Education | FCAT Science Lessons Learned
11

FCAT08_LL_Sci_r9d1 5/6/08 4:39 PM Page 12
STATISTICAL CONSIDERATIONS LESSONS LEARNED
Limitations
Analysis of the students’ science performance data was limited by a number of conditions. Where salient to the findings of this report, these limitations are noted below.
• The task force evaluated the questions that were particularly challenging to students, identifying persistent areas of concern without attempting to evaluate student results on every question.
• The analyses reported herein are based on state-level data and are not intended to provide specific classroom, school, or district interpretations; however, this presentation of findings may provide a model that can guide data analysis at those levels. The results may also be used by teachers to compare their knowledge about students’ science performance to the average performance of students across the state.
• FCAT scale scores are derived from equated scores. Results based on these scale scores can be compared across years. These results are the average (mean) scale scores (SS) and the percents of students in Achievement Levels 3, 4, and 5. Results not based on equated scores include reporting cluster and test-question levels. The task force took care not to misinterpret or overinterpret the trend data presented at these levels, given the limitations with comparability.
• Results are reported at the reporting-cluster level only, not for the strands that comprise each reporting cluster. For FCAT Science, subscores are reported as the four reporting clusters (see page 7). The task force provided instructional implications at the reporting-cluster level, based on examination of items within the strands. When FCAT questions are selected each year, the most important consideration is content representation. Consistent content is maintained from year to year by selecting questions for the various reporting clusters and benchmarks assessed. Each year’s test includes previously used questions, new questions, and anchor questions. During the process of assembling the test, question and test statistical characteristics are compared for the total test, the anchor questions, and the reporting clusters. Using these pre-equating methods, similar characteristics are maintained for the reporting clusters from year to year. Test equating, conducted during the test-scoring process, is used to generate the total test scores.
• The statistic used to report performance by reporting cluster is called the mean percent correct. The mean percent correct is calculated in a manner analogous to finding the percent of points a student earned on the questions within each reporting cluster. It is the mean number of points earned by the entire group of students divided by the number of points possible. For example, if there are 12 questions within a reporting cluster and each of five students correctly answers 8, 6, 6, 9, and 12 questions, respectively, the average number of questions answered correctly is 8.2. This translates to an overall mean percent of 68% (i.e., 8.2 divided by 12).
• For some reporting clusters, the reader may note an absence of observations and/or implications for instruction. In these instances, analysis of available student performance data did not yield enough information to reach clear conclusions.
• The longitudinal comparisons of student performance data are NOT for a matched cohort of students (e.g., matched over time). For example, these data simply represent all students tested as fifth graders in 2003 and all students tested as eighth graders in 2006.
FCAT Science Lessons Learned | Copyright © 2008 Florida Department of Education 12

FCAT08_LL_Sci_r9d1 5/6/08 4:39 PM Page 13
STATISTICAL CONSIDERATIONS LESSONS LEARNED
Effect Size and FCAT Results
Effect size is a statistical method that is often used in research. This statistic quantifies change relative to the spread of the distribution. For example, while a difference of two units may be statistically significant with large sample sizes, it may mean very little with regard to the practical size of that difference. The effect size statistic captures the fact that this difference may, from a practical standpoint, be quite small. The information below provides context on how effect size can be used to evaluate FCAT results.
Effect size is a statistical method that . . . quantifies change relative to the spread of the distribution.
The following text identifies the categories of change most often used when describing variance in effect-size statistics.2
2 Cohen, J. (1988). Statistical power analysis for the behavioral sciences. Hillsdale, NJ: Erlbaum.
Effect Size Qualifier
d � 0.2 Negligible0.5 � d � 0.2 Small 0.8 � d � 0.5 Medium
d � 0.8 Large
Although the effect size can be computed as a negative value, its interpretation is based on its absolute value; therefore, a negative effect size should not be interpreted as a negligible change. A small effect size implies a change that is insubstantial. For example, if the mean scale score increases by 10 scale points, the effect size will be 0.20 (10 divided by 50, assuming 50 is the pooled standard deviation). While this change may be statistically significant because of the large number of student scores, it is small with regard to effect size. By contrast, an increase of 50 scale score points would yield an effect size of 1.0. This would be a large effect size, indicating that relative to the standard deviation of the scale scores (50) there was a substantial change in the mean scale score. From a program evaluation standpoint, the implications of medium or large effect sizes warrant more serious consideration than those of small effect sizes. As shown in the Grade 8 row of Table 3, there was relatively no change (the effect size was 0.0) in the mean scale score from 2003 through 2006. A small difference or change in score is equivalent to a small effect size or no effect size.
It should be noted that the effect-size qualifiers suggested by Cohen are general and that many researchers advocate thoughtful consideration of the evaluated content. For example, a “medium” effect-size change may be considered large in a social science like education. For the purposes of this report, however, the general parameters proposed by Cohen will be utilized. Further research and consideration will be given to interpretation of effect sizes for incorporation into future Lessons Learned reports.
Copyright © 2008 Florida Department of Education | FCAT Science Lessons Learned 13
FCAT08_LL_Sci_r9d1 5/6/08 4:39 PM Page 14
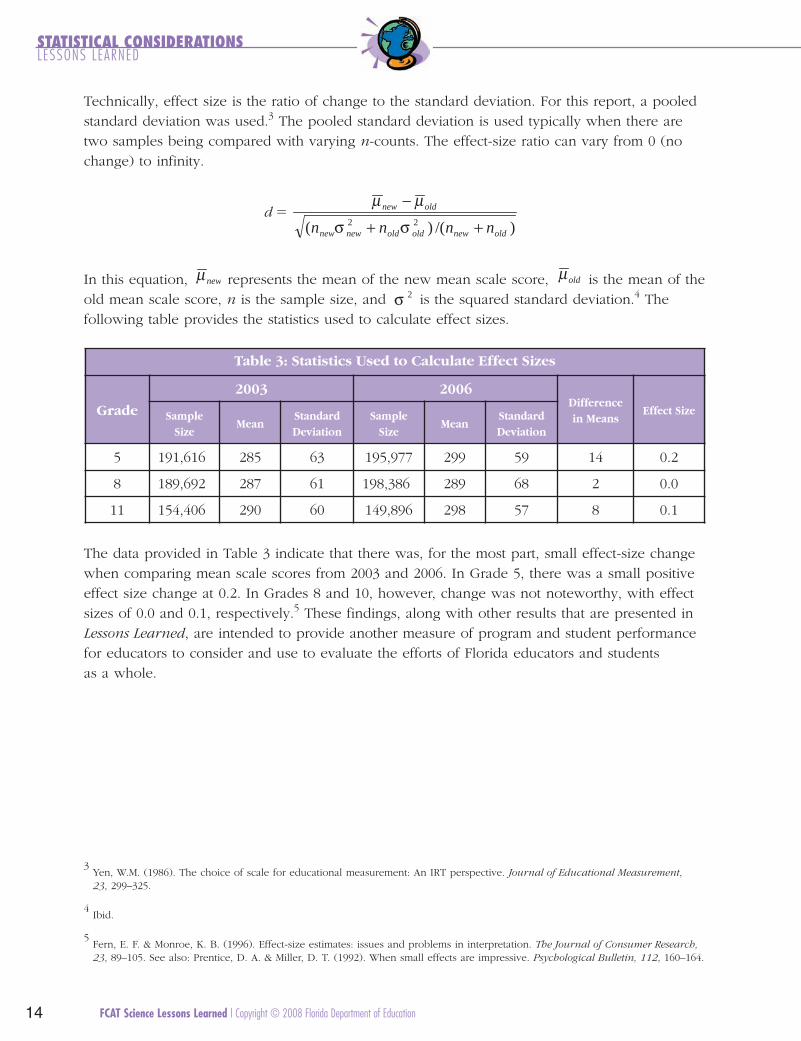
Technically, effect size is the ratio of change to the standard deviation. For this report, a pooled standard deviation was used.3
3 Yen, W.M. (1986). The choice of scale for educational measurement: An IRT perspective. Journal of Educational Measurement, 23, 299–325.
The pooled standard deviation is used typically when there are two samples being compared with varying n-counts. The effect-size ratio can vary from 0 (no change) to infinity.
μnew − μoldd � 2 2(nnewσ new + nold σ old ) /(nnew + nold )
STATISTICAL CONSIDERATIONS LESSONS LEARNED
In this equation, μnew represents the mean of the new mean scale score, μold is the mean of the old mean scale score, n is the sample size, and σ 2 is the squared standard deviation.4
4 Ibid.
The following table provides the statistics used to calculate effect sizes.
Table 3: Statistics Used to Calculate Effect Sizes
Grade
2003 2006 Difference in Means
Effect Size Sample Size
Mean Standard Deviation
Sample Size
Mean Standard Deviation
5 191,616 285 63 195,977 299 59 14 0.2
8 189,692 287 61 198,386 289 68 2 0.0
11 154,406 290 60 149,896 298 57 8 0.1
The data provided in Table 3 indicate that there was, for the most part, small effect-size change when comparing mean scale scores from 2003 and 2006. In Grade 5, there was a small positive effect size change at 0.2. In Grades 8 and 10, however, change was not noteworthy, with effect sizes of 0.0 and 0.1, respectively.5
5 Fern, E. F. & Monroe, K. B. (1996). Effect-size estimates: issues and problems in interpretation. The Journal of Consumer Research, 23, 89–105. See also: Prentice, D. A. & Miller, D. T. (1992). When small effects are impressive. Psychological Bulletin, 112, 160–164.
These findings, along with other results that are presented in Lessons Learned, are intended to provide another measure of program and student performance for educators to consider and use to evaluate the efforts of Florida educators and students as a whole.
FCAT Science Lessons Learned | Copyright © 2008 Florida Department of Education 14
FCAT08_LL_Sci_r9d1 5/6/08 4:39 PM Page 15
STATISTICAL CONSIDERATIONS LESSONS LEARNED
Scale Scores (SS)
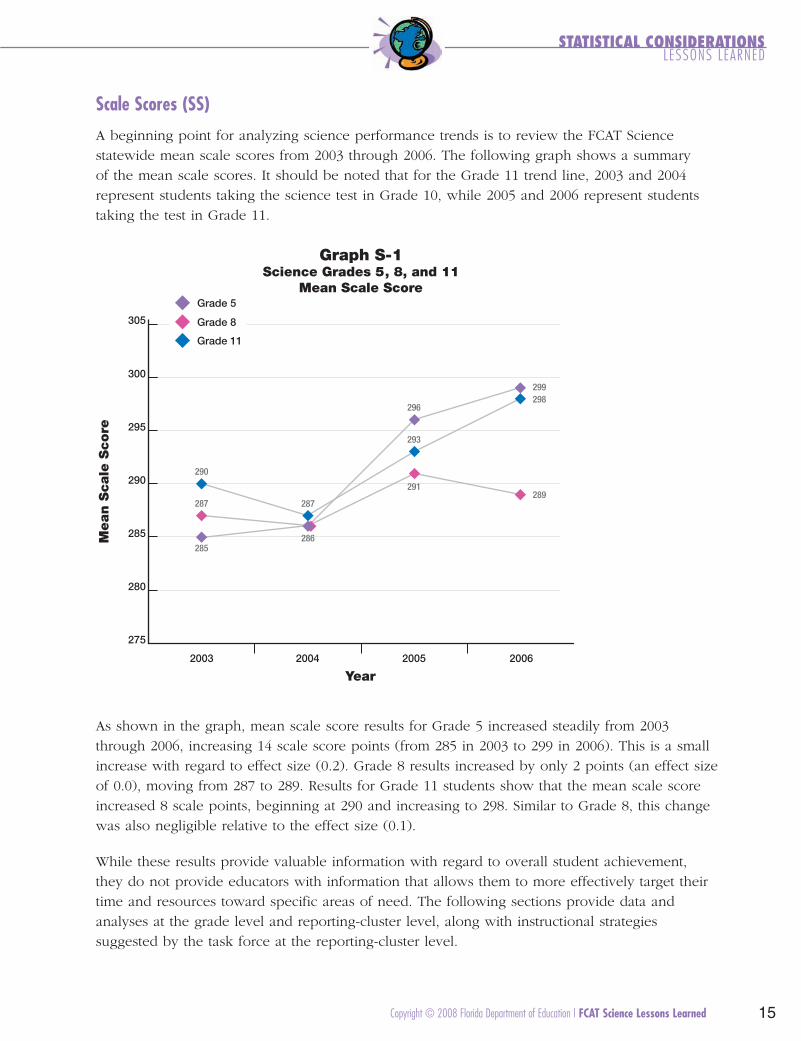
A beginning point for analyzing science performance trends is to review the FCAT Science statewide mean scale scores from 2003 through 2006. The following graph shows a summary of the mean scale scores. It should be noted that for the Grade 11 trend line, 2003 and 2004 represent students taking the science test in Grade 10, while 2005 and 2006 represent students taking the test in Grade 11.
Graph S-1Science Grades 5, 8, and 11
Mean Scale Score
285
287
290
286
287
291
293
296
289
298 299
295
300
305
290
285
280
275
2003 2004 2005 2006
Mean S
cale
Score
Grade 5
Grade 8
Grade 11
Year
As shown in the graph, mean scale score results for Grade 5 increased steadily from 2003 through 2006, increasing 14 scale score points (from 285 in 2003 to 299 in 2006). This is a small increase with regard to effect size (0.2). Grade 8 results increased by only 2 points (an effect size of 0.0), moving from 287 to 289. Results for Grade 11 students show that the mean scale score increased 8 scale points, beginning at 290 and increasing to 298. Similar to Grade 8, this change was also negligible relative to the effect size (0.1).
While these results provide valuable information with regard to overall student achievement, they do not provide educators with information that allows them to more effectively target their time and resources toward specific areas of need. The following sections provide data and analyses at the grade level and reporting-cluster level, along with instructional strategies suggested by the task force at the reporting-cluster level.
Copyright © 2008 Florida Department of Education | FCAT Science Lessons Learned 15

FCAT08_LL_Sci_r9d1 5/6/08 4:39 PM Page 16
FCAT Science Lessons Learned | Copyright © 2008 Florida Department of Education 16
FCAT08_LL_Sci_r9d1 5/6/08 4:39 PM Page 17
Lessons Learned RESULTS BYGRADE LEVEL
FCAT Science Statewide Achievement Results by Grade Level
Achievement Levels
Performance on the FCAT Science test is reported by Achievement Level. The Achievement Levels for each grade were recommended by teachers and district administrators and adopted by the Florida Board of Education in 2006. Five levels of achievement are used for each grade. A brief description of each of the five categories follows.
• Level 5—This student has success with the most challenging content of the Sunshine State Standards. A student scoring in Level 5 answers most of the test questions correctly, including the most challenging questions.
• Level 4—This student has success with the challenging content of the Sunshine StateStandards. A student scoring in Level 4 answers most of the test questions correctly,but the student may have only some success with questions that reflect the mostchallenging content.
• Level 3—This student has partial success with the challenging content of the Sunshine State Standards, but performance is inconsistent. A student scoring in Level 3 answers many of the test questions correctly, but the student is generally less successful with the most challenging questions.
• Level 2—This student has limited success with the challenging content of the SunshineState Standards.
• Level 1—This student has little success with the challenging content of the Sunshine State Standards.
Copyright © 2008 Florida Department of Education | FCAT Science Lessons Learned 17

FCAT08_LL_Sci_r9d1 5/6/08 4:39 PM Page 18
RESULTS BY GRADE LEVEL LESSONS LEARNED
The following table provides the score ranges for each Achievement Level by grade.
Table 4: FCAT Science Achievement Levels
Grade Achievement Level
Level 1 Level 2 Level 3 Level 4 Level 5
5 100–272 273–322 323–376 377–416 417–500
8 100–269 270–324 325–386 387–431 432–500
11 100–278 279–323 324–379 380–424 425–500
No Child Left Behind (NCLB) requires states to identify one of their Achievement Levels as “proficient.” The “partial success” FCAT Science Achievement Level (Level 3) was identified by the State of Florida to be equivalent to “proficient.”
The grade-specific sections that follow include graphic information organized by the following categories:
• Achievement Level 3 (proficient or partial success) or higher (e.g., Graph S-2)—Studentswho demonstrate partial success on the content assessed by the FCAT are classified asLevel 3 achievement; therefore, these graphs will, for each year, display the percent ofstudents having achieved at least Level 3.
• Four-year trend results for Achievement Levels 1 through 5 (e.g., Graphs S-3 and S-4)— Evaluating results at this level allowed the task force to better understand the changes that took place related to distribution of performance across Achievement Levels over time.
• The four Sunshine State Standards reporting clusters for science (e.g., Graph S-5)—Since 2003, FCAT Science reports sent to students, parents, and teachers have provided the number of questions correct by reporting cluster. The ad hoc analyses by reporting cluster were conducted specifically for this report and are based on the mean percent correct statistic. The focus of this section will be on results across reporting clusters by grade.
Note: At the state level, the statistical process of equating allows for the across-year comparison of the mean percent of students who achieve in Level 3 or higher; however, it is not appropriate to draw trend-related inferences with mean percent correct statistics across years and within a given reporting cluster.
Given educators’ desire to glean reliable information from any test that is administered to their students (including the FCAT), it is important to identify at the reporting-cluster level the comparisons that yield valid interpretations of student performance. While the comparisons that are described in the following paragraphs could not be used in this Lessons Learned report (a state-level report), they can be applied in school- and district-level evaluations. The state data in Tables 5–7 on the following pages are real; however, the school and district data are not. For illustration purposes, mock data are provided for the fictitious schools and district in the tables.
FCAT Science Lessons Learned | Copyright © 2008 Florida Department of Education 18

FCAT08_LL_Sci_r9d1 5/6/08 4:39 PM Page 19
RESULTS BY GRADE LEVEL LESSONS LEARNED
One valid comparison is performance on a given reporting cluster among schools, districts, and the state. For example, a particular school’s results on one year’s test at the reporting-cluster level can be compared to other schools’, other districts’, or the state’s results on the same test at the reporting-cluster level. District results can be compared to other district results and the state results. The reasoning for this is simple: students in any group (school, district, or state) will take the same set of test items in a given year. This means that, regardless of across-year varying item difficulty at the reporting-cluster level, in one year, students are assessed using the same items and, subsequently, their results are comparable.
In Table 5 below, students in two schools (Sunshine and Evergreen) and students in the district (Coastal) can be compared to students in the state based on their performance in Reporting Cluster 1.
Table 5: Mean Percent Correct for Grade 5 Science Reporting Cluster 1
2006 School Year (mock data)
Sunshine Elementary (mock data)
Evergreen Elementary (mock data)
Coastal District
(mock data)
State of Florida (real data)
48% 55% 59% 57%
Another type of valid comparison is the trend of any of the aforementioned comparisons (e.g., school to school, school to district). Educators in a low-performing school may be interested in tracking the gaps between their students’ performance on Reporting Cluster 1 to students’ performance in their district or to students’ performance in the state. Evaluating trend data for this type of annual gap is valid and potentially very enlightening.
Table 6: Mean Percent Correct for Grade 5 Science Reporting Cluster 1
2003 through 2006 (mock data)
Year
Sunshine Elementary (mock data)
State of Florida (real data)
Difference
2003 34% 58% –24%
2004 40% 62% –22%
2005 42% 61% –19%
2006 48% 57% –9%
Copyright © 2008 Florida Department of Education | FCAT Science Lessons Learned 19

FCAT08_LL_Sci_r9d1 5/6/08 4:39 PM Page 20
RESULTS BY GRADE LEVEL LESSONS LEARNED
In Table 6, the trend results from 2003 to 2006 provide important evaluative information to the educators of Sunshine Elementary. While student performance at Sunshine Elementary was consistently lower on Reporting Cluster 1 than the performance of all Grade 5 students in Florida, the progress that has been made over the four-year period is substantial enough to warrant another look at program initiatives (e.g., the school may have introduced an afterschool tutoring program that can be linked to an improvement in performance).
Table 7: Mean Percent Correct for Grade 5 Science, 2006 School Year Comparison of School to District and School to State (mock data)
Reporting Cluster
Evergreen Elementary
(mock data)
Coastal District (mock data)
Difference
Evergreen Elementary
(mock data)
State of Florida
(real data)
Difference
Reporting Cluster 1 55% 59% –4% 55% 57% –2%
Reporting Cluster 2 49% 40% 9% 49% 47% 2%
Reporting Cluster 3 58% 60% –2% 58% 53% 5%
Reporting Cluster 4 41% 54% –13% 41% 55% –14%
In Table 7, 2006 mock results for Evergreen Elementary are compared to both the district (Coastal) and the state. This presentation of data provides yet another perspective of student performance and program effectiveness. For example, in Reporting Cluster 2, Evergreen Elementary had a higher mean percent correct statistic than the Coastal District (49% versus 40%, respectively); however, Evergreen Elementary results were comparable to the state (49% versus 47%, respectively). If this difference was consistent over the four years, there would be good reason to identify and share best practices in Evergreen Elementary with the rest of the district.
Another meaningful finding from Table 7 is illustrated in Reporting Cluster 3 results. In this reporting cluster, Evergreen Elementary had a slightly lower mean percent correct than the Coastal District (58% versus 60%, respectively); however, this same statistic was higher than that of the state (58% versus 53%, respectively). It would be easy to miss the fact that, while performance at Evergreen Elementary on Reporting Cluster 3 was lower than that of the district, the performance of both the school and the district were substantially higher than the state. Subsequently, it is possible that targeting additional resources to improve Reporting Cluster 3 would be a low priority.
The DOE and the task force encourage educators to use FCAT results in any way that is statistically appropriate. The comparisons that have been described in this section provide possibilities for evaluation at the school and district levels.
FCAT Science Lessons Learned | Copyright © 2008 Florida Department of Education 20
FCAT08_LL_Sci_r9d1 5/6/08 4:39 PM Page 21
Analysis of FCAT Science Grade 5 Results 2003–2006
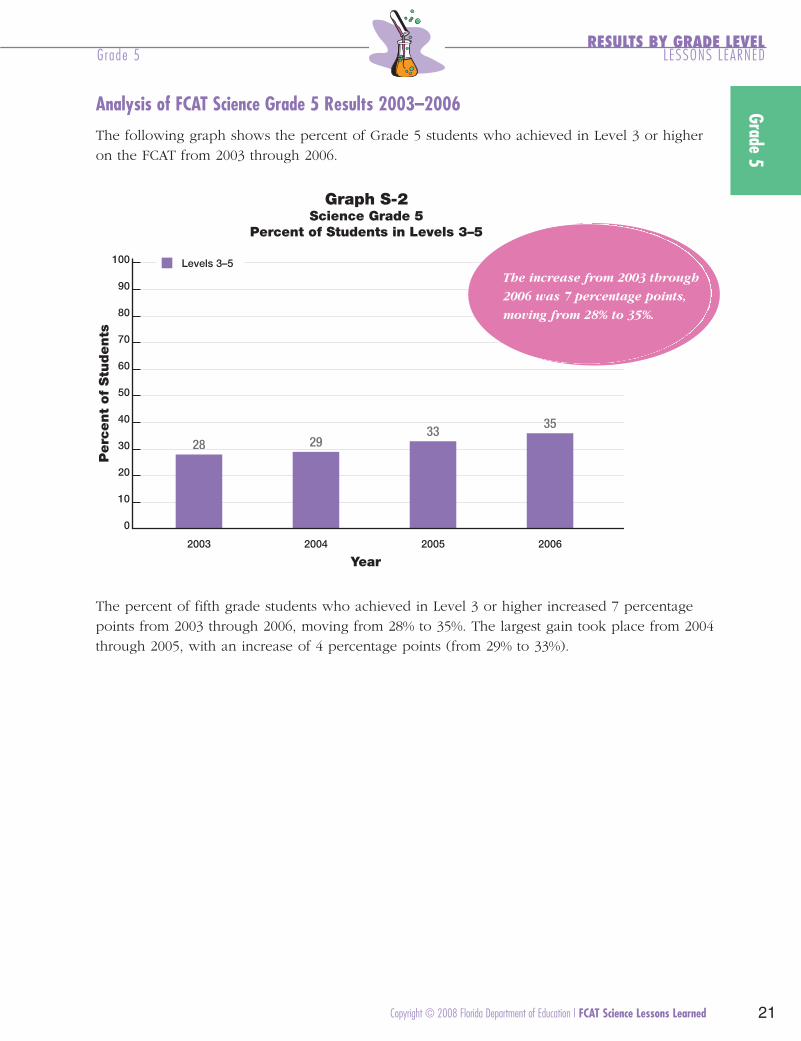
The following graph shows the percent of Grade 5 students who achieved in Level 3 or higher on the FCAT from 2003 through 2006.
Graph S-2Science Grade 5
Percent of Students in Levels 3–5
100 Levels 3–5
90
80
70
60
50
40 3533
30 28 29
20
10
0
2003 2004 2005 2006
The increase from 2003 through
2006 was 7 percentage points,
moving from 28% to 35%.
Year
Perc
ent
of
Stu
dents
RESULTS BY GRADE LEVEL Grade 5 LESSONS LEARNED
The percent of fifth grade students who achieved in Level 3 or higher increased 7 percentage points from 2003 through 2006, moving from 28% to 35%. The largest gain took place from 2004 through 2005, with an increase of 4 percentage points (from 29% to 33%).
Grade 5
Copyright © 2008 Florida Department of Education | FCAT Science Lessons Learned 21

FCAT08_LL_Sci_r9d1 5/6/08 4:39 PM Page 22
It is also worthwhile to study trends for each specific Achievement Level. When evaluating the trends in the following graph and in similar graphs to follow, a positive trend is indicated by a steady decrease in the percent of students achieving in Levels 1 and 2, and by a commensurate percent increase in Levels 3, 4, and 5.
Graph S-3Science Grade 5
Percent of Students by Achievement Level
Perc
ent
of
Stu
dents
50
40
30
20
10
0
38 37
29
36
22
34
4
1
4
1 1
34
24 27
5
38
27
2
6
29
2003 2004 2005 2006
Level 1
Level 2
Level 3
Level 4
Level 5
Graph S-3 shows a decrease
of 9 percentage points in Level 1
scores through 2006, moving
from 38% to 29%.
Year
RESULTS BY GRADE LEVEL LESSONS LEARNED Grade 5
Grad
e 5
Graph S-3 shows a decrease of 9 percentage points in Level 1 scores from 2003 through 2006, moving from 38% to 29%. The largest decrease within this trend is from 2004 through 2005, with a decrease of 8 percentage points. For Level 2 scores, there was an overall increase of 2 percentage points, from 34% to 36%, across the four-year period; however, there was an increase of 4 percentage points for Level 2 scores from 2004 through 2005. The trend line for Level 3 scores shows an overall increase of 5 percentage points from 2003 through 2006, from 22% to 27%. Similar to Level 2 scores, the largest one-year gain of Level 3 scores occurs from 2004 through 2005. The trend lines for Levels 4 and 5 are relatively flat, with gains of 2 and 1 percentage points, respectively.
FCAT Science Lessons Learned | Copyright © 2008 Florida Department of Education 22

FCAT08_LL_Sci_r9d1 5/6/08 4:39 PM Page 23
The information presented in Graph S-3 can also be illustrated with a bar graph. Doing soprovides a perspective that captures the distribution within each year, whereas Graph S-3 moreclearly illustrates Achievement Level results over time. Graph S-4 further illustrates the decreaseof Level 1 scores from 2003 through 2006, as well as the low and stable percentages for Level 4and 5 scores.
Graph S-4Science Grade 5
Percent of Students by Achievement Level
Level 1
Level 2
Level 350 Level 4
Level 5
40 38 3837 3634 34
30 29 2927 27
2422
20
10
654 421 1 1
0
2003 2004 2005 2006
Perc
ent
of
Stu
dents
Year
RESULTS BY GRADE LEVEL Grade 5 LESSONS LEARNED
Grade 5
Copyright © 2008 Florida Department of Education | FCAT Science Lessons Learned 23

FCAT08_LL_Sci_r9d1 5/6/08 4:39 PM Page 24
Student achievement for Grade 5 in each reporting cluster is provided in the following graph. Readers should pay particular attention to the overall performance across reporting clusters. While questions across administrations and within a reporting cluster are similar in the content to which they align, the results at the reporting-cluster level are not equated. Any changes in average question difficulty are not adjusted at the reporting-cluster level; therefore, it is important to realize that the changing results across administrations may reflect, in part, variance in question difficulty from year to year.
Graph S-5Science Grade 5
Mean Percent Correct by Reporting Cluster2003
2004 Cluster 1–Physical & Chemical SciencesCluster 2–Earth & Space Sciences
2005100
90
80
58 62 61
57 53
50 54
47
60 64
59
53 55
49
58 55
Cluster 1 Cluster 2 Cluster 3 Cluster 4
Cluster 3–Life & Environmental Sciences Cluster 4–Scientific Thinking2006
Mean P
erc
ent
Corr
ect
70
60
50
40
30
20
10
0
Reporting Cluster
RESULTS BY GRADE LEVEL LESSONS LEARNED Grade 5
Grad
e 5
Note: Caution must be used in interpreting this graph because the changes in performance over time may be attributed to changes in item difficulty. See pages 18–20 for appropriate methods that the DOE suggests schools and districts use to analyze performance at the reporting-cluster level.
FCAT Science Lessons Learned | Copyright © 2008 Florida Department of Education 24

FCAT08_LL_Sci_r9d1 5/6/08 4:39 PM Page 25
Analysis of FCAT Science Grade 8 Results 2003–2006
The results in the following graph show the percent of Grade 8 students who achieved in Level 3 or higher on the FCAT from 2003 through 2006.
Graph S-6Science Grade 8
Percent of Students in Levels 3–5
100 Levels 3–5
90
80
70
60
50
4033 32
30 28 28
20
10
0
2003 2004 2005 2006
The graph shows an overall
increase of 4 percentage points
in the number of eighth grade
students achieving in Level 3
or higher.
Year
Perc
ent
of
Stu
dents
RESULTS BY GRADE LEVEL Grade 8 LESSONS LEARNED
The graph shows an overall increase of 4 percentage points in the number of eighth grade students achieving in Level 3 or higher. For 2003 and 2004, the percent of eighth grade students achieving in Level 3 or higher remained stable at 28%, followed by an increase of 5 percentage points (to 33%) in 2005; however, in 2006, the percent decreased 1 percentage point to 32%.
Grade 8
Copyright © 2008 Florida Department of Education | FCAT Science Lessons Learned 25

FCAT08_LL_Sci_r9d1 5/6/08 4:39 PM Page 26
The following graph provides a detailed view of the shift in Grade 8 Achievement Levels over the four-year period.
Perc
ent
of
Stu
dents
Graph S-7Science Grade 8
Percent of Students by Achievement Level
50
40
30
20
10
0
2003 2004 2005 2006
Level 1
Level 2
Level 3
Level 4
Level 5
37 36
32
35
24
36
3
0
3
0 1
25
26
5
36
26
1
5
33
The percent of Level 2 scores
dropped 4 percentage points
overall, from 37% in 2003 to
33% in 2006.
Year
RESULTS BY GRADE LEVEL LESSONS LEARNED Grade 8
Grad
e 8
The Level 1 scores remained consistent at 36% from 2003 through 2005, but dropped 1 percentage point (to 35%) in 2006. The percent of Level 2 scores dropped 4 percentage points overall, from 37% in 2003 to 33% in 2006. The percent of Level 3 scores increased 2 percentage points, from 24% in 2003 to 26% in 2005, but remained at 26% in 2006. The Level 4 scores show an overall increase of 2 percentage points from 2003 through 2006, moving from 3% to 5%. This increase occurs specifically from 2004 through 2005. The percent of Level 5 scores remained relatively consistent from 2003 through 2006, with an initial measurement at 0% and an increase of 1 percentage point occurring from 2004 through 2005.
FCAT Science Lessons Learned | Copyright © 2008 Florida Department of Education 26

FCAT08_LL_Sci_r9d1 5/6/08 4:39 PM Page 27
A bar graph displaying the same data as Graph S-7 is provided below. The graph further shows the relative stability of the distribution of Achievement Level scores, with the exception of Level 2.
Perc
ent
of
Stu
dents
Graph S-8Science Grade 8
Percent of Students by Achievement Level
Level 1
Level 2
Level 350 Level 4
Level 5
40
36 37 36 36 36 353332
30
26 262524
20
10
5 53 3
1 10 00
2003 2004 2005 2006
Year
RESULTS BY GRADE LEVEL Grade 8 LESSONS LEARNED
Grade 8
Copyright © 2008 Florida Department of Education | FCAT Science Lessons Learned 27

FCAT08_LL_Sci_r9d1 5/6/08 4:39 PM Page 28
The following graph provides a view of Grade 8 student achievement at the reporting-cluster level.
Graph S-9Science Grade 8
Mean Percent Correct by Reporting Cluster2003
2004 Cluster 1–Physical & Chemical Sciences Cluster 2–Earth & Space Sciences
2005100 Cluster 3–Life & Environmental Sciences2006 Cluster 4–Scientific Thinking
90
80
70 64
60 5860 57 56 55 55 5352 50 50 4950 46 46
40 39
30
20
10
0
45
Cluster 1 Cluster 2 Cluster 3 Cluster 4
Mean P
erc
ent
Corr
ect
Reporting Cluster
RESULTS BY GRADE LEVEL LESSONS LEARNED Grade 8
Grad
e 8
Note: Caution must be used in interpreting this graph because the changes in performance over time may be attributed to changes in item difficulty. See pages 18–20 for appropriate methods that the DOE suggests schools and districts use to analyze performance at the reporting-cluster level.
FCAT Science Lessons Learned | Copyright © 2008 Florida Department of Education 28
FCAT08_LL_Sci_r9d1 5/6/08 4:39 PM Page 29
Analysis of FCAT Science Grade 11 Results 2003–2006
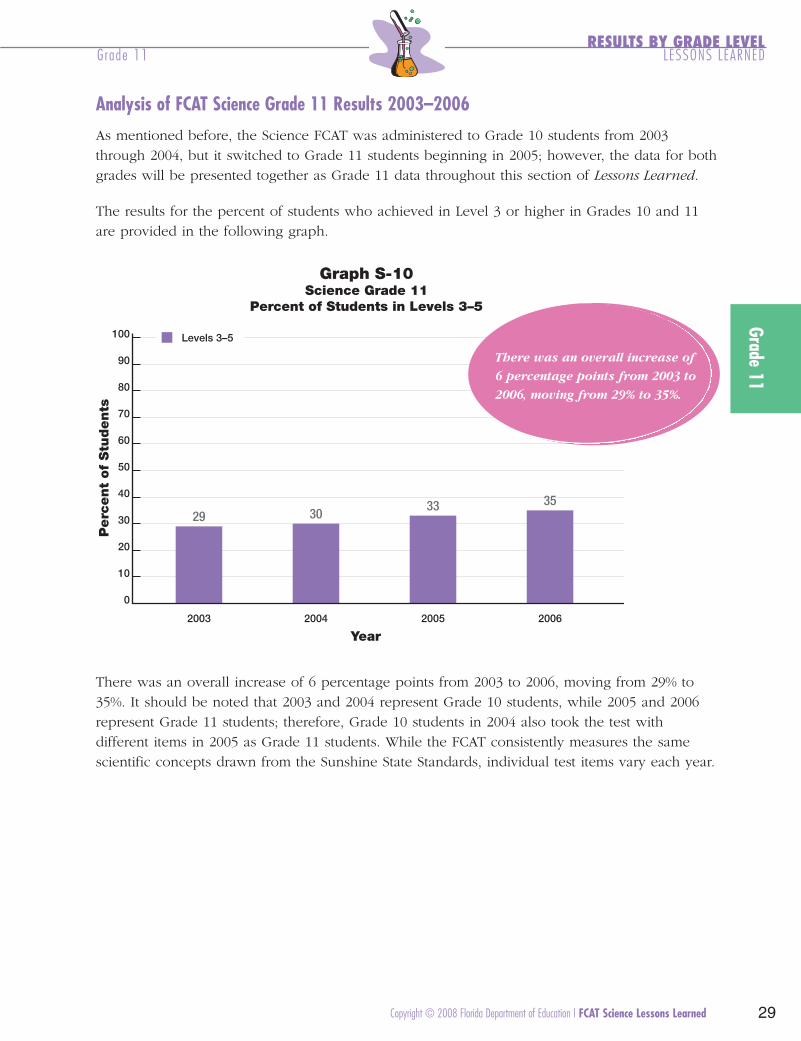
As mentioned before, the Science FCAT was administered to Grade 10 students from 2003 through 2004, but it switched to Grade 11 students beginning in 2005; however, the data for both grades will be presented together as Grade 11 data throughout this section of Lessons Learned.
The results for the percent of students who achieved in Level 3 or higher in Grades 10 and 11 are provided in the following graph.
Graph S-10Science Grade 11
Percent of Students in Levels 3–5
100 Levels 3–5
90
80
70
60
50
40 33 35
30 29 30
20
10
0
2003 2004 2005 2006
There was an overall increase of
6 percentage points from 2003 to
2006, moving from 29% to 35%.
Year
Perc
ent
of
Stu
dents
RESULTS BY GRADE LEVEL Grade 11 LESSONS LEARNED
There was an overall increase of 6 percentage points from 2003 to 2006, moving from 29% to 35%. It should be noted that 2003 and 2004 represent Grade 10 students, while 2005 and 2006 represent Grade 11 students; therefore, Grade 10 students in 2004 also took the test with different items in 2005 as Grade 11 students. While the FCAT consistently measures the same scientific concepts drawn from the Sunshine State Standards, individual test items vary each year.
Grade 11
Copyright © 2008 Florida Department of Education | FCAT Science Lessons Learned 29
FCAT08_LL_Sci_r9d1 5/6/08 4:39 PM Page 30
The following graph provides a detailed view of the distribution of Grade 11 Achievement Levels over the four-year period.
Graph S-11Science Grade 11
Percent of Students by Achievement Level
Perc
ent
of
Stu
dents
50
40
30
20
10
0
2003 2004 2005 2006
Year
Level 1
Level 2
Level 3
Level 4
Level 5
42 40
30 31 32
23
29
5
1
5
1 1
24 27
5
36
30
0
5
33
The percent of Level 1 scores
decreased 10 percentage points,
from 42% in 2003 to 32% in 2006.
RESULTS BY GRADE LEVEL LESSONS LEARNED Grade 11
Grad
e 11
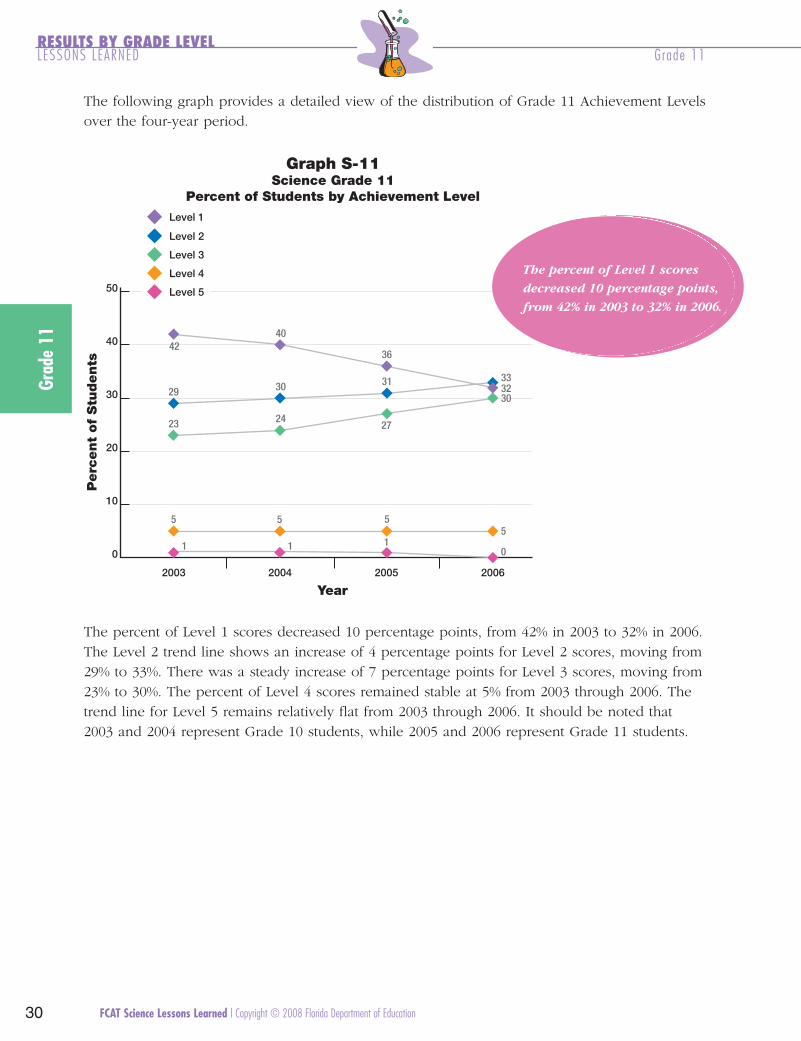
The percent of Level 1 scores decreased 10 percentage points, from 42% in 2003 to 32% in 2006. The Level 2 trend line shows an increase of 4 percentage points for Level 2 scores, moving from 29% to 33%. There was a steady increase of 7 percentage points for Level 3 scores, moving from 23% to 30%. The percent of Level 4 scores remained stable at 5% from 2003 through 2006. The trend line for Level 5 remains relatively flat from 2003 through 2006. It should be noted that 2003 and 2004 represent Grade 10 students, while 2005 and 2006 represent Grade 11 students.
FCAT Science Lessons Learned | Copyright © 2008 Florida Department of Education 30

FCAT08_LL_Sci_r9d1 5/6/08 4:39 PM Page 31
A bar graph displaying the same data as Graph S-11 is provided below. The graph providesmore support of the shift in scores from Level 1 to Levels 2 and 3. It should be noted that 2003and 2004 represent Grade 10 students, while 2005 and 2006 represent Grade 11 students.
Perc
ent
of
Stu
dents
Graph S-12Science Grade 11
Percent of Students by Achievement Level
Level 1
Level 2
Level 3
Level 450 Level 5
424040
36
32 333130 3030 29
27
2423
20
10
5 5 5 5
1 1 1 00
2003 2004 2005 2006
Year
RESULTS BY GRADE LEVEL Grade 11 LESSONS LEARNED
Grade 11
Copyright © 2008 Florida Department of Education | FCAT Science Lessons Learned 31

FCAT08_LL_Sci_r9d1 5/6/08 4:39 PM Page 32
The following graph provides a view of Grade 11 student achievement at the reporting-cluster level. It should be noted that 2003 and 2004 represent Grade 10 students, while 2005 and 2006 represent Grade 11 students.
Graph S-13Science Grade 11
Mean Percent Correct by Reporting Cluster2003
2004 Cluster 1–Physical & Chemical SciencesCluster 2–Earth & Space Sciences
2005100 Cluster 3–Life & Environmental Sciences2006 Cluster 4–Scientific Thinking
90
80
70
61 60 58 58 56
53 53 50 51 50 4950 46 45
42 40 43 42
40
30
20
10
0
Cluster 1 Cluster 2 Cluster 3 Cluster 4
Mean P
erc
ent
Corr
ect
Reporting Cluster
RESULTS BY GRADE LEVEL LESSONS LEARNED Grade 11
Grad
e 11
Note: Caution must be used in interpreting this graph because the changes in performance over time may be attributed to changes in item difficulty. See pages 18–20 for appropriate methods that the DOE suggests schools and districts use to analyze performance at the reporting-cluster level.
FCAT Science Lessons Learned | Copyright © 2008 Florida Department of Education 32

FCAT08_LL_Sci_r9d1 5/6/08 4:39 PM Page 33
Lessons Learned LONGITUDINAL RESULTS
FCAT Science Statewide AchievementLongitudinal Results
Longitudinal analyses track the progress of a cohort of students from grade to grade. For example, the reading and mathematics Lessons Learned reports show Grade 3 results in 2001, Grade 4 results in 2002, Grade 5 results in 2003, etc. This group of students is referred to as the Grade 3, 2001 cohort. Because the FCAT Science is not assessed in adjacent grades, as in reading and mathematics, the longitudinal analyses in this Lessons Learned report will be somewhat different.
The longitudinal analyses presented in this report will compare the following:
• Grade 5 students in 2003 to Grade 8 students in 2006 (Grade 5, 2003 cohort); • Grade 8 students in 2003 to Grade 11 students in 2006 (Grade 8, 2003 cohort); and • Grade 10 students in 2004 to Grade 11 students in 2005 (Grade 10, 2004 cohort).
Perfectly matched cohorts require the researcher to account for students who move in and out of state, limiting the analysis to those students who were in the cohort during the time period studied. While this analysis did not use perfectly matched cohorts, average achievement results at the state level should be unaffected, largely due to the substantial volume of data. In schools or districts with fewer students, the accuracy of longitudinal results becomes more questionable given that changes in smaller student populations have more impact on average results.
When interpreting the results of this section, it should be noted that the cognitive rigor of the test increases as the grade tested increases. For example, the balance of test questions that require high-level thinking is higher in Grade 11 than in Grade 8.
Copyright © 2008 Florida Department of Education | FCAT Science Lessons Learned 33

FCAT08_LL_Sci_r9d1 5/6/08 4:39 PM Page 34
LONGITUDINAL RESULTS LESSONS LEARNED Grade 5 Cohor t
Analysis of FCAT Science Grade 5 Cohort Results 2003–2006
The following graph provides the longitudinal comparison for the 2003 Grade 5 cohort.
Graph S-14Science Grade 5, 2003 Cohort
Percent of Students in Levels 3–5
2003 2004 2005 2006
Year
28 32
80
100
60
40
20
70
90
50
30
10
0
Perc
ent
of
Stu
dent
Cohort
The graph shows that 28% of the cohort scored in Level 3 or higher on the Grade 5 assessment in 2003, while 32% of this cohort scored in Level 3 or higher on the Grade 8 assessment in 2006.
FCAT Science Lessons Learned | Copyright © 2008 Florida Department of Education 34

FCAT08_LL_Sci_r9d1 5/6/08 4:39 PM Page 35
LONGITUDINAL RESULTS Grade 8 Cohor t LESSONS LEARNED
Analysis of FCAT Science Grade 8 Cohort Results 2003–2006
The following graph provides the longitudinal comparison for the 2003 Grade 8 cohort.
Graph S-15Science Grade 8, 2003 Cohort
Percent of Students in Levels 3–5
28 35
80
100
60
40
20
70
90
50
30
10
0
Perc
ent
of
Stu
dent
Cohort
2003 2004 2005 2006
Year
The graph shows that 28% of the cohort scored in Level 3 or higher on the Grade 8 assessment in 2003, while 35% of this cohort scored in Level 3 or higher on the Grade 11assessment in 2006.
Copyright © 2008 Florida Department of Education | FCAT Science Lessons Learned 35
FCAT08_LL_Sci_r9d1 5/6/08 4:39 PM Page 36
LONGITUDINAL RESULTS LESSONS LEARNED Grade 11 Cohor t
Analysis of FCAT Science Grade 10 Cohort Results 2004–2005
The following graph provides the longitudinal comparison for the 2004 Grade 10 cohort.
Graph S-16Science Grade 10, 2004 Cohort
Percent of Students in Levels 3–5
2003 2004 2005 2006
Year
30 33
80
100
60
40
20
70
90
50
30
10
0
Perc
ent
of
Stu
dent
Cohort
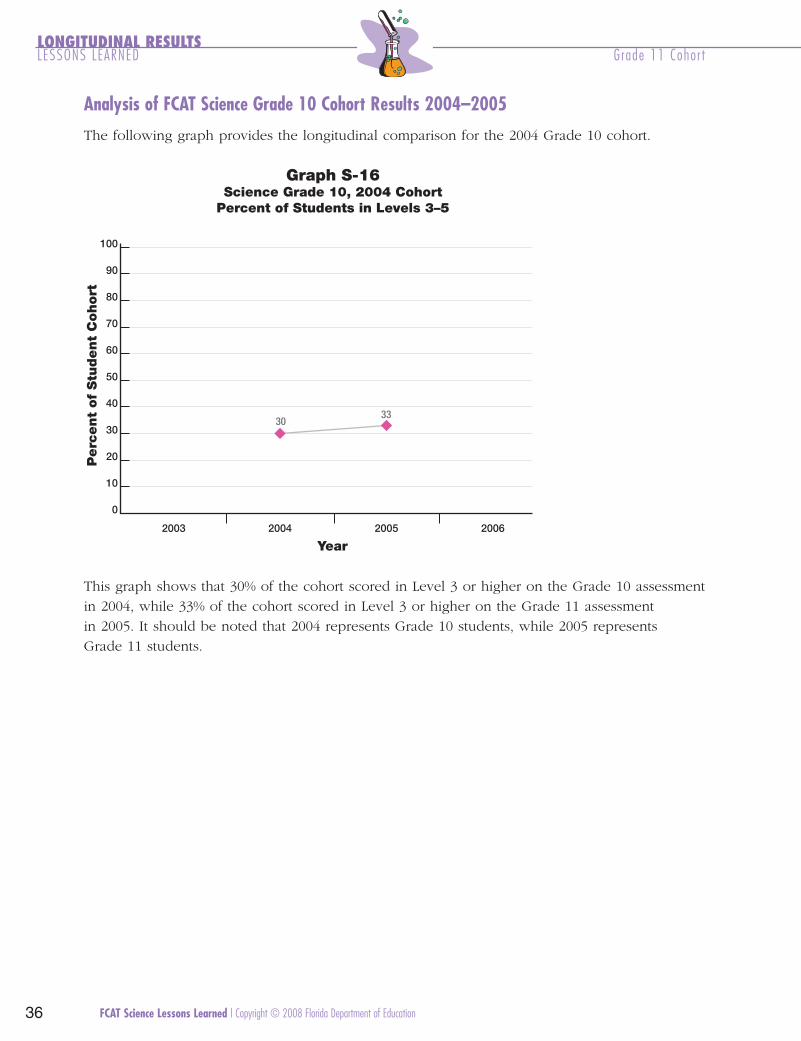
This graph shows that 30% of the cohort scored in Level 3 or higher on the Grade 10 assessment in 2004, while 33% of the cohort scored in Level 3 or higher on the Grade 11 assessment in 2005. It should be noted that 2004 represents Grade 10 students, while 2005 represents Grade 11 students.
FCAT Science Lessons Learned | Copyright © 2008 Florida Department of Education 36

FCAT08_LL_Sci_r9d1 5/6/08 4:39 PM Page 37
LONGITUDINAL RESULTS LESSONS LEARNED
Longitudinal Analysis Summary
The results of the longitudinal analysis are summarized in the following table.
Table 8: FCAT Science Longitudinal Cohort Percentage-Point Change
Cohort Percent of Students in Levels 3–5 Overall
Percentage-Point Change2003 2004 2005 2006
Grade 5, 2003 28% 32% 4%
Grade 8, 2003 28% 35% 7%
Grade 10, 2004 30% 33% 3%
As mentioned on page 33, the cohorts were not perfectly matched across the years. Individual students were not tracked across the years, e.g., from Grade 5 in 2003 to Grade 8 in 2006; therefore, each cohort referenced in Table 8 actually compares the performance of two grades. The Grade 5, 2003 cohort represents the students who were in Grade 5 in 2003 and in Grade 8 in 2006. The Grade 8, 2003 cohort represents the students who were in Grade 8 in 2003 and in Grade 11 in 2006. The Grade 10, 20046
6 As previously noted, the FCAT Science test was administered to Grades 5, 8, and 10 in 2003 and 2004. Beginning in 2005, FCATScience was administered to Grades 5, 8, and 11; therefore, Grade 10 students who took the test in 2004 also took it in 2005 asGrade 11 students. In this volume, the high school test and results are labeled “Grade 11” for ease of reference.
cohort represents the students who were in Grade 10 in 2004 and in Grade 11 in 2005.
The Grade 5, 2003 cohort showed an increase of 4 percentage points for students achieving in Level 3 or higher from Grade 5 in 2003 to Grade 8 in 2006. The Grade 8, 2003 cohort showed an increase of 7 percentage points for students achieving in Level 3 or higher from Grade 8 in 2003 to Grade 11 in 2006. The Grade 10, 2004 cohort showed an increase of 3 percentage points for students achieving in Level 3 or higher from Grade 10 in 2004 to Grade 11 in 2005. The reader should keep in mind that Developmental Scale Scores (DSS) have not been developed for science because the science test is currently assessed only in Grades 5, 8, and 11. Unlike the reading and math longitudinal analyses, the science longitudinal analysis is not assessed in consecutive grades, which limits its capacity to assess growth over time.
Copyright © 2008 Florida Department of Education | FCAT Science Lessons Learned 37

FCAT08_LL_Sci_r9d1 5/6/08 4:39 PM Page 38
FCAT Science Lessons Learned | Copyright © 2008 Florida Department of Education 38
FCAT08_LL_Sci_r9d1 5/6/08 4:39 PM Page 39
Lessons Learned RESULTS BY CLUSTER & INSTRUCTIONAL IMPLICATIONS
FCAT Science Statewide Achievement Results by Reporting Cluster with Instructional Implications
This section of Lessons Learned includes an analysis of student performance by reporting cluster and by grade (Grades 5, 8, and 11). The examination of each reporting cluster across grade levels provides important instructional implications to educators. Teachers at the elementary and middle school levels can benefit from learning about the expectations for student performance through high school. A view of student performance through the lens of achievement in reporting clusters provides valuable information about similarities and differences across grades.
The task force examined student performance on the four reporting clusters and on the individual strands that make up those reporting clusters to determine particular areas of student strength or weakness, the types of errors that limited student performance, and appropriate instructional strategies for classroom teachers. They supplemented these analyses with an examination of student performance on individual test questions at the strand level. Sample test questions are interspersed throughout the book to highlight observations for each reporting cluster and to demonstrate the variety of content assessed. The percent of students who selected each option on multiple-choice items, received credit on gridded-response items, or received a given rubric score is provided for each sample test question. In some cases, these percents will not add up to 100%. This is a result of rounding each percent to a whole number.
To gain a better understanding of student performance, the task force analyzed the correct answers, the incorrect answers that proved most attractive to students who did not respond correctly (for MC items), and the range of responses for GR, SR, and ER items.
The task force provided implications for instruction by grade level andreporting cluster.
Copyright © 2008 Florida Department of Education | FCAT Science Lessons Learned 39

FCAT08_LL_Sci_r9d1 5/6/08 4:39 PM Page 40
RESULTS BY CLUSTER Physical and Chemical SciencesLESSONS LEARNED Grade 5
Clus
ter 1
For additional information about the characteristics of FCAT items, including difficulty level, see Section 4.4 of the FCAT Handbook at http://fcat.fldoe.org/handbk/fcathandbook.asp. For each reporting cluster, mean percent correct student performance data are presented. The task force provided implications for instruction by reporting cluster. Sample test questions further clarify these observations and implications.
Each reporting cluster analysis section is organized by
• the reporting cluster title; • a graph depicting student performance data for that reporting cluster at each grade level; • a grade-level chart showing reporting cluster by strand, standard, and benchmark; and • a summary of performance at the reporting-cluster level with sample questions and
implications for instruction.
Reporting Cluster 1—Physical and Chemical Sciences
Grade 5
Reporting Cluster 1 Results for Grade 5
The Grade 5 results on Reporting Cluster 1 (Physical and Chemical Sciences) are displayed in the graph below.
Graph S-17Science Grade 5
Mean Percent Correct for Reporting Cluster 1
2003
2004100 2005
90 2006
80
Grade 5
Mean P
erc
ent
Corr
ect
70
62 61 60 58 57
50
40
30
20
10
0
Note: Caution must be used in interpreting this graph because the changes in performance over time may be attributed to changes in item difficulty. See pages 18–20 for appropriate methods that the DOE suggests schools and districts use to analyze performance at the reporting-cluster level.
FCAT Science Lessons Learned | Copyright © 2008 Florida Department of Education 40

FCAT08_LL_Sci_r9d1 5/6/08 4:39 PM Page 41
Physical and Chemical Sciences RESULTS BY CLUSTER Grade 5 LESSONS LEARNED
The following charts show the Reporting Cluster 1 (Physical and Chemical Sciences) strands, standards, and benchmarks for Grade 5. Observations, sample items, and implications for instruction for each reporting cluster follow the charts.
Strand A: The Nature of Matter
Standard 1. The student understands that all matter has observable, measurable properties.
Benchmark SC.A.1.2.1: The student determines that the properties of materials (e.g., density and volume) can be compared and measured (e.g., using rulers, balances, and thermometers).
Benchmark SC.A.1.2.2: The student knows that common materials (e.g., water) can be changed from one state to another by heating and cooling.
Benchmark SC.A.1.2.3: The student knows that the weight of an object always equals the sum of its parts.
Benchmark SC.A.1.2.4: The student knows that different materials are made by physically combining substances and that different objects can be made by combining different materials.
Benchmark SC.A.1.2.5: The student knows that materials made by chemically combining two or more substances may have properties that differ from the original materials.
Standard 2. The student understands the basic principles of atomic theory.
Benchmark SC.A.2.2.1: The student knows that materials may be made of parts too small to be seen without magnification.
Cluster 1
Copyright © 2008 Florida Department of Education | FCAT Science Lessons Learned
Strand B: Energy
Standard 1. The student recognizes that energy may be changed in form with varying efficiency.
Benchmark SC.B.1.2.1: The student knows how to trace the flow of energy in a system (e.g., as in an ecosystem).
Benchmark SC.B.1.2.2: The student recognizes various forms of energy (e.g., heat, light, and electricity). (Also assesses SC.B.1.2.3, SC.B.1.2.4, SC.B.1.2.5, and SC.B.1.2.6.)
Benchmark SC.B.1.2.3: The student knows that most things that emit light also emit heat. (Assessed as SC.B.1.2.2.)
Benchmark SC.B.1.2.4: The student knows the many ways in which energy can be transformed from one type to another. (Assessed as SC.B.1.2.2.)
Benchmark SC.B.1.2.5: The student knows that various forms of energy (e.g., mechanical, chemical, electrical, magnetic, nuclear, and radiant) can be measured in ways that make it possible to determine the amount of energy that is transformed. (Assessed as SC.B.1.2.2.)
Benchmark SC.B.1.2.6: The student knows ways that heat can move from one object to another. (Assessed as SC.B.1.2.2.)
Standard 2. The student understands the interaction of matter and energy.
Benchmark SC.B.2.2.1: The student knows that some source of energy is needed for organisms to stay alive and grow.
Benchmark SC.B.2.2.2: The student recognizes the costs and risks to society and the environment posed by the use of nonrenewable energy. (Assessed as SC.D.2.2.1.)
Benchmark SC.B.2.2.3: The student knows that the limited supply of usable energy sources (e.g., fuels such as coal or oil) places great significance on the development of renewable energy sources. (Assessed as SC.D.2.2.1.)
41

FCAT08_LL_Sci_r9d1 5/6/08 4:39 PM Page 42
RESULTS BY CLUSTER Physical and Chemical SciencesLESSONS LEARNED Grade 5
Clus
ter 1
Strand C: Force and Motion
Standard 1. The student understands that types of motion may be described, measured,
and predicted.
Benchmark SC.C.1.2.1: The student understands that the motion of an object can be described and measured.
Benchmark SC.C.1.2.2: The student knows that waves travel at different speeds through different materials.
Standard 2. The student understands that the types of force that act on an object and the
effect of that force can be described, measured, and predicted.
Benchmark SC.C.2.2.1: The student recognizes that forces of gravity, magnetism, and electricity operate simple machines.
Benchmark SC.C.2.2.2: The student knows that an object may move in a straight line at a constant speed, speed up, slow down, or change direction dependent on net force acting on the object. (Assessed as SC.C.2.2.4.)
Benchmark SC.C.2.2.3: The student knows that the more massive an object is, the less effect a given force has. (Assessed as SC.C.2.2.4.)
Benchmark SC.C.2.2.4: The student knows that the motion of an object is determined by the overall effect of all of the forces acting on the object. (Also assesses SC.C.2.2.2 and SC.C.2.2.3.)
Grade 5: Observations for Reporting Cluster 1—Physical and Chemical Sciences
Analysis of student performance data reveals the following:
Students who are successful are able to • identify the appropriate tools used for measuring length, mass, weight, volume,
and temperature;• identify cause-and-effect relationships in phase changes (e.g., “What happens to a solid if
you heat it?”) (see Sample Item 1); • identify familiar forms of energy (e.g., potential, kinetic, heat, light); • identify the force acting on an object; and • recognize situations when balanced and unbalanced forces are present.
Students who are unsuccessful have the greatest difficulty with • applying the concept of density to real-world situations (e.g., understanding why objects
float in water); • identifying representations of solutions (see Sample Item 2); • explaining the transfer of energy through a food chain (e.g., why eating is the transfer of
energy between trophic levels) and understanding that the Sun is the primary source of energy (see Sample Item 3); and
• explaining the effects of forces on an object (e.g., how forces such as friction or gravity affect the motion of an object).
FCAT Science Lessons Learned | Copyright © 2008 Florida Department of Education 42

FCAT08_LL_Sci_r9d1 5/6/08 4:39 PM Page 43
Grade 5 Cluster 1 Item #1 05SCB122M0981
Physical and Chemical Sciences Grade 5
RESULTS BY CLUSTER LESSONS LEARNED
Sample Item 1
Cluster 1
The head of a metal nail is dipped in melted candle wax. When the wax hardens, the head of the nail is coated with the wax. The rest of the nail has no wax. Tongs are used to hold the pointed end of the nail over the flame of a candle. Soon, the wax on the head of the nail begins to soften and then drip from the nail.
Nail NailWax Wax
Candle Candle
What causes the wax to melt?
A. Heat stored in the wax as it hardened on the nail. B. Heat stored in the nail from the time it was made. C. Heat moving through the air from the candle flame.
☞ D. Heat moving through the nail from the candle flame.
☞ Correct Answer Most recent student results
6% chose option A 3% chose option B
10% chose option C 81% chose option D
Copyright © 2008 Florida Department of Education | FCAT Science Lessons Learned 43

FCAT08_LL_Sci_r9d1 5/6/08 4:39 PM Page 44
Grade 5 Cluster 1 Item #2 05SCA124M0484
RESULTS BY CLUSTER Physical and Chemical SciencesLESSONS LEARNED Grade 5
Sample Item 2
Clus
ter 1 Roberto has four beakers containing different substances as shown below.
50% gravel 50% water
90% water 10% oil
70% alcohol 30% water
100% water
Beaker 1 Beaker 4 Beaker 3 Beaker 2
Which beaker contains a solution?
A. Beaker 1 ☞ B. Beaker 2
C. Beaker 3 D. Beaker 4
☞ Correct Answer
Most recent student results
24% chose option A 40% chose option B 20% chose option C 16% chose option D
FCAT Science Lessons Learned | Copyright © 2008 Florida Department of Education 44

FCAT08_LL_Sci_r9d1 5/6/08 4:39 PM Page 45
Grade 5 Cluster 1 Item #3 05SCB121S4317
Physical and Chemical Sciences RESULTS BY CLUSTER Grade 5 LESSONS LEARNED
The following is a short-response task and an example of a top-score response.
Sample Item 3
READ INQUIRE EXPLAIN
Frogs are the major predators of fireflies. Explain how energy from the Sun is transferred through a firefly to a frog.
An explanation similar to the following received a score of 2 points:
The Sun’s energy is caught by plants that use energy to grow. That energy is transferred to the firefly when it eats these plants. When the frog eats the firefly, the frog gets the firefly’s energy.
Most recent student results
11% earned 2 points 28% earned 1 point 61% earned 0 points
Cluster 1
Copyright © 2008 Florida Department of Education | FCAT Science Lessons Learned 45
FCAT08_LL_Sci_r9d1 5/6/08 4:39 PM Page 46
RESULTS BY CLUSTER Physical and Chemical SciencesLESSONS LEARNED Grade 5
Clus
ter 1
Grade 5: Implications for Instruction for Reporting Cluster 1—Physical and Chemical Sciences
The task force recommends that instruction should include teacher-demonstrated laboratory activities (labs), as well as student-designed labs. Students should have opportunities to apply, analyze, and explain the concepts of energy, force, and motion. Teachers should continue to teach measurement across subject areas, providing students opportunities to apply mathematical computations in science contexts (i.e., manipulate data from tables to find averages or differences). Scientific experiments must be followed by reflection, analysis, and explanation (i.e., oral and written lab summary reports). Students should move beyond knowing definitions into practical applications of the concepts to include hands-on experiences, connections to their real-life experiences, and manipulation of variables in experiments.
Instruction should focus on relationships within a system to emphasize that the parts of the system are connected to each other and to the whole (e.g., energy transfers in food chains and food webs, and phase changes in the water cycle). Rather than teaching parts of a system in isolation, teachers must focus on whole systems so that students can explain the entire system starting at any given point within that system. The task force suggests that instruction provide students with opportunities to manipulate objects and then explain, using words and diagrams, the effects that different forces have on those objects (i.e., what would happen with or without a given force).
FCAT Science Lessons Learned | Copyright © 2008 Florida Department of Education 46

FCAT08_LL_Sci_r9d1 5/6/08 4:39 PM Page 47
Strand
Grade 8
Reporting Cluster 1 Results for Grade 8
The Grade 8 results on Reporting Cluster 1 (Physical and Chemical Sciences) are displayed in the graph below.
Graph S-18Science Grade 8
Mean Percent Correct for Reporting Cluster 1
2003
100 2004
200590 2006
80
70
60 5752 5050
40
30
20
10
0
39
Grade 8
Mean P
erc
ent
Corr
ect
Physical and Chemical Sciences RESULTS BY CLUSTER Grade 8 LESSONS LEARNED
Note: Caution must be used in interpreting this graph because the changes in performance over time may be attributed to changes in item difficulty. See pages 18–20 for appropriate methods that the DOE suggests schools and districts use to analyze performance at the reporting-cluster level.
The following charts show the Reporting Cluster 1 (Physical and Chemical Sciences) strands, standards, and benchmarks for Grade 8. Observations, sample items, and implications for instruction follow each reporting cluster.
Cluster 1
Copyright © 2008 Florida Department of Education | FCAT Science Lessons Learned 47

FCAT08_LL_Sci_r9d1 5/6/08 4:39 PM Page 48
RESULTS BY CLUSTER Physical and Chemical SciencesLESSONS LEARNED Grade 8
Clus
ter 1
Strand A: The Nature of Matter
Standard 1. The student understands that all matter has observable, measurable properties.
Benchmark SC.A.1.3.1: The student identifies various ways in which substances differ (e.g., mass, volume, shape, density, texture, and reaction to temperature and light). (Also assesses SC.A.1.3.2 and SC.A.1.3.6.)
Benchmark SC.A.1.3.2: The student understands the difference between weight and mass. (Assessed as SC.A.1.3.1.)
Benchmark SC.A.1.3.3: The student knows that temperature measures the average energy of motion of the particles that make up the substance.
Benchmark SC.A.1.3.4: The student knows that atoms in solids are close together and do not move around easily; in liquids, atoms tend to move farther apart; in gas, atoms are quite far apart and move around freely.
Benchmark SC.A.1.3.5: The student knows the difference between a physical change in a substance (i.e., altering the shape, form, volume, or density) and a chemical change (i.e., producing new substances with different characteristics).
Benchmark SC.A.1.3.6: The student knows that equal volumes of different substances may have different masses. (Assessed as SC.A.1.3.1.)
Standard 2. The student understands the basic principles of atomic theory.
Benchmark SC.A.2.3.1: The student describes and compares the properties of particles and waves.
Benchmark SC.A.2.3.2: The student knows the general properties of the atom (a massive nucleus of neutral neutrons and positive protons surrounded by a cloud of negative electrons) and accepts that single atoms are not visible.
Benchmark SC.A.2.3.3: The student knows that radiation, light, and heat are forms of energy used to cook food, treat diseases, and provide energy. (Assessed as SC.B.1.3.1.)
Strand B: Energy
Standard 1. The student recognizes that energy may be changed in form with varying efficiency.
Benchmark SC.B.1.3.1: The student identifies forms of energy and explains that they can be measured and compared. (Also assesses SC.A.2.3.3, SC.B.1.3.2, SC.B.1.3.3, and SC.B.1.3.4.)
Benchmark SC.B.1.3.2: The student knows that energy cannot be created or destroyed, but only changed from one form to another. (Assessed as SC.B.1.3.1.)
Benchmark SC.B.1.3.3: The student knows the various forms in which energy comes to Earth from the sun (e.g., visible light, infrared, and microwave). (Assessed as SC.B.1.3.1.)
Benchmark SC.B.1.3.4: The student knows that energy conversions are never 100% efficient (i.e., some energy is transformed to heat and is unavailable for further useful work). (Assessed as SC.B.1.3.1.)
Benchmark SC.B.1.3.5: The student knows the processes by which thermal energy tends to flow from a system of higher temperature to a system of lower temperature.
Benchmark SC.B.1.3.6: The student knows the properties of waves (e.g., frequency, wavelength, and amplitude); that each wave consists of a number of crests and troughs; and the effects of different media on waves. (Also assesses SC.C.1.3.2.)
FCAT Science Lessons Learned | Copyright © 2008 Florida Department of Education 48

FCAT08_LL_Sci_r9d1 5/6/08 4:39 PM Page 49
Physical and Chemical Sciences RESULTS BY CLUSTER Grade 8 LESSONS LEARNED
Strand B: Energy
Standard 2. The student understands the interaction of matter and energy.
Benchmark SC.B.2.3.1: The student knows that most events in the universe (e.g., weather changes, moving cars, and the transfer of a nervous impulse in the human body) involve some form of energy transfer and that these changes almost always increase the total disorder of the system and its surroundings, reducing the amount of useful energy.
Benchmark SC.B.2.3.2: The student knows that most of the energy used today is derived from burning stored energy collected by organisms millions of years ago (i.e., nonrenewable fossil fuels). (Assessed as SC.G.2.3.1.)
Strand C: Force and Motion
Standard 1. The student understands that types of motion may be described, measured,
and predicted.
Benchmark SC.C.1.3.1: The student knows that the motion of an object can be described by its position, direction of motion, and speed.
Benchmark SC.C.1.3.2: The student knows that vibrations in materials set up wave disturbances that spread away from the source (e.g., sound and earthquake waves). (Assessed as SC.B.1.3.6.)
Standard 2. The student understands that the types of force that act on an object and the effect
of that force can be described, measured, and predicted.
Benchmark SC.C.2.3.1: The student knows that many forces (e.g., gravitational, electrical, and magnetic) act at a distance (i.e., without contact).
Benchmark SC.C.2.3.2: The student knows common contact forces. (Assessed as SC.C.2.3.6.)
Benchmark SC.C.2.3.3: The student knows that if more than one force acts on an object, then the forces can reinforce or cancel each other, depending on their direction and magnitude. (Assessed as SC.C.2.3.6.)
Benchmark SC.C.2.3.4: The student knows that simple machines can be used to change the direction or size of a force.
Benchmark SC.C.2.3.5: The student understands that an object in motion will continue at a constant speed and in a straight line until acted upon by a force and that an object at rest will remain at rest until acted upon by a force. (Assessed as SC.C.2.3.6.)
Benchmark SC.C.2.3.6: The student explains and shows the ways in which a net force (i.e., the sum of all acting forces) can act on an object (e.g., speeding up an object traveling in the same direction as the net force, slowing down an object traveling in the direction opposite of the net force). (Also assesses SC.C.2.3.2, SC.C.2.3.3, and SC.C.2.3.5.)
Benchmark SC.C.2.3.7: The student knows that gravity is a universal force that every mass exerts on every other mass.
Cluster 1
Copyright © 2008 Florida Department of Education | FCAT Science Lessons Learned 49

FCAT08_LL_Sci_r9d1 5/6/08 4:39 PM Page 50
RESULTS BY CLUSTER Physical and Chemical SciencesLESSONS LEARNED Grade 8
Clus
ter 1
Grade 8: Observations for Reporting Cluster 1—Physical and Chemical Sciences
Analysis of student performance data reveals the following:
Students who are successful are able to • perform calculations to find density when given the mass and volume of an object; • identify arrangements of molecules for different states of matter (i.e., solid, liquid, gas); • recognize different forms of energy; and • identify gravity as the force that causes objects to fall to Earth (see Sample Item 4).
Students who are unsuccessful have the greatest difficulty with • explaining the concept of density (the ratio of mass to volume); • manipulating formulas to solve problems (i.e., mass, volume, work, frequency, force); • explaining the difference between weight and mass; • identifying and explaining energy conversions (e.g., solar energy to electrical energy,
mechanical energy to thermal energy, electrical energy to mechanical energy); • demonstrating understanding that energy can be released as heat during energy conversions
(see Sample Item 5); • identifying wave properties and characteristics (see Sample Item 6); and • explaining the effects of forces on an object (e.g., friction is a force that opposes motion).
FCAT Science Lessons Learned | Copyright © 2008 Florida Department of Education 50

FCAT08_LL_Sci_r9d1 5/6/08 4:39 PM Page 51
Grade 8 Cluster 1 Item #1 08SCC231M8372
Physical and Chemical Sciences RESULTS BY CLUSTER Grade 8 LESSONS LEARNED
Sample Item 4
Sam drops a rubber ball from the top of a staircase to his friend, as shown in the picture below. The speed of the ball increases as it gets farther away from Sam’s hand.
One ball is dropped
What is the best explanation for the increase in the speed of the ball?
A. Electric forces are acting on the ball. B. Air resistance is accelerating the ball. C. Magnetic forces are pushing the ball.
☞ D. Gravitational force is pulling on the ball.
☞ Correct Answer
Most recent student results
9% chose option A 2% chose option B 1% chose option C
89% chose option D
Cluster 1
Copyright © 2008 Florida Department of Education | FCAT Science Lessons Learned 51

FCAT08_LL_Sci_r9d1 5/6/08 4:39 PM Page 52
Grade 8 Cluster 1 Item #2 08SCB131E8926
RESULTS BY CLUSTER Physical and Chemical SciencesLESSONS LEARNED Grade 8
Clus
ter 1
The following is an extended-response task and an example of a top-score response.
Sample Item 5
READ INQUIRE EXPLAIN
Florida can get very hot and humid as temperatures reach 40° Celsius or higher. Many residents use room fans to keep themselves cool. Fans, however, produce more heat than people suspect, even when the fan itself seems to be keeping the people cool. An electrical fan is an example of a device that actually uses energy in several different forms.
An explanation similar to the following received a score of 4 points:
Part A Identify the energy conversions that occur when using an electrical fan.
Electrical energy turns into mechanical energy when the fan is turned on. Mechanical energy turns into heat energy as the fan runs.
Part B Explain why a fan’s motor produces heat when in use.
The fan’s motor gets hot because all the gears rubbing together make friction.
Most recent student results 0% earned 4 points 2% earned 3 points 7% earned 2 points
15% earned 1 point 66% earned 0 points
FCAT Science Lessons Learned | Copyright © 2008 Florida Department of Education 52
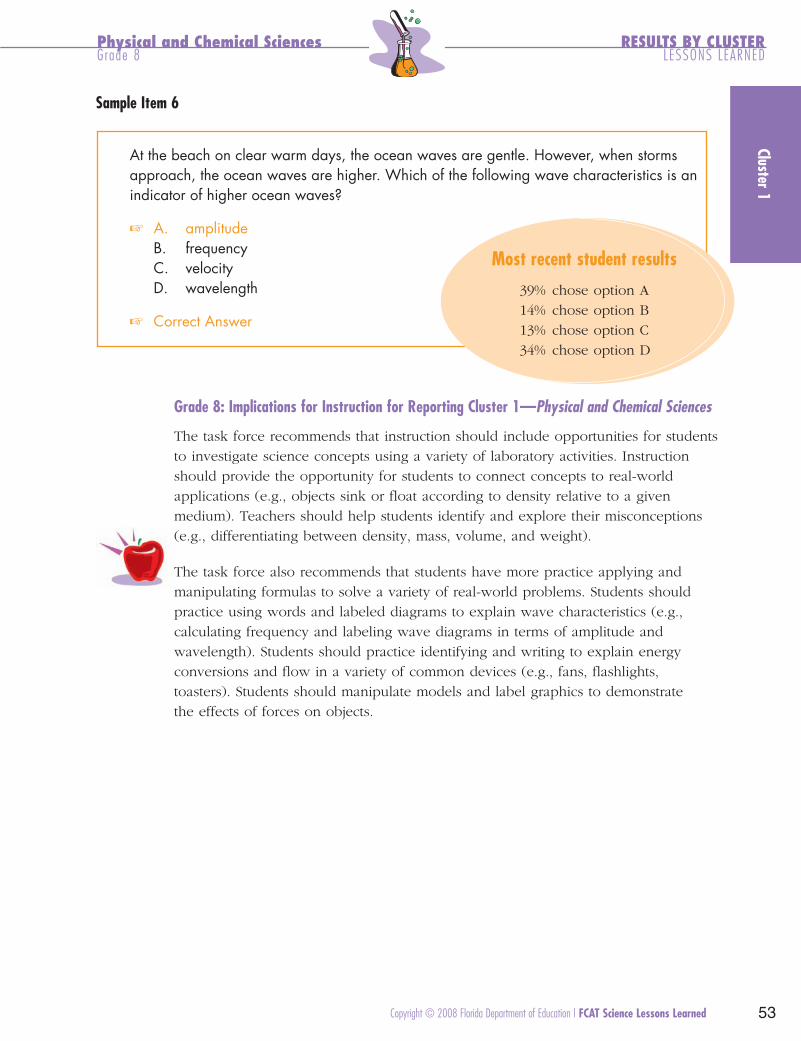
FCAT08_LL_Sci_r9d1 5/6/08 4:39 PM Page 53
Grade 8 Cluster 1 Item #3 08SCB136M0014
Physical and Chemical Sciences Grade 8
RESULTS BY CLUSTER LESSONS LEARNED
Sample Item 6
Cluster 1
At the beach on clear warm days, the ocean waves are gentle. However, when storms approach, the ocean waves are higher. Which of the following wave characteristics is an indicator of higher ocean waves?
☞ A. amplitude B. frequency C. velocity
D. wavelength
☞ Correct Answer
Most recent student results
39% chose option A 14% chose option B 13% chose option C 34% chose option D
Grade 8: Implications for Instruction for Reporting Cluster 1—Physical and Chemical Sciences
The task force recommends that instruction should include opportunities for students to investigate science concepts using a variety of laboratory activities. Instruction should provide the opportunity for students to connect concepts to real-world applications (e.g., objects sink or float according to density relative to a given medium). Teachers should help students identify and explore their misconceptions (e.g., differentiating between density, mass, volume, and weight).
The task force also recommends that students have more practice applying and manipulating formulas to solve a variety of real-world problems. Students should practice using words and labeled diagrams to explain wave characteristics (e.g., calculating frequency and labeling wave diagrams in terms of amplitude and wavelength). Students should practice identifying and writing to explain energy conversions and flow in a variety of common devices (e.g., fans, flashlights, toasters). Students should manipulate models and label graphics to demonstrate the effects of forces on objects.
Copyright © 2008 Florida Department of Education | FCAT Science Lessons Learned 53

FCAT08_LL_Sci_r9d1 5/6/08 4:39 PM Page 54
Grade 11
Reporting Cluster 1 Results for Grade 11
The Grade 11 results on Reporting Cluster 1 (Physical and Chemical Sciences) are displayed in the graph below. It should be noted that 2003 and 2004 represent Grade 10 students, while 2005 and 2006 represent Grade 11 students.
Graph S-19Science Grade 11
Mean Percent Correct for Reporting Cluster 1
2003
2004100 2005
90 2006
80
Grade 11
Mean P
erc
ent
Corr
ect
70
60
50 46 42 40
43 40
30
20
10
0
RESULTS BY CLUSTER Physical and Chemical SciencesLESSONS LEARNED Grade 11
Clus
ter 1
Note: Caution must be used in interpreting this graph because the changes in performance over time may be attributed to changes in item difficulty. See pages 18–20 for appropriate methods that the DOE suggests schools and districts use to analyze performance at the reporting-cluster level.
The following charts show the Reporting Cluster 1 (Physical and Chemical Sciences) strands, standards, and benchmarks for Grade 11. Observations, sample items, and implications for instruction follow each reporting cluster.
FCAT Science Lessons Learned | Copyright © 2008 Florida Department of Education 54
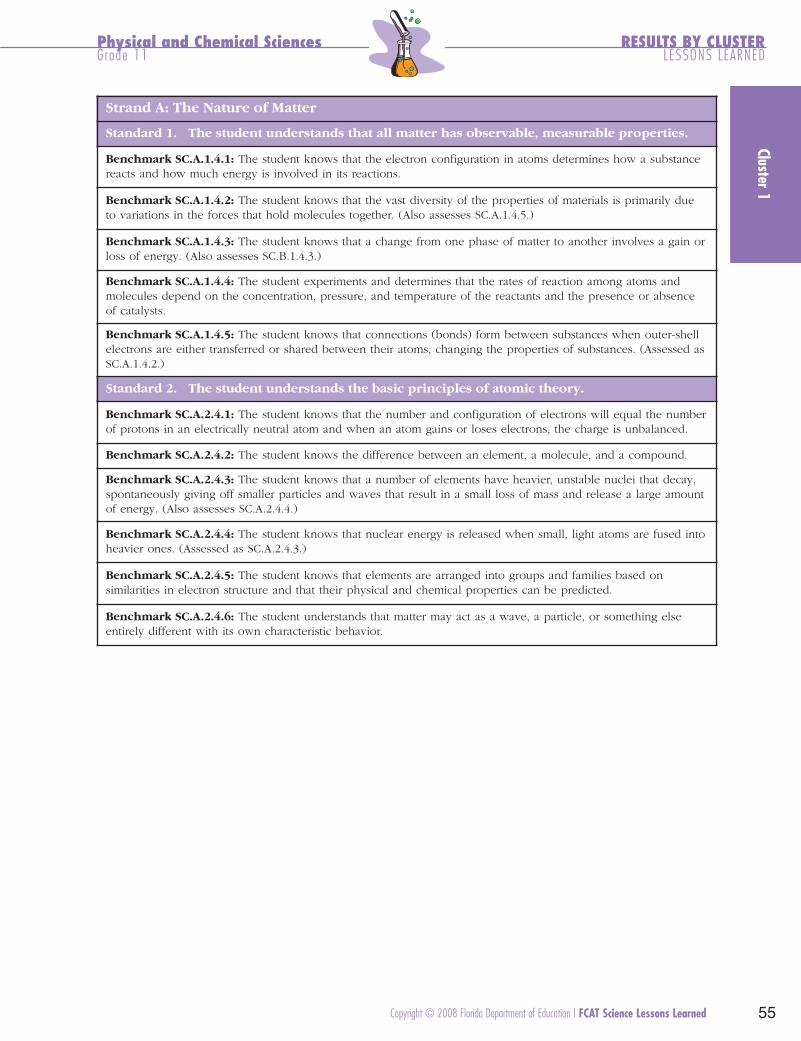
FCAT08_LL_Sci_r9d1 5/6/08 4:39 PM Page 55
Physical and Chemical Sciences RESULTS BY CLUSTER Grade 11 LESSONS LEARNED
Strand A: The Nature of Matter
Standard 1. The student understands that all matter has observable, measurable properties.
Benchmark SC.A.1.4.1: The student knows that the electron configuration in atoms determines how a substance reacts and how much energy is involved in its reactions.
Benchmark SC.A.1.4.2: The student knows that the vast diversity of the properties of materials is primarily due to variations in the forces that hold molecules together. (Also assesses SC.A.1.4.5.)
Benchmark SC.A.1.4.3: The student knows that a change from one phase of matter to another involves a gain or loss of energy. (Also assesses SC.B.1.4.3.)
Benchmark SC.A.1.4.4: The student experiments and determines that the rates of reaction among atoms and molecules depend on the concentration, pressure, and temperature of the reactants and the presence or absence of catalysts.
Benchmark SC.A.1.4.5: The student knows that connections (bonds) form between substances when outer-shell electrons are either transferred or shared between their atoms, changing the properties of substances. (Assessed as SC.A.1.4.2.)
Standard 2. The student understands the basic principles of atomic theory.
Benchmark SC.A.2.4.1: The student knows that the number and configuration of electrons will equal the number of protons in an electrically neutral atom and when an atom gains or loses electrons, the charge is unbalanced.
Benchmark SC.A.2.4.2: The student knows the difference between an element, a molecule, and a compound.
Benchmark SC.A.2.4.3: The student knows that a number of elements have heavier, unstable nuclei that decay, spontaneously giving off smaller particles and waves that result in a small loss of mass and release a large amount of energy. (Also assesses SC.A.2.4.4.)
Benchmark SC.A.2.4.4: The student knows that nuclear energy is released when small, light atoms are fused into heavier ones. (Assessed as SC.A.2.4.3.)
Benchmark SC.A.2.4.5: The student knows that elements are arranged into groups and families based on similarities in electron structure and that their physical and chemical properties can be predicted.
Benchmark SC.A.2.4.6: The student understands that matter may act as a wave, a particle, or something else entirely different with its own characteristic behavior.
Cluster 1
Copyright © 2008 Florida Department of Education | FCAT Science Lessons Learned 55

FCAT08_LL_Sci_r9d1 5/6/08 4:39 PM Page 56
RESULTS BY CLUSTER Physical and Chemical SciencesLESSONS LEARNED Grade 11
Clus
ter 1
Strand B: Energy
Standard 1. The student recognizes that energy may be changed in form with varying efficiency.
Benchmark SC.B.1.4.1: The student understands how knowledge of energy is fundamental to all the scientific disciplines (e.g., the energy required for biological processes in living organisms and the energy required for the building, erosion, and rebuilding of the Earth). (Also assesses SC.B.1.4.2.)
Benchmark SC.B.1.4.2: The student understands that there is conservation of mass and energy when matter is transformed. (Assessed as SC.B.1.4.1.)
Benchmark SC.B.1.4.3: The student knows that temperature is a measure of the average translational kinetic energy of motion of the molecules in an object. (Assessed as SC.A.1.4.3.)
Benchmark SC.B.1.4.4: The student knows that as electrical charges oscillate, they create time-varying electric and magnetic fields that propagate away from the source as an electromagnetic wave.
Benchmark SC.B.1.4.5: The student knows that each source of energy presents advantages and disadvantages to its use in society (e.g., political and economic implications may determine a society’s selection of renewable or nonrenewable energy sources). (Assessed as SC.G.2.4.2.)
Benchmark SC.B.1.4.6: The student knows that the first law of thermodynamics relates the transfer of energy to the work done and the heat transferred. (Assessed as SC.B.1.4.7.)
Benchmark SC.B.1.4.7: The student knows that the total amount of usable energy always decreases, even though the total amount of energy is conserved in any transfer. (Also assesses SC.B.1.4.6.)
Standard 2. The student understands the interaction of matter and energy.
Benchmark SC.B.2.4.1: The student knows that the structure of the universe is the result of interactions involving fundamental particles (matter) and basic forces (energy) and that evidence suggests that the universe contains all of the matter and energy that ever existed.
FCAT Science Lessons Learned | Copyright © 2008 Florida Department of Education 56
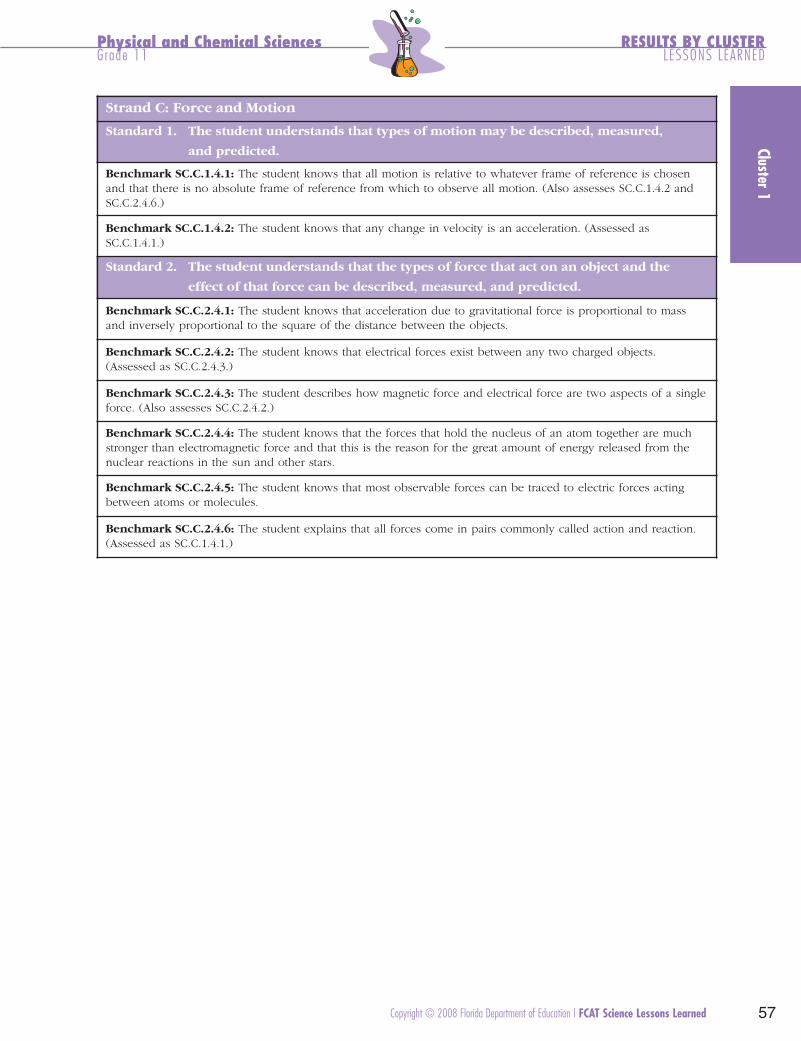
FCAT08_LL_Sci_r9d1 5/6/08 4:39 PM Page 57
Physical and Chemical Sciences RESULTS BY CLUSTER Grade 11 LESSONS LEARNED
Strand C: Force and Motion
Standard 1. The student understands that types of motion may be described, measured,
and predicted.
Benchmark SC.C.1.4.1: The student knows that all motion is relative to whatever frame of reference is chosen and that there is no absolute frame of reference from which to observe all motion. (Also assesses SC.C.1.4.2 and SC.C.2.4.6.)
Benchmark SC.C.1.4.2: The student knows that any change in velocity is an acceleration. (Assessed as SC.C.1.4.1.)
Standard 2. The student understands that the types of force that act on an object and the
effect of that force can be described, measured, and predicted.
Benchmark SC.C.2.4.1: The student knows that acceleration due to gravitational force is proportional to mass and inversely proportional to the square of the distance between the objects.
Benchmark SC.C.2.4.2: The student knows that electrical forces exist between any two charged objects. (Assessed as SC.C.2.4.3.)
Benchmark SC.C.2.4.3: The student describes how magnetic force and electrical force are two aspects of a single force. (Also assesses SC.C.2.4.2.)
Benchmark SC.C.2.4.4: The student knows that the forces that hold the nucleus of an atom together are much stronger than electromagnetic force and that this is the reason for the great amount of energy released from the nuclear reactions in the sun and other stars.
Benchmark SC.C.2.4.5: The student knows that most observable forces can be traced to electric forces acting between atoms or molecules.
Benchmark SC.C.2.4.6: The student explains that all forces come in pairs commonly called action and reaction. (Assessed as SC.C.1.4.1.)
Cluster 1
Copyright © 2008 Florida Department of Education | FCAT Science Lessons Learned 57

FCAT08_LL_Sci_r9d1 5/6/08 4:39 PM Page 58
RESULTS BY CLUSTER Physical and Chemical SciencesLESSONS LEARNED Grade 11
Clus
ter 1
Grade 11: Observations for Reporting Cluster 1—Physical and Chemical Sciences
Analysis of student performance data reveals the following:
Students who are successful are able to • identify and explain the relationships between kinetic energy and temperature changes; • differentiate between elements and compounds when given a chemical formula; • identify valence electrons for a given element, using the periodic table; and • recognize properties of metals.
Students who are unsuccessful have the greatest difficulty with • explaining relationships between temperature and energy changes and performing related
calculations associated with a heating curve;• identifying the factors that affect rates of reactions (e.g., temperature, surface area,
concentration, catalysts) and explaining the role of these factors (see Sample Item 7);• recognizing how properties change across the periodic table (e.g., properties change across
periods but are similar within groups/families); • making the connection between valence electrons and the formation of ions; • applying the laws of conservation of mass and energy in a variety of disciplines, such
as environmental systems, biological systems, physical systems, and chemical systems (see Sample Item 8);
• understanding the relationship between potential and kinetic energy of objects in motion (see Sample Item 9);
• explaining motion and performing calculations associated with motion (e.g., acceleration,relative motion, frame of reference); and
• describing the relationships among gravitational force, distance, and mass.
FCAT Science Lessons Learned | Copyright © 2008 Florida Department of Education 58

FCAT08_LL_Sci_r9d1 5/6/08 4:39 PM Page 59
Grade 11 Cluster 1 Item #1 10SCA144S0542
The following is a short-response task and an example of a top-score response.
Sample Item 7
READ To produce sulfuric acid (H2SO4), one industrial plant uses the “contact process,” which INQUIRE EXPLAIN consists of several reactions. The initial reaction in this process uses sulfur dioxide (SO2)
and oxygen (O2) in the presence of vanadium oxide (V2O5) pellets to produce sulfur trioxide (SO3) as shown below.
V2O5
2SO2 (g) Sulfur
dioxide
O2 (g)Oxygen
Pellets 2SO3 (g)
Sulfur trioxide
Physical and Chemical Sciences RESULTS BY CLUSTER Grade 11 LESSONS LEARNED
An explanation similar to the following received a score of 2 points:
Part A In the reaction between SO2 and O2, what is the role of the V2O5 pellets?
The vanadium oxide pellets serve as a catalyst in the reaction between SO2 and O2.
Part B Explain what the industrial chemists could do to increase the efficiency of this reaction.
To increase the reaction’s efficiency, the chemists could increase the temperature at which the reaction occurs.
Most recent student results
6% earned 2 points 22% earned 1 point 72% earned 0 points
Cluster 1
Copyright © 2008 Florida Department of Education | FCAT Science Lessons Learned 59

FCAT08_LL_Sci_r9d1 5/6/08 4:39 PM Page 60
Grade 11 Cluster 1 Item #2 10SCC241M1002
Grade 11 Cluster 1 Item #3 10SCB141G0537
LESSONS LEARNED Cl
uste
r 1
RESULTS BY CLUSTER Physical and Chemical SciencesGrade 11
Sample Item 8
A space shuttle is launched from the Kennedy Space Center in Florida. What happens to the gravitational force that is exerted on the space shuttle while it remains in an orbit around Earth?
A. The gravitational force increases. B. The gravitational force decreases.
☞ C. The gravitational force remains the same. D. The gravitational force decreases at first
and then increases.
☞ Correct Answer
Most recent student results
19% chose option A 31% chose option B 36% chose option C 14% chose option D
Sample Item 9
Assume there is no energy loss due to air resistance or friction. At what height, in centimeters (cm), will the potential energy and the kinetic energy of the pendulum be equal?
Correct Answer: 30
Highest point
C E I L I N G
Steel wire
Pendulum
Lowest point
60 cm
0 cm
A swinging pendulum is shown below. The highest point of the pendulum swing is at 60 centimeters (cm), and the lowest point of the pendulum swing is 0 cm.
Most recent student results
30% of Grade 11 students answered this
question correctly.
FCAT Science Lessons Learned | Copyright © 2008 Florida Department of Education 60

FCAT08_LL_Sci_r9d1 5/6/08 4:39 PM Page 61
Physical and Chemical Sciences RESULTS BY CLUSTER Grade 11 LESSONS LEARNED
Grade 11: Implications for Instruction for Reporting Cluster 1—Physical and Chemical Sciences
The task force recommends that students should have the opportunity to compare and contrast, interpret, analyze, and explain chemical and physical concepts during laboratory activities and classroom discussions. To address common misconceptions, teachers should have students model their understandings of various relationships so teachers can modify instruction as needed.
Whenever appropriate, instruction should emphasize the presence and role of catalysts using different contexts. Students should perform laboratory activities using enzymes or other catalysts and then write to explain the role of catalysts in these labs. Using real-life experiences, students should make connections between observations and applications of the laws of conservation of energy and mass (e.g., using a chemical reaction to demonstrate the conservation of mass, tracing the amounts of energy moving through a food chain, analyzing changes in potential and kinetic energy for objects in motion).
Cluster 1
Copyright © 2008 Florida Department of Education | FCAT Science Lessons Learned 61

FCAT08_LL_Sci_r9d1 5/6/08 4:39 PM Page 62
Reporting Cluster 2—Earth and Space Sciences
Grade 5
Reporting Cluster 2 Results for Grade 5
The Grade 5 results on Reporting Cluster 2 (Earth and Space Sciences) are displayed in the graph below.
Graph S-20Science Grade 5
Mean Percent Correct for Reporting Cluster 2
2003
2004100 2005
90 2006
80
70
60 53 54
5050 47
40
30
20
10
0
Grade 5
Mean P
erc
ent
Corr
ect
RESULTS BY CLUSTER Earth and Space SciencesLESSONS LEARNED Grade 5
Clus
ter 2
Note: Caution must be used in interpreting this graph because the changes in performance over time may be attributed to changes in item difficulty. See pages 18–20 for appropriate methods that the DOE suggests schools and districts use to analyze performance at the reporting-cluster level.
The following charts show the Reporting Cluster 2 (Earth and Space Sciences) strands, standards, and benchmarks for Grade 5. Observations, sample items, and implications for instruction follow each reporting cluster.
FCAT Science Lessons Learned | Copyright © 2008 Florida Department of Education 62
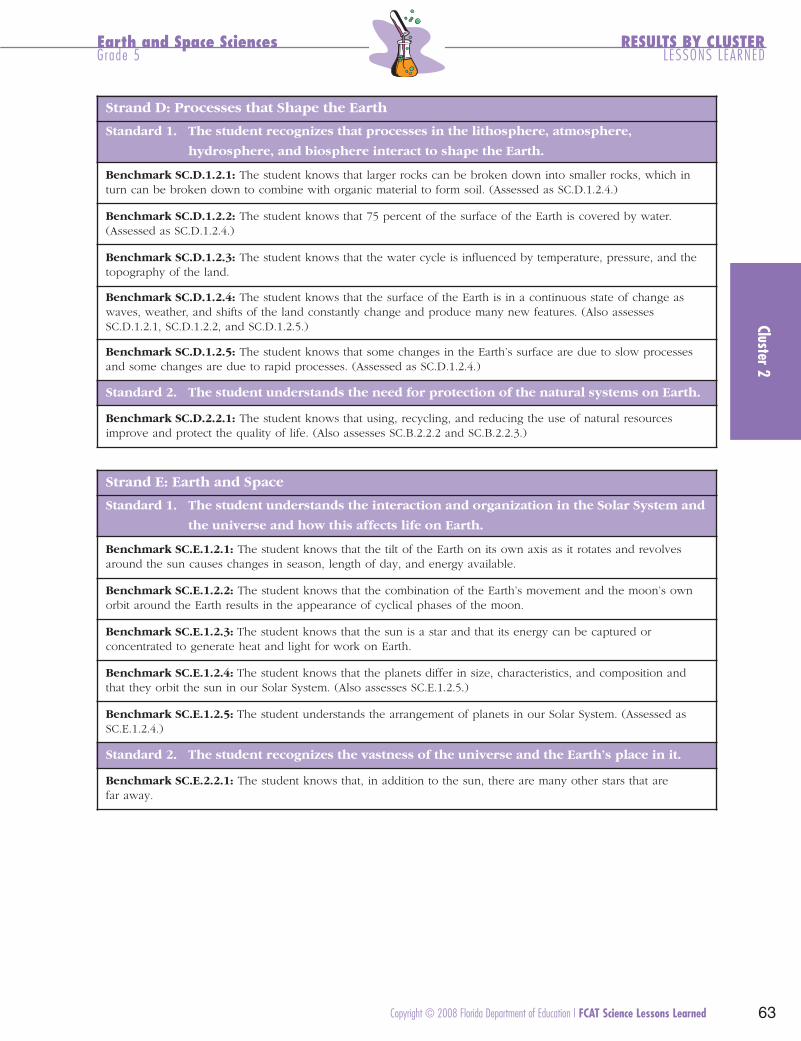
FCAT08_LL_Sci_r9d1 5/6/08 4:39 PM Page 63
Earth and Space Sciences RESULTS BY CLUSTER Grade 5 LESSONS LEARNED
Strand D: Processes that Shape the Earth
Standard 1. The student recognizes that processes in the lithosphere, atmosphere,
hydrosphere, and biosphere interact to shape the Earth.
Benchmark SC.D.1.2.1: The student knows that larger rocks can be broken down into smaller rocks, which in turn can be broken down to combine with organic material to form soil. (Assessed as SC.D.1.2.4.)
Benchmark SC.D.1.2.2: The student knows that 75 percent of the surface of the Earth is covered by water. (Assessed as SC.D.1.2.4.)
Benchmark SC.D.1.2.3: The student knows that the water cycle is influenced by temperature, pressure, and the topography of the land.
Benchmark SC.D.1.2.4: The student knows that the surface of the Earth is in a continuous state of change as waves, weather, and shifts of the land constantly change and produce many new features. (Also assesses SC.D.1.2.1, SC.D.1.2.2, and SC.D.1.2.5.)
Benchmark SC.D.1.2.5: The student knows that some changes in the Earth’s surface are due to slow processes and some changes are due to rapid processes. (Assessed as SC.D.1.2.4.)
Standard 2. The student understands the need for protection of the natural systems on Earth.
Benchmark SC.D.2.2.1: The student knows that using, recycling, and reducing the use of natural resources improve and protect the quality of life. (Also assesses SC.B.2.2.2 and SC.B.2.2.3.)
Strand E: Earth and Space
Standard 1. The student understands the interaction and organization in the Solar System and
the universe and how this affects life on Earth.
Benchmark SC.E.1.2.1: The student knows that the tilt of the Earth on its own axis as it rotates and revolves around the sun causes changes in season, length of day, and energy available.
Benchmark SC.E.1.2.2: The student knows that the combination of the Earth’s movement and the moon’s own orbit around the Earth results in the appearance of cyclical phases of the moon.
Benchmark SC.E.1.2.3: The student knows that the sun is a star and that its energy can be captured or concentrated to generate heat and light for work on Earth.
Benchmark SC.E.1.2.4: The student knows that the planets differ in size, characteristics, and composition and that they orbit the sun in our Solar System. (Also assesses SC.E.1.2.5.)
Benchmark SC.E.1.2.5: The student understands the arrangement of planets in our Solar System. (Assessed as SC.E.1.2.4.)
Standard 2. The student recognizes the vastness of the universe and the Earth’s place in it.
Benchmark SC.E.2.2.1: The student knows that, in addition to the sun, there are many other stars that are far away.
Cluster 2
Copyright © 2008 Florida Department of Education | FCAT Science Lessons Learned 63
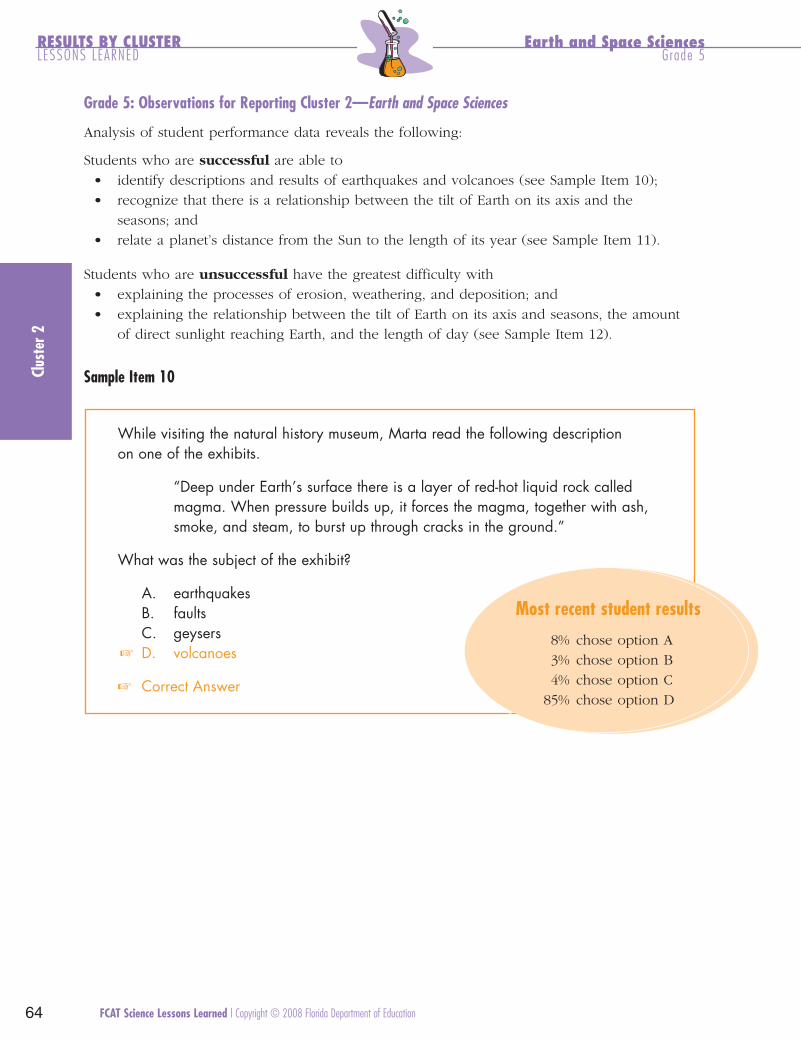
FCAT08_LL_Sci_r9d1 5/6/08 4:39 PM Page 64
Grade 5 Cluster 2 Item #1 05SCD124M5153
RESULTS BY CLUSTER Earth and Space SciencesLESSONS LEARNED Grade 5
Clus
ter 2
Grade 5: Observations for Reporting Cluster 2—Earth and Space Sciences
Analysis of student performance data reveals the following:
Students who are successful are able to • identify descriptions and results of earthquakes and volcanoes (see Sample Item 10); • recognize that there is a relationship between the tilt of Earth on its axis and the
seasons; and• relate a planet’s distance from the Sun to the length of its year (see Sample Item 11).
Students who are unsuccessful have the greatest difficulty with • explaining the processes of erosion, weathering, and deposition; and • explaining the relationship between the tilt of Earth on its axis and seasons, the amount
of direct sunlight reaching Earth, and the length of day (see Sample Item 12).
Sample Item 10
While visiting the natural history museum, Marta read the following description on one of the exhibits.
“Deep under Earth’s surface there is a layer of red-hot liquid rock called magma. When pressure builds up, it forces the magma, together with ash, smoke, and steam, to burst up through cracks in the ground.”
What was the subject of the exhibit?
A. earthquakes B. faults C. geysers
☞ D. volcanoes
☞ Correct Answer
Most recent student results
8% chose option A 3% chose option B 4% chose option C
85% chose option D
FCAT Science Lessons Learned | Copyright © 2008 Florida Department of Education 64
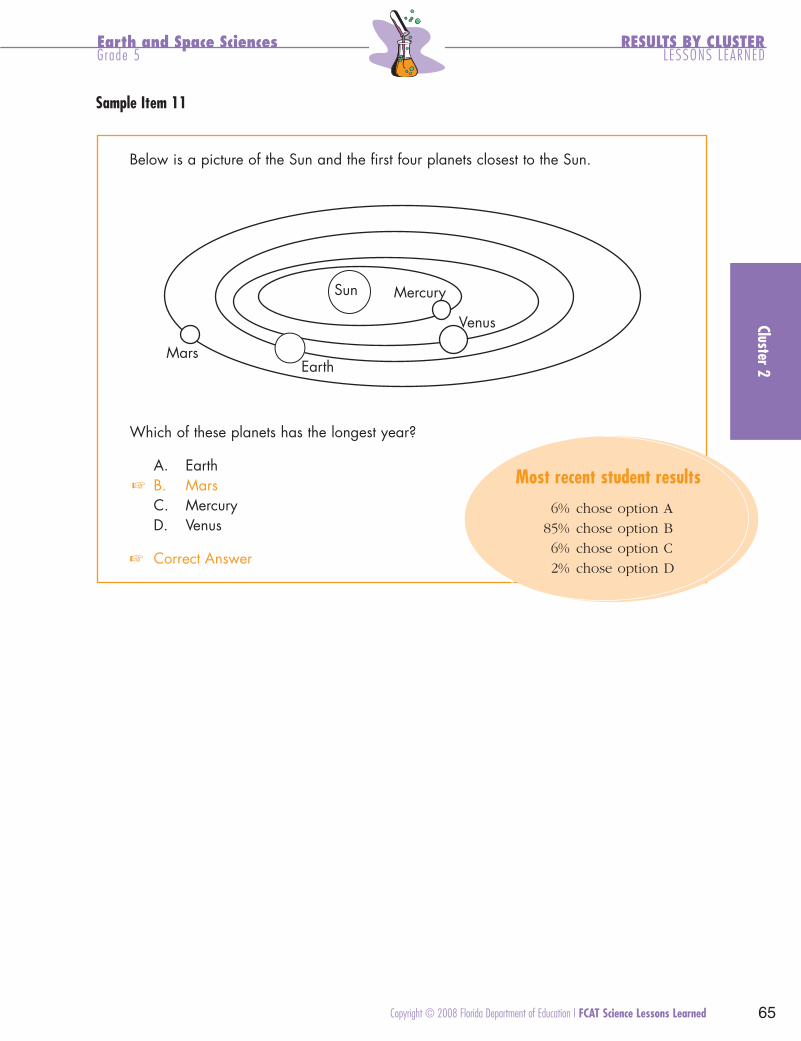
FCAT08_LL_Sci_r9d1 5/6/08 4:39 PM Page 65
Grade 5 Cluster 2 Item #2 05SCE124M6100
Earth and Space Sciences Grade 5
RESULTS BY CLUSTER LESSONS LEARNED
Sample Item 11
Below is a picture of the Sun and the first four planets closest to the Sun.
Sun Mercury
Earth Mars
Venus
Which of these planets has the longest year?
A. Earth ☞ B. Mars
C. Mercury D. Venus
☞ Correct Answer
Most recent student results
6% chose option A 85% chose option B 6% chose option C 2% chose option D
Cluster 2
Copyright © 2008 Florida Department of Education | FCAT Science Lessons Learned 65

FCAT08_LL_Sci_r9d1 5/6/08 4:39 PM Page 66
Grade 5 Cluster 2 Item #3 05SCE121S5215
RESULTS BY CLUSTER Earth and Space SciencesLESSONS LEARNED Grade 5
The following is a short-response task and an example of a top-score response.
Sample Item 12
READ INQUIRE EXPLAIN
Ashley’s science group is doing a report on the Sun’s energy and Earth. Ashley is asked to explain to the class why it is cold at the North and South Poles and hot at the equator.
FlashlightGlobe
Clus
ter 2
How could she explain this using a flashlight and a globe of Earth?
An explanation similar to the following received a score of 2 points:
She could explain by shining a flashlight at a globe near the Equator. The flashlight will be the Sun’s ray. Not much light will reach the poles so not much heat will reach the poles either. Therefore it is colder at the poles than at the Equator.
Most recent student results
4% earned 2 points 23% earned 1 point 69% earned 0 points
FCAT Science Lessons Learned | Copyright © 2008 Florida Department of Education 66

FCAT08_LL_Sci_r9d1 5/6/08 4:39 PM Page 67
Earth and Space Sciences RESULTS BY CLUSTER Grade 5 LESSONS LEARNED
Grade 5: Implications for Instruction for Reporting Cluster 2—Earth and Space Sciences
The task force recommends that instruction should integrate teaching energy benchmarks when teaching earth and space sciences, especially in connection with the role of the Sun. Students should be given the opportunity to model their understanding of the various relationships so that teachers can identify misconceptions and modify instruction accordingly. For example, students should be encouraged to explain, using words and labeled diagrams, the relationships between the tilt of Earth’s axis, the amount of direct sunlight, and the seasons. More emphasis should be provided to distinguish between the effects of rotation and revolution.
Instruction should also address cause-and-effect relationships and emphasize that processes occur over time (e.g., moon phases, seasons, erosion, weathering, water cycle). For example, instruction on the water cycle should emphasize its effect at different times of day, temperatures, climates, pressures, and topographies. Activities focusing on processes may include, but are not limited to, daily observations of shadows and sun angles, keeping a calendar of moon phases, observing weathering on school grounds, and using stream tables.
Cluster 2
Copyright © 2008 Florida Department of Education | FCAT Science Lessons Learned 67

FCAT08_LL_Sci_r9d1 5/6/08 4:39 PM Page 68
Grade 8
Reporting Cluster 2 Results for Grade 8
The Grade 8 results on Reporting Cluster 2 (Earth and Space Sciences) are displayed in the graph below.
Graph S-21 Science Grade 8
Mean Percent Correct for Reporting Cluster 2
2003
100 2004
200590 2006
80
7064
60 56 53
50
40
30
20
10
0
46
Grade 8
Mean P
erc
ent
Corr
ect
RESULTS BY CLUSTER Earth and Space SciencesLESSONS LEARNED Grade 8
Clus
ter 2
Note: Caution must be used in interpreting this graph because the changes in performance over time may be attributed to changes in item difficulty. See pages 18–20 for appropriate methods that the DOE suggests schools and districts use to analyze performance at the reporting-cluster level.
The following charts show the Reporting Cluster 2 (Earth and Space Sciences) strands, standards, and benchmarks for Grade 8. Observations, sample items, and implications for instruction follow each reporting cluster.
FCAT Science Lessons Learned | Copyright © 2008 Florida Department of Education 68

FCAT08_LL_Sci_r9d1 5/6/08 4:39 PM Page 69
Strand D: Processes that Shape the Earth
Earth and Space Sciences RESULTS BY CLUSTER Grade 8 LESSONS LEARNED
Strand D: Processes that Shape the Earth
Standard 1. The student recognizes that processes in the lithosphere, atmosphere,
hydrosphere, and biosphere interact to shape the Earth.
Benchmark SC.D.1.3.1: The student knows that mechanical and chemical activities shape and reshape the Earth’s land surface by eroding rock and soil in some areas and depositing them in other areas, sometimes in seasonal layers.
Benchmark SC.D.1.3.2: The student knows that over the whole Earth, organisms are growing, dying, and decaying as new organisms are produced by the old ones. (Assessed as SC.D.1.3.4.)
Benchmark SC.D.1.3.3: The student knows how conditions that exist in one system influence the conditions that exist in other systems.
Benchmark SC.D.1.3.4: The student knows the ways in which plants and animals reshape the landscape (e.g., bacteria, fungi, worms, rodents, and other organisms add organic matter to the soil, increasing soil fertility, encouraging plant growth, and strengthening resistance to erosion). (Also assesses SC.D.1.3.2.)
Benchmark SC.D.1.3.5: The student understands concepts of time and size relating to the interaction of Earth’s processes (e.g., lightning striking in a split second as opposed to the shifting of the Earth’s plates altering the landscape, distance between atoms measured in Angstrom units as opposed to distance between stars measured in light-years).
Standard 2. The student understands the need for protection of the natural systems on Earth.
Benchmark SC.D.2.3.1: The student understands that quality of life is relevant to personal experience. (Not assessed.)
Benchmark SC.D.2.3.2: The student knows the positive and negative consequences of human action on the Earth’s systems. (Assessed as SC.G.2.3.2.)
Strand E: Earth and Space
Standard 1. The student understands the interaction and organization in the Solar System and
the universe and how this affects life on Earth.
Benchmark SC.E.1.3.1: The student understands the vast size of our Solar System and the relationship of the planets and their satellites. (Also assesses SC.E.1.3.2.)
Benchmark SC.E.1.3.2: The student knows that available data from various satellite probes show the similarities and differences among planets and their moons in the Solar System. (Assessed as SC.E.1.3.1.)
Benchmark SC.E.1.3.3: The student understands that our sun is one of many stars in our galaxy. (Assessed as SC.E.2.3.1.)
Benchmark SC.E.1.3.4: The student knows that stars appear to be made of similar chemical elements, although they differ in age, size, temperature, and distance.
Standard 2. The student recognizes the vastness of the universe and the Earth’s place in it.
Benchmark SC.E.2.3.1: The student knows that thousands of other galaxies appear to have the same elements, forces, and forms of energy found in our Solar System. (Also assesses SC.E.1.3.3.)
Cluster 2
Copyright © 2008 Florida Department of Education | FCAT Science Lessons Learned 69
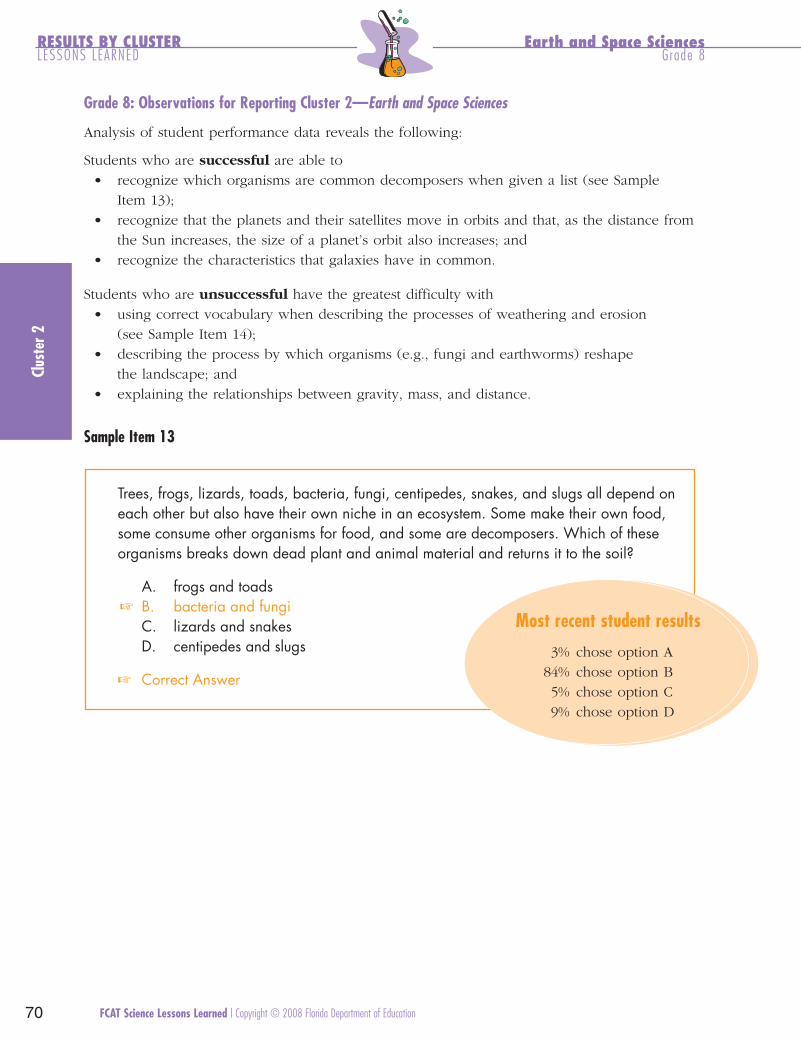
FCAT08_LL_Sci_r9d1 5/6/08 4:39 PM Page 70
Grade 8 Cluster 2 Item #1 08SCD134M8043
RESULTS BY CLUSTER Earth and Space SciencesLESSONS LEARNED Grade 8
Clus
ter 2
Grade 8: Observations for Reporting Cluster 2—Earth and Space Sciences
Analysis of student performance data reveals the following:
Students who are successful are able to • recognize which organisms are common decomposers when given a list (see Sample
Item 13);• recognize that the planets and their satellites move in orbits and that, as the distance from
the Sun increases, the size of a planet’s orbit also increases; and • recognize the characteristics that galaxies have in common.
Students who are unsuccessful have the greatest difficulty with • using correct vocabulary when describing the processes of weathering and erosion
(see Sample Item 14);• describing the process by which organisms (e.g., fungi and earthworms) reshape
the landscape; and• explaining the relationships between gravity, mass, and distance.
Sample Item 13
Trees, frogs, lizards, toads, bacteria, fungi, centipedes, snakes, and slugs all depend on each other but also have their own niche in an ecosystem. Some make their own food, some consume other organisms for food, and some are decomposers. Which of these organisms breaks down dead plant and animal material and returns it to the soil?
A. frogs and toads ☞ B. bacteria and fungi
C. lizards and snakes D. centipedes and slugs
☞ Correct Answer
Most recent student results
3% chose option A 84% chose option B 5% chose option C 9% chose option D
FCAT Science Lessons Learned | Copyright © 2008 Florida Department of Education 70

FCAT08_LL_Sci_r9d1 5/6/08 4:39 PM Page 71
Grade 8 Cluster 2 Item #2 08SCD131M7168
Earth and Space Sciences RESULTS BY CLUSTER LESSONS LEARNED Grade 8
Sample Item 14
When Juan walks on the rocks to cross a nearby flowing stream, he notices the rocks are all rounded off smoothly. What caused the rounding off of these rocks?
A. acid rain B. soil erosion C. chemical weathering
☞ D. mechanical weathering
☞ Correct Answer
Most recent student results
10% chose option A 27% chose option B 40% chose option C 23% chose option D
Grade 8: Implications for Instruction for Reporting Cluster 2–Earth and Space Sciences
The task force recommends that students have the opportunity to write to explain about the cause-and-effect relationships that exist in earth and space science. Student should conduct laboratory activities that focus on the processes that shape the Earth (e.g., experiments with soil that demonstrate weathering and erosion). Instruction should include students exploring, modeling, and using words or labeled diagrams to demonstrate knowledge of the scientific concepts such as planetary motion, the rock cycle, and the water cycle.
Instruction should include comparing and contrasting the processes that result in different land formations in various regions (e.g., the Grand Canyon, the Everglades, deserts, tundras). Illustrations of decomposition taking place, demonstrations of the causes and effects of decomposition, and explanations of how matter cycles through the environment should be included as instructional examples and discussion points. Students should develop an understanding of time as it relates to geologic processes (e.g., mountain formation) and distances in space (e.g., light years, astronomical units).
Cluster 2
Copyright © 2008 Florida Department of Education | FCAT Science Lessons Learned 71

FCAT08_LL_Sci_r9d1 5/6/08 4:39 PM Page 72
Grade 11
Reporting Cluster 2 Results for Grade 11
The Grade 11 results on Reporting Cluster 2 (Earth and Space Sciences) are displayed in the graph below. It should be noted that 2003 and 2004 represent the performance of Grade 10 students, while 2005 and 2006 represent the performance of Grade 11 students.
Graph S-22Science Grade 11
Mean Percent Correct for Reporting Cluster 2
2003
100 2004
200590 2006
80
70
6053
50 51 50
40
30
20
10
0
45
Grade 11
Mean P
erc
ent
Corr
ect
RESULTS BY CLUSTER Earth and Space SciencesLESSONS LEARNED Grade 11
Clus
ter 2
Note: Caution must be used in interpreting this graph because the changes in performance over time may be attributed to changes in item difficulty. See pages 18–20 for appropriate methods that the DOE suggests schools and districts use to analyze performance at the reporting-cluster level.
The following charts show the Reporting Cluster 2 (Earth and Space Sciences) strands, standards, and benchmarks for Grade 11. Observations, sample items, and implications for instruction follow each reporting cluster.
FCAT Science Lessons Learned | Copyright © 2008 Florida Department of Education 72

FCAT08_LL_Sci_r9d1 5/6/08 4:39 PM Page 73
Earth and Space Sciences RESULTS BY CLUSTER Grade 11 LESSONS LEARNED
Strand D: Processes that Shape the Earth
Standard 1. The student recognizes that processes in the lithosphere, atmosphere,
hydrosphere, and biosphere interact to shape the Earth.
Benchmark SC.D.1.4.1: The student knows how climatic patterns on Earth result from an interplay of many factors (Earth’s topography, its rotation on its axis, solar radiation, the transfer of heat energy where the atmosphere interfaces with lands and oceans, and wind and ocean currents).
Benchmark SC.D.1.4.2: The student knows that the solid crust of Earth consists of slow-moving, separate plates that float on a denser, molten layer of Earth and that these plates interact with each other, changing the Earth’s surface in many ways (e.g., forming mountain ranges and rift valleys, causing earthquake and volcanic activity, and forming undersea mountains that can become ocean islands).
Benchmark SC.D.1.4.3: The student knows that changes in Earth’s climate, geological activity, and life forms may be traced and compared.
Benchmark SC.D.1.4.4: The student knows that Earth’s systems and organisms are the result of a long, continuous change over time. (Assessed as SC.F.2.4.3.)
Standard 2. The student understands the need for protection of the natural systems on Earth.
Benchmark SC.D.2.4.1: The student understands the interconnectedness of the systems on Earth and the quality of life. (Also assesses SC.G.2.4.4.)
Strand E: Earth and Space
Standard 1. The student understands the interaction and organization in the Solar System and
the universe and how this affects life on Earth.
Benchmark SC.E.1.4.1: The student understands the relationships between events on Earth and the movements of the Earth, its moon, the other planets, and the sun. (Also assesses SC.E.1.4.2 and SC.E.1.4.3.)
Benchmark SC.E.1.4.2: The student knows how the characteristics of other planets and satellites are similar to and different from those of the Earth. (Assessed as SC.E.1.4.1.)
Benchmark SC.E.1.4.3: The student knows the various reasons that Earth is the only planet in our Solar System that appears to be capable of supporting life as we know it. (Assessed as SC.E.1.4.1.)
Standard 2. The student recognizes the vastness of the universe and the Earth’s place in it.
Benchmark SC.E.2.4.1: The student knows that the stages in the development of three categories of stars are based on mass: stars that have the approximate mass of our sun, stars that are two-to-three-stellar masses and develop into neutron stars, and stars that are five-to-six-stellar masses and develop into black holes.
Benchmark SC.E.2.4.2: The student identifies the arrangement of bodies found within and outside our galaxy.
Benchmark SC.E.2.4.3: The student knows astronomical distance and time.
Benchmark SC.E.2.4.4: The student understands stellar equilibrium. (Not assessed.)
Benchmark SC.E.2.4.5: The student knows various scientific theories on how the universe was formed. (Not assessed.)
Benchmark SC.E.2.4.6: The student knows the various ways in which scientists collect and generate data about our universe (e.g., X-ray telescopes, computer simulations of gravitational systems, nuclear reactions, space probes, and supercollider simulations). (Assessed as SC.H.1.4.1.)
Benchmark SC.E.2.4.7: The student knows that mathematical models and computer simulations are used in studying evidence from many sources to form a scientific account of the universe. (Also assesses SC.H.1.4.1.)
Cluster 2
Copyright © 2008 Florida Department of Education | FCAT Science Lessons Learned 73
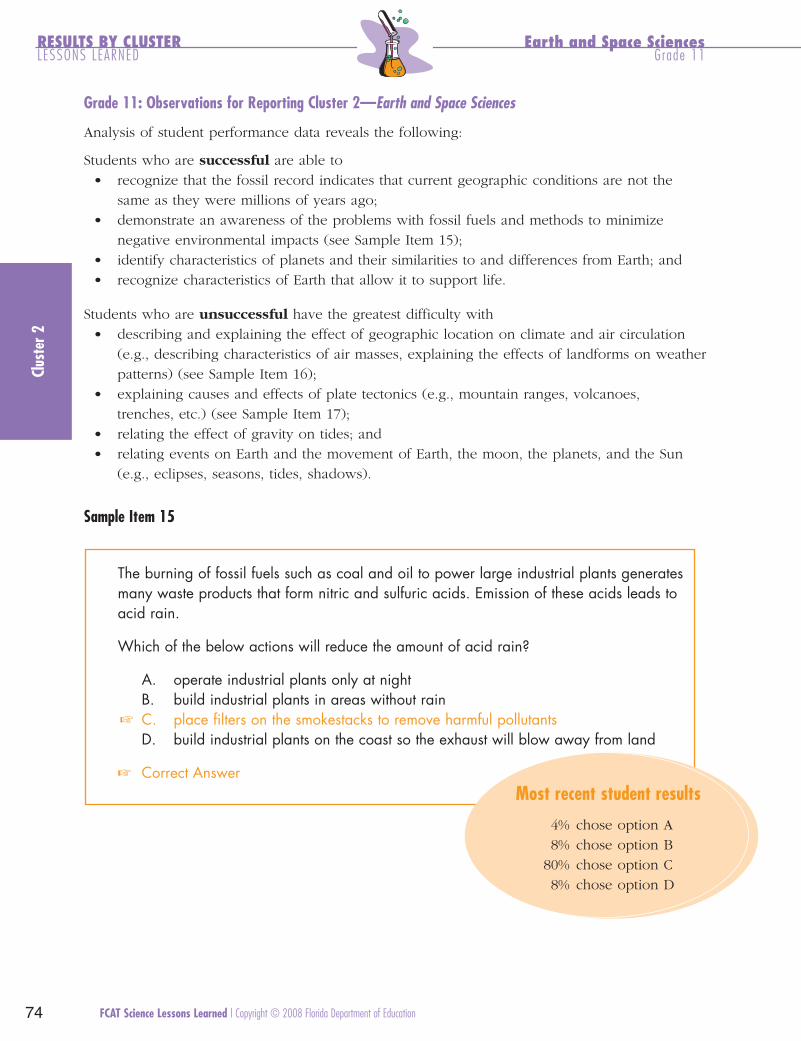
FCAT08_LL_Sci_r9d1 5/6/08 4:39 PM Page 74
Grade 11 Cluster 2 Item #1 10SCD241M0648
RESULTS BY CLUSTER Earth and Space SciencesLESSONS LEARNED Grade 11
Clus
ter 2
Grade 11: Observations for Reporting Cluster 2—Earth and Space Sciences
Analysis of student performance data reveals the following:
Students who are successful are able to • recognize that the fossil record indicates that current geographic conditions are not the
same as they were millions of years ago;• demonstrate an awareness of the problems with fossil fuels and methods to minimize
negative environmental impacts (see Sample Item 15);• identify characteristics of planets and their similarities to and differences from Earth; and • recognize characteristics of Earth that allow it to support life.
Students who are unsuccessful have the greatest difficulty with • describing and explaining the effect of geographic location on climate and air circulation
(e.g., describing characteristics of air masses, explaining the effects of landforms on weather patterns) (see Sample Item 16);
• explaining causes and effects of plate tectonics (e.g., mountain ranges, volcanoes,trenches, etc.) (see Sample Item 17);
• relating the effect of gravity on tides; and • relating events on Earth and the movement of Earth, the moon, the planets, and the Sun
(e.g., eclipses, seasons, tides, shadows).
Sample Item 15
The burning of fossil fuels such as coal and oil to power large industrial plants generates many waste products that form nitric and sulfuric acids. Emission of these acids leads to acid rain.
Which of the below actions will reduce the amount of acid rain?
A. operate industrial plants only at night B. build industrial plants in areas without rain
☞ C. place filters on the smokestacks to remove harmful pollutants D. build industrial plants on the coast so the exhaust will blow away from land
☞ Correct Answer Most recent student results
4% chose option A 8% chose option B
80% chose option C 8% chose option D
FCAT Science Lessons Learned | Copyright © 2008 Florida Department of Education 74

FCAT08_LL_Sci_r9d1 5/6/08 4:39 PM Page 75
Grade 11 Cluster 2 Item#2 10SCD141M1102
Earth and Space Sciences RESULTS BY CLUSTER Grade 11 LESSONS LEARNED
Sample Item 16
The Sierra Nevada mountain range, located in California and parts of Nevada, contains one of the tallest peaks in the continental United States. Moist air from the Pacific Ocean travels inland to this area.
Moist Air
Pacific Ocean
Sierra Nevada Mountains
Owen s Valley'
Owen’s Valley is situated just east of the Sierra Nevada mountain range. What is the most likely climate of Owen’s Valley?
☞ A. hot and dry B. cool and wet C. hot and humid D. cool and humid
☞ Correct Answer
Most recent student results
36% chose option A 16% chose option B 24% chose option C 24% chose option D
Cluster 2
Copyright © 2008 Florida Department of Education | FCAT Science Lessons Learned 75
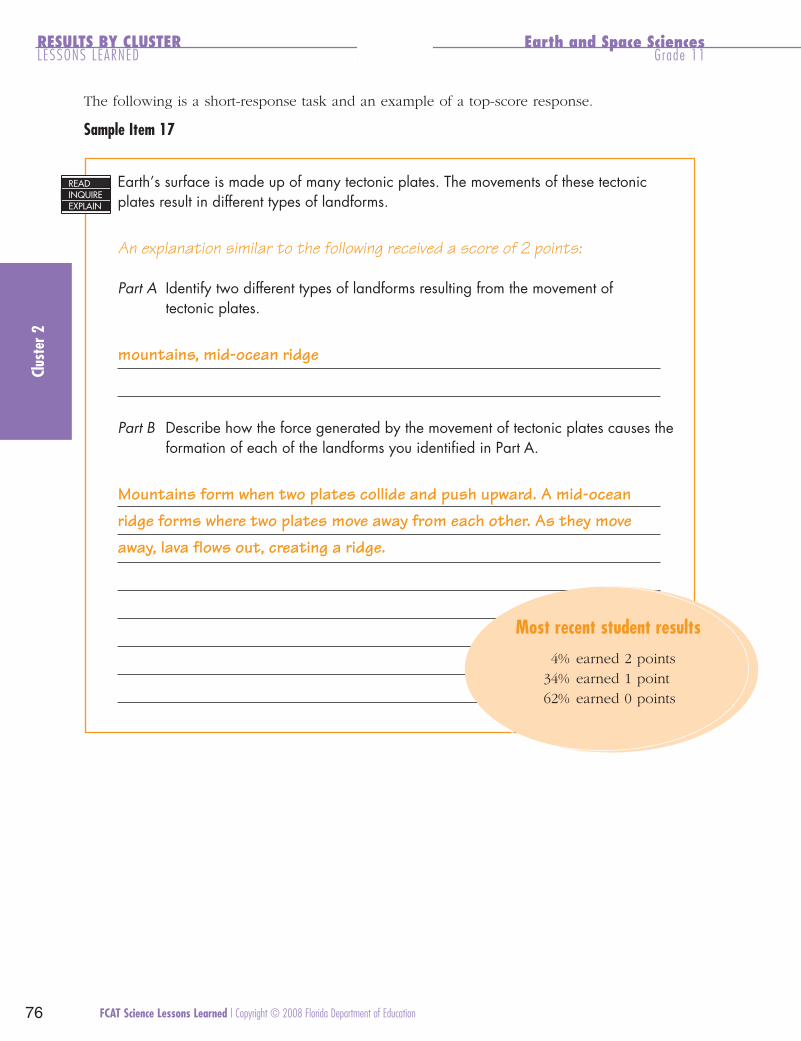
FCAT08_LL_Sci_r9d1 5/6/08 4:39 PM Page 76
Grade 11 Cluster 2 Item #3 10SCD142S0294
RESULTS BY CLUSTER Earth and Space SciencesLESSONS LEARNED Grade 11
The following is a short-response task and an example of a top-score response.
Sample Item 17
Clus
ter 2
READ INQUIRE EXPLAIN
Earth’s surface is made up of many tectonic plates. The movements of these tectonic plates result in different types of landforms.
An explanation similar to the following received a score of 2 points:
Part A Identify two different types of landforms resulting from the movement of tectonic plates.
mountains, mid-ocean ridge
Part B Describe how the force generated by the movement of tectonic plates causes the formation of each of the landforms you identified in Part A.
Mountains form when two plates collide and push upward. A mid-ocean ridge forms where two plates move away from each other. As they move away, lava flows out, creating a ridge.
Most recent student results
4% earned 2 points 34% earned 1 point 62% earned 0 points
FCAT Science Lessons Learned | Copyright © 2008 Florida Department of Education 76
FCAT08_LL_Sci_r9d1 5/6/08 4:39 PM Page 77
Earth and Space Sciences RESULTS BY CLUSTER Grade 11 LESSONS LEARNED
Grade 11: Implications for Instruction for Reporting Cluster 2—Earth and Space Sciences
The task force recommends that students should have practice explaining earth and space concepts using words and labeled diagrams. Laboratory activities can be used to model and demonstrate relationships such as plate interactions, gravity and tides, planetary motion, and climate and weather patterns. By allowing students to use models, perform inquiry-based labs, and write explanations, teachers can identify common misconceptions and adjust instruction as needed.
Instruction should also provide students with opportunities to compare and contrast local (Florida) weather patterns to those of other regions. During instruction, students should be given the opportunity to use models to represent the positions of Earth, the Moon, the Sun, and other planets to describe their effect on Earth events, such as eclipses and seasons. In space science, students should have more opportunities to practice calculations involving astronomical units.
Cluster 2
Copyright © 2008 Florida Department of Education | FCAT Science Lessons Learned 77
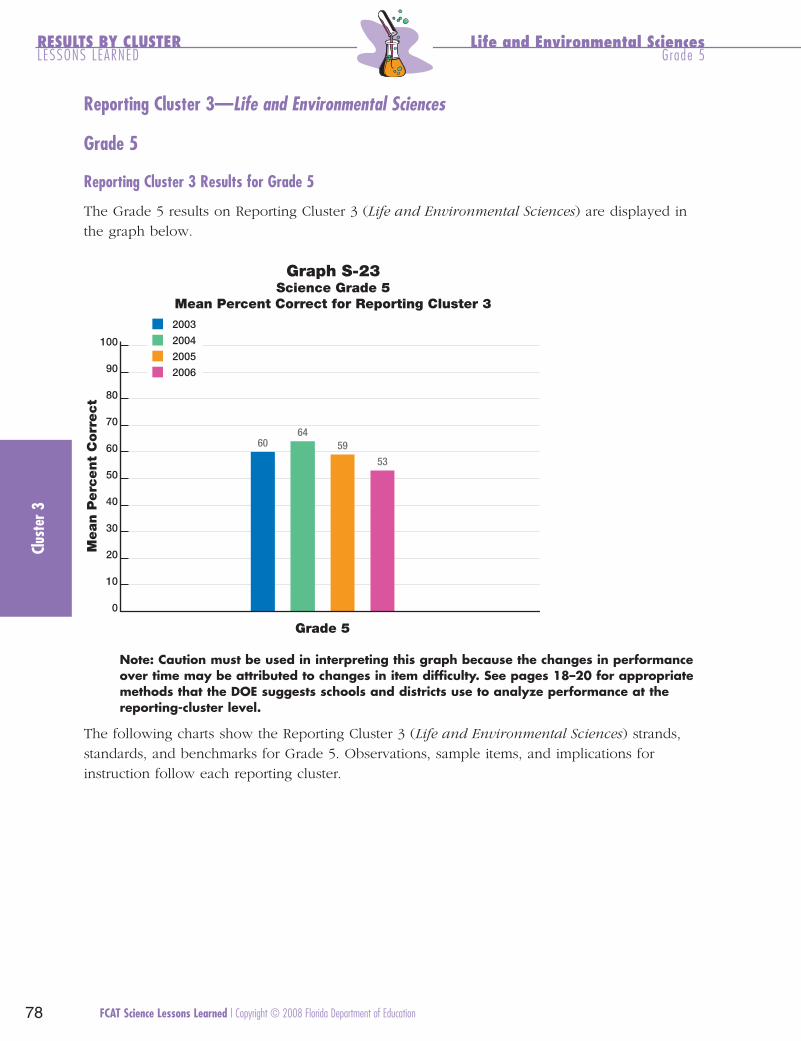
FCAT08_LL_Sci_r9d1 5/6/08 4:39 PM Page 78
RESULTS BY CLUSTER Life and Environmental Sciences LESSONS LEARNED Grade 5
Clus
ter 3
Reporting Cluster 3—Life and Environmental Sciences
Grade 5
Reporting Cluster 3 Results for Grade 5
The Grade 5 results on Reporting Cluster 3 (Life and Environmental Sciences) are displayed in the graph below.
Graph S-23Science Grade 5
Mean Percent Correct for Reporting Cluster 3
2003
100 2004
200590 2006
80
7064
60 59
53 60
50
40
30
20
10
0
Grade 5
Mean P
erc
ent
Corr
ect
Note: Caution must be used in interpreting this graph because the changes in performance over time may be attributed to changes in item difficulty. See pages 18–20 for appropriate methods that the DOE suggests schools and districts use to analyze performance at the reporting-cluster level.
The following charts show the Reporting Cluster 3 (Life and Environmental Sciences) strands, standards, and benchmarks for Grade 5. Observations, sample items, and implications for instruction follow each reporting cluster.
FCAT Science Lessons Learned | Copyright © 2008 Florida Department of Education 78

FCAT08_LL_Sci_r9d1 5/6/08 4:39 PM Page 79
Life and Environmental Sciences RESULTS BY CLUSTER Grade 5 LESSONS LEARNED
Strand F: Processes of Life
Standard 1. The student describes patterns of structure and function in living things.
Benchmark SC.F.1.2.1: The student knows that the human body is made of systems with structures and functions that are related.
Benchmark SC.F.1.2.2: The student knows how all animals depend on plants.
Benchmark SC.F.1.2.3: The student knows that living things are different but share similar structures.
Benchmark SC.F.1.2.4: The student knows that similar cells form different kinds of structures.
Standard 2. The student understands the process and importance of genetic diversity.
Benchmark SC.F.2.2.1: The student knows that many characteristics of an organism are inherited from the parents of the organism, but that other characteristics are learned from an individual’s interactions with the environment.
Cluster 3
Copyright © 2008 Florida Department of Education | FCAT Science Lessons Learned
Strand G: How Living Things Interact with Their Environment
Standard 1. The student understands the competitive, interdependent, cyclic nature of living
things in the environment.
Benchmark SC.G.1.2.1: The student knows ways that plants, animals, and protists interact.
Benchmark SC.G.1.2.2: The student knows that living things compete in a climatic region with other living things and that structural adaptations make them fit for an environment.
Benchmark SC.G.1.2.3: The student knows that green plants use carbon dioxide, water, and sunlight energy to turn minerals and nutrients into food for growth, maintenance, and reproduction.
Benchmark SC.G.1.2.4: The student knows that some organisms decompose dead plants and animals into simple minerals and nutrients for use by living things and thereby recycle matter. (Assessed as SC.G.1.2.6.)
Benchmark SC.G.1.2.5: The student knows that animals eat plants or other animals to acquire the energy they need for survival.
Benchmark SC.G.1.2.6: The student knows that organisms are growing, dying, and decaying and that new organisms are being produced from the materials of dead organisms. (Also assesses SC.G.1.2.4.)
Benchmark SC.G.1.2.7: The student knows that variations in light, water, temperature, and soil content are largely responsible for the existence of different kinds of organisms and population densities in an ecosystem.
Standard 2. The student understands the consequences of using limited natural resources.
Benchmark SC.G.2.2.1: The student knows that all living things must compete for Earth’s limited resources; organisms best adapted to compete for the available resources will be successful and pass their adaptations (traits) to their offspring.
Benchmark SC.G.2.2.2: The student knows that the size of a population is dependent upon the available resources within its community.
Benchmark SC.G.2.2.3: The student understands that changes in the habitat of an organism may be beneficial or harmful.
79

FCAT08_LL_Sci_r9d1 5/6/08 4:39 PM Page 80
Grade 5 Cluster 3 Item#1 05SCG122M5053
RESULTS BY CLUSTER Life and Environmental Sciences LESSONS LEARNED Grade 5
Clus
ter 3
Grade 5: Observations for Reporting Cluster 3—Life and Environmental Sciences
Analysis of student performance data reveals the following:
Students who are successful are able to • identify structures of familiar organisms; • identify structural adaptations in various organisms (see Sample Item 18); and • recognize that animals eat in order to obtain energy for survival.
Students who are unsuccessful have the greatest difficulty with • comparing and/or contrasting the structures in different organisms (see Sample Item 19); • identifying and describing the function of specific structures; and • explaining how adaptations can help animals survive in their environments (see Sample
Item 20).
Sample Item 18
Many animals such as walruses, sea lions, polar bears, and penguins live in polar regions.
Walrus Sea Lion Polar Bear Penguin
What characteristic do these animals in the polar regions share that shows how they have adapted to the cold weather?
A. thick fur B. webbed feet C. strong back claws
☞ D. thick body covering
☞ Correct Answer
Most recent student results
11% chose option A 4% chose option B 1% chose option C
84% chose option D
FCAT Science Lessons Learned | Copyright © 2008 Florida Department of Education 80

FCAT08_LL_Sci_r9d1 5/6/08 4:39 PM Page 81
Grade 5 Cluster 3 Item #2 05SCF123M0883
Life and Environmental Sciences RESULTS BY CLUSTER Grade 5 LESSONS LEARNED
Sample Item 19
The short-beaked echidna is a mammal found in Australia. These animals lay eggs, develop fur coats, have milk-producing glands, and regulate their own body temperature. A short-beaked echidna is shown below.
Which of the following characteristics of the echidna is rare among mammals?
☞ A. laying eggs B. developing a fur coat C. having milk-producing glands D. regulating its own body temperature
☞ Correct Answer
Most recent student results
42% chose option A 8% chose option B
13% chose option C 37% chose option D
Cluster 3
Copyright © 2008 Florida Department of Education | FCAT Science Lessons Learned 81

FCAT08_LL_Sci_r9d1 5/6/08 4:39 PM Page 82
Grade 5 Cluster 3 Item#3 05SCG122S5065
RESULTS BY CLUSTER Life and Environmental Sciences LESSONS LEARNED Grade 5
The following is a short-response task and an example of a top-score response.
Sample Item 20
Clus
ter 3
READ INQUIRE EXPLAIN
Many animals live on the African plain and compete for the limited food supply. Each type of animal, including the lion, the zebra, the antelope, and the giraffe, has become adapted to a different niche within this environment. Select one of these animals and describe a specialized trait. Explain how this trait helps it to survive.
An explanation similar to the following received a score of 2 points:
The zebra’s stripes are a trait that helps it to survive. Its stripes help the zebra blend in with other zebras in the herd, making it confusing for predators to pick one zebra to attack.
Most recent student results
21% earned 2 points 22% earned 1 point 53% earned 0 points
Grade 5: Implications for Instruction for Reporting Cluster 3—Life and Environmental Sciences
The task force recommends that energy (Strand B) be connected to processes of life (Strand F) and how living things interact with their environment (Strand G), thereby integrating the teaching of these strands in a manner that relates structure and function to adaptation. Teachers should provide students the opportunity to discuss and explain (using words or labeled diagrams) cause-and-effect relationships of changes in populations in food webs and food chains in different ecosystems (e.g., if one population decreases, what happens to the others), in connection to survival. Students should also have the opportunity to discuss and label diagrams about plants in order for teachers to identify common misconceptions about photosynthesis, the source of energy for plants, and plant structures and their functions (e.g., a common misconception is that plants get their energy by “eating plant food”).
During instruction, emphasis should be placed on identifying relationships between structures and identifying each structure’s functions within an organism, and comparing organisms. Students should be taught various biomes, in addition to those in Florida, and the structural adaptations needed for plants and animals to survive in each biome.
FCAT Science Lessons Learned | Copyright © 2008 Florida Department of Education 82

FCAT08_LL_Sci_r9d1 5/6/08 4:39 PM Page 83
Life and Environmental Sciences RESULTS BY CLUSTER Grade 8 LESSONS LEARNED
Grade 8
Reporting Cluster 3 Results for Grade 8
The Grade 8 results on Reporting Cluster 3 (Life and Environmental Sciences) are displayed in the graph below.
Graph S-24Science Grade 8
Mean Percent Correct for Reporting Cluster 3
2003
100 2004
200590 2006
80
70
6060 55 55
5050
40
30
20
10
0
Grade 8
Mean P
erc
ent
Corr
ect
Note: Caution must be used in interpreting this graph because the changes in performance over time may be attributed to changes in item difficulty. See pages 18–20 for appropriate methods that the DOE suggests schools and districts use to analyze performance at the reporting-cluster level.
The following charts show the Reporting Cluster 3 (Life and Environmental Sciences) strands, standards, and benchmarks for Grade 8. Observations, sample items, and implications for instruction follow each reporting cluster.
Cluster 3
Copyright © 2008 Florida Department of Education | FCAT Science Lessons Learned 83

FCAT08_LL_Sci_r9d1 5/6/08 4:39 PM Page 84
Strand F: Processes of Life
Benchmark SC.F.1.3.1: The student understands that living things are composed of major systems that function inreproduction, growth, maintenance, and regulation.
Benchmark SC.F.1.3.2: The student knows that the structural basis of most organisms is the cell and most organisms are single cells, while some, including humans, are multicellular.
Benchmark SC.F.1.3.3: The student knows that in multicellular organisms cells grow and divide to make more cells in order to form and repair various organs and tissues.
Benchmark SC.F.1.3.4: The student knows that the levels of structural organization for function in living things include cells, tissues, organs, systems, and organisms.
Benchmark SC.F.1.3.5: The student explains how the life functions of organisms are related to what occurs within the cell.
Benchmark SC.F.1.3.6: The student knows that the cells with similar functions have similar structures, whereas those with different structures have different functions.
Benchmark SC.F.1.3.7: The student knows that behavior is a response to the environment and influences growth, development, maintenance, and reproduction.
Standard 2. The student understands the process and importance of genetic diversity.
Benchmark SC.F.2.3.1: The student knows the patterns and advantages of sexual and asexual reproduction in plants and animals.
Benchmark SC.F.2.3.2: The student knows that the variation in each species is due to the exchange and interaction of genetic information as it is passed from parent to offspring.
Benchmark SC.F.2.3.3: The student knows that generally organisms in a population live long enough to reproduce because they have survival characteristics. (Also assesses SC.F.2.3.4 and SC.G.1.3.2.)
Benchmark SC.F.2.3.4: The student knows that the fossil record provides evidence that changes in the kinds of plants and animals in the environment have been occurring over time. (Assessed as SC.F.2.3.3.)
Standard 1. The student describes patterns of structure and function in living things.
RESULTS BY CLUSTER Life and Environmental Sciences LESSONS LEARNED Grade 8
Clus
ter 3
FCAT Science Lessons Learned | Copyright © 2008 Florida Department of Education 84
FCAT08_LL_Sci_r9d1 5/6/08 4:39 PM Page 85
Life and Environmental Sciences RESULTS BY CLUSTER Grade 8 LESSONS LEARNED
Strand G: How Living Things Interact with Their Environment
Standard 1. The student understands the competitive, interdependent, cyclic nature of living
things in the environment.
Benchmark SC.G.1.3.1: The student knows that viruses depend on other living things. (Assessed as SC.G.1.3.4.)
Benchmark SC.G.1.3.2: The student knows that biological adaptations include changes in structures, behaviors, or physiology that enhance reproductive success in a particular environment. (Assessed as SC.F.2.3.3.)
Benchmark SC.G.1.3.3: The student understands that the classification of living things is based on a given set of criteria and is a tool for understanding biodiversity and interrelationships.
Benchmark SC.G.1.3.4: The student knows that the interactions of organisms with each other and with the nonliving parts of their environments result in the flow of energy and the cycling of matter throughout the system. (Also assesses SC.G.1.3.1 and SC.G.1.3.5.)
Benchmark SC.G.1.3.5: The student knows that life is maintained by a continuous input of energy from the sun and by the recycling of the atoms that make up the molecules of living organisms. (Assessed as SC.G.1.3.4.)
Standard 2. The student understands the consequences of using limited natural resources.
Benchmark SC.G.2.3.1: The student knows that some resources are renewable and others are nonrenewable. (Also assesses SC.B.2.3.2.)
Benchmark SC.G.2.3.2: The student knows that all biotic and abiotic factors are interrelated and that if one factor is changed or removed, it impacts the availability of other resources within the system. (Also assesses SC.D.2.3.2, SC.G.2.3.3, and SC.G.2.3.4.)
Benchmark SC.G.2.3.3: The student knows that a brief change in the limited resources of an ecosystem may alter the size of a population or the average size of individual organisms and that long-term change may result in the elimination of animal and plant populations inhabiting the Earth. (Assessed as SC.G.2.3.2.)
Benchmark SC.G.2.3.4: The student understands that humans are a part of an ecosystem and their activities may deliberately or inadvertently alter the equilibrium in ecosystems. (Assessed as SC.G.2.3.2.)
Grade 8: Observations for Reporting Cluster 3—Life and Environmental Sciences
Analysis of student performance data reveals the following:
Students who are successful are able to • recognize that the exchange and combination of genetic information results in variations
within a species; • identify factors that influence an organism’s ability to survive (e.g., ability to camouflage,
lack of competition); and • recognize that matter is broken down into nutrients and that decomposition results in the
cycling of matter (see Sample Item 21).
Students who are unsuccessful have the greatest difficulty with • explaining the processes that occur within body systems and the interactions of body
systems that perform basic life functions (see Sample Item 22); and• distinguishing between characteristics of single-celled and multicellular organisms
(see Sample Item 23).
Cluster 3
Copyright © 2008 Florida Department of Education | FCAT Science Lessons Learned 85

FCAT08_LL_Sci_r9d1 5/6/08 4:39 PM Page 86
Grade 8 Cluster 3 Item #1 08SCG134M9157
Grade 8 Cluster 3 Item#2 08SCF131S7449
RESULTS BY CLUSTER Life and Environmental Sciences LESSONS LEARNED Grade 8
Sample Item 21
When Greenscape Lawn Service mowed the lawn, they did not go back and pick up the grass clippings. They left them on the lawn to benefit the soil. How would grass clippings benefit the soil?
A. Clippings take nitrogen out of the soil. B. Clippings increase the amount of soil erosion.
☞ C. Clippings return nutrients to the soil as they decompose.
D. Clippings help to reduce the amount oforganic matter in the soil.
☞ Correct Answer
Most recent student results
4% chose option A 6% chose option B
82% chose option C 8% chose option D
The following is a short-response task and an example of a top-score response.
Sample Item 22
READ INQUIRE EXPLAIN
The digestive system extracts the nutrients and water from food that the body needs to survive. Describe how the digestive system uses both mechanical and chemical processes to extract nutrients and water from food.
An explanation similar to the following received a score of 2 points:
The mouth breaks down food mechanically through the process of chewing. The stomach breaks down food mechanically by churning and chemically with digestive enzymes. The nutrients and water from food are then absorbed in the intestines.
Most recent student results
10% earned 2 points 22% earned 1 point 68% earned 0 points
Clus
ter 3
FCAT Science Lessons Learned | Copyright © 2008 Florida Department of Education 86
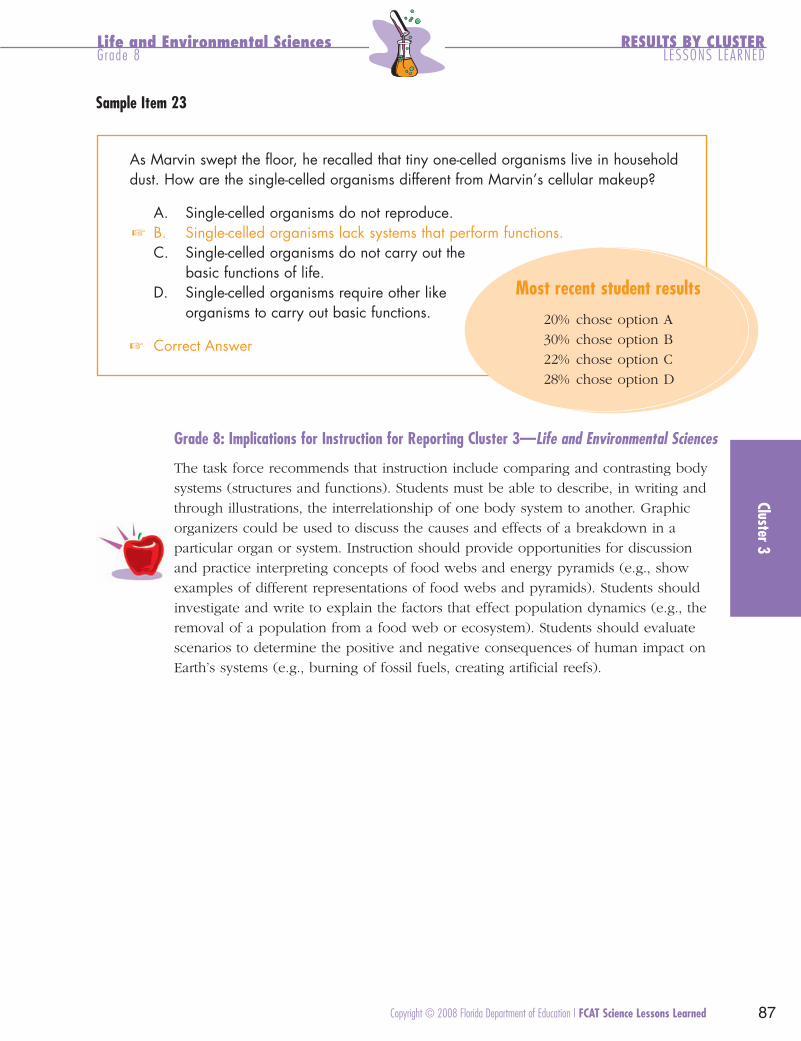
FCAT08_LL_Sci_r9d1 5/6/08 4:39 PM Page 87
Grade 8 Cluster 3 Item #3 08SCF132M8218
Life and Environmental Sciences RESULTS BY CLUSTER Grade 8 LESSONS LEARNED
Sample Item 23
As Marvin swept the floor, he recalled that tiny one-celled organisms live in household dust. How are the single-celled organisms different from Marvin’s cellular makeup?
A. Single-celled organisms do not reproduce. ☞ B. Single-celled organisms lack systems that perform functions.
C. Single-celled organisms do not carry out the basic functions of life.
D. Single-celled organisms require other like organisms to carry out basic functions.
☞ Correct Answer
Most recent student results
20% chose option A 30% chose option B 22% chose option C 28% chose option D
Grade 8: Implications for Instruction for Reporting Cluster 3—Life and Environmental Sciences
The task force recommends that instruction include comparing and contrasting body systems (structures and functions). Students must be able to describe, in writing and through illustrations, the interrelationship of one body system to another. Graphic organizers could be used to discuss the causes and effects of a breakdown in a particular organ or system. Instruction should provide opportunities for discussion and practice interpreting concepts of food webs and energy pyramids (e.g., show examples of different representations of food webs and pyramids). Students should investigate and write to explain the factors that effect population dynamics (e.g., the removal of a population from a food web or ecosystem). Students should evaluate scenarios to determine the positive and negative consequences of human impact on Earth’s systems (e.g., burning of fossil fuels, creating artificial reefs).
Cluster 3
Copyright © 2008 Florida Department of Education | FCAT Science Lessons Learned 87

FCAT08_LL_Sci_r9d1 5/6/08 4:39 PM Page 88
RESULTS BY CLUSTER Life and Environmental Sciences LESSONS LEARNED Grade 11
Clus
ter 3
Grade 11
Reporting Cluster 3 Results for Grade 11
The Grade 11 results on Reporting Cluster 3 (Life and Environmental Sciences) are displayed in the graph below. It should be noted that 2003 and 2004 represent the performance of Grade 10 students, while 2005 and 2006 represent the performance of Grade 11 students.
Graph S-25Science Grade 11
Mean Percent Correct for Reporting Cluster 3
2003
100 2004
200590 2006
80
70
60 5853
5050
40
30
20
10
0
42
Grade 11
Mean P
erc
ent
Corr
ect
Note: Caution must be used in interpreting this graph because the changes in performance over time may be attributed to changes in item difficulty. See pages 18–20 for appropriate methods that the DOE suggests schools and districts use to analyze performance at the reporting-cluster level.
The following charts show the Reporting Cluster 3 (Life and Environmental Sciences) strands, standards, and benchmarks for Grade 11. Observations, sample items, and implications for instruction follow each reporting cluster.
FCAT Science Lessons Learned | Copyright © 2008 Florida Department of Education 88
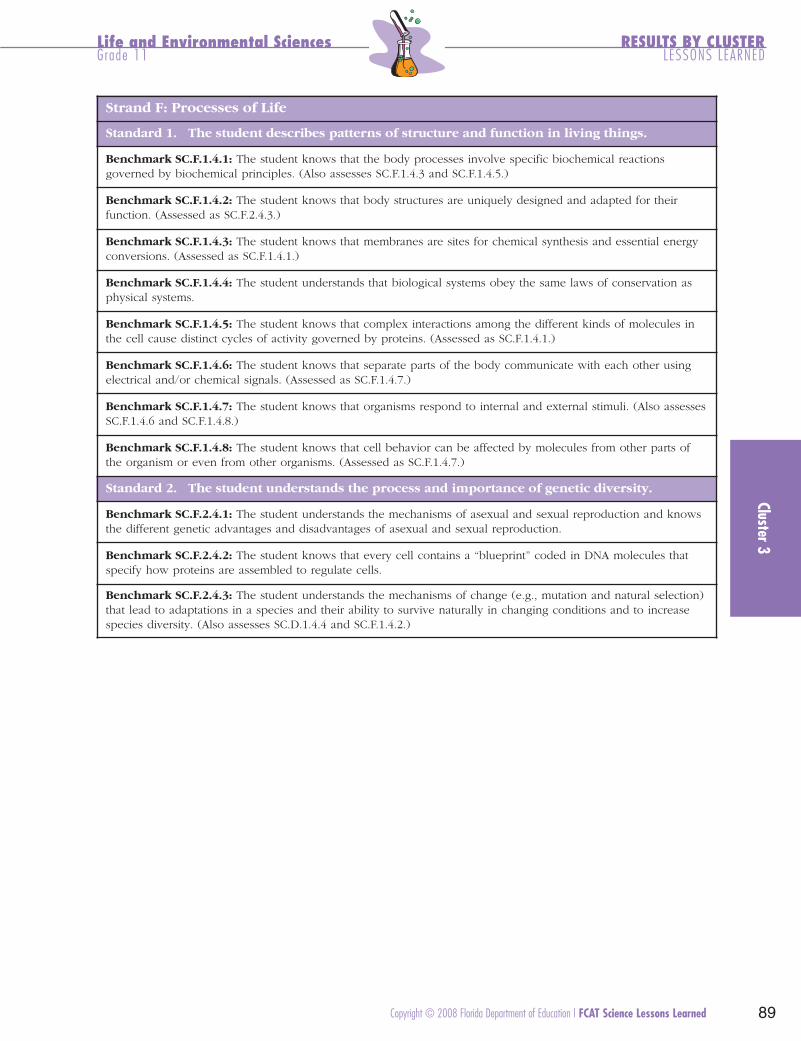
FCAT08_LL_Sci_r9d1 5/6/08 4:39 PM Page 89
Life and Environmental Sciences RESULTS BY CLUSTER Grade 11 LESSONS LEARNED
Strand F: Processes of Life
Standard 1. The student describes patterns of structure and function in living things.
Benchmark SC.F.1.4.1: The student knows that the body processes involve specific biochemical reactions governed by biochemical principles. (Also assesses SC.F.1.4.3 and SC.F.1.4.5.)
Benchmark SC.F.1.4.2: The student knows that body structures are uniquely designed and adapted for their function. (Assessed as SC.F.2.4.3.)
Benchmark SC.F.1.4.3: The student knows that membranes are sites for chemical synthesis and essential energy conversions. (Assessed as SC.F.1.4.1.)
Benchmark SC.F.1.4.4: The student understands that biological systems obey the same laws of conservation as physical systems.
Benchmark SC.F.1.4.5: The student knows that complex interactions among the different kinds of molecules in the cell cause distinct cycles of activity governed by proteins. (Assessed as SC.F.1.4.1.)
Benchmark SC.F.1.4.6: The student knows that separate parts of the body communicate with each other using electrical and/or chemical signals. (Assessed as SC.F.1.4.7.)
Benchmark SC.F.1.4.7: The student knows that organisms respond to internal and external stimuli. (Also assesses SC.F.1.4.6 and SC.F.1.4.8.)
Benchmark SC.F.1.4.8: The student knows that cell behavior can be affected by molecules from other parts of the organism or even from other organisms. (Assessed as SC.F.1.4.7.)
Standard 2. The student understands the process and importance of genetic diversity.
Benchmark SC.F.2.4.1: The student understands the mechanisms of asexual and sexual reproduction and knows the different genetic advantages and disadvantages of asexual and sexual reproduction.
Benchmark SC.F.2.4.2: The student knows that every cell contains a “blueprint” coded in DNA molecules that specify how proteins are assembled to regulate cells.
Benchmark SC.F.2.4.3: The student understands the mechanisms of change (e.g., mutation and natural selection) that lead to adaptations in a species and their ability to survive naturally in changing conditions and to increase species diversity. (Also assesses SC.D.1.4.4 and SC.F.1.4.2.)
Cluster 3
Copyright © 2008 Florida Department of Education | FCAT Science Lessons Learned 89

FCAT08_LL_Sci_r9d1 5/6/08 4:39 PM Page 90
RESULTS BY CLUSTER Life and Environmental Sciences LESSONS LEARNED Grade 11
Clus
ter 3
Strand G: How Living Things Interact with Their Environment
Standard 1. The student understands the competitive, interdependent, cyclic nature of living
things in the environment.
Benchmark SC.G.1.4.1: The student knows of the great diversity and interdependence of living things. (Also assesses SC.G.1.4.2.)
Benchmark SC.G.1.4.2: The student understands how the flow of energy through an ecosystem made up of producers, consumers, and decomposers carries out the processes of life and that some energy dissipates as heat and is not recycled. (Assessed as SC.G.1.4.1.)
Benchmark SC.G.1.4.3: The student knows that the chemical elements that make up the molecules of living things are combined and recombined in different ways.
Standard 2. The student understands the consequences of using limited natural resources.
Benchmark SC.G.2.4.1: The student knows that layers of energy-rich organic materials have been gradually turned into great coal beds and oil pools (fossil fuels) by the pressure of the overlying earth and that humans burn fossil fuels to release the stored energy as heat and carbon dioxide.
Benchmark SC.G.2.4.2: The student knows that changes in a component of an ecosystem will have unpredictable effects on the entire system but that the components of the system tend to react in a way that will restore the ecosystem to its original condition. (Also assesses SC.B.1.4.5 and SC.G.2.4.5.)
Benchmark SC.G.2.4.3: The student understands how genetic variation of offspring contributes to population control in an environment and that natural selection ensures that those who are best adapted to their surroundings survive to reproduce.
Benchmark SC.G.2.4.4: The student knows that the world ecosystems are shaped by physical factors that limit their productivity. (Assessed as SC.D.2.4.1.)
Benchmark SC.G.2.4.5: The student understands that the amount of life any environment can support is limited and that human activities can change the flow of energy and reduce the fertility of the Earth. (Assessed as SC.G.2.4.2.)
Benchmark SC.G.2.4.6: The student knows the ways in which humans today are placing their environmental support systems at risk (e.g., rapid human population growth, environmental degradation, and resource depletion).
FCAT Science Lessons Learned | Copyright © 2008 Florida Department of Education 90

FCAT08_LL_Sci_r9d1 5/6/08 4:39 PM Page 91
Life and Environmental Sciences RESULTS BY CLUSTER Grade 11 LESSONS LEARNED
Grade 11: Observations for Reporting Cluster 3—Life and Environmental Sciences
Analysis of student performance data reveals the following:
Students who are successful are able to • recognize the function of enzymes (see Sample Item 24); • recognize relationships between body structures and function (e.g., structural adaptations); • identify factors involved in the interdependence of organisms, such as predator-prey and
host-parasite relationships; and• explain the effects of introducing non-native species into an ecosystem.
Students who are unsuccessful have the greatest difficulty with • describing the purpose and processes of cellular respiration; • explaining the role of the cell membrane in movement of particles (e.g., diffusion and
active transport);• determining chromosome numbers resulting from meiosis (see Sample Item 25); • explaining the processes and results of mutations and natural selection; • predicting the impact of stress on a population (e.g., carrying capacity, limiting factors); and • explaining the principles of ecological succession (see Sample Item 26).
Cluster 3
Copyright © 2008 Florida Department of Education | FCAT Science Lessons Learned 91

FCAT08_LL_Sci_r9d1 5/6/08 4:39 PM Page 92
Grade 11 Cluster 3 Item #1 10SCF141M0065
Grade 11 Cluster 3 Item #2 10SCF241G2081
RESULTS BY CLUSTER Life and Environmental Sciences LESSONS LEARNED Grade 11
Sample Item 24
Raul takes a bite of baked potato. The saliva he produces is a mixture of water, mucus, and amylase. The water and mucus lubricate the food preparing it for digestion. What is the function of the enzyme amylase?
A. to increase the amount of energy in digestion B. to convert carbohydrates into digestible protein
☞ C. to begin the breakdown of carbohydrates in the mouth
D. to slow the rate of digestion until the food reaches the stomach
☞ Correct Answer
Most recent student results
10% chose option A 15% chose option B 62% chose option C 13% chose option D
Sample Item 25
A certain type of rat has a total of 22 chromosomes in its cell nucleus. The rat’s sex cells are produced by the process of meiosis. As a result of meiosis, how many chromosomes are found in a sex cell of a normal rat?
Correct Answer: 11 Most recent student results
35% of Grade 11 students answered this
question correctly.
Clus
ter 3
FCAT Science Lessons Learned | Copyright © 2008 Florida Department of Education 92
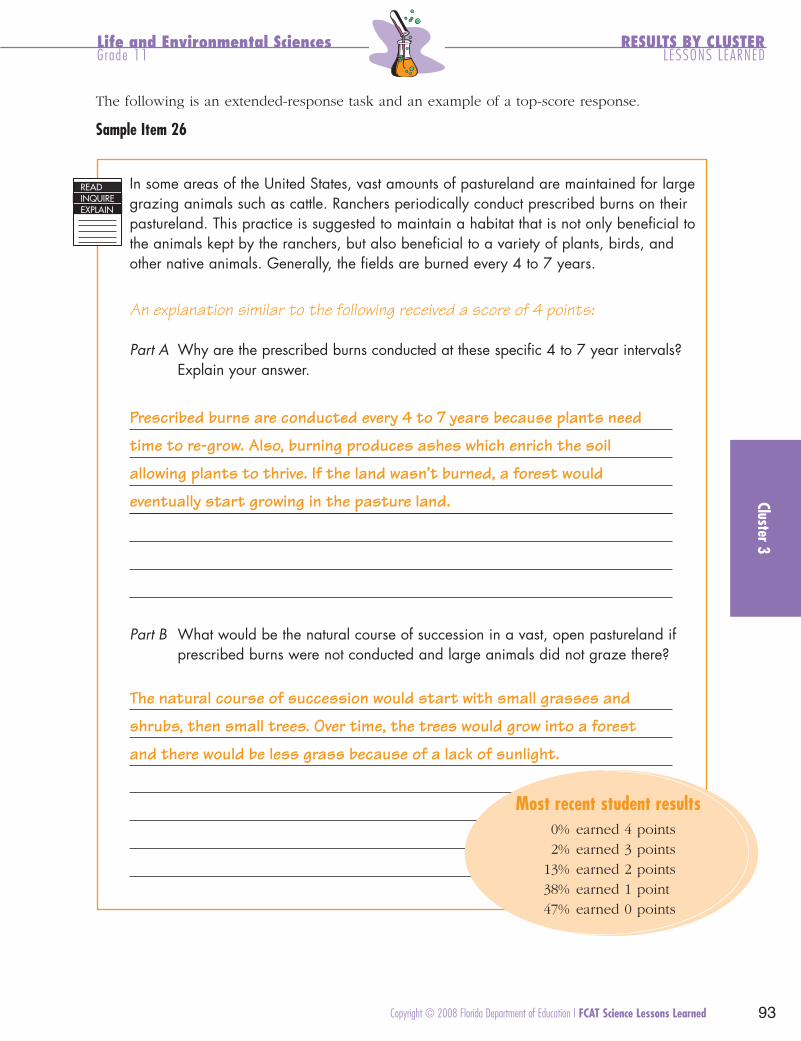
FCAT08_LL_Sci_r9d1 5/6/08 4:39 PM Page 93
Grade 11 Cluster 3 Item #3 10SCG242E2930
Life and Environmental Sciences RESULTS BY CLUSTER Grade 11 LESSONS LEARNED
The following is an extended-response task and an example of a top-score response.
Sample Item 26
READ INQUIREEXPLAIN
In some areas of the United States, vast amounts of pastureland are maintained for large grazing animals such as cattle. Ranchers periodically conduct prescribed burns on their pastureland. This practice is suggested to maintain a habitat that is not only beneficial to the animals kept by the ranchers, but also beneficial to a variety of plants, birds, and other native animals. Generally, the fields are burned every 4 to 7 years.
An explanation similar to the following received a score of 4 points:
Part A Why are the prescribed burns conducted at these specific 4 to 7 year intervals? Explain your answer.
Prescribed burns are conducted every 4 to 7 years because plants need
time to re-grow. Also, burning produces ashes which enrich the soil
allowing plants to thrive. If the land wasn’t burned, a forest would
eventually start growing in the pasture land.
Part B What would be the natural course of succession in a vast, open pastureland if prescribed burns were not conducted and large animals did not graze there?
The natural course of succession would start with small grasses and
shrubs, then small trees. Over time, the trees would grow into a forest
and there would be less grass because of a lack of sunlight.
Most recent student results 0% earned 4 points 2% earned 3 points
13% earned 2 points 38% earned 1 point 47% earned 0 points
Cluster 3
Copyright © 2008 Florida Department of Education | FCAT Science Lessons Learned 93

FCAT08_LL_Sci_r9d1 5/6/08 4:39 PM Page 94
RESULTS BY CLUSTER Life and Environmental Sciences LESSONS LEARNED Grade 11
Grade 11: Implications for Instruction for Reporting Cluster 3—Life and Environmental Sciences
The task force recommends that teachers use guided practice to model how to write explanations of ecological concepts. Rather than teaching parts in isolation, teachers should use graphic organizers to teach a biological process and to show how the individual steps contribute to that entire process (e.g., use a concept map to show the process of cellular respiration, use a Venn diagram to compare and contrast mitosis and meiosis).
Instruction should help students clarify their understanding of biotic and abiotic factors within ecosystems, factors that produce change in a population, and advantages of sexual and asexual reproduction. Students should have opportunities to solve genetic problems using Punnett squares. Students should investigate and explain factors affecting biodiversity in an ecosystem.
Clus
ter 3
FCAT Science Lessons Learned | Copyright © 2008 Florida Department of Education 94

FCAT08_LL_Sci_r9d1 5/6/08 4:39 PM Page 95
Scientific Thinking RESULTS BY CLUSTER Grade 5 LESSONS LEARNED
Reporting Cluster 4—Scientific Thinking
Grade 5
Reporting Cluster 4 Results for Grade 5
The Grade 5 results on Reporting Cluster 4 (Scientific Thinking) are displayed in the graph below.
Graph S-26Science Grade 5
Mean Percent Correct for Reporting Cluster 4
2003
100 2004
200590 2006
80
70
60 5855 55
4950
40
30
20
10
0
Grade 5
Mean P
erc
ent
Corr
ect
Note: Caution must be used in interpreting this graph because the changes in performance over time may be attributed to changes in item difficulty. See pages 18–20 for appropriate methods that the DOE suggests schools and districts use to analyze performance at the reporting-cluster level.
The following charts show the Reporting Cluster 4 (Scientific Thinking) strands, standards, and benchmarks for Grade 5. Observations, sample items, and implications for instruction follow each reporting cluster.
Cluster 4
Copyright © 2008 Florida Department of Education | FCAT Science Lessons Learned 95

FCAT08_LL_Sci_r9d1 5/6/08 4:39 PM Page 96
RESULTS BY CLUSTER Scientific ThinkingLESSONS LEARNED Grade 5
Strand H: The Nature of Science
Standard 1. The student uses the scientific processes and habits of mind to solve problems.
Benchmark SC.H.1.2.1: The student knows that it is important to keep accurate records and descriptions to provide information and clues on causes of discrepancies in repeated experiments.
Benchmark SC.H.1.2.2: The student knows that a successful method to explore the natural world is to observe and record, and then analyze and communicate the results. (Also assesses SC.H.1.2.4 and SC.H.3.2.2.)
Benchmark SC.H.1.2.3: The student knows that to work collaboratively, all team members should be free to reach, explain, and justify their own individual conclusions. (Not assessed.)
Benchmark SC.H.1.2.4: The student knows that to compare and contrast observations and results is an essential skill in science. (Assessed as SC.H.1.2.2.)
Benchmark SC.H.1.2.5: The student knows that a model of something is different from the real thing, but can be used to learn something about the real thing.
Standard 2. The student understands that most natural events occur in comprehensible,
consistent patterns.
Benchmark SC.H.2.2.1: The student knows that natural events are often predictable and logical.
Standard 3. The student understands that science, technology, and society are interwoven
and interdependent.
Benchmark SC.H.3.2.1: The student understands that people, alone or in groups, invent new tools to solve problems and do work that affects aspects of life outside of science. (Also assesses SC.H.3.2.3.)
Benchmark SC.H.3.2.2: The student knows that data are collected and interpreted in order to explain an event or concept. (Assessed as SC.H.1.2.2.)
Benchmark SC.H.3.2.3: The student knows that before a group of people build something or try something new, they should determine how it may affect other people. (Assessed as SC.H.3.2.1.)
Benchmark SC.H.3.2.4: The student knows that through the use of science processes and knowledge, people can solve problems, make decisions, and form new ideas.
Clus
ter 4
Grade 5: Observations for Reporting Cluster 4—Scientific Thinking
Analysis of student performance data reveals the following:
Students who are successful are able to • identify an appropriate procedure and the need to control variables; • identify steps of the scientific method (i.e., what to do in each step of the process) (see
Sample Item 27); and • identify cause-and-effect relationships in a given scientific experiment (see Sample Item 28).
Students who are unsuccessful have the greatest difficulty with • using and applying higher-order thinking skills in the process of analysis (e.g.,
comparing/contrasting and interpreting data, averaging results, interpreting cause-and-effect relationships, writing to explain why) (see Sample Item 29); and
• making predictions based on patterns in observable data collected over time.
FCAT Science Lessons Learned | Copyright © 2008 Florida Department of Education 96

FCAT08_LL_Sci_r9d1 5/6/08 4:39 PM Page 97
Grade 5 Cluster 4 Item #1 05SCH122M4115
Grade 5 Cluster 4 Item #2 05SCH324M4090
Scientific Thinking RESULTS BY CLUSTER Grade 5 LESSONS LEARNED
Sample Item 27
Janis wants to compare the number of snails in two different areas of a park. What is the most appropriate way for Janis to compare the number of snails in the two different areas of the park?
A. list ways that people make it hard for snails to live ☞ B. use a table to show the number of snails in each area
C. make a drawing showing different features of each area
D. graph how often the two groups of snails eat the same kind of food
☞ Correct Answer
Most recent student results
5% chose option A 70% chose option B 16% chose option C 10% chose option D
Sample Item 28
Arnella sometimes leaves bread pieces on her bird feeder for the robins to eat. She is trying to determine which type of bread—rye, wheat, or white—that robins like.
Cluster 4
Arnella places equal amounts of each bread on the bird feeder. What information would help determine which type of bread the robins like to eat?
A. when the robins come to eat B. how many robins come to eat
☞ C. which type of bread is gone first D. how long until all the bread is gone
☞ Correct Answer
Most recent student results
3% chose option A 7% chose option B
87% chose option C 3% chose option D
Copyright © 2008 Florida Department of Education | FCAT Science Lessons Learned 97

FCAT08_LL_Sci_r9d1 5/6/08 4:39 PM Page 98
Grade 5 Cluster 4 Item#3 05SCH122S0166
RESULTS BY CLUSTER Scientific ThinkingLESSONS LEARNED Grade 5
The following is a short-response task and an example of a top-score response.
Sample Item 29
READ INQUIRE EXPLAIN
Sam and Erin are studying photosynthesis, the process by which plants make food. They know the process of photosynthesis produces oxygen (O2) gas. They set up an experiment in which they place water plants in each of five test tubes containing water like the one shown in Figure 1. Next, Sam and Erin place the test tubes at different distances from a light source. They observe that the plants produce bubbles of gas. They count the number of bubbles produced per minute in each test tube. Their results are shown in the table below.
Bubbles of gas
Water plants
Test tube
Figure 1
EXPERIMENT DESIGN
Clus
ter 4
RESULTS OF EXPERIMENT
Test Tube Number
Distance from Light
(in centimeters)
Bubbles (per minute)
1 10 45
2 30 30
3 50 19
4 70 6
5 100 1
An explanation similar to the following received a score of 2 points:
Part A Explain how the distance from the light source affects the production of bubbles.
The closer the plant is to the light, the more bubbles are produced. When the plant is farther from the light, fewer bubbles are produced.
Part B Identify one thing Sam and Erin could do to improve their experiment. Explain why this change should be made.
They could repeat their experiment more times to make sure their results are valid. Most recent student results
4% earned 2 points 43% earned 1 point 54% earned 0 points
FCAT Science Lessons Learned | Copyright © 2008 Florida Department of Education 98

FCAT08_LL_Sci_r9d1 5/6/08 4:39 PM Page 99
Scientific Thinking RESULTS BY CLUSTER Grade 5 LESSONS LEARNED
Grade 5: Implications for Instruction for Reporting Cluster 4—Scientific Thinking
The task force recommends extending applications of the previous reporting clusters into this strand; students need to have conducted experiments in all three reporting clusters so that they can answer questions related to the Strand H set in any of these contexts. Along with this, instruction should move beyond just observations and demonstrations, and into hands-on opportunities for students to analyze (i.e., synthesize, compare/contrast, draw inferences, determine causes and effects, average, classify, categorize), draw appropriate conclusions, and apply concepts. Teachers should provide multiple opportunities for students to make predictions based on patterns in observable data collected over time (e.g., more abstract and different contexts, long-term observations). Students should have the opportunity to experience the scientific method as a cycle that includes data generating new questions that lead to new experiments. The Lessons Learned task force recommends emphasizing the holistic nature (i.e., the whys and hows) of the scientific process. For example, students must understand that one reason it is important to provide (in writing) a clear written procedure is to allow someone else to replicate it.
Cluster 4
Copyright © 2008 Florida Department of Education | FCAT Science Lessons Learned 99
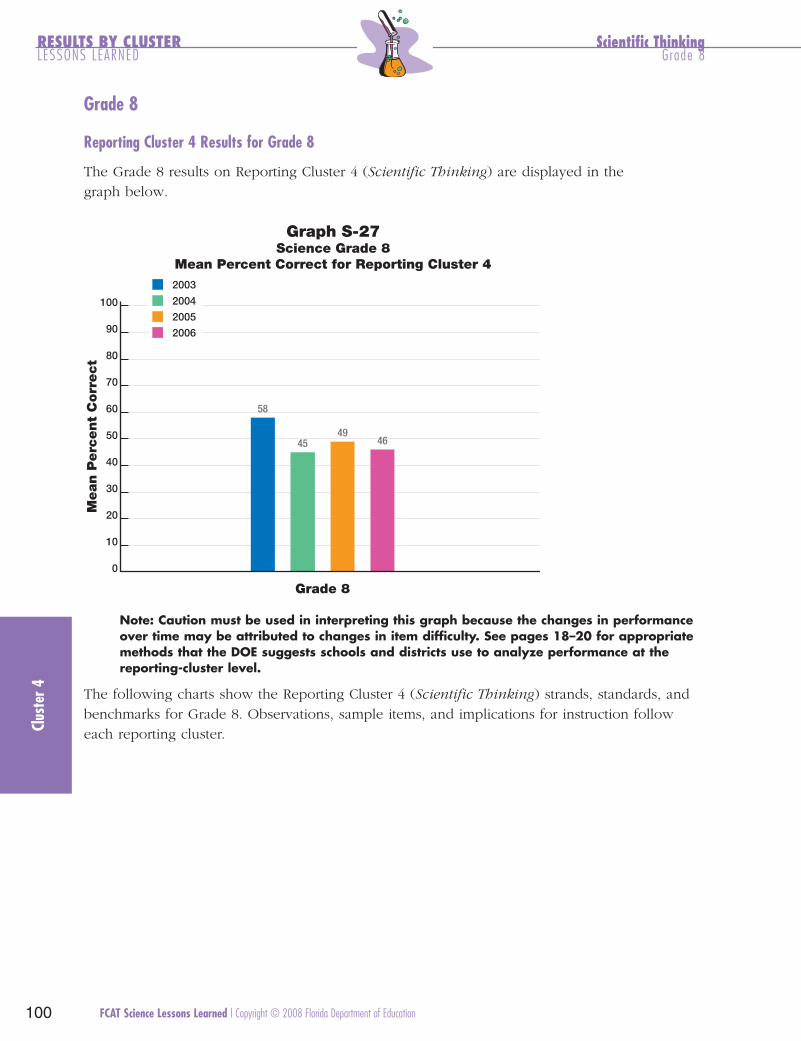
FCAT08_LL_Sci_r9d1 5/6/08 4:39 PM Page 100
RESULTS BY CLUSTER Scientific ThinkingLESSONS LEARNED Grade 8
Grade 8
Reporting Cluster 4 Results for Grade 8
The Grade 8 results on Reporting Cluster 4 (Scientific Thinking) are displayed in the graph below.
Graph S-27Science Grade 8
Mean Percent Correct for Reporting Cluster 4
2003
100 2004
200590 2006
80
Mean P
erc
ent
Corr
ect
70
60 58
50 49 4645
40
30
20
10
0
Grade 8
Note: Caution must be used in interpreting this graph because the changes in performance over time may be attributed to changes in item difficulty. See pages 18–20 for appropriate methods that the DOE suggests schools and districts use to analyze performance at the reporting-cluster level.
The following charts show the Reporting Cluster 4 (Scientific Thinking) strands, standards, and benchmarks for Grade 8. Observations, sample items, and implications for instruction follow each reporting cluster. Cl
uste
r 4
100 FCAT Science Lessons Learned | Copyright © 2008 Florida Department of Education

FCAT08_LL_Sci_r9d1 5/6/08 4:39 PM Page 101
Scientific Thinking RESULTS BY CLUSTER Grade 8 LESSONS LEARNED
Strand H: The Nature of Science
Standard 1. The student uses the scientific processes and habits of mind to solve problems.
Benchmark SC.H.1.3.1: The student knows that scientific knowledge is subject to modification as new information challenges prevailing theories and as a new theory leads to looking at old observations in a new way.
Benchmark SC.H.1.3.2: The student knows that the study of the events that led scientists to discoveries can provide information about the inquiry process and its effects.
Benchmark SC.H.1.3.3: The student knows that science disciplines differ from one another in topic, techniques, and outcomes, but that they share a common purpose, philosophy, and enterprise.
Benchmark SC.H.1.3.4: The student knows that accurate record keeping, openness, and replication are essential to maintaining an investigator’s credibility with other scientists and society. (Also assesses SC.H.1.3.7.)
Benchmark SC.H.1.3.5: The student knows that a change in one or more variables may alter the outcome of an investigation.
Benchmark SC.H.1.3.6: The student recognizes the scientific contributions that are made by individuals of diverse backgrounds, interests, talents, and motivations. (Not assessed.)
Benchmark SC.H.1.3.7: The student knows that when similar investigations give different results, the scientific challenge is to verify whether the differences are significant by further study. (Assessed as SC.H.1.3.4.)
Standard 2. The student understands that most natural events occur in comprehensible,
consistent patterns.
Benchmark SC.H.2.3.1: The student recognizes that patterns exist within and across systems.
Standard 3. The student understands that science, technology, and society are interwoven
and interdependent.
Benchmark SC.H.3.3.1: The student knows that science ethics demand that scientists must not knowingly subject coworkers, students, the neighborhood, or the community to health or property risks. (Also assesses SC.H.3.3.2 and SC.H.3.3.3.)
Benchmark SC.H.3.3.2: The student knows that special care must be taken in using animals in scientific research. (Assessed as SC.H.3.3.1.)
Benchmark SC.H.3.3.3: The student knows that in research involving human subjects, the ethics of science require that potential subjects be fully informed about the risks and benefits associated with the research and of their right to refuse to participate. (Assessed as SC.H.3.3.1.)
Benchmark SC.H.3.3.4: The student knows that technological design should require taking into account constraints such as natural laws, the properties of the materials used, and economic, political, social, ethical, and aesthetic values. (Also assesses SC.H.3.3.6 and SC.H.3.3.7.)
Benchmark SC.H.3.3.5: The student understands that contributions to the advancement of science, mathematics, and technology have been made by different kinds of people, in different cultures, at different times, and are an intrinsic part of the development of human culture. (Not assessed.)
Benchmark SC.H.3.3.6: The student knows that no matter who does science and mathematics or invents things, or when or where they do it, the knowledge and technology that result can eventually become available to everyone. (Assessed as SC.H.3.3.4.)
Benchmark SC.H.3.3.7: The student knows that computers speed up and extend people’s ability to collect, sort, and analyze data; prepare research reports; and share data and ideas with others. (Assessed as SC.H.3.3.4.)
Cluster 4
Copyright © 2008 Florida Department of Education | FCAT Science Lessons Learned 101

FCAT08_LL_Sci_r9d1 5/6/08 4:39 PM Page 102
Grade 8 Cluster 4 Item #1 08SCH134M0609
RESULTS BY CLUSTER Scientific ThinkingLESSONS LEARNED Grade 8
Grade 8: Observations for Reporting Cluster 4—Scientific Thinking
Analysis of student performance data reveals the following:
Students who are successful are able to • recognize that repetition increases the validity of an experiment and that the experimental
procedures should be provided to other potential researchers to allow for replication of an experiment (see Sample Item 30); and
• recognize that technological advances can benefit society (see Sample Item 31).
Students who are unsuccessful have the greatest difficulty with • explaining the roles of variables and controls in experiments (see Sample Item 32); • designing an experimental procedure when given a hypothesis; and • analyzing an experimental design for validity.
Sample Item 30
Michael studied the effects of temperature and pressure on the expansion rate of gases. When publishing the results of the experiment for others to study, which of the following would be most important for Michael to include?
☞ A. detailed steps in the procedures used B. cost of the materials used in the study C. acknowledgement of family members D. name of the building where the
experiments were performed
☞ Correct Answer
Most recent student results
83% chose option A 6% chose option B 6% chose option C 5% chose option D
Clus
ter 4
102 FCAT Science Lessons Learned | Copyright © 2008 Florida Department of Education

FCAT08_LL_Sci_r9d1 5/6/08 4:39 PM Page 103
Grade 8 Cluster 4 Item #2 08SCH334M7047
Scientific Thinking RESULTS BY CLUSTER Grade 8 LESSONS LEARNED
Sample Item 31
Artifacts from a Seminole tribe include a carved stone that was used as an ax head. The description of this artifact explains that an ax head could have taken many hours tomake. Why does it take less time to make an ax head today than it did in ancient times?
A. Axes are now made out of steel instead of rock. B. The size and design of the ax heads have changed.
☞ C. Machines can be used in the manufacturing process. D. There are more people today to work in the
manufacturing process.
☞ Correct Answer
Most recent student results
10% chose option A 6% chose option B
80% chose option C 4% chose option D
Cluster 4
Copyright © 2008 Florida Department of Education | FCAT Science Lessons Learned 103

FCAT08_LL_Sci_r9d1 5/6/08 4:39 PM Page 104
Grade 8 Cluster 4 Item #3 08SCH135E7468
RESULTS BY CLUSTER Scientific ThinkingLESSONS LEARNED Grade 8
The following is an extended-response task and an example of a top-score response.
Sample Item 32
READ INQUIRE EXPLAIN
Tara and Richard wanted to show that a fish releases carbon dioxide (CO ). 2 They obtained two jars and a red liquid indicator that turns yellow in the presence of CO2. In each jar, they placed 50 milliliters (mL) of water and five drops of the red indicator. In Jar 1, Tara gently blew through a straw into the solution for two minutes. Richard placed a small fish in Jar 2. The results of the experiment are shown in the chart below.
RESULTS OF EXPERIMENT
Time Solution Color
Jar 1 Jar 2
Beginning of experiment Red Red
At 2 minutes Yellow Red
At 15 minutes Yellow Yellow
An explanation similar to the following received a score of 4 points:
Part A A control was not included in the set up for this experiment, however, a control was needed. Explain what the control should be and how it should be used in
this experiment.
A control jar is used for comparison purposes. The control jar would contain 50 mL of water and five drops of indicator. Nothing else would be added to the control jar.
Part B Draw a chart showing the appearance of the control over the course of the experiment.
Clus
ter 4
Time Solution Color — Control Jar
Beginning of Experiment Red At 2 minutes Red At 15 minutes Red
Most recent student results 3% earned 4 points 8% earned 3 points 5% earned 2 points 5% earned 1 point
62% earned 0 points
104 FCAT Science Lessons Learned | Copyright © 2008 Florida Department of Education

FCAT08_LL_Sci_r9d1 5/6/08 4:39 PM Page 105
Scientific Thinking RESULTS BY CLUSTER Grade 8 LESSONS LEARNED
Grade 8: Implications for Instruction for Reporting Cluster 4—Scientific Thinking
The task force recommends more inquiry-based activities followed by class discussions and written lab reports. Students should be given the opportunity to design and conduct experiments to test hypotheses (e.g., science fairs). Methods and processes from Strand H should be incorporated within the teaching of the other strands rather than taught in isolation. Instruction should provide opportunities for students to collect, display, and analyze data to draw appropriate and meaningful conclusions. Students should practice explaining the roles of variables (e.g., manipulating and responding variables, dependent and independent variables), constants, and controls in a scientific experiment. Instruction should include peer review and discussion of ethical considerations or bias in experimental design.
Cluster 4
Copyright © 2008 Florida Department of Education | FCAT Science Lessons Learned 105

FCAT08_LL_Sci_r9d1 5/6/08 4:39 PM Page 106
RESULTS BY CLUSTER Scientific ThinkingLESSONS LEARNED Grade 11
Grade 11
Reporting Cluster 4 Results for Grade 11
The Grade 11 results on Reporting Cluster 4 (Scientific Thinking) are displayed in the graph below. It should be noted that 2003 and 2004 represent the performance of Grade 10 students, while 2005 and 2006 represent the performance of Grade 11 students.
Graph S-28 Science Grade 11
Mean Percent Correct for Reporting Cluster 4
2003
100 2004
2005 90 2006
80
Mean P
erc
ent
Corr
ect
70
61 60 58 56
49
Grade 11
50
40
30
20
10
0
Note: Caution must be used in interpreting this graph because the changes in performance over time may be attributed to changes in item difficulty. See pages 18–20 for appropriate methods that the DOE suggests schools and districts use to analyze performance at the reporting-cluster level.
The following charts show the Reporting Cluster 4 (Scientific Thinking) strands, standards, and benchmarks for Grade 11. Observations, sample items, and implications for instruction follow each reporting cluster.
Clus
ter 4
106 FCAT Science Lessons Learned | Copyright © 2008 Florida Department of Education

FCAT08_LL_Sci_r9d1 5/6/08 4:39 PM Page 107
Scientific Thinking RESULTS BY CLUSTER Grade 11 LESSONS LEARNED
Strand H: The Nature of Science
Standard 1. The student uses the scientific processes and habits of mind to solve problems.
Benchmark SC.H.1.4.1: The student knows that investigations are conducted to explore new phenomena, to check on previous results, to test how well a theory predicts, and to compare different theories. (Also assesses SC.H.1.2.1, SC.H.1.2.2, SC.H.2.4.2, SC.E.2.4.6, and SC.E.2.4.7.)
Benchmark SC.H.1.4.2: The student knows that from time to time, major shifts occur in the scientific view of how the world works, but that more often the changes that take place in the body of scientific knowledge are small modifications of prior knowledge. (Also assesses SC.H.1.3.2, SC.H.1.4.3, SC.H.1.4.5, and SC.H.1.4.6.)
Benchmark SC.H.1.4.3: The student understands that no matter how well one theory fits observations, a new theory might fit them as well or better, or might fit a wider range of observations, because in science, the testing, revising, and occasional discarding of theories, new and old, never ends and leads to an increasingly better understanding of how things work in the world, but not to absolute truth. (Assessed as SC.H.1.4.2.)
Benchmark SC.H.1.4.4: The student knows that scientists in any one research group tend to see things alike and that therefore scientific teams are expected to seek out the possible sources of bias in the design of their investigations and in their data analysis.
Benchmark SC.H.1.4.5: The student understands that new ideas in science are limited by the context in which they are conceived, are often rejected by the scientific establishment, sometimes spring from unexpected findings, and usually grow slowly from many contributors. (Assessed as SC.H.1.4.2.)
Benchmark SC.H.1.4.6: The student understands that, in the short run, new ideas that do not mesh well with mainstream ideas in science often encounter vigorous criticism and that, in the long run, theories are judged by how they fit with other theories, the range of observations they explain, how well they explain observations, and how effective they are in predicting new findings. (Assessed as SC.H.1.4.2.)
Benchmark SC.H.1.4.7: The student understands the importance of a sense of responsibility, a commitment to peer review, truthful reporting of the methods and outcomes of investigations, and making the public aware of the findings.
Standard 2. The student understands that most natural events occur in comprehensible,
consistent patterns.
Benchmark SC.H.2.4.1: The student knows that scientists assume that the universe is a vast system in which basic rules exist that may range from very simple to extremely complex, but that scientists operate on the belief that the rules can be discovered by careful, systemic study.
Benchmark SC.H.2.4.2: The student knows that scientists control conditions in order to obtain evidence, but when that is not possible for practical or ethical reasons, they try to observe a wide range of natural occurrences to discern patterns. (Assessed as SC.H.1.4.1.) Cluster 4
Copyright © 2008 Florida Department of Education | FCAT Science Lessons Learned 107
FCAT08_LL_Sci_r9d1 5/6/08 4:39 PM Page 108
RESULTS BY CLUSTER Scientific ThinkingLESSONS LEARNED Grade 11
Strand H: The Nature of Science
Standard 3. The student understands that science, technology, and society are interwoven
and interdependent.
Benchmark SC.H.3.4.1: The student knows that performance testing is often conducted using small-scale models, computer simulations, or analogous systems to reduce the chance of system failure.
Benchmark SC.H.3.4.2: The student knows that technological problems often create a demand for new scientific knowledge and that new technologies make it possible for scientists to extend their research in a way that advances science. (Also assesses SC.H.3.4.5 and SC.H.3.4.6.)
Benchmark SC.H.3.4.3: The student knows that scientists can bring information, insights, and analytical skills to matters of public concern and help people understand the possible causes and effects of events.
Benchmark SC.H.3.4.4: The student knows that funds for science research come from federal government agencies, industry, and private foundations and that this funding often influences the areas of discovery. (Not assessed.)
Benchmark SC.H.3.4.5: The student knows that the value of a technology may differ for different people and at different times. (Assessed as SC.H.3.4.2.)
Benchmark SC.H.3.4.6: The student knows that scientific knowledge is used by those who engage in design and technology to solve practical problems, taking human values and limitations into account. (Assessed as SC.H.3.4.2.)
Grade 11: Observations for Reporting Cluster 4—Scientific Thinking
Analysis of student performance data reveals the following:
Students who are successful are able to • recognize the importance of repetition in experiments (see Sample Item 33); and • interpret and analyze experimental data presented in tables (see Sample Item 34).
Students who are unsuccessful have the greatest difficulty with • writing a detailed procedure to test a hypothesis (see Sample Item 35); and • analyzing trends involving multiple variables to form conclusions.
Clus
ter 4
108 FCAT Science Lessons Learned | Copyright © 2008 Florida Department of Education

FCAT08_LL_Sci_r9d1 5/6/08 4:39 PM Page 109
Grade 11 Cluster 4 Item #1 10SCH142M2536
Scientific Thinking RESULTS BY CLUSTER Grade 11 LESSONS LEARNED
Sample Item 33
In the 1920s, Alexander Fleming discovered a mold growing inside a petri dish that contained infectious bacteria. He noticed that where the mold grew, the bacteria had died. He eventually prepared a broth from the mold and used it to successfully vaccinate a person against an infectious disease. What would have been the best action for others in medical science to take before using the vaccination globally?
☞ A. continue to test the broth’s effectiveness B. look for ways to develop the mold artificially C. develop a business plan to distribute the broth D. dismiss the results due to the
unauthorized experimentation
☞ Correct Answer
Most recent student results
77% chose option A 15% chose option B 5% chose option C 3% chose option D
Cluster 4
Copyright © 2008 Florida Department of Education | FCAT Science Lessons Learned 109

FCAT08_LL_Sci_r9d1 5/6/08 4:39 PM Page 110
Grade 11 Cluster 4 Item #2 10SCH241M0685
RESULTS BY CLUSTER Scientific ThinkingLESSONS LEARNED Grade 11
Sample Item 34
Clus
ter 4
Sound waves travel at various speeds through different media or materials, depending on the density of those materials. The waves travel at different speeds through solids, liquids, and gases. The following table gives five materials or media that sound waves go through and the speed of those waves.
SPEED OF SOUND WAVES DETERMINEDBY THE DIFFERENT MEDIA
Medium Speed (meters/second)
Air 343
Carbon Dioxide (CO2) 267
Granite 3950
Steel 5121
Water (liquid) 1469
Which describes the relationship between the speed of sound waves and the medium they travel through?
A. The speed of sound waves is greatest when traveling through liquid. B. The speed of sound waves is greatest when traveling through the air.
☞ C. As the density of the medium increases, speed of the sound waves increases. D. As the density of the medium increases, speed of the sound waves decreases.
☞ Correct Answer
Most recent student results
9% chose option A 7% chose option B
72% chose option C 12% chose option D
110 FCAT Science Lessons Learned | Copyright © 2008 Florida Department of Education

FCAT08_LL_Sci_r9d1 5/6/08 4:39 PM Page 111
Grade 11 Cluster 4 Item #3 10SCH141E0870
Scientific Thinking RESULTS BY CLUSTER Grade 11 LESSONS LEARNED
The following is an extended-response task and an example of a top-score response.
Sample Item 35
READ INQUIRE EXPLAIN
Marcus is conducting an experiment. He wants to verify the law of conservation of mass which states that the mass of the reactants in a chemical reaction should equal the mass of the products. He knows that baking soda and vinegar react to form a gas. He designs an experiment using vinegar, baking soda, plastic zipper bags, a graduated cylinder, and a balance.
What procedure should Marcus follow to test his hypothesis?
An explanation similar to the following received a score of 4 points:
Marcus should first place the reactants, the vinegar and baking soda, into
separate plastic bags. These bags should be placed in a bag and then
sealed. Using the balance, the mass of the reactants and the plastic bags
should be recorded. Next, the bags containing the reactants should be
opened to allow the reaction to occur without breaking the seal of the
larger bag. After the reaction has taken place, the mass of the products
and the plastic bags should be recorded using the balance.
Most recent student results 3% earned 4 points 6% earned 3 points
21% earned 2 points 18% earned 1 point 34% earned 0 points
Cluster 4
Copyright © 2008 Florida Department of Education | FCAT Science Lessons Learned 111

FCAT08_LL_Sci_r9d1 5/6/08 4:39 PM Page 112
RESULTS BY CLUSTER Scientific ThinkingLESSONS LEARNED Grade 11
Grade 11: Implications for Instruction for Reporting Cluster 4—Scientific Thinking
The Lessons Learned task force recommends that students practice designing experiments and using the scientific method throughout the science course. Teachers should incorporate the scientific method through more inquiry-based activities. Critical thinking skills should be emphasized during instruction so that students can make connections between practice and theory. Students should understand that data may not always support the hypothesis and why this may occur. When this occurs, students should be able to determine the next appropriate steps (i.e., understanding the scientific process). Teachers should provide students more practice with writing lab reports to analyze data (using a variety of formats), form conclusions, and conduct peer reviews. Finally, instruction should use current events to increase awareness of new technologies and applications of technology in routine tasks. This should include discussions on how science has influenced the development of technology and how existing technology can be applied to other situations.
Clus
ter 4
112 FCAT Science Lessons Learned | Copyright © 2008 Florida Department of Education

FCAT08_LL_Sci_r9d1 5/6/08 4:39 PM Page 113
Lessons LearnedCONCLUSION
FCAT Science Lessons Learned Task Force Conclusions
In reviewing this report, many educators may likely see the performance of their own students reflected in the results of the data analysis and in the findings of the task force. Subsequently, the Lessons Learned report can be used to support what educators may have already suspected was occurring across the state in some areas. The task force recognized that some things educators believe to be occurring within their classrooms during instruction were not reflected in the data analyses presented in this report. It is important to keep in mind that the recommendations presented in this report are based upon the data, rather than on personal experiences of educators within Florida classrooms.
Across grades, the task force made the following observations and suggestions:
• Although there have been improvements in student performance in science, the task force has identified that students continue to struggle with developing a deeper understanding of scientific concepts. Students need more practice in demonstrating and explaining, especially in writing, scientific concepts, and scientific processes.
• Teachers should provide a broader focus on scientific concepts and processes in a “big picture” sense and not overemphasize the parts of the scientific concepts and processes. In other words, whole systems, such as the water cycle, must be taught so that students can explain the entire system starting at any given point within the system; otherwise, students can only explain the parts in isolation.
• As revealed through the data, common misconceptions still hamper students’ ability to demonstrate full scientific knowledge. Teachers should modify instruction to address these misconceptions, especially after classroom assessments reflect these misconceptions.
• Science instruction should provide additional opportunities for students to relate scientific concepts and processes to real-world situations and provide applications to enhance the depth of understanding achieved by the students.
Copyright © 2008 Florida Department of Education | FCAT Science Lessons Learned 113

FCAT08_LL_Sci_r9d1 5/6/08 4:39 PM Page 114
CONCLUSION LESSONS LEARNED
• Instruction should integrate the use of the scientific process or nature of science (Strand H) throughout the other reporting clusters. Students should have the opportunity to conduct hands-on experiments in all areas of science, with analysis and reflection to emphasize the concepts and cause-and-effect relationships.
• Teachers should model the use of correct science terminology, especially when the science term differs in meaning from its everyday usage (e.g., work). Instruction should include using terms interchangeably when appropriate so that students are familiar with variation in scientific language (e.g., transformations and conversions).
This summary information, as well as the additional details provided throughout Lessons
Learned, is intended to provide educators with information that can further support the continuation of existing initiatives and possibly re-target programmatic change focused on addressing new issues.
114 FCAT Science Lessons Learned | Copyright © 2008 Florida Department of Education
FCAT08_LL_Sci_r9d1 5/6/08 4:39 PM Page 115
Lessons Learned FCAT SCIENCEREFERENCES
Copyright © 2008 Florida Department of Education | FCAT Science Lessons Learned 115
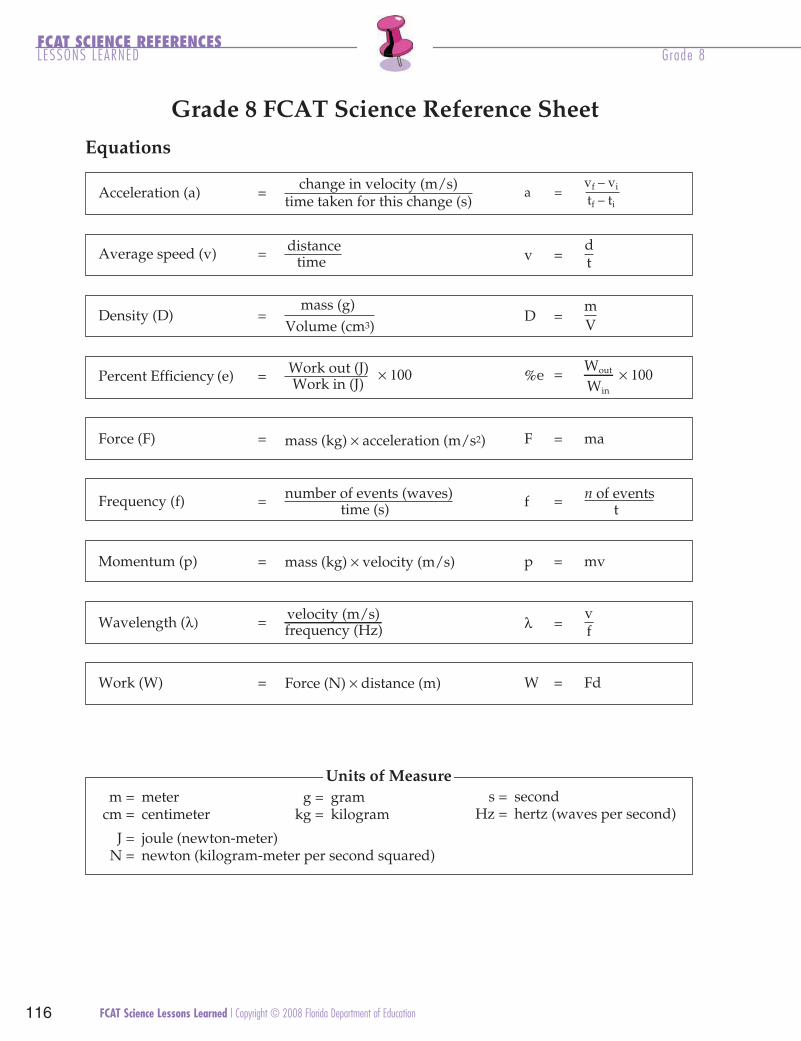
FCAT08_LL_Sci_r9d1 5/6/08 4:39 PM Page 116
Grade 8 FCAT Science Reference Sheet
Equations
Acceleration (a)
Average speed (v)
Density (D)
Percent Efficiency (e)
=
=
=
=
change in velocity (m/s) time taken for this change (s)
distance time
mass (g) Volume (cm3)
Work out (J) Work in (J)
× 100
a vf – vi
tf – ti =
v d t =
D = m V
=%e Wout
Win
× 100
Force (F) = mass (kg) × acceleration (m/s2) F = ma
Frequency (f) = number of events (waves) f = n of events time (s) t
Momentum (p) = mass (kg) × velocity (m/s) p = mv
Wavelength (λ) = velocity (m/s) frequency (Hz) λ =
v f
Work (W) = Force (N) × distance (m) W = Fd
Units of Measure m = meter g = gram s = second cm = centimeter kg = kilogram Hz = hertz (waves per second)
J = joule (newton-meter) N = newton (kilogram-meter per second squared)
FCAT SCIENCE REFERENCES LESSONS LEARNED Grade 8
116 FCAT Science Lessons Learned | Copyright © 2008 Florida Department of Education

FCAT08_LL_Sci_r9d1 5/6/08 4:39 PM Page 117
Grade 11 FCAT Science Reference Sheet
Equations
Acceleration (a)
Average speed (v)
Density (D)
Percent Efficiency (e)
=
=
=
=
change in velocity (m/s) time taken for this change (s)
distance time
mass (g) Volume (cm3)
Work out (J) Work in (J) × 100
a vf – vi tf – ti
=
v d t =
D = m V
%e = Wout
Win × 100
Force (F) = mass (kg) × acceleration (m/s2) F = ma
number of events (waves) n of eventsFrequency (f) = f = time (s) t
Momentum (p) = mass (kg) × velocity (m/s) p = mv
Pressure (P)
Wavelength (λ)
=
=
Force (N) area (m2)
velocity (m/s) frequency (Hz)
P
λ
=
=
F A
v f
Work (W) = Force (N) × distance (m) W = Fd
Units of Measure m = meter g = gram s = second
cm = centimeter kg = kilogram Hz = hertz (waves per second)
J = joule (newton-meter)N = newton (kilogram-meter per second squared)
1 Astronomical Unit (AU) = distance between Earth and the Sun (approximately 150 million kilometers)
FCAT SCIENCE REFERENCES Grade 11 LESSONS LEARNED
Copyright © 2008 Florida Department of Education | FCAT Science Lessons Learned 117

FCAT08_LL_Sci_r9d1 5/6/08 4:39 PM Page 118
Per
iod
ic T
able
of
the
Ele
men
ts
(bas
ed o
n 1 62
C =
12.
0000
)R
epre
sen
tati
ve
Gro
up
E
lem
ents
1
18
1 2 3 4 5 6 7
85 09 hT
muir
oh
T
eC
muire
C21.041
830.232
06
dN
mui
myd
oeN
42.44129 U m
uinar
U920.832
16 mP
mui
htem
orP
319.44139
pN
mui
nut
peN
840.732
26 mS
muira
maS
63.05149
uP
mui
not
ulP
460.442
36
uE
mui
por
uE
69.15159 m
Am
uicirem
A160.342
46
dG
mui
nilo
daG
52.75169 m
Cm
uiru
C070.742
56 bT
mui
breT
529.85179
kB
muilekre
B070.742
66
yD
muis
orpsy
D05.261
89
fC
mui
nrofila
C080.152
76
oH
mui
mlo
H039.461
99
sE
mui
nietsni
E380.252
86
rE
mui
brE
62.761001 m
Fm
uimre
F590.752
96 mT
muil
uh
T439.861
101
dM
muivele
dne
M990.852
07
bY
mui
brettY
40.371201
oN
muile
bo
N101.952
17 uL
muitet
uL
769.471301
rL
muic
nerwa
L501.062
95
rP
mui
myd
oesarP
809.041
19
aP
mui
nitcator
P630.132
1 H ne
gor
dyH
800.1
11
aN
mui
do
S099.22
91 K muissat
oP
890.93
73
bR
mui
dib
uR
864.58
55
sC
muise
C509.231
78
rF
muic
narF
3223
iL
mui
htiL
149.6
21
gM
muise
nga
M503.42
02
aC
muicla
C870.04
83
rS
muit
nort
S26.78
65
aB
muira
B723.731
88
aR
mui
daR
520.622
75
aL
mu
naht
naL
509.831
98
cA
mui
nitcA
820.722
401
fR
muidrofrehtuR
)162(
501
bD
mui
nb
uD
)262(
601
gS
mui
gro
baeS
)362(
701
hB
muir
ho
B)462(
801
sH
muissa
H)562(
901
tM
muire
ntieM
)862(
22
iT
mui
natiT
88.74
04
rZ
mui
nocri
Z422.19
27
fH
mui
nfaH
94.871
32 V mui
dana
V249.05
14
bN
mui
boi
N609.29
37
aT
mulat
naT
849.081
42
rC
mui
mor
hC
699.15
24
oM
mu
ned
bylo
M49.59
47 W nets
gn
uT
58.381
52
nM
esena
gna
M839.45
34
cT
muite
nhce
T89 57
eR
mui
neh
R702.681
62
eF
norI
748.55
44
uR
mui
neht
uR
70.101
67
sO
mui
msO
2.091
72
oC
tlab
oC
339.85
54
hR
mui
do
hR
609.201
77 rIm
uidirI
22.291
82
iN
lekciN
396.85
64
dP
mui
dallaP
24.601
87
tP
mu
nitalP
80.591
92
uC
rep
po
C645.36
74
gA
31
lA
mu
nim
ulA
289.62
eH
muile
H300.4
A22
A331
A441
A551
A661
A771
680.82
revliS
868.701
97
uA
dlo
G769.691
03 nZ
cni
Z93.56
84
dC
mui
mda
C114.211
08
gH
yrucre
M95.002
13
aG
muilla
G327.96
94 nIm
uid
nI28.411
5
eB
Bn
oro
Bm
uillyreB
18.01
18
lT
muilla
hT
383.402
23
eG
mui
namre
G16.27
05
nS
niT
017.811
41
iS
nocili
S680.82
6 C n
obra
C110.21
28
bP
daeL
2.702
33
sA
cinesr
A229.47
15
bS
yn
omit
nA
757.121
51 P s
uro
hps
oh
P479.03
7 N ne
gorti
N700.41
38
iB
htu
msiB
089.802
43
eS
mui
neleS
69.87
25
eT
muir
ulleT
06.721
61 Sr
uflu
S60.23
8 One
gyxO
999.51
48
oP
mui
nol
oP
289.802
53
rB
eni
mor
B409.97
35 I eni
doI
509.621
71
lC
enir
olh
C354.53
9 F enir
oul
F899.81
58
tA
enitats
A012
63
rK
not
pyrK
08.38
45
eX
no
neX
92.131
81
rA
no
grA
849.93
01
eN
noe
N081.02
2 68
nR
no
daR
222
12
cS
mui
dnac
S659.44
93 Y m
uirttY
609.88
4
210.9
A1
3 B4
B34
5 6
019
87
seirese
dina
htna
L
B5B6
B7B1
2111
B2
A8
B8
slatem
no
Nslate
M
slateM
noitis
narT
ren
nI
slateM
noitis
narT
41
iS
nocili
S
reb
mu
nci
mot
A
lo
bmy
Se
maN
ssaM
cim
otA
Period
Act
inid
e se
ries
FCAT SCIENCE REFERENCES LESSONS LEARNED Grades 5 , 8 , and 11
118 FCAT Science Lessons Learned | Copyright © 2008 Florida Department of Education

FCAT08_LL_Sci_r9d1 5/6/08 4:39 PM Page 119
FCAT SCIENCE REFERENCES Grades 5 , 8 , and 11 LESSONS LEARNED
FCAT Science Short-Response Rubric
READ INQUIRE EXPLAIN
General Short-Response Scoring Rubric
2 points A score of two indicates that the student has demonstrated a thorough understanding of the scientific concepts and/or procedures embodied in the task. The student has completed the task correctly, in a scientifically sound manner. When required, student explanations and/or interpretations are clear and complete. The response may contain minor flaws that do not detract from the demonstration of a thorough understanding.
1 point A score of one indicates that the student has provided a response that is only partially correct. For example, the student may arrive at an acceptable conclusion or provide an adequate interpretation, but may demonstrate some misunderstanding of the underlying scientific concepts and/or procedures. Conversely, a student may arrive at an unacceptable conclusion or provide a faulty interpretation, but could have applied appropriate and scientifically sound concepts and/or procedures.
0 points A score of zero indicates that the student has not provided a response or has provided a response that does not demonstrate an understanding of the scientific concepts and/or procedures embodied in the task. The student’s explanation may be uninterpretable, lack sufficient information to determine the student’s understanding, contain clear misunderstandings of the underlying scientific concepts and/or procedures, or may be incorrect.
Copyright © 2008 Florida Department of Education | FCAT Science Lessons Learned 119
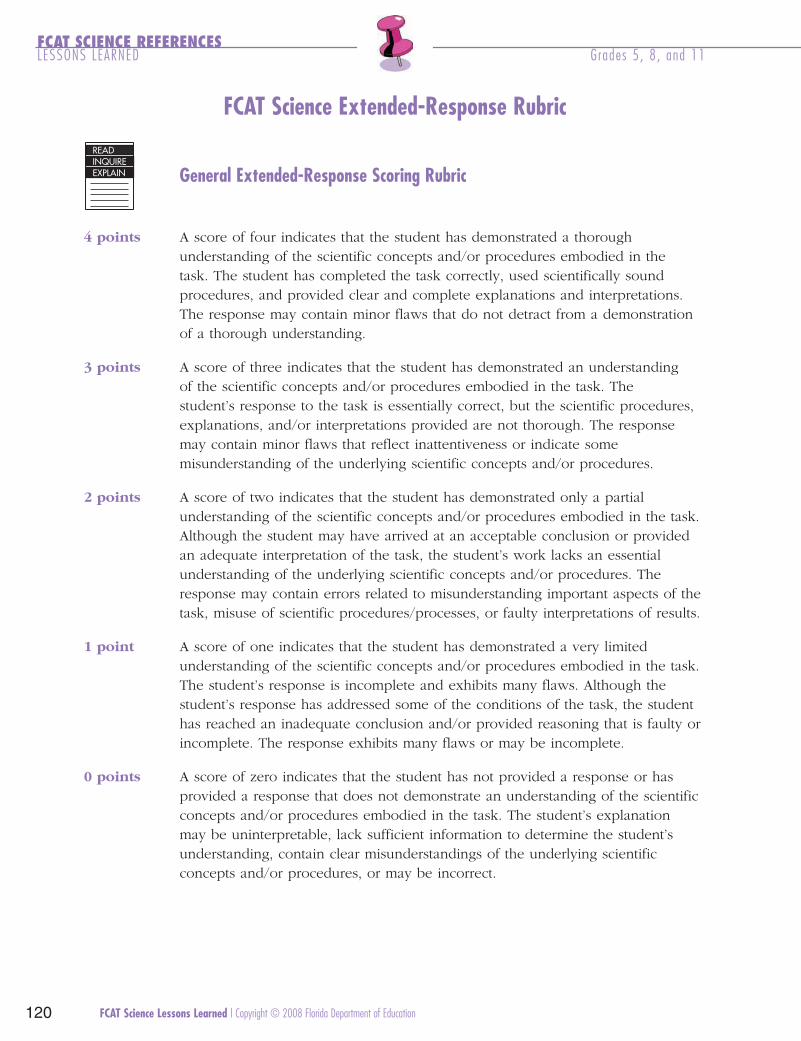
FCAT08_LL_Sci_r9d1 5/6/08 4:39 PM Page 120
FCAT SCIENCE REFERENCES LESSONS LEARNED Grades 5 , 8 , and 11
FCAT Science Extended-Response Rubric
READ INQUIRE EXPLAIN General Extended-Response Scoring Rubric
4 points A score of four indicates that the student has demonstrated a thorough understanding of the scientific concepts and/or procedures embodied in the task. The student has completed the task correctly, used scientifically sound procedures, and provided clear and complete explanations and interpretations. The response may contain minor flaws that do not detract from a demonstration of a thorough understanding.
3 points A score of three indicates that the student has demonstrated an understanding of the scientific concepts and/or procedures embodied in the task. The student’s response to the task is essentially correct, but the scientific procedures, explanations, and/or interpretations provided are not thorough. The response may contain minor flaws that reflect inattentiveness or indicate some misunderstanding of the underlying scientific concepts and/or procedures.
2 points A score of two indicates that the student has demonstrated only a partial understanding of the scientific concepts and/or procedures embodied in the task. Although the student may have arrived at an acceptable conclusion or provided an adequate interpretation of the task, the student’s work lacks an essential understanding of the underlying scientific concepts and/or procedures. The response may contain errors related to misunderstanding important aspects of the task, misuse of scientific procedures/processes, or faulty interpretations of results.
1 point A score of one indicates that the student has demonstrated a very limited understanding of the scientific concepts and/or procedures embodied in the task. The student’s response is incomplete and exhibits many flaws. Although the student’s response has addressed some of the conditions of the task, the student has reached an inadequate conclusion and/or provided reasoning that is faulty or incomplete. The response exhibits many flaws or may be incomplete.
0 points A score of zero indicates that the student has not provided a response or has provided a response that does not demonstrate an understanding of the scientific concepts and/or procedures embodied in the task. The student’s explanation may be uninterpretable, lack sufficient information to determine the student’s understanding, contain clear misunderstandings of the underlying scientific concepts and/or procedures, or may be incorrect.
120 FCAT Science Lessons Learned | Copyright © 2008 Florida Department of Education

FCAT08_LL_Sci_r9d1 5/6/08 4:39 PM Page 121
Lessons Learned FCAT RESOURCES
FCAT Publications and Products
The Department of Education (DOE) produces many materials to help educators, students, and parents better understand the FCAT program. A list of FCAT-related publications and products is provided below. Additional information about the FCAT program is available on the FCAT home page of the DOE website at http://fcat.fldoe.org.
About the FCAT Web Brochures These web-based brochures in English, Spanish, and Haitian Creole are found on the DOE website at http://fcat.fldoe.org/fcatpub3.asp. They provide information about FCAT Reading, Writing, Mathematics, and Science for Grades 3–11 and link the reader to other helpful DOE web resources.
Assessment & Accountability Briefing Book This book provides an overview of Florida’s assessment, school accountability, and teacher certification programs. FCAT topics include frequently asked questions, content assessed by the FCAT, and test reliability and validity. This booklet can be downloaded from the DOE website at http://fcat.fldoe.org/fcatpub1.asp.
FCAT Handbook—A Resource for Educators This publication provides the first comprehensive look at the FCAT, including history, test content, test format, test development and construction, test administration, and test scoring and reporting. Educator involvement is emphasized by detailing how Florida teachers and administrators participate in reviewing test items, determining how standards should be assessed, finding ranges of scores, and providing input on aspects of the test administration process. The PDF version is available on the DOE website at http://fcat.fldoe.org/handbk/fcathandbook.asp.
Copyright © 2008 Florida Department of Education | FCAT Science Lessons Learned 121

FCAT08_LL_Sci_r9d1 5/6/08 4:39 PM Page 122
FCAT RESOURCES LESSONS LEARNED
FCAT Myths vs. Facts By providing factual information about the FCAT program, this brochure addresses common myths about the FCAT. This brochure is also available in Spanish and can be downloaded from the DOE website at http://fcat.fldoe.org/fcatpub3.asp.
FCAT Posters Elementary, middle, and high school FCAT Reading, Writing, Science, and Mathematics posters have an instructional focus. Two additional posters provide information about Achievement Levels and which FCAT tests are given at each grade. A high school poster reminds students about the graduation requirement to pass the FCAT Reading and Mathematics tests and the multiple opportunities available to retake the tests. Posters were delivered to Florida school districts in 2005; limited numbers of these posters are still available from the DOE Assessment office.
FCAT Released Tests Reading, Grades 3–10 Mathematics, Grades 3–10 Science, Grades 8 and 11
Since 2005, the DOE has released previously used full tests of the FCAT Reading, FCAT Mathematics, and FCAT Science. These web-based releases have included not only the tests, but also several other important documents, including test books, answer keys, How to Use the FCAT
Released Tests, How to Score the FCAT Released Tests, and Frequently Asked Questions About the
FCAT Released Tests. These supplemental materials provide many important details about the FCAT, including the range of correct answers and points needed for each Achievement Level. All materials are available on the DOE website at http://fcat.fldoe.org/fcatrelease.asp.
FCAT Results Folder: A Guide for Parents and Guardians This folder is designed for parents and guardians of students in Grades 3–11. It provides information about FCAT student results and allows parents to store student reports for future reference. Spanish and Haitian Creole versions are available. After several years of distribution to all students, in 2008, the DOE distributed the folder to only Grade 3 students. Annual delivery coincides with the spring delivery of student reports.
122 FCAT Science Lessons Learned | Copyright © 2008 Florida Department of Education

FCAT08_LL_Sci_r9d1 5/6/08 4:39 PM Page 123
FCAT RESOURCES LESSONS LEARNED
FCAT Test Item Specifications Reading, Grade Levels 3–5, 6–8, and 9–10 Mathematics, Grade Levels 3–5, 6–8, and 9–10 Science, Grades 5, 8, and 10/11
Defining both the content and the format of the FCAT test questions, the Specifications primarily serve as guidelines for item writers and reviewers, but they also contain information for educators and the general public. The Specifications are based on the Florida standards and are designed to be broad enough to ensure test items are developed in several formats to measure the concepts presented in each benchmark. These materials can be downloaded from the DOE website at http://fcat.fldoe.org/fcatis01.asp.
Florida Reads! Report on the 2007 FCAT Reading Released Items (Grades 4, 8 & 10) Florida Solves! Report on the 2007 FCAT Mathematics Released Items (Grades 5, 8 & 10) Florida Inquires! Report on the 2007 FCAT Science Released Items (Grades 5, 8 & 11) These reports provide information about the scoring of the FCAT Reading, Mathematics, and Science performance tasks displayed on the 2007 student reports. Florida Reads! combines Grades 4, 8, and 10 in one document; Florida Solves! covers Grades 5, 8, and 10; and Florida Inquires!
includes Grades 5, 8, and 11. Reports from 2006 and 2007 are posted to the DOE website at http://fcat.fldoe.org/fcatflwrites.asp. The DOE will not produce the print publications in 2008 and beyond, but much of the information related to scoring is included on the Florida Reads! Writes!
Solves! Inquires! CD distributed annually to districts for training purposes.
Florida Reads! Writes! Solves! Inquires! CD (FRWSI CD) The FRWSI CD provides educators with the annotated papers used to train handscorers for the released FCAT Writing prompts and released FCAT Reading, Mathematics, and Science short-response items on the individual student reports. For each featured item, the CD provides the item as it appeared on the test, a top-score response for that item, images of student responses, and annotated training papers from the anchor set and one qualifying set. The CD includes reading, writing, mathematics, and science on a single CD and provides general information about FCAT performance tasks, the FCAT handscoring process, scoring rubrics, and FCAT resources. This CD is produced annually and delivered to districts in July.
Copyright © 2008 Florida Department of Education | FCAT Science Lessons Learned 123

FCAT08_LL_Sci_r9d1 5/6/08 4:39 PM Page 124
FCAT RESOURCES LESSONS LEARNED
Florida Writes! Report on the 2007 FCAT Writing+ Assessment, Grade 4 Florida Writes! Report on the 2007 FCAT Writing+ Assessment, Grade 8 Florida Writes! Report on the 2007 FCAT Writing+ Assessment, Grade 10 Each grade-level publication describes the content and application of the prompt portion of the 2007 FCAT Writing+ tests and offers suggestions for activities that may be helpful in preparing students for the draft writing assessment. Reports from 2006 and 2007 are posted to the DOE website at http://fcat.fldoe.org/fcatflwrites.asp. The DOE will not produce the print publications in 2008 and beyond, but much of the information related to scoring is included on the Florida
Reads! Writes! Solves! Inquires! CD distributed annually to districts for training purposes.
Frequently Asked Questions About FCAT This brochure provides answers to frequently asked questions about the FCAT program and is available on the DOE website at http://fcat.fldoe.org/fcatpub3.asp.
Keys to FCAT, Grades 3–5, 6–8, and 9–11 These booklets are distributed each January and contain information for parents and students preparing for FCAT Reading, Writing, Mathematics, and Science. Keys to FCAT are translated into Spanish and Haitian Creole and are available, along with the English version, on the DOE website at http://fcat.fldoe.org/fcatkeys.asp.
Lessons Learned—FCAT, Sunshine State Standards and Instructional Implications The original Lessons Learned provided analyses of FCAT Reading, Writing, and Mathematics results based on state-level data through 2000. The next two volumes in the Lessons Learned
series, FCAT Reading Lessons Learned: 2001–2005 Data Analysis and Instructional Implications
and FCAT Mathematics Lessons Learned: 2001–2005 Data Analysis and Instructional
Implications, were delivered to districts in November 2007. This publication, FCAT Science
Lessons Learned: 2003–2006 Data Analysis and Instructional Implications, is the fourth book in the Lessons Learned series. All Lessons Learned publications are available on the DOE website at http://fcat.fldoe.org/lessonslearned.asp.
Sample Test Materials for the FCAT Reading and Mathematics, Grades 3–10 Science, Grades 5, 8, and 11
These materials are produced and distributed each fall for teachers to use with students. The student’s test booklet contains practice questions and hints for answering them. For each question, the teacher’s answer key provides the correct answer, an explanation for the correct answer, and indicates the assessed SSS benchmark. These booklets are available in PDF format on the DOE website at http://fcat.fldoe.org/fcatsmpl.asp.
124 FCAT Science Lessons Learned | Copyright © 2008 Florida Department of Education

FCAT08_LL_Sci_r9d1 5/6/08 4:39 PM Page 125
FCAT RESOURCES LESSONS LEARNED
The New FCAT NRT: Stanford Achievement Test, Tenth Edition (SAT10) This brochure outlines differences between the previous FCAT NRT (SAT9) and the current FCAT NRT (SAT10). It is available in PDF format on the DOE website at http://fcat.fldoe.org/fcatpub2.asp.
Understanding FCAT Reports This booklet provides information about the FCAT student, school, and district reports for the most recent test administration. Sample reports, explanations about the reports, and a glossary of technical terms are included. Distribution to districts is scheduled to coincide with the delivery of student reports each May. The booklet can be downloaded from the DOE website at http://fcat.fldoe.org/fcatpub2.asp.
What every teacher should know about FCAT This document provides suggestions for all subject-area teachers to use in helping their students be successful on the FCAT. It can be downloaded from the DOE website at http://fcat.fldoe.org/fcatpub2.asp.
Copyright © 2008 Florida Department of Education | FCAT Science Lessons Learned 125

FCAT08_LL_Sci_r9d1 5/6/08 4:39 PM Page 126
FCAT RESOURCES LESSONS LEARNED
Online FCAT Data ResourcesFCAT Scores and Reports for schools, districts, and the state for all test administrations are accessible from the DOE website at http://fcat.fldoe.org/fcatscor.asp.
FCAT Technical Reports are available on the DOE website at http://fcat.fldoe.org/fcatpub2.asp.
The FCAT Demographic Results website, located at http://www.fcatresults.com/demog/ , provides searches on school-, district-, and state-level data. The site currently hosts data for FCAT Reading and Mathematics (2000 through 2008) and FCAT Writing (2001 through 2008).
School Grades and Accountability Reports are available on the DOE website at http://schoolgrades.fldoe.org/.
126 FCAT Science Lessons Learned | Copyright © 2008 Florida Department of Education

FCAT08_LL_Sci_r9d1 5/6/08 4:39 PM Page 127

FCAT08_LL_Sci_r9d1 5/6/08 4:39 PM Page 128

FCAT08_LL_Sci_r9d1 5/6/08 4:39 PM Page 129

FCAT08_LL_Sci_r9d1 5/6/08 4:39 PM Page 130

FCAT08_LL_Sci_r9d1 5/6/08 4:39 PM Page 131

FCAT08_LL_Sci_r9d1 5/6/08 4:39 PM Page 132

less
ons lear
ned
999-8570-67-0
FCAT Science Lessons Learned:2003–2006 Data Analysesand Instructional Implications
Assessment and School PerformanceFlorida Department of Education
Tallahassee, Florida
Copyright © 2008 State of Florida Department of State
FCATScience Lessons Learned:2003–2006 Data Analyses and Instructional Im
plications
FCAT08_LL_Sci_Cvr_fnl2 5/15/08 9:49 AM Page 1
1
2
3
4
5
6
7
8
9
1011
12A
B
C
D
E