Embed Size (px)
Citation preview

001
C M Y K
Fiscal Year Ended
Traded
Stock Code
March 31, 2013
TSE1
7296
F.C.C. CO., LTD.
YUHO REPORTAnnual
7000-36, Nakagawa, Hosoe-cho, Kita-ku, Hamamatsu-shi, Shizuoka, 431-1394, JapanTelephone: 81-53-523-2400Facsimile: 81-53-523-2405URL: http://www.fcc-net.co.jp/
Printed in Japan
F.C.C. CO., LTD.

YUHOREPORT
F.C.C. CO., LTD.
Fiscal Year Ended March 31, 2013
Traded TSE1
Stock Code 7296

F . C . C . C O . , L T D .
2
This report is based on the Company’s Japanese-language annual filing with the Financial Services Agency and supplemented with materials that facilitate comparison with the Company’s peers. The materials from the annual filing with the Financial Services Agency have been edited and reorganized in a format more familiar to the international investment community. All information contained in this report has been obtained from sources believed to be reliable, but the accuracy of the data and the translation and the completeness and timeliness of the information are not warranted by the Company, Pacific Associates, or PRONEXUS. None of the above parties shall be responsible for any error or omission or for results obtained from the use of this information. Also, because a reporting company may sometimes request that terminology be tailored as closely as possible to the XBRL taxonomy, this report may contain English expressions that are incorrect.
Table of Contents COMPANY PROFILE.......................................................................................................................... 3
Financial highlights ...........................................................................................................................................3 Peer comparisons.............................................................................................................................................3
BUSINESS OVERVIEW ..................................................................................................................... 4 Description of business ....................................................................................................................................4 Group companies .............................................................................................................................................5 History...............................................................................................................................................................6 Risk factors .......................................................................................................................................................7 Research and development..............................................................................................................................8 Analysis of financial condition and results of operations ................................................................................10 Corporate governance....................................................................................................................................15 Directors .........................................................................................................................................................22 Employees ......................................................................................................................................................23 Unions.............................................................................................................................................................24
CASH FLOWS.................................................................................................................................. 25 Consolidated statements of cash flows ..........................................................................................................25 Capital expenditures.......................................................................................................................................27 Dividend policy................................................................................................................................................29
OPERATIONS................................................................................................................................... 30 Consolidated statements of income ...............................................................................................................30 Consolidated statements of comprehensive income......................................................................................31 Consolidated statements of changes in net assets ........................................................................................32 Results of operations......................................................................................................................................34 Segment information ......................................................................................................................................36 Issues requiring action....................................................................................................................................39 Production and sales ......................................................................................................................................40
CAPITAL STRUCTURE.................................................................................................................... 41 Consolidated balance sheets .........................................................................................................................41 Market value of securities...............................................................................................................................43 Facilities..........................................................................................................................................................44 Borrowings......................................................................................................................................................45 Retirement benefits.........................................................................................................................................45 Deferred taxes ................................................................................................................................................47
RELATED PARTIES ......................................................................................................................... 48 NON-CONSOLIDATED FINANCIAL STATEMENTS ....................................................................... 49
Non-consolidated statements of income ........................................................................................................49 Non-consolidated statements of changes in net assets .................................................................................51 Cost of goods sold..........................................................................................................................................54 Non-consolidated balance sheets ..................................................................................................................55 Trade credits ...................................................................................................................................................58 Securities ........................................................................................................................................................60 Property, plant and equipment........................................................................................................................62 Allowances......................................................................................................................................................63
ACCOUNTING POLICIES ................................................................................................................ 64 SHARE-RELATED INFORMATION.................................................................................................. 66 YUHOREPORT is a trademark of Pacific Associates and PRONEXUS. The translation is copyrighted by Pacific Associates.

F . C . C . C O . , L T D .
3
Company Profile Financial highlights Years ended March 31; Millions of yen 2009 2010 2011 2012 2013
Change 2013/2009
Consolidated
Net sales 121,279 96,943 117,621 117,068 126,245 104%
Ordinary income 7,867 6,075 12,672 11,494 13,124 167%
Net income 3,882 2,250 8,041 7,276 7,942 205%
Comprehensive income - - 5,518 6,244 17,707
Net assets 73,124 73,792 77,268 81,208 97,491 133%
Total assets 93,560 94,634 98,531 103,937 122,258 131%
Net assets per share (Yen) 1,292.91 1,350.16 1,412.95 1,497.72 1,780.34 138%
Net income per share (Yen) 74.30 44.10 160.23 144.98 158.26 213%
Net income per share, fully diluted (Yen) - - - - -
Net cash provided by (used in) operating activities
10,989 9,619 14,991 12,360 13,491 123%
Net cash provided by (used in) investing activities
(8,607) (3,701) (5,350) (10,309) (11,355)
Net cash provided by (used in) financing activities
(4,218) (5,410) (1,657) (3,204) (2,176)
Cash and cash equivalents at end of period
14,654 15,473 22,545 20,591 23,369 159%
Employees 5,778 5,717 5,701 5,946 7,011 121%
Peer comparisons Years ended March 31 2009 2010 2011 2012 2013
Net income / net sales (%) 3.2 2.3 6.8 6.2 6.3
Peers (1.8) 0.2 3.7 2.9 2.5
Ordinary income / net sales (%) 6.5 6.3 10.8 9.8 10.4
Peers 0.8 2.6 6.3 5.5 4.9
Net income / assets (%) 3.8 2.4 8.3 7.2 7.0
Peers (2.2) 0.7 4.7 3.6 2.8
Ordinary income / assets (%) 7.6 6.5 13.1 11.4 11.6
Peers 1.2 3.4 8.0 6.7 5.8
Equity / assets (%) 71.4 71.6 72.0 72.3 73.1
Peers 41.7 40.5 42.8 43.1 45.1
Net income / equity (%) 5.5 3.4 11.6 10.0 9.7
Peers (8.5) 0.4 12.1 8.8 5.8
Peers include 49 motorcycle and automobile parts manufacturers in the transportation equipment industry listed on the First and Second sections of the TSE.

F . C . C . C O . , L T D .
4
Business Overview
Description of business
The FCC Group, comprising the Company and 23 subsidiaries, is engaged in the manufacture and sales of clutches for motorcycles and automobiles.
The following breaks down the FCC Group’s businesses into its operating segments, and indicates where each company falls within those segments.
Motorcycle clutches
This segment is engaged primarily in the manufacture and sales of clutches for motorcycles, scooters, all-terrain vehicles, and power products; it is also involved in the manufacture and sale of components and parts for motorcycles and automobiles.
Manufacturing KYUSHU F.C.C. CO., LTD.
Manufacturing and sales The Company, TENRYU SANGYO CO., LTD., Tohoku Chemical Industries, Ltd., FCC (PHILIPPINES) CORP. (Philippines), CHU'S F.C.C. CO., LTD. (SHANGHAI) (China), CHENGDU YONGHUA. F.C.C. CLUTCHES CO., LTD. (China), FCC DO BRAZIL LTDA. (Brazil), FCC (THAILAND) CO., LTD. (Thailand), FCC (TAIWAN) CO., LTD. (Taiwan), FCC RICO LTD. (India), FCC (North Carolina), LLC. (United States), PT. FCC INDONESIA (Indonesia), FCC (VIETNAM) CO., LTD. (Vietnam)
Automobile clutches
This segment is engaged primarily in the manufacture and sales of clutches for automatic and manual transmission automobiles.
Manufacturing KYUSHU F.C.C. CO., LTD., FCC (PHILIPPINES) CORP. (Philippines), FCC (North Carolina), LLC. (United States)
Manufacturing and sales The Company, FCC (THAILAND) CO., LTD. (Thailand), FCC RICO LTD. (India), PT. FCC INDONESIA (Indonesia), FCC (INDIANA), LLC. (United States), FCC (Adams), LLC. (United States), CHINA FCC FOSHAN CO., LTD. (China)

F . C . C . C O . , L T D .
5
Group companies
Name Operations
Capital stock Millions of yen or as indicated
Percent ownership
(Consolidated subsidiaries)
KYUSHU F.C.C. CO., LTD. Motorcycle and automobile clutches 30 100
TENRYU SANGYO CO., LTD. Motorcycle clutches 22.5 67.11
Tohoku Chemical Industries, Ltd. Motorcycle clutches 125 100
FCC (North America), INC. Administration of U.S. subsidiaries US$42,800,000 100
FCC (INDIANA), LLC. Automobile clutches US$17,800,000 100*
FCC (North Carolina), LLC. Motorcycle and automobile clutches US$10,000,000 100*
FCC (Adams), LLC. Automobile clutches US$15,000,000 100*
FCC (THAILAND) CO., LTD. Motorcycle and automobile clutches THB60,000,000 58*
FCC (PHILIPPINES) CORP. Motorcycle and automobile clutches PHP200,000,000 100
F.C.C.(China) Investment Co., Ltd. Administration of China subsidiaries US$20,000,000 100
CHENGDU YONGHUA. F.C.C. CLUTCHES CO., LTD.
Motorcycle and automobile clutches US$28,000,000 100*
CHU'S F.C.C. CO., LTD. (SHANGHAI)
Motorcycle clutches US$9,800,000 100
CHINA FCC FOSHAN CO., LTD. Automobile clutches US$18,000,000 87.4*
FCC (TAIWAN) CO., LTD. Motorcycle clutches NT$195,000,000 70*
FCC RICO LTD. Motorcycle and automobile clutches INR79,000,000 50
PT. FCC INDONESIA Motorcycle and automobile clutches US$11,000,000 100*
FCC (VIETNAM) CO., LTD. Motorcycle clutches US$10,000,000 70
FCC DO BRASIL LTDA. Motorcycle clutches BRL31,600,000 100
(Affiliated company) Company stock owned
Shares Percent
HONDA MOTOR CO., LTD. Manufacture and sales of automobiles and engines
86,067 21.68
* The Company owns subsidiaries marked with asterisks indirectly.

F . C . C . C O . , L T D .
6
History Year Month Event
1939 June Fuji Lite Industries Co., Ltd. is established in Sato-cho, Hamamatsu-shi, Shizuoka Prefecture; the Company begins manufacturing clutch plates, gears and other products employing compression molding of Bakelite resins.
1943 March Changes name to Fuji Chemical Co., Ltd.
1982 February Establishes Kyushu Fuji Chemical Industries Co., Ltd. (now KYUSHU F.C.C. CO., LTD., a consolidated subsidiary) in Matsubase-machi, Shimomashiki-gun, Kumamoto Prefecture.
1984 July Changes name to F.C.C. CO., LTD.
1988 July Establishes JAYTEC, INC. (now FCC (INDIANA) LLC., a consolidated subsidiary) in Indiana, U.S.A.
1989 March Establishes FCC (THAILAND) CO., LTD. (now a consolidated subsidiary) in Bangkok, Thailand.
June Moves corporate head office to current address.
1992 September Makes equity investment in KWANG HWA SHING INDUSTRIAL CO., LTD. of Tainan Province, Taiwan.
1993 September Establishes FCC (PHILIPPINES) CORP. (now a consolidated subsidiary) in Laguna, Philippines.
October Acquires shares of TENRYU SANGYO CO., LTD. (now a consolidated subsidiary)
1994 August Registers its shares for OTC trading with the Securities Dealers Association of Japan.
December Establishes CHENGDU JIANG HUA. F.C.C. CLUTCHES. CO., LTD. (now CHENGDU YONGHUA. F.C.C. CLUTCHES CO., LTD., a consolidated subsidiary) in Chengdu, Szechuan Province, China.
1995 March Establishes CHU'S F.C.C. CO., LTD. (SHANGHAI) (now a consolidated subsidiary) in Shanghai, China.
September Establishes FCC (EUROPE) LTD. in Milton Keynes, UK.
1997 April Establishes FCC RICO LTD. (now a consolidated subsidiary) in Haryana, India.
1998 November Establishes FCC DO BRASIL LTDA. (now a consolidated subsidiary) in Amazonas, Brazil.
2000 April Establishes FCC (North Carolina), INC. (now FCC (North Carolina), LLC., a consolidated subsidiary) in North Carolina, U.S.A.
2001 April Establishes PT. FCC INDONESIA (now a consolidated subsidiary) in Karyawan, Indonesia.
2002 December Establishes FCC (North America), INC. (now a consolidated subsidiary) and FCC (INDIANA), INC. (now FCC(INDIANA) LLC.) in Indiana, U.S.A.
2003 February Lists its shares on the Second Section of the Tokyo Stock Exchange.
May Establishes FCC (Adams), LLC. (now a consolidated subsidiary) in Indiana, U.S.A.
2004 March Lists its shares on the First Section of the Tokyo Stock Exchange.
2005 June Increases investment in KWANG HWA SHING INDUSTRIAL CO., LTD. (now FCC (TAIWAN) CO., LTD.), making the company a consolidated subsidiary.
November Establishes FCC (VIETNAM) CO., LTD. (now a consolidated subsidiary) in Hanoi, Vietnam.
2006 January Establishes CHINA FCC FOSHAN CO., LTD. (now a consolidated subsidiary) in Guangdong Province, China.
2010 November Acquires 100% of Tohoku Chemical Industries, Ltd. (now a consolidated subsidiary) in Shinagawa-ku, Tokyo.
2012 September Establishes F.C.C. (China) Investment Co., Ltd. (now a consolidated subsidiary) in Chengdu, Szechuan Province, China.
December Completes liquidation of FCC (EUROPE) LTD.
2013 February Establishes FCC SEOJIN CO., LTD. in Siheung, Gyeonggi Province, Korea.
F . C . C . C O . , L T D .
7
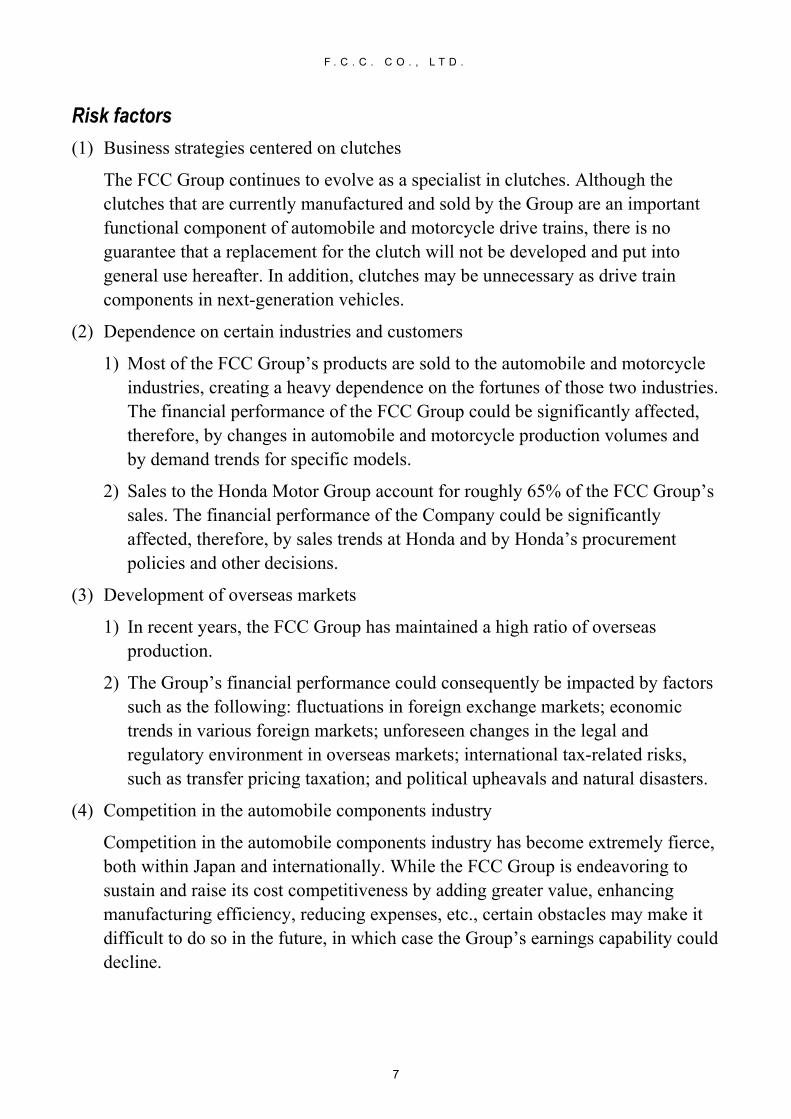
Risk factors
(1) Business strategies centered on clutches
The FCC Group continues to evolve as a specialist in clutches. Although the clutches that are currently manufactured and sold by the Group are an important functional component of automobile and motorcycle drive trains, there is no guarantee that a replacement for the clutch will not be developed and put into general use hereafter. In addition, clutches may be unnecessary as drive train components in next-generation vehicles.
(2) Dependence on certain industries and customers
1) Most of the FCC Group’s products are sold to the automobile and motorcycle industries, creating a heavy dependence on the fortunes of those two industries. The financial performance of the FCC Group could be significantly affected, therefore, by changes in automobile and motorcycle production volumes and by demand trends for specific models.
2) Sales to the Honda Motor Group account for roughly 65% of the FCC Group’s sales. The financial performance of the Company could be significantly affected, therefore, by sales trends at Honda and by Honda’s procurement policies and other decisions.
(3) Development of overseas markets
1) In recent years, the FCC Group has maintained a high ratio of overseas production.
2) The Group’s financial performance could consequently be impacted by factors such as the following: fluctuations in foreign exchange markets; economic trends in various foreign markets; unforeseen changes in the legal and regulatory environment in overseas markets; international tax-related risks, such as transfer pricing taxation; and political upheavals and natural disasters.
(4) Competition in the automobile components industry
Competition in the automobile components industry has become extremely fierce, both within Japan and internationally. While the FCC Group is endeavoring to sustain and raise its cost competitiveness by adding greater value, enhancing manufacturing efficiency, reducing expenses, etc., certain obstacles may make it difficult to do so in the future, in which case the Group’s earnings capability could decline.

F . C . C . C O . , L T D .
8
(5) Compensation for product defects
Although the FCC Group is doing all it can to ensure sufficient quality control, it is not possible to prevent all defects and deficiencies. In addition, large-scale recalls by final assemblers initiated as a result of defects in products supplied by the FCC Group could result in enormous costs to the Group as well as in serious damage to its reputation. In such event, product defect liability could exert a serious impact on both the Group’s financial performance and its financial condition.
(6) Impact of natural disasters, earthquakes, etc.
The FCC Group is enacting measures to minimize the potential effects of work stoppages on its production lines. There is no guarantee, however, that it will be able to fully avoid or ameliorate the impact of work stoppages caused by disasters, electrical outages or other events at its manufacturing facilities. In this respect, the concentration of the Group’s principal manufacturing facilities in western Shizuoka Prefecture is particularly notable, because this area lies within the region that is likely to be affected by the widely predicted Tokai and Tonankai earthquakes. Such a disaster could exert an enormous impact on the Group’s manufacturing facilities and cause a significant reduction in its manufacturing capabilities.
(Note) All forward-looking statements made in items (1) through (6) are based on information available as of the date of submission of the filing with the Financial Services Agency.
Research and development
As a manufacturer of functional components for transportation vehicles, the FCC Group has adopted the basic R&D policy of identifying customer needs and providing products that give customers excellent performance through the application of creative ideas and technologies. Accordingly, it carries out both basic research on friction materials for use in motorcycle, automobile and power equipment clutches and R&D on clutches themselves (including R&D on production technologies for use in their manufacture).
The Group also works on the development of new products by making improvements in existing products and by utilizing the technologies it has accumulated through its experience in manufacturing clutches (and the friction materials employed in the clutches). Among R&D efforts aimed at protecting the environment, it is developing a porous fiber catalytic sheet (“paper catalyst”), which it believes can be employed as a paper catalyst to clean engine exhaust.

F . C . C . C O . , L T D .
9
During the year under review, R&D expenditures amounted to 2,983 million yen.
The following is a summary of R&D activities by segment during the year.
Motorcycle clutches: where the aim is to develop new wet friction materials for motorcycles and dry friction materials for scooters to improve clutch operability and reduce costs.
Principal achievements:
1) In ASEAN, began mass production of pulley assemblies and clutches for commuter-use motorcycles targeting global consumer market
2) Began mass production of clutches for large-displacement sports model motorcycles incorporating the Company’s proprietary A&S technology; also commenced mass production of limited slip differentials for multi-utility vehicles
3) Continued development of new friction materials that offer enhanced product appeal and durability
Paper catalyst:
Continued R&D aimed at expanding applications for paper catalysts, for which mass production began in March 2011. Paper catalysts are currently being used as exhaust filters in power equipment.
R&D expenses in the motorcycle clutch segment amounted to 1,237 million yen.
Automobile clutches: where the aim is to develop new wet friction materials for automatic transmissions (including CVTs) and new dry friction materials for manual transmissions to make clutches more compact, less expensive to manufacture and more fuel efficient.
Principal achievements:
1) Began mass production of a torque limiter for use in hybrid vehicles employing technologies based on the following:
Elements of the Company’s proprietary “segment” method of manufacturing friction plates, and
Methods used to manufacture wet process friction material and wet process clutches developed to enhance the fuel efficiency and durability of automatic transmissions
2) Designed a new clutch for recently developed multi-stage automatic transmissions.

F . C . C . C O . , L T D .
10
R&D expenses in the automobile clutch segment amounted to 1,745 million yen.
Analysis of financial condition and results of operations
(1) Important accounting principles and estimates
The FCC Group’s financial statements are prepared in accordance with accounting standards generally deemed to be fair and appropriate in Japan. In the course of preparing these financial statements, a number of important estimates and suppositions must be made. The following is a discussion of areas in which important judgments are required in the application of accounting principles and in which such judgments have a significant impact on the Group’s financial condition and operating performance.
Retirement benefit expenses and retirement benefit liabilities
To ensure their ability to pay benefits to retiring employees, F.C.C. CO., LTD. and its subsidiaries recognize a provision for retirement benefits based on estimates of retirement benefit liabilities and pension assets as of the end of the fiscal year.
Calculations of retirement benefit expenses rest on a number of assumptions, including assumptions concerning discount rates, rates of pay increases and expected rates of return on investments. The companies take interest rates and other market trends into account to determine discount rates and expected rates of return on investments. Their estimates of rates of pay increases reflect the actual rates of increase as well as their most recent projections.
The Company considers its accounting estimate of retirement benefit liabilities to be an “important accounting estimate.” This is because any change in the assumptions used to estimate this liability could have a material impact on its financial standing and operating performance. Differences in retirement benefit liabilities resulting from such changes in assumptions are amortized over future periods, with these differences reflected in the financial statements for future periods as expenses and liabilities. Although management believes that its current assumptions are appropriate, any changes in these assumptions could exert an effect on retirement benefit expenses and liabilities.

F . C . C . C O . , L T D .
11
(2) Analysis of financial condition
1) Current assets
Current assets at year-end were 62,927 million yen, 7,972 million yen higher than at the end of March 2012. This increase was attributable primarily to an increase in cash and deposits of 3,332 million yen, an increase in inventories of 2,804 million yen and an increase in short-term loans receivable of 478 million yen.
2) Noncurrent assets
Noncurrent assets amounted to 59,330 million yen at year-end, an increase of 10,348 million yen compared to the end of March 2012. A decrease in goodwill led to a 77 million yen decrease in intangible assets, which was more than offset by a 8,795 million yen increase in property, plant and equipment and a 1,630 million yen increase in investments and other assets.
3) Current liabilities
Current liabilities at year-end registered 19,360 million yen, 1,647 million yen greater than at the end of March 2012. Most of this change was accounted for by a 1,375 million yen increase in income taxes payable, which offset declines in notes and accounts payable-trade of 261 million yen, in factoring liabilities of 450 million yen, and in a provision for loss on business liquidation of 336 million yen.
4) Noncurrent liabilities
Noncurrent liabilities at year-end were 5,405 million yen, 390 million yen greater than at the end of March 2012.
5) Net assets
Net assets at year-end were 97,491 million yen, an increase of 16,282 million yen from the end of March 2012. This growth was attributable primarily to a 6,936 million yen increase in retained earnings, a 6,697 million yen increase in foreign currency translation adjustment and a 2,098 million yen increase in minority interests.
(3) Analysis of operating results (year-on-year percentage changes)
1) Net sales
Net sales increased by 7.8% to 126,245 million yen.

F . C . C . C O . , L T D .
12
By segment:
Motorcycle clutches: up 0.5% to 71,004 million yen
Automobile clutches: up 19.0% to 55,240 million yen
Impact of exchange rates when translating sales of overseas subsidiaries into yen:
Negative in the motorcycle clutches segment
Positive in the automobile clutches segment
2) Operating income
Operating income decreased by 0.8% to 10,964 million yen.
By segment:
Motorcycle clutches: down 24.2% to 7,165 million yen
Automobile clutches: up 137.3% to 3,798 million yen
Analysis:
Increase in costs associated with new product launches
Lower sales of high-margined motorcycle clutches as a result of a tightening of consumer loan-related credit controls in Indonesia and Brazil
Declines in the value of the Indonesian, Indian and Brazilian currencies
3) Income before income taxes and minority interests
Income before income taxes and minority interests increased by 15.9%, to 13,073 million yen.
Non-operating accounts: the positive balance increased from 438 million yen to 2,160 million yen as a result of a large swing in foreign exchange gains and losses from a loss of 272 million yen in the year ended March 2012 to a gain of 1,368 million yen in the year ended March 2013.
Extraordinary accounts: decline in extraordinary losses from 217 million yen to 50 million yen
Larger gains on sales of noncurrent assets
Elimination of losses on the liquidation of a British subsidiary recognized in the year ended March 2012

F . C . C . C O . , L T D .
13
4) Net income
Net income increased by 9.2% to 7,942 million yen.
The corporate tax rate on income before income taxes and minority interests increased by 3.92 percentage points to 31.28%.
The reasons for the difference between this rate and normal effective statutory tax rates were as follows:
Effects of motorcycle clutch operations in Indonesia, Brazil and Thailand, which are countries with low corporate tax rates
Effects of automobile clutch operations in China
Exclusion of dividends received from overseas subsidiaries, and credits for foreign taxes paid
(4) Liquidity and sources of funds
The financial policies of the FCC Group revolve around three objectives: generating an appropriate amount of capital for its operations; maintaining an appropriate amount of liquidity; and sustaining a healthy balance sheet. Its basic policy is to fund all capital investments and R&D expenditures from cash generated by operations. During the year, cash flow from operations amounted to 13,491 million yen (up 9.2% from the previous year); cash used in investing activities amounted to 11,355 million yen (up 10.1%); and cash used in financing activities amounted to 2,176 million yen (down 32.1%).
In the year ending March 2014, the Company plans to finance capital investment and R&D primary through cash and cash equivalents on hand and through cash and cash equivalents generated through operations.
1) Research and development
R&D-related expenses during the year amounted to 2,983 million yen (up 1.7% from the previous year).
2) Capital investment
Principal categories of expenditure: at overseas subsidiaries, equipment for the launch of new models and for expansion of manufacturing capacity; in Japan, new equipment for capacity increases on production lines for friction materials, and upgrading of production control systems

F . C . C . C O . , L T D .
14
Capital investment during the year amounted to 11,774 million yen (up 6.5% from the previous year). The breakdown of capital investment by business segment is as follows:
Millions of yen 2013
AmountYear-on-yearcomparison
Motorcycle clutches 5,059 90.5%
Automobile clutches 6,038 123.7%
Segment reporting total 11,097 105.9%
General operations 677 117.7%
11,774 106.5%
(5) Factors exerting a material impact on operating performance and the Group’s responses
The Company’s operating performance is affected by changes in currency rates, and these changes had an impact on net sales, gross profit, operating income, ordinary income, net income and retained earnings. Among efforts to minimize trading risks, the Company is seeking to increase the ratio of local content in manufacturing by overseas subsidiaries and to create an effective system of parts and product sharing among the Group companies.
HONDA MOTOR CO., LTD. and its affiliates accounted for approximately 65% of the Company’s total sales for the year. The Honda group’s product trends and procurement policies consequently exert a significant impact on the Company’s financial performance. The Company is pursuing aggressive efforts to expand its sales outside the Honda group in order to develop a more stable business base. It is also taking steps to strengthen its R&D capabilities in order to expand its new product lineup.
(Note) All forward-looking statements made in items (1) through (5) are based on information available as of the date of submission of the filing with the Financial Services Agency.

F . C . C . C O . , L T D .
15
Corporate governance
Basic policy regarding corporate governance
In the Company’s view, the goals of corporate governance are threefold: to increase returns to all stakeholders who interact with the Company in various capacities, including shareholders, creditors, customers, employees and local community residents; to construct systems that facilitate efficient, ethical management of the Company; and to increase the Company’s corporate value. The Company thus considers fostering better corporate governance to be a critically important task for management, and it is working diligently to achieve it.
(1) Structure of corporate governance
1) Summary of features and systems of corporate governance
The Company’s oversight and auditing functions are carried out by the Board of Directors and Board of Corporate Auditors.
The Board of Directors comprises 11 directors. In addition to making decisions on important matters concerning operations and fulfilling functions required by law, the Board oversees the execution of the Company’s operations.
The Board of Corporate Auditors is composed of four auditors, of whom two are external auditors. In accordance with the auditing policies and divisions of responsibility established by the Board of Corporate Auditors, each auditor audits the performance of the Board of Directors based on his/her participation in Board of Directors’ meetings and in other important meetings and on examinations of the Company’s operations and assets.
2) Reasons for adopting the features and systems of corporate governance described above
In view of its size and the nature of its businesses, the Company has elected to become a “company with corporate auditors.” In addition to providing a means of overseeing and auditing the execution of duties by the directors, the use of corporate auditors enables the Company to create an organization that is in accord with the Company’s basic policy on internal control systems. Of the Company’s four corporate auditors, two are external auditors, who by virtue of their professional knowledge and experience bring an external perspective to the task of auditing. The Company believes that this ensures the maintenance of objectivity and neutrality in its management oversight function.

F . C . C . C O . , L T D .
16
3) Internal control systems
In September 2003, the FCC Group established a set of “Action Guidelines” as a means of fostering enhanced trust among shareholders, customers and local communities and of increasing its corporate value. It is now implementing them on a Group-wide basis.
The Company’s President is responsible for overseeing the operations of the Group as a whole, while the presidents of the various subsidiaries assume these responsibilities for their companies. The Board members in charge of the respective divisions are responsible for establishing, promoting and executing the FCG (“F.C.C. Corporate Governance”) system in their respective divisions.
4) Risk management
A risk management officer is responsible for overseeing risk management for the FCC Group as a whole. A managing director currently performs this role. In addition, in the interest of promoting early detection of potential legal or ethical violations at the level of individual business units, and in the interest of guarding against recurrence should such violations occur, the Group has also established a department to which any Group employee can make proposals concerning improvements in corporate ethics. All such proposals are processed by this department and submitted to the Corporate Ethics Committee. The Corporate Ethics Committee is led by the Corporate Compliance Officer (currently a director) with two other directors also serving on the committee. It is the committee’s job to protect persons who submit proposals and, in cases of serious violations, to investigate the problems and take appropriate corrective action.
In addition, the Group has established an Auditing Office, which is responsible for monitoring the state of regulatory compliance by each business unit and for examining the effectiveness of the risk management mechanisms that have been put into place. The Auditing Office submits its findings directly to the President. The Corporate Auditors and the Board of Corporate Auditors examine the functioning of governance at the overall Group level and make determinations concerning the effectiveness of mechanisms set up to deal with regulatory compliance and risk management.
If an important legal issue arises, or if the Group believes it is faced with a serious regulatory problem, it consults with its outside legal advisers and involves them in all requisite examinations of the issue. In addition to regular

F . C . C . C O . , L T D .
17
financial auditing, the Group consults with its financial auditors on all important accounting-related issues as they arise.
(2) Internal audits and audits by corporate auditors
Internal audits
To protect the Company’s assets, rationalize its management, and improve and enhance its operating efficiency, this office examines whether the organization is being run in accordance with the Company’s policies and plans and in accordance with its directives, orders and regulations. This office’s five staff members (including the Chief Audit Officer) carry out periodic audits of operations in collaboration with the Board of Corporate Auditors and conduct unscheduled audits at the direction of the President.
Audits by corporate auditors
The Company’s four corporate auditors, of whom two are internal auditors (standing) and two are external auditors (non-standing), audit the management performance of the directors, the Company’s system of internal control and other aspects of operations by attending Board of Directors’ meetings, senior management meetings and other important meetings, collaborating closely with the Office of Auditing, and examining the operations and assets of the Company’s divisions and domestic and overseas subsidiaries. Such audits are carried out in accordance with auditing policies, plans and divisions of responsibility established by the Board of Corporate Auditors based on the “Regulations of the Board of Corporate Auditors” and the “Auditing Standards for Corporate Auditors.” The statutory auditors also exchange information and opinions with the financial auditors in an effort to improve the effectiveness and efficiency of their audits.
The Corporate Ethics Committee receives letters and opinions dealing with compliance-related issues through an office responsible for accepting proposals for improving corporate ethics. The corporate auditors examine these documents and follow up on the reported issues during their regular audits. In matters of sufficient importance, the Company-wide Corporate Governance Secretariat (administered by the General Affairs Department) provides occasional updates on the issues concerned on an as-required basis. As concerns financial and accounting-related matters, the corporate auditors are briefed in detail by senior Accounting Department personnel on the Company’s monthly financial results, in addition to its quarterly and annual results.

F . C . C . C O . , L T D .
18
External auditor Masahide Sato is a licensed CPA with abundant knowledge of finance and accounting.
(3) External corporate auditors
The Company has two external corporate auditors, Yoshinori Tsuji and Masahide Sato, neither of whom has any other relationship with the Company—whether personal or based on shareholdings or business transactions.
The function and role of the external auditors is oversight. In this capacity, their aim is to ensure that the directors execute their duties in a manner that is increasingly appropriate and effective.
- The Board of Corporate Auditors establishes auditing policies, auditing plans, and divisions of responsibility based on the “Regulations of the Board of Corporate Auditors” and “Auditing Standards for Corporate Auditors.”
- Guided by these policies, plans and divisions of responsibility, the external auditors audit the management performance of the directors and the Company’s system of internal control by attending Board of Directors’ meetings, collaborating with the Office of Auditing, and examining the operations and assets of the Company’s divisions and domestic and overseas subsidiaries.
- The external auditors also exchange opinions and information with the financial auditors in an effort to improve the effectiveness and efficiency of their audits.
- Further, as noted in the preceding section on Audits by the corporate auditors, the external auditors are briefed when necessary on issues of compliance and finance and accounting by the Company-wide Corporate Governance Secretariat and the Accounting Department.
In selecting external auditors, the primary consideration is independence, but there are no clear standards or policies with regard to selection.
- Mr. Tsuji is an attorney with abundant experience and broad-ranging knowledge of his profession.
- Mr. Sato is a CPA with abundant experience and broad-ranging knowledge of his profession.

F . C . C . C O . , L T D .
19
- In consideration of the high degree of independence and the absence of any conflict of interest between them and the ordinary shareholders, the Company has designated Mr. Tsuji and Mr. Sato as independent auditors in accordance with the provisions established by the Tokyo Stock Exchange Group, Inc., and registered them with said exchange.
The Company has no external directors. It believes that, in corporate governance, the important thing is to have objective and neutral management oversight from external parties. Because the audits by its two external auditors fully provide such oversight, the Company has chosen not to elect external directors.
(4) Compensation paid to directors and corporate auditors
1) Compensation by category of board members, breakdown by type of compensation and number of board members in each category
Amount paid out to board members by type of compensation
Millions of yen Amount paid Compensation Bonuses
Number of board members in each
category
Directors 304 223 80 14
Corporate Auditors (excluding External Corporate Auditors)
45 33 11 3
External Corporate Auditors 7 7 - 2
(Notes)
1. The total amount of directors’ compensation does not include salaries paid to persons who are concurrently directors and employees.
2. At the 78th Ordinary General Meeting of Shareholders held on June 19, 2008, the compensation paid to directors was capped at 500 million yen per year (which, however, does not include salaries paid for work performed as employees).
3. At the 76th Ordinary General Meeting of Shareholders held on June 22, 2006, the compensation paid to corporate auditors was capped at 90 million yen per year.
2) Policy regarding amounts paid to board members and the method of calculation of such amounts
The Board of Directors determines the compensation paid to each director by considering trends in the economy and the industry and by weighing financial contributions and other factors. The Board of Corporate Auditors decides, through consultation, on the amounts of compensation to be paid to the corporate auditors.
(5) Shareholdings in other companies
1) Of shares held for investment purposes, the number of shares purchased for reasons other than pure investment and the value of such shares on the balance sheet
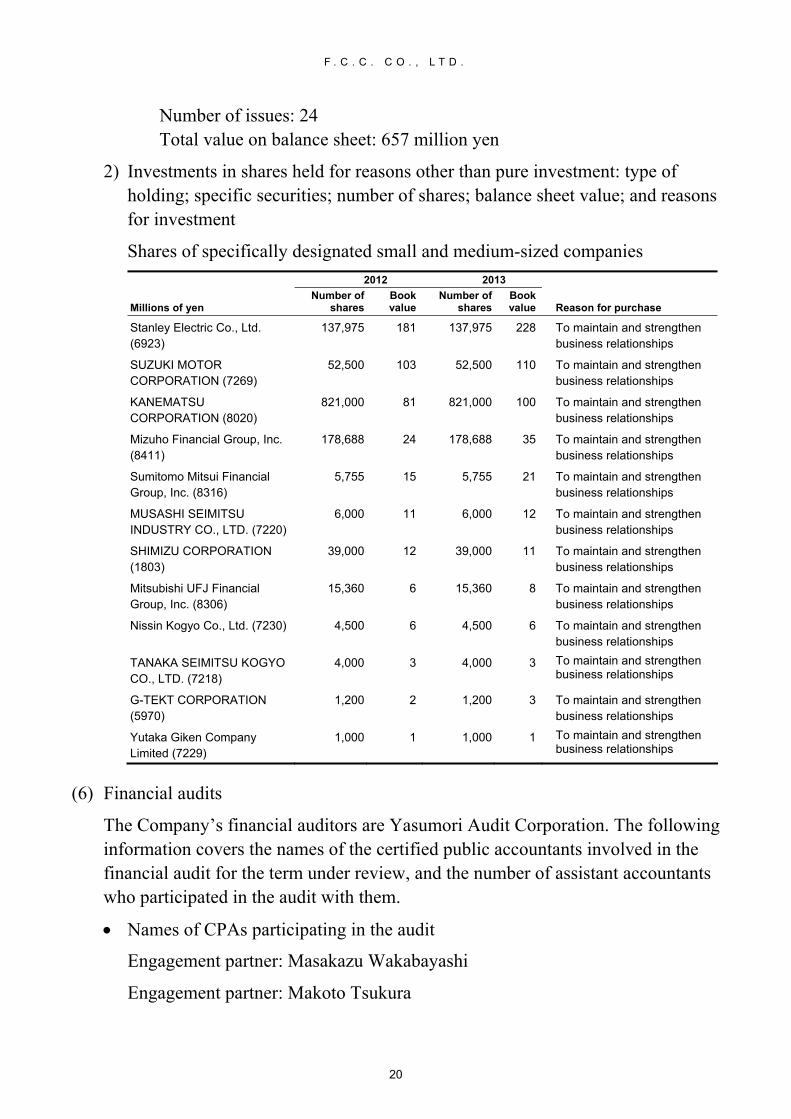
F . C . C . C O . , L T D .
20
Number of issues: 24 Total value on balance sheet: 657 million yen
2) Investments in shares held for reasons other than pure investment: type of holding; specific securities; number of shares; balance sheet value; and reasons for investment
Shares of specifically designated small and medium-sized companies
2012 2013
Millions of yen Number of
sharesBook value
Number of shares
Book value Reason for purchase
Stanley Electric Co., Ltd. (6923)
137,975 181 137,975 228 To maintain and strengthen business relationships
SUZUKI MOTOR CORPORATION (7269)
52,500 103 52,500 110 To maintain and strengthen business relationships
KANEMATSU CORPORATION (8020)
821,000 81 821,000 100 To maintain and strengthen business relationships
Mizuho Financial Group, Inc. (8411)
178,688 24 178,688 35 To maintain and strengthen business relationships
Sumitomo Mitsui Financial Group, Inc. (8316)
5,755 15 5,755 21 To maintain and strengthen business relationships
MUSASHI SEIMITSU INDUSTRY CO., LTD. (7220)
6,000 11 6,000 12 To maintain and strengthen business relationships
SHIMIZU CORPORATION (1803)
39,000 12 39,000 11 To maintain and strengthen business relationships
Mitsubishi UFJ Financial Group, Inc. (8306)
15,360 6 15,360 8 To maintain and strengthen business relationships
Nissin Kogyo Co., Ltd. (7230) 4,500 6 4,500 6 To maintain and strengthen business relationships
TANAKA SEIMITSU KOGYO CO., LTD. (7218)
4,000 3 4,000 3 To maintain and strengthen business relationships
G-TEKT CORPORATION (5970)
1,200 2 1,200 3 To maintain and strengthen business relationships
Yutaka Giken Company Limited (7229)
1,000 1 1,000 1 To maintain and strengthen business relationships
(6) Financial audits
The Company’s financial auditors are Yasumori Audit Corporation. The following information covers the names of the certified public accountants involved in the financial audit for the term under review, and the number of assistant accountants who participated in the audit with them.
Names of CPAs participating in the audit
Engagement partner: Masakazu Wakabayashi
Engagement partner: Makoto Tsukura

F . C . C . C O . , L T D .
21
Assistant accountants participating in the audit: 9 CPAs
(7) Matters normally requiring the adoption of a resolution by the General Meeting of Shareholders, which may be decided by the Board of Directors
Acquisition of treasury shares
To carry out capital market-related strategies in a flexible and timely manner in response to changes in the economic environment, the Company provides in its Articles of Incorporation that, in accordance with Article 165-2 of the Corporation Law, it may acquire treasury shares through market transactions based on a resolution of the Board of Directors.
Interim dividends
The Company provides in its Articles of Incorporation that, in accordance with Article 454-5 of the Corporation Law, it may pay a dividend of surplus (interim dividend) based on a resolution of the Board of Directors. The aim of such dividends shall be to return profits quickly and effectively to shareholders.
(8) Number of directors
The Company states in its Articles of Incorporation that it shall have no more than fifteen directors.
(9) Requirements for the election of directors
The Company states in its Articles of Incorporation that adoption of resolutions for the election of directors shall require that at least one-third of the shareholders entitled to execute voting rights be present, and that an affirmative vote be cast by a majority of such shareholders.
(10) Requirements for the adoption of special resolutions by the General Meeting of Shareholders
The Company states in its Articles of Incorporation that the adoption of resolutions based on Article 309-2 of the Corporation Law shall require that at least one-third of the shareholders entitled to execute voting rights be present and that an affirmative vote be cast by at least two-thirds of such shareholders. The aim of this provision is to further ensure that quorums are available for the adoption of special resolutions by the General Meeting of Shareholders and that the General Meeting of Shareholders is conducted without impediments.

F . C . C . C O . , L T D .
22
Professional fees paid to financial auditors
Compensation paid to CPAs and accounting firms
2012 2013
Millions of yen Financial audit
services Non-audit
servicesFinancial audit
servicesNon-audit
services
The Company 53 - 53 -
Subsidiaries - - - -
53 - 53 -
Directors
Name Title Date joined Company
Previous or current employers/ occupations Date of birth Term
Hundreds of shares
Shiro Sumita Representative Director, Chairman
Sep-74 21-Apr-47 1 year from the General Meeting of Shareholders (GMS) held on June 24, 2013
310
Toshimichi Matsuda Representative Director, President
Mar-75 9-Dec-52 1 year from GMS held on June 24, 2013
90
Yoshitaka Saito Managing Director
Feb-09 29-Nov-73 1 year from GMS held on June 24, 2013
40
Kazuhiro Itonaga Managing Director
Mar-82 11-Mar-60 1 year from GMS held on June 24, 2013
13
Yoshinobu Isobe Director Apr-09 HONDA MOTOR CO., LTD.
28-Sep-53 1 year from GMS held on June 24, 2013
55
Kazuto Suzuki Director Apr-84 27-May-61 1 year from GMS held on June 24, 2013
23
Tomokazu Takeda Director Apr-11 26-Oct-54 1 year from GMS held on June 24, 2013
10
Ryujiro Matsumoto Director Jul-05 4-Jun-62 1 year from GMS held on June 24, 2013
10
Atsuhiro Mukoyama Director Apr-84 31-Jul-63 1 year from GMS held on June 24, 2013
14
Satoshi Nakaya Director Apr-86 17-Mar-64 1 year from GMS held on June 24, 2013
41
Kenichi Inoue Director Apr-13 3-May-57 1 year from GMS held on June 24, 2013
10

F . C . C . C O . , L T D .
23
Name Title Date joined Company
Previous or current employers/ occupations Date of birth Term
Hundreds of shares
Hiromichi Suzuki Standing Corporate Auditor
Mar-78 20-Sep-52 4 years from GMS held on June 28, 2011
46
Katsuyoshi Fukatsu Standing Corporate Auditor
Mar-77 30-Nov-54 4 years from GMS held on June 25, 2012
47
Yoshinori Tsuji Corporate Auditor
Jun-07 Attorney at Law 17-Apr-59 4 years from GMS held on June 28, 2011
-
Masahide Sato Corporate Auditor
Jun-10 CPA 10-Feb-64 4 years from GMS held on June 25, 2012
-
15 709
Current assignments and previous positions in the Company have been omitted.
Employees Consolidated
Business segment Number
Motorcycle clutches 4,551
Automobile clutches 2,015
Segment reporting total 6,566
Administration (general operations) 445
7,011
Parent
Total or average
Number 1,118
Average age 37.4
Average years of service 13.5
Average annual salary (Yen) 6,122,907
Business segment Number
Motorcycle clutches 243
Automobile clutches 430
Segment reporting total 673
Administration (general operations) 445
1,118
The number noted under “Administration (general operations)" refers to employees in management and technical research divisions and the production engineering center.
The increase in consolidated number of employees by 1,065 compared to the previous fiscal year is due to increases in manufacturing capacity at subsidiaries in Indonesia, India and the United States.

F . C . C . C O . , L T D .
24
Unions Parent company
The Company’s labor union, known as the F.C.C. Labor Union, had 1,063 members as of March 31, 2013. It is a member of the Japanese Association of Metal, Machinery and Manufacturing Workers (“JAM”). Since its formation, the union has enjoyed amicable relations with the Company, and there are currently no unresolved issues between the two parties.
Labor-management relations at the Company’s consolidated subsidiaries are also stable, with no unresolved issues requiring reporting. The situations with respect to labor unions at the Company’s principal subsidiaries are as follows.
FCC (THAILAND) CO., LTD.
The Company’s labor union, known as the F.C.C. Workers’ Union, had 362 members as of March 31, 2013. Since its formation, the union has enjoyed amicable relations with the Company, and there are currently no unresolved issues between the two parties.
PT. FCC INDONESIA
The Company’s labor union, known as the F.C.C. Indonesia Metalworkers’ Union, had 1,312 members as of March 31, 2013. It is a member of the Indonesian Metalworkers’ Union. When necessary, the Company engages in negotiations with the union in response to its demands.

F . C . C . C O . , L T D .
25
Cash Flows Consolidated statements of cash flows Years ended March 31; Millions of yen 2012 2013
Net cash provided by (used in) operating activities
Income before income taxes and minority interests 11,277 13,073
Depreciation and amortization 6,335 5,999
Amortization of goodwill 275 275
Increase (decrease) in allowance for doubtful accounts (2) (2)
Increase (decrease) in provision for bonuses (42) 53
Increase (decrease) in provision for retirement benefits 229 (52)
Increase (decrease) in provision for directors' retirement benefits (23) -
Interest and dividends income (481) (501)
Interest expenses 19 13
Foreign exchange losses (gains) (21) (724)
Equity in (earnings) losses of affiliates (23) 21
Loss (gain) on sales and retirement of noncurrent assets 60 101
Gain on bargain purchase (83) -
Subsidy income (50) (2)
Reversal of provision for loss on business liquidation - (48)
Loss on liquidation of business 291 -
Decrease (increase) in notes and accounts receivable - trade (3,040) 1,963
Decrease (increase) in inventories (1,804) (1,495)
Decrease (increase) in other assets (143) (280)
Increase (decrease) in notes and accounts payable - trade 2,202 (1,762)
Increase (decrease) in factoring liabilities 119 (432)
Increase (decrease) in other liabilities (340) 9
Increase (decrease) in accrued consumption taxes (56) (194)
Subtotal 14,697 16,013
Interest and dividends income received 627 615
Interest expenses paid (26) (15)
Payments for loss on disaster (1) -
Income taxes paid (2,936) (3,121)
Net cash provided by (used in) operating activities 12,360 13,491

F . C . C . C O . , L T D .
26
Years ended March 31; Millions of yen 2012 2013
Net cash provided by (used in) investing activities
Payments into time deposits (252) (712)
Proceeds from withdrawal of time deposits 246 296
Purchase of property, plant and equipment (9,541) (11,012)
Proceeds from sales of property, plant and equipment 144 526
Purchase of intangible assets (66) (194)
Proceeds from sales of intangible assets - 1
Purchase of investment securities (146) (53)
Proceeds from sales of investment securities - 12
Payments for purchases of other investment instruments (30) (135)
Proceeds from sales of other investment instruments 12 17
Payments of loans receivable (5,238) (3,978)
Collection of loans receivable 4,514 3,898
Other, net 49 (22)
Net cash provided by (used in) investing activities (10,309) (11,355)
Net cash provided by (used in) financing activities
Net increase (decrease) in short-term loans payable (1,045) 184
Repayment of long-term loans payable (71) (136)
Purchase of treasury stock (0) (0)
Cash dividends paid (1,605) (1,705)
Cash dividends paid to minority shareholders (480) (519)
Net cash provided by (used in) financing activities (3,204) (2,176)
Effect of exchange rate change on cash and cash equivalents (799) 1,879
Net increase (decrease) in cash and cash equivalents (1,953) 1,839
Cash and cash equivalents at beginning of period 22,545 20,591
Increase (decrease) in cash and cash equivalents resulting from change in accounting period of subsidiaries
- 938
Cash and cash equivalents at end of period 20,591 23,369
Relationship between balance of cash and cash equivalents as of term-end and balance sheet items
Years ended March 31; Millions of yen 2012 2013
Cash and deposit accounts 20,865 24,198
Time deposits, etc., with terms of over 3 months (273) (828)
Cash and cash equivalents, end of period 20,591 23,369

F . C . C . C O . , L T D .
27
Capital expenditures
The FCC Group makes investments with a focus on products and R&D-related projects with medium-to-long term growth potential that contribute to labor savings, rationalization and enhanced product reliability. During the fiscal year ended March 2013, it made a total of 11,774 million yen in capital investments, which included the following major projects.
Millions of yen Buildings and
structures
Machinery, equipment and
vehicles Land Other Total book
value
Book value Square meters
Parent company
Suzuka Factory
Motorcycle and automobile clutches
109 68 - - 744 922
R&D Division
Integrated research 8 403 - - (68) 344
Hosoe Factory
Motorcycle and automobile clutches
11 181 - - 9 202
Ryuyo Factory
Motorcycle and automobile clutches
- 24 - - 120 145
Domestic subsidiaries
Tohoku Chemical Industries, Ltd.
Motorcycle clutches 230 18 - - (123) 126
Overseas subsidiaries
PT. FCC INDONESIA
Motorcycle and automobile clutches
418 1,053 - - 450 1,922
FCC (Adams), LLC.
Automobile clutches 535 325 - - 613 1,474
CHENGDU YONGHUA. F.C.C. CLUTCHES CO., LTD.
Motorcycle and automobile clutches
683 84 - - 471 1,239
FCC RICO LTD.
Motorcycle and automobile clutches
165 694 67 - 267 1,194
FCC (THAILAND) CO., LTD.
Motorcycle and automobile clutches
54 677 - - 273 1,005

F . C . C . C O . , L T D .
28
Capital expenditure and disposal plan
The FCC Group develops and adopts capital investment plans based on broad-ranging considerations of economic forecasts, industry trends and investment efficiency. As a rule, investment plans are initiated by the individual Group companies. The reporting Company then functions as the coordinator in formulating the final plan.
Millions of yen Budgeted
amountExpenditures to
dateDate
commenced Date to becompleted
Hamakita Factory
Automobile clutches 1,066 - 2013/4 2014/3
R&D Division
Integrated research 350 - 2013/4 2014/3
Ryuyo Factory
Motorcycle and automobile clutches 151 - 2013/4 2014/3
Suzuka Factory
Motorcycle and automobile clutches 151 - 2013/4 2014/3
FCC (North Carolina), LLC.
Motorcycle and automobile clutches 7,160 - 2013/4 2014/3
FCC (THAILAND) CO., LTD.
Motorcycle and automobile clutches 2,086 - 2013/4 2014/3
CHENGDU YONGHUA. F.C.C. CLUTCHES CO., LTD.
Motorcycle and automobile clutches 2,072 - 2013/1 2013/12
FCC (INDIANA), LLC.
Automobile clutches 1,805 - 2013/4 2014/3
FCC (Adams), LLC.
Automobile clutches 1,330 - 2013/4 2014/3
PT. FCC INDONESIA
Motorcycle and automobile clutches 824 - 2013/4 2014/3

F . C . C . C O . , L T D .
29
Dividend policy
The Company considers dividend policy to be one of most important decision-making areas for management. The automobile and automobile component industries engage in businesses around the world from a global perspective. Against this background, the Company’s fundamental stance toward dividends is to make payouts that are backed by performance, which in turn requires that it carry out aggressive programs of capital investment and R&D, that it develop new products and technologies and translate them successfully into high-volume production, and that it maintain and consolidate its competitive position in the industry.
The Company’s basic policy is to pay dividends twice a year in the form of an interim dividend and a year-end dividend.
Decisions on the year-end dividend are made by the shareholders at their General Meeting; decisions on interim dividends are made by the Board of Directors.
Based on the foregoing policy, the Company paid a total dividend for the year under review of 36 yen per share (of which 18 yen was paid out as an interim dividend). This resulted in a dividend payout ratio of 22.75%.
The Company allocates retained earnings toward investments conducted in response to challenges arising in the changing operating environment. Specifically, these are investments aimed at increasing the Company’s cost competitiveness, strengthening its ability to develop technologies and products that meet customer needs, and implementing steps to further its global expansion.
The Company has included a provision in its Articles of Incorporation stating that “By resolution of the Board of Directors, the Company shall have the right to pay an interim dividend, with a date of record of September 30 each year.”
Dividends for the year under review were as follows.
Date of decision Dividend payout Dividend per share
(Millions of yen) (Yen)
October 26, 2012 Resolution by Board of Directors
903 18
June 24, 2013 Resolution by General Meeting of Shareholders
903 18
F . C . C . C O . , L T D .
30
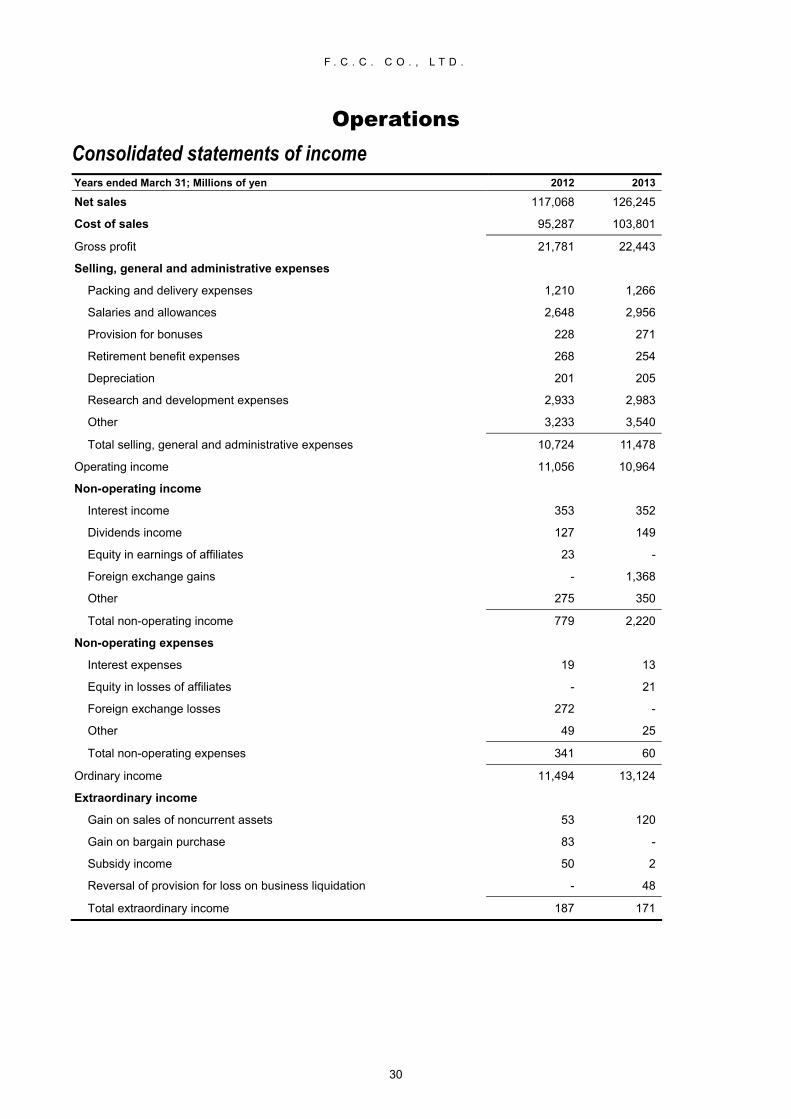
Operations Consolidated statements of income Years ended March 31; Millions of yen 2012 2013
Net sales 117,068 126,245
Cost of sales 95,287 103,801
Gross profit 21,781 22,443
Selling, general and administrative expenses
Packing and delivery expenses 1,210 1,266
Salaries and allowances 2,648 2,956
Provision for bonuses 228 271
Retirement benefit expenses 268 254
Depreciation 201 205
Research and development expenses 2,933 2,983
Other 3,233 3,540
Total selling, general and administrative expenses 10,724 11,478
Operating income 11,056 10,964
Non-operating income
Interest income 353 352
Dividends income 127 149
Equity in earnings of affiliates 23 -
Foreign exchange gains - 1,368
Other 275 350
Total non-operating income 779 2,220
Non-operating expenses
Interest expenses 19 13
Equity in losses of affiliates - 21
Foreign exchange losses 272 -
Other 49 25
Total non-operating expenses 341 60
Ordinary income 11,494 13,124
Extraordinary income
Gain on sales of noncurrent assets 53 120
Gain on bargain purchase 83 -
Subsidy income 50 2
Reversal of provision for loss on business liquidation - 48
Total extraordinary income 187 171

F . C . C . C O . , L T D .
31
Years ended March 31; Millions of yen 2012 2013
Extraordinary loss
Loss on sales and retirement of noncurrent assets 113 222
Loss on liquidation of business 291 -
Total extraordinary losses 404 222
Income before income taxes and minority interests 11,277 13,073
Income taxes - current 2,545 4,451
Income taxes - deferred 540 (361)
Total income taxes 3,085 4,089
Income before minority interests 8,191 8,984
Minority interests in income 915 1,041
Net income 7,276 7,942
Consolidated statements of comprehensive income Years ended March 31; Millions of yen 2012 2013
Income before minority interests 8,191 8,984
Other comprehensive income
Valuation difference on available-for-sale securities 264 560
Foreign currency translation adjustment (2,221) 8,171
Share of other comprehensive income of associates accounted for using equity method
9 (8)
Total other comprehensive income (1,947) 8,723
Comprehensive income 6,244 17,707
Comprehensive income attributable to
Comprehensive income attributable to owners of the parent 5,869 15,310
Comprehensive income attributable to minority interests 374 2,397

F . C . C . C O . , L T D .
32
Consolidated statements of changes in net assets Years ended March 31; Millions of yen 2012 2013
Shareholders' equity
Capital stock
Balance at the beginning of current period 4,175 4,175
Changes of items during the period
Total changes of items during the period - -
Balance at the end of current period 4,175 4,175
Capital surplus
Balance at the beginning of current period 4,566 4,566
Changes of items during the period
Total changes of items during the period - -
Balance at the end of current period 4,566 4,566
Retained earnings
Balance at the beginning of current period 73,050 78,720
Changes of items during the period
Dividends from surplus (1,606) (1,706)
Net income 7,276 7,942
Changes in fiscal year-end of consolidated subsidiaries - 699
Total changes of items during the period 5,670 6,936
Balance at the end of current period 78,720 85,657
Treasury stock
Balance at the beginning of current period (3,407) (3,407)
Changes of items during the period
Purchase of treasury stock (0) (0)
Total changes of items during the period (0) (0)
Balance at the end of current period (3,407) (3,407)
Total shareholders' equity
Balance at the beginning of current period 78,384 84,054
Changes of items during the period
Dividends from surplus (1,606) (1,706)
Net income 7,276 7,942
Purchase of treasury stock (0) (0)
Changes in fiscal year-end of consolidated subsidiaries - 699
Total changes of items during the period 5,670 6,936
Balance at the end of current period 84,054 90,991

F . C . C . C O . , L T D .
33
Years ended March 31; Millions of yen 2012 2013
Accumulated other comprehensive income
Valuation difference on available-for-sale securities
Balance at the beginning of current period 2,792 3,076
Changes of items during the period
Net changes of items other than shareholders' equity 284 550
Total changes of items during the period 284 550
Balance at the end of current period 3,076 3,626
Foreign currency translation adjustment
Balance at the beginning of current period (10,262) (11,962)
Changes of items during the period
Net changes of items other than shareholders' equity (1,700) 6,697
Total changes of items during the period (1,700) 6,697
Balance at the end of current period (11,962) (5,264)
Total accumulated other comprehensive income
Balance at the beginning of current period (7,470) (8,886)
Changes of items during the period
Net changes of items other than shareholders' equity (1,416) 7,247
Total changes of items during the period (1,416) 7,247
Balance at the end of current period (8,886) (1,638)
Minority interests
Balance at the beginning of current period 6,354 6,039
Changes of items during the period
Changes in fiscal year-end of consolidated subsidiaries - 151
Net changes of items other than shareholders' equity (314) 1,946
Total changes of items during the period (314) 2,098
Balance at the end of current period 6,039 8,138
Total net assets
Balance at the beginning of current period 77,268 81,208
Changes of items during the period
Dividends from surplus (1,606) (1,706)
Net income 7,276 7,942
Purchase of treasury stock (0) (0)
Changes in fiscal year-end of consolidated subsidiaries - 851
Net changes of items other than shareholders' equity (1,730) 9,194
Total changes of items during the period 3,939 16,282
Balance at the end of current period 81,208 97,491

F . C . C . C O . , L T D .
34
Results of operations
Fiscal year ended March 31, 2013
Overview of financial results (year-on-year percentage changes)
Despite lower sales of motorcycle clutches in Indonesia and Brazil and the negative impact of public boycotts against Japanese products in China, sales benefited from a recovery of automobile production by the Company’s major customers. Expenses associated with new product launches impacted operating income, but exchange gains boosted ordinary and pre-tax income. Net income, while higher, grew at a slightly lower rate than ordinary and pre-tax income because of increases in corporate taxes. The following results ensured:
1) Net sales: up 7.8%, to 126,245 million yen
2) Operating income: down 0.8%, to 10,964 million yen
3) Ordinary income: up 14.2%, to 13,124 million yen
4) Income before income taxes and minority interests: up 15.9%, to 13,073 million yen
5) Net income: up 9.2%, to 7,942 million yen
Segment breakdown
Motorcycle clutches
Sales remained roughly unchanged, rising by 0.5% to 71,004 million yen; segment income declined by 24.2%:
1) The end of flood-related disruptions in Thailand helped sales offset the negative impacts of tighter consumer loan-related credit controls in Indonesia and Brazil and weaker currencies in Indonesia, India and Brazil.
2) The decline in segment income primarily reflected lower sales in Indonesia and Brazil as well as lower values for the currencies of Indonesia, India and Brazil.
Automobile clutches
Sales and segment income both increased, the former by 19.0% to 55,240 million yen, and the latter by 137.3% to 3,798 million yen:
1) Despite anti-Japanese boycotts in China, sales and segment income benefited from a significant recovery in manufacturing by the Company’s major customers in Japan and North America.
2) The improved financial performance in this segment also reflected continuing

F . C . C . C O . , L T D .
35
strong momentum in sales to Ford.
Fiscal year ended March 31, 2012
Overview of financial results (year-on-year percentage changes)
While impacted by severe flooding in Thailand, the Company’s motorcycle clutch sales were buoyant, benefiting from strength in Indonesia and India. On the other hand, disruptions of automobile manufacturing by major customers following the Great East Japan Earthquake and the flooding in Thailand, along with the negative effects of the stronger yen, weighed significantly on the Company’s sales and profits. The following results ensured:
1) Net sales: down 0.5% to 117,068 million yen 2) Operating income: down 14.0% to 11,056 million yen 3) Ordinary income: down 9.3% to 11,494 million yen 4) Income before income taxes and minority interests: down 10.3% to 11,277 million
yen 5) Net income: down 9.5% to 7,276 million yen
Segment breakdown
Motorcycle clutches
Sales increased by 3.6% to 70,642 million yen, but segment income declined by 4.5% to 9,455 million yen:
1) Despite the negative impact of the record flooding in Thailand, sales benefited from rising demand for motorcycles in Indonesia and India.
2) In Japan, sales also increased because of a pickup in exports of large-displacement bikes.
Automobile clutches
Sales and segment income both declined, falling by 6.1% to 46,426 million yen and 45.7% to 1,601 million yen, respectively:
1) Continued positive trends in sales to Ford Motor Co. 2) Disaster-related impacts and the stronger yen nevertheless resulted in reductions in
production, both domestically and overseas, by the Company’s major customers.

F . C . C . C O . , L T D .
36
Segment information
1. Segment reporting
The Company’s segment reporting is based on organizational units for which clearly separable financial information can be obtained. These units are also subject to regular reviews by the Board of Directors to determine resource allocation and evaluate financial performance.
Divisional units that administer manufacturing in the motorcycle clutch business and the automobile clutch business provide the primary leadership for these operations, each developing comprehensive strategies for domestic and overseas markets where these businesses are conducted.
Consequently, the FCC Group adopts “motorcycle clutches” and “automobile clutches” as its reporting segments.
The former segment manufactures clutches for motorcycles, scooters and ATVs, while the latter manufactures clutches for manual and automatic transmission automobiles.
2. Method of calculating segment net sales, profits and losses, assets, liabilities, etc.
The accounting methods used in segment reporting are identical to those cited under “Fundamental and Important Matters for the Preparation of Consolidated Financial Statements.”
“Segment profits” are identical to the individual segments’ operating income.
The Company determined changes in depreciation method and useful lives of property, plant and equipment beginning from the year ended March 2013.
(Change in method of depreciation)
1) From the declining-balance method to the straight-line method (Refer to accounting policies on page 64.)
2) An assessment by the Company determined that the straight-line method would better reflect the manner in which the F.C.C. Group operates as it prepares for significant capital investments and upgrades in the future; it based its judgment on the following:
A reassessment of how such property, plant and equipment are actually being used

F . C . C . C O . , L T D .
37
The need to unify accounting methods as the F.C.C. Group develops further as a global enterprise
3) Financial effects of this change in depreciation methods: in the motorcycle clutches segment, segment profits increased by 1,019 million yen; in the automobile clutches segment, segment profits increased by 382 million yen.
(Change in useful lives for property, plant and equipment)
1) As a result of a reassessment of how property, plant and equipment are actually employed, the useful lives of certain property, plant and equipment owned by overseas subsidiaries have been changed.
2) Financial effects of this change in estimates: in the motorcycle clutches segment, segment profits decreased by 376 million yen; in the automobile clutches segment, segment profits decreased by 339 million yen.
3. Figures for segment net sales, profits and losses, assets, liabilities, etc.
Millions of yen Motorcycle
clutches Automobile
clutches Total Adjustments Book value
2013
Net sales
External customers 71,004 55,240 126,245 - 126,245
Inter-area - - - - -
71,004 55,240 126,245 - 126,245
Segment profits 7,165 3,798 10,964 - 10,964
Segment assets 61,072 48,992 110,064 12,193 122,258
Other items Depreciation and amortization Amortization of goodwill Increase in property, plant and equipment and Intangible assets
2,798 275
5,059
3,200-
6,038
5,999275
11,097
- -
677
5,999275
11,774
2012
Net sales
External customers 70,642 46,426 117,068 - 117,068
Inter-area - - - - -
70,642 46,426 117,068 - 117,068
Segment profits 9,455 1,601 11,056 - 11,056
Segment assets 52,889 41,016 93,906 10,031 103,937
Other items Depreciation and amortization Amortization of goodwill Increase in property, plant and equipment and Intangible assets
2,865 275
5,593
3,470-
4,883
6,335275
10,476
- -
575
6,335275
11,051
Notes:
1. Adjustments:
(1) The adjustments to segment assets of 10,031 million yen (2012) and 12,193 million yen (2013) represent assets attributable to the Company as a whole, comprising largely investment securities and property, plant and equipment that are not attributable to any segment (R&D facilities, production engineering center and Corporate Headquarters).
(2) The increases of 575 million yen (2012) and 677 million yen (2013) to property, plant and equipment and to intangible assets represent assets attributable to the Company as a whole, comprising largely increases in property, plant and equipment and intangible assets (R&D facilities, production engineering center and Corporate Headquarters).
2. The total of segment income coincides with operating income in the financial statements.

F . C . C . C O . , L T D .
38
Related information
Information on products and services 2012 2013
Millions of yen Motorcycle
clutches Automobile
clutches TotalMotorcycle
clutchesAutomobile
clutches Total
External customers 70,642 46,426 117,068 71,004 55,240 126,245
Information by region
Millions of yen Japan United States Indonesia India Others Total
2013
Sales 25,972 34,623 20,698 12,800 32,150 126,245
2012
Sales 27,537 25,743 19,178 12,405 32,204 117,068
Principal countries in the “Others” category are as follows: Thailand, China, Brazil and Vietnam.
Millions of yen Japan United States China Others Total
2013
Property, plant and equipment 16,222 12,647 4,892 13,536 47,299
Millions of yen Japan United States Others Total
2012
Property, plant and equipment 15,910 10,064 12,528 38,504
Information by principal customer
Sales Millions of yen 2012 2013 Segment
HONDA MOTOR CO., LTD. and its group companies 74,255 81,480 Motorcycle and automobile clutches
Information on goodwill: amortization and unamortized balances by segment
2012 2013
Millions of yen Motorcycle
clutches Automobile
clutches Eliminations TotalMotorcycle
clutchesAutomobile
clutches Eliminations Total
Amortization 275 - - 275 275 - - 275
Ending balance 1,032 - - 1,032 756 - - 756

F . C . C . C O . , L T D .
39
Issues requiring action
There are reasons for concern about the potential negative impacts on motorcycle clutch sales of financial system instability in Europe, slowing economic trends in emerging nations, and the adoption of Islamic financial practices in Indonesia (regulations concerning down payments required for purchases financed by consumer loans). The outlook is for downward adjustments of the yen exchange rate to continue, on the other hand, and for sales of automobile clutches to new customers to increase. In this environment, the following have been identified as key issues:
1) Implementing the major policies of the Company’s 8th Medium Term Management Plan, which covers the period through the fiscal year ending March 31, 2014
2) Increasing manufacturing efficiency, and reducing the risks associated with tsunamis and ground liquefaction which may result from major earthquakes in the Tokai and Tonankai regions, which many scientists predict—through smooth implementation of plans to redistributing manufacturing assets in Japan (entailing the transfer of major manufacturing processes that are currently handled at the coastal Ryuyo and Tenryu factories to plants in the interior of the country as well as to overseas subsidiaries)
3) Expediting decision-making and improving operating efficiency
Through the adoption of the executive corporate officer system implemented by the Company on April 1, 2013
The new system will enable Company to respond rapidly and flexibly to changes in the operating environment.
4) Tackling the extremely important issue of building a new business which, over the medium-to-long term, can become a second pillar of operations complementing clutch manufacturing.
5) By segment
Motorcycle clutches: reorganizing the manufacturing base in Japan and enhancing its efficiency; in the emerging nations, developing policies for labor management and increasing the added value of scooter components
Automobile clutches: realigning the manufacturing base in Japan and enhancing its efficiency; in the United States and China, broadening and deepening manufacturing capabilities and preparing and implementing production systems capable of handling new models and of responding to the needs of new customers

F . C . C . C O . , L T D .
40
Production and sales Production Millions of yen 2013
AmountYear-on-year
comparison (%)
Motorcycle clutches 71,443 100.2
Automobile clutches 55,609 120.0
127,053 108.0
Orders Millions of yen 2013
Orders Orders outstanding
AmountYear-on-year
comparison (%) Amount Year-on-year
comparison (%)
Motorcycle clutches 71,463 100.9 6,308 107.9
Automobile clutches 55,587 116.0 4,888 107.6
127,051 107.0 11,196 107.8
Sales by product Millions of yen 2013
AmountYear-on-year
comparison (%)
Motorcycle clutches 71,004 100.5
Automobile clutches 55,240 119.0
126,245 107.8
Principal customers
Millions of yen 2012 2013
Amount % of net sales Amount % of net sales
HONDA MOTOR CO., LTD. 20,220 17.3 18,373 14.6

F . C . C . C O . , L T D .
41
Capital Structure Consolidated balance sheets Assets March 31; Millions of yen 2012 2013
Current assets Cash and deposits 20,865 24,198
Notes and accounts receivable - trade 16,769 17,554
Merchandise and finished goods 2,077 2,348
Work in process 2,569 2,923
Raw materials and supplies 8,572 10,751
Deferred tax assets 1,152 1,327
Short-term loans receivable 509 988
Other 2,444 2,843
Allowance for doubtful accounts (4) (8)
Total current assets 54,955 62,927
Noncurrent assets
Property, plant and equipment
Buildings and structures 23,280 26,929
Accumulated depreciation (11,764) (13,581)
Buildings and structures, net 11,516 13,347
Machinery, equipment and vehicles 62,852 71,577
Accumulated depreciation (47,703) (53,384)
Machinery, equipment and vehicles, net 15,148 18,192
Tools, furniture and fixtures 10,697 11,883
Accumulated depreciation (9,308) (10,131)
Tools, furniture and fixtures, net 1,388 1,751
Land 7,367 7,465
Construction in progress 3,082 6,543
Total property, plant and equipment 38,504 47,299
Intangible assets
Goodwill 1,032 756
Other 467 665
Total intangible assets 1,499 1,422
Investments and other assets
Investment securities 6,829 7,823
Long-term loans receivable 440 532
Deferred tax assets 900 1,306
Other 857 992
Allowance for doubtful accounts (49) (45)
Total investments and other assets 8,978 10,608
Total noncurrent assets 48,982 59,330
Total assets 103,937 122,258

F . C . C . C O . , L T D .
42
Liabilities and net assets March 31; Millions of yen 2012 2013
Current liabilities Notes and accounts payable - trade 8,851 8,590
Factoring liabilities 2,453 2,003
Short-term loans payable 206 291
Income taxes payable 899 2,275
Provision for bonuses 1,331 1,382
Provision for loss on business liquidation 336 -
Other 3,634 4,817
Total current liabilities 17,713 19,360
Noncurrent liabilities
Deferred tax liabilities 2,648 3,171
Provision for retirement benefits 1,571 1,586
Other 795 648
Total noncurrent liabilities 5,015 5,405
Total liabilities 22,728 24,766
Net assets
Shareholders' equity
Capital stock 4,175 4,175
Capital surplus 4,566 4,566
Retained earnings 78,720 85,657
Treasury stock (3,407) (3,407)
Total shareholders' equity 84,054 90,991
Accumulated other comprehensive income
Valuation difference on available-for-sale securities 3,076 3,626
Foreign currency translation adjustment (11,962) (5,264)
Total accumulated other comprehensive income (8,886) (1,638)
Minority interests 6,039 8,138
Total net assets 81,208 97,491
Total liabilities and net assets 103,937 122,258

F . C . C . C O . , L T D .
43
Market value of securities Other quoted securities 2012 2013
Millions of yen Book value Cost of
acquisitionUnrealized
gains (losses) Book value Cost of
acquisition Unrealized
gains (losses)
Securities valued on the consolidated balance sheet at amounts greater than the purchase cost
Shares 6,026 1,197 4,829 6,916 1,243 5,673
Bonds
JGB, local government bonds, etc. - - - - - -
Corporate bonds - - - - - -
Other - - - - - -
Other - - - - - -
6,026 1,197 4,829 6,916 1,243 5,673
Securities valued on the consolidated balance sheet at amounts not greater than the purchase cost
Shares 0 0 (0) 0 0 (0)
Bonds
JGB, local government bonds, etc. - - - - - -
Corporate bonds - - - - - -
Other - - - - - -
Other - - - - - -
0 0 (0) 0 0 (0)
6,027 1,198 4,829 6,916 1,243 5,673

F . C . C . C O . , L T D .
44
Facilities
Millions of yen Buildings and
structures
Machinery, equipment and
vehicles Land Other Total book
value Number of employees
Book value Square meters
Parent company
Hosoe Factory
Motorcycle and automobile clutches
193 367 270 18,080 13 845 137
Hamakita Factory
Automobile clutches 411 192 731 26,216 44 1,380 55
Ryuyo Factory
Motorcycle and automobile clutches
430 686 1,047 59,045 186 2,352 216
Tenryu Factory
Motorcycle and automobile clutches
336 216 1,022 32,511 18 1,593 48
Suzuka Factory
Motorcycle and automobile clutches
2,563 822 1,292 75,130 884 5,562 217
R&D Division
Integrated research 507 500 216 12,093 62 1,286 187
Domestic subsidiaries
KYUSHU F.C.C. CO., LTD.
Motorcycle and automobile clutches
188 193 11 20,474 40 433 129
Overseas subsidiaries
FCC (Adams), LLC.
Automobile clutches 1,484 1,866 43 161,880 2,472 5,866 224
PT. FCC INDONESIA
Motorcycle and automobile clutches
843 2,844 294 72,812 693 4,675 1,399
FCC (INDIANA) LLC.
Automobile clutches 1,043 1,557 68 246,263 951 3,621 721
FCC (North Carolina), LLC.
Motorcycle and automobile clutches
820 1,790 4 269,064 914 3,530 173
FCC (THAILAND) CO., LTD.
Motorcycle and automobile clutches
861 1,297 600 87,890 436 3,195 417
FCC RICO LTD.
Motorcycle and automobile clutches
520 1,925 341 82,680 259 3,047 547
CHINA FCC FOSHAN CO., LTD.
Automobile clutches 482 2,298 - 59,108 236 3,016 226
FCC (VIETNAM) CO., LTD.
Motorcycle clutches 452 1,130 - 45,816 493 2,076 893

F . C . C . C O . , L T D .
45
Borrowings
Millions of yen Outstanding at
Beginning of termOutstanding at
end of term Average rate Maturity
Short-term loans payable 73 291 3.05% -
Current portion of long-term loans payable 132 - - -
Current portion of lease obligations - - - -
Long-term loans payable (except current portion of long-term loans payable)
- - - -
Lease obligations (except current portion of lease obligations)
- - - -
Other interest-bearing liabilities - - - -
206 291 - -
Retirement benefits Outline of retirement benefit system
The Company and its consolidated subsidiaries offer employees the following options in terms of defined benefit pension plans: Employees’ Welfare Pension Fund (koseinenkin); qualified retirement annuity plan; and lump-sum payment at retirement.
A number of consolidated subsidiaries have established defined contribution pension plans.
Effective October 1, 2010, the Company switched from the tax-qualified pension plan it had used previously to a defined contribution pension plan. In doing so, it applied the Guidance in Accounting for Transfers between Retirement Benefit Plans (ASBJ Guidance No. 1 issued on January 31, 2002).
Matters related to retirement benefit liabilities Millions of yen 2012 2013
Retirement benefit obligations (6,482) (6,797)
Pension plan assets 4,458 5,411
Unfunded retirement benefit obligations (2,023) (1,386)
Unrecognized actuarial gains or losses 511 (154)
Unrecognized prior service costs (51) (36)
Net retirement benefit obligations recognized on the consolidated balance sheets
(1,563) (1,576)
Prepaid pension costs (8) (10)
Provision for retirement benefits (1,571) (1,586)

F . C . C . C O . , L T D .
46
Matters related to retirement benefit expenses Millions of yen 2012 2013
Service costs 950 1,068
Interest costs 83 85
Expected returns on pension plan assets - -
Amortization of actuarial gains or losses 69 (21)
Amortization of prior service costs (14) (14)
Retirement benefit expenses 1,089 1,118
Service costs include amounts contributed to the Japan Auto Parts Industries Association Employees Pension Fund, which is an “integrated-type fund (sogo-gata)” involving multiple employers.
The following is information related to multiple employer pension plans, which treat required contributions as retirement expenses.
(1) Status of funding for the system as a whole
Millions of yen 2011 2012
Amount of pension assets 140,751 140,010
Pro forma pension obligations assumed under the pension program
163,335 164,426
Difference (22,583) (24,416)
(2) Premiums contributed by the FCC Group as a percentage of overall system premiums: 4.63% (for the month of March 2011) and 4.57% (for the month of March 2012)
(3) Supplemental remarks
The principal reasons for the difference shown in item (1) above are 19,710 million yen in past service costs and 4,705 million yen in reserve shortfalls, which are taken into consideration in calculations of pension financing. Under this system, past service costs are amortized in equal amounts over 19 years. In its financial statements, the FCC Group recognized a special contribution of 72 million yen for the year ended March 2011 and expensed 72 million yen for the year ended March 2012.
Assumptions underlying the calculation of retirement benefit liabilities 2012 2013
Term allocation of the estimated amount of retirement benefits
Prior fixed amount basis
Discount rate 1.5% 1.5%
Expected rate of return on pension plan assets 0.0% 0.0%
Amortization period of prior service costs 5 years 5 years
Amortization period of actuarial gains or losses 18 years (using the fixed-rate method based on the average number of years remaining in the tenure of employees as of the date on which the gains or losses arise; differences are expensed during the fiscal year in which they occur.)

F . C . C . C O . , L T D .
47
Deferred taxes Millions of yen 2012 2013
Deferred tax assets (current) 1,380 1,655
Deferred tax assets (noncurrent) 1,856 2,063
3,236 3,719
Deferred tax liabilities (current) (158) (169)
Deferred tax liabilities (noncurrent) (3,674) (4,088)
(3,833) (4,257)
Deferred tax assets (liabilities) - net (596) (537)
Percentage
Statutory tax rate 39.75% 37.20%
Differences in tax rates of overseas subsidiaries (11.38)% (7.04)%
Dividends and excluded income from overseas subsidiaries
(3.01)% (4.31)%
Overseas tax credits (3.47)% (2.53)%
Tax credits for testing and research-related expenses (2.64)% (1.81)%
Taxes withheld at source by overseas subsidiaries 0.72% 0.91%
Valuation allowance 2.11% 1.96%
Consolidated eliminations of dividends received 3.28% 4.68%
Other 2.00% 2.22%
Effective tax rates 27.36% 31.28%

F . C . C . C O . , L T D .
48
Related Parties Transactions with related parties
March 31; Millions of yen Address
Capital or investment
% of voting rights held (held by others) Relationship with related party
Type of transaction
Value of transactions
Accounting classification
Balance at term-end
2013
Parent company and primary institutional shareholders, etc.
86,067 Owned: Direct 21.68
Sales of the Company’s products
18,373 Accounts receivable - trade
1,461HONDA MOTOR CO., LTD.
Minato-ku, Tokyo
Sales of products and procurement of raw materials and components
Procurement of raw materials and components
3,264 Accounts payable - trade
312
2012
Parent company and primary institutional shareholders, etc.
86,067 Owned: Direct 21.68
Sales of the Company’s products
20,220 Accounts receivable - trade
3,783HONDA MOTOR CO., LTD.
Minato-ku, Tokyo
Sales of products and procurement of raw materials and components
Procurement of raw materials and components
3,526 Accounts payable - trade
603
Investments in non-consolidated companies March 31; Millions of yen 2012 2013
Investment securities (equity) 733 828

F . C . C . C O . , L T D .
49
Non-consolidated Financial Statements Non-consolidated statements of income Years ended March 31; Millions of yen 2012 2013
Net sales 43,759 45,260
Cost of sales
Beginning finished goods 665 684
Cost of products manufactured 32,594 32,939
Purchase of finished goods 2,104 2,287
Total 35,364 35,911
Ending finished goods 684 809
Cost of finished goods sold 34,679 35,102
Gross profit 9,079 10,158
Selling, general and administrative expenses
Packing and delivery expenses 688 765
Salaries and allowances 1,356 1,465
Provision for bonuses 195 232
Retirement benefit expenses 210 193
Depreciation 47 40
Research and development expenses 2,834 2,924
Other 1,363 1,474
Total selling, general and administrative expenses 6,695 7,095
Operating income 2,384 3,062
Non-operating income
Interest income 48 94
Interest on capital receivable 120 105
Dividends income 1,017 1,745
Rental income 2 1
Commissions on equipment sales 685 590
Foreign exchange gains - 986
Technical advisory fee 67 145
Other 54 61
Total non-operating income 1,997 3,731
Non-operating expenses
Interest expenses 8 -
Rent expenses 0 0
Foreign exchange losses 27 -
Other 0 0
Total non-operating expenses 36 0
Ordinary income 4,345 6,793

F . C . C . C O . , L T D .
50
Years ended March 31; Millions of yen 2012 2013
Extraordinary income
Gain on sales of noncurrent assets 0 6
Subsidy income 40 -
Total extraordinary income 41 6
Extraordinary loss
Loss on sales and retirement of noncurrent assets 52 141
Loss on valuation of stocks of subsidiaries and affiliates 268 -
Total extraordinary losses 320 141
Income before income taxes 4,065 6,658
Income taxes - current 773 1,755
Income taxes - deferred 18 68
Total income taxes 791 1,823
Net income 3,274 4,834

F . C . C . C O . , L T D .
51
Non-consolidated statements of changes in net assets Years ended March 31; Millions of yen 2012 2013
Shareholders' equity
Capital stock
Balance at the beginning of current period 4,175 4,175
Changes of items during the period
Total changes of items during the period - -
Balance at the end of current period 4,175 4,175
Capital surplus
Legal capital surplus
Balance at the beginning of current period 4,555 4,555
Changes of items during the period
Total changes of items during the period - -
Balance at the end of current period 4,555 4,555
Other capital surplus
Balance at the beginning of current period 10 10
Changes of items during the period
Total changes of items during the period - -
Balance at the end of current period 10 10
Total capital surplus
Balance at the beginning of current period 4,566 4,566
Changes of items during the period
Total changes of items during the period - -
Balance at the end of current period 4,566 4,566
Retained earnings
Legal retained earnings
Balance at the beginning of current period 1,043 1,043
Changes of items during the period
Total changes of items during the period - -
Balance at the end of current period 1,043 1,043
Other retained earnings
Reserve for dividends
Balance at the beginning of current period 1,600 1,600
Changes of items during the period
Total changes of items during the period - -
Balance at the end of current period 1,600 1,600
Reserve for special depreciation
Balance at the beginning of current period 2 -
Changes of items during the period
Reversal of reserve for special depreciation (3) -
Provision of reserve for special depreciation 0 -
Total changes of items during the period (2) -
Balance at the end of current period - -
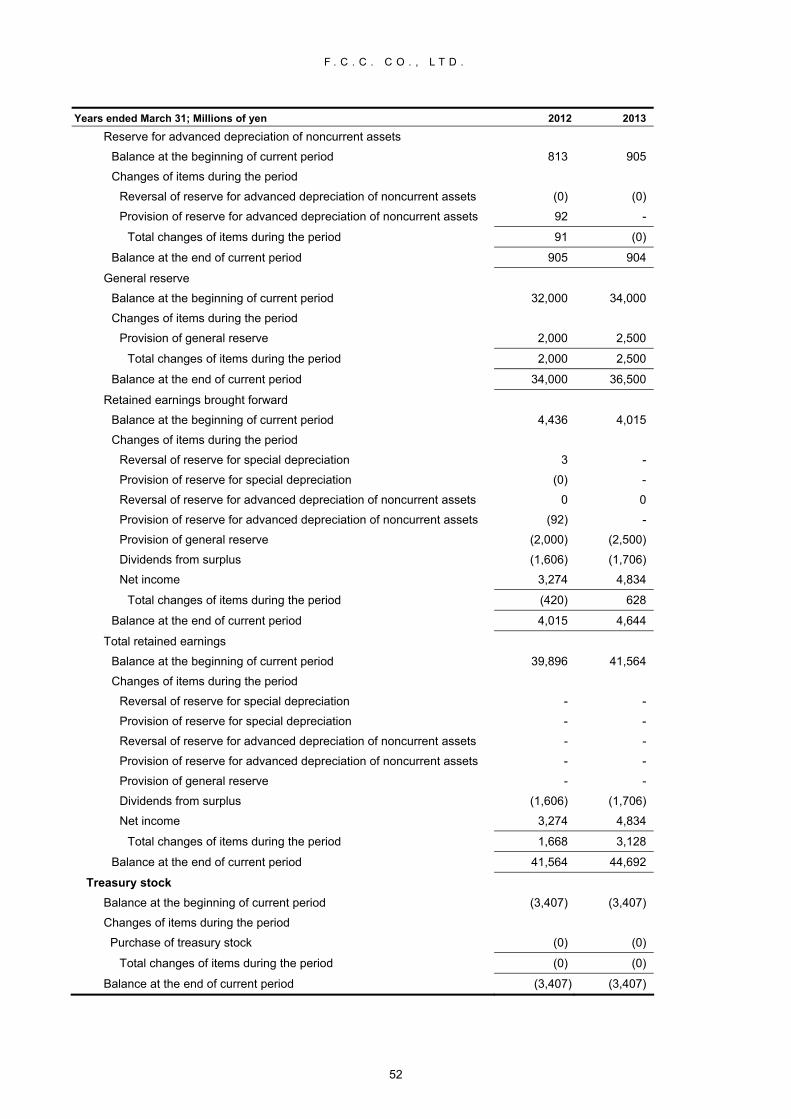
F . C . C . C O . , L T D .
52
Years ended March 31; Millions of yen 2012 2013
Reserve for advanced depreciation of noncurrent assets
Balance at the beginning of current period 813 905
Changes of items during the period
Reversal of reserve for advanced depreciation of noncurrent assets (0) (0)
Provision of reserve for advanced depreciation of noncurrent assets 92 -
Total changes of items during the period 91 (0)
Balance at the end of current period 905 904
General reserve
Balance at the beginning of current period 32,000 34,000
Changes of items during the period
Provision of general reserve 2,000 2,500
Total changes of items during the period 2,000 2,500
Balance at the end of current period 34,000 36,500
Retained earnings brought forward
Balance at the beginning of current period 4,436 4,015
Changes of items during the period
Reversal of reserve for special depreciation 3 -
Provision of reserve for special depreciation (0) -
Reversal of reserve for advanced depreciation of noncurrent assets 0 0
Provision of reserve for advanced depreciation of noncurrent assets (92) -
Provision of general reserve (2,000) (2,500)
Dividends from surplus (1,606) (1,706)
Net income 3,274 4,834
Total changes of items during the period (420) 628
Balance at the end of current period 4,015 4,644
Total retained earnings
Balance at the beginning of current period 39,896 41,564
Changes of items during the period
Reversal of reserve for special depreciation - -
Provision of reserve for special depreciation - -
Reversal of reserve for advanced depreciation of noncurrent assets - -
Provision of reserve for advanced depreciation of noncurrent assets - -
Provision of general reserve - -
Dividends from surplus (1,606) (1,706)
Net income 3,274 4,834
Total changes of items during the period 1,668 3,128
Balance at the end of current period 41,564 44,692
Treasury stock
Balance at the beginning of current period (3,407) (3,407)
Changes of items during the period
Purchase of treasury stock (0) (0)
Total changes of items during the period (0) (0)
Balance at the end of current period (3,407) (3,407)

F . C . C . C O . , L T D .
53
Years ended March 31; Millions of yen 2012 2013
Total shareholders' equity
Balance at the beginning of current period 45,231 46,899
Changes of items during the period
Dividends from surplus (1,606) (1,706)
Net income 3,274 4,834
Purchase of treasury stock (0) (0)
Total changes of items during the period 1,668 3,127
Balance at the end of current period 46,899 50,027
Valuation and translation adjustments
Valuation difference on available-for-sale securities
Balance at the beginning of current period 2,692 2,945
Changes of items during the period
Net changes of items other than shareholders' equity 253 530
Total changes of items during the period 253 530
Balance at the end of current period 2,945 3,476
Total valuation and translation adjustments
Balance at the beginning of current period 2,692 2,945
Changes of items during the period
Net changes of items other than shareholders' equity 253 530
Total changes of items during the period 253 530
Balance at the end of current period 2,945 3,476
Total net assets
Balance at the beginning of current period 47,923 49,845
Changes of items during the period
Dividends from surplus (1,606) (1,706)
Net income 3,274 4,834
Purchase of treasury stock (0) (0)
Net changes of items other than shareholders' equity 253 530
Total changes of items during the period 1,921 3,658
Balance at the end of current period 49,845 53,503

F . C . C . C O . , L T D .
54
Cost of goods sold Years ended March 31; Millions of yen 2012 % 2013 %
Cost of materials 23,523 67.0 24,369 68.3
Labor costs 6,190 17.6 5,900 16.6
Manufacturing overhead
Subcontracted processing expenses 1,620 1,707
Depreciation 1,545 1,227
Expenses for electricity and power 401 400
Other 1,843 2,058
5,409 15.4 5,393 15.1
Total manufacturing costs for the term 35,124 100.0 35,664 100.0
Beginning work in process 1,186 1,129
36,310 36,793
Transfers to other accounts 2,586 2,887
Ending work in process 1,129 967
Cost of products manufactured 32,594 32,939
Transfers to other accounts
Supplies 2,241 2,495
Construction in progress 170 255
Research and development expenses 174 135
Selling, general and administrative expenses, etc. 0 0
2,586 2,887

F . C . C . C O . , L T D .
55
Non-consolidated balance sheets Assets March 31; Millions of yen 2012 2013
Current assets
Cash and deposits 6,527 8,249
Notes receivable - trade 3 6
Accounts receivable - trade 8,703 7,355
Merchandise and finished goods 684 809
Work in process 1,129 967
Raw materials and supplies 2,207 2,257
Prepaid expenses 51 47
Deferred tax assets 720 770
Short-term loans receivable from subsidiaries and affiliates 2,723 2,600
Accounts receivable - other 759 866
Other 116 138
Allowance for doubtful accounts (2) (5)
Total current assets 23,626 24,064
Noncurrent assets
Property, plant and equipment
Buildings 10,275 10,326
Accumulated depreciation (5,596) (6,091)
Buildings, net 4,679 4,234
Structures 1,548 1,549
Accumulated depreciation (956) (1,047)
Structures, net 592 501
Machinery and equipment 22,566 21,464
Accumulated depreciation (19,452) (18,257)
Machinery and equipment, net 3,113 3,206
Vehicles 152 161
Accumulated depreciation (138) (137)
Vehicles, net 14 24
Tools, furniture and fixtures 5,743 5,206
Accumulated depreciation (5,414) (4,762)
Tools, furniture and fixtures, net 329 443
Land 5,382 5,382
Construction in progress 255 817
Total property, plant and equipment 14,367 14,611

F . C . C . C O . , L T D .
56
March 31; Millions of yen 2012 2013
Intangible assets
Telephone subscription right 3 3
Software 87 87
Software in progress - 32
Other 2 1
Total intangible assets 93 125
Investments and other assets
Investment securities 539 657
Stocks of subsidiaries and affiliates 18,676 18,725
Investments in capital 4 4
Investments in capital of subsidiaries and affiliates 3,022 4,586
Long-term loans to employees 154 156
Long-term loans receivable from subsidiaries and affiliates 400 1,000
Long-term prepaid expenses - 23
Long-term deposits 648 648
Other 59 55
Allowance for doubtful accounts (43) (38)
Total investments and other assets 23,461 25,819
Total noncurrent assets 37,922 40,556
Total assets 61,548 64,620

F . C . C . C O . , L T D .
57
Liabilities and net assets March 31; Millions of yen 2012 2013
Current liabilities
Notes payable - trade 560 458
Accounts payable - trade 3,720 2,625
Factoring liabilities 2,342 1,918
Accounts payable - other 733 794
Accrued expenses 301 304
Income taxes payable 153 1,078
Advances received 3 1
Deposits received 94 96
Provision for bonuses 1,048 1,097
Other 0 1
Total current liabilities 8,958 8,376
Noncurrent liabilities
Deferred tax liabilities 1,587 1,971
Provision for retirement benefits 794 626
Asset retirement obligations 37 37
Other 325 105
Total noncurrent liabilities 2,744 2,740
Total liabilities 11,703 11,116
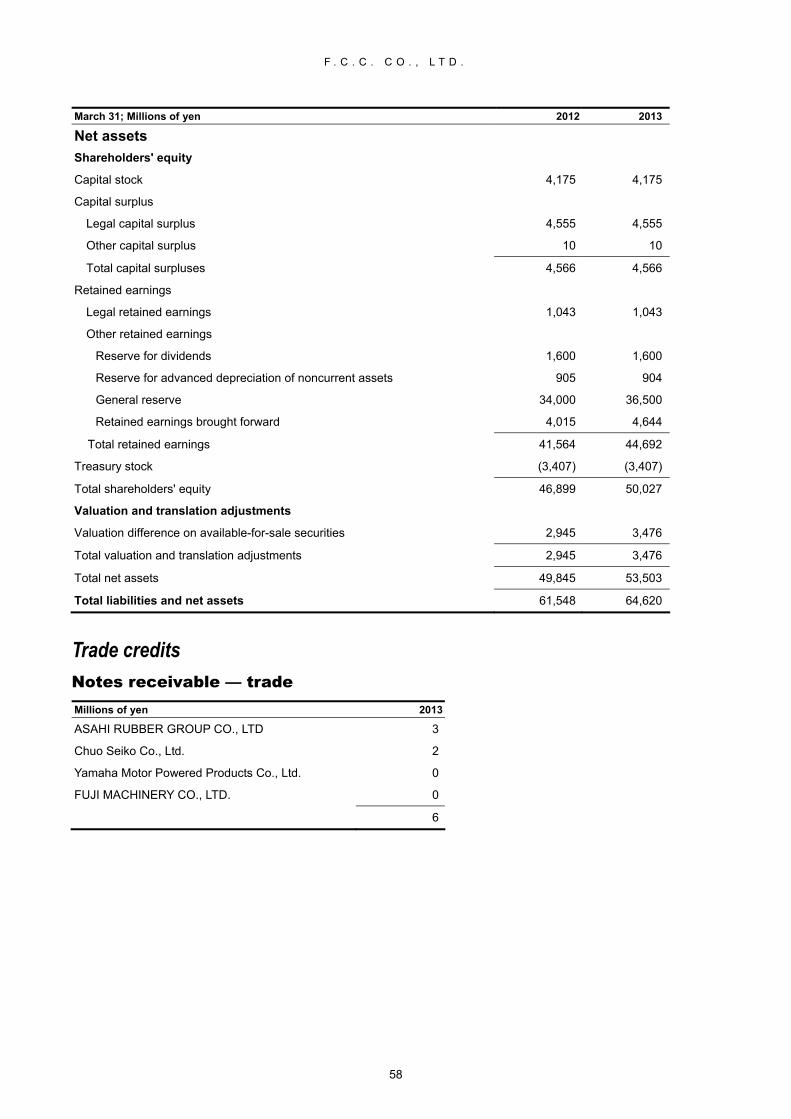
F . C . C . C O . , L T D .
58
March 31; Millions of yen 2012 2013
Net assets
Shareholders' equity
Capital stock 4,175 4,175
Capital surplus
Legal capital surplus 4,555 4,555
Other capital surplus 10 10
Total capital surpluses 4,566 4,566
Retained earnings
Legal retained earnings 1,043 1,043
Other retained earnings
Reserve for dividends 1,600 1,600
Reserve for advanced depreciation of noncurrent assets 905 904
General reserve 34,000 36,500
Retained earnings brought forward 4,015 4,644
Total retained earnings 41,564 44,692
Treasury stock (3,407) (3,407)
Total shareholders' equity 46,899 50,027
Valuation and translation adjustments
Valuation difference on available-for-sale securities 2,945 3,476
Total valuation and translation adjustments 2,945 3,476
Total net assets 49,845 53,503
Total liabilities and net assets 61,548 64,620
Trade credits Notes receivable — trade Millions of yen 2013
ASAHI RUBBER GROUP CO., LTD 3
Chuo Seiko Co., Ltd. 2
Yamaha Motor Powered Products Co., Ltd. 0
FUJI MACHINERY CO., LTD. 0
6
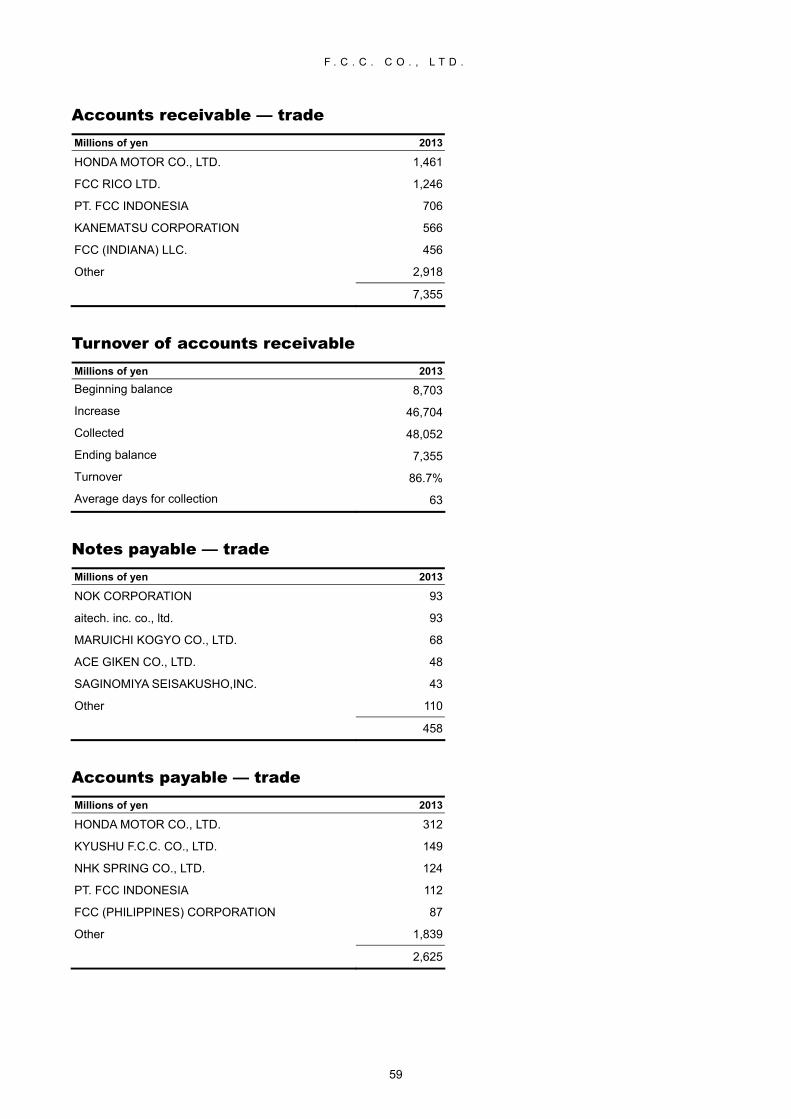
F . C . C . C O . , L T D .
59
Accounts receivable — trade Millions of yen 2013
HONDA MOTOR CO., LTD. 1,461
FCC RICO LTD. 1,246
PT. FCC INDONESIA 706
KANEMATSU CORPORATION 566
FCC (INDIANA) LLC. 456
Other 2,918
7,355
Turnover of accounts receivable Millions of yen 2013
Beginning balance 8,703
Increase 46,704
Collected 48,052
Ending balance 7,355
Turnover 86.7%
Average days for collection 63
Notes payable — trade Millions of yen 2013
NOK CORPORATION 93
aitech. inc. co., ltd. 93
MARUICHI KOGYO CO., LTD. 68
ACE GIKEN CO., LTD. 48
SAGINOMIYA SEISAKUSHO,INC. 43
Other 110
458
Accounts payable — trade Millions of yen 2013
HONDA MOTOR CO., LTD. 312
KYUSHU F.C.C. CO., LTD. 149
NHK SPRING CO., LTD. 124
PT. FCC INDONESIA 112
FCC (PHILIPPINES) CORPORATION 87
Other 1,839
2,625

F . C . C . C O . , L T D .
60
Securities
Financial instruments
Policy with respect to financial instruments
The Company limits its investments of surplus cash to short-term deposits, etc., and finances its operations through bank loans. It does not, as a rule, engage in derivative transactions.
Types of financial instruments and their attendant risks; the Company’s policies for managing these risks
Trade receivables: The Company is exposed to the credit risks of its customers. It deals with these risks by monitoring the timeliness of each customer’s payments and managing outstanding balances in accordance with the Group’s credit management policies. In addition, the Company carries out periodic assessments of the credit status of its major customers.
Foreign currency-denominated receivables: The Company deals with risks associated with fluctuating foreign currencies through measures aimed at minimizing such risks.
Stocks: The Company is exposed to the risk of fluctuations in the market prices of stocks. Its holdings, however, are primarily in companies with which it has operational relationships. It monitors the market prices of these shares on a quarterly basis.
Trade payables and factoring-related liabilities: Payment terms are less than one year.
Bank debt: Short-term loans payable are used mainly to finance operating transactions.
The assumption of trade payables and bank debt exposes the Company to liquidity risk, which each company in the Group deals with by preparing a monthly cash flow plan and managing its liabilities according to this plan.

F . C . C . C O . , L T D .
61
Items related to current value 2012 2013
Millions of yen Book value Current value
Unrealized
gain (loss) Book value Current value
Unrealized
gain (loss)
Cash and deposits 20,865 20,865 - 24,198 24,198 -
Notes and accounts receivable - trade 16,769 16,769 - 17,554 17,554 -
Investment securities 6,027 6,027 - 6,916 6,916 -
Total assets 43,662 43,662 - 48,669 48,669 -
Notes and accounts payable - trade 8,851 8,851 - 8,590 8,590 -
Factoring liabilities 2,453 2,453 - 2,003 2,003 -
Short-term loans payable 206 206 - 291 291 -
Total liabilities 11,511 11,511 - 10,885 10,885 -
Methods of calculating current value Cash and deposits; notes and accounts receivable - trade: book value
Investment securities: market value
Notes and accounts payable - trade; factoring liabilities; short-term loans payable: book value
Financial instruments with no easily ascertainable current value
Millions of yen 2012 2013
Unlisted stocks 802 906
Repayment schedule for receivables after accounting date
Millions of yen Up to 1 yearGreater than 1 and
up to 5 yearsGreater than 5 and
up to 10 years Greater than
10 years
2013
Cash and deposits 24,198 - - -
Notes and accounts receivable - trade 17,554 - - -
41,753 - - -
2012
Cash and deposits 20,865 - - -
Notes and accounts receivable - trade 16,769 - - -
37,635 - - -

F . C . C . C O . , L T D .
62
Marketable and investment securities Millions of yen
Stocks
Number of
shares Book value
Investment securities
Other securities
Stanley Electric Co., Ltd. (6923) 137,975 228
SUZUKI MOTOR CORPORATION (7269) 52,500 110
KANEMATSU CORPORATION (8020) 821,000 100
Mizuho Financial Group, Inc. (preferred stock) 100,000 70
Mizuho Financial Group, Inc. (8411) 178,688 35
Nikkan Co., Ltd. 33,582 33
Sumitomo Mitsui Financial Group, Inc. (8316) 5,755 21
MUSASHI SEIMITSU INDUSTRY CO., LTD. (7220) 6,000 12
SHIMIZU CORPORATION (1803) 39,000 11
Mitsubishi UFJ Financial Group, Inc. (8306) 15,360 8
Others (14 shares) 24,831 22
1,414,691 657
Property, plant and equipment
Millions of yen Beginning of
term Increase Decrease End of term Depreciation End of term,
net
Accumulated Current
Property, plant and equipment
Buildings 10,275 133 82 10,326 6,091 534 4,234
Structures 1.548 0 0 1,549 1,047 91 501
Machinery and equipment 22,566 950 2,052 21,464 18.257 639 3,206
Vehicles 152 15 7 161 137 5 24
Tools, furniture and fixtures 5,743 240 778 5,206 4,762 120 443
Land 5,382 - - 5,382 - - 5,382
Construction in progress 255 1,193 630 817 - - 817
45,924 2,535 3,551 44,909 30,297 1,392 14,611
Intangible assets
Patent right 88 - - 88 88 - -
Telephone subscription right 3 - - 3 - - 3
Software 188 35 - 224 137 35 87
Software in progress - 32 - 32 - - 32
Others 4 - - 4 2 0 1
285 68 - 353 228 35 125
Long-term prepaid expenses - 26 3 23 - - 23

F . C . C . C O . , L T D .
63
Allowances
Millions of yen Beginning of
term Increase Decrease End of term
Allowance for doubtful accounts 45 3 4 43
Provision for bonuses 1,048 1,097 1,048 1,097

F . C . C . C O . , L T D .
64
Accounting Policies Summary of accounting policies: consolidated
Basis of presentation Japanese GAAP
Marketable and investment securities
Other securities: Quoted securities: The market value method is applied, based on the market value as of the fiscal year-end. The entire positive or negative valuation difference from the purchase price is booked directly as net assets, and the cost of securities sold is calculated using the periodic average method.
Unquoted securities: valued at cost using the periodic average method
Inventories Finished goods and work in process: valued at cost, computed on a periodic average basis (where amounts shown on the balance sheet take into account declines in book values based on reduced outlooks for profitability). Raw materials and supplies: valued at cost, computed on a FIFO basis (where amounts shown on the balance sheet take into account declines in book values based on reduced outlooks for profitability).
Depreciation Property, plant and equipment: straight-line method
Intangible assets: straight-line method Software for internal use is amortized on a straight-line basis (based on a length of useful internal life of 5 years).
Allowance for doubtful accounts To provide for potential losses from doubtful accounts, the Company recognizes an amount calculated based on the historical default ratio for general accounts receivable, plus an amount for specific accounts for which collection appears doubtful.
Provision for bonuses Recognized based on standards for estimated bonus expenses.
Provision for retirement benefits To provide for employees' retirement benefits, the Company recognizes an amount based on retirement benefit liabilities and estimated pension assets as of the end of the fiscal year to March 2013.
Provision for loss on business liquidation
To provide for losses arising from the liquidation of businesses, the Company recognizes the amount of the projected loss.
Opinion of independent auditors Auditors: Yasumori Audit Corporation Opinion: unqualified
(Change in method of depreciation)
• From the declining-balance method to the straight-line method
The Company and its consolidated subsidiaries in Japan had been using the declining-balance method (except with respect to buildings purchased after April 1, 1998, which were depreciated using the straight-line method). An assessment by the Company determined that the straight-line method would better reflect the manner in which the F.C.C. Group operates as it prepares for significant capital investments and upgrades in the future; it based its judgment on the following: - A reassessment of how such property, plant and equipment are actually being used - The need to unify accounting methods as the F.C.C. Group develops further as a global enterprise
• The financial effects of this change in policy
Operating income, ordinary income, and income before income taxes and minority interests each increased by 1,402 million yen

F . C . C . C O . , L T D .
65
Summary of accounting policies: non-consolidated
Basis of presentation Japanese GAAP
Marketable and investment securities
Shares in subsidiaries and affiliated companies: valued at cost using the periodic average method
Other securities: Quoted securities: The market value method is applied, based on the market value as of the fiscal year-end. The entire positive or negative valuation difference from the purchase price is booked directly as net assets, and the cost of securities sold is calculated using the periodic average method.
Unquoted securities: valued at cost using the periodic average method
Inventories Finished goods and work in process: valued at cost, computed on a periodic average basis (where amounts shown on the balance sheet take into account declines in book values based on reduced outlooks for profitability). Raw materials and supplies: valued at cost, computed on a FIFO basis (where amounts shown on the balance sheet take into account declines in book values based on reduced outlooks for profitability).
Depreciation Property, plant and equipment: straight-line method
Intangible assets: straight-line method Software for internal use is amortized on a straight-line basis (based on a length of useful internal life of 5 years).
Allowance for doubtful accounts To provide for potential losses from doubtful accounts, the Company recognizes an amount calculated based on the historical default ratio for general accounts receivable, plus an amount for specific accounts for which collection appears doubtful.
Provision for bonuses Recognized based on standards for estimated bonus expenses.
Provision for retirement benefits To provide for employees' retirement benefits, the Company recognizes an amount based on retirement benefit liabilities and estimated pension assets as of the end of the fiscal year to March 2013.
Opinion of independent auditors Auditors: Yasumori Audit Corporation Opinion: unqualified
(Change in method of depreciation)
• From the declining-balance method to the straight-line method
- The Company had been using the declining-balance method (except with respect to buildings purchased after April 1, 1998, which were depreciated using the straight-line method)
• An assessment by the Company determined that the straight-line method would better reflect the manner in which the Company operates as it prepares for significant capital investments and upgrades in the future; it based its judgment on the following:
- A reassessment of how such property, plant and equipment are actually being used
• The financial effects of this change in policy: non-consolidated operating income, ordinary income, and income before income taxes each increased by 535 million yen

F . C . C . C O . , L T D .
66
Share-related Information Shares in issue
Types of stock Common
Number of shares authorized 90,000,000
Issued
As of March 31, 2013 52,644,030
As of June 25, 2013 52,644,030
Stock exchange listings Tokyo Stock Exchange, First Section
Comments 100-share min. trading unit
Changes in capital stock and number of shares outstanding Shares outstanding Capital stock Legal capital surplus
Increase or
decrease Balance Increase or
decrease BalanceIncrease or
decrease Balance Remarks
Shares Millions of yen Millions of yen
April 1, 2006 26,322,015 52,644,030 - 4,175 - 4,555 Split 2 for 1
Shareholders by type of investor
Type of investor Number of
shareholdersNumber of units
owned % owned
Financial institutions 38 103,708 19.71
Financial instrument firms 21 1,334 0.25
Business and other corporations 109 143,178 27.20
Non-residents (businesses and corporations) 135 144,829 27.52
Non-residents (individuals) 4 44 0.01
Individuals and other 11,630 133,229 25.31
11,937 526,322 100.00
Shares less than one unit 11,830

F . C . C . C O . , L T D .
67
Largest shareholders
Name Hundreds of
shares owned% of shares outstanding
HONDA MOTOR CO., LTD. 108,812 20.66
Japan Trustee Services Bank, Ltd. 55,509 10.54
Yoshihide Yamamoto 22,623 4.29
BNP Paribas Sec Service Luxembourg Jasdec Aberdeen Global Client Assets
20,418 3.87
Y.A Co., Ltd. 20,194 3.83
Trust & Custody Services Bank, Ltd. 19,835 3.76
NORTHERN TRUST CO. (AVFC) SUB A/C AMERICAN CLIENTS
17,452 3.31
State Street Bank and Trust Company 15,428 2.93
Mellon Bank NA as Agent for Its Client Mellon Omnibus US Pension
13,766 2.61
Ei Yamamoto 13,009 2.47
307,049 58.32
Share information
Business year April 1 - March 31
Ex-rights date March 31
Dates of record for dividends September 30 and March 31
Annual General Meeting of Shareholders June
Trading unit 100 shares
Transfer agent Mizuho Trust & Banking Co., Ltd., 1-2-1 Yaesu, Chuo-ku, Tokyo
Publication of record The Nihon Keizai Shimbun

F . C . C . C O . , L T D .
68
Contact Ryujiro Matsumoto Director, Management and Administration F.C.C. CO., LTD. 7000-36 Nakagawa, Hosoe-cho, Kita-ku, Hamamatsu-shi, Shizuoka 431-1394 Tel.: +81-53-523-2400 Fax: +81-53-523-2405

001
C M Y K
Fiscal Year Ended
Traded
Stock Code
March 31, 2013
TSE1
7296
F.C.C. CO., LTD.
YUHO REPORTAnnual
7000-36, Nakagawa, Hosoe-cho, Kita-ku, Hamamatsu-shi, Shizuoka, 431-1394, JapanTelephone: 81-53-523-2400Facsimile: 81-53-523-2405URL: http://www.fcc-net.co.jp/
Printed in Japan
F.C.C. CO., LTD.