Embed Size (px)
Citation preview
1
FEAR OF CRIME, INCIVILITIES, AND COLLECTIVE EFFICACY IN FOUR MIAMI NEIGHBORHOODS
Marc L. Swatt, Ph.D. Assistant Professor – School of Criminology and Criminal Justice University of Nebraska Omaha CPACS Building 218F 6001 Dodge Street Omaha, NE 68182-0149 Email: [email protected] Ph: 402-554-4057 Marc L. Swatt is an Assistant Professor in the School of Criminology and Criminal Justice at the University of Nebraska at Omaha. His recent publications have appeared in Justice Quarterly, Journal of Quantitative Criminology, Crime and Delinquency, and Journal of Criminal Justice. His current research interests include quantitative methods, criminological theory, neighborhoods and crime, and spatial crime analysis Sean P. Varano, Ph.D. Assistant Professor – School of Justice Studies Roger Williams University CAS 145 - School of Justice Studies One Old Ferry Rd. Bristol, RI 02809 Email: [email protected] Ph: (401) 254-3738 Sean P. Varano is an Assistant Professor in the School of Justice Studies at Roger Williams University. His recent publications have appeared in Crime and Delinquency and the Journal of Criminal Justice. His research interests include policing, gangs, and the effectiveness of violence reduction strategies. Craig D. Uchida, Ph.D. President, Justice & Security Strategies, Inc. PO Box 6188 Silver Spring, Maryland 20916 Email: [email protected] Ph: (301) 438 - 3132 Craig D. Uchida is President of Justice & Security Strategies, Inc., a consulting firm that specializes in criminal justice and public policy issues. He has written numerous monographs and edited two books. His publications have appeared in Crime and Delinquency, Journal of Criminal Law and Criminology, and Journal of Research in Crime and Delinquency. His research interests include predictive policing, gangs, and violence. Shellie E. Solomon, M.A. Chief Executive Officer, Justice & Security Strategies, Inc. 1835 East Hallandale Beach Blvd # 387 Hallandale Beach, FL 33009 Email: [email protected] Ph: (954) 458-6465

2
Shelllie E. Solomon is the Chief Executive Office of Justice & Security Strategies, Inc. She has written numerous monographs, and government publications. Her research interests include children of inmates, gangs, mortgage fraud, and violence prevention. With the assistance of: Christine Connor, Jonathan Mash, Corina Putt, W. Riley Waugh, and Robert Adams ACKNOWLEDGEMENTS
We gratefully acknowledge funding from the Children’s Trust of Miami–Dade to Justice & Security Strategies, Inc. for the “Mapping and Spatial Analysis to Study Youth Violence and Social Disorganization Project” (contract number 864-234) of which this is a part. The Trust is a dedicated source of revenue established by voter referendum to improve the lives of children and families in Miami-Dade County. The findings, conclusions, and recommendations expressed in this paper are those of the authors and do not necessarily reflect those of the Children's Trust.

3
FEAR OF CRIME, INCIVILITIES, AND COLLECTIVE EFFICACY IN FOUR MIAMI NEIGHBORHOODS
Abstract
Extant literature indicates that individual perceptions of collective efficacy and
incivilities are important in explaining fear of crime. Using field interviews with a sample of
residents from four neighborhoods within Miami-Dade County, the current study examines the
degree to which perceptions of incivilities mediates the relationship between collective efficacy
and fear of crime. In the combined sample, results indicate that perceptions of collective efficacy
perfectly mediates the relationship between collective efficacy and fear of crime. However,
results from considering each neighborhood separately suggests substantial heterogeneity in the
social processes that govern fear of crime. In one neighborhood, there is evidence for perfect
mediation. In the second neighborhood there is evidence for partial mediation. In the third
neighborhood, only perceptions of incivilities is an important predictor of fear of crime. Finally,
in the fourth neighborhood, neither collective efficacy nor perceptions of incivilities predict fear
of crime. These results suggest that ignoring the context within neighborhoods may lead to
oversimplification of the processes at work. Implications for future research and policy are
discussed.
Keywords: Collective Efficacy, Incivilities, Fear of Crime

4
INTRODUCTION
There is a well-established connection between neighborhood conditions and well known
deleterious conditions including serious violent crime (Bursik & Grasmik, 1993; Messner &
Tardiff, 1986; Sampson &Groves, 1989), gang membership (Hill, Howell, Hawkins, & Battin-
Pearson, 1999), school problems (Kirk, 2009; McCluskey, Patchin, & Bynum, 2004), and fear of
crime (Wyant, 2008). Neighborhoods play important roles in lives of those that live, work, and
socialize in their boundaries. They are one of several “zones” of influence that shape individuals’
sense the world beyond their immediate selves and family units. Neighborhoods create the
physical and social context for interactions among neighborhood residents that help shape
notions of “community” and individuals perceptions of their wider social space.
In order to identify the mechanisms that both inhibit the development of negative
neighborhood conditions and promote healthier communities, considerable attention has been
given to the concept of collective efficacy. For decades scholars have noted that communities
differ in their capacity to create and enforce normative levels of pro-social behavior (see
Kornhauser, 1978; Bursik, 1988; Warner, 2007). Networks of informal social control are central
to establishing value systems that are reflective of prevailing social norms. Collective efficacy
eventually emerged as the central process whereby community members create a sense of agency
(see Sampson, et al. 1997) and assume ownership for the state of the community. It is one of
several forms of formal and informal social control that predicts the overall functioning of a
community (Warner, 2007). The purpose of this research is to understand the relationships
among the perceptions of physical disorder (incivilities), collective efficacy, and fear of crime.
COLLECTIVE EFFICACY, INCIVILITIES, AND FEAR OF CRIME
5
The concept of collective efficacy emerged out of the social disorganization literature. It
represents the capacity of residents, organizations, and other groups to exert social control and
thereby reduce crime and violence. Sampson argues that collective efficacy includes working
trust among residents and the willingness to intervene to achieve social control. Neighborhood
collective efficacy “captures the link between cohesion, especially working trust, and shared
expectations for action…” The promise of collective efficacy theory is “that it reaffirms the
importance of thinking about social ways to approach social problems” (Sampson, 2004).
Collective efficacy has important implications for how neighborhoods are informally
managed by residents. Research shows that neighborhoods with higher levels of collective
efficacy generally experience lower levels of violence (Sampson, Raudenbush, & Earls, 1997).
Within this model, social control is produced through modalities of intervention into problems by
neighborhood occupants. In the most explicit sense, collective efficacy is expected to result in
“direct” intervention to ameliorate problems. Warner (2007), for example, argues direct informal
social control is when individuals take personal action to address an issue, and indirect informal
social control is when third parties (e.g., governmental authorities) are mobilized by residents.
More recent research suggests that collective efficacy works through other pathways, such as
informal parenting styles, to create pro-social norms. Simons, Simons, Burt, Brody, and Cutrona
(2005) suggest that increasing levels of collective efficacy in a neighborhood produces increases
in authoritative parenting (see Baumrind, 1967). Both collective efficacy and authoritative
parenting together in turn serve a deterrent function to discourage delinquent behavior in young
people. Thus, the research suggests that features of neighborhoods, collective efficacy in
particular, have important influences on neighborhood crime and disorder levels.

6
The role of collective efficacy in promoting safe, healthy community conditions is worth
considering for several reasons. As Morenoff, Sampson, and Raudenbush (2001: 519) noted,
“Neighborhoods bereft of social capital (e.g., interlocking social networks) are less able to
realize common values and maintain the informal social control that foster safety.” Collective
efficacy is an important neighborhood-level process that functions as an intermediary between
neighborhood conditions and disorder. For decades, scholars have attempted to understand the
processes whereby some neighborhoods with high levels of economic disenfranchised were able
to somehow promote pro-social values and control disorderly behavior. That is, not all poor and
impoverished communities suffered the same levels of crime and disorder. Wilson (1996)
posited that many residents of poor communities were involved in tightly interconnected social
networks that functioned as protective factors against crime and disorder. These social networks
were argued to be critical in not only promoting pro-social values, but preventing serious
violence. Research lends support for the conclusion that collective efficacy is a key social
process in the production of violence. Neighborhoods with low collective efficacy, for example,
experience significantly higher levels of crime, particularly serious violent crime such as
homicide (Morenoff, et al, 2001). Thus, it is important to understand the sources of collective
efficacy and the protective role it plays, particularly in at-risk communities.
One way that collective efficacy is linked to crime is through incivilities. Incivilities
represent the presence of physical and/or social disorder that have a noxious effect on the
condition of neighborhood environments. Incivilities such as unattended physical environments
and the regular presence of groups of unruly and disruptive youth can escalate the deterioration
of neighborhoods and leads to crime (see Kelling & Coles, 1996). The presence of incivilities
has been shown to reduce individuals’ sense of satisfaction with their neighborhoods and also
7
increase fear of crime. Robinson, Lawton, Taylor, and Perkins (2003), for example, reported a
lagged effect to perceived incivilities whereby perceived incivilities result in an increase in
vulnerability, fear of crime, and decrease in overall levels of neighborhood satisfaction. Yet as
Robinson et al. (2003) suggest, this relationship may very well be recursive where fear of crime
also changes perceptions of incivilities. Regardless, this relationship appears consistently strong
in urban areas. Reisig and Cancino (2004) also confirm the relationship exists in areas other than
highly urbanized communities. Their research shows that even in relatively rural,
nonmetropolitan areas, there is a significant negative relationship between perceived incivilities
and collective efficacy. That is, net of other structural control variables, collective efficacy and
incivilities were negatively associated. These relationships have been largely replicated by
Wyant (2008) who found perceived incivilities to be a consistently significant and positive
predictor of fear of crime. Wyant (2008) also found that while actual incivilities, measured
through systematic social observations of social spaces, was also a significant predictor of fear,
its impact all but disappeared when crime measures were included in the model. Thus, it is likely
that perceptions of incivilities are a stronger predictor of fear of crime than actual incivilities.
There is a growing body of evidence that neighborhood conditions such as incivilities
have both a direct and indirect effect on negative outcomes such as fear of crime. Using
structural equation modeling, Gibson, Zhao, Lovrich, and Gaffney (2002) reported that perceived
incivilities had both a direct, positive effect on fear of crime, but that the relationship was also
mitigated to some degree through collective efficacy. Thus, the effects of incivilities can be
reduced in communities with higher levels of informal social control. Gibson et al’s (2002)
findings were consistent across three different cities.

8
While the Gibson et al. (2002) study demonstrates the linkages between collective
efficacy, incivilities, and fear of crime, the study did not consider whether these relationships
vary within communities. As Oberwittler and Wikström (2009) suggest, there is substantial
variability in collective efficacy in units of analysis smaller than a neighborhood. If there is
additional within neighborhood variability, it is possible that the relationships between collective
efficacy, perceptions of incivilities, and fear of crime differ between neighborhoods. The purpose
of the current research is to add to the existing body of literature that considers the relationships
between incivilities, collective efficacy and fear of crime. Specifically, this research uses surveys
of a representative sample of neighborhood residents collected from four neighborhoods in
Miami-Dade County, Florida to examine whether the relationships between collective efficacy,
incivilities, and fear of crime differ between these neighborhoods.
METHODS
Study Location
The data used in this research comes from a larger study that examines the relationship
between collective efficacy and crime in Miami-Dade County and is funded by the Children’s
Trust of Miami-Dade County in order to better understand the neighborhood dynamics, such as
collective efficacy, that are associated with the development of crime. The current research uses
resident survey data from the Brownsville, Bunche Park, Seminole Wayside Park, and East Little
Havana neighborhoods, which were of particular interest to the funding agency.
Brownsville is an unincorporated neighborhood of mixed residential and commercial
properties partly located in the core urban area of the City of Miami and partly within the north
central corner of Miami-Dade County. The City of Miami and the Miami-Dade Police
Department provide policing services in their respective jurisdictions. About 39,000 people live
9
in Brownsville and according to the 2000 census the racial distribution was 6% White, 91%
African American, and 3% of other races. Hispanic or Latino of any race was a little over 8% of
the population. Brownsville accounted for 120 homicides or approximately 11 percent of all
homicides in Miami Dade County from 2004 to 2008 (Uchida, Solomon, Varano, Swatt, Putt,
Connor, & Mash, 2011).
The Bunche Park area in Miami Gardens includes Bunche Park, Bunche Elementary
School, and surrounding residential housing. Miami Gardens, incorporated in May 2003 is one of
the newest cities in Miami-Dade County. With a population of over 105,457 and an area of
approximately 20 square miles, it is the County’s third largest city and is the largest
predominately African American municipality in Florida. Located in the north end of Miami-
Dade County, Miami Gardens is bordered by unincorporated Miami-Dade County to the west (an
area known as Carol City) and the east (known as Ives Estates), Broward County to the north,
and Opa-locka to the south. Medical Examiner data show that 72 homicides occurred in Miami
Gardens from 2004 to 2008. This accounted for 6.4 percent of all homicides during the period
within the county (Uchida et al., 2011).
Seminole Wayside Park lies in the southern part of Miami-Dade County, within Leisure
City. This neighborhood is in the southern part of Leisure City and includes a small part of the
northern boundary of Homestead and receives policing services from the Miami-Dade County
Police Department. From January 1, 2009 to June 30, 2011, SWP experienced 141 burglaries, 80
larcenies, 76 vehicle burglaries, 44 aggravated assaults, 19 robberies and 2 homicides. Instances
of robberies, narcotics crimes, and larcenies increased from 2009-2010, but instances of vehicle
burglaries and motor vehicle thefts decreased (Uchida et al., 2011).

10
East Little Havana lies within the ethnic enclave, Little Havana, in the City of Miami, and
is famous as a cultural and political capital of Cuban Americans. Little Havana is one of the most
diverse neighborhoods in Miami‐Dade County with a population estimated at 49,000 residents.
The neighborhood predominately consists of immigrants from the Caribbean, Central America,
and South America, and the predominant language is Spanish. Recently, Nicaraguan and Puerto
Rican immigrants have also moved into the neighborhood. The northeastern corner of Little
Havana is a predominately Hispanic, low socioeconomic status, high crime neighborhood. East
Little Havana receives policing services from the City of Miami Police Department. From
January 1, 2008 to December 31, 2008, ELH experienced 59 calls for burglaries, 64 calls for
larcenies, 34 calls for aggravated assaults, 40 calls for robberies, and 84 calls for larcenies to a
motor vehicle. According to Miami-Dade Medical Examiner Data, in 2008-2010, four homicides
occurred in this neighborhood (Uchida et al., 2011).
Sampling Strategy
Researchers selected a random sample of neighborhood residents from these four
neighborhoods for participation in community surveys using a database of all active mailing
addresses known to the United States Postal Service (USPS) for Miami-Dade County. The
sampling frame was address-specific, not person-specific in the target areas. The data were
secured from a USPS approved vendor and represents the most complete list of all known
addresses to the USPS available. A random sample of addresses was selected from each
neighborhood. A team of interview staff was selected and trained to administer the field surveys,
walking from household to household and conducting in-person interviews. The list was
resampled to account for unsuccessful for interviews. All interviews took approximately 20
minutes to complete. Five-hundred and seventy-eight completed surveys were collected from
11
May 2010 through August 2011. The combined sample consisted of the 524 respondents with
complete information.1
Measures
Fear of Crime. Fear of crime represents a central concept when examining neighborhood
dynamics and as such, it represents the key dependent variable in the current analysis. Fear of
crime was measured using five Likert items that asked respondents how much they fear being the
victim of a burglary, having items stolen from outside their home, being the victim of a robbery,
being the victim of an assault, or having people involve their family members in selling drugs.
Response categories ranged from 1 = “Not worried” to 3 = “Very worried.” Results indicated
that this measure had high internal consistency (α =.905) and principal axis factor analysis
suggested a single factor solution. The final measure was created using the principal axis factor
analysis solution and higher values indicated higher levels of fear.
Perceptions of Incivilities. As discussed in the literature review, there have been a
number of studies which identified a link between neighborhood disorder/incivilities and fear of
crime. Drawing from this research, resident perceptions of incivilities is one of variables of the
most substantive interest in these analyses. Importantly, this measure is perceptual and it relied
on the validity of respondent perceptions of disorder and incivilities in their neighborhood. -
Studies suggest that these measures are valid (see Worrall, 2007; Armstrong and Katz, 2009).
This measure was constructed from a series of fourteen Likert items that asked residents about
1 For several respondents, there were missing data for one or several items in a scale variable. In these instances, the missing item values were replaced with the scale mean. As Schafer and Graham (2002) suggest, this method is unlikely to create difficulties in the analysis. Since the remaining missing data represented a small fraction of the overall valid cases (less than 10 percent) these cases were dropped from the analysis As Allison (2001) suggests, listwise deletion of missing data performs well when the fraction of missing data is small even if these data are MAR instead of MCAR.

12
neighborhood problems spanning a range from minor to serious problems.2 Response categories
ranged from 1 = “Not an issue/No problem” to 3 = “Big problem.” Again, results indicated that
this measure had a high amount of internal consistency (α = .831) and principal axis factor
analysis suggested a single factor solution. The final measure was created using the principal
axis factor analysis solution and higher values indicated greater perceptions of incivilities.
Collective Efficacy. The final main variable used in these analyses is collective efficacy.
As discussed in the literature review, collective efficacy has become a central concept in
understanding neighborhood processes. The measure of collective efficacy is an extension of the
measure used in the Project on Human Development in Chicago Neighborhoods project
(Sampson et al., 1997), which is commonly used in neighborhood studies. This extended
measure included the original 10 items used by Sampson et al. (1997) as well as additional
measures designed to assess the components of collective efficacy. In total, this measure consists
of 29 Likert items across three dimensions: willingness to intervene (12 items), social cohesion
(11 items), and the capacity of social control (six items).3 Results indicated that our expanded
2 The specific items used to measure Perception of Incivilities includes the following: 1) dirty/unkempt buildings or lots, 2) vacant or abandoned lots, 3) neighbors making too much noise, 4) homeless loitering, 5) vandalism, 6) public drug or alcohol use, 7) theft or vandalism to vehicles, 8) graffiti, 9) drug dealing, 10) groups of young people hanging out/around, 11) physical assaults of people on the street, 12) gangs or similar criminal activities, 13) gun shots/gun violence, and 14) truancy. 3 The measures of the three components of collective efficacy were as follows. Willingness to Intervene: 1) Someone trying to break in a house, 2) Illegally parking on the street, 3) suspicious people hanging around the neighborhood, 4) People having a loud argument in the street, 5) group of underage kids drinking, 6) children spray painting graffiti on a local building, 7) fight and someone was getting beaten or threatened, 8) child showing disrespect to an adult, 9) group of children skipping school and hanging out on the corner, 10) someone on the block playing loud music, 11) someone on the block firing a gun, 12) drugs being sold on the block. Social Cohesion: 1) neighborhood is a good area to raise children, 2) people who live in the neighborhood are generally friendly, 3) happy to live in the neighborhood, 4) people around here take care of each other, 5) people in the neighborhood can be trusted, 6) people around here willing to help neighbors, 7) this is a close‐knit neighborhood, 8) people in the neighborhood generally don’t get along (reverse coded), 9) people in the neighborhood don’t share the same values (reverse coded), 10) regularly stop and talk with people in the neighborhood, 11) know the names of people in the neighborhood. Capacity of Social Control: 1) serious pothole that needed repairs, 2) people dumping large trash items in local park or alleyway, 3) vacant house being used for drug dealing, 4) city planning to cut funding for a local community center, 5) prostitutes soliciting clients, 6) city planning to close fire station closest to your home.
13
measure had high internal consistency (α = .918). While a principal axis factor analysis
suggested a two factor solution, in order to remain consistent with Sampson et al. (1997), a
single factor solution was retained. The final measure was created using the principal axis factor
analysis solution and higher values indicate greater perceptions of collective efficacy.
Control Variables. A number of control variables were included in the analyses. Sex was
a dichotomous variable with males as the reference category. As indicated in Table 1, females
constitute 59.0 percent of the total sample. Due to the demographic composition of the
neighborhoods under investigation, race/ethnicity was included as two mutually exclusive
dichotomous variables: Hispanic and Black with the reference category of Other Race/Ethnicity.
A total of 55.2% of respondents reported Hispanic ancestry and 37.2 percent indicated African-
American/Black as their racial/ethnic designation. Employment status was included as a
dichotomous indicator with the explicit category of currently employed full or part-time. In this
sample, 51.0 percent of respondents reported being employed. Education was incorporated as a
system of dichotomous variables with less than high school education being the reference
category. In this sample, 36.3 percent reported receiving a high school diploma or GED
equivalent as their highest education and 43.5 percent reported some college education or higher.
Additional control variables that are important in neighborhood studies were also
included in the analyses. Social disorganization theory suggests that residential instability
curtails the development of social networks that are critical to the capacity of neighborhood
residents to exercise social control (Bursik and Grasmick, 1993). Residence length was
operationalized as the number of months our respondents reported living at their current address.
The mean residence length of our sample was 75.0 months. Home ownership was also included
in the analysis as prior research suggests greater home owners experience greater permanence in

14
residence and a larger financial stake in the well-being of the neighborhood (Felson, 1998).
Approximately 46.9 percent of respondents reported being homeowners with the remainder
renters or individuals with other living situations. Social disorganization theory also suggests that
economic disadvantage is associated with reduced capacity to exercise social control (Bursik &
Grasmick, 1993). In the current study, economic disadvantage was operationalized as one or
more members of a household participating in income assistance programs. This measure was a
dichotomous indicator with the reference category of not participating in these programs. In the
current sample, 40.5 percent of respondents reported that one or more members of their
household participated in an income assistance program.
Satisfaction with the police is an important control variable in the current analyses as it is
possible that the level of perceived incivilities by residents may be a function of the level of
frustration toward the police to address serious neighborhood problems. For example, Varano,
Schafer, Cancino and Swatt (2009) found that police were less responsive to crime, property
crime particular, that occurred in higher poverty neighborhoods. Police satisfaction was
measured using a single Likert item inquiring about the current level of satisfaction with the
police. Responses ranged from 1 = “Very dissatisfied” to 5 = “Very satisfied.” The level of
police satisfaction in both neighborhoods was rather high, as the average of this item was 3.94.
The analyses also included a variable that measures the extent to which respondents utilized
particular neighborhood resources such as parks and community centers. While there is little
prior research on this measure, it is anticipated that residents who frequent neighborhood
establishments and more frequently utilize neighborhood resources will have a larger awareness
space (e.g., Brantingham & Brantingham, 2004) and may be more apt to perceive neighborhood
incivilities. In contrast, it is also possible that these individuals will also have an increased

15
likelihood of encountering other neighborhood residents, which should foster a larger and denser
social network. Hence, these individuals may have higher perceptions of collective efficacy. A
seven Likert item scale asked respondents how often they use specific facilities in the
neighborhood (libraries, churches, parks, community centers, grocery stores, medical services,
and public transportation). The response categories ranged from 1 = “Never” to 4 = “Often.”
These items were averaged to provide a composite measure of the use of neighborhood
resources, with an average of 2.35 across neighborhoods. Finally, seeing that there are likely
other important unmeasured neighborhood dynamics that could lead to differences between the
neighborhoods a series of control variables for neighborhood (Brownsville is left out as the
reference category) were used in models that pooled subjects across neighborhoods.
Plan of Analysis
Initial descriptive statistics were used to provide an initial description of the combined
sample and to assess the distribution of key variables within each neighborhood. Bivariate
correlations were also examined as a preliminary step to provide information regarding the
relationship between key variables and controls.4 The analysis strategy followed the procedures
illustrated by Baron and Kenney (1986) for assessing the existence of mediating relationships.
Since the dependent variables in these models were all produced using factor analysis and the
skewness statistics for all variables were well within acceptable limits, they were treated as
continuous variables and a series of Ordinary Least Squares (OLS) regression models were used
to investigate potential mediating mechanisms. These regressions were conducted on first the
combined sample and then on the sample for each neighborhood separately.
4 Although some of the correlations appear high, multicollinearity does not appear to be a problem in these analyses, as the largest Variance Inflation Factor (VIF) was 5.24 for the neighborhood control variable for East Little Havana. All other variables had VIFs less than 5.

16
RESULTS
Descriptive Statistics
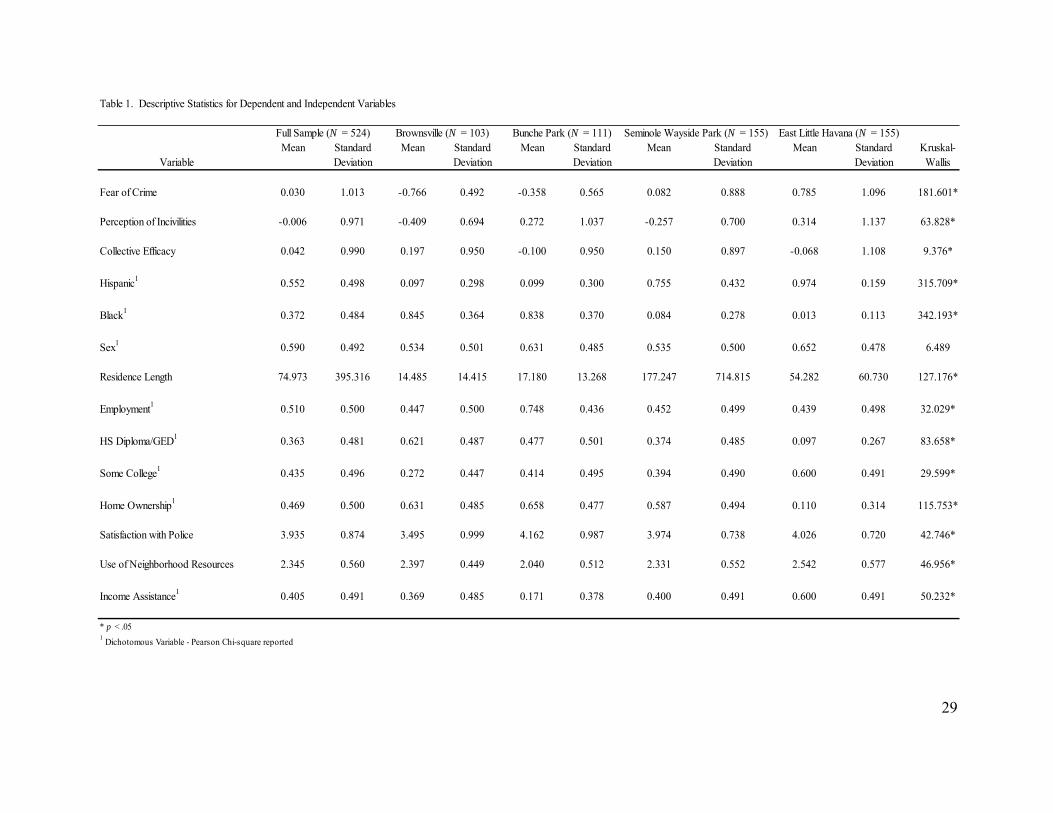
Table 1 presents descriptive statistics for each variable used in the analysis. Kruskall-
Wallis and Chi-square tests demonstrated that there were significant differences between the
neighborhoods on all variables except sex. As expected, there were significant racial/ethnic
differences between the study neighborhoods. Brownsville and Bunche Park included a larger
proportion of African Americans; East Little Havana and Seminole Wayside Park included a
larger proportion of Hispanics. Finally, there were significant differences in residence length as
the mean residence length in Brownsville was less than one year and was close to 15 years in
Seminole Wayside Park. Residents in Bunche Park were the most likely to be employed (78.4%),
but residents in East Little Havana were most likely to have at least some college education
(60.0%). Home ownership was lowest in East Little Havana (11.0%) and using income
assistance was highest (60.0%). Residents in Bunche Park were most satisfied with police
services (4.16) and residents in Brownsville were least satisfied (3.50). Residents of East Little
Havana reported the highest usage of neighborhood resources (2.54). Notably, the mean of fear
of crime was lowest in Brownsville and highest in East Little Havana. Likewise, the mean of
perceptions of incivilities was lowest in Brownsville and highest in East Little Havana. Finally,
the mean of collective efficacy was highest in Brownsville and lowest in Bunche Park.
[Insert Table 1 about here]
Bivariate Correlations
The results from the bivariate correlations are presented in Table 2. Consistent with
theoretical expectations, we find that perception of incivilities carried a significant positive
relationship with fear of crime (r = .325). Similarly, collective efficacy demonstrated a
17
statistically significant positive correlation with fear of crime (r = -.169). In addition to these two
variables; both race/ethnicity variables, both education variables, home ownership, use of
neighborhood resources, and income assistance demonstrated significant (p<.05) relationships
with fear of crime. Collective efficacy carried a statistically significant negative relationship with
the perception of incivilities (r = -.349). In addition, Hispanics and residents who used more
community resources perceived higher levels of incivilities, while homeowners perceived lower
levels of incivilities. In addition to fear of crime and perception of incivilities, the only variables
with significant relationships with collective efficacy were home ownership, satisfaction with the
police, and income assistance.
[Insert Table 2 about here]
Multiple Regression Models
The first multivariate models examined the relationship between control variables and
collective efficacy. The results for the full sample model are presented in Table 3. The full model
was significant, but only explained 5.3 percent of the variance in collective efficacy. This
suggests that a substantial amount of the variance in collective efficacy remained unexplained.
Satisfaction with the police carried a significant relationship with collective efficacy, which
suggests that residents who reported more satisfaction with police had higher perceptions of
collective efficacy. Finally, the neighborhood control variable for Bunche Park was significant.
Interestingly, the within neighborhood models, presented in Table 3, suggested
heterogeneity in these relationships between neighborhoods.5 For Bunche Park and Seminole
Wayside Park, the models were not significant, explained very little variance, and no variables
5 In order to examine whether these coefficients were similar across groups, tests for the invariance of parameters across groups were used by specifying a structural equation model corresponding to the final regression models (see StataCorp, 2010). These tests indicate that the coefficients for employment and home ownership varied between neighborhoods.
18
were statistically significant. For Brownsville and Seminole Wayside Park, however, the models
were significant and explained a larger percent of the variance in collective efficacy (22.3 and
18.8 percent respectively). Satisfaction with police had a statistically significant relationship in
both models, and in both neighborhoods, higher satisfaction with the police was associated with
higher collective efficacy. Additionally, home ownership and income assistance were both
significant in the model for East Little Havana. Specifically, in East Little Havana, homeowners
and respondents using income assistance reported lower levels of collective efficacy.
[Insert Table 3 about here]
Table 4 presents the results of the OLS regressions of resident perception of incivilities
on collective efficacy and the control variables. The results for the combined sample are
presented in the first panel. This model explained 23.1 percent of the variance in our measure of
perception of incivilities. Conforming to theoretical expectations, collective efficacy carried a
statistically significant coefficient, indicating that for the combined sample, as collective efficacy
increased, perceptions of incivilities decreased. In addition, the use of neighborhood resources
variable was statistically significant. It appears that residents who more frequently used
neighborhood resources reported higher reported perceptions of incivilities. The neighborhood
control variables for Bunche Park and East Little Havana were also significant.
Again, when examining the results for the individual neighborhoods, there is compelling
evidence of heterogeneity between neighborhoods.6 While the model only explained 7.8 percent
of the variance in Seminole Wayside Park, it explained 43.8 percent of the variance in
Brownsville. These results are surprising and the substantial differences between neighborhoods
suggest that separate processes may be at work in each neighborhood. Concerning the individual 6 Tests for the equality of coefficients across groups indicated that the coefficients for police satisfaction varied between the neighborhoods.
19
variables in each model, the effect of collective efficacy was statistically significant and fairly
consistent across the neighborhoods, with the exception of Bunche Park. In Brownsville,
Seminole Wayside Park, and East Little Havana, higher collective efficacy was associated with
greater perceptions of incivilities. In Bunche Park, however, collective efficacy approached, but
failed to reach statistical significance at the .05 level. Results that support the argument that
social processes vary between neighborhoods were observed regarding satisfaction with the
police. In East Little Havana police satisfaction had a significant negative relationship with
perception of incivilities, which indicated that as police satisfaction increased, perceptions of
incivilities decreased. Surprisingly in Brownsville and Bunche Park, police satisfaction carried a
significant positive coefficient, which indicated that as police satisfaction increased, perceptions
of incivilities also increased. Satisfaction with police was not significant in the model for
Seminole Wayside Park. The different signs of these coefficients explain why this variable was
not significant in the full model. Further, in Brownsville, use of neighborhood resources and
employment were also significant.
[Insert Table 4 about here]
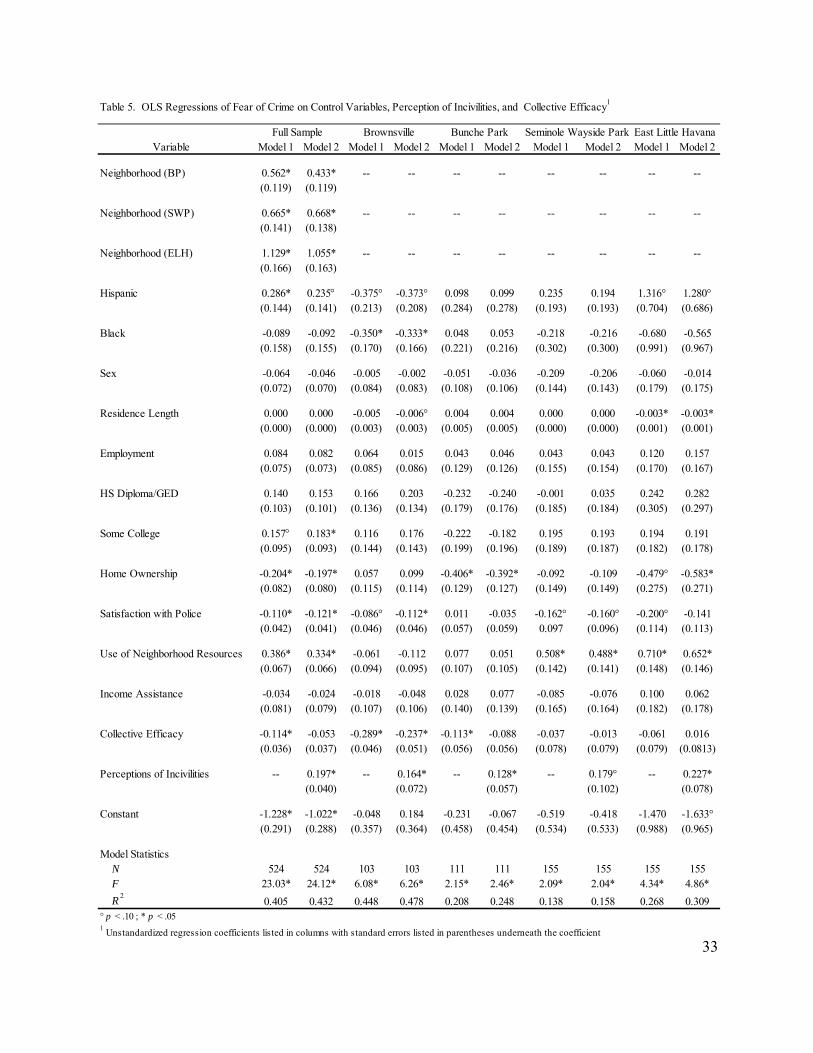
Table 5 presents the final regression models with fear of crime regressed on collective
efficacy, perceived incivilities, and the control variables. Model 1 presents regression models
where perception of incivilities was excluded from the model, and Model 2 presents models
where perception of incivilities was included.7 In the full model, perceptions of incivilities
perfectly mediated the relationship between collective efficacy and fear of crime, as the
7 In results not presented, additional models examined whether perception of incivilities was mediated by collective efficacy, but found little evidence to support this relationship. These results can be provided upon request to the first author. While this would seem to contrast the results found by Gibson et al. (2002), it does not appear that alternative model specifications where incivilities mediates collective efficacy were considered in their results. Based on the relationships between their variables, this alternative specification of the model may be consistent with their results.

20
coefficient of collective efficacy was significant in Model 1 but was not significant in Model 2.
The final model explained 43.2 percent of the variance in fear of crime. In addition to
perceptions of incivilities, several additional variables carried statistically significant coefficients
with fear of crime. Having a college education was associated with significantly greater fear of
crime. Owning a home was associated with significantly lower fear of crime. Respondents who
reported higher satisfaction with the police also reported significantly lower fear of crime.
Residents using neighborhood resources more frequently also reported significantly greater fear
of crime. Finally, each of the neighborhood control variables was statistically significant.
Again, however, it appears that the results from the combined sample masked important
differences between the neighborhoods concerning the social processes at work.8 In Brownsville
there was evidence for a partially mediated effect for collective efficacy, since after perceptions
of incivilities was added to the model, the coefficient of collective efficacy diminished but
remained statistically significant. The final model performed well in this neighborhood as it
explained 44.8 percent of the variance in fear of crime. In this model, African Americans
appeared to have significantly lower amounts of fear of crime. Additionally, higher levels of
satisfaction with the police were associated with lower levels of fear of crime.
A different picture emerged in Bunche Park. In this neighborhood, the relationship
between collective efficacy and fear of crime was perfectly mediated by perceptions of
incivilities. The final model explained a substantially lower percentage of the variance in fear of
crime (24.8 percent). The only other statistically significant variable in the model for Bunche
Park was home ownership. Homeowners reported lower fear of crime.
8 Tests for the equality of coefficients across groups indicated that for the final model (Model 2), the coefficients for collective efficacy, Black, residence length, home ownership, and use of neighborhood resources were significantly different across neighborhoods.

21
The results from Seminole Wayside Park and East Little Havana contrast the results
observed in the other neighborhoods. In Seminole Wayside Park, neither perceptions of
incivilities nor collective efficacy reached statistical significance in the final model. This model
explained a much smaller percentage of the variance (15.8 percent) compared to the results from
the prior two neighborhoods. The only significant variable in this model was use of
neighborhood resources, as residents who reported greater use of neighborhood resources also
reported greater fear of crime. The results from East Little Havana contrast with the results from
all previous neighborhoods. Interestingly, collective efficacy was not statistically significant
even when perception of incivilities was not included in the model. In the final model, perception
of incivilities was statistically significant. Homeowners reported significantly lower levels of
fear of crime. Further, longer residence length was associated with lower fear of crime. Greater
use of neighborhood resources was associated with significantly higher levels of fear of crime.
This model explained 30.9 percent of the variance in fear of crime.
[Insert Table 5 about here]
DISCUSSION
The purpose of this study was to investigate the relationships between collective efficacy,
perceptions of incivilities, and fear of crime. Field surveys from a random sample of Miami-
Dade residents in four neighborhoods, Liberty City/Brownsville, Bunche Park, Seminole
Wayside Park, and East Little Havana were used to examine whether the effect of collective
efficacy on fear of crime was mediated by perceptions of incivilities. The analyses examined
results for the combined sample, as well as for each neighborhood individually. The findings
suggested important heterogeneity in the social processes that govern fear of crime between
neighborhoods. When only examining the results for the combined sample, this heterogeneity

22
would be missed. Only after considering models for each neighborhood separately, is it apparent
that some variables were only significant in particular neighborhoods, the relationship between
variables differs depending on the neighborhood under consideration, and there was substantial
variability in the explanatory power of the models.
For the combined sample, results suggested that the relationship between collective
efficacy and fear of crime was perfectly mediated by perceptions of incivilities. However, when
considering each neighborhood individually, a more complex relationship between these
variables emerged. In Brownsville, results supported a partially mediated relationship, as
collective efficacy remained statistically significant, after perceptions of incivilities was added to
the model. In contrast, for Bunche Park, the results indicated that perceptions of incivilities
perfectly mediated the relationship between collective efficacy and fear of crime. In East Little
Havana, collective efficacy was not significant even prior to adding perceptions of incivilities to
the model. Perception of incivilities, however, remained an important variable for understanding
the level of fear of crime. Finally, in Seminole Wayside Park, neither collective efficacy nor
perceptions of incivilities were significant predictors of fear of crime. In sum, these findings
suggested partial support for the mediating role of perceptions of incivilities in the relationship
between collective efficacy and fear of crime. The extent of this support differed depending on
the neighborhood that is under consideration. While some heterogeneity between neighborhoods
was expected, the extent of this heterogeneity was surprising.
One possible explanation for this heterogeneity is that the relationship between collective
efficacy, perceptions of incivilities, and fear of crime is that the relationships between these
variables at the individual level depend on the aggregate influence of these variables at the
neighborhood level. In a Hierarchical Linear Model (HLM) framework, this would imply that the

23
neighborhood-level mean for collective efficacy and perceptions of incivilities should be entered
as a level 2 explanatory variable (see Wyatt, 2008). For example, perceptions of incivilities had
the no influence in Seminole Wayside Park. It is possible that the variance in individual
perceptions of incivilities is overwhelmed by the comparatively low amount of incivilities across
the neighborhood. Likewise, collective efficacy was very important in Brownsville. It is possible
that because Brownsville had comparatively high levels of collective efficacy, individual-level
variation in the perceptions of collective efficacy become more important to understanding
individual differences in fear of crime. Therefore, it seems plausible than that some of the
differences between neighborhoods in Table 1 might explain these interactions. Unfortunately,
the extent to which aggregate neighborhood-level impacts explain the differential relationships at
the individual level would require a full HLM model to assess, which is not possible with the
data at hand. Future researchers, however, should consider this possibility as it requires only a
simple extension of HLM models that are commonly used.
A more theoretically enticing and equally possible explanation for these results is that
there are unmeasured neighborhood-level factors that condition the relationships between
collective efficacy, perceptions of incivilities, and fear of crime. Obviously, with only four
neighborhoods under consideration, it is not possible to assess this hypothesis. It may be helpful,
however, to speculate about which variables might be worth consideration. One of the first
important variables to consider is crime. As discussed previously, these neighborhoods differed
substantially in the amount and severity of crime. It is possible, that the mitigating effect of
collective efficacy on fear of crime is only particularly salient in high crime neighborhoods. A
second possible variable that could explain the observed differences is average housing value. It
is possible that as average housing value increases, the importance of collective efficacy

24
decreases. In wealthy neighborhoods, collective efficacy may be irrelevant as residents are
paying for additional measures of social control (i.e., gated entrances, fences to restrict access,
private security) or for additional insulation from potentially criminogenic features of the
environment (increased distance from urban center, increased distance from crime
attractors/generators) as part of the cost of housing. A third variable worth considering is average
length of residence. Increased average stability within a neighborhood implies a greater
permanence of network affiliations. While individual perceptions of collective efficacy may
vary, this variance may be unimportant in neighborhoods with high average length of residence
as stable social networks already function to mitigate fear of crime. These potential variables are
not meant to represent an exhaustive list of possible explanations for the between neighborhood
differences, but merely represents suggestions for further inquiry.
Of course, this study is limited in a number of respects. The results of this study may not
be generalizable to other settings. Miami is one of the most demographically and culturally
diverse cities in the country and it may be the case that this diversity complicates comparisons in
to other cities. Further, this study only examined four neighborhoods within Miami-Dade
County, and it is possible that these findings are particular to the neighborhoods under
consideration. Another potential criticism of this study is the use of perceptual measures of
incivilities as opposed to objective measures of incivilities (e.g., Sampson et al. 1997). As
previously discussed, it is likely that perceptual measures of incivilities have more salience when
examining fear of crime. However, the use of triangulated measures would offer a substantial
addition to this research. Finally, this analysis did not attempt to disentangle the relationship
between collective efficacy, perceptions of incivilities, and fear of crime over time. Additional

25
data where neighborhood residents were administered a series of follow-up interviews over time
would be necessary for a more thorough understanding of the dynamic social processes at work.
Despite these limitations, this study offers important insights to policy and future
research. For policy, the most important observation is that these findings clearly indicate that
context is critical when designing interventions to combat fear of crime. Strategies that may be
effective in one neighborhood may not be effective in others. For example, a strategy that relies
on strengthening collective efficacy will likely be ineffective in East Little Havana. Likewise, a
strategy that focuses on addressing incivilities will have little effect in Seminole Wayside Park.
For this reason, it is recommended that policy-makers engage in an assessment of the social
processes linked with fear of crime within the areas of interest prior to designing an intervention.
In regards to future research, the most pressing concern is to replicate these findings in
other neighborhoods in other cities to determine whether these results are particular to these
neighborhoods in Miami-Dade County. These four neighborhoods consisted of two low
socioeconomic status, predominately African-American communities, one low socioeconomic
status, predominately Hispanic community, and one working class, predominately Hispanic
community. Future research should seek to examine neighborhoods with a greater range of
racial/ethnic compositions and economic conditions. When possible, future research should also
consider examining a sufficient cross-section of neighborhoods to allow for between-
neighborhood comparisons. These comparisons would enable examinations of neighborhood-
level variables that may explain the differences observed between neighborhoods.
REFERENCES
Allison, P.D. (2001). Missing Data. Thousand Oaks, CA: Sage.
26
Armstrong, T. & Katz, C. (2009). Further evidence on the discriminant validity of perceptual incivilities measures. Justice Quarterly, 27, 280-304.
Baron, R. M., & Kenny, D. A. (1986). The moderator-mediator variable distinction in social
psychological research: Conceptual, strategic, and statistical considerations. Journal of Personality and Social Psychology, 51(6), 1173-1182.
Baumrind, D. (1967). Child care practices anteceding three patterns of preschool behavior.
Genetic Psychology Monographs, 75, 43-88. Brantingham, P. J., & Brantingham, P. L. (1999). A theoretical model of crime hot spot
generation. Studies on Crime and Crime Prevention, 1, 7-26. Bursik, R.J. (1988). Social disorganization and theories of crime and delinquency: Problems and
prospects. Criminology, 26, 519-551. Bursik R.J. & Grasmick, H.G. (1993). Neighborhoods and Crime: The Dimensions of Effective
Community Control. Lanham, MD: Lexington Books. Felson, M. (1998). Crime and Everyday Life, 2nd Edition. Beverley Hills, CA: Sage. Gibson, C. L., Zhao, J., Lovrich, N. P., & Gaffney, M. J. (2002). Social integration, individual
perceptions of collective efficacy, and fear of crime in three cities. Justice Quarterly, 19(3), 537.
Hill, K. G., Howell, J. C., Hawkins, J. D., & Battin-Pearson, S. R. (1999). Childhood risk factors
for adolescent gang membership: results from the Seattle Social Development Project. Journal of Research in Crime and Delinquency, 36(3), 300-322.
Kelling, G. L., & Coles, C. M. (1996). Fixing broken windows : restoring order and reducing crime in our communities. New York: Martin Kessler Books.
Kirk, D. S. (2009). Unraveling the contextual effects on student suspension and juvenile arrest:
The independent and interdependent influences of school, neighborhood, and family social controls. Criminology, 47(2), 479-520.
Kornhauser, R. (1978). Social sources of delinquency. Chicago: University of Chicago Press. McCluskey, C. P., Patchin, J. W., & Bynum, T. S. (2004). Reducing chronic absenteeism: an
assessment of an early truancy initiative. Crime & Delinquency, 50(2), 214-234. Messner, S. F., and Kenneth Tardiff. (1986). Economic inequality and levels of homicide: An
analysis of urban neighborhoods. Criminology, 24(2), 297-315. Morenoff, J., Sampson, R.J. & Raudenbush, S. (2001). Neighborhood inequality, collective
efficacy, and the spatial dynamics of urban violence. Criminology, 39, 517-560.

27
Oberwittler, D. & Wikström, P.O. (2009). Why small is better: Advancing the study of the role of behavioral contexts in crime causation. Pp 35-59 in Weisburd, D., Bernasco, W. & Bruinsma, G.J.N. (Eds.) Putting Crime in its Place: Units of Analysis in Geographic Criminology. New York: Springer.
Reisig, M. D., & Cancino, J. M. (2004). Incivilities in nonmetropolitian communities: The
effects of structural constraints, social conditions, and crime. Journal of Criminal Justice, 32, 15-29.)
Robinson, J. B., Lawton, B. A., Taylor, R. B., & Perkins, D. D. (2003). Multilevel longitudinal
impacts of incivilities: Fear of crime, expected safety, and block satisfaction. Journal of Quantitative Criminology, 19(3), 237-274.
Sampson, R.J. & W.B. Groves. (1989). Community structure and crime: Testing social-
disorganization theory. American Journal of Sociology 94, 774-802. Sampson, R. J., Raudenbush, S.W. & Earls, F. (1997). Neighborhoods and violent crime: A
multilevel study of collective efficacy. Science, 277, 918-24. Schafer, J. L. & Graham, J. W. (2002). Missing data: Our view of the state of the art.
Psychological Methods, 7, 147-177 Simons, R. L., Simons, L. G., Burt, C. H., Brody, G. H., & Cutrona, C. (2005). Collective
efficacy, authoritative parenting and delinquency: a longitudinal test of model integrating community-and family-level processes. Criminology, 43, 989-1030.
StataCorp. (2011). Stata Structural Equation Modeling Reference Manual Release 12. Statistical
Software. College Station, TX: StataCorp LP. Uchida, C.D., Solomon, S.E., Varano, S., Swatt, M., Putt, C., Connor, C., & Mash, J. (2011).
Crime, collective efficacy, and Miami-Dade neighborhoods. Report delivered to the Children’s Trust of Miami-Dade.
Varano, S. P., Schafer, J. A., Cancino, J. M., & Swatt, M. L. (2009). Constructing crime:
Neighborhood characteristics and police recording behavior. Journal of Criminal Justice, 37(6), 553-563.
Warner, B.D. (2007). Directly intervene or call the authorities? A study of forms of
neighborhood social control within a social disorganization framework. Criminology, 45, 99-129.
Wilson, W.J. (1996). When work disappears. Political Science Quarterly, 111, 567-595. Worrall, J.L. (2007). The discriminant validity of perceptual incivilities measures. Justice
Quarterly, 23, 360-383

28
Wyant, B. R. (2008). Multilevel impacts of perceived incivilities and perceptions of crime risk
on fear of crime. Journal of Research in Crime and Delinquency, 45(1), 39-64.
29
Table 1. Descriptive Statistics for Dependent and Independent Variables
Mean Standard Mean Standard Mean Standard Mean Standard Mean Standard Kruskal-Variable Deviation Deviation Deviation Deviation Deviation Wallis
Fear of Crime 0.030 1.013 -0.766 0.492 -0.358 0.565 0.082 0.888 0.785 1.096 181.601*
Perception of Incivilities -0.006 0.971 -0.409 0.694 0.272 1.037 -0.257 0.700 0.314 1.137 63.828*
Collective Efficacy 0.042 0.990 0.197 0.950 -0.100 0.950 0.150 0.897 -0.068 1.108 9.376*
Hispanic1 0.552 0.498 0.097 0.298 0.099 0.300 0.755 0.432 0.974 0.159 315.709*
Black1 0.372 0.484 0.845 0.364 0.838 0.370 0.084 0.278 0.013 0.113 342.193*
Sex1 0.590 0.492 0.534 0.501 0.631 0.485 0.535 0.500 0.652 0.478 6.489
Residence Length 74.973 395.316 14.485 14.415 17.180 13.268 177.247 714.815 54.282 60.730 127.176*
Employment1 0.510 0.500 0.447 0.500 0.748 0.436 0.452 0.499 0.439 0.498 32.029*
HS Diploma/GED1 0.363 0.481 0.621 0.487 0.477 0.501 0.374 0.485 0.097 0.267 83.658*
Some College1 0.435 0.496 0.272 0.447 0.414 0.495 0.394 0.490 0.600 0.491 29.599*
Home Ownership1 0.469 0.500 0.631 0.485 0.658 0.477 0.587 0.494 0.110 0.314 115.753*
Satisfaction with Police 3.935 0.874 3.495 0.999 4.162 0.987 3.974 0.738 4.026 0.720 42.746*
Use of Neighborhood Resources 2.345 0.560 2.397 0.449 2.040 0.512 2.331 0.552 2.542 0.577 46.956*
Income Assistance1 0.405 0.491 0.369 0.485 0.171 0.378 0.400 0.491 0.600 0.491 50.232*
* p < .051 Dichotomous Variable - Pearson Chi-square reported
Full Sample (N = 524) Brownsville (N = 103) Bunche Park (N = 111) East Little Havana (N = 155)Seminole Wayside Park (N = 155)

30
Table 2. Bivariate Correlations between Dependent and Independent Variables (N = 524)
Variable 1 2 3 4 5 6 7 8 9 10 11 12 13
1. Fear of Crime --
2. Perception of Incivilities .325* --
3. Collective Efficacy -.169* -.349* --
4. Hispanic .450* .109* .005 --
5. Black -.432* -.073 .015 -.854* --
6. Sex .027 .005 -.015 .012 .008 --
7. Residence Length .055 -.024 -.000 -.000 -.100* .023 --
8. Employment -.003 .044 -.042 .148* .131* -.050 .014 --
9. HS Diploma/GED -.214* -.064 -.002 -.278* .273* .024 -.050 -.030 --
10. Some College .165* .007 .023 .103* -.118* -.004 -.036 .091* -.662* --
11. Home Ownership -.315* -.127* .091* -.244* .249* -.063 .014 .097* .126* -.047 --
12. Satisfaction with Police -.021 .072 .098* .091* -.110* .018 .065 -.025 -.003 -.014 -.057 --
13. Use of Neighborhood Resources .300* .128* -.041 .113* -.098* .110* .091 -.067 -.071 .082 -.153* -.053 --
14. Income Assistance .157* .027 -.090* .196* -.152* .119* .040 -.296* -.056 -.025 -.324* -.099* .163*
* p < .05

31
Table 3. OLS Regressions of Collective Efficacy on Control Variables1
Full Sample Brownsville Bunche Park Seminole Wayside East Little
Park Havana
Variable
Neighborhood (BP) -0.450* -- -- -- --
(0.145)
Neighborhood (SWP) -0.058 -- -- -- --
(0.174)
Neighborhood (ELH) -0.236 -- -- -- --
(0.204)
Hispanic 0.217 0.390 0.137 0.268 -0.117
(0.177) (0.484) (0.507) (0.206) (0.746)
Black 0.273 0.212 0.388 0.209 0.200
(0.195) (0.387) (0.392) (0.323) (1.050)
Sex 0.025 -0.172 -0.078 -0.052 0.274
(0.089) (0.192) (0.192) (0.154) (0.188)
Residence Length -0.000 -0.000 -0.004 -0.000 0.001
(0.000) (0.007) (0.008) (0.000) (0.001)
Employment -0.086 -0.244 0.395° 0.023 -0.318°
(0.092) (0.192) (0.227) (0.166) (0.179)
HS Diploma/GED -0.014 0.270 0.057 -0.008 -0.015
(0.127) (0.309) (0.321) (0.198) (0.323)
Some College 0.103 0.556 0.148 0.092 -0.329°
(0.117) (0.323) (0.356) (0.202) (0.191)
Home Ownership 0.122 0.244 0.376 0.147 -1.039*
(0.100) (0.261) (0.228) (0.159) (0.278)
Satisfaction with Police 0.146* 0.234* 0.031 0.027 0.251*
(0.051) (0.101) (0.102) (0.104) (0.119)
Use of Neighborhood Resources -0.083 -0.059 0.192 -0.000 -0.103
(0.082) (0.215) (0.190) (0.152) (0.157)
Income Assistance -0.166° -0.219 -0.037 -0.088 -0.501*
(0.099) (0.244) (0.250) (0.177) (0.189)
Constant -0.375 -0.885 -1.462° -0.238 -0.180
(0.358) (0.808) (0.805) (0.571) (1.048)
Model Statistics
N 524 103 111 155 155
F 2.03* 2.37* 0.96 0.38 3.02*
R2
0.053 0.223 0.096 0.028 0.188° p < .10 ; * p < .051 Unstandardized regression coefficients listed in columns with standard errors listed in parentheses underneath the coefficient

32
Table 4. OLS Regressions of Perception of Incivilities on Control Variables and Collective Efficacy1
Full Sample Brownsville Bunche Park Seminole Wayside East LittlePark Havana
Variable
Neighborhood (BP) 0.655* -- -- -- --(-0.016)
Neighborhood (SWP) -0.016 -- -- -- --(0.154)
Neighborhood (ELH) 0.378* -- -- -- --(0.181)
Hispanic 0.257 -0.012 -0.013 0.226 0.160(0.157) (0.304) (0.496) (0.158) (0.734)
Black 0.018 -0.102 -0.036 -0.009 -0.504(0.173) (0.242) (0.386) (0.247) (1.034)
Sex -0.093 -0.014 -0.120 -0.016 -0.203(0.078) (0.120) (0.188) (0.117) (0.186)
Residence Length -0.000 0.004 0.000 -0.000 -0.002(0.000) (0.004) (0.008) (0.000) (0.001)
Employment 0.011 0.296* -0.023 -0.004 -0.165(0.081) (0.121) (0.225) (0.126) (0.178)
HS Diploma/GED -0.068 -0.222 0.066 -0.198 -0.180(0.112) (0.194) (0.314) (0.151) (0.318)
Some College -0.134 -0.365° -0.310 0.012 0.016(0.104) (0.205) (0.349) (0.154) (0.190)
Home Ownership -0.041 -0.256 -0.104 0.096 0.460(0.089) (0.164) (0.226) (0.122) (0.287)
Satisfaction with Police 0.054 0.156* 0.352* -0.015 -0.263*0.046 (0.065) (0.099) (0.079) (0.119)
Use of Neighborhood Resources 0.264* 0.313* 0.202 0.113 0.254(0.073) (0.134) (0.187) (0.116) (0.154)
Income Assistance -0.051 0.186 -0.379 -0.047 0.165(0.088) (0.153) (0.244) (0.135) (0.190)
Collective Efficacy -0.307* -0.319* -0.194° -0.137* -0.337*(0.039) (0.065) (0.098) (0.064) (0.082)
Constant -1.045 -1.415* -1.275 -0.563 0.721(0.317) (0.508) (0.800) (0.435) (1.031)
Model Statistics N 524 103 111 155 155 F 10.16* 5.84* 3.21* 0.99 4.14*
R2
0.231 0.438 0.282 0.078 0.259° p < .10 ; * p < .051 Unstandardized regression coefficients listed in columns with standard errors listed in parentheses underneath the coefficient
33
Table 5. OLS Regressions of Fear of Crime on Control Variables, Perception of Incivilities, and Collective Efficacy1
Variable Model 1 Model 2 Model 1 Model 2 Model 1 Model 2 Model 1 Model 2 Model 1 Model 2
Neighborhood (BP) 0.562* 0.433* -- -- -- -- -- -- -- --(0.119) (0.119)
Neighborhood (SWP) 0.665* 0.668* -- -- -- -- -- -- -- --(0.141) (0.138)
Neighborhood (ELH) 1.129* 1.055* -- -- -- -- -- -- -- --(0.166) (0.163)
Hispanic 0.286* 0.235 -0.375° -0.373° 0.098 0.099 0.235 0.194 1.316° 1.280°(0.144) (0.141) (0.213) (0.208) (0.284) (0.278) (0.193) (0.193) (0.704) (0.686)
Black -0.089 -0.092 -0.350* -0.333* 0.048 0.053 -0.218 -0.216 -0.680 -0.565(0.158) (0.155) (0.170) (0.166) (0.221) (0.216) (0.302) (0.300) (0.991) (0.967)
Sex -0.064 -0.046 -0.005 -0.002 -0.051 -0.036 -0.209 -0.206 -0.060 -0.014(0.072) (0.070) (0.084) (0.083) (0.108) (0.106) (0.144) (0.143) (0.179) (0.175)
Residence Length 0.000 0.000 -0.005 -0.006° 0.004 0.004 0.000 0.000 -0.003* -0.003*(0.000) (0.000) (0.003) (0.003) (0.005) (0.005) (0.000) (0.000) (0.001) (0.001)
Employment 0.084 0.082 0.064 0.015 0.043 0.046 0.043 0.043 0.120 0.157(0.075) (0.073) (0.085) (0.086) (0.129) (0.126) (0.155) (0.154) (0.170) (0.167)
HS Diploma/GED 0.140 0.153 0.166 0.203 -0.232 -0.240 -0.001 0.035 0.242 0.282(0.103) (0.101) (0.136) (0.134) (0.179) (0.176) (0.185) (0.184) (0.305) (0.297)
Some College 0.157 0.183* 0.116 0.176 -0.222 -0.182 0.195 0.193 0.194 0.191(0.095) (0.093) (0.144) (0.143) (0.199) (0.196) (0.189) (0.187) (0.182) (0.178)
Home Ownership -0.204* -0.197* 0.057 0.099 -0.406* -0.392* -0.092 -0.109 -0.479° -0.583*(0.082) (0.080) (0.115) (0.114) (0.129) (0.127) (0.149) (0.149) (0.275) (0.271)
Satisfaction with Police -0.110* -0.121* -0.086° -0.112* 0.011 -0.035 -0.162° -0.160° -0.200° -0.141(0.042) (0.041) (0.046) (0.046) (0.057) (0.059) 0.097 (0.096) (0.114) (0.113)
Use of Neighborhood Resources 0.386* 0.334* -0.061 -0.112 0.077 0.051 0.508* 0.488* 0.710* 0.652*(0.067) (0.066) (0.094) (0.095) (0.107) (0.105) (0.142) (0.141) (0.148) (0.146)
Income Assistance -0.034 -0.024 -0.018 -0.048 0.028 0.077 -0.085 -0.076 0.100 0.062(0.081) (0.079) (0.107) (0.106) (0.140) (0.139) (0.165) (0.164) (0.182) (0.178)
Collective Efficacy -0.114* -0.053 -0.289* -0.237* -0.113* -0.088 -0.037 -0.013 -0.061 0.016(0.036) (0.037) (0.046) (0.051) (0.056) (0.056) (0.078) (0.079) (0.079) (0.0813)
Perceptions of Incivilities -- 0.197* -- 0.164* -- 0.128* -- 0.179° -- 0.227*(0.040) (0.072) (0.057) (0.102) (0.078)
Constant -1.228* -1.022* -0.048 0.184 -0.231 -0.067 -0.519 -0.418 -1.470 -1.633°(0.291) (0.288) (0.357) (0.364) (0.458) (0.454) (0.534) (0.533) (0.988) (0.965)
Model Statistics N 524 524 103 103 111 111 155 155 155 155 F 23.03* 24.12* 6.08* 6.26* 2.15* 2.46* 2.09* 2.04* 4.34* 4.86*
R2
0.405 0.432 0.448 0.478 0.208 0.248 0.138 0.158 0.268 0.309° p < .10 ; * p < .051 Unstandardized regression coefficients listed in columns with standard errors listed in parentheses underneath the coefficient
Full Sample Brownsville Bunche Park Seminole Wayside Park East Little Havana