Embed Size (px)
Citation preview
Feasibility, Costs, Next Steps:SHORE-BASED BALLAST WATER RECEPTION AND TREATMENT IN CALIFORNIA
26 SEPTEMBER 2018
PREVENTION FIRST, 13TH BIENNIAL
LONG BEACH, CA
Shore-based Ballast Water Reception and Treatment in California2
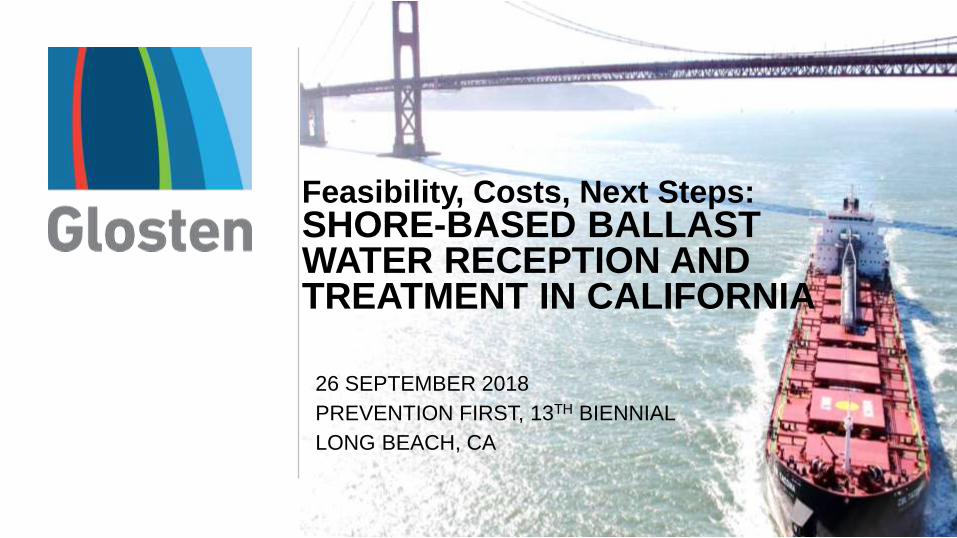
Challenge Water
>100,000 / m3
US Coast Guard
≤10 / m3
California Interim
Non-detectable
California Interim Ballast Water Performance Standards
Illustration for >50 micron size class.
1 cubic meter example.
Challenge

3
Co
nta
ine
r
sh
ips
Bu
lke
rs
Ta
nk
ers
Pa
ss
en
ger
Car
Carr
ier
Oth
ers
Cali
forn
ia
Ballast Water Discharges (#/year) 223 375 570 167 10 210 1,556
Volume, Average per Discharge (metric tons/event) 3,680 15,313 10,605 816 853 9,771
12.8 million metric tons ballast water discharged annually
1,556 annual discharge events (only 16% of ship calls discharge ballast)
Challenge
Shore-based Ballast Water Reception and Treatment in California

4
Ports StudiedStockton, Oakland, Port
Hueneme, El Segundo, LA/LB
Marine Vessel Refitting$151,400 to $425,900 per ship
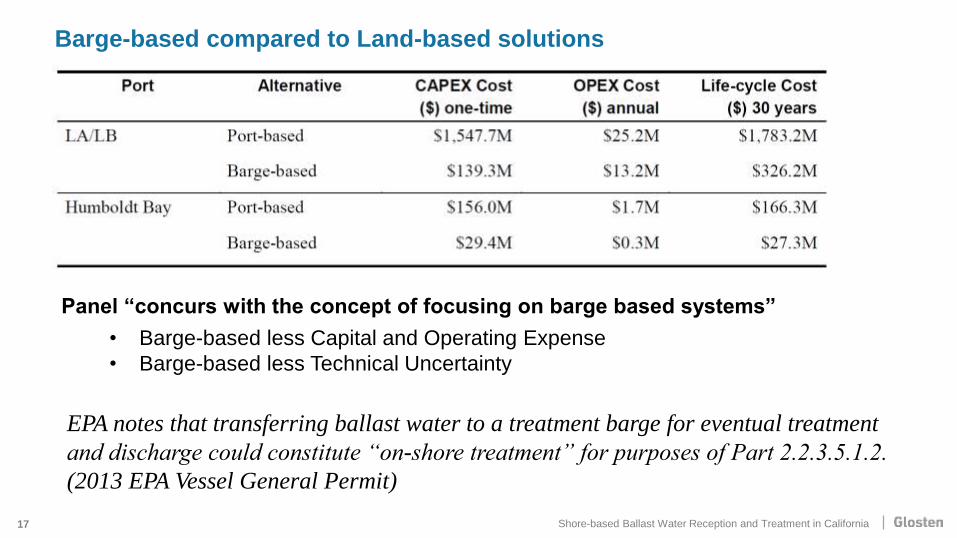
Reception & TreatmentLA/LB life cycle cost
Land-based $1,783M
Barge-based $326M
Port Hueneme life cycle cost
Land-based $166M
Barge-based $27M
ConclusionBarge-based most cost effective
and practical alternative
LA/LB
50 miles piping or 7 barges
Marine Vessel
Retrofitting
Ports and Wharves
Retrofitting
Treatment
Facilities
Case Studies
Shore-based Ballast Water Reception and Treatment in California
5
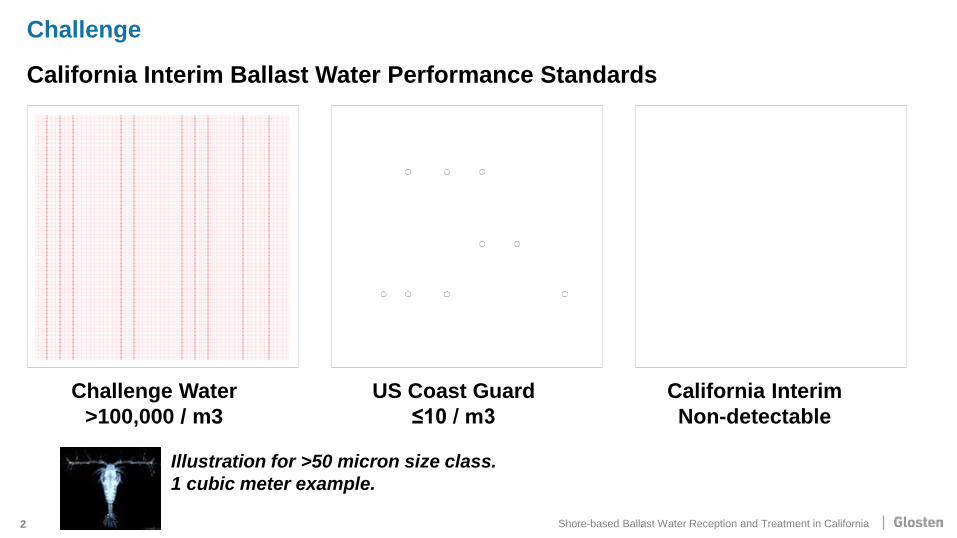
Reception from Ship
Flocculation
Plate Settlers
Membrane Filtration
UV Disinfection
Discharge Overboard
Analysis indicates existing technology can meet CA Interim Standard
Scale-up requires three years of prototyping and pilot projects
Technology
Shore-based Ballast Water Reception and Treatment in California
6
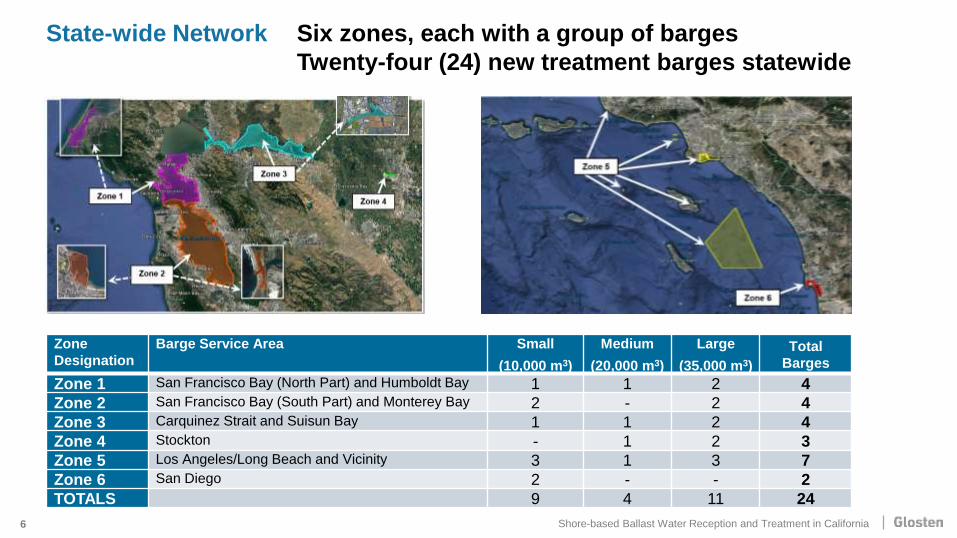
Zone
Designation
Barge Service Area Small
(10,000 m3)
Medium
(20,000 m3)
Large
(35,000 m3)
Total
Barges
Zone 1 San Francisco Bay (North Part) and Humboldt Bay 1 1 2 4
Zone 2 San Francisco Bay (South Part) and Monterey Bay 2 - 2 4
Zone 3 Carquinez Strait and Suisun Bay 1 1 2 4
Zone 4 Stockton - 1 2 3
Zone 5 Los Angeles/Long Beach and Vicinity 3 1 3 7
Zone 6 San Diego 2 - - 2
TOTALS 9 4 11 24
State-wide Network Six zones, each with a group of barges
Twenty-four (24) new treatment barges statewide
Shore-based Ballast Water Reception and Treatment in California

Marine Vessels Refit & Operate$2,170 Million
Treatment Barges Build & Operate$1,450 Million
7
Costs
$3.62 billion for 30 year life cycle
Single ShipRefit for offloading ballast
$151,400 to $425,900
One Ballast DischargePay for Barge Service
$36,751 to $118,321
Unit Costs$2.18 per ton grain or oil
$18.68 per shipping container
$11.30 per automobile
$46.38 per passenger
Shore-based Ballast Water Reception and Treatment in California

Unit Costs$2.18 per ton grain or oil
$18.68 per shipping container
$11.30 per automobile
$46.38 per passenger
8
Market Implications
Disproportionate impact on small/remote ports and exports
Single ShipRefit for offloading ballast
$151,400 to $425,900
One Ballast DischargePay for Barge Service
$36,751 to $118,321
$46.38 per passenger
~5.6% increase in cost
~5.6% decrease in use
Decrease pool of
available vessels for
spot trade cargo
Bulk ship calling Stockton costs
~$118,000 per day. More economical
to divert cargo to another port.
Shore-based Ballast Water Reception and Treatment in California
9
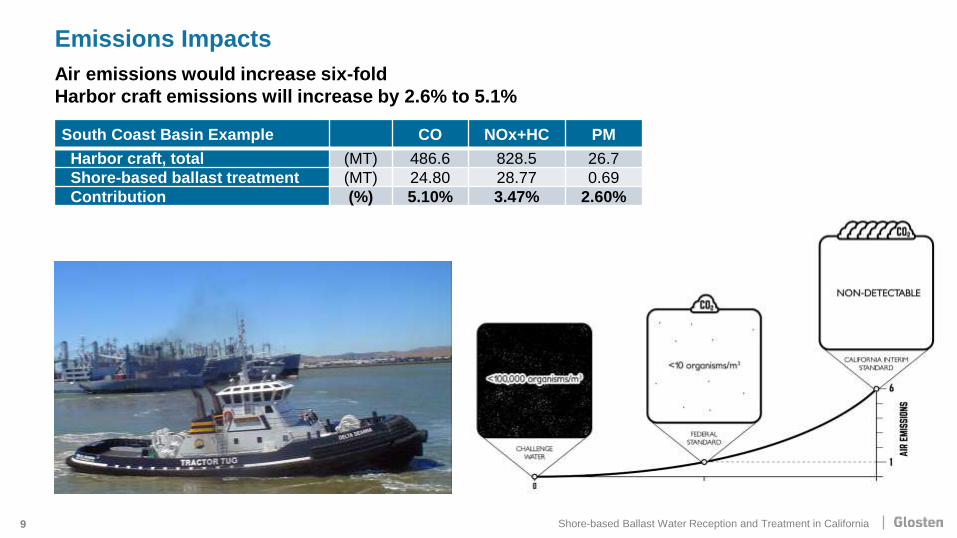
Emissions Impacts
South Coast Basin Example CO NOx+HC PM
Harbor craft, total (MT) 486.6 828.5 26.7
Shore-based ballast treatment (MT) 24.80 28.77 0.69
Contribution (%) 5.10% 3.47% 2.60%
Air emissions would increase six-fold
Harbor craft emissions will increase by 2.6% to 5.1%
Shore-based Ballast Water Reception and Treatment in California
10
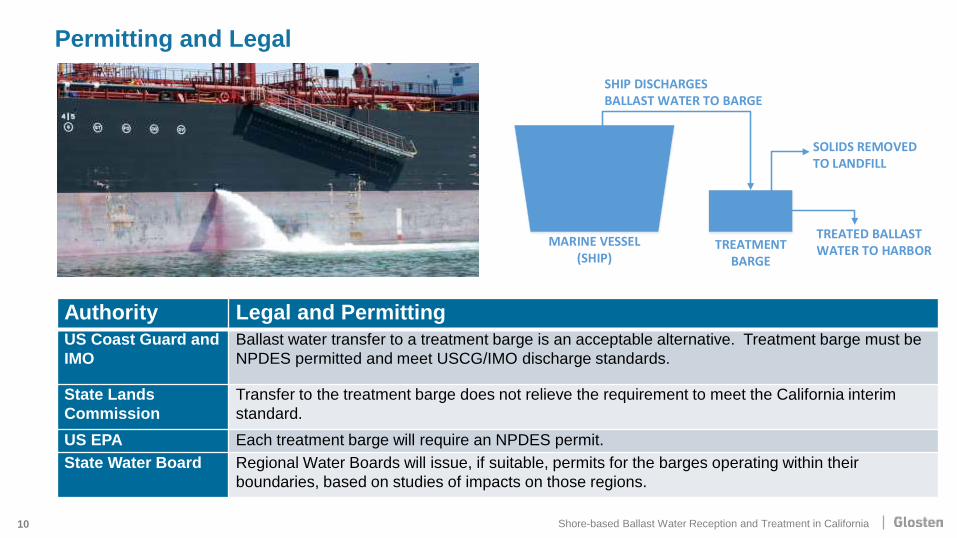
Permitting and Legal
Authority Legal and Permitting
US Coast Guard and
IMO
Ballast water transfer to a treatment barge is an acceptable alternative. Treatment barge must be
NPDES permitted and meet USCG/IMO discharge standards.
State Lands
Commission
Transfer to the treatment barge does not relieve the requirement to meet the California interim
standard.
US EPA Each treatment barge will require an NPDES permit.
State Water Board Regional Water Boards will issue, if suitable, permits for the barges operating within their
boundaries, based on studies of impacts on those regions.
SHIP DISCHARGESBALLAST WATER TO BARGE
TREATED BALLASTWATER TO HARBOR
MARINE VESSEL(SHIP)
TREATMENTBARGE
SOLIDS REMOVEDTO LANDFILL
Shore-based Ballast Water Reception and Treatment in California
11
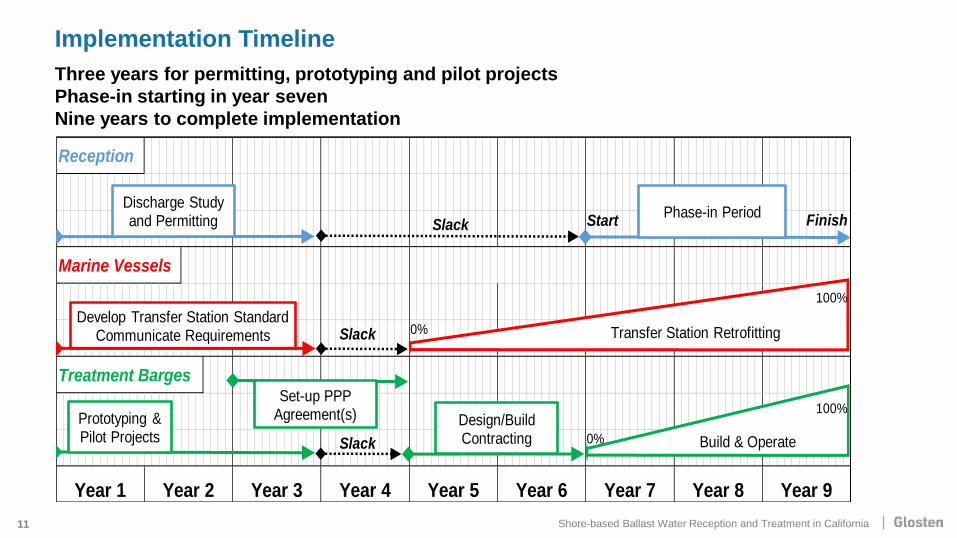
Implementation Timeline
Year 4 Year 5 Year 6 Year 7 Year 8 Year 9
Reception
Marine Vessels
Treatment Barges
Year 1 Year 2 Year 3
Discharge Study and Permitting
Phase-in Period
Transfer Station Retrofitting
Build & Operate0%
0%
100%
100%
Develop Transfer Station StandardCommunicate Requirements
Start Finish
Prototyping & Pilot Projects
Design/BuildContracting
Slack
Slack
Slack
Set-up PPP Agreement(s)
Three years for permitting, prototyping and pilot projects
Phase-in starting in year seven
Nine years to complete implementation
Shore-based Ballast Water Reception and Treatment in California

12
Summary
Practicality
A barge-based network can practically service the 1,556 annual ballast water discharges
Existing technology should be able to meet the CA Interim Standard, but requires
prototyping and pilot projects
Cost
$3.52 billion life cycle cost over 30 year period mostly borne directly by shipping industry
Barge network requires $552 million investment
Impacts
Primary impact on discretionary cargo,
cargo exports, and remote and small ports
Harbor craft emissions increase 2.6% to 5.1%
Schedule
Nine years for implementation
Shore-based Ballast Water Reception and Treatment in California
Additional Slides
Review Process Slide 14
Pilot Project Outline Slide 15
Example Connections Slide 16
Land-based vs. Barge Slide 17
Costs, More Details Slide 18
Market Impacts, Details Slide 19
Outfalls Slide 20
ADDITIONAL SLIDES FOR QUESTIONS
Feasibility, Costs, Next Steps:SHORE-BASED BALLAST WATER RECEPTION AND TREATMENT IN CALIFORNIA
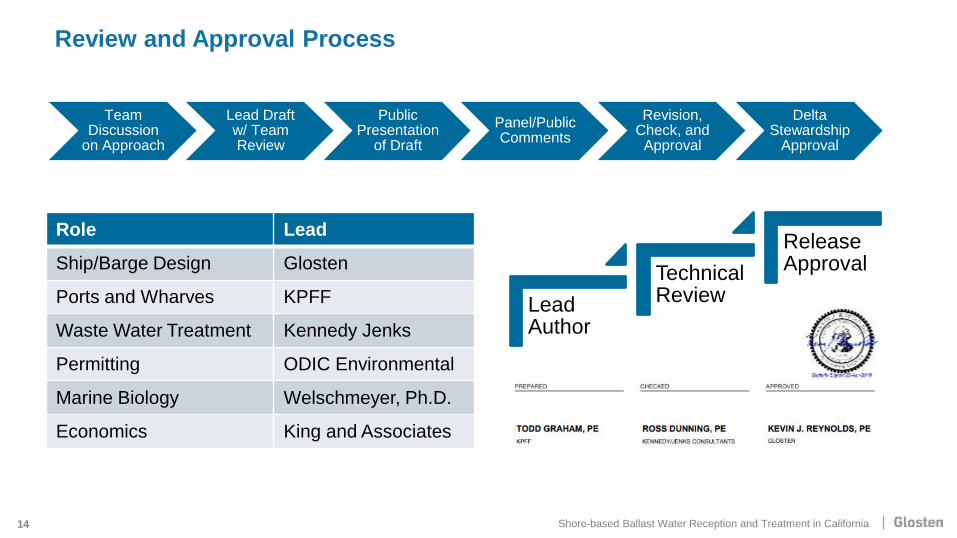
Lead Author
Technical Review
Release Approval
14
Review and Approval Process
Role Lead
Ship/Barge Design Glosten
Ports and Wharves KPFF
Waste Water Treatment Kennedy Jenks
Permitting ODIC Environmental
Marine Biology Welschmeyer, Ph.D.
Economics King and Associates
Team Discussion
on Approach
Lead Draft w/ Team Review
Public Presentation
of Draft
Panel/Public Comments
Revision, Check, and
Approval
Delta Stewardship
Approval
Shore-based Ballast Water Reception and Treatment in California

15
Pilot ProjectEstimates Not Peer Reviewed
Treatment Plant Prototype$3M analysis and bench scale
$18M full-scale, small pilot plant
$42M full-scale, large pilot plant
Trial Marine Vessel Refits$1.5M engineering, refits (two)
Testing and Verification
$3M operations and support
$3M third party testing, evaluation
Analysis and Permitting
$2.5M analysis, submittals
Totals – Three Years
Small only $28.5M
Small and Large $73M
Shore-based Ballast Water Reception and Treatment in California
16
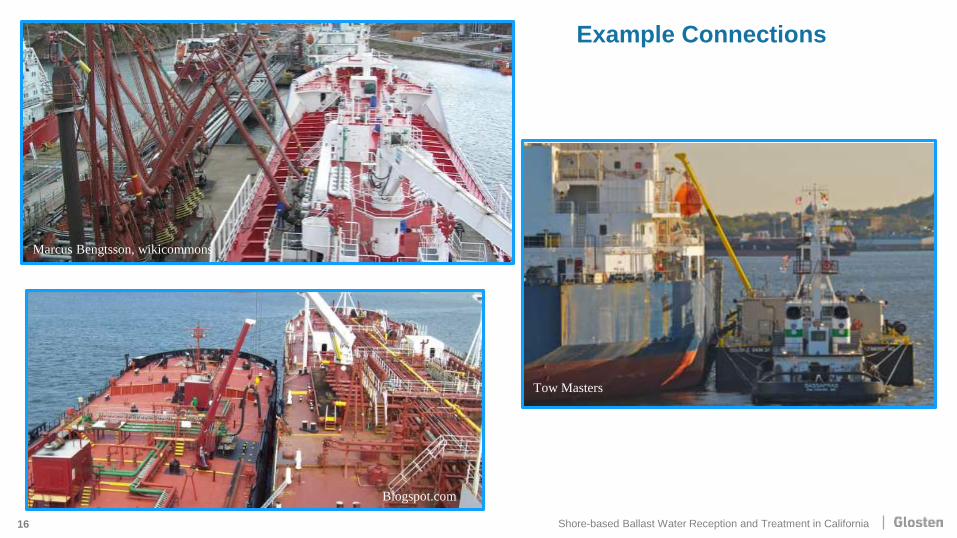
Marcus Bengtsson, wikicommons
Tow Masters
Blogspot.com
Shore-based Ballast Water Reception and Treatment in California
Example Connections
17
Panel “concurs with the concept of focusing on barge based systems”
• Barge-based less Capital and Operating Expense
• Barge-based less Technical Uncertainty
EPA notes that transferring ballast water to a treatment barge for eventual treatment
and discharge could constitute “on-shore treatment” for purposes of Part 2.2.3.5.1.2.
(2013 EPA Vessel General Permit)
Shore-based Ballast Water Reception and Treatment in California
Barge-based compared to Land-based solutions
18
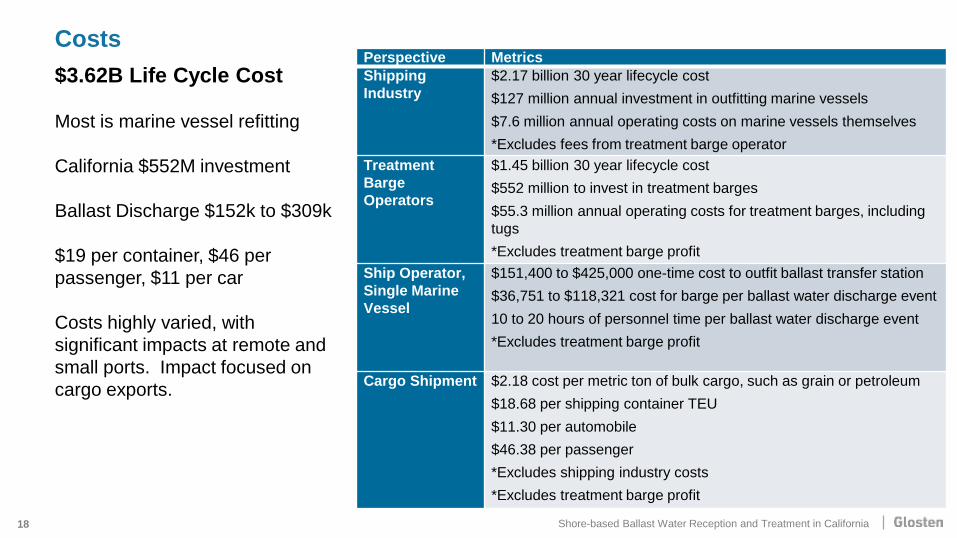
CostsPerspective Metrics
Shipping
Industry
$2.17 billion 30 year lifecycle cost
$127 million annual investment in outfitting marine vessels
$7.6 million annual operating costs on marine vessels themselves
*Excludes fees from treatment barge operator
Treatment
Barge
Operators
$1.45 billion 30 year lifecycle cost
$552 million to invest in treatment barges
$55.3 million annual operating costs for treatment barges, including
tugs
*Excludes treatment barge profit
Ship Operator,
Single Marine
Vessel
$151,400 to $425,000 one-time cost to outfit ballast transfer station
$36,751 to $118,321 cost for barge per ballast water discharge event
10 to 20 hours of personnel time per ballast water discharge event
*Excludes treatment barge profit
Cargo Shipment $2.18 cost per metric ton of bulk cargo, such as grain or petroleum
$18.68 per shipping container TEU
$11.30 per automobile
$46.38 per passenger
*Excludes shipping industry costs
*Excludes treatment barge profit
$3.62B Life Cycle Cost
Most is marine vessel refitting
California $552M investment
Ballast Discharge $152k to $309k
$19 per container, $46 per
passenger, $11 per car
Costs highly varied, with
significant impacts at remote and
small ports. Impact focused on
cargo exports.
Shore-based Ballast Water Reception and Treatment in California
19
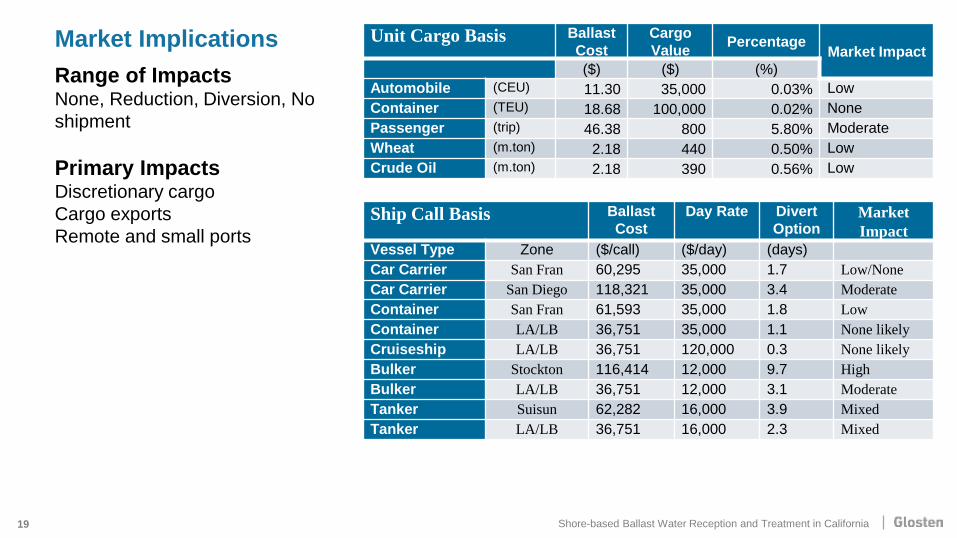
Market Implications Unit Cargo Basis Ballast
Cost
Cargo
ValuePercentage
Market Impact
($) ($) (%)
Automobile (CEU) 11.30 35,000 0.03% Low
Container (TEU) 18.68 100,000 0.02% None
Passenger (trip) 46.38 800 5.80% Moderate
Wheat (m.ton) 2.18 440 0.50% Low
Crude Oil (m.ton) 2.18 390 0.56% Low
Ship Call Basis Ballast
Cost
Day Rate Divert
OptionMarket
Impact
Vessel Type Zone ($/call) ($/day) (days)
Car Carrier San Fran 60,295 35,000 1.7 Low/None
Car Carrier San Diego 118,321 35,000 3.4 Moderate
Container San Fran 61,593 35,000 1.8 Low
Container LA/LB 36,751 35,000 1.1 None likely
Cruiseship LA/LB 36,751 120,000 0.3 None likely
Bulker Stockton 116,414 12,000 9.7 High
Bulker LA/LB 36,751 12,000 3.1 Moderate
Tanker Suisun 62,282 16,000 3.9 Mixed
Tanker LA/LB 36,751 16,000 2.3 Mixed
Range of ImpactsNone, Reduction, Diversion, No
shipment
Primary ImpactsDiscretionary cargo
Cargo exports
Remote and small ports
Shore-based Ballast Water Reception and Treatment in California

20
Bruce Perry, CSU Long Beach
OUTFALL METHODS
CURRENT
Task 6 – Outfalls, Shore-based Ballast Water Treatment in California

21
Bruce Perry, CSU Long Beach
OUTFALL METHODS SHIP DISCHARGESBALLAST WATER TO BARGE
TREATED BALLASTWATER TO HARBOR
MARINE VESSEL(SHIP)
TREATMENTBARGE
SOLIDS REMOVEDTO LANDFILL
BALLAST WATERTO HARBORMARINE VESSEL
(SHIP)
Current Outfalls Outfalls with Treatment Barges
Task 6 – Outfalls, Shore-based Ballast Water Treatment in California