Embed Size (px)
Citation preview
Feasibility of a Passive Acoustic Monitoring (PAM) network for Harbour Porpoises on the
Dutch Continental Shelf
Author(s): M. Scheidat, S.C.V. Geelhoed & C.A. Noort
Wageningen University &
Research report C095/19

Feasibility of a Passive Acoustic Monitoring (PAM) network for Harbour Porpoises on the Dutch Continental Shelf
Author(s): M. Scheidat, S.C.V. Geelhoed & C.A. Noort
Wageningen Marine Research IJmuiden, October 2019
CONFIDENTIAL no
Wageningen Marine Research report C095/19

© Wageningen Marine Research Wageningen Marine Research, an institute
within the legal entity Stichting Wageningen
Research (a foundation under Dutch private
law) represented by Dr. M.C.Th. Scholten,
Managing Director
KvK nr. 09098104,
WMR BTW nr. NL 8113.83.696.B16.
Code BIC/SWIFT address: RABONL2U
IBAN code: NL 73 RABO 0373599285
A_4_3_2 V29 (2019)
Wageningen Marine Research accepts no liability for consequential damage, nor
for damage resulting from applications of the results of work or other data
obtained from Wageningen Marine Research. Client indemnifies Wageningen
Marine Research from claims of third parties in connection with this application.
All rights reserved. No part of this publication may be reproduced and / or
published, photocopied or used in any other way without the written permission
of the publisher or author.
2 of 41 | Wageningen Marine Research report C095/19
Keywords: Passive acoustic monitoring, harbour porpoise, North Sea.
Client: Rijkswaterstaat Water, Verkeer & Leefomgeving (WVL)
Attn.: Ingeborg van Splunder Zuiderwagenplein 2 8224 AD Lelystad
This report can be downloaded for free from https://doi.org/10.18174/504076 Wageningen Marine Research provides no printed copies of reports
Wageningen Marine Research is ISO 9001:2015 certified.

Wageningen Marine Research report C095/19 | 3 of 41
Contents
Summary 4
1 Introduction 5
2 Aim of the project 7
3 PAM devices 8
3.1 General information 8 3.2 PAM device requirements 8 3.3 Comparison of PAM devices 8
3.3.1 CPOD 9 3.3.2 Wideband sound recorders 9 3.3.3 Archival PAM vs data streaming 10
3.4 Moorings 11
4 PAM data applications 13
4.1 Abundance / density 13 4.2 Temporal patterns 16
4.2.1 Seasonal patterns 16 4.2.2 Circadian patterns 17
4.3 Behaviour 17 4.3.1 3D habitat use 18 4.3.2 Feeding 19 4.3.3 Other behaviour 20
5 Design of two pilot studies 21
5.1 Survey design 21 Pilot study I: Dutch Continental Shelf 21 Pilot study II: Offshore wind farm 25
5.2 PAM device choice 26 Pilot study I: Dutch Continental Shelf 26 Pilot study II: Offshore wind farm 26
5.3 Determining correction factors 27 5.4 Deployment and recovery of PAM devices 27 5.5 Extraction of acoustic data 27 5.6 Costs 27
6 Addressing questions & recommendations 30
7 Conclusions and recommendations 32
8 Quality Assurance 33
References 34
Justification 40

4 of 41 | Wageningen Marine Research report C095/19
Summary
This report provides an assessment of the feasibility of using a Passive Acoustic Monitoring (PAM) network on the Dutch Continental Shelf (DCS) to monitor harbour porpoises. It provides a description of what static PAM is currently able to do. It gives an overview of the technical and logistical requirements when using PAM at sea and the analytical limitations when using PAM to monitor harbour porpoises. Rijkswaterstaat was asking if PAM can provide:
• Absolute abundance estimates of harbour porpoises • Relative abundance estimates of harbour porpoises • Temporal and spatial changes of harbour porpoise presence in relation to abiotic and biotic
factors • Data on diving behaviour of harbour porpoises
Currently there are two types of autonomous static PAM devices to detect porpoise vocalizations: click detectors (such as CPOD’s) and wideband or full-spectrum sound recorders. The choice for a device depends on the research question. The theory to estimate absolute porpoise density and subsequently abundance from echolocation clicks detected with PAM is solid. In practice, however, a number of the parameters needed to derive absolute densities from the acoustic detections are often not quantifiable. Where these parameters, such as click rates and detection probabilities, are not known, potential bias can be introduced. One option is to assume that these parameters, such as for example click rates and detection probabilities, are constant or random. In that case PAM can be used to derive minimum or relative density estimates of harbour porpoises. The great advantage of PAM is their continuous recording of sound, providing information throughout day and night and all seasons. This has made them a valuable tool to describe temporal and spatial patterns in harbour porpoise presence. Recently click patterns have also been analysed for behaviour providing more insights on porpoise habitat use. To illustrate the steps needed to monitor harbour porpoises with PAM, we present two case studies for setting up a PAM network covering the Dutch Continental Shelf and a PAM network covering an operating offshore wind farm. These case studies include different options and associated costs. Based on the fore mentioned points, the following conclusions are drawn: - Deriving absolute abundance from passive acoustic monitoring is still in its infancy and while
theoretically possible the needed information to do this is still not available - The primary advantages of PAM are the continuous monitoring, allowing insights in changes in
behaviour and habitat use on short (hours) and long (years) temporal scales - PAM networks have shown to be a useful tool to provide a measure of relative abundance, long-
term and of continuous habitat use, in particular in smaller areas or for populations that occur in numbers that are too low to be assessed by visual survey methods
- For the aim of obtaining relative abundance estimates, the costs for PAM networks are relatively high compared to visual line transect surveys
- Some options are available to derive some of the missing parameters needed so that PAM networks may provide absolute abundance estimates. For example, use of aerial surveys in combination with PAM stations as done in Jacobsen et al. (2017) could also be an option for Dutch waters to derive an estimate of EDA.
- Before a PAM network is to be established in Dutch waters it is important to clearly define the goals of such a network, and assess the feasibility of realistically achieving these
- A step-wise approach could start with testing, developing and improving PAM network to assess harbour porpoise abundance in small-scale areas. Once the methodology is tested it can be further extended to a larger-scale (e.g. DCS-wide) monitoring.

Wageningen Marine Research report C095/19 | 5 of 41
1 Introduction
The harbour porpoise (Phocoena phocoena) is the most abundant marine mammal species in the North Sea. The Greater North Sea population is estimated at 345,000 animals in 2016 (Hammond et al., 2017). In the last decades of the 20th century, the harbour porpoise population has undergone a redistribution across its range (Hammond et al., 2002, 2013, 2017), resulting in an increase in abundance in Dutch waters (Camphuysen, 2004). The maximum numbers in Dutch waters were estimated at ca 86,000 animals in March 2011 (Geelhoed et al., 2013) and ca 63,000 animals in July 2018 (Geelhoed & Scheidat, 2018; Geelhoed et al., 2018a). As a true cetacean harbour porpoises spend their entire life in the water. While they are most of the time underwater, they have to come to the surface to breathe. Tagged porpoises (n = 35) showed that the time spent at the surface varies between 3.4 and 6 %, whereas time spent in the upper layer of the water column, 0-2 m below the sea surface, varies between 42.5 and 61.5 % (Teilmann et al., 2013). Depending on their habitats they are able to dive to considerable depths of up to 236 m in the Atlantic (Westgate et al., 1995). In the Danish Belt diving patterns from tagged animals (e.g. Teilmann et al., 2007; Linnenschmidt et al., 2013) have shown that harbour porpoises can dive to the sea floor at a depth of 30-50 m, primarily to hunt for prey. These animals spend most of their time at 0-5m depth (68% Time at Depth), 17% at 5-10m, 8% at 10-15m, 5% at 15-20m, and 2% deeper than 20m (Teilmann et al., 2007). This is consistent with the results in the Pacific, where more than 90% of the dives of a tagged animal were shallower than 10 m and more than 80% were shorter than one minute in duration (Otani et al., 2000). Harbour porpoise use a sophisticated sonar system and use echolocation as an active sensory system for information about their environment (Verfuß et al., 2005), to find and hunt prey as well as a means of communication. They use clicks that are extremely directional (Villadsgaard et al., 2007; Miller, 2010) and are emitted in a narrow beam in both the horizontal and vertical plane (Au et al., 1999; Koblitz et al., 2012). The signals are distinctive in lasting about 50-150 microseconds, containing virtually no energy below 100 kHz with the main part of the energy around 132 kHz in a narrow band between 120-150 kHz (Au et al., 1999). These characteristics make acoustic detection and identification of harbour porpoise clicks, in relation to other potential sources of these sounds, relatively easy compared to other cetacean species. The fact that the clicks do not travel long distances and makes them also a good proxy for animal detectability around a passive acoustic monitoring device (Jacobsen et al., 2017). Unfortunately, the same characteristics also make this species difficult to track underwater. The high directionality of the narrow-band clicks, and the high attenuation due to the high frequency (among the highest in the animal kingdom), make harbour porpoises especially ill-suited to be localised and tracked through their vocalisations (Macaulay et al., 2017). To quantify the presence of cetaceans based on the sounds they produce it is also necessary to have prior knowledge on their vocal rates. Porpoises are in general considered to spend most of their time producing clicks almost continuously (Villadsgaard et al., 2007; Linnenschmidt et al., 2013; Wisniewska et al., 2016). However, Wright et al. (2017) described sleeping behaviour in tagged porpoises during parabolic dives, characterised by association with fewer or no detected clicks. This behaviour, however, constitutes a relatively small proportion of time: 4.5% of the total recording period (with individuals varying from 1.4-19.6% and 1.0-10.2% respectively). A recent study in Danish waters showed that a cessation of echolocation can also occur in response to vessels passing close to animals or at high speeds (Wisniewska et al., 2018). Population size and distribution, habitat use as well as behaviour of harbour porpoises are key questions that need to be answered to quantify the impact of human activities and to develop adequate management tools to maintain and monitor the species’ conservation status.

6 of 41 | Wageningen Marine Research report C095/19
Observing harbour porpoises visually in the wild can be challenging, in particular due to its small size, and inconspicuous behaviour. Shipboard and aerial surveys, as well as land-based behavioural observations have other drawbacks, such as being limited to daylight hours and good weather conditions. An alternative is the use of Passive Acoustic Monitoring (PAM) to monitor harbour porpoise. As mentioned before, their stereotypical echolocation sound make porpoises a good candidate to identify acoustically at sea. PAM offers a number of advantages in that it can collect data over a longer time period autonomously and is less dependent on environmental circumstances. In particular static PAM methodology has become a standard approach to investigate harbour porpoise echolocation activity and changes thereof in environmental impact assessments of offshore wind farms (e.g. in the Netherlands Geelhoed et al., 2015; Van Polanen Petel et al., 2012; Scheidat et al., 2011), and other anthropogenic activities (e.g. in the Netherlands Brasseur et al., 2010; 2011). It has also been used as a method to estimate abundance in the Baltic Sea where the low density of porpoises makes visual methods ineffective (Carlén et al., 2018; Gallus et al., 2012). Rijkswaterstaat wants to assess the feasibility of using a PAM network on the Dutch Continental Shelf (DCS) to monitor harbour porpoises. Our report provides an in-depth description of what static PAM is currently able to do, with the main focus on harbour porpoise. The report gives an overview of the technical and logistical requirements when using PAM at sea and the analytical limitations when using PAM to monitor harbour porpoises. Finally we design two case studies including approximate costs for setting up a PAM network covering the Dutch Continental Shelf and a PAM network covering an operating offshore wind farm.
Wageningen Marine Research report C095/19 | 7 of 41
2 Aim of the project
Rijkswaterstaat formulated the aim of this project as to investigate the feasibility to design a PAM network to gain more insight into the habitat preferences and population of harbour porpoise. Specifically, answers are sought for the following questions: 1. Can a (monthly/seasonal) density map be produced based on the data of a PAM network?
a. What is the minimal duration of monitoring required to produce such a map? b. Can the uncertainty in the current density maps based on aerial surveys be improved with
a PAM network? 2. If answer 1a is yes then:
a. Can causality of density be determined such as the biotic and abiotic conditions? b. Can the changes in these conditions then be used to predict changes in the densities of
the harbour porpoise in the future? 3. Can the data from a PAM network be used to:
a. identify important areas for foraging (based for example on feeding buzzes and occurrence of prey) or
b. breeding (based on presence during breeding period) of the harbour porpoise and improve our understanding of the habitat use of the species and to allow management decisions be made for the important sites?
4. Can the PAM network be used to: a. identify differences in the diurnal rhythm of the harbour porpoise and b. the difference between habitat use during the day and night?
5. Is it possible to design a PAM network that can localize the harbour porpoises 3D, so the fine-scale movements of porpoises can be studied without the use of a tag?
6. Can the use of the water column be detected and a relation established between feeding and depth of water?
7. If these questions cannot be answered by a PAM network alone, which additional research is needed to answer them?
8. Which PAM devices are the most suitable for each option for a PAM network? Provide worked out scenario’s
9. What are practical problems that need to be addressed for a PAM network? The report is set up in six sections. The first sections 3, 3.4, 4 will provide background information on PAM in general and the specific applications it can be used for in the North Sea. Section 5 will describe potential pilot studies for the Dutch Continental Shelf and for the Luchterduinen offshore wind farm. The final section 6 will address the questions listed above.

8 of 41 | Wageningen Marine Research report C095/19
3 PAM devices
3.1 General information
To monitor harbour porpoises with PAM devices, they need to be able to detect or record the emitted the acoustic signal of this species. Four important points in using PAM devices to monitor porpoises are considered: vocal behaviour, frequency, source level and directionality of the echolocation signals (Mellinger et al., 2007).
3.2 PAM device requirements
PAM devices used for detection of porpoises have to be able to record the Narrow Band High Frequency signals porpoises emit (see chapter 1) and distinguish them from other underwater sounds, The latter, except some boat sonars and echo-sounders, are more broadband or contain more energy at lower frequencies. The ideal PAM device used for porpoises would have the following requirements (Lucke, 2014):
• High frequency range: Hydrophones must have the ability to record a frequency range up to ultrasonic frequencies, since harbour porpoises emit NBHF-signals in the range of 100-150 kHz. For a digital recorder it is not possible to properly record any frequency higher than half of the sampling frequency (the “Nyquist frequency”). Any sound above this frequency is removed in the process of recording. The data size of recordings scales directly with sampling rate. The minimal sampling frequency to record porpoise clicks including harmonics is 320kHz. A higher sampling frequency has repercussions for the deployment time.
• Low self-noise: The voltage produced by the internal electronic circuits should be as low as possible to provide a maximum signal-to-noise ratio for the detected external signals.
• High dynamic range: The digital resolution (in bits) of the recording system defines the resolution of the recorded sounds; at least 16 bit resolution should be provided.
• High acoustic sensitivity: The receiving hydrophones should be very sensitive to allow for detecting sounds of low acoustic intensity. Hydrophone sensitivity is usually expressed as negative dB re 1V/µPa; the smaller this negative value the more sensitive the hydrophone is (e.g. -200 dB re 1V/ µPa is less sensitive than -160 dB re 1V/µPa). The more sensitive a hydrophone is the less amplification is needed; this can save battery power and increases the signal-to-noise ratio as the internal electrical noise would otherwise also be amplified.
• Low power consumption: The lower the power consumption of the recording system (in all functional states: recording as well as idle) the longer the battery life and hence the potential recording duration.
• Large data storage: Data storage capacity has repercussions for either the recording duration, the frequency range that can be sampled and the data resolution (e.g. 16 vs 24 bit) of the recordings. Larger storage capacity can increase either one or all of these.
• Smart sampling: The system should have an event logger and allow for smart sampling that allows duty cycling, i.e. switch to a pre-set recording mode if certain thresholds (received level at certain frequencies) are exceeded (‘event’), or adapt the gain settings of the system to avoid intense acoustic events which might lead to overloading the system.
A buffer of several seconds should be implemented so that the sequence preceding the event can also be analysed in greater detail.
3.3 Comparison of PAM devices
PAM devices can be divided in static and towed hydrophones. The latter are in general towed behind a ship, or in arrays of several devices that need to be synchronized to detections. This type of PAM recorders will not be discussed in this report. For a more extensive overview of available devices see Lucke (2014) and Sousa Lima et al. (2013). This section is limited to devices that are regularly used at sea.

Wageningen Marine Research report C095/19 | 9 of 41
Table 1. Overview of different types of static autonomous PAM devices. All prices are excluding import duties, taxes and transport costs.
Nam
eFu
ll sp
ectr
um (F
C) o
r Zer
o Cr
ossin
g (Z
C)
Snip
pets
bas
ed o
n tr
igge
r
Com
pres
sion
Exte
rnal
pow
er p
ossib
le
Num
ber o
f Bat
terie
s
Max
. Sam
plin
g ra
teM
em. /
bat
t. Fi
eld
ADC
Reco
rdin
g tim
e in
day
s
Lim
ited
by
Reco
rdin
g tim
e in
day
s
Lim
ited
by
Stor
age
limit
Estim
ated
cos
ts p
/uni
t
Incl
udin
g
Deve
lope
rCo
untr
y
C-POD ZC no yes no 10D - yes - 60-90 4Gb € 3,300 Complete system, Incl repairs Chelonia Ltd UKEA-SDA14 FS unknown unknown yes 6-18-54D 625kS/s no 16 39 Storage 154 4Tb € 12,500 RTSys FRSM4M Submersible FS yes possible no 32D 500kHz yes 16 120 1Tb € 10,000 Wildlife Acoustics USSoundtrap ST500 HF FS yes yes no 9D 576kHz yes 16 54 Storage 324 Memory 1,5Tb € 6,400 including memory Ocean instruments NZPorpoise FS no no yes 36D 384kHz yes 24 40 Storage 182 Battery 4Tb € 11,000 memory upgrade & 36D cell pack RS Aqua UKSM3M Sub FS unknown unknown 32D 384kHz yes 16 52 2Tb € 12,000 incl hydrophoon Wildlife Acoustics USAMAR G4 FS no unknown 48D or more 512kHz yes 24 76 Storage 10Tb € 34,000 5Tb storage used and 48 cell pack Jasco CA
Continuous recording
10 min/ hour
Most static PAM devices are autonomous recorders consisting of a hydrophone and a data-recording system, moored to the bottom of the sea. Two types of autonomous recorders have been used to detect porpoise vocalizations, CPOD’s and wideband (full- spectrum) sound recorders. In this section we provide an overview of the specifications of both types and their advantages and disadvantages. To use these devices for triangulation of the short porpoise vocalizations to determine a harbour porpoise location the time of these devices needs to be synchronized, which could pose logistical and technical challenges (see 4.3.1).
3.3.1 CPOD
The CPOD or Continuous POrpoise Detector is a self-contained stationary passive acoustic monitoring device. It is aimed at monitoring toothed whales by means of identifying their specific use of high-frequency sounds. The CPOD manufacturer (Chelonia Ltd, 2012) provides a completely integrated product (from hardware to processing solutions). Specifications of a CPOD are presented in Table 1. In practice, the CPOD unit works as a click detector. The device does not record the actual time signals of the clicks, but derives a set of descriptive parameters based on time information derived from measurements of timing of zero crossings in the signal. Though efficient for the recording of signals such as Narrow Band High Frequency (NBHF) signals, it is important to note that zeros crossing measurements are different from the actual measurement of the acoustic pressure using hydrophones. The later resolves the signal between the zero crossing intervals (given a high enough sampling frequency) and results in a much higher volume of data stored. The filtering reduces the data volume and enables CPODs to autonomously collect data for several months before batteries need to be changed and data downloaded. Harbour porpoise echolocation clicks can be extracted/identified with tailor-made CPOD.exe software.
3.3.2 Wideband sound recorders
The second type of autonomous recorders to detecting porpoise sounds is a wideband sound recorder(WSR), that can record sounds in a broad range of frequencies (Table 1). A wideband sound recorder records acoustic signals in the full frequency spectrum, continuously or according to a predetermined schedule. Recorded WSR data includes raw acoustic pressure at a given sampling frequency, the presence of harmonics. In other words, these recorders can be used to do a full-spectrum sound analysis. The sampling frequency and data resolution (16 or 24 bit) of a wideband sound recorder will dictate the quantity of recorded data. For instance the minimal setting in collecting uncompressed data (WAV) 16 bit, 384kHz, 1 channel will generate 2.8Gb per hour. Table 2 shows the variation in usable sample rates and bit depth (dynamic range of the recording) of commonly used wide band recorders and the uncompressed data production per period. Data storage capacity has repercussions for either the total recording duration, or the choice between continuous recording or smart sampling a proportion of the deployed time.

10 of 41 | Wageningen Marine Research report C095/19
Table 2. Comparison of different models of autonomous recorders and the data volume they create. Sampling rate (kHz) channels Data resolution
(bit depth) Gb/ hour Gb/ month Recorder type
384 1 16 2.8 2083.2 SM3M
576 1 16 4.2 3124.8 Soundtrap ST500HF
384 1 24 4.2 3124.8 RS Aqua Porpoise
576 1 24 6.3 4687.2 AMAR G4
Some acoustic loggers (Soundtrap ST500HF) are able to both log snippets of porpoise sounds and log raw acoustical data, the snippets require much less storage, so a combination of a sampling rate of 10min p/hour full data and continuous recording of porpoise snippets is possible to reduce data storage and increase deployment time. Sound analyses of the full spectral waveforms need to be done with software like PAMguard. This type of software is based on the principle of flagging harbour porpoise clicks by running algorithms that recognise the characteristics of the clicks. Gathering, processing, storing and analysing data of a wideband sound recorder is (initially) more time consuming then for CPODs. A big advantage of the use of wideband sound recorder over the use of CPOD’s is that the data contains much more information and algorithms can be developed and applied to search for click patterns describing specific behaviour (e.g. Wisniewska et al., 2018). Another advantage is that this data can be used to also identify other sound sources (if in the range of frequency recorded), such as other species, or abiotic noise. Compared to CPODs the data amounts are large, and consequently data analysis and storage is more challenging.
3.3.3 Archival PAM vs data streaming
Currently most PAM devices used in the North Sea for harbour porpoise work archive the data collected. The logistical challenges and costs involved with deployment and retrieval can be substantial (see sections 5.4 and 5.6). In coastal areas some PAM stations could potentially have a direct cable connection to land and thus enable the acoustic data to be stored there, this is for example done in Middlefart Listening Station in Denmark, which consists of a moored hydrophone with a signal that can be seen as a live-feed online (Figure 1). Another example is the Studio Bruinvis in the Eastern Scheldt, where Stichting Rugvin has positioned a click detector is close to the coast. The data is filtered for high-frequency clicks, which are then converted to be audible to humans and transmitted via radio waves in real-time to a listening station on land (https://rugvin.nl/oosterschelde/studio-bruinvis/). The click data is also stored. Other systems, such as the Coastal Acoustic Buoy (Turner et al., 2019), relay acoustic data from remote areas in real time, thus allowing reliable and fast transfer of data without having to retrieve the device.

Wageningen Marine Research report C095/19 | 11 of 41
Figure 1. A screenshot from the Middlefart Listening Station in Denmark. A static PAM device is moored in the Little Belt and data is downloaded with a cable to the land. The live-feed provides data on harbour porpoise click activity (red dots) and boat sonar (green dots). In addition information on AIS data from vessels are depicted on the map in the upper left corner. Available at (https://www.youtube.com/embed/live_stream?channel=UCs256_gIEb1mRzCxD2hTTxw).
3.4 Moorings
Autonomous PAM recorders are typically deployed at fixed locations, where they need to be moored with an anchoring and marker system in order to prevent or limit device loss. Over the last decades a lot of experience has been gained in this field. Two main systems are used (Figure 2): moorings with surface markers and moorings with acoustic release systems (e.g. Wilson et al., 2018). An extensive overview of different mooring options can be found on the website of Chelonia (https://www.chelonia.co.uk/moorings.htm). One of the main threats to any moored device in the North Sea is the interaction with fishing vessels, in particular trawling gear. There are some moorings for PAM devices that are thought to be trawl-safe, but they have not been tried out yet in Dutch waters, so we are not aware of their effectiveness. Moorings with surface markers are mandatory for installing devices in Dutch North Sea waters where shipping (especially fishing activity) can occur. In Dutch waters a mooring system using robust material, i.e. buoys, chain and concrete anchors (to prevent displacement by tidal currents), is used since the first deployment of PAM devices for offshore wind farms (Scheidat et al., 2011). The PAM devices are secured with a mooring of two buoys, of which the larger is equipped with a warning lantern. The two buoys are connected with a chain that lies on the sea floor. The second buoy serves as an extra security measure to avoid the risk of collision with trawlers in the area. The CPOD floats approximately 1 m above the concrete anchoring and thus approximately 1 m above the sea bed. The buoys can only be rented from RWS and the maintenance need to be carried out by RWS with their own ships. Apart from considering the secure mooring of the PAM device, a few other points are important to consider. The mooring itself should not produce any sounds that could be considered false positives or can mask porpoise vocalisations. The choice of the location of the mooring needs to take into account potential sound sources, or dangers to the PAM device such as fast moving currents or moving sand.

12 of 41 | Wageningen Marine Research report C095/19
Figure 2 schematic example of moorings for PAM devices in the North Sea (not to scale). On the left a mooring with surface markers, as used in Dutch waters, on the right a mooring with acoustic release.

Wageningen Marine Research report C095/19 | 13 of 41
4 PAM data applications
Based on our own experience as well as literature review we will provide an overview of the type of data PAM can currently deliver with regard to harbour porpoise. We will specifically highlight those data needs outlined in the relevant questions (section 5) and will discuss what kind of methodological approaches have been used to obtain those. We also point out some analytical tools that might be developed in the future.
4.1 Abundance / density
To infer abundance/density estimates for a species in a particular study area (e.g. the Dutch Continental Shelf) representative sub-areas are chosen and sampled. In visual surveys these samples are generally transects, and the width of coverage for the transect is being determined using distance sampling. A similar approach is applied for PAM when distance sampling estimates the effective coverage for porpoises in the area around the device. Similar to the design-based set-up of visual line-transect surveys, point sampling is usually also following a design-based approach. For a thorough background of distance sampling methodology we refer to Buckland et al. (2001). One assumption is that the sampled plots are a representative sample of the entire survey area. Only then can the density estimated over these plots be assumed to be valid for the wider survey area. The abundance over the entire survey area needs to account for the proportion of the area surveyed. There are different options, such as random or evenly spaced locations, but considerations also need to include differences between sub-strata in the study area in which different detection probabilities are expected (again, this is similar to the basic underlying assumptions that are applied to the Dutch harbour porpoise aerial surveys (Scheidat et al., 2012). If a design-based placement of the PAM stations is not possible, then alternatively one could consider a model-based approach, where inferences over the wider survey region are based on a model which relates abundance to covariates. Estimation of porpoise density and subsequently abundance from echolocation clicks detected with PAM theoretically is straightforward. Figure 3 presents a schematic overview and decision tree of the approaches to estimate densities. The density D can be expressed by the following formula:
where n is the number of detected echolocation clicks (per time interval, e.g. DPM/day), f is the proportion of detections that are false positives, p is the probability of detecting a echolocation clicks within the area a, and r represents the multiplier(s) that translates echolocation click density to porpoise density (cf Marquez et al., 2013). The abundance in an area can be expressed as the density times the size of the area. To obtain a density it is necessary to determine the fore-mentioned parameters: detection probability of porpoise clicks p, to obtain the size of the surveyed area a, and obtain an estimate of the multiplier r that translates echolocation click numbers to animal density.

14 of 41 | Wageningen Marine Research report C095/19
Acoustic detections will decrease further away from the PAM device. Distance sampling theory states that the probability of detection can be described as a function of distance r to the PAM device: g(r) (Buckland et al., 2001). If the g(r) detection curve can be derived (Figure 4), it is possible to compensate for undetected echolocation clicks by estimating an effective detection area a (Buckland et al., 2001). Furthermore, distance sampling assumes all animals are detected at zero distance from the PAM device. In other words g(0) equals 1. In practice this assumption is not valid, partly because the echolocation beam of porpoises is narrow and easily missed by the PAM device (see also 5.3.1) and because animals might not click all the time (e.g. Wright et al. 2017). Furthermore, ambient noise can affect the detection of harbour porpoise clicks (Clausen et al., 2018).
Figure 3. Schematic overview of approaches to estimate density from acoustic detections with PAM devices. From Marques et al. (2013).

Wageningen Marine Research report C095/19 | 15 of 41
Figure 4. Comparison between line transect and point transect methodology: a) distribution of animals, b) detection function and c) observed distribution of animals. The x axis shows the distance from the transect (left) or point (right), y axis shows the detection probability. (adapted from CREEM, available at: https://workshops.distancesampling.org/online-course/lecturepdfs/Ch3/L3-1%20Point%20Transects.pdf
To obtain detection distances to estimate a detection probability several studies have used simultaneous visual and passive acoustic observations in a mark–recapture framework, where the visual theodolite observation constitutes a mark and the acoustic detection a recapture. Obtaining accurate detection distances is difficult, but Kyhn et al. (2012) and Tougaard et al. (2006) have estimated the Effective Detection Radius (EDR) for T-PODs respectively to be between 22-107 m, and that the detection probability decreased with distance. There are indications that porpoise clicks can be detected at 400 m (Villadsgaard et al., 2007), or even further away by a CPOD. However, these results vary between devices (Nuuttila et al., 2018b). Another approach was applied in the United States, where simultaneous collected data from a grid of nine CPODs and three days of aerial line-transect visual surveys were used to model the Effective Detection Area (EDA) of the CPODs (Jacobson et al., 2017). These studies show that while obtaining a location-specific g(r) detection curve for a PAM device is possible, it is not easily accomplished. Another approach is modeling the detection functions and subsequently the EDA without measurement of forementioned auxiliary information (e.g. Von Benda-Beckmann et al., 2010; 2018). Detection functions can be modelled either using the passive sonar equation or by applying detectors to detect modeled vocalizations (clicks or calls) injected into recorded noise (e.g. Ainslie, 2013; Von Benda-Beckmann et al., 2018). Using both approaches on Blainville’s beaked whale echolocation clicks, Von Benda-Beckmann et al. (2018) showed that commonly used simplifying narrowband approximations to the propagation of broadband clicks can significantly underestimate the detection function, resulting in a potential bias in the click-based density estimates. For this species the predicted EDA could differ by a factor of 2, even when exactly the same energy source level and detector settings were used. The relative density bias as a consequence of these simplifying assumptions could be quantified for different other odontocete species, detector settings and noise conditions, and ranged between 2% to more than 100% for some species. Caution is needed in using this modelling approach to aid in estimation of densities.
a
b
c

16 of 41 | Wageningen Marine Research report C095/19
The next step to translate echolocation click density to porpoise density (Marquez’ multiplier r) relies on cue-counting methods. The total number of detected echolocation clicks -the cues- are combined with an estimate of the average echolocation click rate (per animal) in a given time period to estimate the number of animals (Buckland et al., 2001). Solid information on echolocation click rates of harbour porpoises is not available yet. Until recently the general consensus was that porpoises echolocate almost continuously, but that differences in the environment or changes in behaviour can evoke different echolocation click rates (e.g. Teilmann et al., 2005; Verfuß et al., 2005 Villadsgaard et al., 2007; Linnenschmidt et al., 2013; Wisniewska et al., 2016). Recent studies indicate that porpoises can strongly reduce their echolocation click rate or even stop emitting echolocation clicks, while sleeping (Wright et al., 2017), or when disturbed (Pirotta et al., 2014; Wisniewska et al., 2018). Determining one echolocation click rate that can be applied to estimate density remains challenging as both click rate and the occurrences of clicks likely are impacted by the behavioural context as well as the differences of individual porpoises, such as age, sex or reproductive status (Thomas & Marques, 2012). Another caveat is the acoustic estimation of group size as most PAM devices cannot determine how many animals produce the recorded clicks. One way to address this problem is to add a multiplier using the average group size to correct the density estimate (e.g. Moretti et al., 2010). This data has generally been obtained through visual observations. Recently Marques et al. (2019) have used the acoustic footprint of high frequency vocalisations of Blainville’s beaked whales to model group sizes from PAM data. In addition several studies have shown that the probability of a PAM device to detect a harbour porpoise varies due to sound propagation properties, and those are dependent on environmental conditions such as depth, bottom substrate, water temperature, salinity and water stratification (Urick, 1983; Dähne et al., 2013a,b). Parts of the North Sea are highly dynamic and it is likely that the characteristics of the sampling locations will not only differ, but that some of them will also change over time. All in all, we can conclude that the theory to estimate absolute porpoise density and subsequently abundance from echolocation clicks detected with PAM is solid. Figure 3 summarizes the different theoretical approaches to obtain this. In practice however a number of the parameters needed to make the calculations are not available, making it necessary to either base the calculations on a number of assumptions or to estimate relative or minimum densities. For areas with very low densities, such as the Baltic Sea (Carlén et al., 2018) or the Inner Gulf of California (Jaramillo-Legorreta et al., 2016), minimum estimate of abundance have been calculated. For these low density populations PAM networks are the only way to monitor trends as visual survey methods cannot be applied successfully anymore.
4.2 Temporal patterns
As described in the previous section estimating porpoise density from echolocation clicks detected with PAM is challenging. Acoustic detections of harbour porpoise echolocation clicks, however, can be used as a proxy for their presence, assuming the detection probability and false alarm rate can be considered constant, or at least random in relation to fixed factors. Therefore, PAM can be used to describe temporal patterns in harbour porpoise presence.
4.2.1 Seasonal patterns
Harbour porpoises show distinct temporal differences in distribution in the North Sea at large (Gilles et al., 2009, 2011 & 2016) as well as on the Dutch Continental Shelf. In the latter area, visual observations of seabird migration and marine mammals (Camphuysen, 2004 & 2011) and aerial surveys (Scheidat et al., 2012; Geelhoed et al., 2013; Geelhoed & Scheidat, 2018) show a year-round occurrence with peak numbers in December-March. After which the numbers drop and slightly increase from July onwards. Further north numbers peak in May and June along the German coast
Wageningen Marine Research report C095/19 | 17 of 41
(Gilles et al., 2009), between April-August in Denmark (Teilmann et al., 2008), and in August along the eastern coast of the United Kingdom (Evans et al., 2003). PAM studies in wind farms off the Dutch mainland coast (Scheidat et al., 2011; Van Polanen Petel et al., 2012), as well as in GEMINI off the Wadden Isles (Geelhoed et al., 2018b) corroborate these seasonal patterns. Further east along the Dutch-German border, on a line of CPODs from the island of Borkum into the Eems-Dollard estuary, Brasseur et al., (2010) detected the lowest click rate in April-July and a higher click rate in August-December. All these studies show similar seasonal patterns, with strong daily variations in acoustic detections of harbour porpoise echolocation clicks.
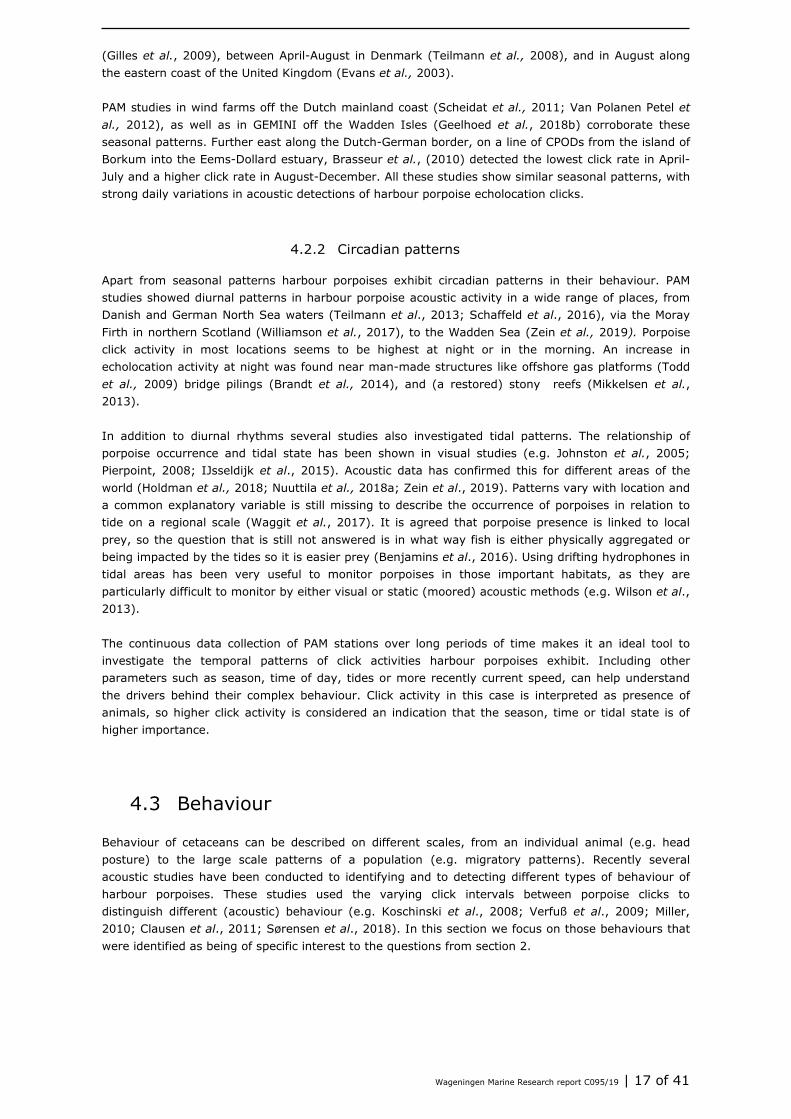
4.2.2 Circadian patterns
Apart from seasonal patterns harbour porpoises exhibit circadian patterns in their behaviour. PAM studies showed diurnal patterns in harbour porpoise acoustic activity in a wide range of places, from Danish and German North Sea waters (Teilmann et al., 2013; Schaffeld et al., 2016), via the Moray Firth in northern Scotland (Williamson et al., 2017), to the Wadden Sea (Zein et al., 2019). Porpoise click activity in most locations seems to be highest at night or in the morning. An increase in echolocation activity at night was found near man-made structures like offshore gas platforms (Todd et al., 2009) bridge pilings (Brandt et al., 2014), and (a restored) stony reefs (Mikkelsen et al., 2013). In addition to diurnal rhythms several studies also investigated tidal patterns. The relationship of porpoise occurrence and tidal state has been shown in visual studies (e.g. Johnston et al., 2005; Pierpoint, 2008; IJsseldijk et al., 2015). Acoustic data has confirmed this for different areas of the world (Holdman et al., 2018; Nuuttila et al., 2018a; Zein et al., 2019). Patterns vary with location and a common explanatory variable is still missing to describe the occurrence of porpoises in relation to tide on a regional scale (Waggit et al., 2017). It is agreed that porpoise presence is linked to local prey, so the question that is still not answered is in what way fish is either physically aggregated or being impacted by the tides so it is easier prey (Benjamins et al., 2016). Using drifting hydrophones in tidal areas has been very useful to monitor porpoises in those important habitats, as they are particularly difficult to monitor by either visual or static (moored) acoustic methods (e.g. Wilson et al., 2013). The continuous data collection of PAM stations over long periods of time makes it an ideal tool to investigate the temporal patterns of click activities harbour porpoises exhibit. Including other parameters such as season, time of day, tides or more recently current speed, can help understand the drivers behind their complex behaviour. Click activity in this case is interpreted as presence of animals, so higher click activity is considered an indication that the season, time or tidal state is of higher importance.
4.3 Behaviour
Behaviour of cetaceans can be described on different scales, from an individual animal (e.g. head posture) to the large scale patterns of a population (e.g. migratory patterns). Recently several acoustic studies have been conducted to identifying and to detecting different types of behaviour of harbour porpoises. These studies used the varying click intervals between porpoise clicks to distinguish different (acoustic) behaviour (e.g. Koschinski et al., 2008; Verfuß et al., 2009; Miller, 2010; Clausen et al., 2011; Sørensen et al., 2018). In this section we focus on those behaviours that were identified as being of specific interest to the questions from section 2.

18 of 41 | Wageningen Marine Research report C095/19
4.3.1 3D habitat use
Hydrophone arrays have been commonly used to locate and track different cetacean species over large distances (e.g. Watkins & Schevill, 1974; Freitag & Tyack, 1993; Thode, 2005; Tiemann et al., 2006; Warner et al., 2017). During foraging dives large toothed whales, such as sperm whales usually click in a 10 Hz–30 kHz frequency band (e.g. Mohl et al., 2003), and their dive patterns have been successfully reconstructed using PAM (e.g. Wahlberg et al., 2001). Smaller toothed whales, such as dolphins or porpoises, however use higher frequencies, high click rates, and a high directionality of the clicks , making it more challenging to apply this method (see Von Benda-Beckmann et al., 2013 for an overview). Only few studies have been successful in tracking their underwater movements using passive acoustics. In this section we describe three examples. Hastie et al. (2006) used a vertical array of four sonobuoy hydrophones deployed from a stationary vessel (Figure 5). They used simultaneous recordings to track the echolocation clicks of bottlenose dolphins (Tursiops truncatus). The study was investigating how the animals used the water column, in particular the amount of time they spent close to the seabed. They related the dive depth with vocalisations associated with feeding. This was possible as a specific call (“bray” Janik, 2000) had been previous identified, allowing the identification of this specific behaviour. The study area was a narrow channel at the entrance of the Cromarty Firth in Scotland which is home to a resident population. This facilitated the work as their occurrence in the area was predictable. Another advantage was that the study area has comparatively low currents ensuring that the array can be kept vertical in the water column.
A different approach was used by Malinka et al. (2018) during a study investigating how dolphins and porpoises use the area around an operating tidal turbine in the Ramsey Sound in Wales. The PAM system that was used comprised 12 hydrophones clustered into 4 groups of 3 hydrophones positioned at the base of the tidal turbine DeltaStream (Figure 6). The hydrophones within each cluster were arranged in an equilateral triangle at a distance of 0.2m to each other. The four clusters were spaced at varying distances from one another (7.9, 14.28 and 14.76 m) along the triangular turbine base. As the figure shows, only 5 of the 12 hydrophones were fully working (Figure 6, green squares), 2 not recording high frequency sounds of porpoise clicks (yellow triangles) and the remaining 5 (red circles) not recording at all. This limited the localisation ability of the PAM system and increased the inaccuracy of the tracking. The
authors presume that had all hydrophones been functional, then the tracking performance would have been significantly improved. A non-static application of PAM to obtain dive data has been used by Macaulay et al. (2017) in tidal rapids. In this approach the array drifted with the tides (from a drifting vessel) while collecting the data, which minimises the flow noise from the currents. The set-up was a 30 to 45m long vertical
Figure 5. Design of a vertical 4-hydrophone array to track bottlenose dolphin echolocation clicks.
Figure 6. Positions of the hydrophones in relation to the tidal turbine. Partially operational hydrophones did not record porpoises.

Wageningen Marine Research report C095/19 | 19 of 41
array with 6-8 hydrophones spaced 4 and 11m apart. The hydrophones on the array were equipped with Open Tags to measure their orientation every 0.01 seconds. This was used to model the underwater movements of the hydrophones. A vertical array alone can provide depth data of clicking porpoises, but it cannot provide a bearing. Therefore another cluster of 4 hydrophones (quad array) was placed on the vessel, which allowed 3D coordinates to be determined. Using a vector GPS the heading of the vessel can be determined during the deployment period. All of this data was then analysed to model the hydrophone positions and subsequently calculate the locations of the clicks. Some of the limitations of the application was that ambient noise can make the system less effective in detecting clicks and reduce the detection range. Another challenge is the general problem related to the very narrow echolocation beam of porpoises. To localise an animal it needs to be detected by a number of hydrophones, however, the detectability on any hydrophone depends greatly on the orientation of the porpoise. An animal facing away from the array is far less likely to be detected than one facing towards the array. This means that almost no entire dives are recorded. Dive information on porpoises are inferred from a large number of dives from different individuals by summarizing the recorded dive sections.
Summarizing the experiences from the mentioned studies it is clear that a number of challenges would be faced when attempting this type of work with porpoises. First of all, harbour porpoises are probably the most challenging species to use this approach because the produce among the highest frequency of any marine mammal. As Macaulay et al. (2017) stated in his conclusion: “the relatively high attenuation and directionality of NBHF clicks makes the harbour porpoise a particularly poor candidate species for localisation using PAM.” Because higher frequencies attenuate faster, the detection distances are small. To overcome the issue of high click-rates and identifying different click trains or clicks hydrophone elements need to be spaced closer together in the hydrophones. The locations of the
hydrophones need to be as exact as possible, as uncertainties will cause errors in the time, and even the smallest errors will make the synchronisation between the hydrophones imprecise. Working with higher frequencies also means the computer time needed for processing the data and during analyses is higher than for other species. Having said that, in areas that have a predictable occurrence of animals and an option to install a system that can withstand currents, monitoring porpoise behaviour for an area of specific interest would be possible. As so little information on dive physiology and patterns is known, any information on dive depth and feeding patterns, even for a smaller area, would be valuable.
4.3.2 Feeding
Harbour porpoises are believed to have a very high energy demand due to their large body surface to volume ratio and their high metabolism, and thus prey availability is of high importance to them (Kastelein, 1998). Some information on the diet of harbour porpoises in the North Sea is available through the analyses of stranded and bycaught animals (Börjesson et al., 2003; Santos & Pierce 2003; Santos et al., 2004; Jansen et al., 2012). How porpoises use their sonar to find and catch their prey has been described in captivity (e.g. Miller, 2010), breaking down the characteristics of the
Figure 7. The vertical array (8 hydrophones) and the cluster array (4 hydrophones) used in the tidal stream. From: Macaulay et al. (2017).

20 of 41 | Wageningen Marine Research report C095/19
vocalizations used during foraging. When approaching a prey, the inter click intervals (ICI) show different phases: the initial part of the approach phase contains a stable click interval of 50–60ms, then the porpoise starts to decrease the click interval progressively (Miller, 2010). When a porpoise closes in on its prey, the ICI drops sharply from roughly 50ms to below 20ms. In close proximity from its prey, the click train ends with a “buzz”, with a click interval below 2ms, indicating that the prey has been found, and most likely captured (Carlström, 2005; DeRuiter et al., 2009; Miller, 2010; Nurminem, 2010; Verfuß et al., 2009). Telemetry studies and studies with porpoises equipped with high-resolution sound and movement recording DTAGs have shown the same type of acoustic patterns in the wild (e.g. Linnenschmidt et al., 2013; Wisniewska et al., 2016). Berges et al. (2019) compared different analytical options to identify and quantify these final buzzes when found in CPOD data collected in the GEMINI wind farm area in the Netherlands. The click-based approach by Pirotta et al. (2014a,b), in which an ICI <10ms is used to classify buzzes, was deemed the most suitable for the data analysed. This method filters the different clicks using the separations between buzz ICIs, regular ICIs and inter-train ICIs. Buzzes with ICIs <2ms can also be produced in a social context, thought to express pain, distress, dominance or aggression (e.g. Amundin, 1991), but currently cannot be distinguished from feeding buzzes in the CPOD data. Berges et al. (2019) used the proportion of buzz clicks relative to the total number of clicks, the buzz click ratio, as an index of feeding behaviour. For the time being they assumed that the occurrence of non-foraging buzzes are a constant or at least random source of potential false positives. If this is valid, or if the number of non-foraging buzzes is negligible in relation to feeding buzzes, foraging behaviour can be quantified in sufficient numbers to describe (temporal) patterns and changes thereof. Analogue to the conversion of echolocation clicks to densities of harbour porpoises, a cue based approach could translate feeding buzzes into foraging activity of harbour porpoises at sea.
4.3.3 Other behaviour
From recent studies using detachable acoustic tags on animals in the wild new information on harbour porpoise acoustic communication is emerging (Sørensen et al., 2018). So far most of our knowledge has come from studies in captivity (e.g. Verfuss et al., 2009; Clausen et al., 2011). In the future it is conceivable that echolocation signals from harbour porpoises could be analysed in more detail including communication and social calls. It is also possible the details of clicks could be used to determine if animals are adults of calves. However, most likely this can only be done using full-spectrum data. One challenge with all static PAMs is that they only record parts of “the conversation” of a porpoise. Interpreting these snippets is very difficult as the ecological context of the behaviour is missing. In contrast, tags on an animal record echolocation continuously while also providing data on other behaviour, such as dive pattern.

Wageningen Marine Research report C095/19 | 21 of 41
5 Design of two pilot studies
We designed two pilot studies for PAM networks, one for the Dutch Continental Shelf and one for an operating offshore wind farm, using Luchterduinen as template. Using real scenarios produce expected project designs as well as a projection of costs for different options. These frameworks could also be used to further simulate if these proposed survey designs could provide desired results in the future. Such results would however need to first be defined, and could for example be the aim to detect a trend in porpoise density with a specific certainty (e.g. 30%) over a set time period (e.g. 6 years). This was outside the scope of this report, but this can be done in the future. Each pilot project consists of the following phases:
1. survey design 2. PAM device choice 3. determining correction factors 4. servicing of PAM devices 5. extraction of acoustic data 6. analysis of data 7. interpretation of the results
From the previous chapters it has become clear that PAM has proved to be efficient in showing local patterns in occurrence of harbour porpoises. It has not yet been established as a method to estimate absolute abundance of porpoises. To be able to design these pilot studies we at times had to make some assumptions, based on the most recent information available. Details on the rationale for the decisions are made in the respective sections.
5.1 Survey design
For the survey design a number of parameters needs to be considered: PAM placement: The sampling designs were generated using the distance sampling program (v7) by importing shapefiles of the two study areas and generating a grid of known coverage probability of 1000 points for each of these. Of these grids both simple random and systematic sampling designs were derived for a different number of samples (i.c. PAM stations). Effective detection range/area: As we are not able to determine the effective detection range (EDR) per PAM device and per location we are using two values of 50 m and 100 m based on published data (Jacobsen et al., 2017; Nuutilla et al. 2018b). The effective detection area (EDA) is 0.0078 km2 for an EDR of 50m and 0.0314 km2 for 100m. For now we assume the EDR does not differ between devices. Number of PAM devices: Based on logistical and financial constraints that became clear after consultation of RWS, we used a number of different scenarios. For the Dutch Continental Shelf we used 30, 100 and 300 PAM stations. For the Luchterduinen offshore wind farm we used 10, 20 and 30 PAM stations.
Pilot study I: Dutch Continental Shelf
The Dutch Continental Shelf has a size of 58,932 km2. From our current knowledge (Geelhoed & Scheidat, 2018; Gilles et al., 2016) we know that porpoises are not homogenous distributed in this area on of at any point in time. To reduce the variability in the data sampling a stratification of the

22 of 41 | Wageningen Marine Research report C095/19
study area as has been done for aerial surveys would be useful (Scheidat et al., 2012). For this pilot study, however, we are only working with one stratum, the entire DCS. An overview of different scenarios for PAM survey designs is given in Table 3. Regarding the sampling design, the outcome between a simple random and a systematic design in terms of coverage is obviously not different if the same number of stations are placed. The main impact of the different designs would be on a logistical level. Planning the deployment and servicing of PAM stations in such a large area is challenging, in particular in offshore waters, making a systematic grid most likely better suited. We picked the design DCS 07 for the further cost analyses (section 5.6). That the application of such a grid is possible on a large scale can be seen in the example of the SAMBAH survey. They generated a systematic grid with a random starting point and a random tilt angle of 304 acoustic monitoring stations in their study area (Figure 8) as well as a second random grid with an offset to provide them with alternative positions. 40 stations had to be relocated to alternative positions due to logistical limitations (high trawling, military areas, shipping lane, no permits).
Regarding the coverage in general for the proposed DCS survey, in relation to the size of the DCS the EDA of a single PAM device (EDR of 50 m) is 0.0078 km2, thus only covering 0.000013% of the overall area. Even when using 300 devices and assuming an EDA of 0.0314 km2 (EDR of 100 m) only about 0.016% of the DCS is covered. However, porpoises move around and the strength of PAM is that it can collect data over a long period of time and porpoise detections can accumulate over time. Data can be analysed on different scales and the resolution of the indicator of porpoise occurrence can be adapted to the amount of clicks that were recorded. For example, in an area of low porpoise density data might be compiled as Porpoise Positive Months (PPM), whereas in other areas Porpoise Positive
Figure 8. The survey design for the SAMBAH project in the Baltic Sea. The black dots show the 304 acoustic monitoring stations for harbour porpoises placed on a systematic sampling grid (from Carlén et al., 2018). The study area covered was 166,800km2.

Wageningen Marine Research report C095/19 | 23 of 41
Days (PPD) per month or Porpoise Positive Hours (PPH) per day might be the more adequate measurement. A disadvantage of a limited amount of stationary sampling points that cannot be compensated with time is that some of the location characteristics will be static. As one aim of our work is to link porpoise presence to habitat characteristics, such as depth, slope and distance from shore, it is unlikely that 30 stations adequately represent the diverse habitat of the North Sea. One option could be to rotate positions to increase data for different areas. For example, one could rotate half the PAM devices and keep the other half fixed. However, we do not consider that option in our scenarios. Table 3. An overview of different scenarios for PAM survey designs for the Dutch Continental Shelf generated using distance v7. Sampling designs are simple random or systematic with an assumed Effective Detection Radius (EDR) of 50 m or 100 m and the associated Effective Detection Area (EDA). The number of sampling stations vary from 29 to 300. The number of stations generated for the systematic design can differ from the random design due to constraints in fitting the exact number into the study area. The respective designs are shown in Figure 8. Highlighted is the survey used for the cost estimate (section 5.6).
Design Area size (km2)
Sampling design
Assumed EDR (m2)
EDA (m2)
Area covered by PAM
(km2)
% area of DCS covered
by PAM
# PAM stations generated
Spacing between stations
(km)
DCS01 58,932 Random 50 7854 0.236 0.0004 30 -
DCS02 58,932 Random 50 7854 0.785 0.0013 100 -
DCS03 58,932 Random 50 7854 2.354 0.0040 300 -
DCS04 58,932 Random 100 31,416 0.942 0.0016 30 -
DCS05 58,932 Random 100 31,416 3.142 0.0053 100 -
DCS06 58,932 Random 100 31,416 9.425 0.0160 300 -
DCS07 58,932 Systematic 50 7854 0.228 0.0004 29 45.86
DCS08 58,932 Systematic 50 7854 0.903 0.0015 115 22.93
DCS09 58,932 Systematic 50 7854 2.264 0.0038 289 14.33
DCS10 58,932 Systematic 100 31,416 0.911 0.0015 29 45.86
DCS11 58,932 Systematic 100 31,416 3.613 0.0061 115 22.93
DCS12 58,932 Systematic 100 31,416 9.079 0.0154 289 14.33
Another aspect of PAM sampling that becomes clear from Table 3 is that the EDR has a great impact on the area covered, as doubling of the radius will increase the area size by 4. This means that the lack of data or more accurately a variation in data on the EDR (e.g. Nuuttila et al., 2018) for the monitoring stations will be a major cause of bias for any study, in particular if it eventually aims to look at absolute abundance data.

24 of 41 | Wageningen Marine Research report C095/19
Figure 9. Overview of the different survey designs created for the Dutch Continental Shelf (using distance v7). The first row shows simple random designs (30, 100 and 300 stations), the second systematic designs (29, 115 and 289 stations).
DCS 01 & 04 Simple random design
30 PAM stations
DCS 02 & 05 Simple random design
100 PAM stations
DCS 03 & 06 Simple random design
300 PAM stations
DCS 07 & 10 Systematic design 29 PAM stations
DCS 08 & 11 Systematic design 115 PAM stations
DCS 09 & WP 12 Systematic design 289 PAM stations

Wageningen Marine Research report C095/19 | 25 of 41
Pilot study II: Offshore wind farm
We used the Luchterduinen offshore wind farm area for the second pilot study. For the design of the PAM survey we only used the area inside the wind farm (15.89 km2). A different set-up is conceivable, consisting of reference areas outside the windfarm to monitor habitat use of porpoises outside and inside a wind farm. The same principles outlined here would also be true for the reference area. The results of the designs are shown in Table 4 and Figure 9. As discussed for the DCS design, the difference between a simple random and a systematic design is primarily relevant in terms of logistics. In particular in a wind farm with regularly placed wind turbines a systematic sampling grid would be preferable. This is why we proposed the survey design for WP 08 for the cost calculations. In contrast to the coverage provided for the DCS the placement of even 9 stations would allow a coverage between 0.44 % (50m EDR) and 1.78 % (100m EDR) of the area. So when porpoises use the area and move around, their presence and behaviour can be monitored on a much better resolution than in the DCS example. Table 4. An overview of different scenarios for PAM survey designs in Luchterduinen offshore wind farm generated using distance v7. Sampling design are simple random or systematic with an assumed Effective Detection Radius (EDR) of 50 m or 100 m. Area coverage for an EDR of 100 m is estimated from the generated survey designs, which can be seen in Figure 9. The number of sampling stations vary from 9 to 32. The number of stations generated for the systematic design can differ from the random design due to constraints in fitting the exact number into the study area. Highlighted is the survey used for the cost estimate (section 5.6).
Design Area size (km2)
Sampling design
Assumed EDR (m)
EDA (m2)
Area covered by PAM
(km2)
% area covered by PAM
# PAM stations generated
Spacing between stations
(km)
WP 01 15.89 Random 50 7854 0.079 0.49 10 -
WP 02 15.89 Random 50 7854 0.157 0.99 20 -
WP 03 15.89 Random 50 7854 0.236 1.48 30 -
WP 04 15.89 Random 100 31,416 0.314 1.98 10 -
WP 05 15.89 Random 100 31,416 0.628 3.95 20 -
WP 06 15.89 Random 100 31,416 0.942 5.93 30 -
WP 07 15.89 Systematic 50 7854 0.071 0.44 9 1.33
WP 08 15.89 Systematic 50 7854 0.165 1.04 21 0.86
WP 09 15.89 Systematic 50 7854 0.236 1.48 30 0.73
WP 10 15.89 Systematic 100 31,416 0.283 1.78 9 1.33
WP 11 15.89 Systematic 100 31,416 0.660 4.15 21 0.86
WP 12 15.89 Systematic 100 31,416 0.942 5.93 30 0.73

26 of 41 | Wageningen Marine Research report C095/19
WP 01 & 04 Simple random design
10 PAM stations
WP 02 & 05 Simple random design
20 PAM stations
WP 03 & 06 Simple random design
30 PAM stations
WP 07 & 10 Systematic design
9 PAM stations
WP 08 & 11 Systematic design 21 PAM stations
WP 09 & WP 12 Systematic design 30 PAM stations
Figure 10. Overview of the different survey designs created for Luchterduinen offshore wind farm (using distance v7). The first row shows simple random designs (10, 20 and 30 stations), the second systematic designs (9, 21 and 30 stations).
5.2 PAM device choice
Based on our discussions in section 5.1 and the aims of the two pilot projects the decision was to use different PAM devices in each pilot study.
Pilot study I: Dutch Continental Shelf
Since the number of PAM devices to obtain good coverage of the Dutch Continental Shelf is high, we made a choice to use CPODs. They require less frequent servicing than most wide band sound recorders; servicing and retrieving data once every four months is realistic, reducing the costs (mainly ship time) substantially. Assuming the main aim of this project is to estimate (absolute) abundance and seasonal changes, harbour porpoise click occurrence is a sufficient measurement.
Pilot study II: Offshore wind farm
The main aim of the project is to investigate how animals use the area, including how their feeding behaviour changes over time in relation to the presence of the wind farm. One hypothesis is that the hard substrate provided by the wind farm might over time increase the available prey for the porpoise. Differences in the specific use of clicks associated with foraging behaviour, for example outside and inside the park or over time, can best be investigated with a PAM device that has the capacity to record wide band. Thus the use of sound traps (or a similar type of wide band sound recorder) is
Wageningen Marine Research report C095/19 | 27 of 41
recommended. Since the devices will be deployed in a comparatively small area close to shore servicing time is limited.
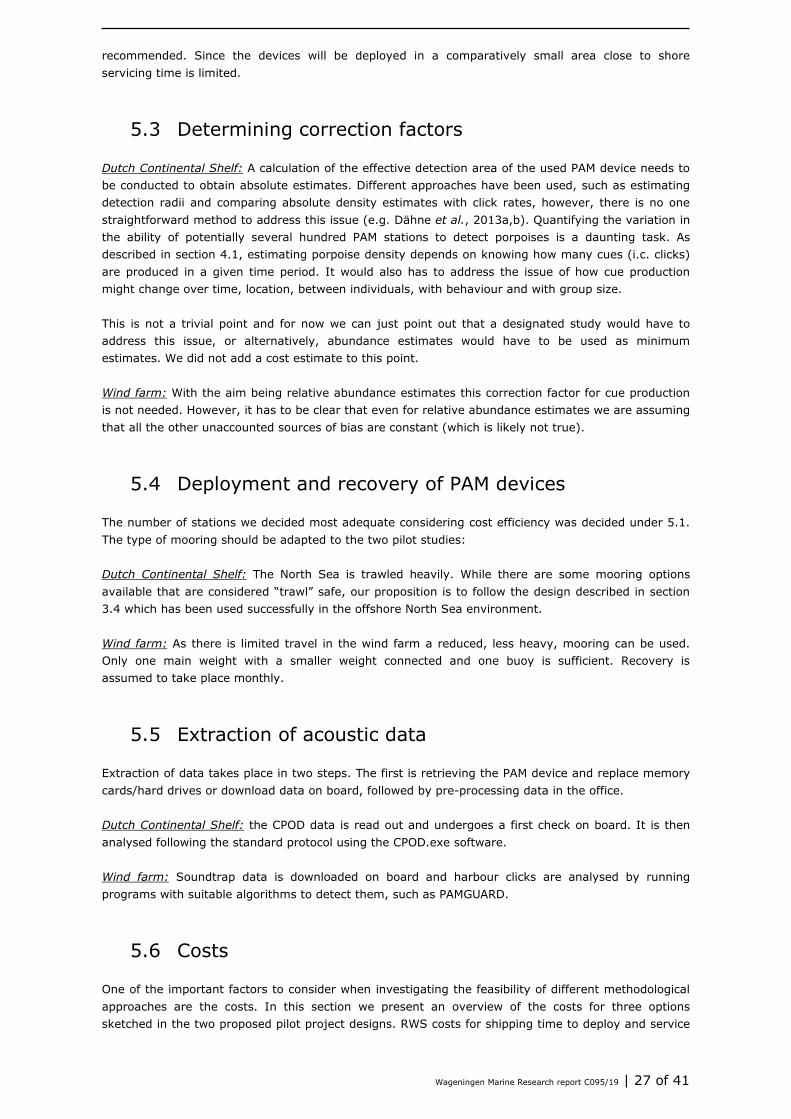
5.3 Determining correction factors
Dutch Continental Shelf: A calculation of the effective detection area of the used PAM device needs to be conducted to obtain absolute estimates. Different approaches have been used, such as estimating detection radii and comparing absolute density estimates with click rates, however, there is no one straightforward method to address this issue (e.g. Dähne et al., 2013a,b). Quantifying the variation in the ability of potentially several hundred PAM stations to detect porpoises is a daunting task. As described in section 4.1, estimating porpoise density depends on knowing how many cues (i.c. clicks) are produced in a given time period. It would also has to address the issue of how cue production might change over time, location, between individuals, with behaviour and with group size. This is not a trivial point and for now we can just point out that a designated study would have to address this issue, or alternatively, abundance estimates would have to be used as minimum estimates. We did not add a cost estimate to this point. Wind farm: With the aim being relative abundance estimates this correction factor for cue production is not needed. However, it has to be clear that even for relative abundance estimates we are assuming that all the other unaccounted sources of bias are constant (which is likely not true).
5.4 Deployment and recovery of PAM devices
The number of stations we decided most adequate considering cost efficiency was decided under 5.1. The type of mooring should be adapted to the two pilot studies: Dutch Continental Shelf: The North Sea is trawled heavily. While there are some mooring options available that are considered “trawl” safe, our proposition is to follow the design described in section 3.4 which has been used successfully in the offshore North Sea environment. Wind farm: As there is limited travel in the wind farm a reduced, less heavy, mooring can be used. Only one main weight with a smaller weight connected and one buoy is sufficient. Recovery is assumed to take place monthly.
5.5 Extraction of acoustic data
Extraction of data takes place in two steps. The first is retrieving the PAM device and replace memory cards/hard drives or download data on board, followed by pre-processing data in the office. Dutch Continental Shelf: the CPOD data is read out and undergoes a first check on board. It is then analysed following the standard protocol using the CPOD.exe software. Wind farm: Soundtrap data is downloaded on board and harbour clicks are analysed by running programs with suitable algorithms to detect them, such as PAMGUARD.
5.6 Costs
One of the important factors to consider when investigating the feasibility of different methodological approaches are the costs. In this section we present an overview of the costs for three options sketched in the two proposed pilot project designs. RWS costs for shipping time to deploy and service

28 of 41 | Wageningen Marine Research report C095/19
the PAM devices, and rental of buoys for moorings are substantial. For the actual data collection and analysis the most important costs are purchase of PAM devices and personnel costs including deployment/servicing of PAM devices, and post-processing, analysis and reporting on the collected data. Calculation of the costs is based on the following assumptions:
• Purchase costs for one CPOD €3300,= and for one Soundtrap €6400,= • Personnel costs are based on a day-rate of €1000,= • Costs for servicing, processing and basic analysis of data increase proportionally to the
number of devices • Costs for analysis of the processed data and reporting is assumed to be independent of the
number of devices • Deployment and servicing time of PAM devices is assumed to be constant, irrespective of the
location of PAM stations •
Estimates for RWS costs are based on the following assumptions: • Ship time at a day-rate of €1000,= • Rental of buoys for moorings €1000,=/month • Deployment based on 5 PAM devices/day, limited by the number of buoys the ship can carry • After deployment of each batch of PAM devices the ship has to sail a day to and from harbour • Servicing based on a fixed number of PAM devices/day, all devices serviced in one continuous
shift, without ‘weekend’ breaks Dutch Continental Shelf: For cost estimates for the Dutch Continental Shelf scenarios additional assumptions were made:
• Servicing based on 5 CPODs/day • PODs serviced three times a year
These assumption lead to estimated costs presented in Table 5. The cheapest scenario with 30 CPODs will cost approximately €1.1 million, annually. Table 5. Estimated costs for three scenarios.
CPODs N=30 N=100 N=300
Material €99,000 €330,000 €990,000
Deployment/Servicing €30,000 €100,000 €300,000
Calibration €9,600 €32,000 €96,000
Post-processing €22,500 €75,000 €225,000
Analysis/processing €136,250 €287,500 €550,000
Reporting €30,000 €30,000 €30,000
Subtotal €327,350 €854,500 €2,191,000
RWS costs1 €810,000 €2,700,000 €8,100,000 1minimum estimate. See above.
Wind farm: For cost estimates for offshore wind farm scenarios additional assumptions were made:
• Deployment based on 10 Soundtraps/day, sailing a day to and from harbour after deployment of each batch
• Servicing based on 10 Soundtraps /day • Soundtraps serviced monthly • Post-processing and analysis of Soundtrap data is more time consuming than for CPODs
The estimated costs are presented in Table 6.

Wageningen Marine Research report C095/19 | 29 of 41
Table 6. Estimated costs for three scenarios.
Soundtraps N=10 N=20 N=30
Material €64,000 €128,000 €192,000
Deployment/Servicing €14,000 €28,000 €42,000
Calibration €3,200 €6,400 €9,600
Post-processing €30,000 €60,000 €90,000
Analysis/processing €165,000 €180,000 €195,000
Reporting €30,000 €30,000 €30,000
Subtotal €306,200 €432,400 €558,600
RWS costs1 €360,000 €720,000 €1,080,000 1minimum estimate. See above.

30 of 41 | Wageningen Marine Research report C095/19
6 Addressing questions & recommendations
The information needed to address the questions from chapter 2 is provided in the first part of this report. Therefore our answers provided below will be brief and cross-referenced to the relevant sections. 1. Can a (monthly/seasonal) density map be produced based on the data of a PAM network?
a. What is the minimal duration of monitoring required to produce such a map? b. Can the uncertainty in the current density maps based on aerial surveys be improved with
a PAM network? 1. Yes, a monthly/seasonal density map can be produced based on the data of a PAM network. However, only minimum and relative densities can be derived from the collected data. Apart from the assumptions made The accuracy will depend on the coverage of the PAM network in relationship to the area and thus, considering the logistical challenges, is better suited for smaller areas. 1.a. The minimal duration of monitoring required to produce a density map depends on the research framework. What is the area size, what is the expected density of porpoises (and thus the cue production) and what is the required accuracy for the results? Section 5.1 highlights the challenges of spatial coverage using PAM stations by comparing the DCS area (e.g. 30 PAM stations cover only 0.0004-0.0016%) and the wind farm area (30 stations cover 0.44-1.98%). Density maps would likely be modelled and as such would need to have information not only on local occurrence of porpoises but also on biotic and abiotic parameters influencing that occurrence. In general, the length of the monitoring is not the key point, accuracy of sampling would be increased by increasing the number of stations. 1.b. No. The uncertainties that are associated with aerial surveys using design-based line transect distance sampling are primarily associated with the variability of detection rates between transects. That uncertainty could not be reduced by density data from a PAM network. There are studies that are designed in a way that acoustic and visual surveys are done together to improve the resulting data. That would be aimed specifically to improve detection probability of either the visual survey or calculate the detectability of the PAM. Uncertainty in the current density maps for other seasons than summer and spring can be reduced by combining monitoring data from the aerial surveys of WMR and MWTL, which conduct bi-monthly surveys. Currently PBL and WMR are looking into possibilities to combine these data as a first step to achieve this. Extending WMR aerial surveys to other seasons, increasing survey effort or applying non-design based analytical methods (such as spatial modelling) would be other possibilities to reduce the uncertainty., A priori assuming the detection probability of harbour porpoises, and the multiplier r that translates echolocation click numbers to density are constant during the year, PAM based minimum and relative density maps can provide additional year round information for shorter time periods (month, season). 2. If answer 1a is yes then:
a. Can causality of density be determined such as the biotic and abiotic conditions? b. Can the changes in these conditions then be used to predict changes in the densities of
the harbour porpoise in the future? 2.a. and 2.b. The relevant parameters need first to be measured or obtained. See the arguments above, if the coverage of data is based on very few sampling points relative to the area of the study it is unlikely it can provide sound results. The same is true for predicting changes.
3. Can the data from a PAM network be used to:
a. identify important areas for foraging (based for example on feeding buzzes and occurrence of prey) or

Wageningen Marine Research report C095/19 | 31 of 41
b. breeding (based on presence during breeding period) of the harbour porpoise and improve our understanding of the habitat use of the species and to allow management decisions be made for the important sites?
3.a. Yes, but the ability to record feeding activity depends on the used PAM device and the analytical method (see section 4.3.2). CPOD data can only be analysed for a fraction of the feeding event, the feeding buzzes, whereas Soundtraps probably perform better allowing more complete click patterns associated with foraging behaviour to be analysed. For all static devices the challenge is that the narrow beam and the high attenuation of the porpoise click does only allow recording partial click trains occurring close to the device. This is why even the 3D tracking with arrays of hydrophones can generally not track complete feeding events but only sections. See section 4.3.1 and 4.3.2.
3.b. No, at this point. It would need more research, for example on calves in captivity, to identify if and how porpoise calves clicks differ from adults. See section 4.3.3. 4. Can the PAM network be used to:
a. identify differences in the diurnal rhythm of the harbour porpoise and b. the difference between habitat use during the day and night?
4.a. Yes, see section 4.2.2 4.b. Yes, but only feeding specifically, see section 4.2.2 5. Is it possible to design a PAM network that can localize the harbour porpoises 3D, so the fine-scale movements of porpoises can be studied without the use of a tag? Yes, but it is challenging. As described in section 4.3.1., individual porpoises cannot be distinguished acoustically, therefore parts of dives of different individuals have to be stitched together to sketch fine scale movements. Synchronization of the PAM devices to accurately triangulate the echolocation source will be a technical challenge. The most feasible option in the Netherlands to test such a network is in the fairly sheltered Eastern Scheldt. With the exception of the tidal currents that can pose logistical challenges, the deeper waters in which porpoises have been seen to conduct long dives, most likely to feed, could be suited for a trial (pers. comment A Podt, Stichting Rugvin). 6. Can the use of the water column be detected and a relation established between feeding and depth of water? Yes, with limitations. See section 4.3.1 and answer above. 7. If these questions cannot be answered by a PAM network alone, which additional research is needed to answer them? High detailed data on individual behaviour under water can best be obtained through tagging, for example with acoustic detachable tags. See Scheidat & Geelhoed (2016) for an overview. 8. Which PAM devices are the most suitable for each option for a PAM network? Provide worked out scenario’s CPOD and Soundtrap, depending on amount of stations, area, and aims, see sections 3.3 and 5
9. What are practical problems that need to be addressed for a PAM network? Data storage and retrieval, moorings, placement and retrieval etc, see section 5

32 of 41 | Wageningen Marine Research report C095/19
7 Conclusions and recommendations
- Deriving absolute abundance from passive acoustic monitoring is still in its infancy and while theoretically possible the needed information to do this is still not available
- The primary advantages of PAM are the continuous monitoring, allowing insights in changes in behaviour and habitat use on short (hours) and long (years) temporal scales
- PAM networks have shown to be a useful tool to provide a measure of relative abundance, long-term and of continuous habitat use, in particular in smaller areas or for populations that occur in numbers that are too low to be assessed by visual survey methods
- For the aim of obtaining relative abundance estimates, the costs for PAM networks are relatively high compared to visual line transect surveys
- Some options are available to derive some of the missing parameters needed so that PAM networks may provide absolute abundance estimates. For example, use of aerial surveys in combination with PAM stations as done in Jacobsen et al. (2017) could also be an option for Dutch waters to derive an estimate of EDA.
- Before a PAM network is to be established in Dutch waters it is important to clearly define the goals of such a network, and assess the feasibility of realistically achieving these
- A step-wise approach could start with testing, developing and improving PAM network to assess harbour porpoise abundance in small-scale areas. Once the methodology is tested it can be further extended to a larger-scale (e.g. DCS-wide) monitoring
Within the framework of these conclusions we recommend:
the use of PAM in those areas where PAM has an advantage over visual survey methods. This is in particularly true in areas with very turbid waters, areas that are highly influenced by tides (Wadden Sea), or areas with low densities.
that PAM networks currently should be used in smaller areas such as offshore wind farms to monitor the fine scale habitat use and behaviour of harbour porpoise and investigate continuous changes over time.
the use of PAM in combination with other methods, such as the Eastern Scheldt where a well-studied photo-identified population of porpoises is present. This small population could serve as a case study to investigate in more detail how animals feed and link this to individual life parameters.
the use of full-spectrum PAM devices if possible. In particular in small scale studies, such as in wind farms, when there is an interest in more detailed analysis of behaviour, such as feeding, full-spectrum data would be preferable. It would also potentially allow to derive information on daily behavioural budgets.
to invest into the development of systems that would allow real time data streaming and/or transmission of data, in particular when aiming for full-spectrum data. A real-time data stream would reduce costs for servicing and would allow real time monitoring of sounds at sea.
the development of automated analysis methodology and systems that would allow monitoring of an area with a network of PAM in a cost-efficient way. This includes the development of specific parameters that can be used as an index for porpoise occurrence and behaviour, and parameters that can translate echolocation click density to porpoise density (Marquez’ multiplier r). Monitoring this index can provide an early warning system for changes seen in a species sensitive to human impact.

Wageningen Marine Research report C095/19 | 33 of 41
8 Quality Assurance
Wageningen Marine Research utilises an ISO 9001:2015 certified quality management system. This certificate is valid until 15 December 2021. The organisation has been certified since 27 February 2001. The certification was issued by DNV GL.

34 of 41 | Wageningen Marine Research report C095/19
References
Ainslie MA, 2013. Neglect of bandwidth of Odontocetes echo location clicks biases propagation loss and single hydrophone population estimates. Journal of the Acoustical Society of America 134: 3506–3512.
Amundin M, 1991. Sound production in odontocetes with emphasis on the harbour porpoise. Stockholm University PhD thesis.
Au WWL, Kastelein RA, Rippe T & Schooneman NM, 1999. Transmission beam pattern and echolocation signals of a harbor porpoise (Phocoena phocoena). Journal of the Acoustical Society of America 106(6): 3699-3705.
Benjamins S, Dale A, Van Geel N & Wilson B, 2016. Riding the tide: Use of a moving tidal‐stream habitat by harbour porpoises. Marine Ecology Progress Series 549: 275– 288.
Berges BJP, Geelhoed SCV, Scheidat M & Tougaard J, 2019. Quantifying harbour porpoise foraging behaviour in CPOD data: identification, automatic detection and potential application. Wageningen, Wageningen Marine Research (University & Research centre), Wageningen Marine Research report C039/19.
Börjesson P, Berggren P, & Ganning B, 2003. Diet of harbour porpoises in the Kattegat and Skagerrak seas: accounting for individual variation and sample size. Marine Mammal Science 19: 38-58.
Boonstra M, Radstake Y, Rebel K, Aarts G & Camphuysen CJ, 2013. Harbour porpoises Phocoena phocoena in the Marsdiep area: new investigations in a historical study area. Lutra 56(1): 59–71.
Brandt M J, Hansen S, Diederichs A & Nehls G, 2014. Do man-made structures and water depth affect the diel rhythms in click recordings of harbor porpoises (Phocoena phocoena)? Marine Mammal Science 30: 1109–1121.
Brasseur SMJM, Van Polanen-Petel T, Geelhoed SCV, Aarts GM & Meesters HWG, 2010. Zeezoogdieren in de Eems; studie naar de effecten van bouw-activiteiten van GSP, RWE en NUON in de Eemshaven in 2009. Jaarrapportage/IMARES Rapport C086/10. Wageningen IMARES.
Brasseur S, Aarts G, Bravo Rebolledo E, Cremer J, Fey-Hofstede F, Geelhoed S, Lindeboom H, Lucke K, Machiels M, Meesters E, Scholl M, Teal L & Witte R, 2011. Zeezoogdieren in de Eems; studie naar de effecten van bouwactiviteiten van GSP, RWE en NUON in de Eemshaven in 2010. Rapport C102a/11. Wageningen IMARES.
Buckland ST, Anderson DR, Burnham KP, Laake JL, Borchers DL & Thomas L, 2001. Introduction to Distance Sampling, Vol. Oxford University Press, Oxford.
Camphuysen CJ, 2004. The return of the harbour porpoise (Phocoena phocoena) in Dutch coastal waters. Lutra 47(2): 113-122.
Camphuysen CJ, 2011. Recent trends and spatial patterns in nearshore sightings of harbour porpoises (Phocoena phocoena) in the Netherlands (Southern Bight, North Sea ), 1990-2010. Lutra 54(1): 39-47.
Carlén I, Thomas L, Carlström J, Amundin M, Teilmann J, Tregenza N, Tougaard J, Koblitz JC, Sveegaard S, Wennerberg D, Loisa O, Dähne M, Brundiers K, Kosecka M, Kyhn LA, Ljungqvist CT, Pawliczka I, Koza R, Arciszewski B, Galatius A, Jabbusch M, Laaksonlaita J, Niemi J, Lyytinen S, Gallus A, Benke H, Blankett P, Skóra KE & Acevedo-Gutiérrez A, 2018. Basin-scale distribution of harbour porpoises in the Baltic Sea provides basis for effective conservation actions. Biological Conservation 226: 42–53. https://doi.org/10.1016/j.biocon.2018.06.031
Carlström J, 2005. Diel variation in echolocation behavior of wild harbor porpoises. Marine Mammal Science 21: 1-12.
Clausen KT, Wahlberg M, Beedholm K, De Ruiter S & Madsen PT, 2011. Click communication in Harbour Porpoises Phocoena phocoena. Bioacoustics 20(1): 1–28.
Clausen KT, Tougaard J, Carstensen J, Delefosse M & Teilmann J, 2018. Noise affects porpoise click detections–the magnitude of the effect depends on logger type and detection filter settings. Bioacoustics: 1-16. https://doi.org/10.1080/09524622.2018.1477071
Dähne M, Gilles A, Lucke K, Peschko V, Adler S, Krügel K, Sundermeyer J & Siebert U, 2013a. Effects of pile-driving on harbour porpoises (Phocoena phocoena) at the first offshore wind farm in Germany. Environ. Res. Lett. 8: 025002.

Wageningen Marine Research report C095/19 | 35 of 41
Dähne M, Verfuß UK, Brandeckerd A, Siebert U & Benke H, 2013b. Methodology and results of calibration of tonal click detectors for small odontocetes (C-PODs). Journal of the Acoustical Society of America 134(3):2514-2522.
DeRuiter SL, Bahr A, Blanchet M‐A, et al., 2009. Acoustic behaviour of echolocating porpoises during prey capture. Journal of Experimental Biology 212: 3100–3107.
DeRuiter SL, Hansen M, Koopman HN, Westgate AJ, Tyack PL & Madsen PT, 2010. Propagation of narrow‐band‐high‐frequency clicks: Measured and modeled transmission loss of porpoise‐like clicks in porpoise habitats. Journal of the Acoustical Society of America 127: 560-567.
DeRuiter SL, Bahr A, Blanchet M-A, et al., 2009. Acoustic behaviour of echolocating porpoises during prey capture. Journal of Experimental Biology 212:3100–3107.
Evans PGH, Anderwald P & Baines M, 2003. UK cetacean status review. Sea Watch Foundation, Oxford, UK.
Gallus A, Dähne M, Verfuß UK, Bräger S, Adler S, Siebert U & Benke H, 2012. Use of passive acoustic monitoring to assess the status of the ‘Critically Endangered’ Baltic harbour porpoise in German Waters. Endangered Species Research 18: 265−278.
Geelhoed SCV, Friedrich E, Joost M, Juhre H, Kirkwood R, van Leeuwen PW, Machiels M, Stöber N & Verdaat H, 2015. Gemini T-0: passive acoustic monitoring and aerial surveys of harbour porpoises. P. 110. IMARES Wageningen UR - Institute for Marine Resources & Ecosystem Studies, Report No. C144/15.
Geelhoed SCV & Scheidat M, 2013. Monitoring harbour porpoise abundance and distribution in Dutch waters. IMARES report number C162/13
Geelhoed SCV, Scheidat M, van Bemmelen RSA & Aarts G, 2013. Abundance of harbour porpoises (Phocoena phocoena) on the Dutch Continental Shelf, aerial surveys in July 2010-March 2011. Lutra 56(1): 45-57.
Geelhoed SCV, Janinhoff N, Lagerveld S & Verdaat JP, 2018a. Marine mammal surveys in Dutch North Sea waters in 2018. Wageningen Marine Research report C098/18
Geelhoed SCV, Friedrich E, Joost M, Machiels MAM & Stöber N, 2018b. Gemini T-c: aerial surveys and passive acoustic monitoring of harbour porpoises 2015. Wageningen Marine Research report C020/17.
Geelhoed SCV & Scheidat M, 2018. Abundance of harbour porpoises (Phocoena phocoena) on the Dutch Continental Shelf, aerial surveys 2012-2017. Lutra 61(1): 127-136.
Gilles A, Scheidat M & Siebert U, 2009. Seasonal distribution of harbour porpoises and possible interference of offshore wind farms in the German North Sea. Marine Ecology Progress Series 383: 295-307.
Gilles A, Adler S, Kaschner K, Scheidat M & Siebert U, 2011. Modelling harbour porpoise seasonal density as a function of the German Bight environment: Implications for management. Endangered Species Research 14: 157-169.
Gilles A, Viquerat S, Becker EA, Forney KA, Geelhoed SCV, Haelters J, Nabe-Nielsen J, Scheidat M, Siebert U, Sveegaard S, van Beest FM, van Bemmelen R & Aarts G, 2016. Seasonal habitat-based density models for a marine top predator, the harbor porpoise, in a dynamic environment. Ecosphere 7(6): e01367. 10.1002/ecs2.1367.
Freitag LE & Tyack PL, 1993. Passive localization of the Atlantic bottlenose dolphin using whistles and echolocation clicks. Journal of the Acoustical Society of America 93: 2197-2205.
Hammond PS, Berggren P, Benke H, Borchers DL, Collet A, Heide Jorgensen MP, Heimlich S, Hiby AR, Leopold MF & Oien N, 2002. Abundance of harbour porpoise and other cetaceans in the North Sea and adjacent waters. Journal of Applied Ecology 39(2): 361-376.
Hammond P, Macleod K, Berggren P, Borchers D, Burt M, Cañadas A, Desportes G, Donovan G, Gilles A, Gillespie D, Gordon J, Hiby L, Kuklik I, Leaper R, Lehnert K, Leopold M, Lovell P, Øien N, Paxton C, Ridoux V, Rogan E, Samarra F, Scheidat M, Sequeira M, Siebert U, Skov H, Swift R, Tasker M, Teilmann J, Van Canneyt O & Vázquez J, 2013. Cetacean abundance and distribution in European Atlantic shelf waters to inform conservation and management. Biological Conservation 164: 107–122.
Hammond PS, Lacey C, Gilles A, Viquerat S, Börjesson P, Herr H, Macleod K, Ridoux V, Santos MB, Scheidat M, Teilmann J, Vingada J & Øien N, 2017. Estimates of cetacean abundance in European Atlantic waters in summer 2016 from the SCANS-III aerial and shipboard surveys. Report to ICES Working Group on Marine Mammal Ecology. 26pp.

36 of 41 | Wageningen Marine Research report C095/19
Hastie GD, Wilson B & Thompson PM, 2006. Diving deep in a foraging hotspot: acoustic insights into bottlenose dolphin dive depths and feeding behaviour. Marine Biology 148: 1181–1188.
Holdman AK, Haxel JH, Klinck H & Torres LG, 2019. Acoustic monitoring reveals the times and tides of harbor porpoise (Phocoena phocoena) distribution off central Oregon, U.S.A. Marine Mammal Science 35(1): 164–186.
IJsseldijk LL, Camphuysen CJ, Nauw JJ & Aarts G, 2015. Going with the flow: tidal influence on the occurrence of the harbour porpoise (Phocoena phocoena) in the Marsdiep area. Netherlands Journal of Sea Research 103: 129−137.
Jacobson EK, Forney KA & Barlow J, 2017. Using paired visual and passive acoustic surveys to estimate passive acoustic detection parameters for harbor porpoise abundance estimates. Journal of the Acoustical Society of America 141(1): 219-230.
Janik VM, 2000. Food-related bray calls in wild bottlenose dolphins (Tursiops truncatus). Proc R Soc Lond Ser B 267: 923–927.
Jansen OE, Michel L, Lepoint G, Das K, Couperus AS & Reijnders PJH, 2012. Diet of harbour porpoises along the Dutch coast: A combined stable isotope and stomach contents approach. Marine Mammal Science, 29:E295-E311
Jaramillo-Legorreta A, Cardenas-Hinojosa G, Nieto-Garcia E, Rojas-Bracho L, Hoef J Ver, Moore J, et al., 2016. Passive acoustic monitoring of the decline of Mexico’s critically endangered vaquita. Conservation Biology 31: 183–191.
Johnston D, Westgate AJ & Read A, 2005. Effects of fine‐scale oceanographic features on the distribution and movements of harbour porpoises Phocoena phocoena in the Bay of Fundy. Marine Ecology Progress Series 295: 279–293.
Kastelein RA, 1998. Food consumption and growth of marine mammals pages. PhD Thesis. Wageningen University.
Koblitz JC, Wahlberg M, Stilz P, Madsen PT, Beedholm K & Schnitzler H-U, 2012. Asymmetry and dynamics of a narrow sonar beam in an echolocating harbor porpoise. Journal of the Acoustical Society of America 131(3): 2315–2324.
Koschinski S, Diederichs A & Amundin A, 2008. Click train patterns of free-ranging harbour porpoises acquired using T-PODs may be useful as indicators of their behaviour. J. Cetacean Res. Manage. 10(2): 147–155.
Kyhn LA, Tougaard J, Thomas L, Duve LR, Stenback J, Amundin M, Desportes G & Teilmann J, 2012. From echolocation clicks to animal density—Acoustic sampling of harbor porpoises with static dataloggers. Journal of the Acoustical Society of America 131: 550–560.
Linnenschmidt M, Teilmann J, Akamatsu T, Dietz R & Miller LA, 2013. Biosonar, dive, and foraging activity of satellite tracked harbor porpoises (Phocoena phocoena). Marine Mammal Science 29(2): E77–E97
Lucke K (editor), 2014. Noise logger overview (One size does not fit all). IMARES Internal Report. Macaulay J, Gordon J, Gillespie D, Malinka C & Northridge S, 2017. Passive acoustic methods for fine-scale tracking of harbour porpoises in tidal rapids. Journal of the Acoustical Society of America 141: 1120−1132.
Malinka C, Gillespie D, Macaulay J, Joy R & Sparling C, 2018. First in situ Passive Acoustic Monitoring for Marine Mammals during Operation of a Tidal Turbine in Ramsey Sound, Wales. Marine Ecology Progress Series 590: 247-266.
Marques TA, Thomas L, Martin SW, Mellinger DK, Ward JA, Moretti DJ, Harris D & Tyack PL, 2013. Estimating animal population density using passive acoustics. Biological Reviews 88: 287-309.
Mellinger DK, Stafford KM, Moore S, Dziak RP & Matsumoto H, 2007. Fixed passive acoustic observation methods for cetaceans. Oceanography 20: 36–45.
Mikkelsen L, Mouritsen KN, Dahl K, Teilmann J & Tougaard J, 2013. Re-established stony reef attracts harbour porpoises Phocoena phocoena. Mar Ecol Prog Ser 481: 239−248.
Miller LA, 2010. Prey Capture by Harbor Porpoises (Phocoena phocoena): A Comparison Between Echolocators in the Field and in Captivity. The Journal of the Acoustical Society of Japan 37(3): 156–168.
Mohl B, Wahlberg M, Madsen PT, Heerfordt A & Lund A, 2003. The monopulsed nature of sperm whale clicks. Journal of the Acoustical Society of America 114: 1143–1154.
Nabe-Nielsen J, van Beest FM, Grimm V, Sibly RM, Teilmann J & Thompson PM, 2018. Predicting the impact of anthropogenic disturbances on marine populations. Conservation Letters: 11(5).

Wageningen Marine Research report C095/19 | 37 of 41
Nurminem A, 2010. Foraging and habitat use of harbour porpoise (Phocoena phocoena) in Cardigan Bay SAC: Effects of season, location and bottlenose dolphin (Tursiops truncatus) presence. University of Bangor MSc Thesis.
Nuuttila HK, Bertelli CM, Mendzil A & Dearle N, 2018a. Seasonal and diel patterns in cetacean use and foraging at a potential marine renewable energy site. Marine Pollution Bulletin 129(2): 633-644. DOI: 10.1016/j.marpolbul.2017.10.051
Nuuttila HK, Brundiers K, Dähne M, Koblitz JC, Thomas L, Courtene-Jones W, Evans PGH, Turner JR, Bennell JD & Hiddink JG, 2018b. Estimating effective detection area of static passive acoustic data loggers from playback experiments with cetacean vocalisations. Methods Ecol Evol. 9: 2362– 2371.
Otani S, Naito Y, Kato A & Kawamura A, 2000. Diving behavior and swimming speed of a free-ranging harbor porpoise, Phocoena phocoena. Marine Mammal Science 16: 811-814.
Pierpoint C, 2008. Harbour porpoise (Phocoena phocoena) foraging strategy at a high energy, near-shore site in south-west Wales, UK. J. Mar. Biol. Assoc. U.K. 88(6): 1167–1173.
Pirotta E, Thompson PM, Miller PI, Brookes KL, Cheney B, Barton TR, Graham IM & Lusseau D, 2014a. Scale-dependent foraging ecology of a marine top predator modelled using passive acoustic data. Functional Ecology 28(1): 206–217.
Pirotta E, Brookes KL, Graham IM & Thompson PM, 2014b. Variation in harbour porpoise activity in response to seismic survey noise. Biology Letters 10(5): 20131090.
Pirotta E, Booth CG, Costa DP, Fleishman E, Kraus SD, Lusseau D, Moretti D, New LF, Schick, RS, Schwarz LK, Simmons SE, Thomas L, Tyack PL, Weise MJ, Wells RS & Harwood J, 2018. Understanding the population consequences of disturbance. Ecology and Evolution 8(19): 9934–9946.
Santos MBA & Pierce GJ, 2003. The diet of harbour porpoise (Phocoena phocoena) in the Northeast Atlantic. Oceanogr. Mar. Biol. Ann. Rev. 41: 355-390.
Santos MB, Pierce GJ, Learmonth JA, Reid RJ, Ross HM, Patterson IAP, Reid DG & Beare D, 2004. Variability in the diet of harbor porpoises (Phocoena phocoena) in Scottish waters 1992–2003. Marine Mammal Science 20:1–27.
Schaffeld T, Bräger S, Gallus A, Dähne M et al., 2016 Diel and seasonal patterns in acoustic presence and foraging behaviour of free-ranging harbour porpoises. Mar Ecol Prog Ser 547: 257−272
Scheidat M, Tougaard J, Brasseur S, Carstensen J, van Polanen Petel T, Teilmann J & Reijnders P, 2011. Harbour porpoises (Phocoena phocoena) and wind farms: a case study in the Dutch North Sea. Environ Res Lett 6: 1-10.
Scheidat M, Verdaat H & Aarts G, 2012. Using aerial surveys to estimate density and distribution of harbour porpoises in Dutch waters. Netherlands Journal of Sea Research 69: 1-7.
Sousa‐Lima RS, Norris TF, Oswald JN & Fernandes DP, 2013. A review and inventory of fixed autonomous recorders for passive acoustic monitoring of marine mammals. Aquatic Mammals 39: 23–53.
Sørensen PM, Wisniewska DM, Jensen FH, Johnson M, Teilmann J & Madsen P, 2018. Click communication in wild harbour porpoises (Phocoena phocoena). Scientific Reports Volume 8: Article number: 9702.
Teilmann J, Larsen F & Desportes G, 2007. Time allocation and diving behaviour of harbour porpoises (Phocoena phocoena) in Danish and adjacent waters. Journal of Cetacean Research and Management 9: 201-210.
Teilmann J, Sveegaard S, Dietz R, Krag Petersen I, Berggren P & Desportes G, 2008. High density areas for harbour porpoises in Danish waters. NERI Technical Report No. 657. National Environmental Research Institute, University of Aarhus.
Teilmann J, Christiansen CT, Kjellerup S, Dietz R & Nachman G, 2013. Geographic, seasonal, and diurnal surface behavior of harbor porpoises. Marine Mammal Science 29(2): E60–E76.
Tiemann CO, Thode AM, Straley J, O'Connell V & Folkert K, 2006. Three-dimensional localization of sperm whales using a single hydrophone. Journal of the Acoustical Society of America 120: 2355.
Thode A, 2005. Three-dimensional passive acoustic tracking of sperm whales (Physeter macrocephalus) in ray-refracting environments. Journal of the Acoustical Society of America 118: 3575.
Thomas L & Marques TA, 2012. Passive acoustic monitoring for estimating animal density. Acoustics Today 8: 35–44.

38 of 41 | Wageningen Marine Research report C095/19
Todd VL, Pearse WD, Tregenza NC, Lepper PA & Todd IB, 2009. Diel echolocation activity of harbour porpoises (Phocoena phocoena) around North Sea offshore gas installations. ICES Journal of Marine Science 66:734–745.
Tougaard J, Poulsen LR, Amundin M, Larsen F, Rye J & Teilmann J, 2006. Detection function of T-PODs and estimation of porpoise densities. In Static Acoustic Monitoring of Cetaceans. European Cetacean Society, Gdnyia, Poland. European Cetacean Society, Gdynia 7–14.
Turner J, Wood J, Porter L & Lee A, 2019. The coastal acoustic buoy: a new mitigation tool. In Proceedings of Western Pacific Commission for Acoustics (WESPAC) 2018, New Delhi, India, 11–15 November 2018. Retrieved 10 December 2018 from http://www.wespac2018.org.in/index.
Urick RJ, 1983. Principles of Underwater Sound, 3rd ed. McGraw-Hill, New York. van Polanen Petel T, Geelhoed S & Meesters E, 2012. Harbour porpoise occurrence in relation to the
Prinses Amaliawindpark. IMARES Report number C177/10, IMARES Wageningen UR. Verboom WC & Kastelein RA, 1995. Acoustic signals by harbour porpoises (Phocoena phocoena) 1-39
pp. In: Nachtigall PE, Lien J, Au WWL and Read AJ (eds), Harbour porpoises – Laboratory Studies to Reduce Bycatch. De Spil Publishers, Woerden, the Netherlands.
Verfuß UK, Miller LA & Schnitzler H-U, 2005. Spatial orientation in echolocating harbour porpoises (Phocoena phocoena). Journal of Experimental Biology 208: 3385-3394.
Verfuß UK, Miller LA, Pilz PKD and Schnitzler H-U, 2009. Echolocation by two foraging harbour porpoises (Phocoena phocoena). Journal of Experimental Biology 212: 823–834.
Villadsgaard A, Wahlberg M & Tougaard J, 2007. Echolocation signals of wild harbour porpoises, Phocoena phocoena. Journal of Experimental Biology 210: 56-64.
Von Benda-Beckmann AM, Lam FPA, Moretti DJ, Fulkerson K, Ainslie MA, van IJsselmuide SP, Theriault J & Beerens SP, 2010. Detection of Blainville’s beaked whales with towed arrays. Applied Acoustics 71: 1027–1035.
von Benda-Beckmann AM., Beerens SP & van IJsselmuide SP, 2013. Effect of towed array stability on instantaneous localization of marine mammals. Journal of the Acoustical Society of America 134: 2409
von Benda-Beckmann AM, Thomas L, Tyack PL & Ainslie MA, 2018. Modelling the broadband propagation of marine mammal echolocation clicks for click-based population density estimates. Journal of the Acoustical Society of America 143(2): 954-967.
Waggitt JJ, Dunn HK, Evans PGH, Hiddink JG, Holmes LJ, Keen E, Murcott BD, Piano M, Robins PE, Scott BE, Whitmore J & Veneruso G, 2018. Regional-scale patterns in harbour porpoise occupancy of tidal stream environments, ICES Journal of Marine Science 75(2): 701–710.
Wahlberg M, Møhl B, & Teglberg Madsen P, 2001. Estimating source position accuracy of a large-aperture hydrophone array for bioacoustics. Journal of the Acoustical Society of America 109: 397.
Watkins WA & Schevill WE, 1974. Listening to Hawaiian spinner porpoises, Stenella longirostris, with a three-dimensional hydrophone array. Journal of Mammalogy 5 5:3 19-328.
Warner GA, Dosso SE & Hannay DE, 2017. Bowhead whale localization using time-difference-of-arrival data from asynchronous recorders. Journal of the Acoustical Society of America 141(3): 1921-1935.
Westgate AJ, Head AJ, Berggren P, Koopman HN & Gaskin DE, 1995. Diving behaviour of harbour porpoises, Phocoena phocoena. Canadian Journal of Fisheries and Aquatic Sciences 52(5): 1064-1073.
Williamson LD, Brookes KL, Scott BE, Graham IM & Thompson PM, 2017. Diurnal variation in harbour porpoise detection—potential implications for management. MEPS 570: 223–232.
Wilson LJ, Booth CG, Burt L, Verfuß UK & Thomas L, 2019. Design of a monitoring plan for the Southern North Sea candidate Special Area of Conservation and wider area. JNCC Report No. 629, JNCC, Peterborough, ISSN 0963-8091.
Wilson B, Benjamins S & Elliott J, 2013. Using drifting passive echolocation loggers to study harbour porpoises in tidal-stream habitats. Endangered Species Research 22(2): 125-143
Wisniewska DM, Johnson M, Teilmann J, Rojano-Doñate L, Shearer J, Sveegaard S, Miller LA, Siebert U & Madsen PT, 2016. Ultra-high foraging rates of harbor porpoises make them vulnerable to anthropogenic disturbance. Current Biology 26(11): 1441-1446.
Wisniewska DM, Johnson M, Teilmann J, Siebert U, Galatius A, Dietz R, et al. 2018. High rates of vessel noise disrupt foraging in wild harbour porpoises (Phocoena phocoena). Proc R Soc B, 285(1872):20172314 pmid:29445018
Wageningen Marine Research report C095/19 | 39 of 41
Wright AJ, Akamatsu T, Mouritsen KN, Sveegaard S, Dietz R & Teilmann J, 2017. Silent porpoise: potential sleeping behaviour identified in wild harbour porpoise. Animal Behaviour 133: 211-222.
Zein B, Woelfing B, Dähne M, Schaffeld T, Ludwig S, Hansen Rye J, Baltzer J, Ruser A & Siebert U, 2019. Time and tide: Seasonal, diel and tidal rhythms in Wadden Sea Harbour porpoises (Phocoena phocoena). PLoS ONE 14(3):e0213348

40 of 41 | Wageningen Marine Research report C095/19
Justification
Report C095/19 Project Number: 4312100103 The scientific quality of this report has been peer reviewed by a colleague scientist and a member of the Management Team of Wageningen Marine Research Approved: Sander Lagerveld Researcher Signature: Date: 6-11-2019 Approved: Jakob Asjes Manager integration Signature: Date: 6-11-2019

Wageningen Marine Research report C095/19 | 41 of 41
Wageningen Marine Research
T +31 (0)317 48 09 00
www.wur.eu/marine-research
Visitors’ address
• Ankerpark 27 1781 AG Den Helder
• Korringaweg 7, 4401 NT Yerseke
• Haringkade 1, 1976 CP IJmuiden
With knowledge, independent scientific research and advice, Wageningen
Marine Research substantially contributes to more sustainable and more
careful management, use and protection of natural riches in marine, coastal
and freshwater areas.
Wageningen Marine Research is part of Wageningen University & Research.
Wageningen University & Research is the collaboration between Wageningen
University and the Wageningen Research Foundation and its mission is: 'To
explore the potential for improving the quality of life'


![Lamello: Passive Acoustic Sensing for Tangible Input ...bjoern/papers/savage-lamello-chi2… · Lamello: Passive Acoustic Sensing for Tangible Input Components ... (Skinput [6]),](https://img.pdfslide.net/doc/110x75/5f0705d37e708231d41ae935/lamello-passive-acoustic-sensing-for-tangible-input-bjoernpaperssavage-lamello-chi2.jpg)