Embed Size (px)
Citation preview

BIOPHARMACEUTICS & DRUG DISPOSITIONBiopharm. Drug Dispos. 28: 1–11 (2007)
Published online in Wiley InterScience
(www.interscience.wiley.com) DOI: 10.1002/bdd.525
Feasibility of d-Glucuronate to Enhance c-HydroxybutyricAcid Metabolism During c-Hydroxybutyric Acid Toxicity:Pharmacokinetic and Pharmacodynamic Studies
Indranil Bhattacharyay and Kathleen M. K. Boje*Department of Pharmaceutical Sciences, School of Pharmacy and Pharmaceutical Sciences, University at Buffalo, Buffalo, NY 14260, USA
ABSTRACT: g-Hydroxybutyric acid (GHB) is a drug of abuse. Literature studies showed thatd-glucuronate acts as an oxidative stimulator of GHB metabolism following in vivo GHB tracerdoses. The present proof-of-concept study investigates if d-glucuronate enhances GHB metabolismand inhibits blood–brain barrier (BBB) carrier-mediated transport of GHB for clinically relevant andtoxicological concentrations of GHB. In a randomized cross-over study with a 3 day washoutperiod, rats were intravenously administered GHB (200, 400 or 800 mg/kg) with either saline ord-glucuronate (830 mg/kg i.v. bolus followed by a constant infusion of 1.39 g/kg-h). Systemic andrenal GHB pharmacokinetics, as well as onset, offset and duration of GHB sedative/hypnoticeffects were measured following each GHB dose. In situ brain perfusion was used to determine ifd-glucuronate inhibited GHB BBB transport. d-Glucuronate did not alter GHB sedative/hypnoticeffects at all three GHB doses. A model independent approach revealed that GHB systemic (AUC,CLTotal, CLMetabolism, VSS, T1/2) and renal (CLRenal, fe) pharmacokinetic parameters were unaltered byd-glucuronate administration. GHB influx clearance was unaltered by d-glucuronate suggesting alack of transport inhibition. These observations suggest that although previously shown to bepromising at GHB tracer doses, d-glucuronate lacks therapeutic benefit in the treatment of GHBtoxicity. Copyright # 2006 John Wiley & Sons, Ltd.
Key words: sodium oxybate; nonlinear pharmacokinetics; toxicokinetics; d-glucuronate
Introduction
g-Hydroxybutyric acid (GHB) is an endogenousfatty acid derived through mammalian metabo-lism and is present both in the central nervoussystem (CNS) and peripheral tissues (heart,skeletal muscles, kidney and brown fat) [1–3].GHB is proposed to act as a neurotransmitter/
neuromodulator, but its peripheral physiologicaleffects remain unclear [4].
GHB acts through the CNS to produce sys-temic pharmacological and toxicological effects,namely dose dependent sedation/anesthesia,hyper- and hypothermia and respiratory depres-sion [5,6], which can progress to unconscious-ness, coma and death [7]. GHB has gainednotoriety due to abuse for its euphoric, sedative,anxiolytic, body building and purported aphro-disiac effects [8,9]. Moreover, the purity ofGHB (or its precursors) available through illicitsources is highly variable [10], which cancontribute to increased incidents of overdose,toxicity and fatalities. Treatment strategies for
*Correspondence to: Department of Pharmaceutical Sciences,H517 Cooke-Hochstetter, University at Buffalo, Buffalo, NY14260, USA. E-mail: [email protected] address: GlaxoSmithKline, Department of Metabo-lism and Pharmacokinetics, 709 Swedeland Rd, King ofPrussia, PA 19406, USA.
Received 6 May 2006Revised 9 August 2006
Accepted 10 August 2006Copyright # 2006 John Wiley & Sons, Ltd.
GHB intoxication are at best, supportive, andcomplicated by nonlinear pharmacokinetics [11].
GHB’s nonlinear pharmacokinetics arise frommetabolism by saturable biochemical pathwaysinvolving the reversible breakdown of GHB tosuccinic semialdehyde via a (i) cytosolic NADPþ
dependent oxidoreductase (E.C.1.1.1.19, GHB-dehydrogenase) and (ii) mitochondrial a-ketoglu-tarate dependent transhydrogenase [12]. In thepresence of NADPþ, GHB is metabolized tosuccinic semialdehyde (SSA) and NADPH(Figure 1). Through the action of semialdehydedehydrogenase, succinic semialdehyde is con-verted to succinic acid which enters the Krebscycle to produce carbon dioxide and water [13–15]. Mitochondrial transhydrogenase oxidationof GHB to succinic semialdehyde does notrequire a pyridine nucleotide cofactor, but isdependent on the presence of citric acid cycle
intermediates, namely a-ketoglutarate (Figure 1)[12]. GHB is not metabolized appreciably bycytochrome 450 s [16].
Kaufman and Nelson demonstrated in vitrothat GHB oxidation to succinic semialdehydeoccurs at a 10-fold faster rate when coupledto the reduction of d-glucuronate (Figure 1).d-Glucuronate increases the rate of GHB oxida-tion by converting NADPH, which inhibits GHBoxidation, to NADPþ, a required cofactor forGHB oxidation, while itself being reduced tol-gulonate. In vivo GHB tracer dose studies (4 mCi[14C]GHB, 347 mg/kg GHB i.v.) revealed thatconcomitant infusion of d-glucuronate enhancedGHB metabolism as demonstrated by a 33%decrease in GHB’s elimination half-life. Corre-sponding infusion of l-gulonate, a competitor ofGHB-dehydrogenase and a reduction productof d-glucuronate, increased GHB’s elimination
L-Gulonic acid
3
SuccinicSemialdehyde
D-Glucuronic acid
2
1
PentosePhosphatePathway
NADPH NADP+
D-GlucoseL-Ascorbic acid
-Hydroxybutyric acid
SuccinicSemialdehyde
7
GABAD-2-Hydroxyglutaric acid
4,5-Dihydroxyhexanoate
4
SuccinicAcid
-Ketoglutarate
CO2 + H2O
Kreb’sCycle
5
8
Mitochondria
Glutamate
6
NADPHNADP +
γ
α
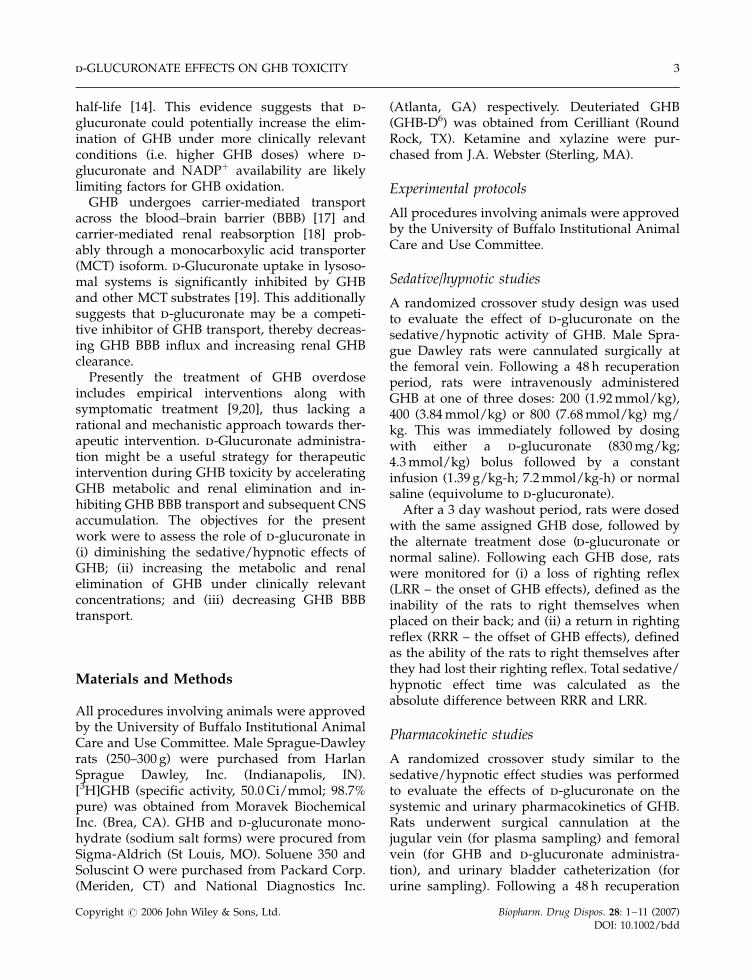
Figure 1. Biochemical pathway of GHB metabolism. Exogenously administered or endogenous GHB is metabolized to succinicsemialdehyde by cytosolic GHB-dehydrogenase or mitochondrial GHB-transhydrogenase. The succinic semialdehyde thusformed can either form carbon dioxide and water by converting to succinic acid and entering the Kreb’s cycle, can convert back toGHB by succinic semialdehyde-reductase, or form GABA by GABA-transaminase. Enzymes: 1, GHB dehydrogenase; 2, succinicsemialdehyde reductase; 3, d-glucuronate reductase; 4, GHB transhydrogenase; 5, succinic semialdehyde dehydrogenase; 6,glutamate dehydrogenase; 7, glutamate decarboxylase; 8, GABA transaminase
I. BHATTACHARYA AND K.M.K. BOJE2
Copyright # 2006 John Wiley & Sons, Ltd. Biopharm. Drug Dispos. 28: 1–11 (2007)DOI: 10.1002/bdd
half-life [14]. This evidence suggests that d-glucuronate could potentially increase the elim-ination of GHB under more clinically relevantconditions (i.e. higher GHB doses) where d-glucuronate and NADPþ availability are likelylimiting factors for GHB oxidation.
GHB undergoes carrier-mediated transportacross the blood–brain barrier (BBB) [17] andcarrier-mediated renal reabsorption [18] prob-ably through a monocarboxylic acid transporter(MCT) isoform. d-Glucuronate uptake in lysoso-mal systems is significantly inhibited by GHBand other MCT substrates [19]. This additionallysuggests that d-glucuronate may be a competi-tive inhibitor of GHB transport, thereby decreas-ing GHB BBB influx and increasing renal GHBclearance.
Presently the treatment of GHB overdoseincludes empirical interventions along withsymptomatic treatment [9,20], thus lacking arational and mechanistic approach towards ther-apeutic intervention. d-Glucuronate administra-tion might be a useful strategy for therapeuticintervention during GHB toxicity by acceleratingGHB metabolic and renal elimination and in-hibiting GHB BBB transport and subsequent CNSaccumulation. The objectives for the presentwork were to assess the role of d-glucuronate in(i) diminishing the sedative/hypnotic effects ofGHB; (ii) increasing the metabolic and renalelimination of GHB under clinically relevantconcentrations; and (iii) decreasing GHB BBBtransport.
Materials and Methods
All procedures involving animals were approvedby the University of Buffalo Institutional AnimalCare and Use Committee. Male Sprague-Dawleyrats (250–300 g) were purchased from HarlanSprague Dawley, Inc. (Indianapolis, IN).[3H]GHB (specific activity, 50.0 Ci/mmol; 98.7%pure) was obtained from Moravek BiochemicalInc. (Brea, CA). GHB and d-glucuronate mono-hydrate (sodium salt forms) were procured fromSigma-Aldrich (St Louis, MO). Soluene 350 andSoluscint O were purchased from Packard Corp.(Meriden, CT) and National Diagnostics Inc.
(Atlanta, GA) respectively. Deuteriated GHB(GHB-D6) was obtained from Cerilliant (RoundRock, TX). Ketamine and xylazine were pur-chased from J.A. Webster (Sterling, MA).
Experimental protocols
All procedures involving animals were approvedby the University of Buffalo Institutional AnimalCare and Use Committee.
Sedative/hypnotic studies
A randomized crossover study design was usedto evaluate the effect of d-glucuronate on thesedative/hypnotic activity of GHB. Male Spra-gue Dawley rats were cannulated surgically atthe femoral vein. Following a 48 h recuperationperiod, rats were intravenously administeredGHB at one of three doses: 200 (1.92 mmol/kg),400 (3.84 mmol/kg) or 800 (7.68 mmol/kg) mg/kg. This was immediately followed by dosingwith either a d-glucuronate (830 mg/kg;4.3 mmol/kg) bolus followed by a constantinfusion (1.39 g/kg-h; 7.2 mmol/kg-h) or normalsaline (equivolume to d-glucuronate).
After a 3 day washout period, rats were dosedwith the same assigned GHB dose, followed bythe alternate treatment dose (d-glucuronate ornormal saline). Following each GHB dose, ratswere monitored for (i) a loss of righting reflex(LRR – the onset of GHB effects), defined as theinability of the rats to right themselves whenplaced on their back; and (ii) a return in rightingreflex (RRR – the offset of GHB effects), definedas the ability of the rats to right themselves afterthey had lost their righting reflex. Total sedative/hypnotic effect time was calculated as theabsolute difference between RRR and LRR.
Pharmacokinetic studies
A randomized crossover study similar to thesedative/hypnotic effect studies was performedto evaluate the effects of d-glucuronate on thesystemic and urinary pharmacokinetics of GHB.Rats underwent surgical cannulation at thejugular vein (for plasma sampling) and femoralvein (for GHB and d-glucuronate administra-tion), and urinary bladder catheterization (forurine sampling). Following a 48 h recuperation
d-GLUCURONATE EFFECTS ON GHB TOXICITY 3
Copyright # 2006 John Wiley & Sons, Ltd. Biopharm. Drug Dispos. 28: 1–11 (2007)DOI: 10.1002/bdd
period, rats were either intravenously adminis-tered GHB (200 or 400 mg/kg) with d-glucur-onate (830 mg/kg bolus followed by 1.39 g/kg-h)or equivolume normal saline. After a 3 daywashout period, rats received GHB and thealternate treatment dose (d-glucuronate or nor-mal saline).
GHB systemic and urinary pharmacokineticswere monitored. For the 200 mg/kg (1.92 mmol/kg) GHB dose, blood samples (200 ml) werecollected at predose (for hematocrit analysis),15, 30, 60, 90, 120, 150, 180, 210 and 240 min,while the 400 mg/kg (3.84 mmol/kg) dose uti-lized the same collection times through 180 min,with two additional times at 240 and 300 min.Hematocrits were measured on days 1 and 5 andwere not significantly different. The indwellingbladder catheter was flushed with 1–2 ml ofisotonic saline every hour for 4 or 5 h and theurine was collected. Blood samples were centri-fuged at 2000� g for 20 min at 4 8C (CentraMP4R, International Equipment Company), andthe harvested plasma was stored at –20 8C forLC/MS/MS analysis. The volume of urineobtained at each collection interval was mea-sured and the samples stored at �20 8C.
CNS permeability studies using in situ brainperfusion
Naı̈ve male Sprague Dawley rats underwent insitu brain perfusion with [3H]GHB (0.02 mm;1.0 mCi/ml) either in the presence or absence ofunlabeled d-glucuronate (20 mm, pH adjusted to7.4) to quantify GHB transport across the BBB[17]. Briefly, rats were anesthetized using intra-muscularly administered ketamine (90 mg/kg)and xylazine (9 mg/kg) and surgically preparedfor perfusion of the left cerebral hemisphere viathe left common carotid artery. In situ brainperfusion was performed for 30 s at 10 ml/min(Harvard perfusion pump model 55-4150, Har-vard Apparatus, Holliston, MA). Followingdecapitation, left cerebral hemispheres weredissected into the following brain regions: thecortices (frontal, parietal and occipital), hippo-campus and striatum. Dissected tissue sampleswere weighed and solubilized overnight with0.8 ml Soluene 350 at 50 8C. Five ml of Soluscint Owas added and the samples were analysed by
liquid scintillation counting using a 1900CALiquid Scintillation Analyzer (Packard Instru-ment Co., Downers Grove, IL; counting efficiencyfor [3H] was 0.61). An aliquot of the perfusionfluid was similarly assayed by liquid scintillationcounting to verify the perfusate analyte concen-tration.
GHB analysis by LC/MS/MS
GHB plasma and urine concentrations wereanalysed using a published HPLC/MS/MSmethod [18,23], with modifications. In brief,90 ml of plasma/urine was mixed with 5 ml ofGHB-D6 (10 mm) and 5 ml of water. Acetonitrile(400 ml) was added to precipitate proteins. Sam-ples were vortexed and centrifuged (10000� g for20 min at 4 8C). The protein free supernatant wassubjected to solid phase extraction [18,23] andwas reconstituted in 95% formic acid (0.1%) and5% acetonitrile.
HPLC was accomplished using an Xterra MSC18, 5 m Aqua column (250� 2.1 mm, Waters,Millford, MA). The mobile phase consisted of95% formic acid (0.1%) and 5% acetonitrile at aflow rate of 200 ml/min through the column. Thetotal run time was 11 min with a retention time of�4.8 min for GHB. A Perkin Elmer 200 auto-sampler (Perkin Elmer, Wellesley, MA) was usedto inject 10 ml sample volumes. The mass analyserconsisted of a Perkin Elmer Sciex API 3000 triplequadrupole mass spectrometer with a turbo ionspray ionization source (source temperature of400 8C). The mass spectrometer was operated in amultiple reaction/positive ion mode. Mass/charge ratio of GHB precursor and product ionwas monitored at 105 and 87, respectively, andfor GHB-D6 (internal standard) at 111 and 93,respectively. Peak area ratios of analyte andinternal standard were determined using theAnalyst 1.3.1 software (Applied Biosystems,Foster City, CA). GHB calibration curves utilizingpeak area ratios of GHB to the internal standard(GHB-D6) were used to calculate the plasma andurine concentrations.
Data analysis
Pharmacokinetic parameters were determinedusing both model dependent and model inde-pendent (noncompartmental) approaches with
I. BHATTACHARYA AND K.M.K. BOJE4
Copyright # 2006 John Wiley & Sons, Ltd. Biopharm. Drug Dispos. 28: 1–11 (2007)DOI: 10.1002/bdd
WinNonlin Pro Version 4.1 (Pharsight Corp, Cary,NC). For the model dependent approach, thedata from all animals in a group were pooled toobtain single estimates of pharmacokinetic para-meters. Equation (1) best described GHB phar-macokinetics, based on visual inspections, squareresidual plots, weighted sum of residuals, andAkaike and Schwartz criteria
V � dC
dt¼ KSyn �
VMax � C
Km þ Cð1Þ
where C is the plasma concentration of GHB, Vrepresents the volume of distribution (ml/kg),KSyn is the zero order production of endogenousGHB (mg/h-kg), Vmax represents maximum elim-ination rate of GHB (mg/h-kg), Km represents halfsaturation constant (mg/ml) and CendogSS repre-sents endogenous steady state concentration ofGHB (mg/ml). When concentrations reach en-dogenous levels
dC
dt¼ 0 and KSyn ¼
VMax � CendogSS
Km þ CendogSSð1aÞ
The initial condition for Equation (1) is
Cð0Þ ¼ CendogSS þDose
V
Ksyn is a fixed term, and is calculated based onEquation (1a).
For the model independent approach, eachindividual animal’s data yielded individualpharmacokinetic parameter estimates. Plasmaarea under curve (AUCPlasma) and area underthe first moment of the curve (AUMC) werecalculated using the log trapezoidal method. Theapparent terminal half-life (T1/2) was obtained by0.693/k, where k is the apparent terminalelimination rate constant determined by loglinear regression analysis of the terminal phaseof the plasma concentration profile. The meanresidence time (MRT) was calculated as the ratioof AUMC and AUC. Total clearance (CLTotal) wascalculated as the ratio of dose to AUC. Thevolume of distribution at steady state (VSS) wasdetermined as the product of MRT and CLTotal.
The total amount of GHB excreted renally wasdetermined by summation of the amount ex-creted in each collection interval. GHB maximalrenal elimination rate was calculated as themaximum amount of GHB renally excretedwithin a collection interval. GHB renal clearance,
CLRenal, was determined as the ratio oftotal amount excreted unchanged and theAUCPlasma. The fraction of GHB dose eliminatedby the urinary route (fe) was determined as theratio of total amount excreted and the totalamount administered. The metabolic clearance(CLMetabolism) was calculated as the differencebetween CLTotal and CLRenal.
Equation (2) calculates GHB influx clearance,(CLin, cm3/min/g), based on data obtained fromthe in situ brain perfusion studies
Q
C¼ CLin � T þ Vvasc ð2Þ
where Q (dpm/g) represents the quantity ofradiotracer in the brain region normalized forwet brain tissue weight, C (dpm/cm3) representsthe perfusion fluid concentration of [3H]GHB, T(min) is the time of perfusion (0.5 min) and Vvasc
(cm3/g) represents the volume of the cerebro-vascular capillary bed for each brain region. Vvasc
data were previously determined in our labora-tory using [3H]inulin for each brain region.
Statistical analyses were performed using SASV 8.0 (SAS Institute, Cary, NC). A two-wayanalysis of variance was used to analyse GHBLRR, RRR and total duration of sedative/hypnotic effects in the presence or absence of d-glucuronate. Similarly, a paired Student’s t-testwas used to evaluate for significant differences inplasma pharmacokinetic parameters (AUCPlasma,MRT, VSS, T1/2, CLTotal) and urinary parameters(total amount excreted, CLRenal, fe) in the presenceor absence of d-glucuronate. An unpaired Stu-dent’s t-test was used to evaluate significantdifferences in brain GHB CLin in the presence orabsence of 20 mm unlabeled d-glucuronate. Theresults were considered statistically significant atp50.05. Data are presented as mean � SEM. of(n) animals.
Results
Sedative/hypnotic studies
Table 1 illustrates the effect of d-glucuronate onthe onset (LRR) and offset (RRR) of individualanimals following GHB doses of 200, 400 and800 mg/kg, respectively. A two way analysis of
d-GLUCURONATE EFFECTS ON GHB TOXICITY 5
Copyright # 2006 John Wiley & Sons, Ltd. Biopharm. Drug Dispos. 28: 1–11 (2007)DOI: 10.1002/bdd

variance revealed that the LRR, RRR and dura-tion of GHB’s sedative/hypnotic effects for allthree doses were not significantly altered byd-glucuronate (Table 1). While the RRR and totalduration of sedative/hypnotic effect was signifi-cantly different among the three GHB doses, theywere not significantly different in the presence ofd-glucuronate within each GHB dose group.
Pharmacokinetic studies
GHB concentration time profiles in the presenceor absence of d-glucuronate were best describedby a one-compartmental model with nonlinearelimination. Figures 2 and 3 depict the observed
and model predicted GHB plasma concentrationtime profiles of 200 mg/kg and 400 mg/kg GHBin the absence or presence of d-glucuronate,respectively. Table 2 presents the computergenerated pharmacokinetic parameter estimatesbased on pooled data from individual animals ina treatment group. Although GHB Vmax and Km
appear to increase 2–4 fold in the presence ofd-glucuronate, the pooling of the data restrictsstatistical comparison of the model-dependentcomputer parameter estimates against each other(treatment versus control), due to an inability toestimate the true variability associated with eachparameter estimate. Moreover, visual examina-tion of the concentration time curves (Figures 2
Table 1. Onset (LRR), offset (RRR) and duration of sedative/hypnotic effect of 200 (1.92 mmol/kg), 400 (3.84 mmol/kg) and 800(7.68 mmol/kg) mg/kg intravenous GHB in the presence or absence of d-glucuronic acid (830 mg/kg; 4.3 mmol/kg bolusfollowed by 1.39 g/kg-h; 7.2 mmol/kg-h). Data represent mean� SEM; n ¼ 6 for 200 and 800 mg/kg dose, n ¼ 7 for 400 mg/kgdose
Treatment LRR (min) RRRa (min) Sedative/hypnotic effect timea (min)
200 mg/kg GHBa
þSaline 6.23� 0.619 45.4� 1.84 39.1�1.82þd-glucuronate 9.22� 2.16 44.1� 3.34 34.9� 2.80
400 mg/kg GHBa
þSaline 3.67� 0.294 94.4� 2.62 90.7� 2.67þd-glucuronate 4.05� 0.459 85.0� 3.75 80.9� 3.77
800 mg/kg GHBa
þSaline 3.50� 0.341 120� 8.37 117� 8.43þd-glucuronate 4.17� 0.307 125� 6.77 121� 6.80
a p50.05; significantly differences were observed among the three doses for RRR and sedative/hypnotic effect time, by two-way ANOVA. No
differences were observed between saline and d-glucuronic acid at each dose.
Time (mins)0 50 100 150 200 250
GH
B P
lasm
a C
on
cen
trat
ion
(µg
/ml)
GH
B P
lasm
a C
on
cen
trat
ion
(µg
/ml)
10
50100200400700
Time (mins)
0 50 100 150 200 250
10
50100200400700
(A) (B)
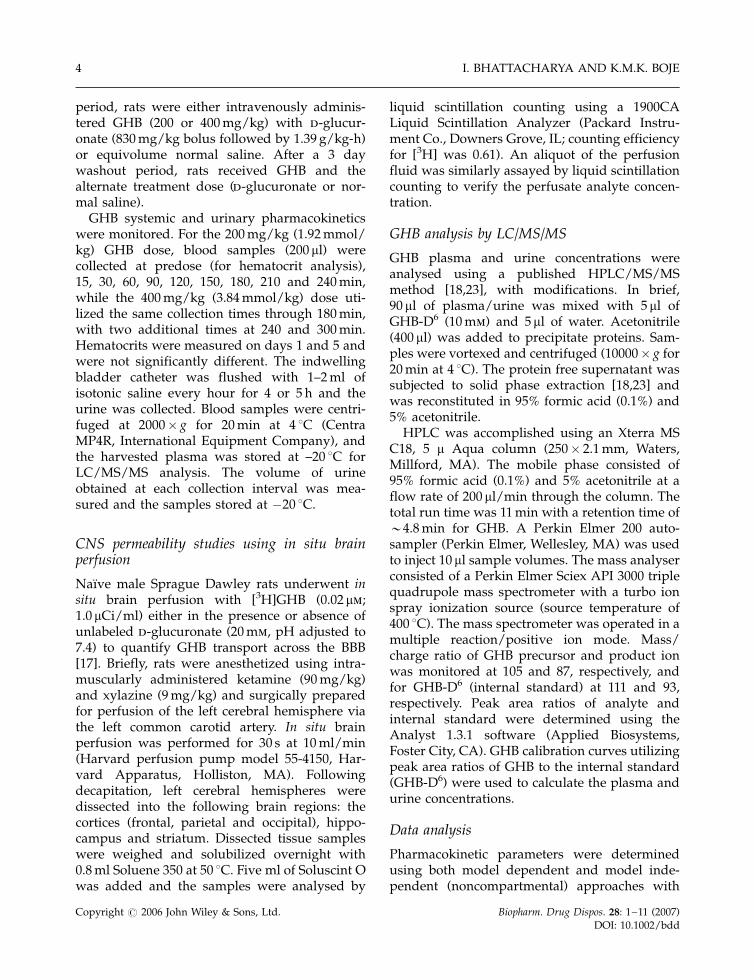
Figure 2. GHB plasma pharmacokinetics presence or absence of d-glucuronate (830 mg/kg; 4.3 mmol/kg) bolus followed by(1.39 g/kg-h; 7.2 mmol/kg-h) infusion. Diamonds and triangles represent observed GHB plasma concentrations following200 mg/kg (1.92 mmol/kg) dose from individual rats ðn ¼ 4Þ in (A) absence or (B) presence of d-glucuronate. Solid and dashedlines represent the predicted data obtained through nonlinear regression analysis
I. BHATTACHARYA AND K.M.K. BOJE6
Copyright # 2006 John Wiley & Sons, Ltd. Biopharm. Drug Dispos. 28: 1–11 (2007)DOI: 10.1002/bdd
and 3) reveals no remarkable differences in thepresence or absence of d-glucuronate. Theapparent decrease in the calculated Ksyn is dueto its dependency on Vmax and Km.
Table 3 presents the results of the noncompart-mental analysis of the concentration time pro-files. None of the noncompartmental parameterswere statistically different within each dosegroup as a result of d-glucuronate administra-tion. The systemic exposure of GHB, as reflectedby the AUC, was not altered in the presence of d-glucuronate for the 200 mg/kg dose. A slight butstatistically insignificant decrease (�15%) inAUC was observed for the 400 mg/kg dose inthe presence of d-glucuronate. Similarly, terminalhalf-life, MRT and CLTotal were not significantlyaltered in the presence of d-glucuronate foreither GHB dose. However, GHB’s nonlinearpharmacokinetics were confirmed as the CLTotal
was significantly different between the 200 and400 mg/kg doses.
The observed decrease in VSS with dose isprimarily due to a significant decrease in CLTotal.Noncompartmental analysis assumes linear andstationary pharmacokinetics, and parametersobtained through noncompartmental analysis ofnonlinear data reflect approximate values. VSS iscalculated as the product of MRT and CLTotal, andunder linear conditions, VSS is independent ofCLTotal. However, as applied to nonlinear datawhere CLTotal decreases with dose, and MRT doesnot change with dose (because proportionalincreases in both AUMC and AUC occur withincreases in dose), the product of CLTotal andMRT yields an apparent decrease in VSS.
Figure 4A and B depict the cumulative amountof intact GHB renally excreted over time in thepresence or absence of d-glucuronate for the 200(Figure 4A) and 400 mg/kg (Figure 4B) GHBdoses. d-Glucuronate did not significantly alterthe cumulative amount of intact GHB excretedfor any collection interval. Table 4 presents the
Time (min)0 50 100 150 200 250 300
GH
B P
lasm
a C
on
cen
trat
ion
( µ
g/m
l)
1
36
10
50100200500
100020003500
Time (min)
0 50 100 150 200 250 300
GH
B P
lasm
a C
on
cen
trat
ion
( µ
g/m
l)
1
36
10
50100200500
100020003500
(A) (B)
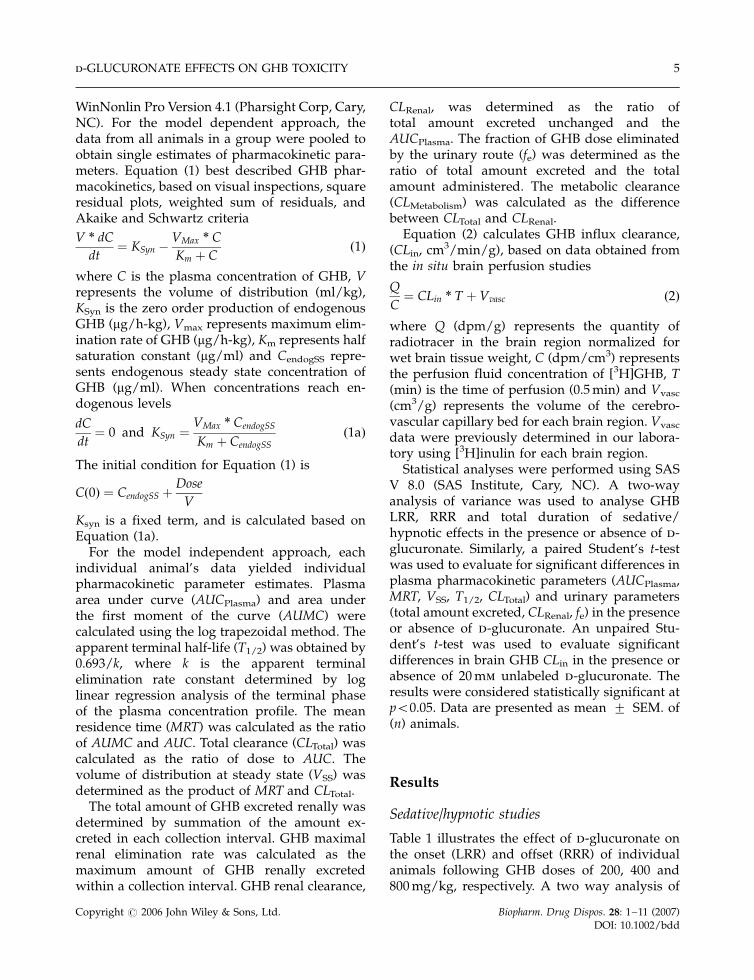
Figure 3. GHB plasma pharmacokinetics presence or absence of d-glucuronate (830 mg/kg; 4.3 mmol/kg) bolus followed by(1.39 g/kg-h; 7.2 mmol/kg-h) infusion. Inverted triangles and circles represent observed GHB plasma concentrations following400 mg/kg (3.84 mmol/kg) dose from individual rats ðn ¼ 5Þ in the (A) absence or (B) presence of d-glucuronate. Solid anddashed lines represent the respective predicted data obtained through nonlinear regression analysis
Table 2. GHB systemic compartmental pharmacokinetic parameter estimates in animals dosed with GHB (200 mg/kg;1.92 mmol/kg or 400 mg/kg; 3.84 mmol/kg i.v.) in the presence or absence of d-glucuronic acid (830 mg/kg; 4.3 mmol/kg bolusfollowed by 1.39 g/kg-h; 7.2 mmol/kg-h). Estimates were obtained by fitting Equation (1) to a pooled data set for each treatment
GHBþ saline GHBþd-glucuronic acid
Parameter Model estimate CV% Model estimate CV%
Vmax (mg min�1 kg �1 101) 322 5.77 723 22.7Km (mg ml�1) 116 26.8 811 36.4V (ml kg�1) 348 9.31 269 11.3CendogSS (mg ml�1) 4.27 11.8 4.97 21.0Ksyn (mg min�1 kg�1) 114 44.0
Ksyn is fixed and is calculated by Equation (1a).
d-GLUCURONATE EFFECTS ON GHB TOXICITY 7
Copyright # 2006 John Wiley & Sons, Ltd. Biopharm. Drug Dispos. 28: 1–11 (2007)DOI: 10.1002/bdd
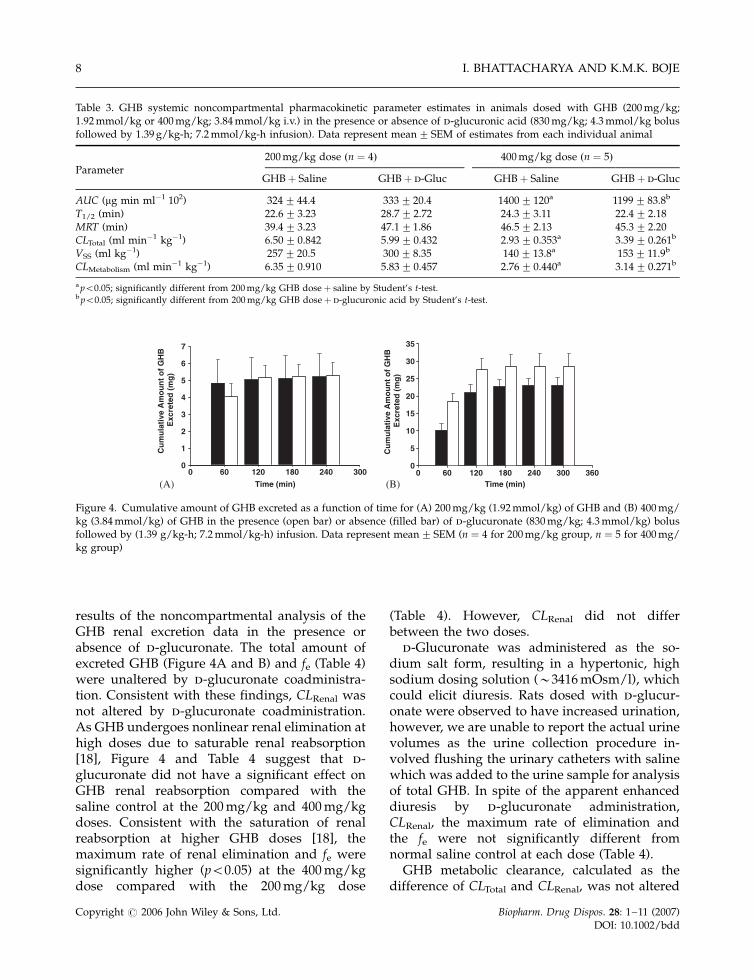
results of the noncompartmental analysis of theGHB renal excretion data in the presence orabsence of d-glucuronate. The total amount ofexcreted GHB (Figure 4A and B) and fe (Table 4)were unaltered by d-glucuronate coadministra-tion. Consistent with these findings, CLRenal wasnot altered by d-glucuronate coadministration.As GHB undergoes nonlinear renal elimination athigh doses due to saturable renal reabsorption[18], Figure 4 and Table 4 suggest that d-glucuronate did not have a significant effect onGHB renal reabsorption compared with thesaline control at the 200 mg/kg and 400 mg/kgdoses. Consistent with the saturation of renalreabsorption at higher GHB doses [18], themaximum rate of renal elimination and fe weresignificantly higher (p50.05) at the 400 mg/kgdose compared with the 200 mg/kg dose
(Table 4). However, CLRenal did not differbetween the two doses.
d-Glucuronate was administered as the so-dium salt form, resulting in a hypertonic, highsodium dosing solution (�3416 mOsm/l), whichcould elicit diuresis. Rats dosed with d-glucur-onate were observed to have increased urination,however, we are unable to report the actual urinevolumes as the urine collection procedure in-volved flushing the urinary catheters with salinewhich was added to the urine sample for analysisof total GHB. In spite of the apparent enhanceddiuresis by d-glucuronate administration,CLRenal, the maximum rate of elimination andthe fe were not significantly different fromnormal saline control at each dose (Table 4).
GHB metabolic clearance, calculated as thedifference of CLTotal and CLRenal, was not altered
Table 3. GHB systemic noncompartmental pharmacokinetic parameter estimates in animals dosed with GHB (200 mg/kg;1.92 mmol/kg or 400 mg/kg; 3.84 mmol/kg i.v.) in the presence or absence of d-glucuronic acid (830 mg/kg; 4.3 mmol/kg bolusfollowed by 1.39 g/kg-h; 7.2 mmol/kg-h infusion). Data represent mean� SEM of estimates from each individual animal
200 mg/kg dose ðn ¼ 4Þ 400 mg/kg dose ðn ¼ 5ÞParameter
GHBþ Saline GHBþ d-Gluc GHBþ Saline GHBþ d-Gluc
AUC (mg min ml�1 102) 324� 44.4 333� 20.4 1400� 120a 1199� 83.8b
T1/2 (min) 22.6� 3.23 28.7� 2.72 24.3� 3.11 22.4� 2.18MRT (min) 39.4� 3.23 47.1�1.86 46.5� 2.13 45.3� 2.20CLTotal (ml min�1 kg�1) 6.50� 0.842 5.99� 0.432 2.93� 0.353a 3.39� 0.261b
VSS (ml kg�1) 257� 20.5 300� 8.35 140� 13.8a 153� 11.9b
CLMetabolism (ml min�1 kg�1) 6.35� 0.910 5.83� 0.457 2.76� 0.440a 3.14� 0.271b
a p50.05; significantly different from 200 mg/kg GHB doseþ saline by Student’s t-test.b p50.05; significantly different from 200 mg/kg GHB doseþ d-glucuronic acid by Student’s t-test.
Time (min)0 60 120 180 240 300 360
Cu
mu
lati
ve A
mo
un
t o
f G
HB
Exc
rete
d (
mg
)
0
5
10
15
20
25
30
35
(B)Time (min)
0 60 120 180 240 300
Cu
mu
lati
ve A
mo
un
t o
f G
HB
Exc
rete
d (
mg
)
0
1
2
3
4
5
6
7
(A)
Figure 4. Cumulative amount of GHB excreted as a function of time for (A) 200 mg/kg (1.92 mmol/kg) of GHB and (B) 400 mg/kg (3.84 mmol/kg) of GHB in the presence (open bar) or absence (filled bar) of d-glucuronate (830 mg/kg; 4.3 mmol/kg) bolusfollowed by (1.39 g/kg-h; 7.2 mmol/kg-h) infusion. Data represent mean� SEM (n ¼ 4 for 200 mg/kg group, n ¼ 5 for 400 mg/kg group)
I. BHATTACHARYA AND K.M.K. BOJE8
Copyright # 2006 John Wiley & Sons, Ltd. Biopharm. Drug Dispos. 28: 1–11 (2007)DOI: 10.1002/bdd
by d-glucuronate administration at either dose(Table 3). However, consistent with nonlinearpharmacokinetics, GHB CLMetabolism was signifi-cantly different (p50.05) between the two doses(Table 3).
CNS Permeability studies using in situ brainperfusion
Table 5 presents [3H]GHB CLin in the presence orabsence of 20 mm d-glucuronate. Overall, d-glucuronate does not inhibit GHB BBB transportin the various brain regions.
Discussion
Literature evidence supports the hypothesis thatd-glucuronate increases GHB metabolism [13].Moreover, d-glucuronate inhibits GHB lysosomaltransport, likely by inhibition of a MCT isoform[19], suggesting that d-glucuronate may be acompetitive inhibitor of renal tubular reabsorp-tion [18] and GHB BBB transport [17] via MCTtransporters. Should this be the case, then d-
glucuronate may be a useful agent to administerin cases of GHB toxicity. Enhancing GHBelimination via increases in metabolic clearancecoupled with reduced GHB BBB transport mayreduce the recovery time and improve patientoutcomes in instances of GHB toxicity.
The mechanism by which d-glucuronate in-creases the rate of GHB oxidation was elucidatedby Kaufman and Nelson using in vivo microdos-ing and in vitro studies [14,24]. In the presence ofexcess NADPþ, GHB is metabolized to succinicsemialdehyde. d-Glucuronate increases NADPþ
by accelerating the turnover of NADPH toNADPþ [13]. In vivo, the rate limiting step ofGHB oxidation is not fully coupled to d-glucuronate reduction, implying that there maynot be sufficient cytosolic d-glucuronate to drivemaximal GHB conversion to succinic semialde-hyde. Kaufman and Nelson showed that exogen-ous d-glucuronate administration (bolus plus i.v.infusion) led to a 33% decrease in GHB half-lifefor a GHB tracer dose (linear pharmacokinetics)of 347 mg/kg. The d-glucuronate dosing regimenused in these studies was the same as that usedby Kaufman and Nelson [13].
Table 4. GHB renal noncompartmental pharmacokinetic parameter estimates in animals dosed with GHB (200 mg/kg;1.92 mmol/kg or 400 mg/kg; 3.84 mmol/kg i.v.) in the presence or absence of d-glucuronic acid (830 mg/kg; 4.3 mmol/kg bolusfollowed by 1.39 g/kg-h; 7.2 mmol/kg-h infusion). Data represent mean� SEM of estimates from individual animals
200 mg/kg dose ðn ¼ 4Þ 400 mg/kg dose ðn ¼ 5Þ
Renal non compartmental parameters GHBþ Saline GHBþ d-Gluc GHBþ Saline GHBþ d-Gluc
Maximum rate of elimination (mg min�1) 66.1� 21.7 67.5� 12.7 209� 20.7a 307� 40.6b
fe 0.080� 0.022 0.095� 0.013 0.204� 0.018a 0.257� 0.037b
CLRenal (ml min�1 kg�1) 0.152� 0.056 0.165� 0.036 0.166� 0.012 0.252� 0.051
a p50.05; significantly different from 200 mg/kg GHB doseþ saline by Student’s t-test.b p50.05; significantly different from 200 mg/kg GHB doseþ d-glucuronic acid by Student’s t-test.
Table 5. GHB BBB influx clearance values (10�2� cm3/min/g) in the presence or absence of 20 mm d-glucuronic acid. Data aremean� SEM of individual animals
CLin� 10�2 (cm3/min-g brain tissue)
Brain region [3HGHB] only ðn ¼ 3Þ ½3HGHB� þ 20 mm d-glucuronic acid ðn ¼ 6Þ
Hippocampus 3.25� 0.294 4.06� 0.628Striatum 7.24� 1.84 5.13� 0.948Frontal cortex 5.03� 0.380 3.89� 0.492Parietal cortex 4.22� 0.177 3.99� 0.527Occipital cortex 4.52� 0.549 4.33� 0.568
d-GLUCURONATE EFFECTS ON GHB TOXICITY 9
Copyright # 2006 John Wiley & Sons, Ltd. Biopharm. Drug Dispos. 28: 1–11 (2007)DOI: 10.1002/bdd
The pharmacokinetics of GHB was studied inthe presence or absence of d-glucuronate at twodoses that would produce clinically relevantconcentrations. In man, therapeutic doses of�65 mg/kg GHB orally produce plasma concen-trations of �100 mg/ml; GHB blood concentra-tions from post-mortem drug overdoses mayreach 330 mg/ml [21,22]. Based on simulations,doses of 164 mg/kg or higher of GHB i.v.produces concentrations of �350 mg/ml in rats(data not shown), and was the basis for selectionof the GHB doses used in this study.
Lettieri and Fung observed that GHB pharma-cokinetics are linear at 200 mg/kg and nonlinearat higher doses [11]. As we observed GHBnonlinear pharmacokinetics at 200 and 400 mg/kg doses, individual animal data for both doseswere combined into a treatment or control dataset, as this is the best approach to obtainreasonable nonlinear parameter estimates fromtwo dose levels. However, pooling of the datarestricts statistical comparison of the model-dependent computer parameter estimates againsteach other (treatment versus control), due to aninability to estimate the true variability asso-ciated with each parameter estimate. Based onthe in vitro and tracer dose studies [14,24], onemight predict an increase in Vmax in the presenceof d-glucuronate. While there is an apparentincrease in Vmax and Km in the presence of d-glucuronate, a corresponding increase in GHBelimination was not observed for the concentra-tion-time profiles or the non-compartmentalestimates of AUC, half-life, MRT, CLTotal, CLRenal
and CLMetabolism. These data argue against ahypothesis that d-glucuronate acts as an efficientoxidative stimulant of GHB metabolism at higherGHB doses.
A perplexing increase in Km was observed, inaddition to a decreased Ksyn, the zero order rateconstant for endogenous GHB production, sug-gesting that the model-dependent approachusing a pooled, single data set results incovariant parameter estimates. In order to appro-priately assess the meaningfulness of the changesin the Vmax, Km and Ksyn parameters, one needsto employ a population based modeling ap-proach using data from three GHB doses, withat least one dose in the linear pharmacokineticrange.
GHB renal elimination was unaltered by d-glucuronate. There were no significant changesin the fe or CLRenal for the 200 and 400 mg/kgdoses by d-glucuronate. These data rule out ahypothesis that d-glucuronic acid, a MCT sub-strate, enhances GHB renal excretion at higherdoses through inhibition of GHB tubular reab-sorption.
Similar to the findings of Morris et al. [18], thefraction of the GHB dose eliminated through therenal route was dose dependent (2.55 foldincrease with a doubling of the dose). However,CLRenal was unchanged between the two GHBdoses. This is due to the fact that a dose-dependent increase in the fe was offset bycorresponding increases in AUC.
Since GHB inhibited d-glucuronate influx inlysosomes [19], it was necessary to determine ifd-glucuronate demonstrates mutual transportinhibition with GHB. Using rat in situ brainperfusion this study found that d-glucuronatedoes not inhibit GHB BBB influx clearance.
One may speculate as to why d-glucuronatefailed to alter GHB pharmacokinetics underclinically relevant concentrations. It may be thatwhile d-glucuronate may stimulate NADPþ –NADPH turnover, this turnover is not rate-limiting for GHB oxidation. Alternatively, GHBdehydrogenase (cytosolic NADPþ dependentoxidoreductase, E.C.1.1.1.19) is saturated at highconcentrations of GHB, hence provision of d-glucuronate, which putatively enhances cofactoravailability, is without effect. Or, l-gulonate, theend-product of d-glucuronate reduction and acompetitive substrate of GHB dehydrogenase[14], accumulates with d-glucuronate adminis-tration due to rate limiting shunting into theascorbic acid cycle. A last possibility is thatsuccinic semialdehyde, the product of GHBoxidation, also accumulates and is convertedback to GHB.
Overall, GHB pharmacokinetic studies suggestthat d-glucuronate does not alter total (metabolicor renal) elimination of GHB following low(200 mg/kg) or higher (400 mg/kg) doses. Thein situ brain perfusion and pharmacodynamicstudies do not support the utility of d-glucur-onate administration to decrease GHB brain BBBpermeability and subsequent sedative/hypnoticeffects. In total, the present work suggests that
I. BHATTACHARYA AND K.M.K. BOJE10
Copyright # 2006 John Wiley & Sons, Ltd. Biopharm. Drug Dispos. 28: 1–11 (2007)DOI: 10.1002/bdd

d-glucuronate is without effect as a potentialtherapeutic intervention in the treatment of GHBoverdose conditions in rats. Since high doses ofd-glucuronate (830 mg/kg bolus followed by1.39 g/kg-h) were used, it is unlikely that evenhigher doses of d-glucuronate could be used forGHB toxicity treatment without itself causingtoxicity. Furthermore, based on this work, thetherapeutic application of d-glucuronate in thetreatment of GHB doses in other species, includ-ing humans, is questionable.
Acknowledgements
The authors would like to thank Mr David Sodafor his assistance with the surgical cannulations;Mr Joseph J. Raybon and Mrs Donna Ruszaj fortheir help in developing the LC/MS/MS assay;and Dr Donald E. Mager for providing insightfulsuggestions. This work was supported in part byNational Institutes of Health grant DA 14988 anda Merck predoctoral fellowship.
References
1. Roth R, Giarman N. Gamma-butyrolactone and gamma-hydroxybutyric acid – I. Distribution and metabolism.Biochem Pharmacol 1966; 15: 1333–1348.
2. Roth RH. Formation and regional distribution of gamma-hydroxybutyric acid in mammalian brain. Biochem Phar-macol 1970; 19: 3013–3019.
3. Nelson T, Kaufman E, Kline J, Sokoloff L. The extraneuraldistribution of gamma-hydroxybutyrate. J Neurochem1981; 37: 1345–1348.
4. Cash CD. Gamma-hydroxybutyrate: an overview of thepros and cons for it being a neurotransmitter and/or auseful therapeutic agent. Neurosci Biobehav Rev 1994; 18:291–304.
5. Chin RL, Sporer KA, Cullison B, Dyer JE, Wu TD. Clinicalcourse of gamma-hydroxybutyrate overdose. Ann EmergMed 1998; 31: 716–722.
6. Kaufman EE, Porrino LJ, Nelson T. Pyretic action of lowdoses of gamma-hydroxybutyrate in rats. Biochem Phar-macol 1990; 40: 2637–2640.
7. Ingels M, Rangan C, Bellezzo J, Clark RF. Coma andrespiratory depression following the ingestion of GHBand its precursors: three cases. J Emerg Med 2000; 19:47–50.
8. Zvosec DL, Smith SW, McCutcheon JR, Spillane J, Hall BJ,Peacock EA. Adverse events, including death, associated
with the use of 1,4-butanediol. N Engl J Med 2001; 344:87–94.
9. Okun MS, Boothby LA, Bartfield RB, Doering PL. GHB: animportant pharmacologic and clinical update. J PharmPharm Sci 2001; 4: 167–175.
10. Gahlinger PM. Club drugs: MDMA, gamma-hydroxybu-tyrate (GHB), Rohypnol, and ketamine. Am Fam Physician2004; 69: 2619–2626.
11. Lettieri JT, Fung HL. Dose-dependent pharmacokineticsand hypnotic effects of sodium gamma-hydroxybutyratein the rat. J Pharmacol Exp Ther 1979; 208: 7–11.
12. Nelson T, Kaufman EE. Developmental time courses inthe brain and kidney of two enzymes that oxidizegamma-hydroxybutyrate. Dev Neurosci 1994; 16: 352–358.
13. Kaufman EE, Nelson T. Kinetics of coupled gamma-hydroxybutyrate oxidation and d-glucuronate reductionby an NADPþ-dependent oxidoreductase. J Biol Chem1981; 256: 6890–6894.
14. Kaufman EE, Nelson T. Evidence for the participation of acytosolic NADPþ-dependent oxidoreductase in the cata-bolism of gamma-hydroxybutyrate in vivo. J Neurochem1987; 48: 1935–1941.
15. Kaufman EE, Nelson T, Goochee C, Sokoloff L. Purifica-tion and characterization of an NADPþ-linked alcoholoxido-reductase which catalyzes the interconversion ofgamma-hydroxybutyrate and succinic semialdehyde.J Neurochem 1979; 32: 699–712.
16. Anonymous. Xyrem package insert. Orphan Medical:Minnetonka, MN, 2002.
17. Bhattacharya I, Boje KM. GHB (gamma-hydroxybutyrate)carrier-mediated transport across the blood-brain barrier.J Pharmacol Exp Ther 2004; 311: 92–98.
18. Morris ME, Hu K, Wang Q. Renal clearance of gamma-hydroxybutyric acid in rats: increasing renal eliminationas a detoxification strategy. J Pharmacol Exp Ther 2005; 313:1194–1202.
19. Havelaar AC, Mancini GM, Beerens CE, Souren RM,Verheijen FW. Purification of the lysosomal sialic acidtransporter. Functional characteristics of a monocarbox-ylate transporter. J Biol Chem 1998; 273: 34568–34574.
20. Nicholson KL, Balster RL. GHB: a new and novel drug ofabuse. Drug Alcohol Depend 2001; 63: 1–22.
21. Borgen LA, Okerholm RA, Lai A, Scharf MB. Thepharmacokinetics of sodium oxybate oral solution follow-ing acute and chronic administration to narcolepticpatients. J Clin Pharmacol 2004; 44: 253–257.
22. Kalasinsky KS, Dixon MM, Schmunk GA, Kish SJ. Blood,brain, and hair GHB concentrations following fatalingestion. J Forensic Sci 2001; 46: 728–730.
23. Fung HL, Haas E, Raybon J, Xu J, Fung SM. Liquidchromatographic-mass spectrometric determination ofendogenous gamma-hydroxybutyrate concentrations inrat brain regions and plasma. J Chromatogr B AnalytTechnol Biomed Life Sci 2004; 807: 287–291.
24. Kaufman EE, Relkin N, Nelson T. Regulation andproperties of an NADPþoxidoreductase which functionsas a gamma-hydroxybutyrate dehydrogenase. J Neuro-chem 1983; 40: 1639–1646.
d-GLUCURONATE EFFECTS ON GHB TOXICITY 11
Copyright # 2006 John Wiley & Sons, Ltd. Biopharm. Drug Dispos. 28: 1–11 (2007)DOI: 10.1002/bdd


![Pages 1 to 5 of Thesis Contents - Roman Orus · θ α 1 i 2 Γ[2] α 3 i 3 Γ[3] qχ 1 qχ 3 ˜Γ[2] λ[2] Γ˜[3] qχ 1 qχ 1 qχ 1 qχ 3 qχ 3 qχ 3 Γ Γ [2]Γ[3] ˜Γ Γ˜[3]](https://img.pdfslide.net/doc/110x75/5fb0531b101ac54293032a09/pages-1-to-5-of-thesis-contents-roman-1-i-2-2-3-i-3-3-q-1-q.jpg)