Embed Size (px)
Citation preview
Feasibility of prefabricated
concrete elements for
underpasses
Watertight connection & structural safety
B.G.A. van Casteren
Delft
Univ
ers
ity o
f Tech
nolo
gy

Cover photo:
The execution of an underpass in Gieten (NL) built-up by prefabricated concrete elements. The photo depicts the installation of the last underpass element with protruding dilatation profile.
Romein Beton
Feasibility of prefabricated concrete elements for underpasses
WATERTIGHT CONNECTION & STRUCTURAL SAFETY
MASTER THESIS
By
B.G.A. van Casteren
in partial fulfilment of the requirements for the degree of
Master of Science in Civil Engineering
at the Delft University of Technology,
To be defended publicly on Wednesday May 13, 2015 at 16:00.
Student number: 4116631 Supervisor: Prof. dr. ir. D.A. Hordijk TU Delft Thesis committee: Prof. dr. ir. R.P.B.J. Dollevoet TU Delft Dr. ir. C. van der Veen TU Delft Ir. T.W. Groeneweg Movares
This thesis is confidential and cannot be made public until January 1, 2016
An electronic version of this thesis is available at http://repository.tudelft.nl/

i
Abstract
Prefabricated concrete is a well known construction material for building and civil engineering. The controlled production process, quick erection and high
repetition make this material planning technically and financial very attractive. So why is this not used for underpasses? Or only to a small extend of slow traffic underpasses. Underpasses are common seen structures in the Dutch landscapes, but are usually executed as cast in-situ concrete.
When there is strived for a quick execution time of the structure and a high repetition of elements is possible, prefabricated concrete starts to become an interesting alternative to cast in-situ concrete. So finding an application, which meets these requirements make it possible to test whether prefabricated concrete is an attractive material to use for the construction of underpasses.
In assignment of the Dutch government the Dutch rail capacity needs to grow and be used more efficient. Therefore the so called Programma Hoogfrequent Spoorvervoer (PHS) is introduced. The program aims to sharpen the train table on the main tracks to a train every 10 minutes. An important consequence of
this rail capacity increase, is increased traffic disturbance at level railway crossings. An ideal is therefore to refrain from level crossings with railroads. The use of underpasses seems to be the most obvious solution. So we have found an application for a high repetition of underpasses and because of the execution during a train free period, a short execution time plays an important
role. The main objective of this research is to test the feasibility of prefabricated concrete as a construction material for (railway) underpasses. By means of a literature study the most important aspects for the use of prefabricated
concrete are analyzed, as well as the execution aspects for an underpass crossing a railway. Based on the findings from the literature study, different element configurations are designed. Subsequently these designs are tested with a list of criteria and the most interesting configurations are used for the design study of this research. In the design study the overall design is worked
out to a more detailed level. A solution is found for connecting the elements together and obtain a watertight structure and structural safety. Within the design study, a suitable execution schedule is searched for various situations.
The result of the research is a proposed standardized underpass design,
constructed with prefabricated concrete elements. The standardized design is applicable for 53% of the crossings on the PHS track. Within these group of crossings, variants regarding the soil conditions occur. For several interesting situations a corresponding execution schedule and foundation method is proposed. It can be concluded that a financial and planning technical
attractive prefab solution is found.

ii
iii
Acknowledgements
I would like to take the opportunity to express my gratitude to everyone who contributed in the completion of this thesis. First I would like to thank my
graduation committee, who started with helping me to find a research topic, and later on helped me during the process. Thanks Dick Hordijk, Rolf Dollevoet, Cor van der Veen and Tom Groeneweg. I would like to thank my colleagues at Movares that helped me during the research and gave me a pleasant time at the office. Special thanks to my fellow students and
colleagues Koen van Viegen and Joost Houtenbos, who shared their thoughts about my research with me. It was nice to share ideas with them, and they certainly helped me with theirs. Finally I would like to thank my parents and brother for supporting me for all those years, from a close or even a far distance.
B.G.A. van Casteren
Utrecht, May 2015

iv
v
Preface
This thesis is written as part of the Civil Engineering master curriculum at the
Delft University of Technology. The research was carried out in cooperation with the Dutch engineering and consulting company Movares and the faculty of Civil Engineering & Geosciences of the Delft University of Technology. “Keep it simple” those words where often the solution to a problem I bumped
into during the process of this research. In the first couple of months I saw my graduation research as a big puzzle. So many aspects where influencing each other, in the search for an underpass constructed with prefabricated concrete elements. There was a time that I thought my conclusion would be: prefab concrete for underpasses is not an interesting alternative to cast in-situ
concrete. But as the strength of prefab elements is simplicity, a solution could not be found with only complex thinking. As I figured out how to deal with the different aspects of the combination of prefab and train free periods, the pieces of the puzzle where coming together. And I am glad that my end conclusion is
different from the one I mentioned above.
When I was looking for graduation topics that interested me, I had two demands; it had to contain concrete structures and it had to be innovative. When I first approached Movares, the manager was convinced that we could come to an research topic that satisfied the company, the TU Delft and me. It
took a while, but after several proposals I was working on a topic that I find very interesting, and whereby I think a lot of needless labor can be saved in the future. A last thing I would like to add is that every student, including me, looks back
at the graduation period saying “if I could do it all over again, I would do it different”, but I now realize that that is all part of the education.
B.G.A. van Casteren Utrecht, May 2015

vi
vii
Contents
Abstract .......................................................................................................... i
Acknowledgements ....................................................................................... iii
Preface ........................................................................................................... v
Contents ...................................................................................................... vii
Acronyms ..................................................................................................... ix
1 Introduction............................................................................................... 1
1.1. Problem statement ............................................................................. 2 1.2. Research objective ............................................................................. 2 1.3. Research question ............................................................................. 2 1.4. Sub questions .................................................................................... 2 1.5. Scope................................................................................................. 2 1.6. Reading guide .................................................................................... 3
PART I LITERATURE REVIEW ........................................................................ 5
2 Prefabricated concrete ................................................................................ 7
2.1. Introduction....................................................................................... 7 2.2. Motivation ......................................................................................... 7 2.3. Repetition .......................................................................................... 8 2.4. Design rules ...................................................................................... 8 2.5. Stability ............................................................................................. 9 2.6. Tolerances ......................................................................................... 9 2.7. Standardization ................................................................................. 9 2.8. Connections ....................................................................................... 9 2.9. Details ............................................................................................... 9 2.10. Interview .......................................................................................... 10
3 Water tightness ........................................................................................ 11
3.1. General ............................................................................................ 11 3.2. Joints .............................................................................................. 11
4 Transportation & crane capacity .............................................................. 15
4.1. Transportation ................................................................................. 15 4.2. Crane capacity ................................................................................. 17
5 Design input ............................................................................................ 19
5.1. Environmental parameters ............................................................... 19 5.2. Coordinate system ........................................................................... 21 5.3. Clearance gauge for rail traffic ......................................................... 21 5.4. Road profile ..................................................................................... 23 5.5. Underpass dimensions ..................................................................... 26 5.6. Soil conditions ................................................................................. 28 5.7. Altitude railway ................................................................................ 29 5.8. Starting points ................................................................................. 30
PART II THE DESIGN ................................................................................... 31
6 Element configuration .............................................................................. 33
6.1. Criteria ............................................................................................ 33 6.2. Underpass layouts ........................................................................... 35 6.3. Conclusions ..................................................................................... 43 6.4. Sensitivity analysis .......................................................................... 45
7 Loads....................................................................................................... 47
7.1. Self-weight ....................................................................................... 47
viii
7.2. Dead load ........................................................................................ 47 7.3. Creep ............................................................................................... 48 7.4. Shrinkage ........................................................................................ 48 7.5. Traffic .............................................................................................. 48 7.6. Snow ............................................................................................... 53 7.7. Wind ................................................................................................ 53 7.8. Temperature .................................................................................... 53 7.9. Load combinations ........................................................................... 54
8 Connections ............................................................................................. 57
8.1. Load on connections ........................................................................ 57 8.2. Connecting systems ......................................................................... 57 8.3. Mortar joints .................................................................................... 60
9 Structural design ..................................................................................... 63
9.1. Design principles ............................................................................. 63 9.2. Static analysis ................................................................................. 64 9.3. Results ............................................................................................ 68 9.4. Material properties & classifications ................................................. 70 9.5. Verification of the structure ............................................................. 71 9.6. Connections ..................................................................................... 71 9.7. Foundation ...................................................................................... 82 9.8. Access ramps ................................................................................... 83 9.9. Comparison of variant H and I ......................................................... 83 9.10. Conclusions ..................................................................................... 86
10 Execution ................................................................................................ 87
10.1. Train free period .............................................................................. 87 10.2. Planning .......................................................................................... 89 10.3. Execution during a train free period ................................................. 89 10.4. Conclusions ..................................................................................... 95
11 Cost estimations ...................................................................................... 97
11.1. Cost estimations .............................................................................. 97 11.2. Conclusion ...................................................................................... 98
12 Conclusions & recommendations ............................................................. 99
12.1. Conclusion ...................................................................................... 99 12.2. Recommendations ......................................................................... 100
References ................................................................................................. 101
List of figures ............................................................................................. 105
ANNEX I: Element configuration .................................................................... I
ANNEX II: Loads .......................................................................................... II
ANNEX III: Load cases and combinations ....................................................III
ANNEX IV: Verification of the structure ...................................................... IV
ANNEX V: Connections ................................................................................V
ANNEX VI: Execution ................................................................................. VI
ix
Acronyms
GWL Groundwater level LM Load Model
NEN-EN Comité Européen de Normalisation OVS Ontwerp Voorschriften Spoor (Design Rules for Railway
structures) PHS Programma Hoogfrequent Spoorvervoer (Program High Frequency
Rail transport)
PVR Profiel van Vrije Ruimte (Clearance gauge) ROK Richtlijnen Ontwerp Kunstwerken (Guidelines for structural
design) RDW Rijksdienst wegverkeer (Dutch public service in the mobility
chain)
SLS Serviceability Limit State SPMT Self Propelled Modular Transporter TFP Train Free Period ULS Ultimate Limit State

x
1
1 Introduction
Prefabricated concrete is a well known construction material for building and civil engineering. For ages prefab elements are used to construct buildings, bridges or bored tunnels. The controlled production process, quick erection and high repetition make this material planning technically and financial very
attractive. So why is this not used for underpasses? Or only to a small extend of slow traffic underpasses. Underpasses are common seen structures in the Dutch landscapes, but are usually executed as cast in-situ concrete. When there is strived for a quick execution time of the structure and a high
repetition of elements is possible, prefabricated concrete starts to become an interesting alternative to cast in-situ concrete.
So together with Movares an application is found, which makes it possible to research if the use of prefabricated concrete for underpasses is an interesting
alternative to the traditional cast in-situ underpass. In assignment of the Dutch government the Dutch rail capacity needs to grow and be used more efficient. Therefore the so called Programma Hoogfrequent Spoorvervoer1 (PHS) is introduced. The program aims to sharpen the train
table on the main tracks to a train every 10 minutes. Passenger trains will run as subways. The goal is to realize this before the end of the year 2028. Traveling without a railway timetable will be introduced step by step and will improve the accessibility of cities and industries. The main solution is more passenger trains on the main tracks and cargo trains running particularly on
the so called “Betuweroute”. An important consequence of this rail capacity increase, is increased traffic disturbance at level railway crossings. An ideal is therefore to refrain from level crossings with railroads. Taking into account the catenaries of railways, the use of underpasses seems to be the most obvious solution, from structural point of view.
ProRail plans to tender the design for under passing the crossings on the set of tracks. Movares is researching the possibility to standardize and/or parameterize the design of such underpasses. The mayor profit of standardization is the expected reduction of the design- and execution costs.
Considering the crossing of railways, a quick execution time is demanded to reduce the Train Free Period as much as possible. In addition the PHS track includes a large amount of level crossing which need to be transferred to underpasses, so a high repetition could be possible. This makes it interesting
to search for a solution in prefabricated concrete elements. The application should result in a high repetition factor and a reduction of design-, production- and execution costs.
1 Programma Hoogfrequent Spoorvervoer (PHS), Program High Frequency Rail transport
1. INTRODUCTION
2
This master thesis is focused on researching the possibility of prefabricated concrete elements as a construction material for railway underpasses.
1.1. Problem statement
The use of prefabricated elements for railway underpasses is unusual. Research has to prove whether it is feasible to implement in prefabricated
concrete. Transport restrictions, structural safety, execution, water tightness and costs will play a major role in the investigation of the applicability.
1.2. Research objective
The main objective of this research is to test the feasibility of prefabricated concrete as a construction material for (railway) underpasses. Herewith the main challenge lies in designing an element set-up which secures structural safety, water tightness and lies within the restrictions regarding transportation
and execution possibilities. The results of this research should lead to a standardized design for a large number of railway underpasses, taking advantages on design and construction time and cost. Saving on the train free period of the railway track could lead to a major financial benefit. From research it should be determined whether the expected benefits of this
construction method holds for the most common tunnel profiles from the PHS (standardization). Applying underpasses at current level crossings with railroads on the PHS track, should improve the traffic flow.
1.3. Research question
Is an underpass executed in prefabricated concrete elements, as described in §1.1, with guarantee of water tightness of the construction and structural safety, planning technically a favorable alternative to cast in-situ underpasses?
1.4. Sub questions
In order to obtain a solution to the research question, a set of sub questions is used to focus on the main parts of the research.
How to divide the underpass in elements?
How can a prefabricated concrete underpass be executed?
How can a water tight connection between prefab elements be realized?
Is it profitable to use prefabricated elements for railway underpasses on the PHS track?
1.5. Scope
The focus of the thesis will be on searching for a feasible element layout of the prefab underpass which secures structural safety and water tightness of the structure. The environmental conditions, (rail)road alignment and transport- and execution restrictions related to the railway crossings on the PHS track
form the starting points for the design study of this thesis. In order to check the feasibility of the prefabricated concrete underpass a cost consideration should be made. In the research only a global cost calculation will be made to check if the method is financially beneficial.
1. INTRODUCTION
3
1.6. Reading guide
The report is basically divided into two parts, namely the literature review and the design. This section describes what both parts denote.
1.6.1. Literature review
To be able to answer the research question, a good base of knowledge about the field of research is necessary. Hence, the literature study exists of a collection of information on various topics that are related to the research question. The literature review is an summary of all essential information
extracted from the literature study and serves as the basis of the research and provides enough knowledge to start the design study on.
1.6.2. Design part
The different design aspects are discussed, the boundary conditions are set and verifications are made. First 2D portals will be used for global calculations in the variant study for element layouts. Solutions for the connections between elements, water tightness of the structure and the execution are discussed.
Sequentially 3D finite element models will be used for more detailed calculations and verifications. The design part also covers the technical planning and global financial analysis related to the use of prefab concrete for
underpasses. The findings from the literature review and the design part, will be used to make conclusions on the research and recommendations for
further steps are given.

1. INTRODUCTION
4

5
PART I
LITERATURE REVIEW

6
7
2 Prefabricated concrete
2.1. Introduction
Prefab concrete has a high potential to be economical and durable compared to the traditional in-situ poured concrete, because of the optimized use of materials. Prefabricated concrete elements are made in a factory in a favorable
environment and good production control. Mostly a permanent factory is used for the production of a large amount elements of a relatively small size. This results in a required transportation of the elements from the factory to the project site. An import and beneficial aspect of prefabricated elements is the short construction time on site. In utility building prefab elements are often
used, but many of the properties and benefits of prefabrication in utility buildings also holds for prefabricated tunnels or underpasses.
2.2. Motivation
For every project there are different aspects which influences the choice between prefabricated or in-situ concrete. The most important factors in favor of prefabricated concrete elements are described below:
2.2.1. Construction speed
The overall construction time of prefabricated concrete is in general shorter than in-situ concrete. However, the total building time is also depending on a
long lead-in time(design calculations and preparations), as well as on the delivery time. The calculations and drawings of the elements must be finished in an early stage. But for multiple situations prefabricated elements bring a major benefit regarding the construction speed. Namely, the construction time at the building site can be reduced considerable. This can be desirable for
multiple situations, for example during a train free period.
2.2.2. Building site area
When casted in-situ, space for storing materials, formwork, reinforcement etc. is needed. Namely in urban locations where the space on the building site can be scarce it is desirable to use prefab elements and erect the elements directly from the truck.
2.2.3. Quality of the concrete
In general the quality of prefabricated concrete is better than cast in-situ concrete. This can be explained by the better circumstances and controlled
manufacturing of the concrete. Higher quality means a sleeker design is possible. A common used strength class for prefab concrete elements is C55/67. In many cases it is possible to reduce the concrete cover on reinforcement with 5mm, because of the high quality, daily monitoring and strength of the concrete.
2. PREFABRICATED CONCRETE
8
2.2.4. Flexibility
Prefabricated concrete makes it possible to realize structures which are hard
to build with other materials, because of complicated formwork or difficulties
to pour on site.
2.2.5. Environmental aspects
Using prefab concrete results in less hindrance to the environment. The elements are more-or-less demountable, whereby re-use or demolition at preferred locations (different from building site) is possible.
2.3. Repetition
One of the main reasons to choose for prefabricated concrete is the costs.
Repetition of elements play a major role in economical profit of prefabrication. The cost of the total project mainly depends on the cost components of the moulds. Therefore a high repetition of the elements results in a more economical solution.
2.4. Design rules
A good prefabricated concrete design aims for applying simple details, since the advantages of precast concrete are inherent to simplicity of the details. For
the application of prefabricated concrete elements the following set of design rules holds:
Detail as simple as possible.
Design for the maximum repetition.
Strive for the biggest element size possible, without exceeding the
transport and crane capacity, to obtain as less connections and joints as possible. Also the (transport) reinforcement should fit in the transportation possibilities.
Keep the shape of the elements as simple as possible, so they can be easily demoulded.
Avoid casting concrete on site, because it can result in delays.
During erection the structure should be stable.
Use modular co-ordination
Include tolerances
Aim for standard dimensions, details, cross sections and base type
products.
It is important to realize that the best result of a prefab concrete design is reached, if the structure is designed as a prefabricated structure and not
adapted from the traditional in situ design to a prefab design. Neglecting this can result in unnecessary faults or problems during the fabrication and erection of the elements, as well as during the service life of the structure. Therefore the restrictions, possibilities and advantages & disadvantages of prefab concrete should be kept in mind during the design stage.
B.G.A. VAN CASTEREN
9
2.5. Stability
To obtain a high speed of erection, simple connections are preferred. The use of pinned connections is therefore a common solution. These connections
cannot transfer moments. To perform stabilizing structures, the prefabricated elements must be connected in such a way that shear forces can be transferred. The connections can be dry or wet. The concrete or mortar used in
the wet connections needs time to harden. This may influence the execution time. The structural stability has to be assured in every stage of the erection of the structure. If this is not possible, additional measures have to be taken. The risk of progressive collapse should be considered carefully, and where necessary, provision to prevent or reduce the risk to progressive collapse
should be made. Progressive collapse is a chain-reaction which leads to failure of the structure and causes extensive damage or total collapse of the structure. There are several approaches to reduce the risk of progressive collapse:
Reduce the risk of accidental failure;
Design the structure to withstand accidental loading;
Prevent the propagation of a possible initial failure;
2.6. Tolerances
In general prefabricated concrete is manufactured with relatively small deviations. However designers should take a realistic view of dimensional
variability. To reduce the additional costs and problems during erection, the magnitude of permissible tolerances has to be economical, reasonable and achievable in practice.
2.7. Standardization
In order to achieve a high level of application of standardized elements it is necessary that modular co-ordination is used in design. This should respect
the modular sizes and possibilities of standardized elements.
2.8. Connections
Structural connections serve to transfer forces between the prefab elements in order to obtain integrity and a structural interaction of the loaded structure. The connections should secure the intended structural behavior of the structure and the force path through the connection must be considered in a global view of the connection and the adjacent structural elements. Various
aspects should be considered in the design and detailing of the structural connections:
Production of prefab elements
Transport, storage and handling of the elements
Mounting of the prefab structural system
Structural behavior for ordinary and excessive loads
Appearance and function of the structure in SLS
2.9. Details
There should be strived for the use of simple details. The simplicity of the details are decisive for the advantages of prefabricated concrete. Detailing of
the connections should also be done as simple as possible and all attempts for making connections similar to cast in situ ones should be avoided. The prefab design is independent of the in situ design.
2. PREFABRICATED CONCRETE
10
2.10. Interview
In order to obtain more insight in features of prefabricated concrete elements used for underpasses an expert is interviewed. Expert in prefabricated
concrete elements P. (Paul) de Vries from Romein Beton [42] is interviewed. Romein Beton is a supplier of prefabricated concrete elements. Romein Beton has a lot of experience with prefab concrete elements used for slow traffic
underpasses. The information gained by the interview should help in the design of the underpass. The following topics have come to light:
2.10.1. Dimensions
The dimensions of current prefab concrete elements, used for underpasses, are mainly limited by transport dimensions and costs, and crane capacities. For heavy large elements water transport provides the solution. However, the railway crossings regarded in the research do not lend themselves for water
transport. Therefore the element dimensions are limited by transport capacities of truck and trailer combinations. An element layout with cross-sections consisting of one or two elements is preferred, as connecting elements requires time, space and labor. However, crane capacity and storage space provide room for extending the current maximum element dimensions.
Currently available elements have dimensions of approximately 8m x 4-5m.
For small structures like box culverts, the design of element dimensions is tuned to regular transport dimensions (continued dispensation). For larger structures like underpasses, element dimensions are determined in consultation with the transporter. Dispensation and measurements are project
related. Elements with asymmetric geometry can cause problems during loading and transport, so in case of heavy elements the asymmetry and loading possibility is discussed with the transporter. Often receding walls are applied to create a safe and wide feeling for under passing traffic.
2.10.2. Force distribution & stability
Full moment and shear force transfer between elements can be realized by a kind of dowel (in Dutch: doken). This is a steel bar with a large diameter
(32mm is often used) inserted in both elements at location of the joint. The concrete surface of the joint is roughened for good adhesion and filled-up with low-shrinkage grout. If the self weight of the top element is large enough, the
pressure on the joint will be sufficient to secure water tightness of the joint. Additional prestressing is not required, though this has to be checked. Prestressing in longitudinal direction (y-direction) however is required to
obtain stability in this direction. Normally prefab elements are installed on a smooth leveled floor, inspected and cleaned from sand or other possible
inclusions before the elements are coupled.
2.10.3. Low-shrinkage grout
Different types of low-shrinkage grout are available to fill-up the joint. For the execution during the out-of-service period of the railway high construction speed is desirable. Therefore fast hardening of the grout is required. The structure is as weak as the weakest link, so the joint should obtain a higher strength capacity than the prefab elements.
11
3 Water tightness
If at one side of the concrete structure a water pressure is present, and on the other side air, the concrete is watertight if no water is visible at the airside of
the structure. The water transportation through the concrete is slow enough for water on the outer pores to evaporate before it becomes visible on the concrete surface. This results in a constant dry appearance at the airside of the structure. So water tightness is a property of the structure, not of the concrete.
3.1. General
There are several main rules to follow for water tightness of a concrete
structure. Most of them aim to receive the best concrete possible for the situation.
Limit or avoid cracking of the concrete.
Cracking of the unloaded structure can have several causes: hardening shrinkage, drying shrinkage and heath development during the hardening process. Cracking of the loaded structure can be the result of tensile stresses and temperature stresses. When prefab concrete is used, all environmental circumstances can be optimized and the
manufacturing can be controlled. In general a crack forming of ≤ 0.1 mm is not a problem.
Preventing of porosity of the concrete.
This phenomenon is depending on the coherence and grain size of the cement. The coherence of the cement is dependent of the cement type, grain distribution of the aggregates, the water cement ratio and additional plasticizers. The finishing of the concrete influences the
density and surface structure.
Avoid leakage at connections. In general the water tightness of a structure is determined by the
interruptions at connections of elements. Special attentions is required at the detailing of these connections.
Reinforcement.
To limit the crack width of the concrete and therewith enlarge the water tightness and surface tightness of the concrete structure often a fine distribution of relative small diameter reinforcement bars is chosen.
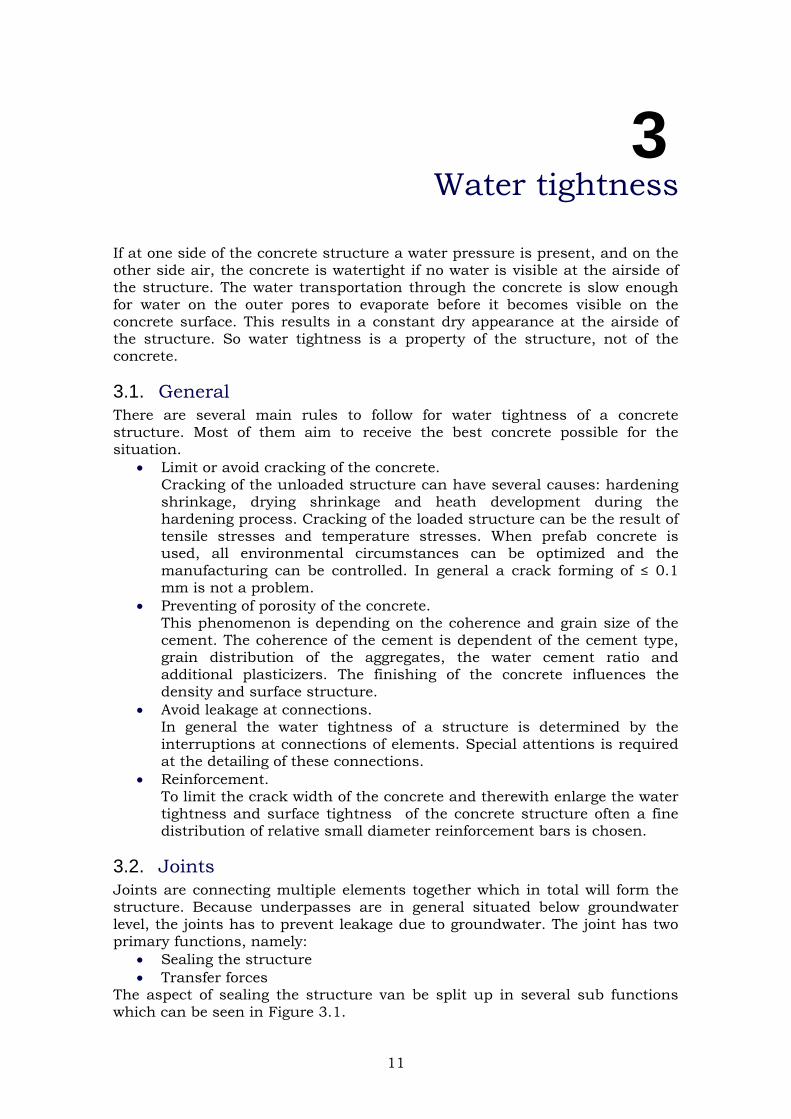
3.2. Joints
Joints are connecting multiple elements together which in total will form the structure. Because underpasses are in general situated below groundwater
level, the joints has to prevent leakage due to groundwater. The joint has two primary functions, namely:
Sealing the structure
Transfer forces The aspect of sealing the structure van be split up in several sub functions
which can be seen in Figure 3.1.
3. WATER TIGHTNESS
12
Figure 3.1: Seal function diagram
The second main function, distribution of forces, can be less important if it
just transfers compression forces. The distribution of forces takes places via pressing the rubber joint profile together. When the joint also transfers other forces a more complicated joint will be required. The following issues require additional attention:
Damage during construction and lifecycle
Verifiability of water tightness
Simplicity of manufacturing
Cost
Mounting of possible sealing profiles
Possibility of follow treatment For optimal functioning of the joint structure the most important situation is
where the joint width is so great that the sealing of the rubber gasket is insufficient. When the joint width varies between the elements a tolerance of 6-7 mm seems reasonable for a standard joint width of 25 mm.
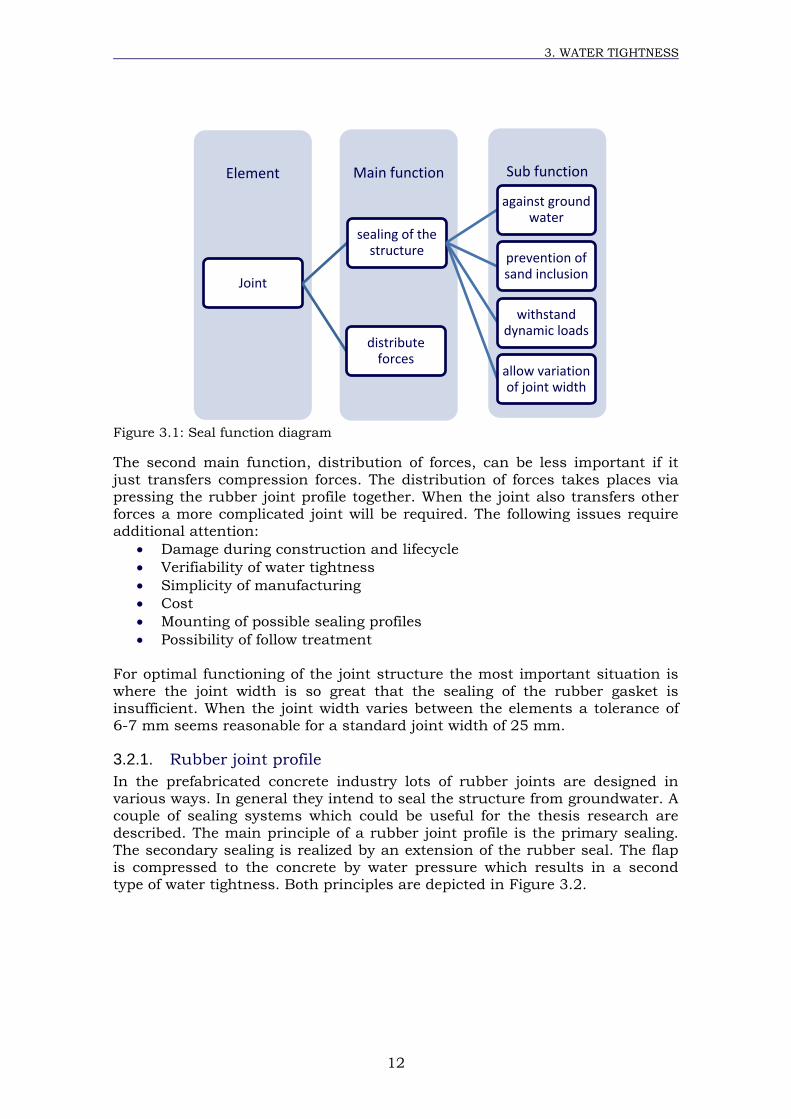
3.2.1. Rubber joint profile
In the prefabricated concrete industry lots of rubber joints are designed in various ways. In general they intend to seal the structure from groundwater. A couple of sealing systems which could be useful for the thesis research are
described. The main principle of a rubber joint profile is the primary sealing. The secondary sealing is realized by an extension of the rubber seal. The flap is compressed to the concrete by water pressure which results in a second type of water tightness. Both principles are depicted in Figure 3.2.
Sub function Main function Element
Joint
sealing of the structure
against ground water
prevention of sand inclusion
withstand dynamic loads
allow variation of joint width
distribute forces
B.G.A. VAN CASTEREN
Figure 3.2: Sealing principles [39]
Rubber joints allow small displacements or rotations of the elements connected to each other.
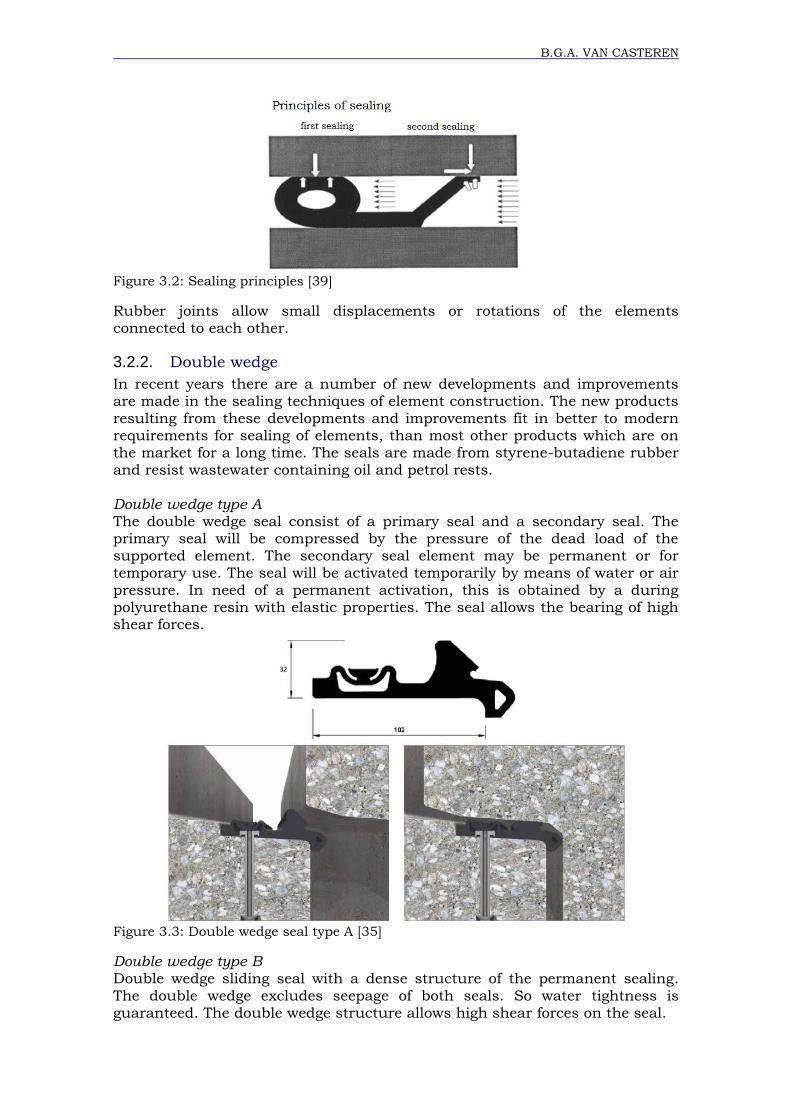
3.2.2. Double wedge
In recent years there are a number of new developments and improvements are made in the sealing techniques of element construction. The new products
resulting from these developments and improvements fit in better to modern requirements for sealing of elements, than most other products which are on the market for a long time. The seals are made from styrene-butadiene rubber
and resist wastewater containing oil and petrol rests.
Double wedge type A The double wedge seal consist of a primary seal and a secondary seal. The primary seal will be compressed by the pressure of the dead load of the supported element. The secondary seal element may be permanent or for temporary use. The seal will be activated temporarily by means of water or air
pressure. In need of a permanent activation, this is obtained by a during polyurethane resin with elastic properties. The seal allows the bearing of high shear forces.
Figure 3.3: Double wedge seal type A [35]
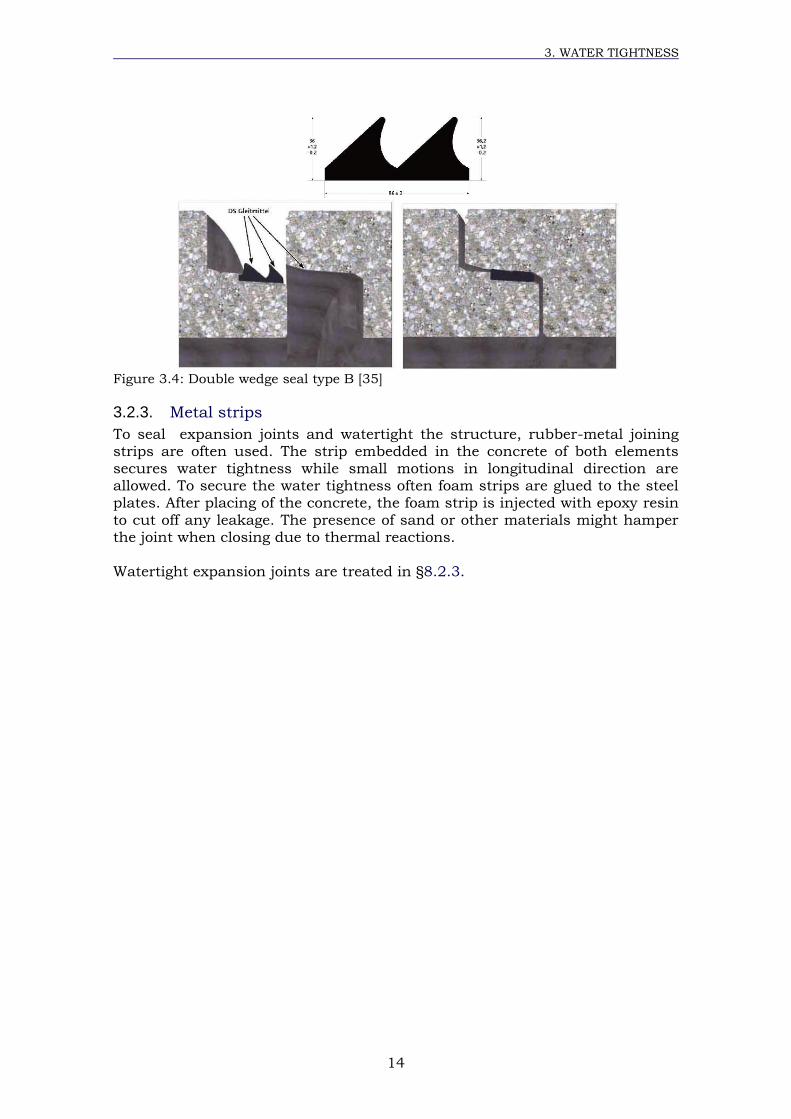
Double wedge type B Double wedge sliding seal with a dense structure of the permanent sealing.
The double wedge excludes seepage of both seals. So water tightness is guaranteed. The double wedge structure allows high shear forces on the seal.
3. WATER TIGHTNESS
14
Figure 3.4: Double wedge seal type B [35]
3.2.3. Metal strips
To seal expansion joints and watertight the structure, rubber-metal joining strips are often used. The strip embedded in the concrete of both elements
secures water tightness while small motions in longitudinal direction are allowed. To secure the water tightness often foam strips are glued to the steel plates. After placing of the concrete, the foam strip is injected with epoxy resin
to cut off any leakage. The presence of sand or other materials might hamper the joint when closing due to thermal reactions. Watertight expansion joints are treated in §8.2.3.
15
4 Transportation & crane capacity
4.1. Transportation
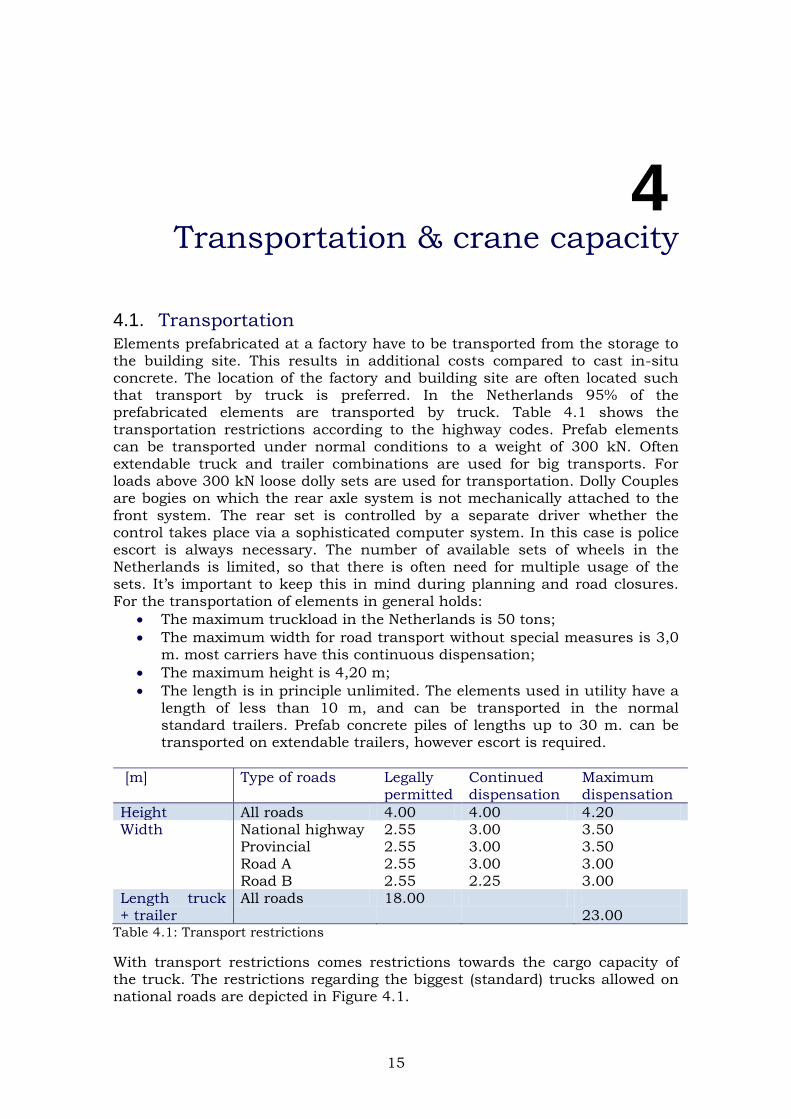
Elements prefabricated at a factory have to be transported from the storage to the building site. This results in additional costs compared to cast in-situ concrete. The location of the factory and building site are often located such that transport by truck is preferred. In the Netherlands 95% of the prefabricated elements are transported by truck. Table 4.1 shows the
transportation restrictions according to the highway codes. Prefab elements can be transported under normal conditions to a weight of 300 kN. Often
extendable truck and trailer combinations are used for big transports. For loads above 300 kN loose dolly sets are used for transportation. Dolly Couples are bogies on which the rear axle system is not mechanically attached to the
front system. The rear set is controlled by a separate driver whether the control takes place via a sophisticated computer system. In this case is police escort is always necessary. The number of available sets of wheels in the Netherlands is limited, so that there is often need for multiple usage of the sets. It’s important to keep this in mind during planning and road closures.
For the transportation of elements in general holds:
The maximum truckload in the Netherlands is 50 tons;
The maximum width for road transport without special measures is 3,0 m. most carriers have this continuous dispensation;
The maximum height is 4,20 m;
The length is in principle unlimited. The elements used in utility have a
length of less than 10 m, and can be transported in the normal standard trailers. Prefab concrete piles of lengths up to 30 m. can be transported on extendable trailers, however escort is required.
[m] Type of roads Legally permitted
Continued dispensation
Maximum dispensation
Height All roads 4.00 4.00 4.20 Width National highway
Provincial Road A Road B
2.55 2.55 2.55 2.55
3.00 3.00 3.00 2.25
3.50 3.50 3.00 3.00
Length truck + trailer
All roads 18.00 23.00
Table 4.1: Transport restrictions
With transport restrictions comes restrictions towards the cargo capacity of the truck. The restrictions regarding the biggest (standard) trucks allowed on national roads are depicted in Figure 4.1.
4. TRANSPORT & CRANE CAPACITY
16
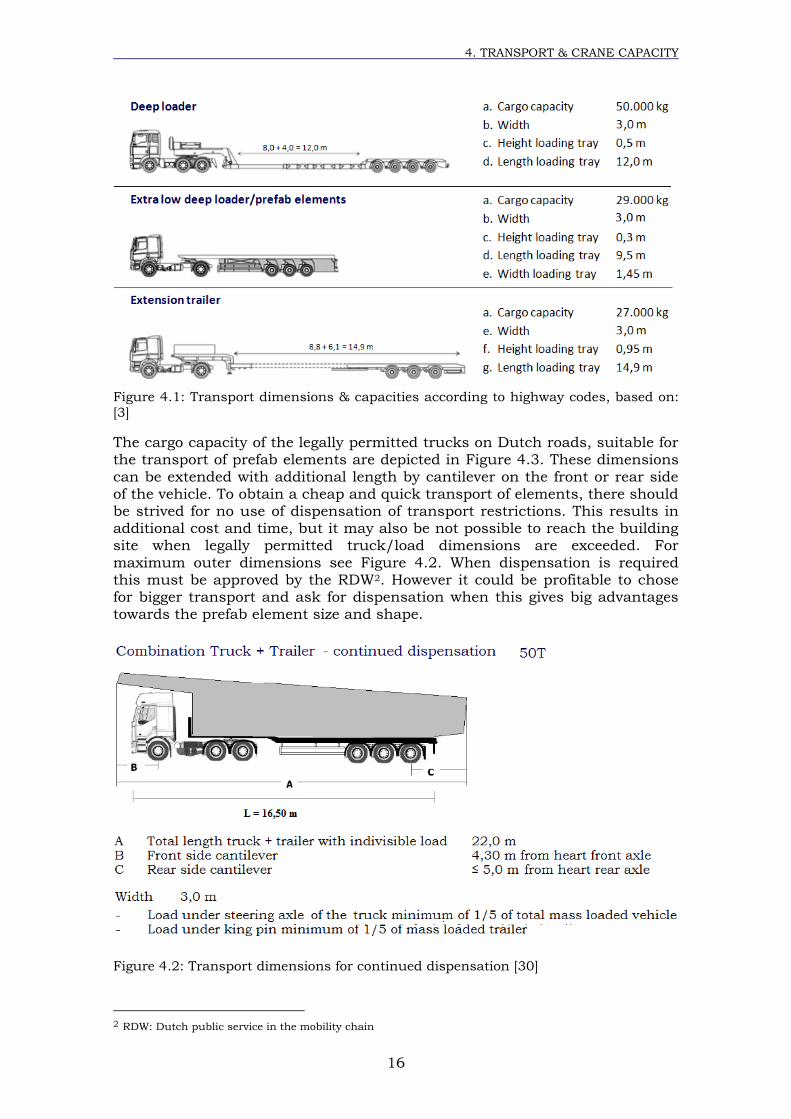
Figure 4.1: Transport dimensions & capacities according to highway codes, based on: [3]
The cargo capacity of the legally permitted trucks on Dutch roads, suitable for
the transport of prefab elements are depicted in Figure 4.3. These dimensions
can be extended with additional length by cantilever on the front or rear side of the vehicle. To obtain a cheap and quick transport of elements, there should be strived for no use of dispensation of transport restrictions. This results in additional cost and time, but it may also be not possible to reach the building site when legally permitted truck/load dimensions are exceeded. For
maximum outer dimensions see Figure 4.2. When dispensation is required this must be approved by the RDW2. However it could be profitable to chose for bigger transport and ask for dispensation when this gives big advantages towards the prefab element size and shape.
Figure 4.2: Transport dimensions for continued dispensation [30]
2 RDW: Dutch public service in the mobility chain
B.G.A. VAN CASTEREN
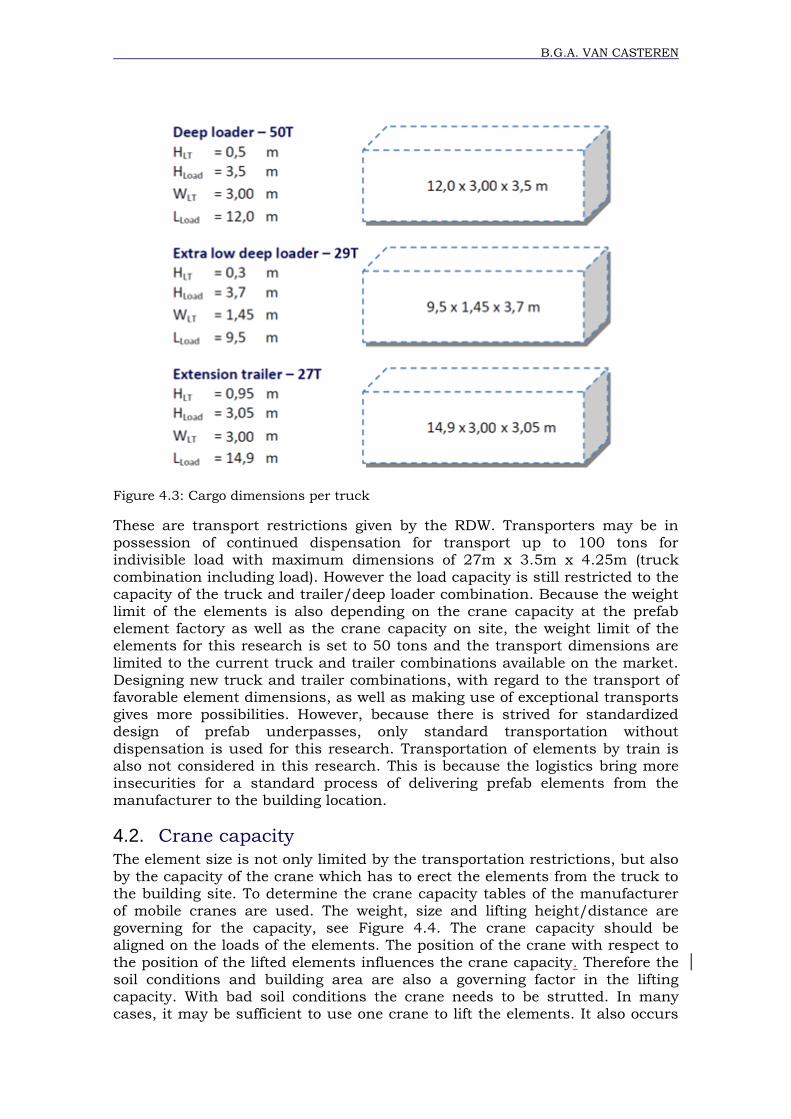
Figure 4.3: Cargo dimensions per truck
These are transport restrictions given by the RDW. Transporters may be in possession of continued dispensation for transport up to 100 tons for indivisible load with maximum dimensions of 27m x 3.5m x 4.25m (truck
combination including load). However the load capacity is still restricted to the capacity of the truck and trailer/deep loader combination. Because the weight limit of the elements is also depending on the crane capacity at the prefab element factory as well as the crane capacity on site, the weight limit of the elements for this research is set to 50 tons and the transport dimensions are
limited to the current truck and trailer combinations available on the market. Designing new truck and trailer combinations, with regard to the transport of favorable element dimensions, as well as making use of exceptional transports gives more possibilities. However, because there is strived for standardized design of prefab underpasses, only standard transportation without
dispensation is used for this research. Transportation of elements by train is also not considered in this research. This is because the logistics bring more
insecurities for a standard process of delivering prefab elements from the manufacturer to the building location.
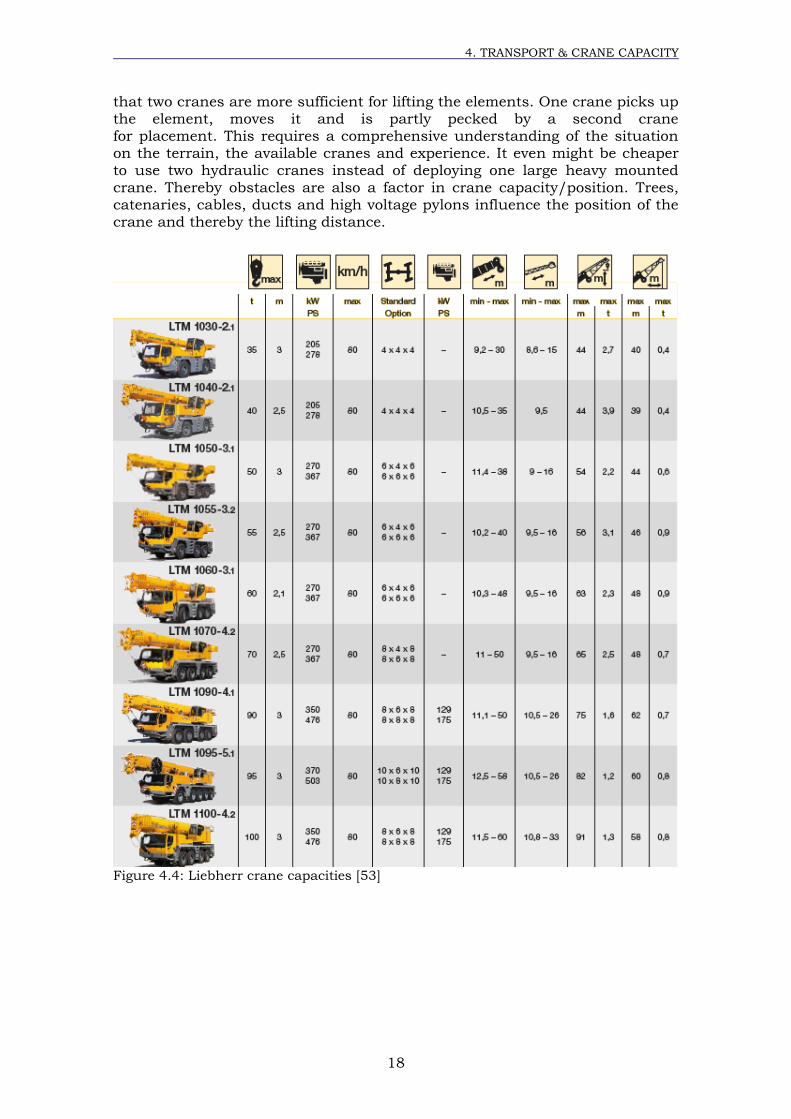
4.2. Crane capacity
The element size is not only limited by the transportation restrictions, but also
by the capacity of the crane which has to erect the elements from the truck to the building site. To determine the crane capacity tables of the manufacturer of mobile cranes are used. The weight, size and lifting height/distance are governing for the capacity, see Figure 4.4. The crane capacity should be aligned on the loads of the elements. The position of the crane with respect to
the position of the lifted elements influences the crane capacity. Therefore the soil conditions and building area are also a governing factor in the lifting capacity. With bad soil conditions the crane needs to be strutted. In many cases, it may be sufficient to use one crane to lift the elements. It also occurs
4. TRANSPORT & CRANE CAPACITY
18
that two cranes are more sufficient for lifting the elements. One crane picks up the element, moves it and is partly pecked by a second crane for placement. This requires a comprehensive understanding of the situation
on the terrain, the available cranes and experience. It even might be cheaper to use two hydraulic cranes instead of deploying one large heavy mounted
crane. Thereby obstacles are also a factor in crane capacity/position. Trees, catenaries, cables, ducts and high voltage pylons influence the position of the crane and thereby the lifting distance.
Figure 4.4: Liebherr crane capacities [53]
19
5 Design input
In order to start a (standardisable) underpass design, which is applicable on the PHS3 track, all important criteria must be analysed. Because it is not usual to implement railway underpasses in prefabricated concrete, it is important to know which design principles and boundaries should be used for
the research.
5.1. Environmental parameters
In order to make the research to the applicability of prefabricated concrete for underpasses interesting for Movares, it is important to consider common situations on the PHS track. Graduate student B.C. van Viegen inventoried all railway crossings on the PHS track. The results from the inventory of his
Master thesis “Underpasses for railways – standardization of the design” [37]
will be used as input for this thesis. The following parameters are investigated:
Crossing type
Location
Crossing angle
Number of railway tracks
Road type
Altitude railway track
Soil condition
Another important parameter is groundwater level. However, due to the high variation of groundwater levels, this is not taken into account in the inventory. The interpretation of the groundwater level will be treated in §5.6.1.
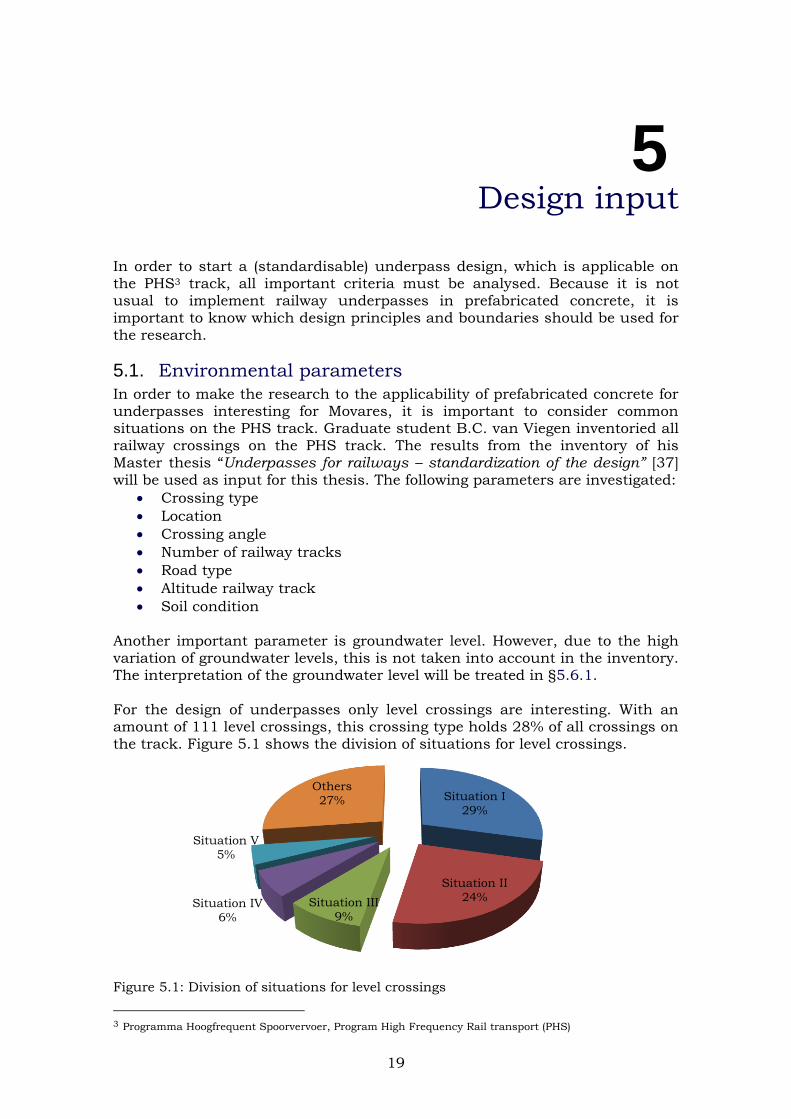
For the design of underpasses only level crossings are interesting. With an amount of 111 level crossings, this crossing type holds 28% of all crossings on the track. Figure 5.1 shows the division of situations for level crossings.
Figure 5.1: Division of situations for level crossings
3 Programma Hoogfrequent Spoorvervoer, Program High Frequency Rail transport (PHS)
Situation I
29%
Situation II
24% Situation III
9% Situation IV
6%
Situation V
5%
Others
27%
5. DESIGN INPUT
20
Situation I (29%):
Location: countryside and semi-urban (the two options make no virtual
differences to the integration of the underpass in the area)
Crossing angle: ±90° (or adaptable to ±90°)
Number of railway tracks: 2 tracks
Road type: access road (road type A)
Altitude railway: ground level
Soil condition: sand and soft soil
Situation II (24%):
Location: countryside and semi-urban (the two options make no virtual
differences to the integration of the underpass in the area)
Crossing angle: ±90° (or adaptable to ±90°)
Number of railway tracks: 2 tracks
Road type: access road (road type A)
Altitude railway: half in elevation
Soil condition: sand and soft soil
Ground water level: favourable for underpass construction Situation III (9%):
Location: urban
Crossing angle: ±90° (or adaptable to ±90°)
Number of railway tracks: 2 tracks
Road type: access road (road type B)
Altitude railway: ground level
Soil condition: sand and soft soil
Situation IV (6%):
Location: urban
Crossing angle: not ±90° (nor adaptable to ±90°)
Number of railway tracks: 2 tracks
Road type: access road (road type B)
Altitude railway: ground level
Soil condition: sand and soft soil
Situation V (5%):
Location: countryside and semi-urban (the two options make no virtual
differences to the integration of the underpass in the area)
Crossing angle: ±90° (or adaptable to ±90°)
Number of railway tracks: 2 tracks
Road type: distributor road (road type A)
Altitude railway: ground level
Soil condition: sand and soft soil
B.G.A. VAN CASTEREN
5.1.1. Conclusions
Based on the inventory obtained from previous research the following
conclusions are drawn:
28% of all crossings on the PHS track are level crossings.
Situation I and II are quite similar to each other and together cover 53%
of all level crossings. They only differ in altitude of the railway track.
The group of level crossings which has the highest priority to be
converted to an underpass is the group that is most difficult to standardize (urban area; distributor road). Similarly the group that is easiest to convert to a standard design has les demands for adaption to
an underpass (countryside; access road).
With respect to the division of level crossings it seems most feasible to use the profiles of situation I and II as a starting point for a
(standardized) underpass design. Together they cover 53% off all crossings on the PHS track.
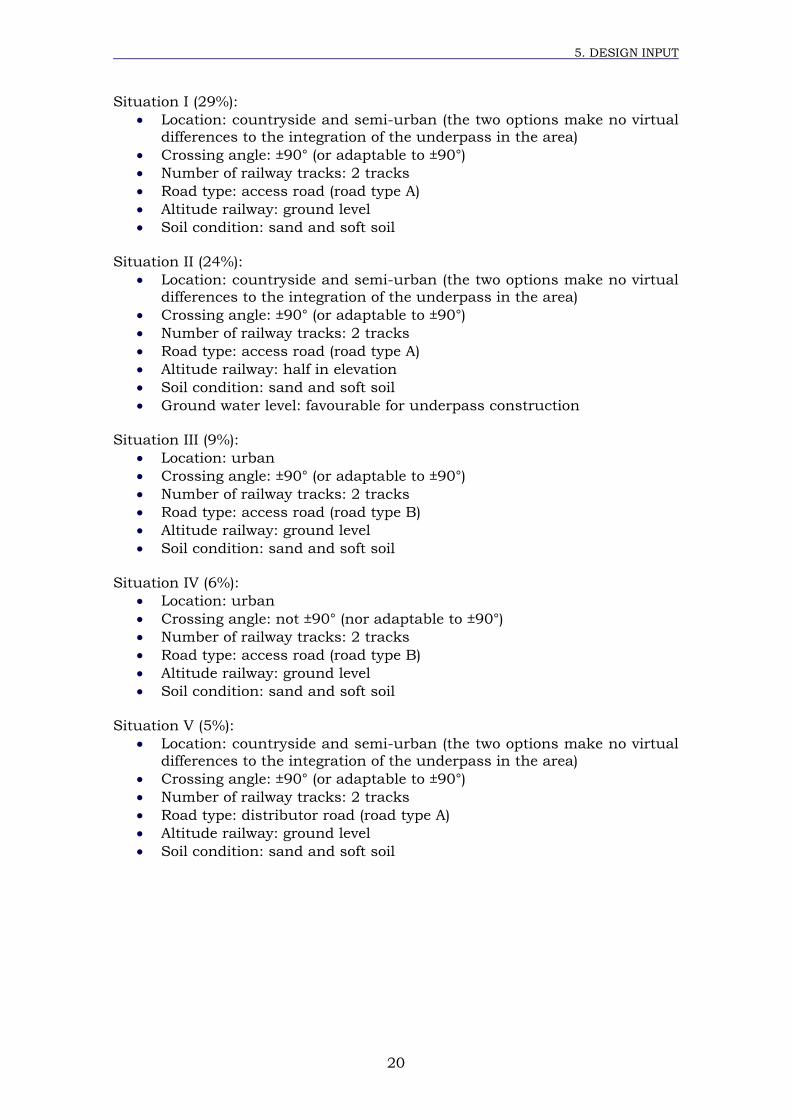
5.2. Coordinate system
A coordinate system in introduced for clear explanation of cross-sections and dimensions of the underpass. When the report states x-, y- or z- direction it refers to the coordinate system depicted in Figure 5.2.
Figure 5.2: Coordinate system of the underpass
5.3. Clearance gauge for rail traffic
The clearance gauge (in Dutch: PVR4) indicates the boundaries of the surface in which no other objects may occur over the traffic. The clearance gauge is used to determine the dimensions of the railway crossings in the y-direction. The clearance gauge is linked to the actual location of the railway track.
5.3.1. Norms
The norms relating to the design and construct of civil structures are mainly
defined in national and international norms. The OVS5 has captured the additional and exceptional provisions for by rail traffic ridden structures.
5.3.2. PVR-GC
For main tracks holds the clearance gauge “PVR-GC”6. The dimensions are derived from reference profile GC as defined in EN15273-2, §A.3.3.2. The PVR-GC has to be applied for all cases of:
Construction of new lines
Large modification work to existing lines
Construction of new stations
Placing of permanent and temporary objects near the railway track
4 PVR, Profiel van Vrije Ruimte 5 Ontwerp Voorschriften voor de Spoorwegbouw, Design Rules for Railway structures 6 Clearance gauge – Space reservation
5. DESIGN INPUT
22
5.3.3. Red Measuring area
The Red Measuring area (in Dutch: Rode Meetgebied, RM) is a non-legally
determined widening and augmentation of the PVR and has to be applied for
freight tracks and for tracks which are partly used by freight transport. Within the RM are no fixed objects permitted. The RM is defined in the “Regeling Spoorverkeer”. The RM is defined for the purpose of extraordinary traffic. The RM allows cargo’s within certain dimensions outside the gauge of the PVR on
the tracks. The RM is depicted in Figure 5.4.
5.3.4. Track distance
With multiple tracks apply at least the in OVS00056-4.2 “Baan en Bovenbouw – Sporen dwarsprofiel” specified track distances. A structure needs to be suitable for a track distance with a minimum of 4,25m center-to-center distance. Larger track distances are indicated in the project specifications.
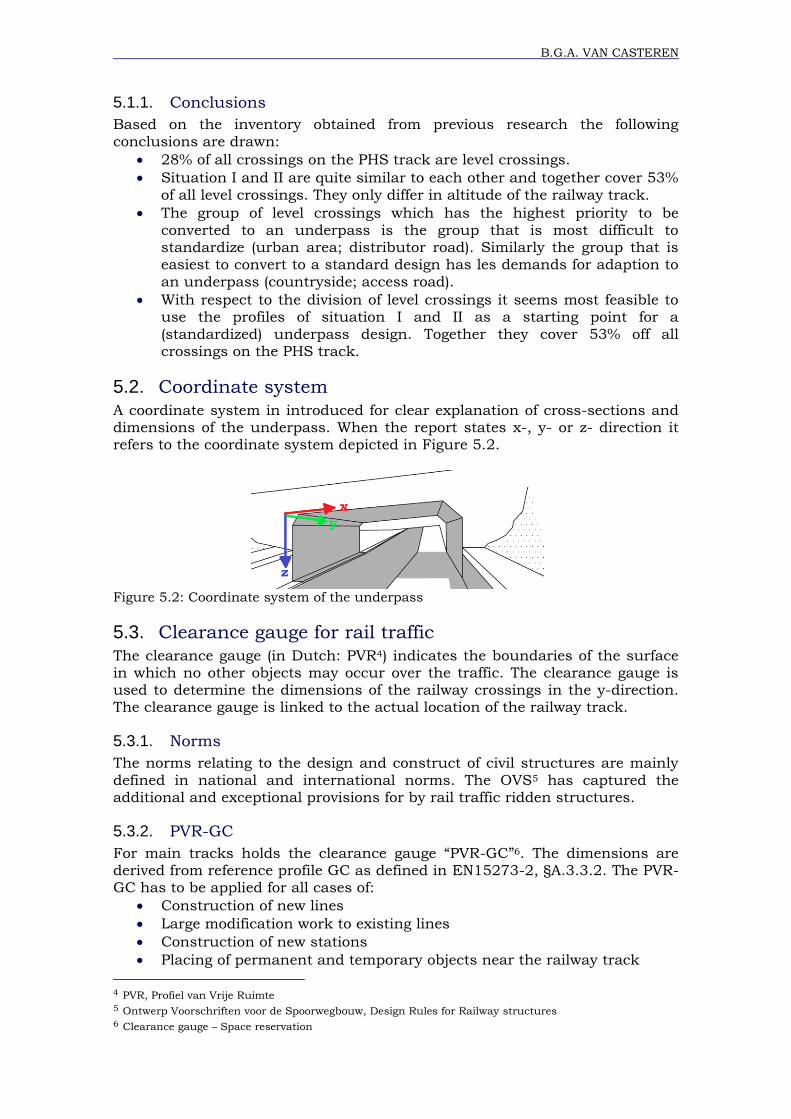
5.3.5. Dimensions
The clearance gauge for railways determines the width of the structure to be crossed. Depending on the type of railway and the amount of tracks, the
profile can be determined. Figure 5.3 depicts the main definitions on the track bed.
Figure 5.3: Schematization of railway track definitions [25]
Definitions of Figure 5.3:
As spoor/Centerline track: Imaginary line in the longitudinal direction of the track, located in the
middle of both rail bars and on the horizontal line which is tangent to the upper side of both bars.
Bovenkant spoorstaaf (BS)/Upper side rail: The level of a horizontal line in the plane transverse to the track, which
touches the upper side of the lowest rail bar.
Verticaal alignement/Vertical alignment: The projection of BS on a vertical plane through the center line track.
Horizontaal alignement/Horizontal alignment: The projection of center line track on a horizontal plane.
Verkanting/Superelevation: Height difference in transverse direction between the rail bars of one track. Superelevation is realized by placing the rail bar on the outer side
of the curvature higher than the inner side bar. In Figure 5.4 the clearance gauge of the main situation, as determined in §5.1, are schematized.
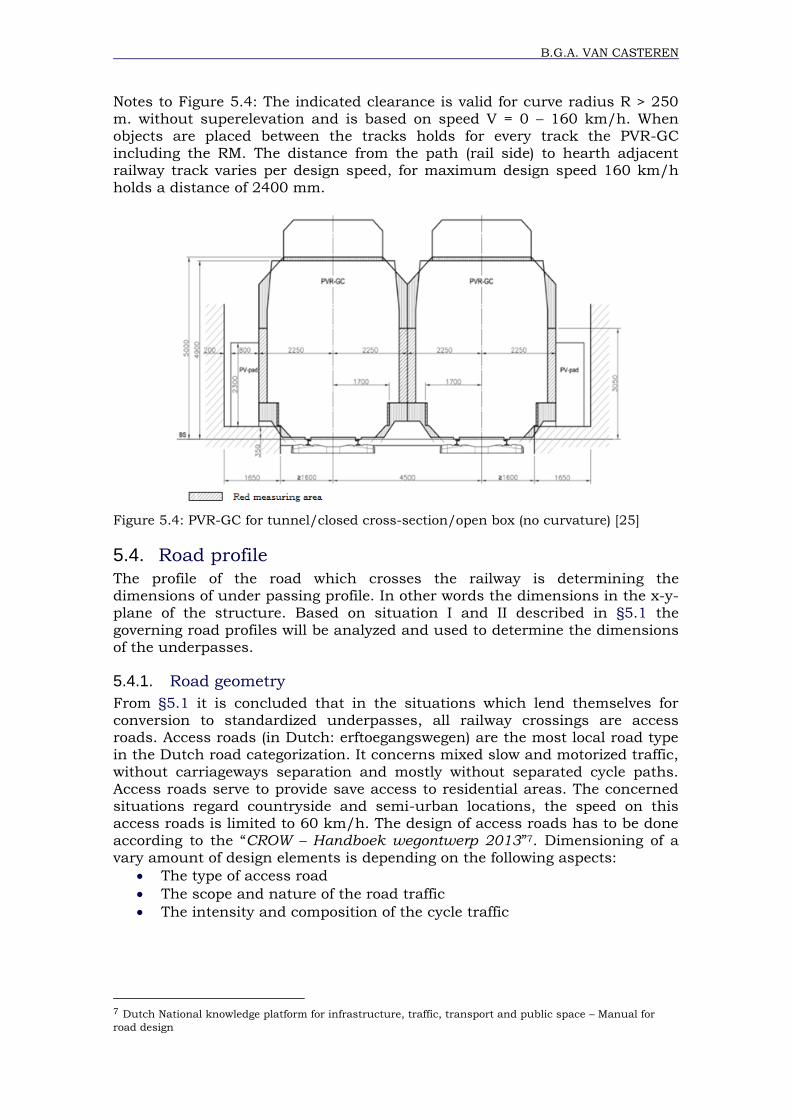
B.G.A. VAN CASTEREN
Notes to Figure 5.4: The indicated clearance is valid for curve radius R > 250 m. without superelevation and is based on speed V = 0 – 160 km/h. When objects are placed between the tracks holds for every track the PVR-GC
including the RM. The distance from the path (rail side) to hearth adjacent railway track varies per design speed, for maximum design speed 160 km/h
holds a distance of 2400 mm.
Figure 5.4: PVR-GC for tunnel/closed cross-section/open box (no curvature) [25]
5.4. Road profile
The profile of the road which crosses the railway is determining the dimensions of under passing profile. In other words the dimensions in the x-y-plane of the structure. Based on situation I and II described in §5.1 the
governing road profiles will be analyzed and used to determine the dimensions of the underpasses.
5.4.1. Road geometry
From §5.1 it is concluded that in the situations which lend themselves for conversion to standardized underpasses, all railway crossings are access roads. Access roads (in Dutch: erftoegangswegen) are the most local road type in the Dutch road categorization. It concerns mixed slow and motorized traffic,
without carriageways separation and mostly without separated cycle paths. Access roads serve to provide save access to residential areas. The concerned situations regard countryside and semi-urban locations, the speed on this access roads is limited to 60 km/h. The design of access roads has to be done according to the “CROW – Handboek wegontwerp 2013”7. Dimensioning of a
vary amount of design elements is depending on the following aspects:
The type of access road
The scope and nature of the road traffic
The intensity and composition of the cycle traffic
7 Dutch National knowledge platform for infrastructure, traffic, transport and public space – Manual for
road design
5. DESIGN INPUT
24
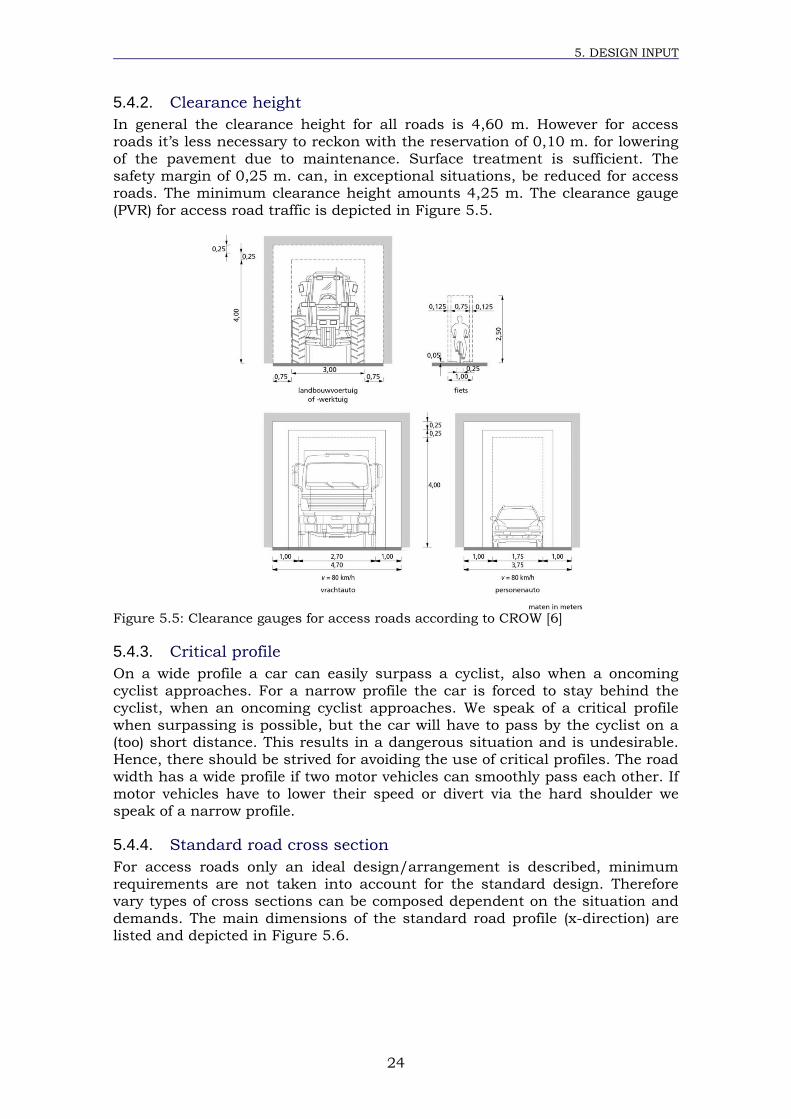
5.4.2. Clearance height
In general the clearance height for all roads is 4,60 m. However for access
roads it’s less necessary to reckon with the reservation of 0,10 m. for lowering
of the pavement due to maintenance. Surface treatment is sufficient. The safety margin of 0,25 m. can, in exceptional situations, be reduced for access roads. The minimum clearance height amounts 4,25 m. The clearance gauge (PVR) for access road traffic is depicted in Figure 5.5.
Figure 5.5: Clearance gauges for access roads according to CROW [6]
5.4.3. Critical profile
On a wide profile a car can easily surpass a cyclist, also when a oncoming
cyclist approaches. For a narrow profile the car is forced to stay behind the cyclist, when an oncoming cyclist approaches. We speak of a critical profile when surpassing is possible, but the car will have to pass by the cyclist on a (too) short distance. This results in a dangerous situation and is undesirable. Hence, there should be strived for avoiding the use of critical profiles. The road
width has a wide profile if two motor vehicles can smoothly pass each other. If motor vehicles have to lower their speed or divert via the hard shoulder we speak of a narrow profile.
5.4.4. Standard road cross section
For access roads only an ideal design/arrangement is described, minimum requirements are not taken into account for the standard design. Therefore vary types of cross sections can be composed dependent on the situation and
demands. The main dimensions of the standard road profile (x-direction) are listed and depicted in Figure 5.6.
B.G.A. VAN CASTEREN
Figure 5.6: Standard cross section access road type 1 with one side cycle path for 2 directions according to CROW [6]
5.4.5. Road design
The standard road design described in §5.4.4 provide minimum and usual/ideal dimensions for road elements. These elements indicate the
location on the road and corresponding safety of the road users. Hence, a proper consideration of road dimensions should be made for the underpass. Because of the lack to research of the width of the obstacle-free zone on access
roads, there cannot be made clear conclusions on the dimensioning of the obstacle-free zone. This leaves a certain freedom in designing the road cross-section.
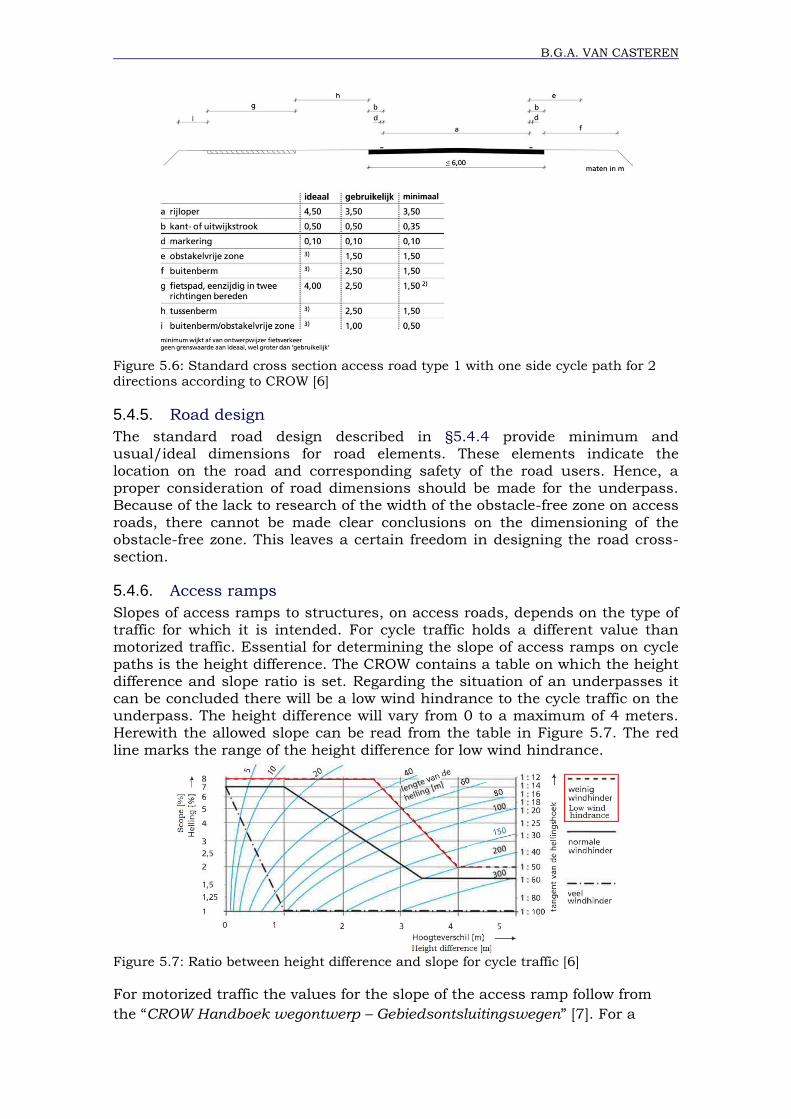
5.4.6. Access ramps
Slopes of access ramps to structures, on access roads, depends on the type of traffic for which it is intended. For cycle traffic holds a different value than motorized traffic. Essential for determining the slope of access ramps on cycle
paths is the height difference. The CROW contains a table on which the height difference and slope ratio is set. Regarding the situation of an underpasses it can be concluded there will be a low wind hindrance to the cycle traffic on the underpass. The height difference will vary from 0 to a maximum of 4 meters. Herewith the allowed slope can be read from the table in Figure 5.7. The red
line marks the range of the height difference for low wind hindrance.
Figure 5.7: Ratio between height difference and slope for cycle traffic [6]
For motorized traffic the values for the slope of the access ramp follow from
the “CROW Handboek wegontwerp – Gebiedsontsluitingswegen” [7]. For a
5. DESIGN INPUT
26
maximum speed of 60 km/h the ideal slope is 7% and the maximum allowed
slope is 12%.
5.4.7. Cycle path
The consideration of one-sided or two-sided cycle paths is often difficult. From
the consideration of comfort, safety, stimulating bicycle traffic, uniformity and continuity, there always has to be strived for two-sided, one-direction cycle paths. Only when on valid reason two-sided cycle paths cannot be realized, the alternative of a one-sided cycle path is discussed. Dimensions for bicycle underpasses are depicted in Figure 5.8 and Figure 5.9.
Figure 5.8: Pedestrian and bicycle underpass with straight walls [5]
Figure 5.9: Pedestrian and bicycle underpass with corridor walls [5]
Parameters on Figure 5.8 & Figure 5.8:
a = 0,50 m. f ≥ 2,0 – 4,0 m. depending on the traffic intensity h ≥ 2,5 m. v ≥ 2,0 m.
5.5. Underpass dimensions
The information from previous paragraphs provides enough information to determine the underpass dimensions.
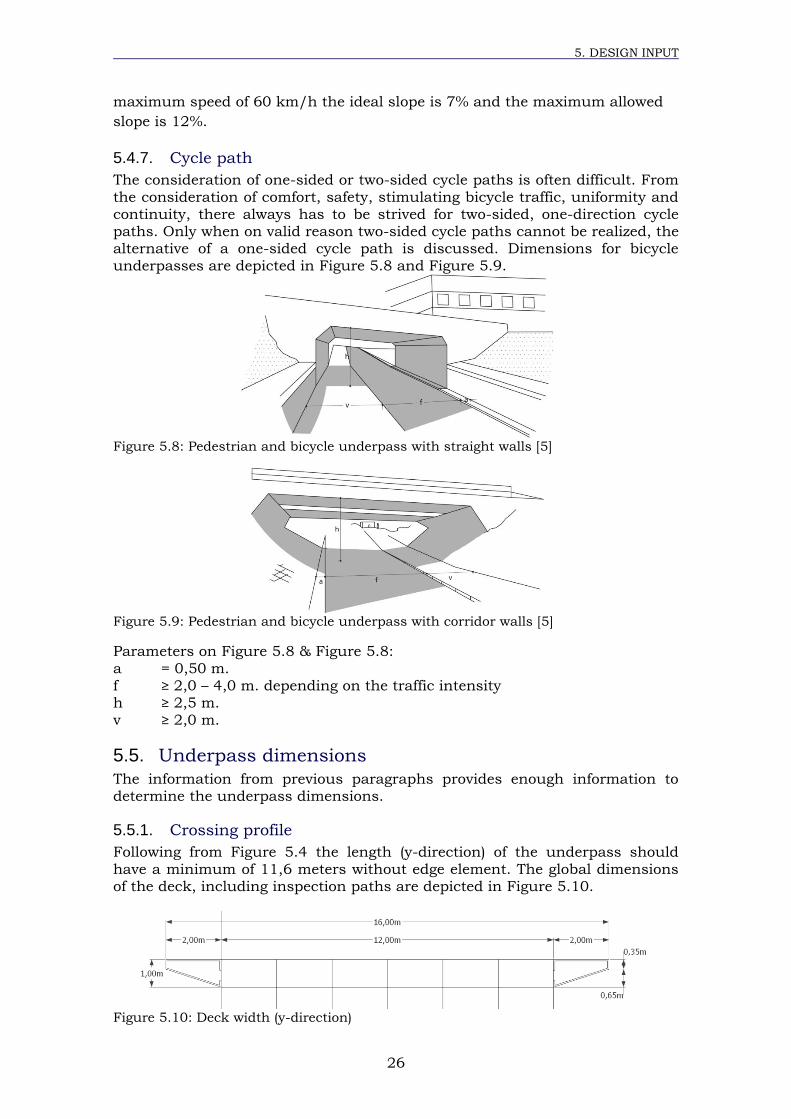
5.5.1. Crossing profile
Following from Figure 5.4 the length (y-direction) of the underpass should
have a minimum of 11,6 meters without edge element. The global dimensions of the deck, including inspection paths are depicted in Figure 5.10.
Figure 5.10: Deck width (y-direction)
B.G.A. VAN CASTEREN
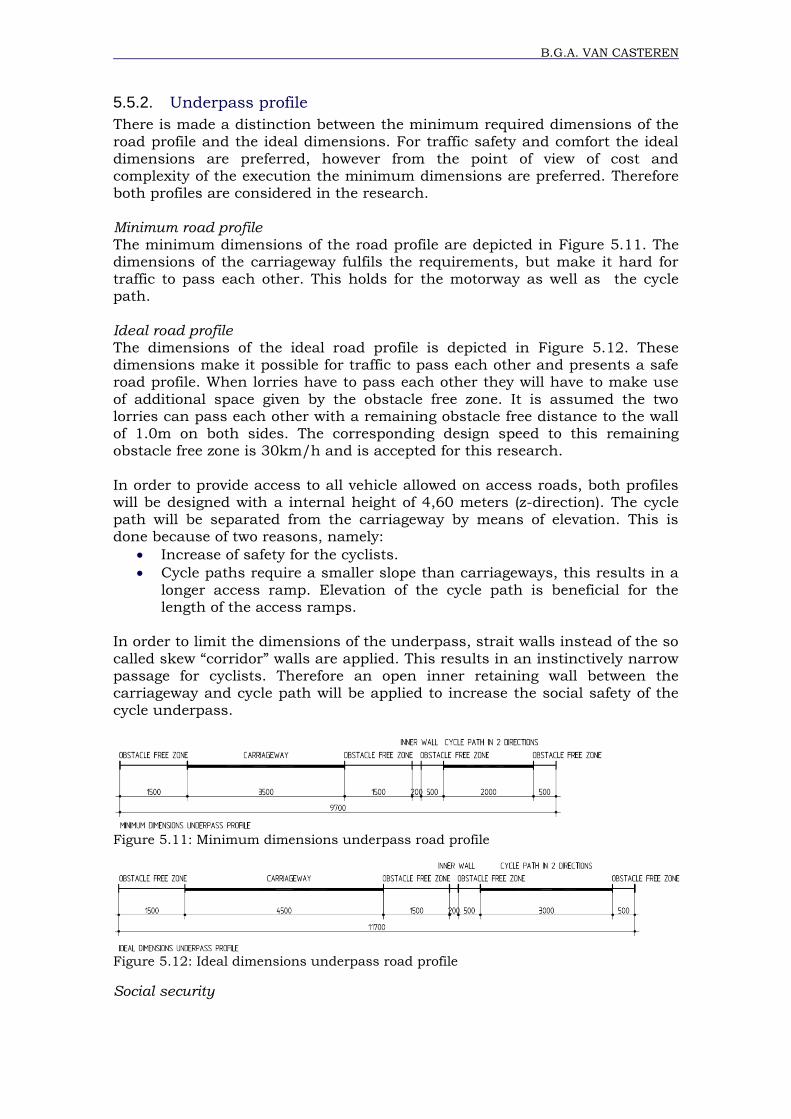
5.5.2. Underpass profile
There is made a distinction between the minimum required dimensions of the
road profile and the ideal dimensions. For traffic safety and comfort the ideal
dimensions are preferred, however from the point of view of cost and complexity of the execution the minimum dimensions are preferred. Therefore both profiles are considered in the research.
Minimum road profile The minimum dimensions of the road profile are depicted in Figure 5.11. The dimensions of the carriageway fulfils the requirements, but make it hard for traffic to pass each other. This holds for the motorway as well as the cycle path.
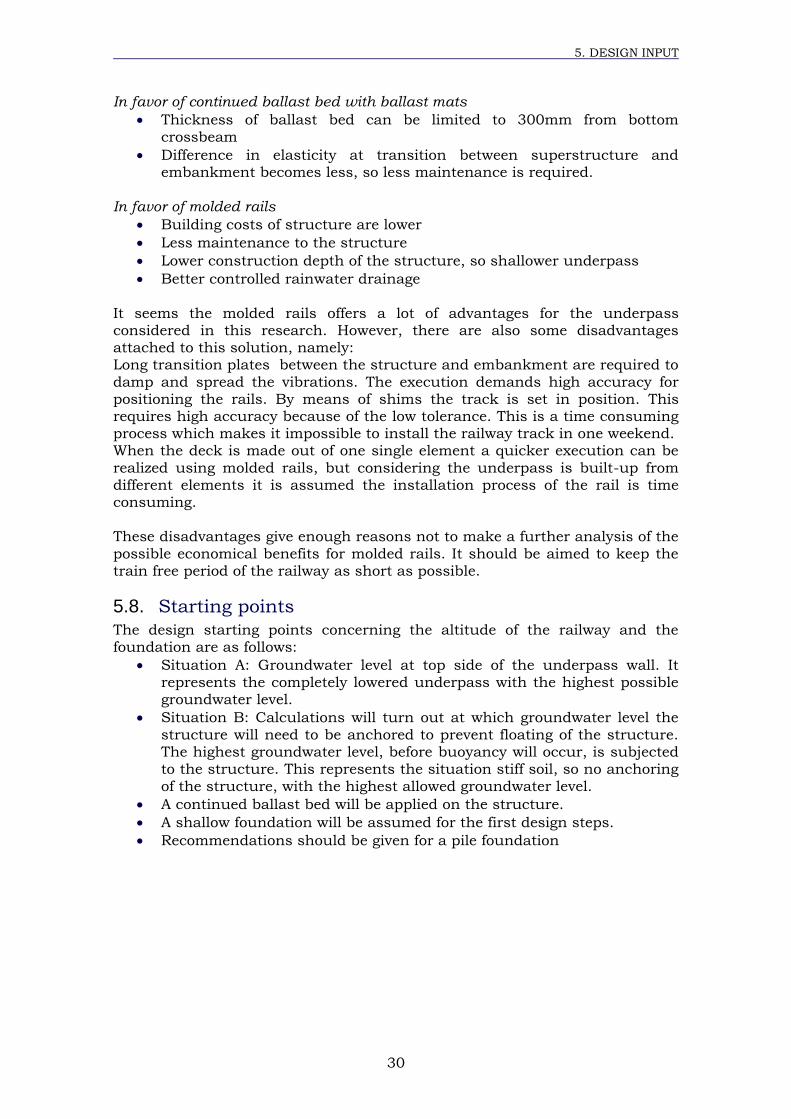
Ideal road profile The dimensions of the ideal road profile is depicted in Figure 5.12. These dimensions make it possible for traffic to pass each other and presents a safe road profile. When lorries have to pass each other they will have to make use
of additional space given by the obstacle free zone. It is assumed the two lorries can pass each other with a remaining obstacle free distance to the wall of 1.0m on both sides. The corresponding design speed to this remaining obstacle free zone is 30km/h and is accepted for this research.
In order to provide access to all vehicle allowed on access roads, both profiles will be designed with a internal height of 4,60 meters (z-direction). The cycle path will be separated from the carriageway by means of elevation. This is done because of two reasons, namely:
Increase of safety for the cyclists.
Cycle paths require a smaller slope than carriageways, this results in a
longer access ramp. Elevation of the cycle path is beneficial for the length of the access ramps.
In order to limit the dimensions of the underpass, strait walls instead of the so
called skew “corridor” walls are applied. This results in an instinctively narrow passage for cyclists. Therefore an open inner retaining wall between the carriageway and cycle path will be applied to increase the social safety of the cycle underpass.
Figure 5.11: Minimum dimensions underpass road profile
Figure 5.12: Ideal dimensions underpass road profile
Social security
5. DESIGN INPUT
28
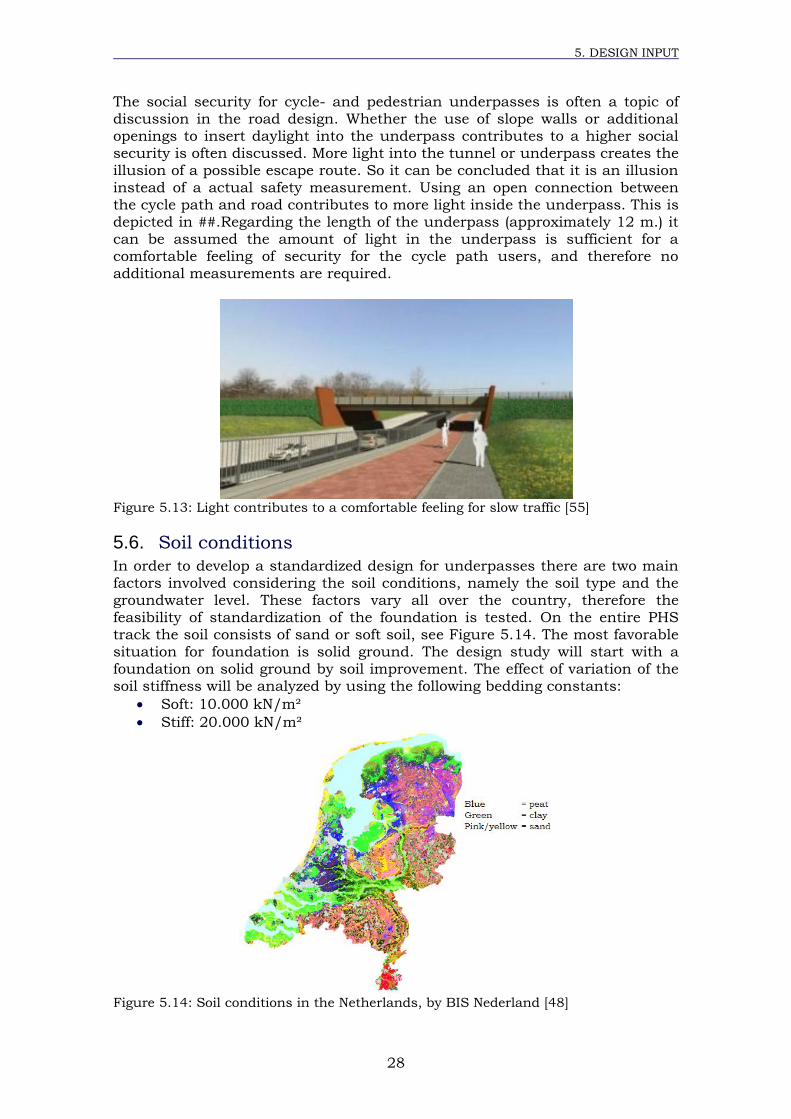
The social security for cycle- and pedestrian underpasses is often a topic of discussion in the road design. Whether the use of slope walls or additional openings to insert daylight into the underpass contributes to a higher social
security is often discussed. More light into the tunnel or underpass creates the illusion of a possible escape route. So it can be concluded that it is an illusion
instead of a actual safety measurement. Using an open connection between the cycle path and road contributes to more light inside the underpass. This is depicted in ##.Regarding the length of the underpass (approximately 12 m.) it can be assumed the amount of light in the underpass is sufficient for a comfortable feeling of security for the cycle path users, and therefore no
additional measurements are required.
Figure 5.13: Light contributes to a comfortable feeling for slow traffic [55]
5.6. Soil conditions
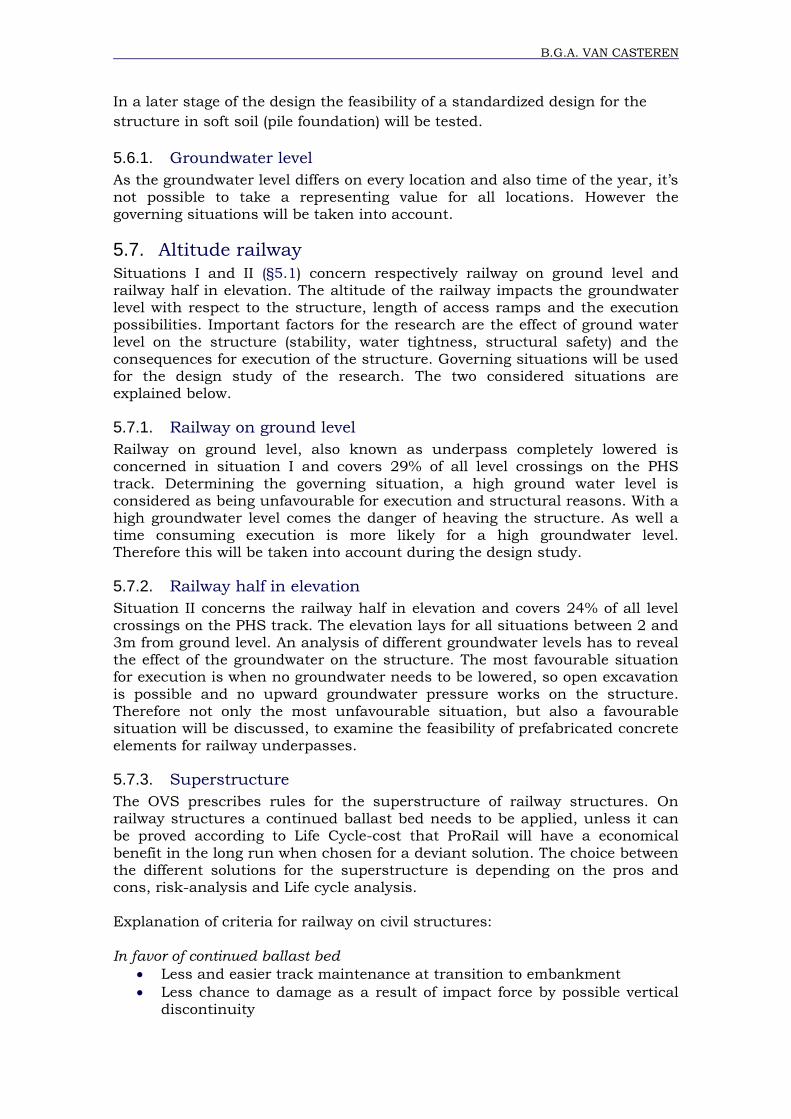
In order to develop a standardized design for underpasses there are two main factors involved considering the soil conditions, namely the soil type and the groundwater level. These factors vary all over the country, therefore the
feasibility of standardization of the foundation is tested. On the entire PHS track the soil consists of sand or soft soil, see Figure 5.14. The most favorable situation for foundation is solid ground. The design study will start with a foundation on solid ground by soil improvement. The effect of variation of the soil stiffness will be analyzed by using the following bedding constants:
Soft: 10.000 kN/m²
Stiff: 20.000 kN/m²
Figure 5.14: Soil conditions in the Netherlands, by BIS Nederland [48]
B.G.A. VAN CASTEREN
In a later stage of the design the feasibility of a standardized design for the
structure in soft soil (pile foundation) will be tested.
5.6.1. Groundwater level
As the groundwater level differs on every location and also time of the year, it’s
not possible to take a representing value for all locations. However the governing situations will be taken into account.
5.7. Altitude railway
Situations I and II (§5.1) concern respectively railway on ground level and railway half in elevation. The altitude of the railway impacts the groundwater level with respect to the structure, length of access ramps and the execution possibilities. Important factors for the research are the effect of ground water
level on the structure (stability, water tightness, structural safety) and the consequences for execution of the structure. Governing situations will be used for the design study of the research. The two considered situations are explained below.
5.7.1. Railway on ground level
Railway on ground level, also known as underpass completely lowered is
concerned in situation I and covers 29% of all level crossings on the PHS
track. Determining the governing situation, a high ground water level is considered as being unfavourable for execution and structural reasons. With a high groundwater level comes the danger of heaving the structure. As well a time consuming execution is more likely for a high groundwater level. Therefore this will be taken into account during the design study.
5.7.2. Railway half in elevation
Situation II concerns the railway half in elevation and covers 24% of all level
crossings on the PHS track. The elevation lays for all situations between 2 and 3m from ground level. An analysis of different groundwater levels has to reveal the effect of the groundwater on the structure. The most favourable situation for execution is when no groundwater needs to be lowered, so open excavation is possible and no upward groundwater pressure works on the structure.
Therefore not only the most unfavourable situation, but also a favourable situation will be discussed, to examine the feasibility of prefabricated concrete elements for railway underpasses.
5.7.3. Superstructure
The OVS prescribes rules for the superstructure of railway structures. On railway structures a continued ballast bed needs to be applied, unless it can be proved according to Life Cycle-cost that ProRail will have a economical
benefit in the long run when chosen for a deviant solution. The choice between the different solutions for the superstructure is depending on the pros and cons, risk-analysis and Life cycle analysis. Explanation of criteria for railway on civil structures:
In favor of continued ballast bed
Less and easier track maintenance at transition to embankment
Less chance to damage as a result of impact force by possible vertical discontinuity
5. DESIGN INPUT
30
In favor of continued ballast bed with ballast mats
Thickness of ballast bed can be limited to 300mm from bottom
crossbeam
Difference in elasticity at transition between superstructure and embankment becomes less, so less maintenance is required.
In favor of molded rails
Building costs of structure are lower
Less maintenance to the structure
Lower construction depth of the structure, so shallower underpass
Better controlled rainwater drainage
It seems the molded rails offers a lot of advantages for the underpass considered in this research. However, there are also some disadvantages attached to this solution, namely: Long transition plates between the structure and embankment are required to
damp and spread the vibrations. The execution demands high accuracy for positioning the rails. By means of shims the track is set in position. This requires high accuracy because of the low tolerance. This is a time consuming process which makes it impossible to install the railway track in one weekend. When the deck is made out of one single element a quicker execution can be
realized using molded rails, but considering the underpass is built-up from different elements it is assumed the installation process of the rail is time consuming. These disadvantages give enough reasons not to make a further analysis of the
possible economical benefits for molded rails. It should be aimed to keep the train free period of the railway as short as possible.
5.8. Starting points
The design starting points concerning the altitude of the railway and the foundation are as follows:
Situation A: Groundwater level at top side of the underpass wall. It
represents the completely lowered underpass with the highest possible groundwater level.
Situation B: Calculations will turn out at which groundwater level the
structure will need to be anchored to prevent floating of the structure. The highest groundwater level, before buoyancy will occur, is subjected
to the structure. This represents the situation stiff soil, so no anchoring
of the structure, with the highest allowed groundwater level.
A continued ballast bed will be applied on the structure.
A shallow foundation will be assumed for the first design steps.
Recommendations should be given for a pile foundation
31
PART II
THE DESIGN

32
33
6 Element configuration
From the literature review follows the road profile of the underpass and the profile of the crossed railroad. There is made a distinction between the minimum dimensions and the ideal dimensions of the road profile. For the profile of the crossing railroad (y-direction) only one option is regarded. These
profiles basically determine the (inner) dimensions of the underpass. This results in inner dimensions of the underpass of approximately 11-to-12m by 4.6m by 11.6m (width x height x length). From structural point of view, the best solution would be the build the cross-section of the underpass out of one single element and repeat those elements in longitudinal direction (y-
direction). However, due to the size of the cross-section, it is not possible to transport these underpasses as a box, built up from one single element, towards the location of the crossing. Therefore the underpass will be build up
from prefabricated elements. To be able to test if it is feasible to design the underpass in prefabricated elements, multiple element layouts are designed
and analysed. The restrictions to the element layout are basically determined by the maximum transport capacity and the execution possibilities.
6.1. Criteria
A set of criteria will point out which layout designs are most potential for a feasible solution to the research objective (§1.2). An explanation of every criterion will be given:
6.1.1. Ideal road profile
The primary goal of constructing railway underpasses is an improved traffic flow. In order to fulfil this goal, the underpass should offer space to the
required road profile. There has been made a distinction between ideal and minimum dimensions for the road profile. The minimum dimensions can result in traffic jams at a high traffic intensity. Traffic jams are the main reason to switch from level crossings to underpasses, if the underpass causes
new traffic jams the structure does not fulfil its main function. Therefore the
minimum road profile should be avoided.
6.1.2. Amount of elements
The amount of elements influence the amount of required transports, the amount of connections, and also the construction time. More elements needed, results in more actions to mount the elements. However, when only few elements are necessary to build up the structure, this can result in large heavy elements, which are difficult to mount and therefore take more time to
put in position. Regarding the amount of connections and the locations of them also influence the execution time, force distribution, and stability of the structure, it is stated that the less elements the cross-section is build-up from, the higher the rating of the layout design on the multi criteria analysis. The relation to the element size and mountability will be discussed in §6.1.4.
6. ELEMENT CONFIGURATION
34
6.1.3. Stability during erection
The element layout can be stable of itself, but there could also be additional
measures needed to obtain stability (prestressing or rigid connections).
Structures which are not stable of itself also need additional measures during execution. This criterion is based on the stability of the structure during execution.
6.1.4. Mountability
Normally structures of prefabricated elements are built up from the bottom to the top. Considering that the railway needs to be restored before the train free
period ends, the deck must be in the condition to support the railway. In addition there must be enough space available to mount and connect the elements. When prestressing is required, there must be enough space to install the jacks. This influences the method of building pit arrangement (placing the sheet piles or open excavation). The score on this criterion is
based on the required space for mounting the elements and the weight of the elements. Heavy elements take more time to install.
6.1.5. Force distribution
The force distribution can be influenced by the location of a connection.
Therefore force distribution is influenced by the choice of the element layout and type of connection. However, to secure the water tightness of the structure, it is most likely all connections will be implement as rigid
connections. So therefore, this criterion judges the location of the joints with respect to the forces acting on that location.
6.1.6. Amount of prestress directions
In order to obtain stability and water tightness of the structure, prestressing of the elements may be necessary. To avoid complex details of prestress tendons coming together from multiple directions, there should be strived for prestressing in as less directions as possible. Also the location of the jacks
could result in complicated execution. Because prestressing in longitudinal direction (y-direction) seems unavoidable, prestressing in this direction is assumed to be applied in all situations and therefore is not discussed in the analysis. Element layouts that do not need additional prestressing to obtain stability show a higher rating on the multi criteria analysis.
6.1.7. Grid
The position of the different elements of a prefab structure forms the grid of
the structure. Repetition of elements is the most efficient with standardized grid dimensions. In other words the design of a prefab structure is most efficient if the connections are in-line with each other and elements have a high repetition. This criterion is focused on the gridlines in longitudinal direction of the underpass.
6.1.8. Adjustability of element design
An element design that could be adjusted to other underpass dimensions
results in a higher repetition of elements. Therefore element design that is easy to extend/shorten provides economic benefits. This criteria is also very important for the research objective of performing standardization of underpasses.
B.G.A. VAN CASTEREN
6.2. Underpass layouts
Keeping the design criteria in mind, several layouts are designed and analyzed. Each layout is design such that it will score high on at least one of the criteria.
For this stage of the research all walls, floors, and decks are assumed to have a thickness of 1m. There is chosen for a conservative dimensioning of the walls, deck and floor to avoid (transportation) problems in a later stage, if it
would turn out that that the element thickness is not sufficient. The design can optimized in a later stage of the research. In this chapter only the strong or weak aspects of each layout are discussed, a full analysis can be found in Annex I.
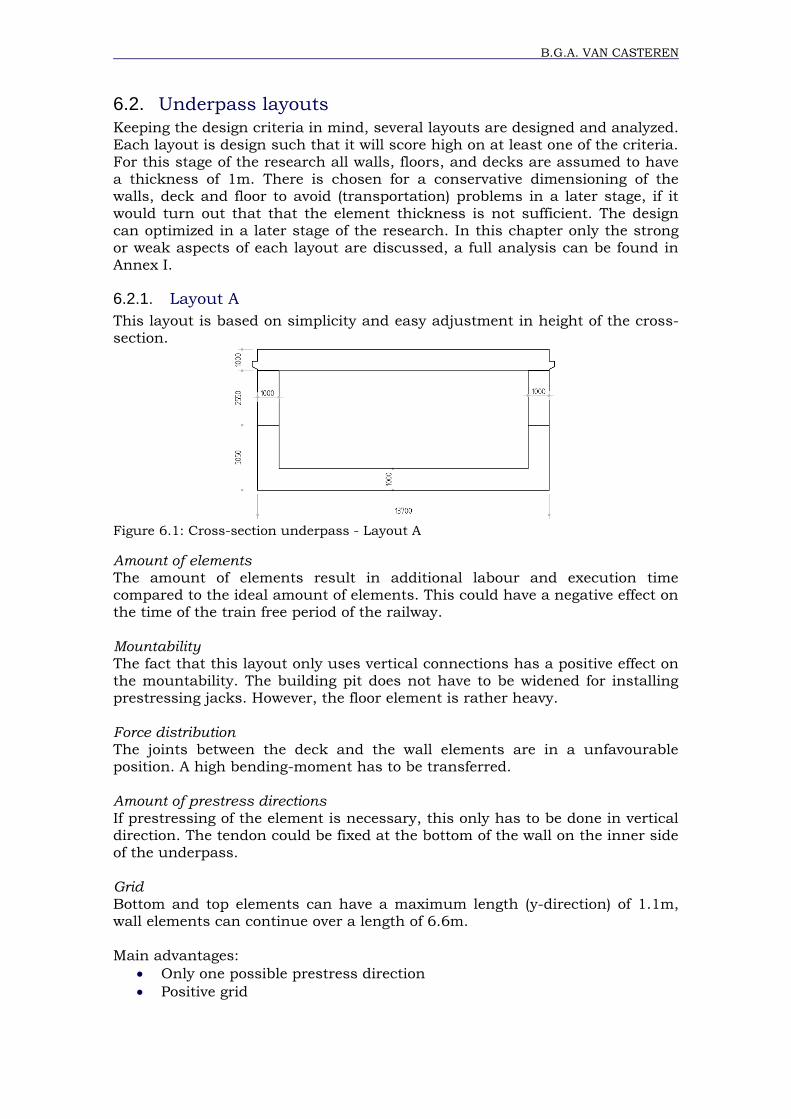
6.2.1. Layout A
This layout is based on simplicity and easy adjustment in height of the cross-section.
Figure 6.1: Cross-section underpass - Layout A
Amount of elements The amount of elements result in additional labour and execution time compared to the ideal amount of elements. This could have a negative effect on the time of the train free period of the railway. Mountability The fact that this layout only uses vertical connections has a positive effect on the mountability. The building pit does not have to be widened for installing prestressing jacks. However, the floor element is rather heavy. Force distribution The joints between the deck and the wall elements are in a unfavourable position. A high bending-moment has to be transferred.
Amount of prestress directions If prestressing of the element is necessary, this only has to be done in vertical direction. The tendon could be fixed at the bottom of the wall on the inner side of the underpass. Grid Bottom and top elements can have a maximum length (y-direction) of 1.1m, wall elements can continue over a length of 6.6m. Main advantages:
Only one possible prestress direction
Positive grid
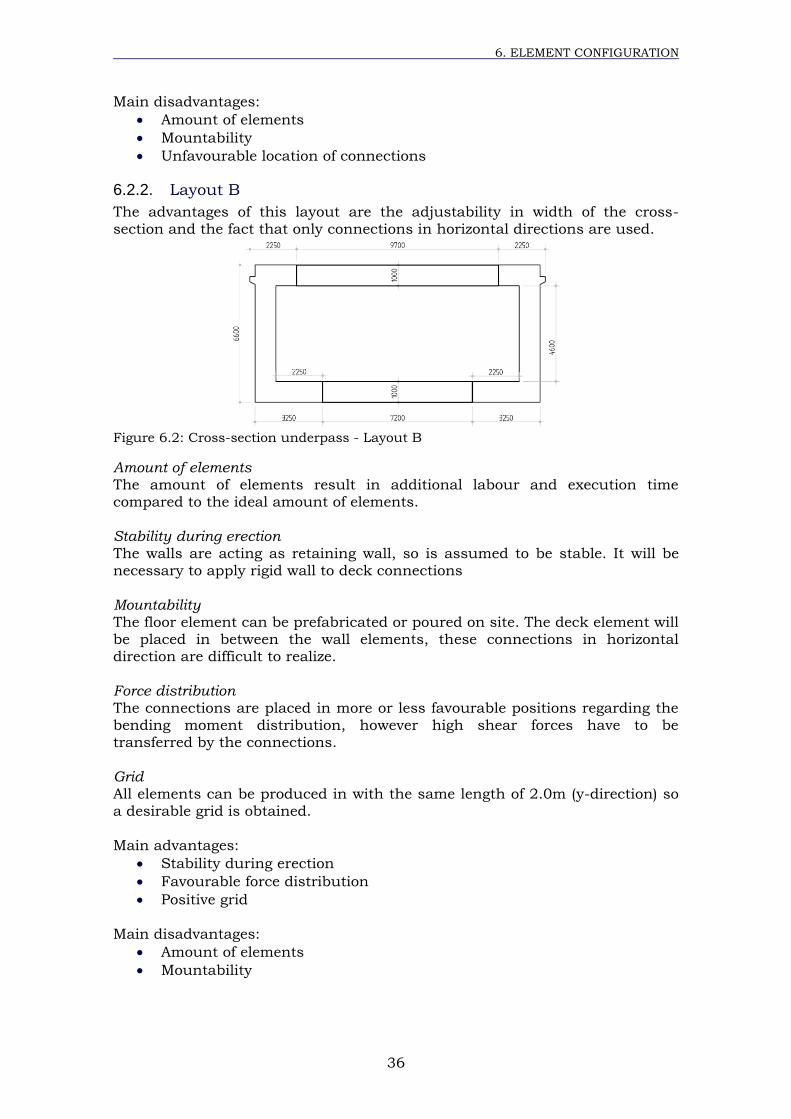
6. ELEMENT CONFIGURATION
36
Main disadvantages:
Amount of elements
Mountability
Unfavourable location of connections
6.2.2. Layout B
The advantages of this layout are the adjustability in width of the cross-section and the fact that only connections in horizontal directions are used.
Figure 6.2: Cross-section underpass - Layout B
Amount of elements The amount of elements result in additional labour and execution time compared to the ideal amount of elements.
Stability during erection The walls are acting as retaining wall, so is assumed to be stable. It will be necessary to apply rigid wall to deck connections
Mountability The floor element can be prefabricated or poured on site. The deck element will be placed in between the wall elements, these connections in horizontal direction are difficult to realize.
Force distribution The connections are placed in more or less favourable positions regarding the bending moment distribution, however high shear forces have to be transferred by the connections.
Grid All elements can be produced in with the same length of 2.0m (y-direction) so a desirable grid is obtained.
Main advantages:
Stability during erection
Favourable force distribution
Positive grid
Main disadvantages:
Amount of elements
Mountability
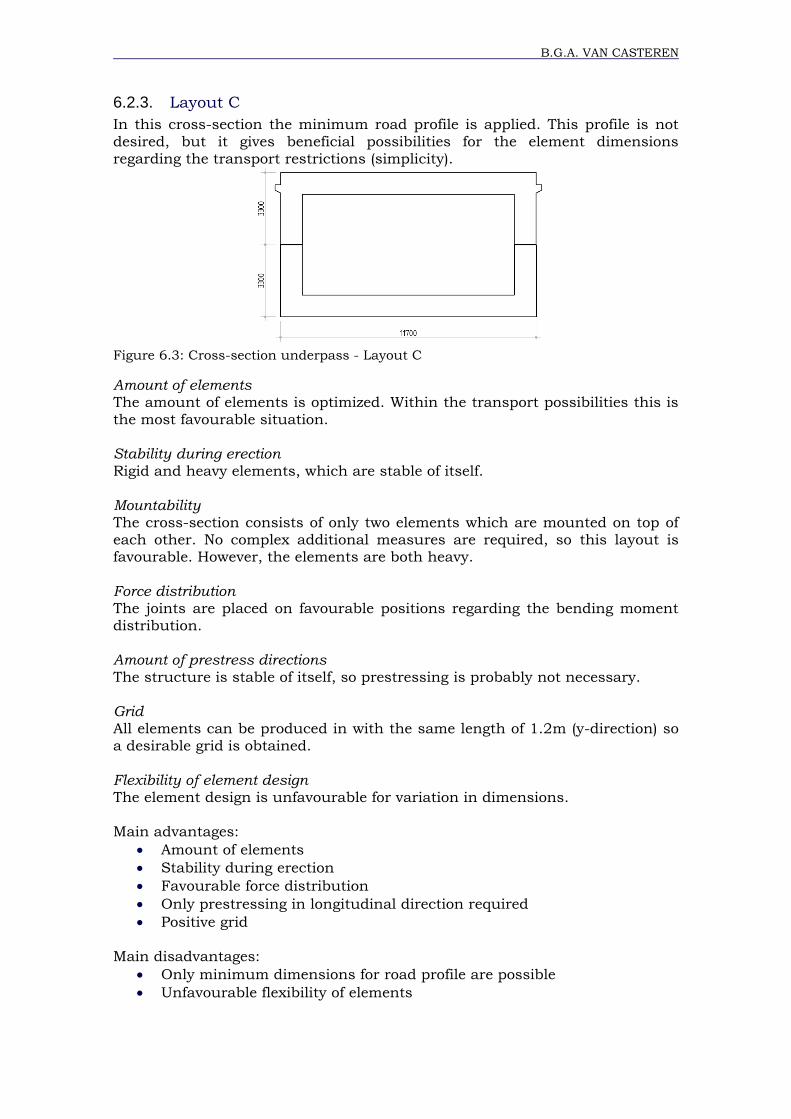
B.G.A. VAN CASTEREN
6.2.3. Layout C
In this cross-section the minimum road profile is applied. This profile is not
desired, but it gives beneficial possibilities for the element dimensions
regarding the transport restrictions (simplicity).
Figure 6.3: Cross-section underpass - Layout C
Amount of elements The amount of elements is optimized. Within the transport possibilities this is
the most favourable situation. Stability during erection
Rigid and heavy elements, which are stable of itself. Mountability The cross-section consists of only two elements which are mounted on top of each other. No complex additional measures are required, so this layout is favourable. However, the elements are both heavy.
Force distribution The joints are placed on favourable positions regarding the bending moment distribution. Amount of prestress directions The structure is stable of itself, so prestressing is probably not necessary. Grid All elements can be produced in with the same length of 1.2m (y-direction) so a desirable grid is obtained.
Flexibility of element design The element design is unfavourable for variation in dimensions. Main advantages:
Amount of elements
Stability during erection
Favourable force distribution
Only prestressing in longitudinal direction required
Positive grid
Main disadvantages:
Only minimum dimensions for road profile are possible
Unfavourable flexibility of elements
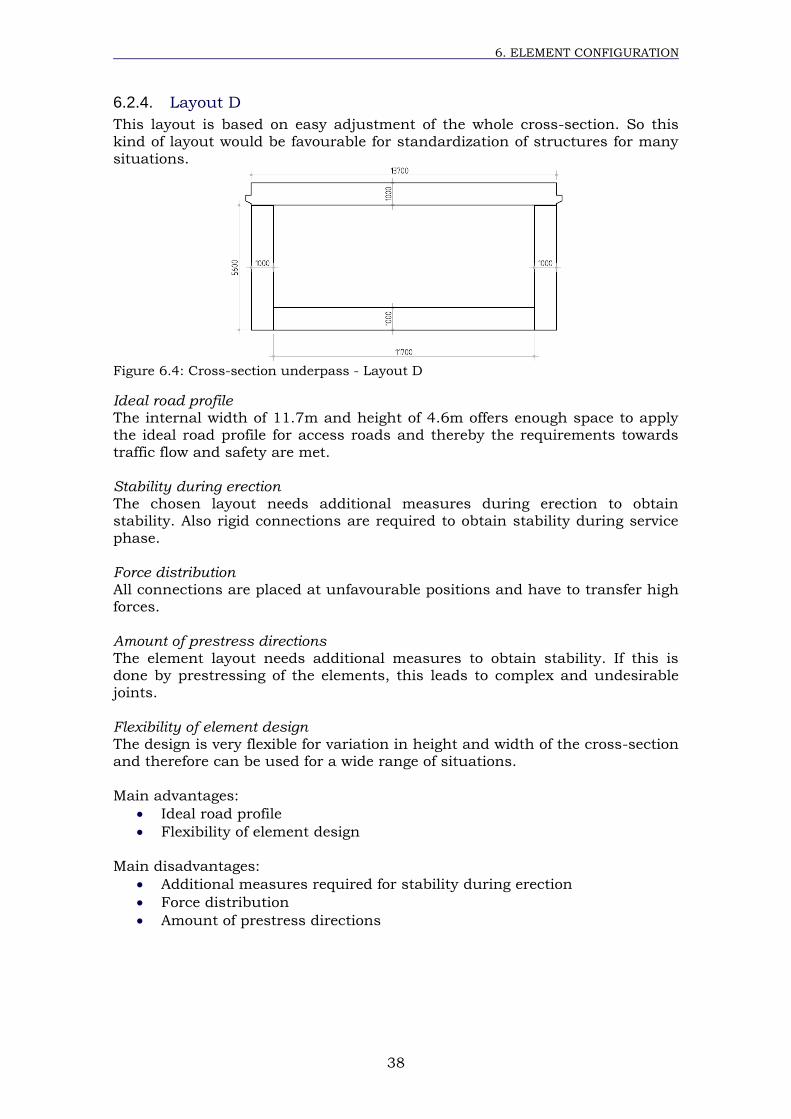
6. ELEMENT CONFIGURATION
38
6.2.4. Layout D
This layout is based on easy adjustment of the whole cross-section. So this
kind of layout would be favourable for standardization of structures for many
situations.
Figure 6.4: Cross-section underpass - Layout D
Ideal road profile The internal width of 11.7m and height of 4.6m offers enough space to apply the ideal road profile for access roads and thereby the requirements towards
traffic flow and safety are met.
Stability during erection The chosen layout needs additional measures during erection to obtain stability. Also rigid connections are required to obtain stability during service
phase. Force distribution All connections are placed at unfavourable positions and have to transfer high forces.
Amount of prestress directions The element layout needs additional measures to obtain stability. If this is done by prestressing of the elements, this leads to complex and undesirable joints.
Flexibility of element design The design is very flexible for variation in height and width of the cross-section and therefore can be used for a wide range of situations.
Main advantages:
Ideal road profile
Flexibility of element design
Main disadvantages:
Additional measures required for stability during erection
Force distribution
Amount of prestress directions
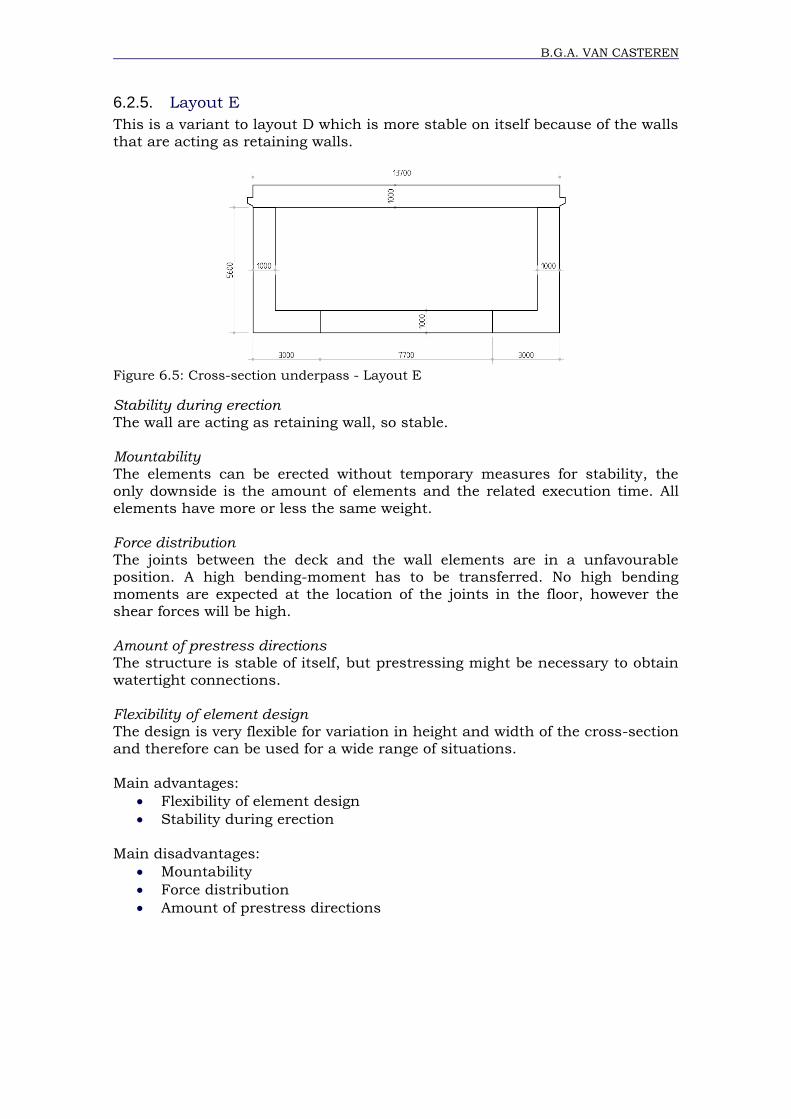
B.G.A. VAN CASTEREN
6.2.5. Layout E
This is a variant to layout D which is more stable on itself because of the walls
that are acting as retaining walls.
Figure 6.5: Cross-section underpass - Layout E
Stability during erection
The wall are acting as retaining wall, so stable. Mountability
The elements can be erected without temporary measures for stability, the only downside is the amount of elements and the related execution time. All
elements have more or less the same weight. Force distribution The joints between the deck and the wall elements are in a unfavourable position. A high bending-moment has to be transferred. No high bending
moments are expected at the location of the joints in the floor, however the shear forces will be high. Amount of prestress directions The structure is stable of itself, but prestressing might be necessary to obtain
watertight connections. Flexibility of element design The design is very flexible for variation in height and width of the cross-section and therefore can be used for a wide range of situations.
Main advantages:
Flexibility of element design
Stability during erection
Main disadvantages:
Mountability
Force distribution
Amount of prestress directions
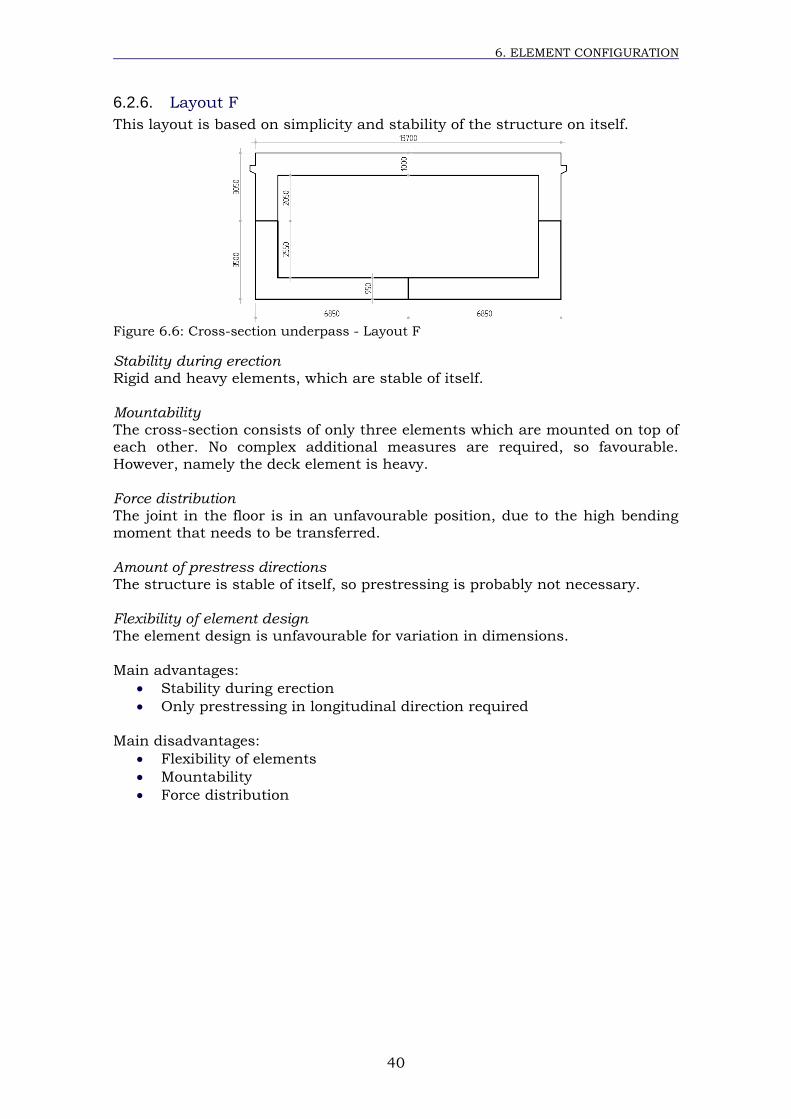
6. ELEMENT CONFIGURATION
40
6.2.6. Layout F
This layout is based on simplicity and stability of the structure on itself.
Figure 6.6: Cross-section underpass - Layout F
Stability during erection Rigid and heavy elements, which are stable of itself.
Mountability The cross-section consists of only three elements which are mounted on top of each other. No complex additional measures are required, so favourable.
However, namely the deck element is heavy.
Force distribution The joint in the floor is in an unfavourable position, due to the high bending moment that needs to be transferred.
Amount of prestress directions The structure is stable of itself, so prestressing is probably not necessary. Flexibility of element design The element design is unfavourable for variation in dimensions.
Main advantages:
Stability during erection
Only prestressing in longitudinal direction required
Main disadvantages:
Flexibility of elements
Mountability
Force distribution
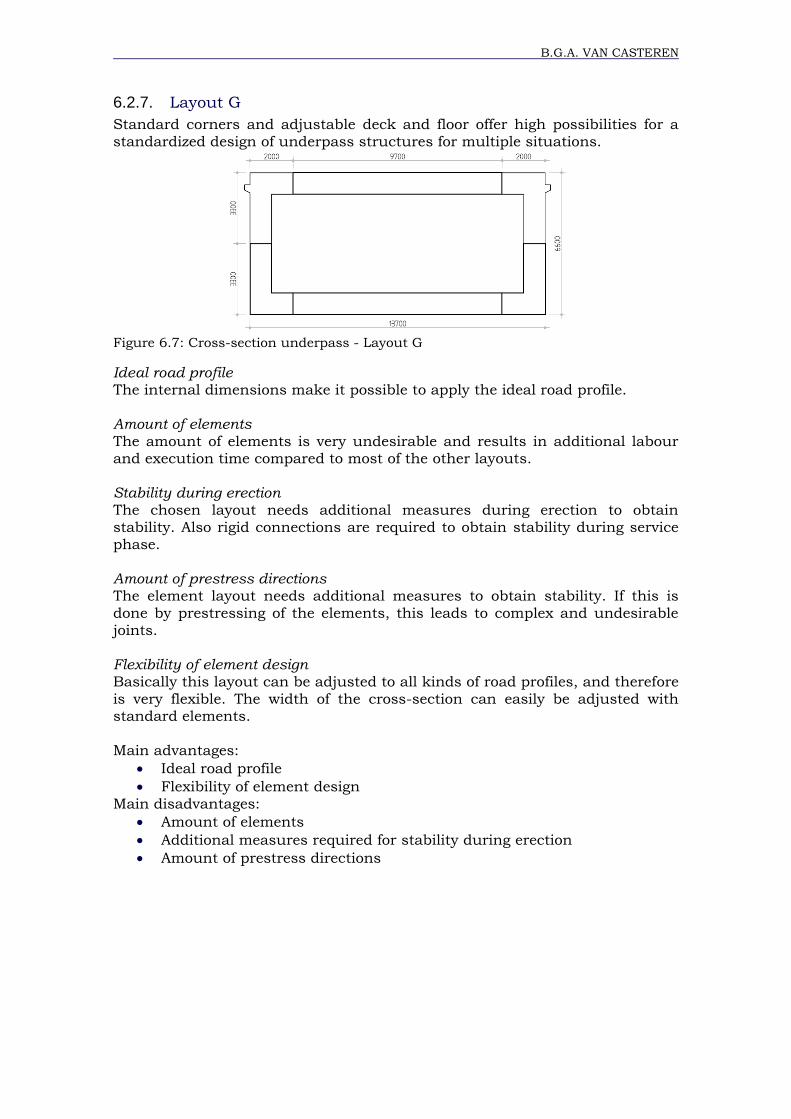
B.G.A. VAN CASTEREN
6.2.7. Layout G
Standard corners and adjustable deck and floor offer high possibilities for a
standardized design of underpass structures for multiple situations.
Figure 6.7: Cross-section underpass - Layout G
Ideal road profile The internal dimensions make it possible to apply the ideal road profile. Amount of elements The amount of elements is very undesirable and results in additional labour
and execution time compared to most of the other layouts. Stability during erection The chosen layout needs additional measures during erection to obtain
stability. Also rigid connections are required to obtain stability during service phase. Amount of prestress directions The element layout needs additional measures to obtain stability. If this is
done by prestressing of the elements, this leads to complex and undesirable joints. Flexibility of element design Basically this layout can be adjusted to all kinds of road profiles, and therefore
is very flexible. The width of the cross-section can easily be adjusted with standard elements. Main advantages:
Ideal road profile
Flexibility of element design
Main disadvantages:
Amount of elements
Additional measures required for stability during erection
Amount of prestress directions
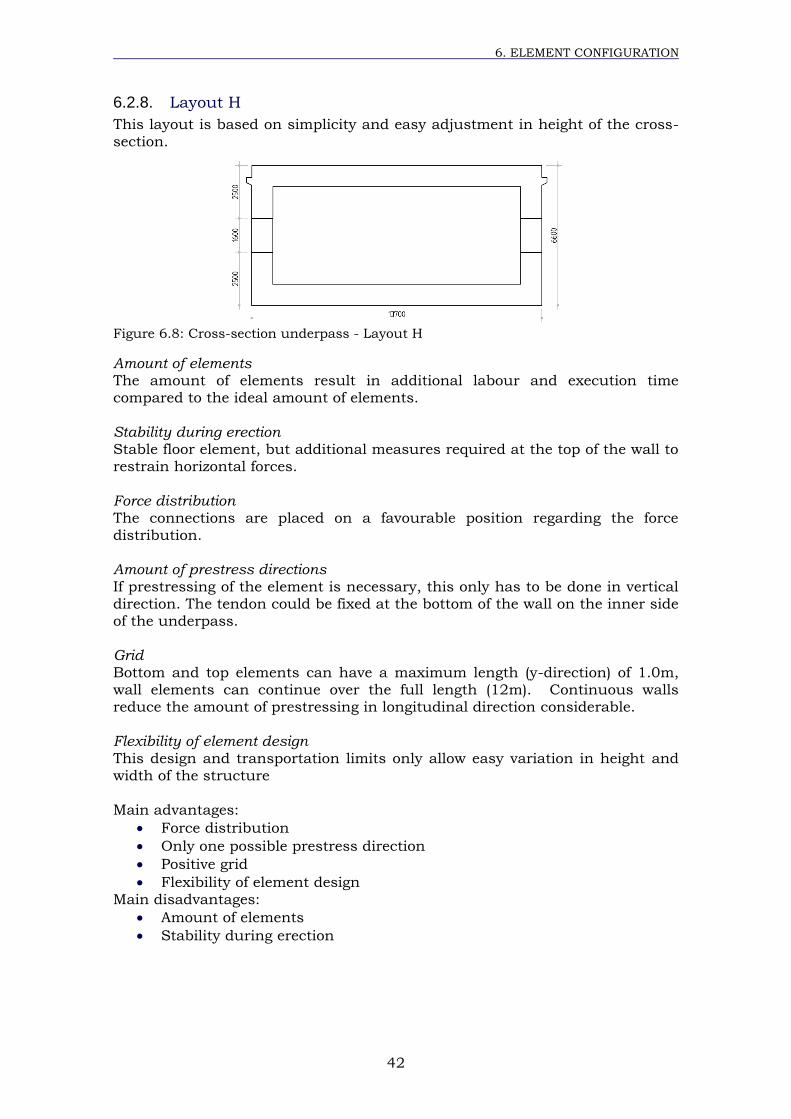
6. ELEMENT CONFIGURATION
42
6.2.8. Layout H
This layout is based on simplicity and easy adjustment in height of the cross-
section.
Figure 6.8: Cross-section underpass - Layout H
Amount of elements The amount of elements result in additional labour and execution time compared to the ideal amount of elements.
Stability during erection Stable floor element, but additional measures required at the top of the wall to
restrain horizontal forces. Force distribution The connections are placed on a favourable position regarding the force distribution. Amount of prestress directions If prestressing of the element is necessary, this only has to be done in vertical direction. The tendon could be fixed at the bottom of the wall on the inner side of the underpass. Grid Bottom and top elements can have a maximum length (y-direction) of 1.0m, wall elements can continue over the full length (12m). Continuous walls reduce the amount of prestressing in longitudinal direction considerable. Flexibility of element design
This design and transportation limits only allow easy variation in height and
width of the structure Main advantages:
Force distribution
Only one possible prestress direction
Positive grid
Flexibility of element design
Main disadvantages:
Amount of elements
Stability during erection
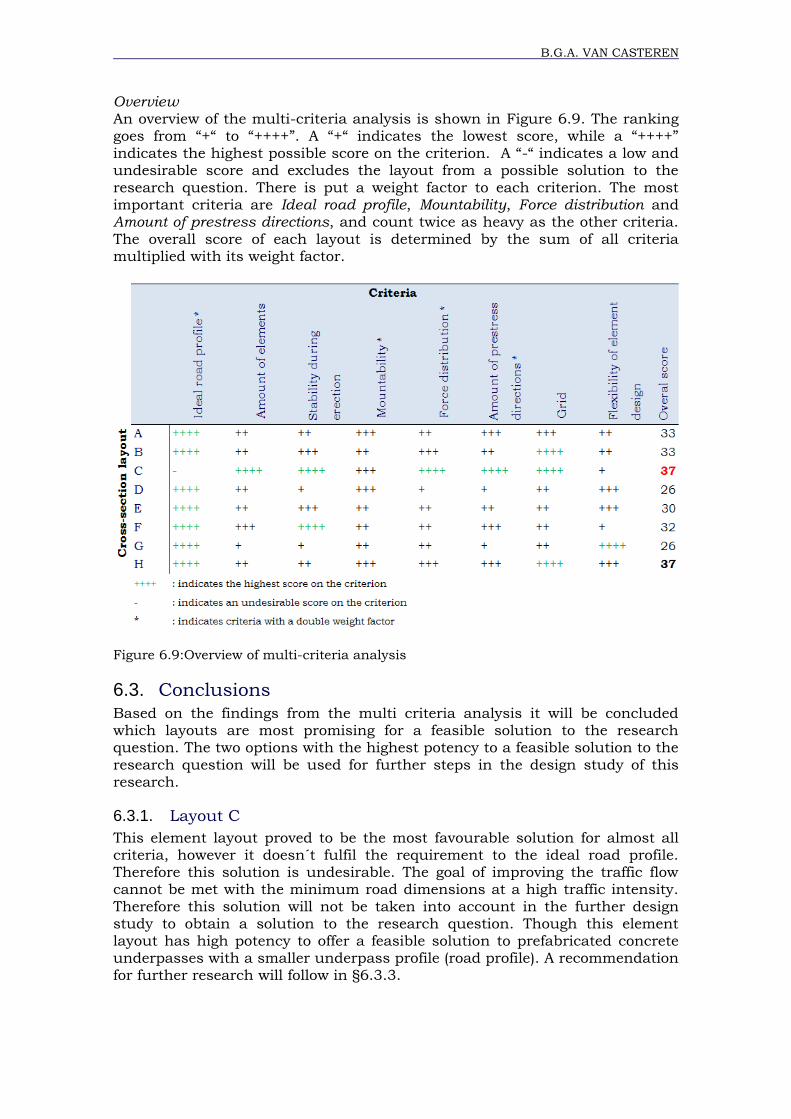
B.G.A. VAN CASTEREN
Overview An overview of the multi-criteria analysis is shown in Figure 6.9. The ranking goes from “+“ to “++++”. A “+“ indicates the lowest score, while a “++++”
indicates the highest possible score on the criterion. A “-“ indicates a low and undesirable score and excludes the layout from a possible solution to the
research question. There is put a weight factor to each criterion. The most important criteria are Ideal road profile, Mountability, Force distribution and Amount of prestress directions, and count twice as heavy as the other criteria.
The overall score of each layout is determined by the sum of all criteria multiplied with its weight factor.
Figure 6.9:Overview of multi-criteria analysis
6.3. Conclusions
Based on the findings from the multi criteria analysis it will be concluded which layouts are most promising for a feasible solution to the research question. The two options with the highest potency to a feasible solution to the
research question will be used for further steps in the design study of this
research.
6.3.1. Layout C
This element layout proved to be the most favourable solution for almost all criteria, however it doesn´t fulfil the requirement to the ideal road profile. Therefore this solution is undesirable. The goal of improving the traffic flow cannot be met with the minimum road dimensions at a high traffic intensity.
Therefore this solution will not be taken into account in the further design study to obtain a solution to the research question. Though this element layout has high potency to offer a feasible solution to prefabricated concrete underpasses with a smaller underpass profile (road profile). A recommendation for further research will follow in §6.3.3.
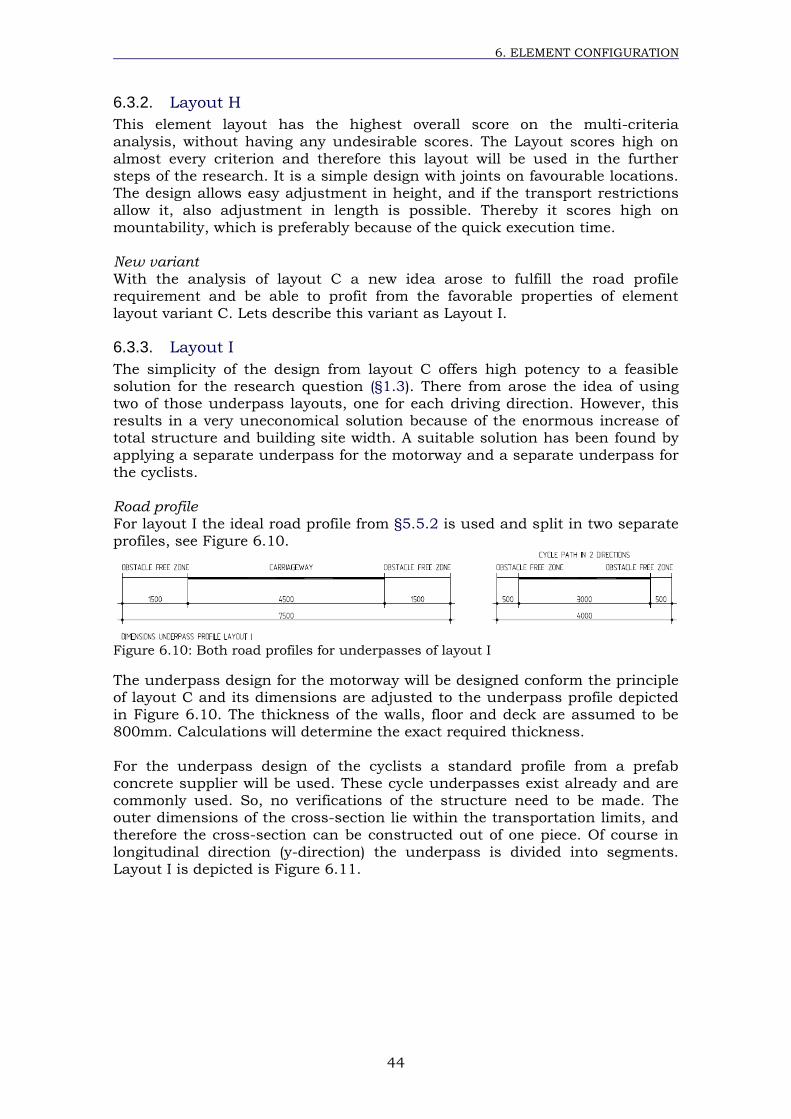
6. ELEMENT CONFIGURATION
44
6.3.2. Layout H
This element layout has the highest overall score on the multi-criteria
analysis, without having any undesirable scores. The Layout scores high on
almost every criterion and therefore this layout will be used in the further steps of the research. It is a simple design with joints on favourable locations. The design allows easy adjustment in height, and if the transport restrictions allow it, also adjustment in length is possible. Thereby it scores high on
mountability, which is preferably because of the quick execution time. New variant With the analysis of layout C a new idea arose to fulfill the road profile requirement and be able to profit from the favorable properties of element
layout variant C. Lets describe this variant as Layout I.
6.3.3. Layout I
The simplicity of the design from layout C offers high potency to a feasible solution for the research question (§1.3). There from arose the idea of using two of those underpass layouts, one for each driving direction. However, this results in a very uneconomical solution because of the enormous increase of total structure and building site width. A suitable solution has been found by
applying a separate underpass for the motorway and a separate underpass for
the cyclists. Road profile For layout I the ideal road profile from §5.5.2 is used and split in two separate
profiles, see Figure 6.10.
Figure 6.10: Both road profiles for underpasses of layout I
The underpass design for the motorway will be designed conform the principle of layout C and its dimensions are adjusted to the underpass profile depicted in Figure 6.10. The thickness of the walls, floor and deck are assumed to be 800mm. Calculations will determine the exact required thickness.
For the underpass design of the cyclists a standard profile from a prefab
concrete supplier will be used. These cycle underpasses exist already and are commonly used. So, no verifications of the structure need to be made. The outer dimensions of the cross-section lie within the transportation limits, and
therefore the cross-section can be constructed out of one piece. Of course in longitudinal direction (y-direction) the underpass is divided into segments. Layout I is depicted is Figure 6.11.
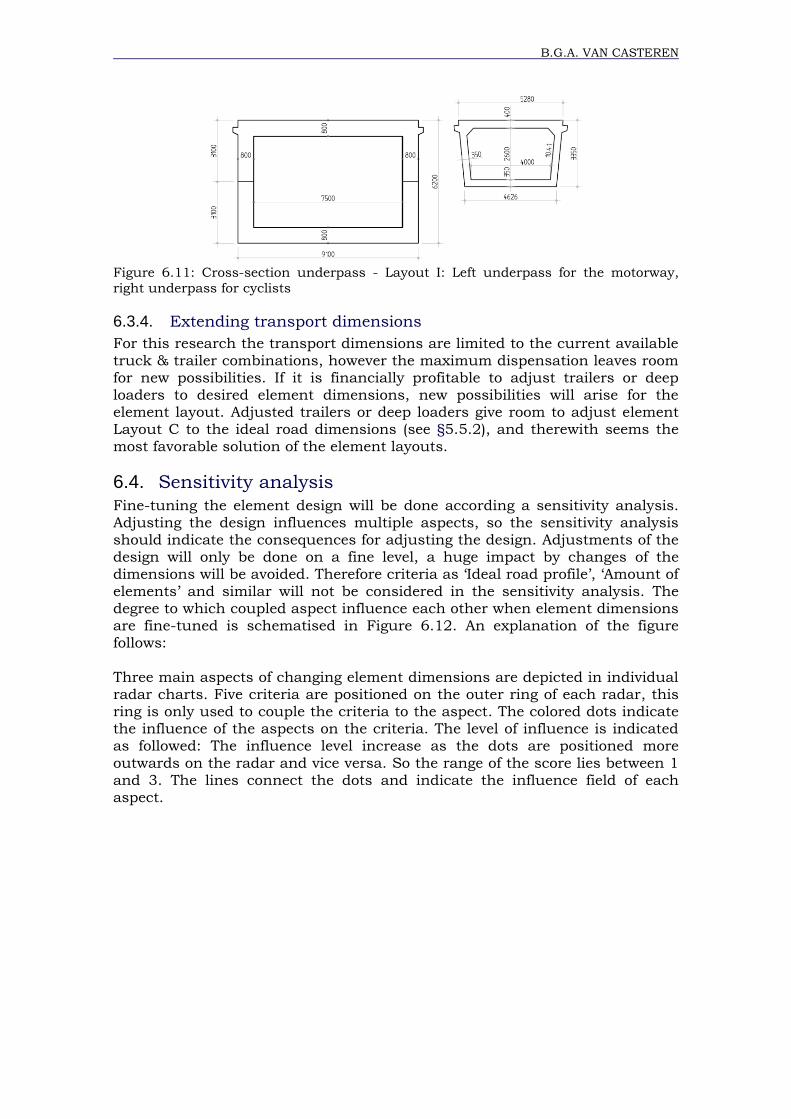
B.G.A. VAN CASTEREN
Figure 6.11: Cross-section underpass - Layout I: Left underpass for the motorway, right underpass for cyclists
6.3.4. Extending transport dimensions
For this research the transport dimensions are limited to the current available
truck & trailer combinations, however the maximum dispensation leaves room for new possibilities. If it is financially profitable to adjust trailers or deep loaders to desired element dimensions, new possibilities will arise for the element layout. Adjusted trailers or deep loaders give room to adjust element Layout C to the ideal road dimensions (see §5.5.2), and therewith seems the
most favorable solution of the element layouts.
6.4. Sensitivity analysis
Fine-tuning the element design will be done according a sensitivity analysis. Adjusting the design influences multiple aspects, so the sensitivity analysis should indicate the consequences for adjusting the design. Adjustments of the design will only be done on a fine level, a huge impact by changes of the dimensions will be avoided. Therefore criteria as ‘Ideal road profile’, ‘Amount of
elements’ and similar will not be considered in the sensitivity analysis. The degree to which coupled aspect influence each other when element dimensions are fine-tuned is schematised in Figure 6.12. An explanation of the figure follows:
Three main aspects of changing element dimensions are depicted in individual radar charts. Five criteria are positioned on the outer ring of each radar, this ring is only used to couple the criteria to the aspect. The colored dots indicate the influence of the aspects on the criteria. The level of influence is indicated as followed: The influence level increase as the dots are positioned more
outwards on the radar and vice versa. So the range of the score lies between 1
and 3. The lines connect the dots and indicate the influence field of each aspect.
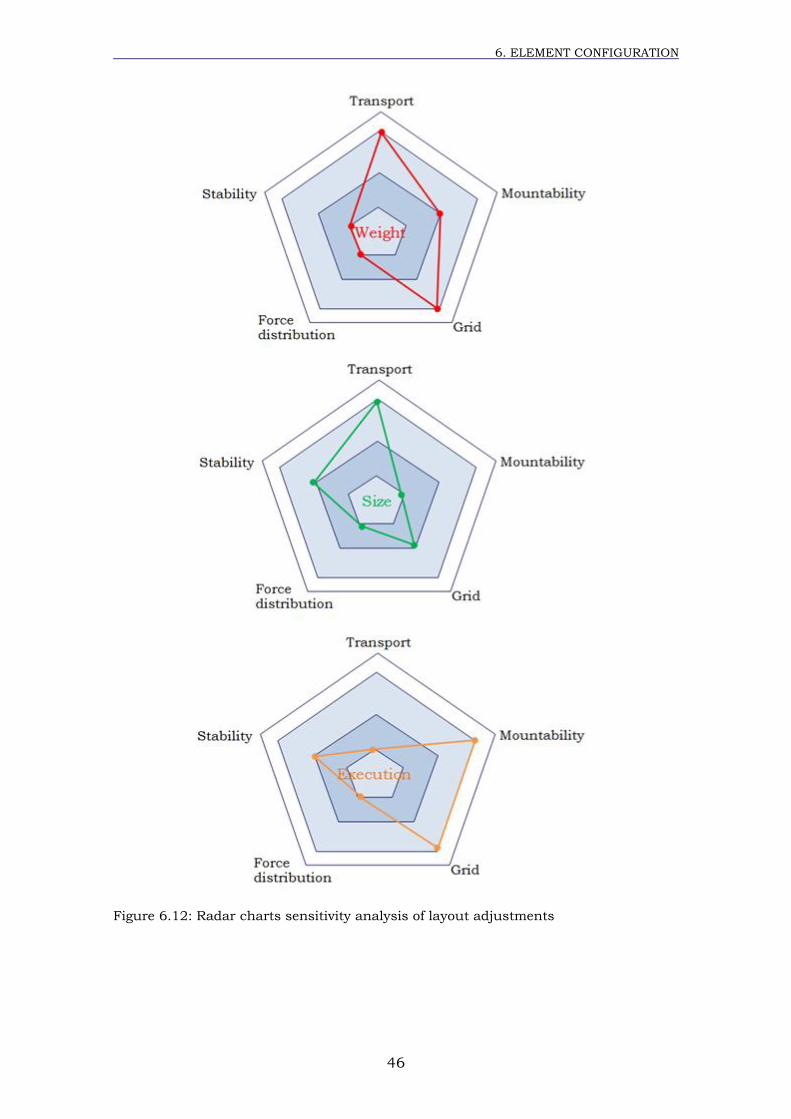
6. ELEMENT CONFIGURATION
46
Figure 6.12: Radar charts sensitivity analysis of layout adjustments
47
7 Loads
In general concrete underpasses have a design service life of hundred years. For this period the structure should comply with the functional requirements without requiring exceptional maintenance. To provide engineers help and
compliance with these requirements, norms and guidelines have been developed. For this research the Eurocode, with the associated Dutch National Annex, the OVS, CUR recommendations and the ROK will be maintained in the structural design of the underpass. It is important for the structural design to regard the scope of this research. Only the load cases that are
governing for design aspects, which are valuable for answering the research question (§1.3), are considered in the structural design. Furthermore the norms provide methods to analyze the structural behavior under influence of these loads and the boundaries between which the structure is considered safe and reliable.
Loads are classified by their variation in time in the following matter [NEN-EN 1990]:
Permanent loads (G): e.g. self-weight, dead loads and loads by
shrinkage and settlements
Variable loads (Q): e.g. imposed loads, thermal loads
Accidental loads (A): e.g. impact from vehicles
The loads are presented both exclusive and characteristic. The design values of loads are derived by multiplication with partial safety factors. The safety factors account for unfavorable deviations of actions, inaccurate modeling of actions and uncertainties in the assessment of the considered limit state. For load combinations, the accompanying values of the loads have to be
determined by multiplication with a combination factor.
7.1. Self-weight
For structural calculations software program Scia Engineer is used. This
program is able to account for the self-weight of general construction materials, by means of mass density of the material and input of the cross-sectional area. The main structure is modeled in Scia Engineer, while
additional permanent elements (hand rails, ballast bed, inner walls etc.) are modeled as line and surface loads. The additional permanent elements are considered as dead load.
7.2. Dead load
7.2.1. Edge elements deck
The dead weight of steel edge elements for the inspection path are projected as
line loads. The density of steel ( = 78 kN/m³) is used to determine the loads.
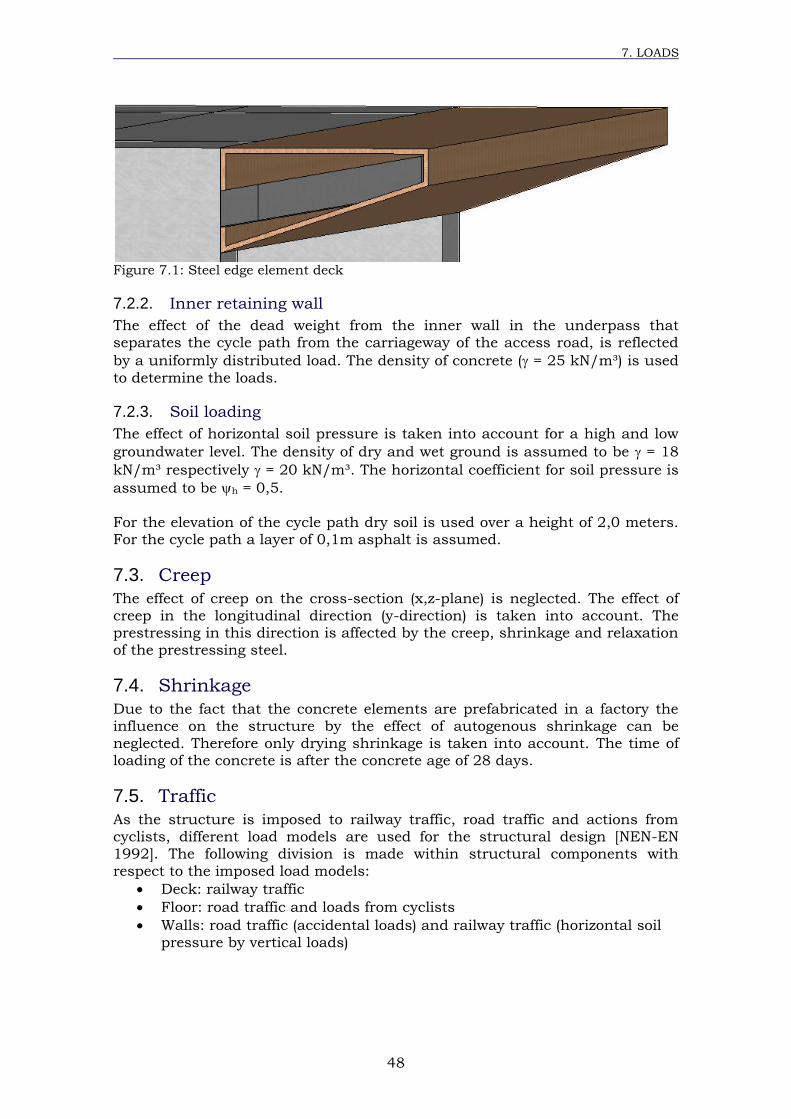
7. LOADS
48
Figure 7.1: Steel edge element deck
7.2.2. Inner retaining wall
The effect of the dead weight from the inner wall in the underpass that separates the cycle path from the carriageway of the access road, is reflected
by a uniformly distributed load. The density of concrete ( = 25 kN/m³) is used
to determine the loads.
7.2.3. Soil loading
The effect of horizontal soil pressure is taken into account for a high and low
groundwater level. The density of dry and wet ground is assumed to be = 18
kN/m³ respectively = 20 kN/m³. The horizontal coefficient for soil pressure is
assumed to be h = 0,5.
For the elevation of the cycle path dry soil is used over a height of 2,0 meters. For the cycle path a layer of 0,1m asphalt is assumed.
7.3. Creep
The effect of creep on the cross-section (x,z-plane) is neglected. The effect of creep in the longitudinal direction (y-direction) is taken into account. The prestressing in this direction is affected by the creep, shrinkage and relaxation of the prestressing steel.
7.4. Shrinkage
Due to the fact that the concrete elements are prefabricated in a factory the influence on the structure by the effect of autogenous shrinkage can be
neglected. Therefore only drying shrinkage is taken into account. The time of loading of the concrete is after the concrete age of 28 days.
7.5. Traffic
As the structure is imposed to railway traffic, road traffic and actions from cyclists, different load models are used for the structural design [NEN-EN 1992]. The following division is made within structural components with
respect to the imposed load models:
Deck: railway traffic
Floor: road traffic and loads from cyclists
Walls: road traffic (accidental loads) and railway traffic (horizontal soil
pressure by vertical loads)
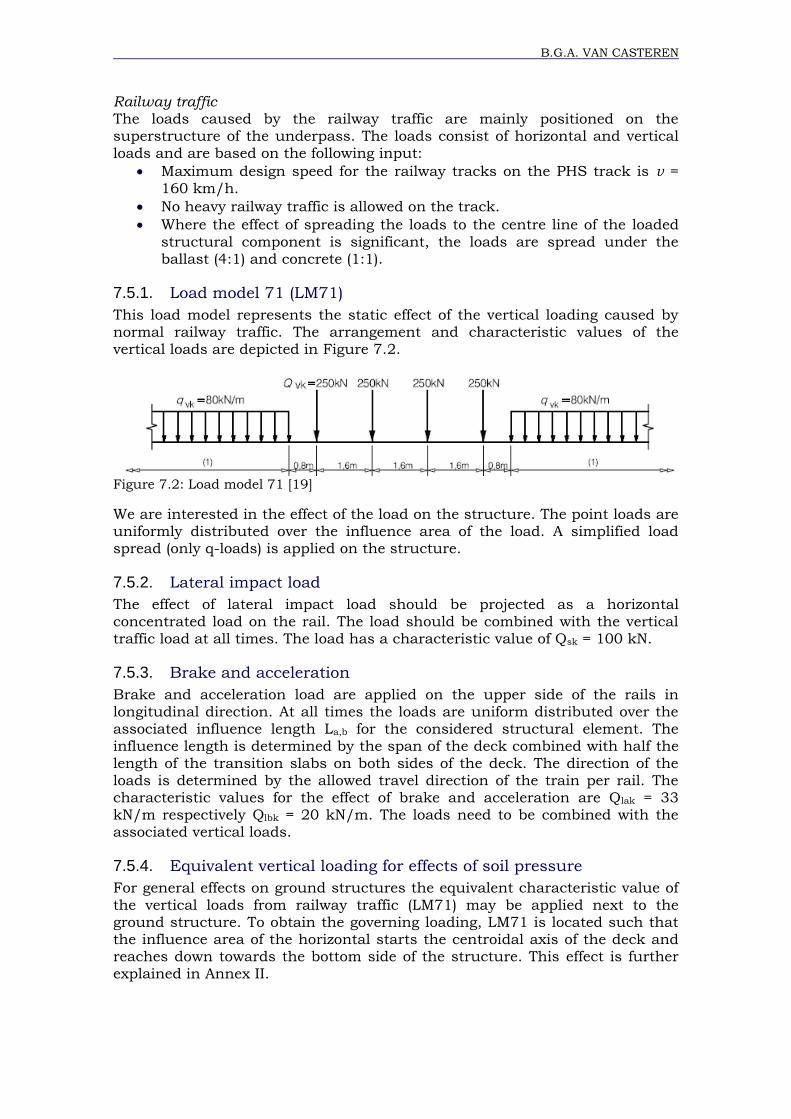
B.G.A. VAN CASTEREN
Railway traffic The loads caused by the railway traffic are mainly positioned on the superstructure of the underpass. The loads consist of horizontal and vertical
loads and are based on the following input:
Maximum design speed for the railway tracks on the PHS track is v =
160 km/h.
No heavy railway traffic is allowed on the track.
Where the effect of spreading the loads to the centre line of the loaded
structural component is significant, the loads are spread under the ballast (4:1) and concrete (1:1).
7.5.1. Load model 71 (LM71)
This load model represents the static effect of the vertical loading caused by normal railway traffic. The arrangement and characteristic values of the vertical loads are depicted in Figure 7.2.
Figure 7.2: Load model 71 [19]
We are interested in the effect of the load on the structure. The point loads are uniformly distributed over the influence area of the load. A simplified load spread (only q-loads) is applied on the structure.
7.5.2. Lateral impact load
The effect of lateral impact load should be projected as a horizontal
concentrated load on the rail. The load should be combined with the vertical traffic load at all times. The load has a characteristic value of Qsk = 100 kN.
7.5.3. Brake and acceleration
Brake and acceleration load are applied on the upper side of the rails in longitudinal direction. At all times the loads are uniform distributed over the associated influence length La,b for the considered structural element. The influence length is determined by the span of the deck combined with half the
length of the transition slabs on both sides of the deck. The direction of the
loads is determined by the allowed travel direction of the train per rail. The characteristic values for the effect of brake and acceleration are Qlak = 33 kN/m respectively Qlbk = 20 kN/m. The loads need to be combined with the associated vertical loads.
7.5.4. Equivalent vertical loading for effects of soil pressure
For general effects on ground structures the equivalent characteristic value of
the vertical loads from railway traffic (LM71) may be applied next to the ground structure. To obtain the governing loading, LM71 is located such that the influence area of the horizontal starts the centroidal axis of the deck and reaches down towards the bottom side of the structure. This effect is further explained in Annex II.
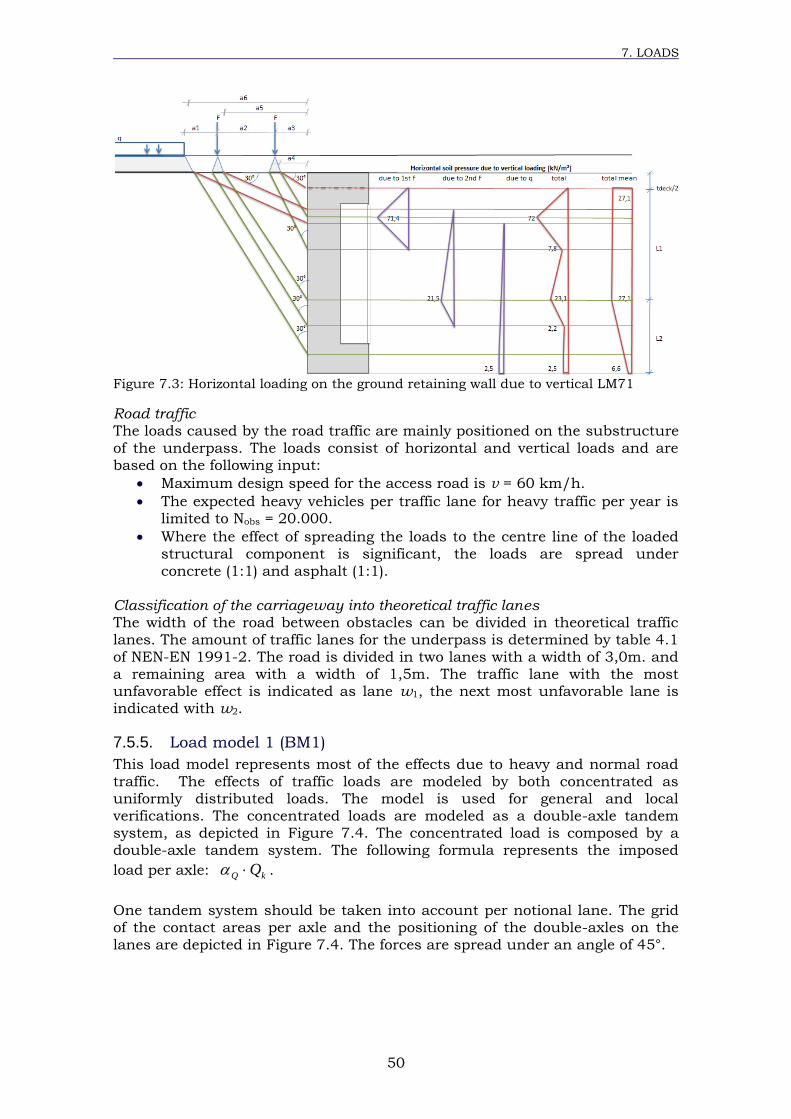
7. LOADS
50
Figure 7.3: Horizontal loading on the ground retaining wall due to vertical LM71
Road traffic The loads caused by the road traffic are mainly positioned on the substructure
of the underpass. The loads consist of horizontal and vertical loads and are
based on the following input:
Maximum design speed for the access road is v = 60 km/h.
The expected heavy vehicles per traffic lane for heavy traffic per year is limited to Nobs = 20.000.
Where the effect of spreading the loads to the centre line of the loaded structural component is significant, the loads are spread under
concrete (1:1) and asphalt (1:1). Classification of the carriageway into theoretical traffic lanes The width of the road between obstacles can be divided in theoretical traffic lanes. The amount of traffic lanes for the underpass is determined by table 4.1
of NEN-EN 1991-2. The road is divided in two lanes with a width of 3,0m. and a remaining area with a width of 1,5m. The traffic lane with the most unfavorable effect is indicated as lane w1, the next most unfavorable lane is indicated with w2.
7.5.5. Load model 1 (BM1)
This load model represents most of the effects due to heavy and normal road
traffic. The effects of traffic loads are modeled by both concentrated as uniformly distributed loads. The model is used for general and local verifications. The concentrated loads are modeled as a double-axle tandem system, as depicted in Figure 7.4. The concentrated load is composed by a double-axle tandem system. The following formula represents the imposed
load per axle: kQ Q .
One tandem system should be taken into account per notional lane. The grid of the contact areas per axle and the positioning of the double-axles on the
lanes are depicted in Figure 7.4. The forces are spread under an angle of 45°.
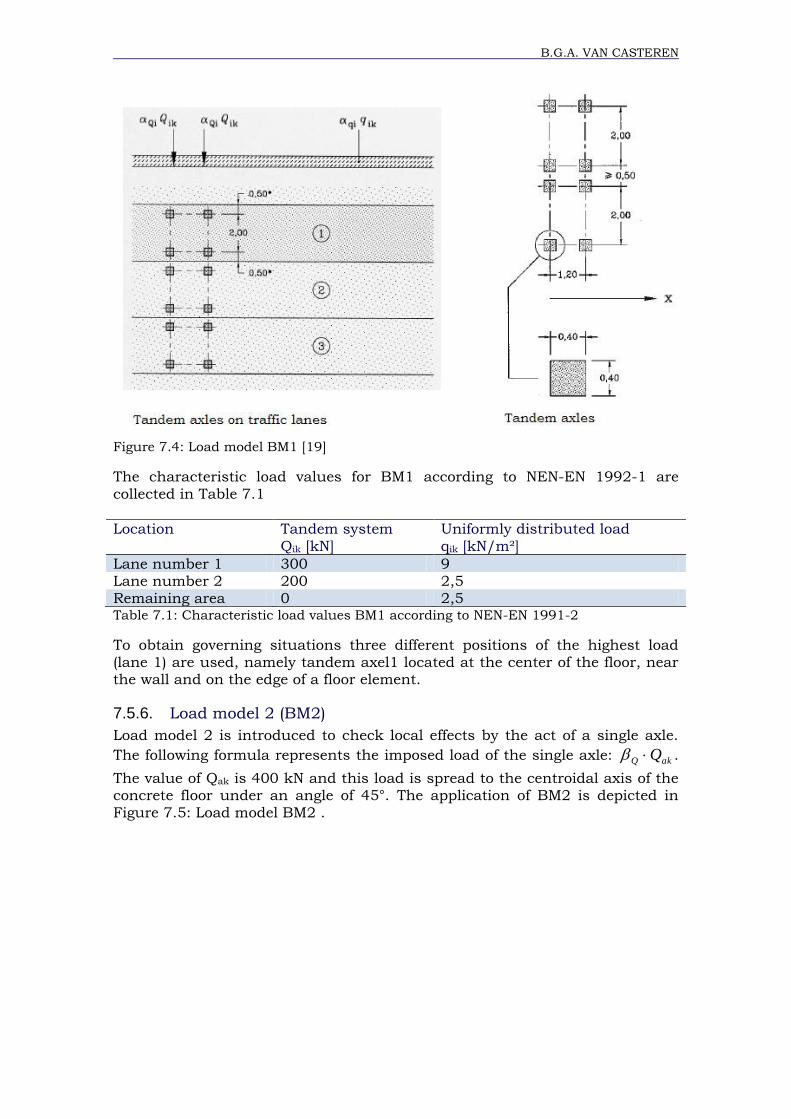
B.G.A. VAN CASTEREN
Figure 7.4: Load model BM1 [19]
The characteristic load values for BM1 according to NEN-EN 1992-1 are
collected in Table 7.1
Location Tandem system
Qik [kN]
Uniformly distributed load
qik [kN/m²]
Lane number 1 300 9 Lane number 2 200 2,5
Remaining area 0 2,5 Table 7.1: Characteristic load values BM1 according to NEN-EN 1991-2
To obtain governing situations three different positions of the highest load
(lane 1) are used, namely tandem axel1 located at the center of the floor, near the wall and on the edge of a floor element.
7.5.6. Load model 2 (BM2)
Load model 2 is introduced to check local effects by the act of a single axle.
The following formula represents the imposed load of the single axle: akQ Q .
The value of Qak is 400 kN and this load is spread to the centroidal axis of the concrete floor under an angle of 45°. The application of BM2 is depicted in
Figure 7.5: Load model BM2 .
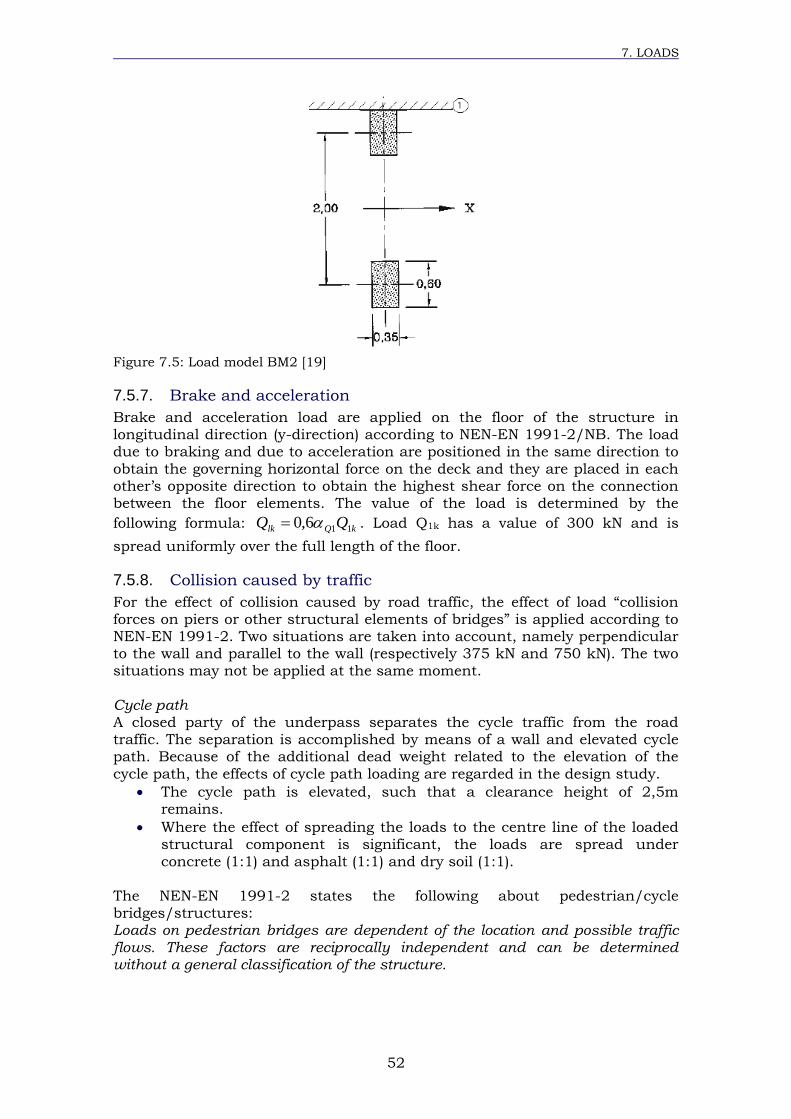
7. LOADS
52
Figure 7.5: Load model BM2 [19]
7.5.7. Brake and acceleration
Brake and acceleration load are applied on the floor of the structure in longitudinal direction (y-direction) according to NEN-EN 1991-2/NB. The load due to braking and due to acceleration are positioned in the same direction to
obtain the governing horizontal force on the deck and they are placed in each other’s opposite direction to obtain the highest shear force on the connection between the floor elements. The value of the load is determined by the
following formula: kQlk QQ 116,0 . Load Q1k has a value of 300 kN and is
spread uniformly over the full length of the floor.
7.5.8. Collision caused by traffic
For the effect of collision caused by road traffic, the effect of load “collision forces on piers or other structural elements of bridges” is applied according to NEN-EN 1991-2. Two situations are taken into account, namely perpendicular to the wall and parallel to the wall (respectively 375 kN and 750 kN). The two situations may not be applied at the same moment.
Cycle path A closed party of the underpass separates the cycle traffic from the road traffic. The separation is accomplished by means of a wall and elevated cycle path. Because of the additional dead weight related to the elevation of the
cycle path, the effects of cycle path loading are regarded in the design study.
The cycle path is elevated, such that a clearance height of 2,5m remains.
Where the effect of spreading the loads to the centre line of the loaded structural component is significant, the loads are spread under
concrete (1:1) and asphalt (1:1) and dry soil (1:1). The NEN-EN 1991-2 states the following about pedestrian/cycle bridges/structures: Loads on pedestrian bridges are dependent of the location and possible traffic flows. These factors are reciprocally independent and can be determined without a general classification of the structure.
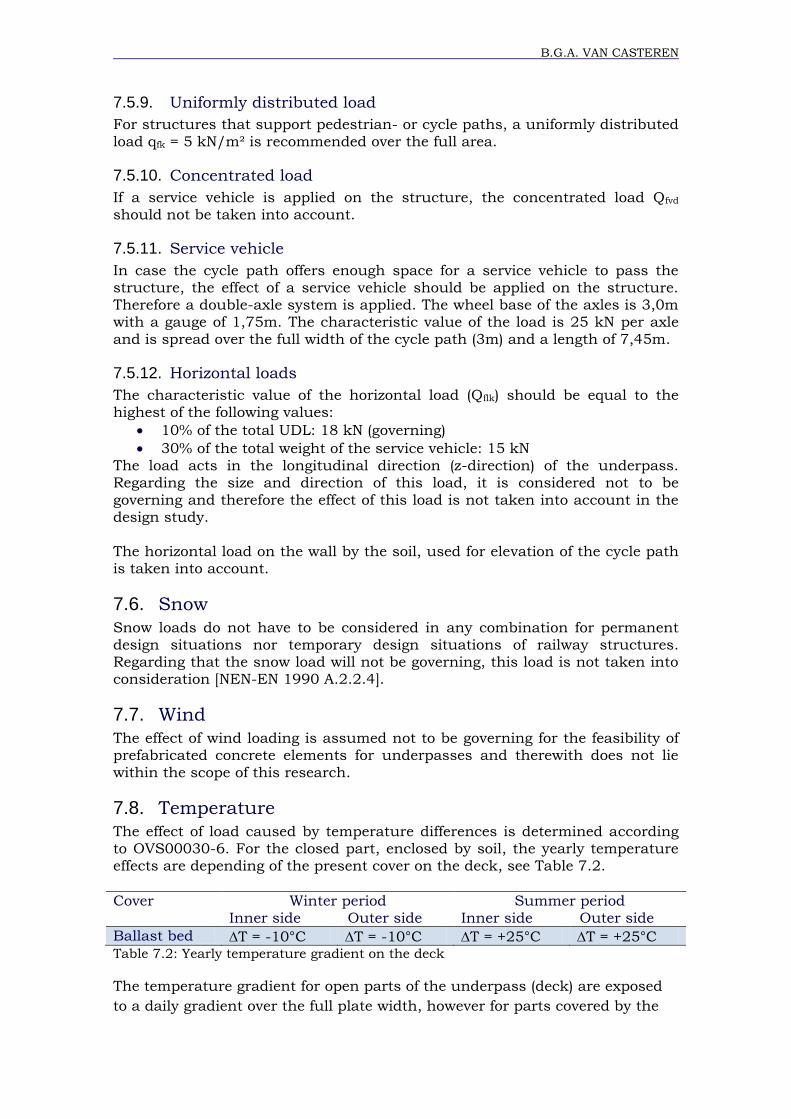
B.G.A. VAN CASTEREN
7.5.9. Uniformly distributed load
For structures that support pedestrian- or cycle paths, a uniformly distributed
load qfk = 5 kN/m² is recommended over the full area.
7.5.10. Concentrated load
If a service vehicle is applied on the structure, the concentrated load Qfvd should not be taken into account.
7.5.11. Service vehicle
In case the cycle path offers enough space for a service vehicle to pass the structure, the effect of a service vehicle should be applied on the structure. Therefore a double-axle system is applied. The wheel base of the axles is 3,0m with a gauge of 1,75m. The characteristic value of the load is 25 kN per axle
and is spread over the full width of the cycle path (3m) and a length of 7,45m.
7.5.12. Horizontal loads
The characteristic value of the horizontal load (Qflk) should be equal to the highest of the following values:
10% of the total UDL: 18 kN (governing)
30% of the total weight of the service vehicle: 15 kN
The load acts in the longitudinal direction (z-direction) of the underpass. Regarding the size and direction of this load, it is considered not to be
governing and therefore the effect of this load is not taken into account in the design study. The horizontal load on the wall by the soil, used for elevation of the cycle path is taken into account.
7.6. Snow
Snow loads do not have to be considered in any combination for permanent design situations nor temporary design situations of railway structures. Regarding that the snow load will not be governing, this load is not taken into consideration [NEN-EN 1990 A.2.2.4].
7.7. Wind
The effect of wind loading is assumed not to be governing for the feasibility of prefabricated concrete elements for underpasses and therewith does not lie
within the scope of this research.
7.8. Temperature
The effect of load caused by temperature differences is determined according to OVS00030-6. For the closed part, enclosed by soil, the yearly temperature effects are depending of the present cover on the deck, see Table 7.2.
Cover Winter period Inner side Outer side
Summer period Inner side Outer side
Ballast bed T = -10°C T = -10°C T = +25°C T = +25°C Table 7.2: Yearly temperature gradient on the deck
The temperature gradient for open parts of the underpass (deck) are exposed
to a daily gradient over the full plate width, however for parts covered by the
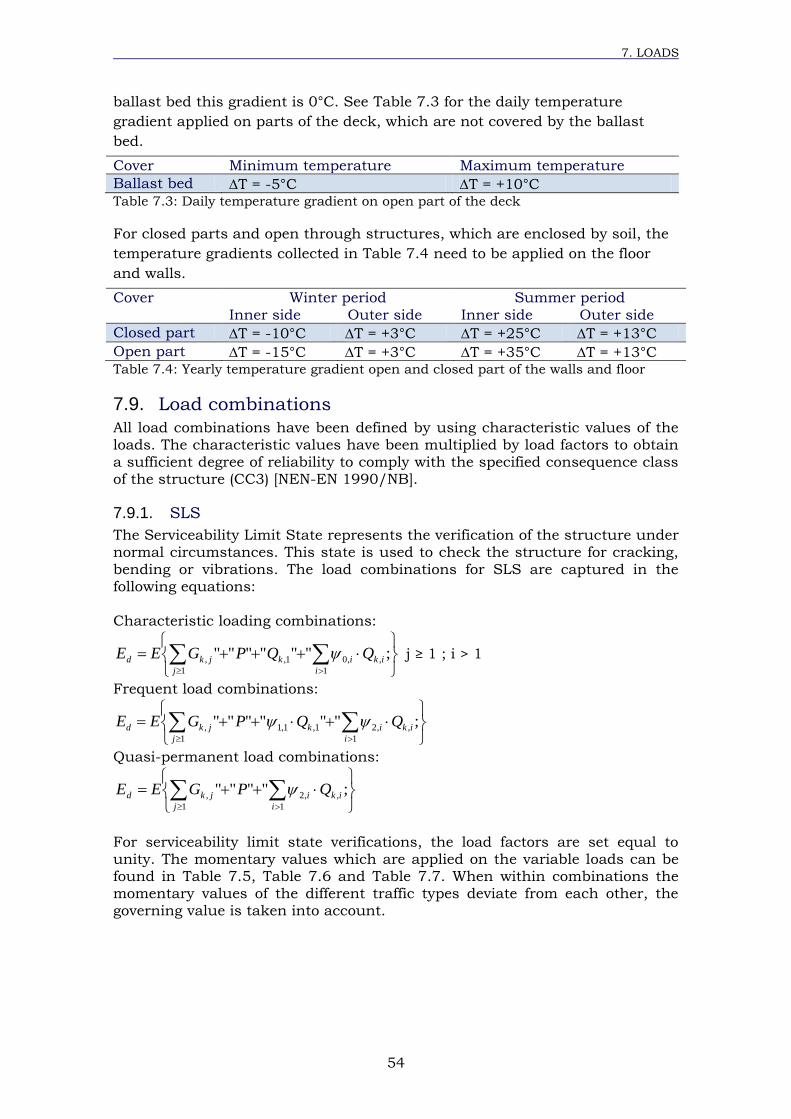
7. LOADS
54
ballast bed this gradient is 0°C. See Table 7.3 for the daily temperature
gradient applied on parts of the deck, which are not covered by the ballast
bed.
Cover Minimum temperature Maximum temperature
Ballast bed T = -5°C T = +10°C Table 7.3: Daily temperature gradient on open part of the deck
For closed parts and open through structures, which are enclosed by soil, the
temperature gradients collected in Table 7.4 need to be applied on the floor
and walls.
Cover Winter period
Inner side Outer side
Summer period
Inner side Outer side
Closed part T = -10°C T = +3°C T = +25°C T = +13°C
Open part T = -15°C T = +3°C T = +35°C T = +13°C Table 7.4: Yearly temperature gradient open and closed part of the walls and floor
7.9. Load combinations
All load combinations have been defined by using characteristic values of the loads. The characteristic values have been multiplied by load factors to obtain
a sufficient degree of reliability to comply with the specified consequence class of the structure (CC3) [NEN-EN 1990/NB].
7.9.1. SLS
The Serviceability Limit State represents the verification of the structure under normal circumstances. This state is used to check the structure for cracking,
bending or vibrations. The load combinations for SLS are captured in the following equations: Characteristic loading combinations:
;""""""1 1
,,01,,
j i
ikikjkd QQPGEE j ≥ 1 ; i > 1
Frequent load combinations:
;""""""1 1
,,21,1,1,
j i
ikikjkd QQPGEE
Quasi-permanent load combinations:
;""""1 1
,,2,
j i
ikijkd QPGEE
For serviceability limit state verifications, the load factors are set equal to unity. The momentary values which are applied on the variable loads can be found in Table 7.5, Table 7.6 and Table 7.7. When within combinations the momentary values of the different traffic types deviate from each other, the governing value is taken into account.
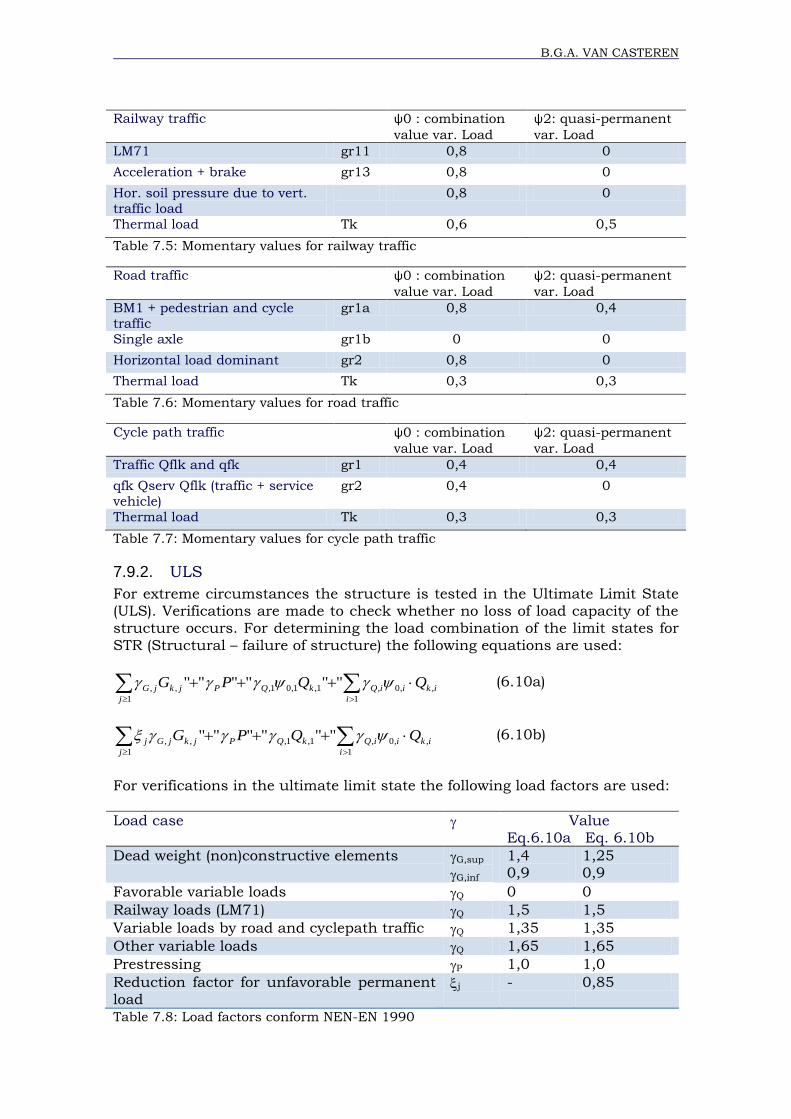
B.G.A. VAN CASTEREN
Railway traffic ψ0 : combination
value var. Load
ψ2: quasi-permanent
var. Load
LM71 gr11 0,8 0
Acceleration + brake gr13 0,8 0
Hor. soil pressure due to vert. traffic load
0,8 0
Thermal load Tk 0,6 0,5
Table 7.5: Momentary values for railway traffic
Road traffic ψ0 : combination
value var. Load
ψ2: quasi-permanent
var. Load
BM1 + pedestrian and cycle traffic
gr1a 0,8 0,4
Single axle gr1b 0 0
Horizontal load dominant gr2 0,8 0
Thermal load Tk 0,3 0,3
Table 7.6: Momentary values for road traffic
Cycle path traffic ψ0 : combination
value var. Load
ψ2: quasi-permanent
var. Load
Traffic Qflk and qfk gr1 0,4 0,4
qfk Qserv Qflk (traffic + service vehicle)
gr2 0,4 0
Thermal load Tk 0,3 0,3
Table 7.7: Momentary values for cycle path traffic
7.9.2. ULS
For extreme circumstances the structure is tested in the Ultimate Limit State (ULS). Verifications are made to check whether no loss of load capacity of the structure occurs. For determining the load combination of the limit states for
STR (Structural – failure of structure) the following equations are used:
1 1
,,0,1,1,01,,, """"""j i
ikiiQkQPjkjG QQPG (6.10a)
1 1
,,0,1,1,,, """"""j i
ikiiQkQPjkjGj QQPG (6.10b)
For verifications in the ultimate limit state the following load factors are used:
Load case Value Eq.6.10a Eq. 6.10b
Dead weight (non)constructive elements G,sup
G,inf
1,4 0,9
1,25 0,9
Favorable variable loads Q 0 0
Railway loads (LM71) Q 1,5 1,5
Variable loads by road and cyclepath traffic Q 1,35 1,35
Other variable loads Q 1,65 1,65
Prestressing P 1,0 1,0
Reduction factor for unfavorable permanent
load j - 0,85
Table 7.8: Load factors conform NEN-EN 1990

7. LOADS
56
An overview of all load cases, load combinations and load groups can be found
in Annex III.
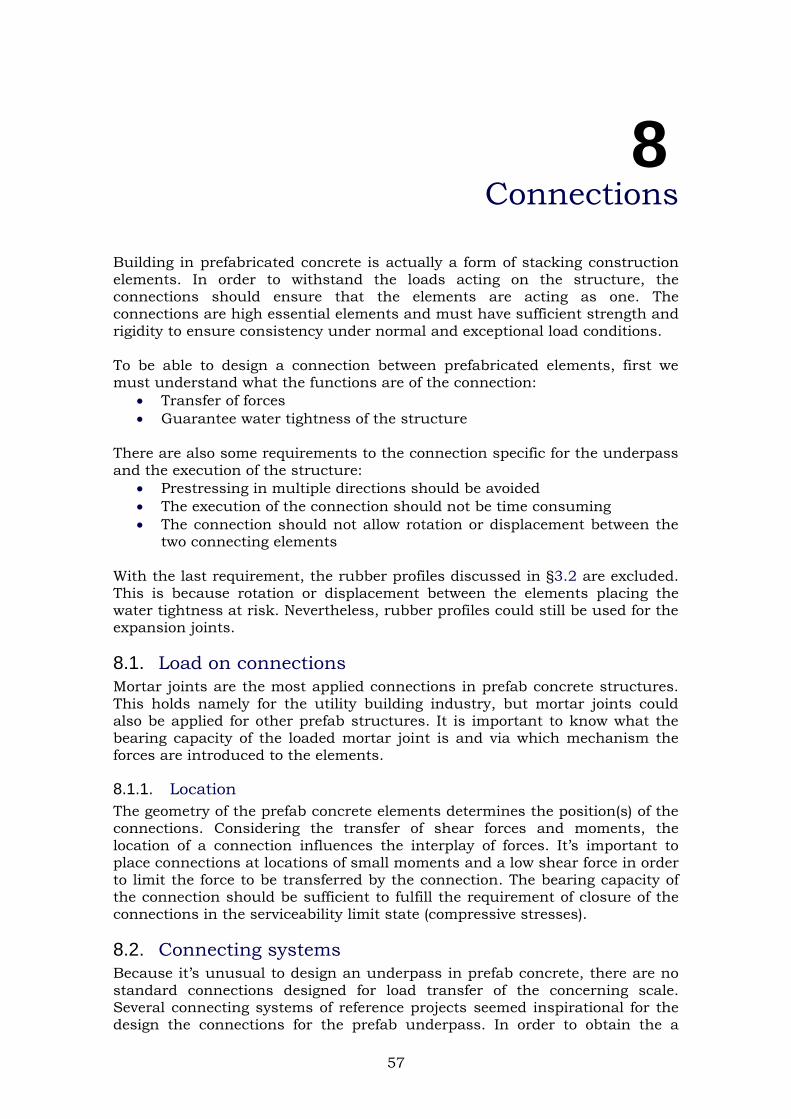
57
8 Connections
Building in prefabricated concrete is actually a form of stacking construction elements. In order to withstand the loads acting on the structure, the connections should ensure that the elements are acting as one. The connections are high essential elements and must have sufficient strength and
rigidity to ensure consistency under normal and exceptional load conditions. To be able to design a connection between prefabricated elements, first we must understand what the functions are of the connection:
Transfer of forces
Guarantee water tightness of the structure
There are also some requirements to the connection specific for the underpass
and the execution of the structure:
Prestressing in multiple directions should be avoided
The execution of the connection should not be time consuming
The connection should not allow rotation or displacement between the two connecting elements
With the last requirement, the rubber profiles discussed in §3.2 are excluded. This is because rotation or displacement between the elements placing the water tightness at risk. Nevertheless, rubber profiles could still be used for the expansion joints.
8.1. Load on connections
Mortar joints are the most applied connections in prefab concrete structures.
This holds namely for the utility building industry, but mortar joints could also be applied for other prefab structures. It is important to know what the bearing capacity of the loaded mortar joint is and via which mechanism the forces are introduced to the elements.
8.1.1. Location
The geometry of the prefab concrete elements determines the position(s) of the connections. Considering the transfer of shear forces and moments, the
location of a connection influences the interplay of forces. It’s important to place connections at locations of small moments and a low shear force in order to limit the force to be transferred by the connection. The bearing capacity of the connection should be sufficient to fulfill the requirement of closure of the connections in the serviceability limit state (compressive stresses).
8.2. Connecting systems
Because it’s unusual to design an underpass in prefab concrete, there are no
standard connections designed for load transfer of the concerning scale. Several connecting systems of reference projects seemed inspirational for the design the connections for the prefab underpass. In order to obtain the a
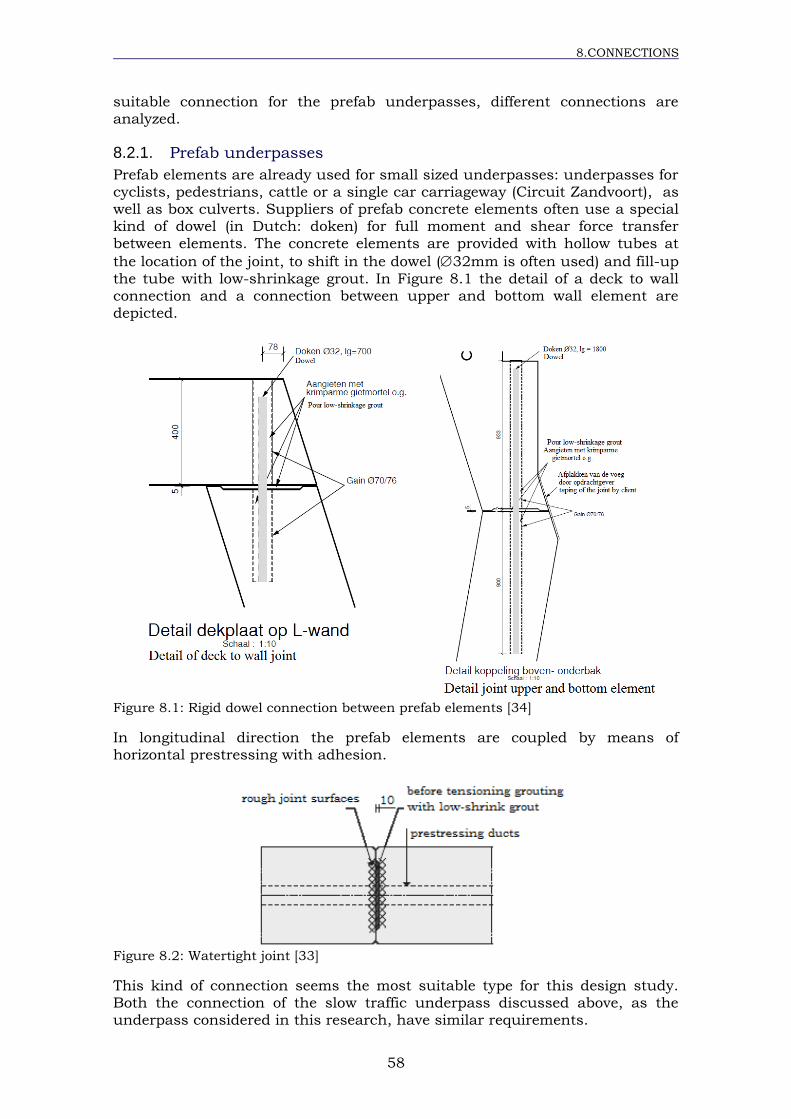
8.CONNECTIONS
58
suitable connection for the prefab underpasses, different connections are analyzed.
8.2.1. Prefab underpasses
Prefab elements are already used for small sized underpasses: underpasses for cyclists, pedestrians, cattle or a single car carriageway (Circuit Zandvoort), as well as box culverts. Suppliers of prefab concrete elements often use a special kind of dowel (in Dutch: doken) for full moment and shear force transfer
between elements. The concrete elements are provided with hollow tubes at
the location of the joint, to shift in the dowel (32mm is often used) and fill-up
the tube with low-shrinkage grout. In Figure 8.1 the detail of a deck to wall connection and a connection between upper and bottom wall element are depicted.
Figure 8.1: Rigid dowel connection between prefab elements [34]
In longitudinal direction the prefab elements are coupled by means of horizontal prestressing with adhesion.
Figure 8.2: Watertight joint [33]
This kind of connection seems the most suitable type for this design study. Both the connection of the slow traffic underpass discussed above, as the underpass considered in this research, have similar requirements.
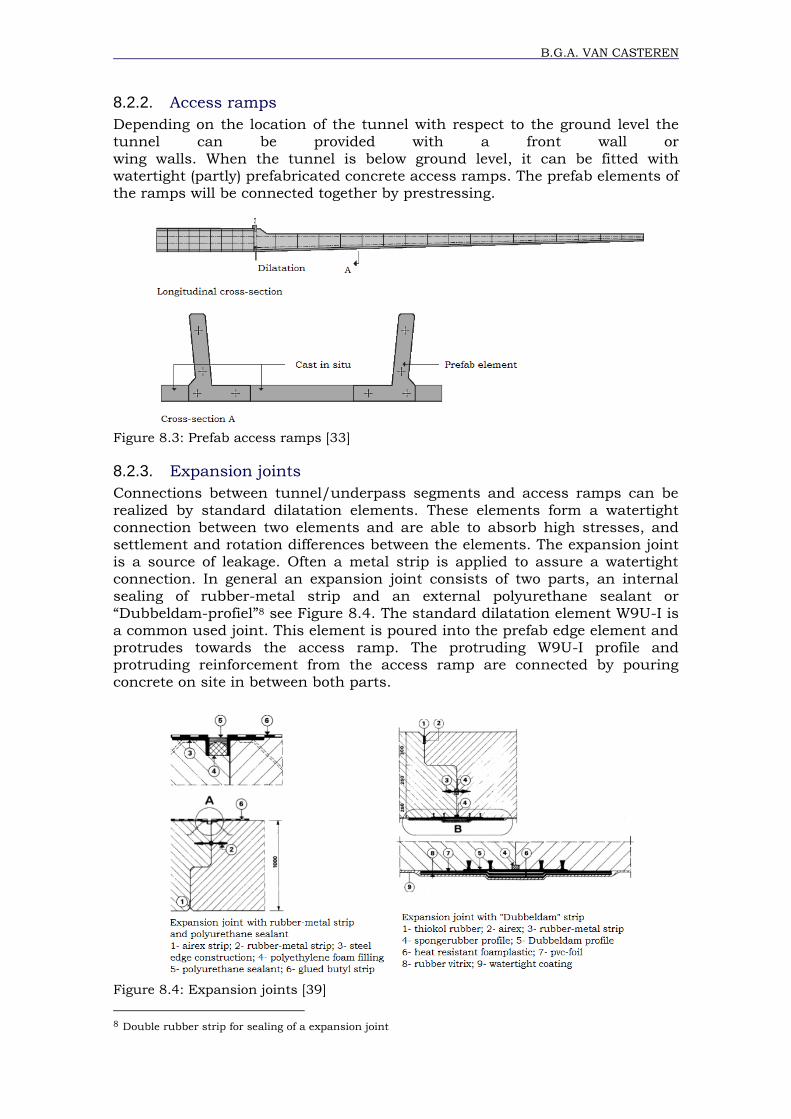
B.G.A. VAN CASTEREN
8.2.2. Access ramps
Depending on the location of the tunnel with respect to the ground level the
tunnel can be provided with a front wall or
wing walls. When the tunnel is below ground level, it can be fitted with watertight (partly) prefabricated concrete access ramps. The prefab elements of the ramps will be connected together by prestressing.
Figure 8.3: Prefab access ramps [33]
8.2.3. Expansion joints
Connections between tunnel/underpass segments and access ramps can be
realized by standard dilatation elements. These elements form a watertight connection between two elements and are able to absorb high stresses, and settlement and rotation differences between the elements. The expansion joint is a source of leakage. Often a metal strip is applied to assure a watertight connection. In general an expansion joint consists of two parts, an internal
sealing of rubber-metal strip and an external polyurethane sealant or “Dubbeldam-profiel”8 see Figure 8.4. The standard dilatation element W9U-I is a common used joint. This element is poured into the prefab edge element and protrudes towards the access ramp. The protruding W9U-I profile and protruding reinforcement from the access ramp are connected by pouring
concrete on site in between both parts.
Figure 8.4: Expansion joints [39]
8 Double rubber strip for sealing of a expansion joint
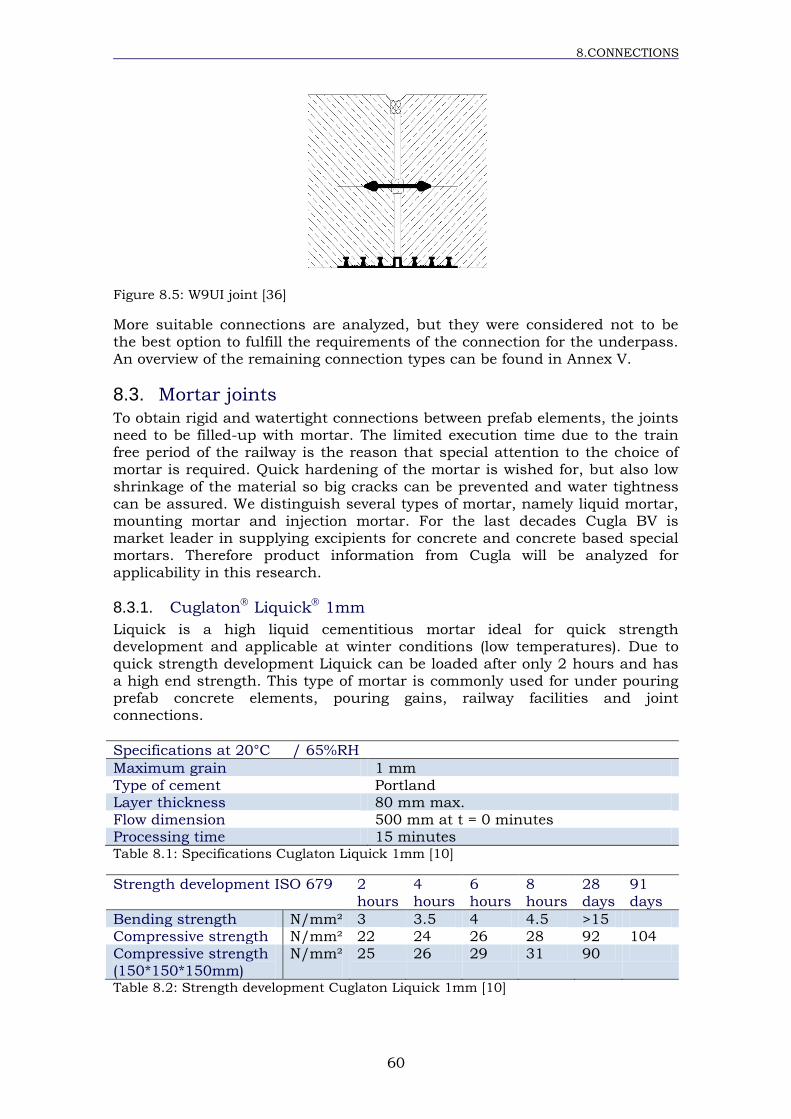
8.CONNECTIONS
60
Figure 8.5: W9UI joint [36]
More suitable connections are analyzed, but they were considered not to be
the best option to fulfill the requirements of the connection for the underpass. An overview of the remaining connection types can be found in Annex V.
8.3. Mortar joints
To obtain rigid and watertight connections between prefab elements, the joints need to be filled-up with mortar. The limited execution time due to the train free period of the railway is the reason that special attention to the choice of
mortar is required. Quick hardening of the mortar is wished for, but also low
shrinkage of the material so big cracks can be prevented and water tightness can be assured. We distinguish several types of mortar, namely liquid mortar, mounting mortar and injection mortar. For the last decades Cugla BV is market leader in supplying excipients for concrete and concrete based special mortars. Therefore product information from Cugla will be analyzed for
applicability in this research.
8.3.1. Cuglaton Liquick 1mm
Liquick is a high liquid cementitious mortar ideal for quick strength development and applicable at winter conditions (low temperatures). Due to
quick strength development Liquick can be loaded after only 2 hours and has a high end strength. This type of mortar is commonly used for under pouring prefab concrete elements, pouring gains, railway facilities and joint connections.
Specifications at 20°C / 65%RH
Maximum grain 1 mm
Type of cement Portland Layer thickness 80 mm max. Flow dimension 500 mm at t = 0 minutes Processing time 15 minutes Table 8.1: Specifications Cuglaton Liquick 1mm [10]
Strength development ISO 679 2
hours
4
hours
6
hours
8
hours
28
days
91
days
Bending strength N/mm² 3 3.5 4 4.5 >15 Compressive strength N/mm² 22 24 26 28 92 104
Compressive strength (150*150*150mm)
N/mm² 25 26 29 31 90
Table 8.2: Strength development Cuglaton Liquick 1mm [10]
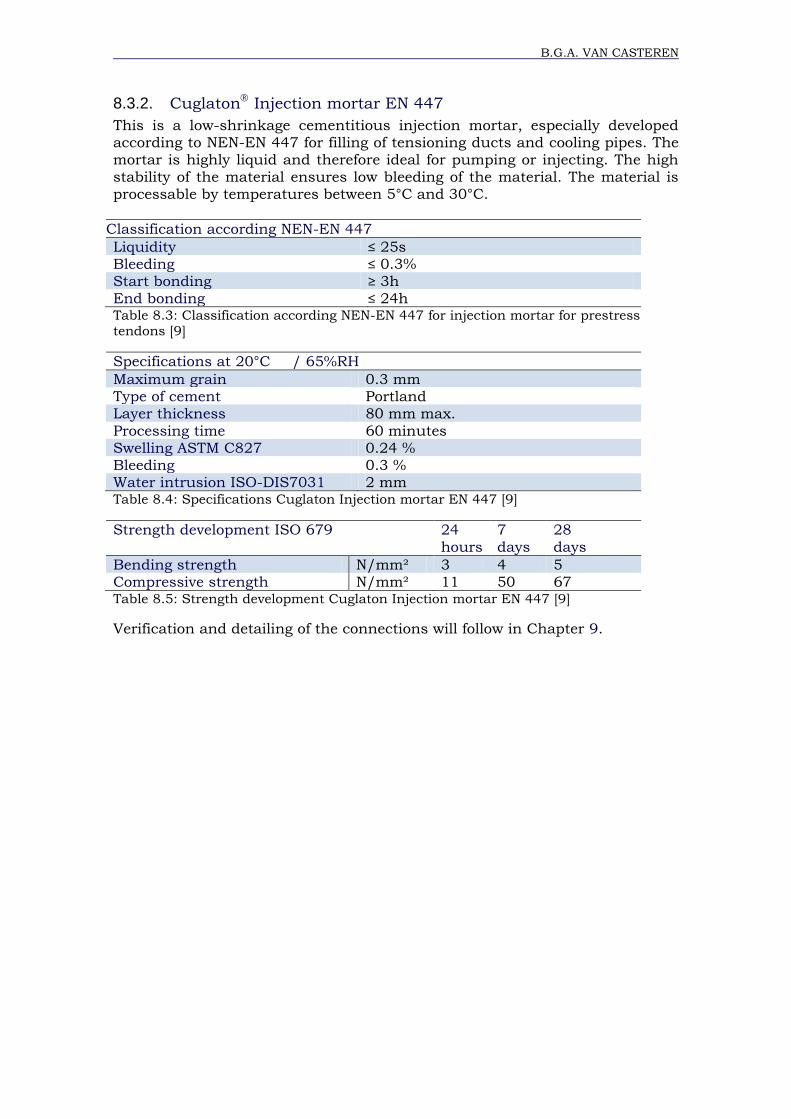
B.G.A. VAN CASTEREN
8.3.2. Cuglaton Injection mortar EN 447
This is a low-shrinkage cementitious injection mortar, especially developed according to NEN-EN 447 for filling of tensioning ducts and cooling pipes. The
mortar is highly liquid and therefore ideal for pumping or injecting. The high
stability of the material ensures low bleeding of the material. The material is processable by temperatures between 5°C and 30°C.
Classification according NEN-EN 447
Liquidity ≤ 25s Bleeding ≤ 0.3% Start bonding ≥ 3h
End bonding ≤ 24h Table 8.3: Classification according NEN-EN 447 for injection mortar for prestress tendons [9]
Specifications at 20°C / 65%RH
Maximum grain 0.3 mm Type of cement Portland Layer thickness 80 mm max.
Processing time 60 minutes Swelling ASTM C827 0.24 %
Bleeding 0.3 % Water intrusion ISO-DIS7031 2 mm Table 8.4: Specifications Cuglaton Injection mortar EN 447 [9]
Strength development ISO 679 24
hours
7
days
28
days
Bending strength N/mm² 3 4 5 Compressive strength N/mm² 11 50 67 Table 8.5: Strength development Cuglaton Injection mortar EN 447 [9]
Verification and detailing of the connections will follow in Chapter 9.

8.CONNECTIONS
62
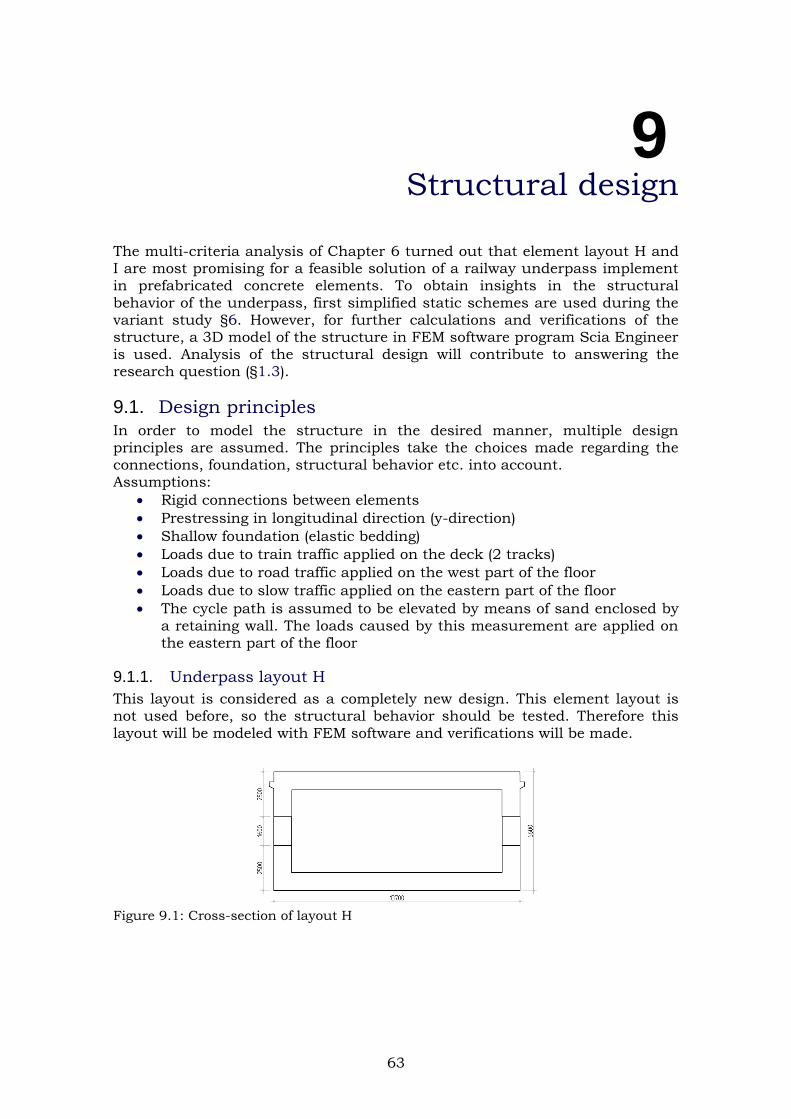
63
9 Structural design
The multi-criteria analysis of Chapter 6 turned out that element layout H and I are most promising for a feasible solution of a railway underpass implement in prefabricated concrete elements. To obtain insights in the structural
behavior of the underpass, first simplified static schemes are used during the variant study §6. However, for further calculations and verifications of the structure, a 3D model of the structure in FEM software program Scia Engineer is used. Analysis of the structural design will contribute to answering the research question (§1.3).
9.1. Design principles
In order to model the structure in the desired manner, multiple design principles are assumed. The principles take the choices made regarding the
connections, foundation, structural behavior etc. into account. Assumptions:
Rigid connections between elements
Prestressing in longitudinal direction (y-direction)
Shallow foundation (elastic bedding)
Loads due to train traffic applied on the deck (2 tracks)
Loads due to road traffic applied on the west part of the floor
Loads due to slow traffic applied on the eastern part of the floor
The cycle path is assumed to be elevated by means of sand enclosed by
a retaining wall. The loads caused by this measurement are applied on the eastern part of the floor
9.1.1. Underpass layout H
This layout is considered as a completely new design. This element layout is not used before, so the structural behavior should be tested. Therefore this
layout will be modeled with FEM software and verifications will be made.
Figure 9.1: Cross-section of layout H
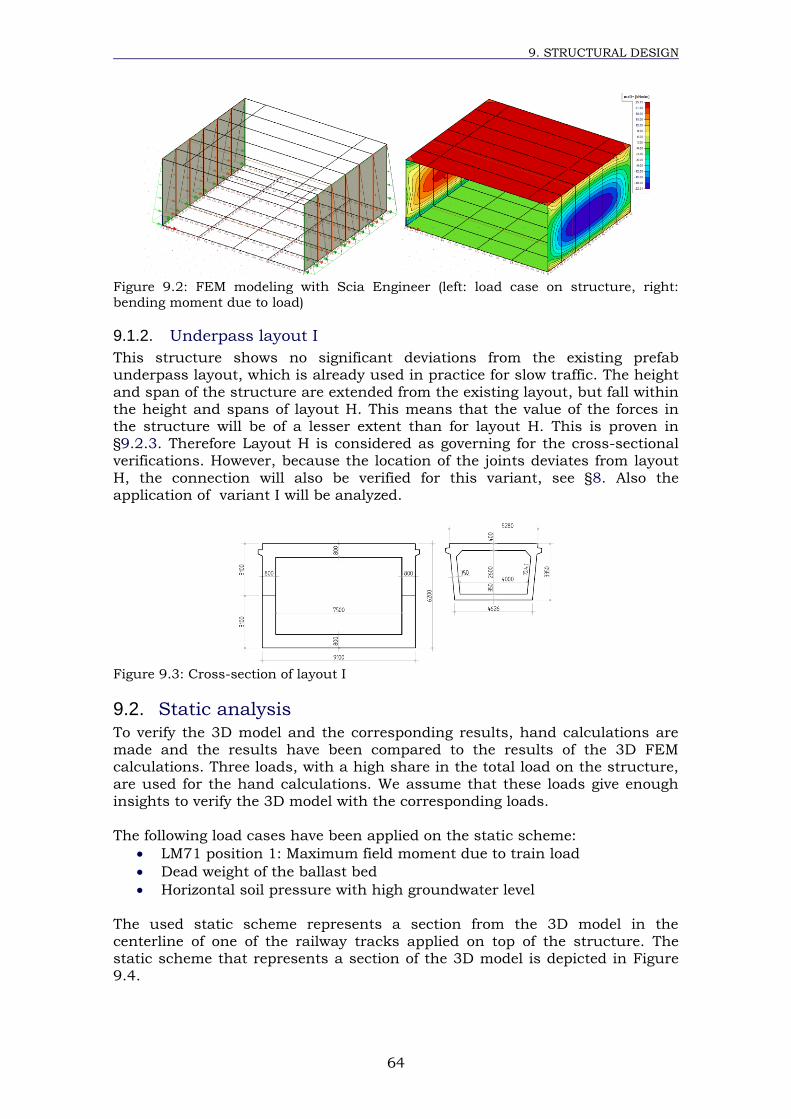
9. STRUCTURAL DESIGN
64
Figure 9.2: FEM modeling with Scia Engineer (left: load case on structure, right: bending moment due to load)
9.1.2. Underpass layout I
This structure shows no significant deviations from the existing prefab underpass layout, which is already used in practice for slow traffic. The height
and span of the structure are extended from the existing layout, but fall within the height and spans of layout H. This means that the value of the forces in the structure will be of a lesser extent than for layout H. This is proven in §9.2.3. Therefore Layout H is considered as governing for the cross-sectional
verifications. However, because the location of the joints deviates from layout
H, the connection will also be verified for this variant, see §8. Also the application of variant I will be analyzed.
Figure 9.3: Cross-section of layout I
9.2. Static analysis
To verify the 3D model and the corresponding results, hand calculations are made and the results have been compared to the results of the 3D FEM calculations. Three loads, with a high share in the total load on the structure,
are used for the hand calculations. We assume that these loads give enough
insights to verify the 3D model with the corresponding loads. The following load cases have been applied on the static scheme:
LM71 position 1: Maximum field moment due to train load
Dead weight of the ballast bed
Horizontal soil pressure with high groundwater level The used static scheme represents a section from the 3D model in the
centerline of one of the railway tracks applied on top of the structure. The static scheme that represents a section of the 3D model is depicted in Figure 9.4.
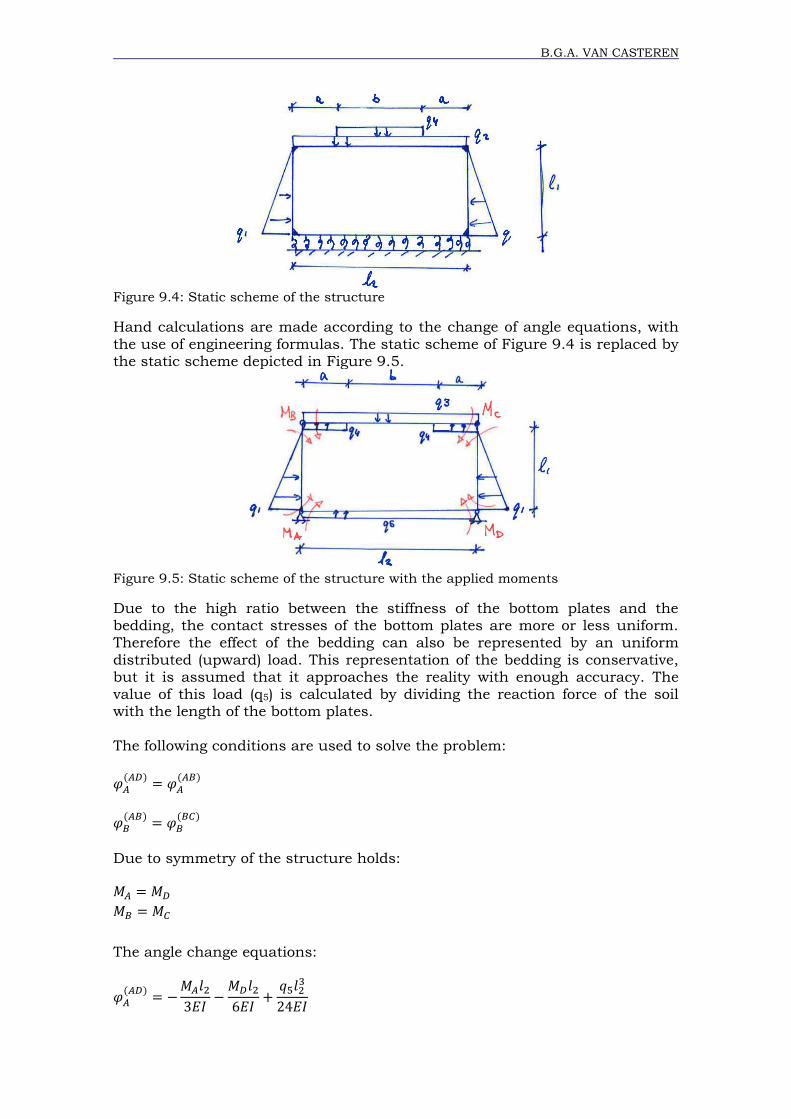
B.G.A. VAN CASTEREN
Figure 9.4: Static scheme of the structure
Hand calculations are made according to the change of angle equations, with
the use of engineering formulas. The static scheme of Figure 9.4 is replaced by the static scheme depicted in Figure 9.5.
Figure 9.5: Static scheme of the structure with the applied moments
Due to the high ratio between the stiffness of the bottom plates and the bedding, the contact stresses of the bottom plates are more or less uniform. Therefore the effect of the bedding can also be represented by an uniform
distributed (upward) load. This representation of the bedding is conservative, but it is assumed that it approaches the reality with enough accuracy. The value of this load (q5) is calculated by dividing the reaction force of the soil with the length of the bottom plates.
The following conditions are used to solve the problem:
Due to symmetry of the structure holds:
The angle change equations:
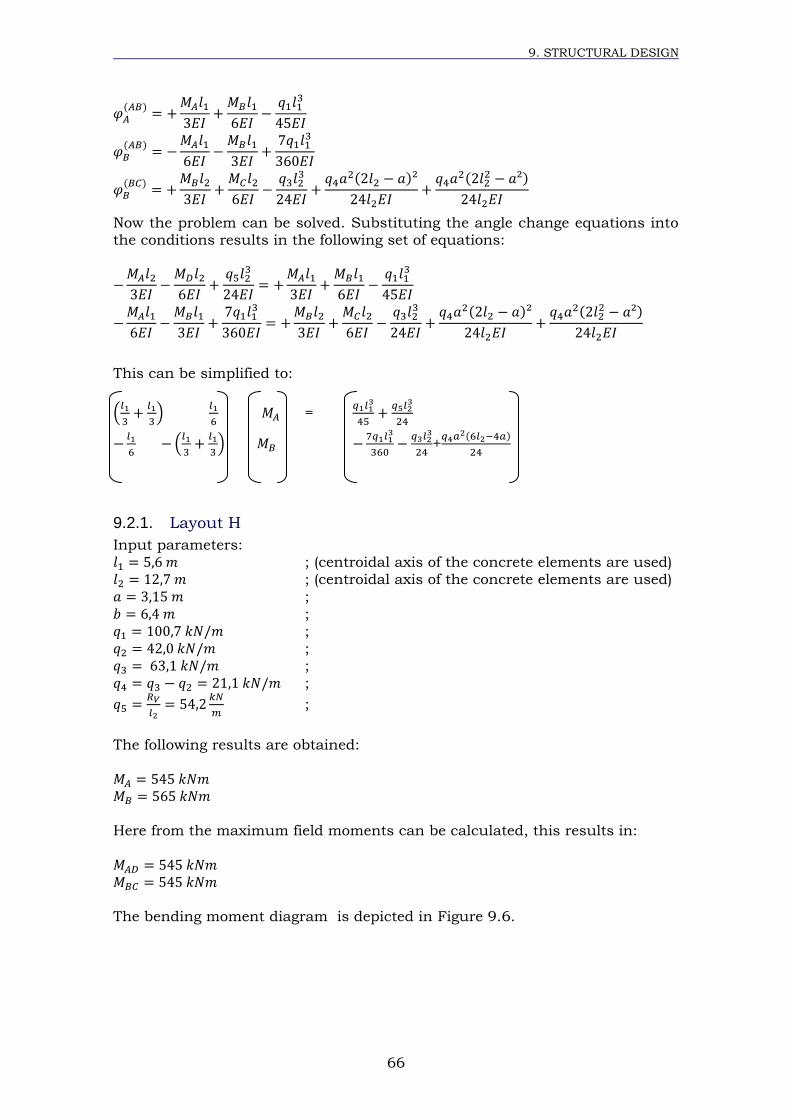
9. STRUCTURAL DESIGN
66
Now the problem can be solved. Substituting the angle change equations into the conditions results in the following set of equations:
This can be simplified to:
=
+
9.2.1. Layout H
Input parameters:
; (centroidal axis of the concrete elements are used)
; (centroidal axis of the concrete elements are used)
;
;
;
;
;
;
;
The following results are obtained:
Here from the maximum field moments can be calculated, this results in:
The bending moment diagram is depicted in Figure 9.6.
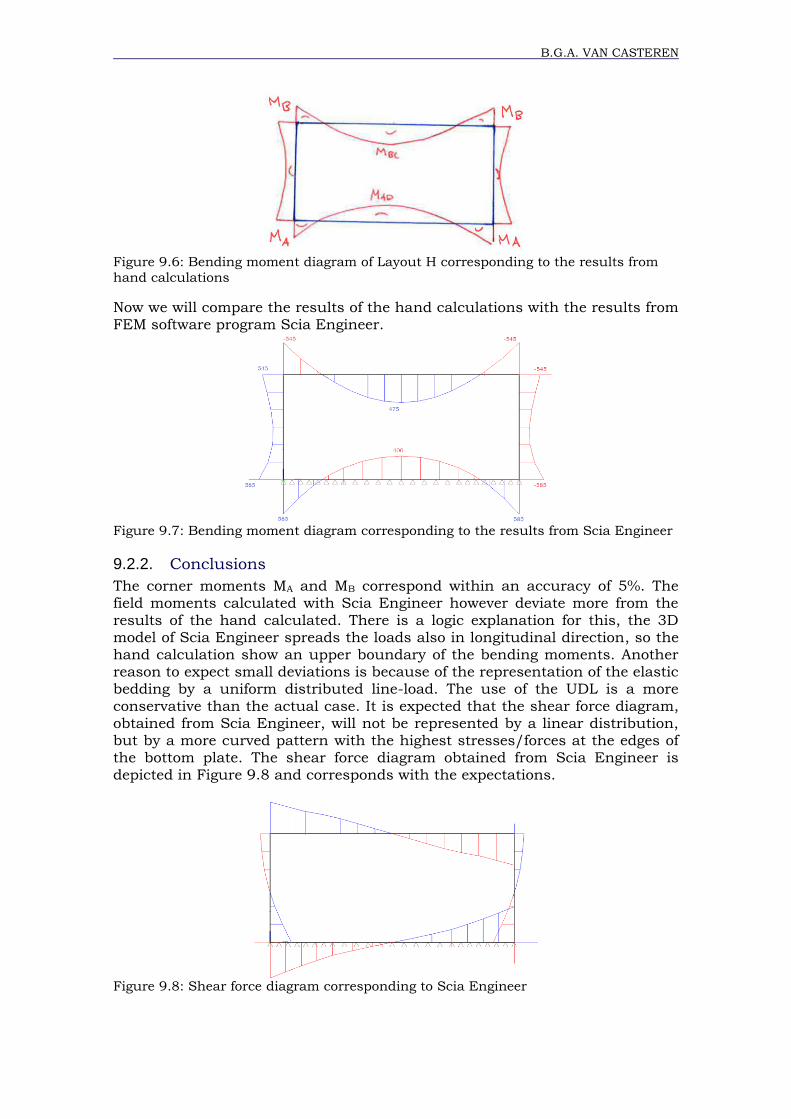
B.G.A. VAN CASTEREN
Figure 9.6: Bending moment diagram of Layout H corresponding to the results from hand calculations
Now we will compare the results of the hand calculations with the results from FEM software program Scia Engineer.
Figure 9.7: Bending moment diagram corresponding to the results from Scia Engineer
9.2.2. Conclusions
The corner moments MA and MB correspond within an accuracy of 5%. The field moments calculated with Scia Engineer however deviate more from the
results of the hand calculated. There is a logic explanation for this, the 3D model of Scia Engineer spreads the loads also in longitudinal direction, so the hand calculation show an upper boundary of the bending moments. Another reason to expect small deviations is because of the representation of the elastic bedding by a uniform distributed line-load. The use of the UDL is a more
conservative than the actual case. It is expected that the shear force diagram, obtained from Scia Engineer, will not be represented by a linear distribution, but by a more curved pattern with the highest stresses/forces at the edges of the bottom plate. The shear force diagram obtained from Scia Engineer is
depicted in Figure 9.8 and corresponds with the expectations.
Figure 9.8: Shear force diagram corresponding to Scia Engineer
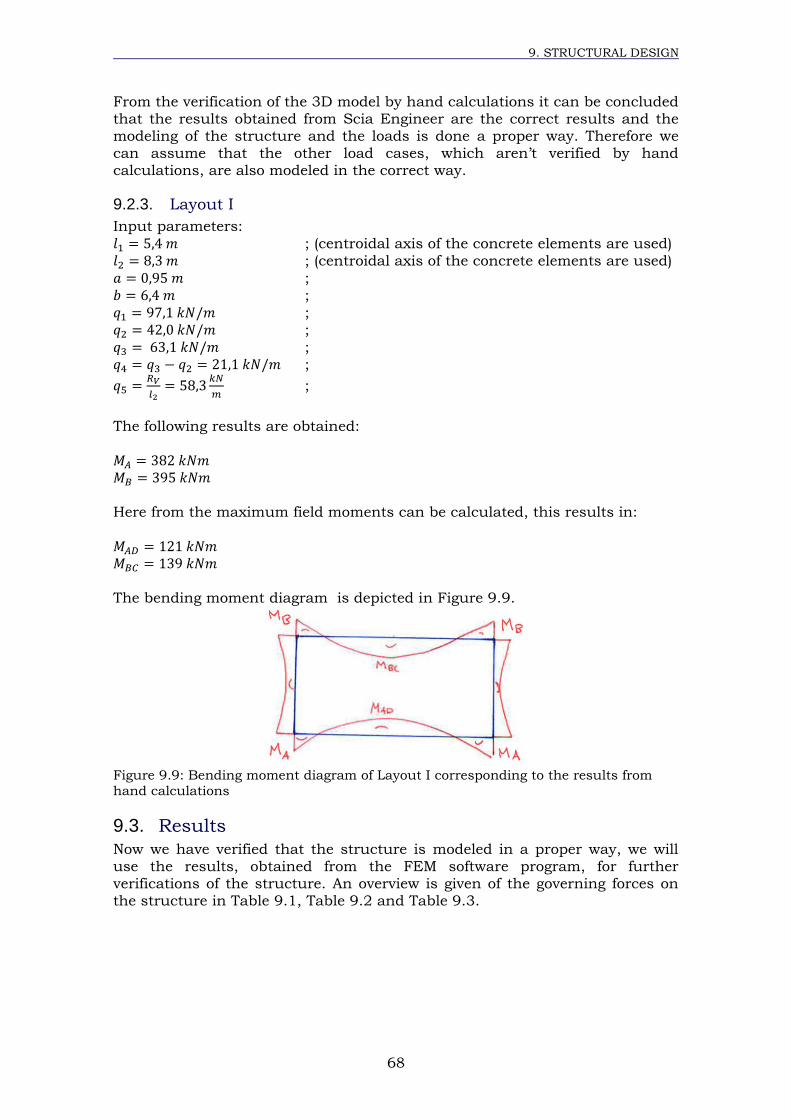
9. STRUCTURAL DESIGN
68
From the verification of the 3D model by hand calculations it can be concluded that the results obtained from Scia Engineer are the correct results and the modeling of the structure and the loads is done a proper way. Therefore we
can assume that the other load cases, which aren’t verified by hand calculations, are also modeled in the correct way.
9.2.3. Layout I
Input parameters:
; (centroidal axis of the concrete elements are used)
; (centroidal axis of the concrete elements are used)
;
;
;
;
;
;
;
The following results are obtained:
Here from the maximum field moments can be calculated, this results in:
The bending moment diagram is depicted in Figure 9.9.
Figure 9.9: Bending moment diagram of Layout I corresponding to the results from hand calculations
9.3. Results
Now we have verified that the structure is modeled in a proper way, we will
use the results, obtained from the FEM software program, for further verifications of the structure. An overview is given of the governing forces on the structure in Table 9.1, Table 9.2 and Table 9.3.
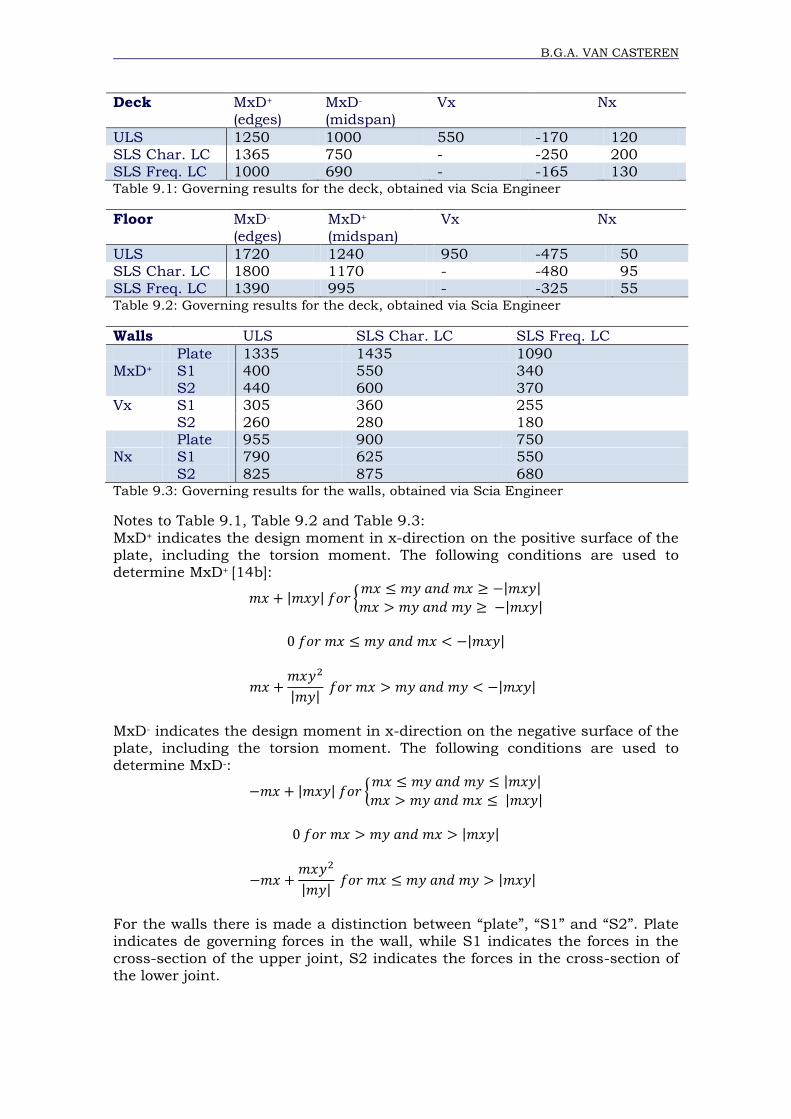
B.G.A. VAN CASTEREN
Deck MxD+ (edges)
MxD- (midspan)
Vx Nx
ULS 1250 1000 550 -170 120
SLS Char. LC 1365 750 - -250 200 SLS Freq. LC 1000 690 - -165 130 Table 9.1: Governing results for the deck, obtained via Scia Engineer
Floor MxD-
(edges)
MxD+
(midspan)
Vx Nx
ULS 1720 1240 950 -475 50 SLS Char. LC 1800 1170 - -480 95 SLS Freq. LC 1390 995 - -325 55 Table 9.2: Governing results for the deck, obtained via Scia Engineer
Walls ULS SLS Char. LC SLS Freq. LC
Plate 1335 1435 1090 MxD+ S1 400 550 340
S2 440 600 370 Vx S1 305 360 255 S2 260 280 180 Plate 955 900 750 Nx S1 790 625 550
S2 825 875 680 Table 9.3: Governing results for the walls, obtained via Scia Engineer
Notes to Table 9.1, Table 9.2 and Table 9.3:
MxD+ indicates the design moment in x-direction on the positive surface of the plate, including the torsion moment. The following conditions are used to determine MxD+ [14b]:
MxD- indicates the design moment in x-direction on the negative surface of the plate, including the torsion moment. The following conditions are used to determine MxD-:
For the walls there is made a distinction between “plate”, “S1” and “S2”. Plate indicates de governing forces in the wall, while S1 indicates the forces in the
cross-section of the upper joint, S2 indicates the forces in the cross-section of the lower joint.
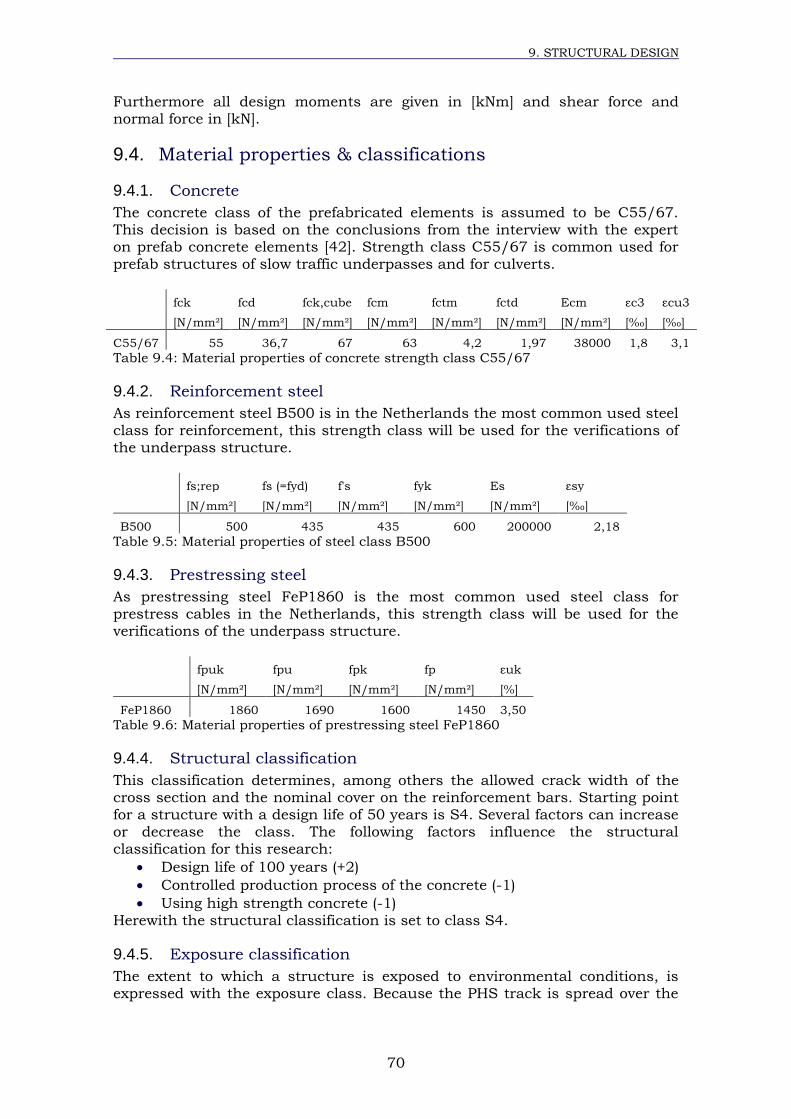
9. STRUCTURAL DESIGN
70
Furthermore all design moments are given in [kNm] and shear force and normal force in [kN].
9.4. Material properties & classifications
9.4.1. Concrete
The concrete class of the prefabricated elements is assumed to be C55/67. This decision is based on the conclusions from the interview with the expert on prefab concrete elements [42]. Strength class C55/67 is common used for prefab structures of slow traffic underpasses and for culverts.
fck fcd fck,cube fcm fctm fctd Ecm εc3 εcu3
[N/mm²] [N/mm²] [N/mm²] [N/mm²] [N/mm²] [N/mm²] [N/mm²] [‰] [‰]
C55/67 55 36,7 67 63 4,2 1,97 38000 1,8 3,1
Table 9.4: Material properties of concrete strength class C55/67
9.4.2. Reinforcement steel
As reinforcement steel B500 is in the Netherlands the most common used steel
class for reinforcement, this strength class will be used for the verifications of the underpass structure.
fs;rep fs (=fyd) f's fyk Es εsy
[N/mm²] [N/mm²] [N/mm²] [N/mm²] [N/mm²] [‰]
B500 500 435 435 600 200000 2,18
Table 9.5: Material properties of steel class B500
9.4.3. Prestressing steel
As prestressing steel FeP1860 is the most common used steel class for prestress cables in the Netherlands, this strength class will be used for the verifications of the underpass structure.
fpuk fpu fpk fp εuk
[N/mm²] [N/mm²] [N/mm²] [N/mm²] [%]
FeP1860 1860 1690 1600 1450 3,50
Table 9.6: Material properties of prestressing steel FeP1860
9.4.4. Structural classification
This classification determines, among others the allowed crack width of the cross section and the nominal cover on the reinforcement bars. Starting point for a structure with a design life of 50 years is S4. Several factors can increase or decrease the class. The following factors influence the structural classification for this research:
Design life of 100 years (+2)
Controlled production process of the concrete (-1)
Using high strength concrete (-1)
Herewith the structural classification is set to class S4.
9.4.5. Exposure classification
The extent to which a structure is exposed to environmental conditions, is expressed with the exposure class. Because the PHS track is spread over the
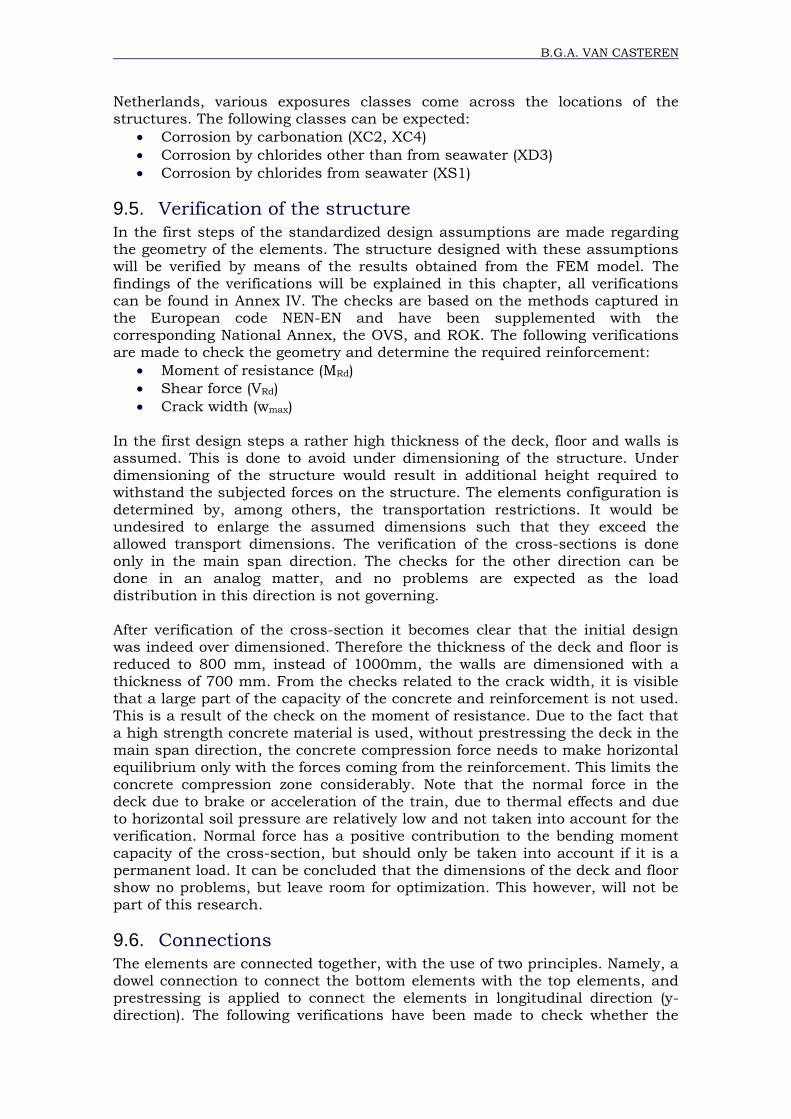
B.G.A. VAN CASTEREN
Netherlands, various exposures classes come across the locations of the structures. The following classes can be expected:
Corrosion by carbonation (XC2, XC4)
Corrosion by chlorides other than from seawater (XD3)
Corrosion by chlorides from seawater (XS1)
9.5. Verification of the structure
In the first steps of the standardized design assumptions are made regarding the geometry of the elements. The structure designed with these assumptions will be verified by means of the results obtained from the FEM model. The
findings of the verifications will be explained in this chapter, all verifications can be found in Annex IV. The checks are based on the methods captured in the European code NEN-EN and have been supplemented with the corresponding National Annex, the OVS, and ROK. The following verifications are made to check the geometry and determine the required reinforcement:
Moment of resistance (MRd)
Shear force (VRd)
Crack width (wmax)
In the first design steps a rather high thickness of the deck, floor and walls is assumed. This is done to avoid under dimensioning of the structure. Under
dimensioning of the structure would result in additional height required to withstand the subjected forces on the structure. The elements configuration is
determined by, among others, the transportation restrictions. It would be undesired to enlarge the assumed dimensions such that they exceed the allowed transport dimensions. The verification of the cross-sections is done only in the main span direction. The checks for the other direction can be done in an analog matter, and no problems are expected as the load
distribution in this direction is not governing. After verification of the cross-section it becomes clear that the initial design was indeed over dimensioned. Therefore the thickness of the deck and floor is reduced to 800 mm, instead of 1000mm, the walls are dimensioned with a
thickness of 700 mm. From the checks related to the crack width, it is visible that a large part of the capacity of the concrete and reinforcement is not used. This is a result of the check on the moment of resistance. Due to the fact that a high strength concrete material is used, without prestressing the deck in the main span direction, the concrete compression force needs to make horizontal
equilibrium only with the forces coming from the reinforcement. This limits the
concrete compression zone considerably. Note that the normal force in the deck due to brake or acceleration of the train, due to thermal effects and due to horizontal soil pressure are relatively low and not taken into account for the verification. Normal force has a positive contribution to the bending moment
capacity of the cross-section, but should only be taken into account if it is a permanent load. It can be concluded that the dimensions of the deck and floor show no problems, but leave room for optimization. This however, will not be part of this research.
9.6. Connections
The elements are connected together, with the use of two principles. Namely, a dowel connection to connect the bottom elements with the top elements, and
prestressing is applied to connect the elements in longitudinal direction (y-direction). The following verifications have been made to check whether the
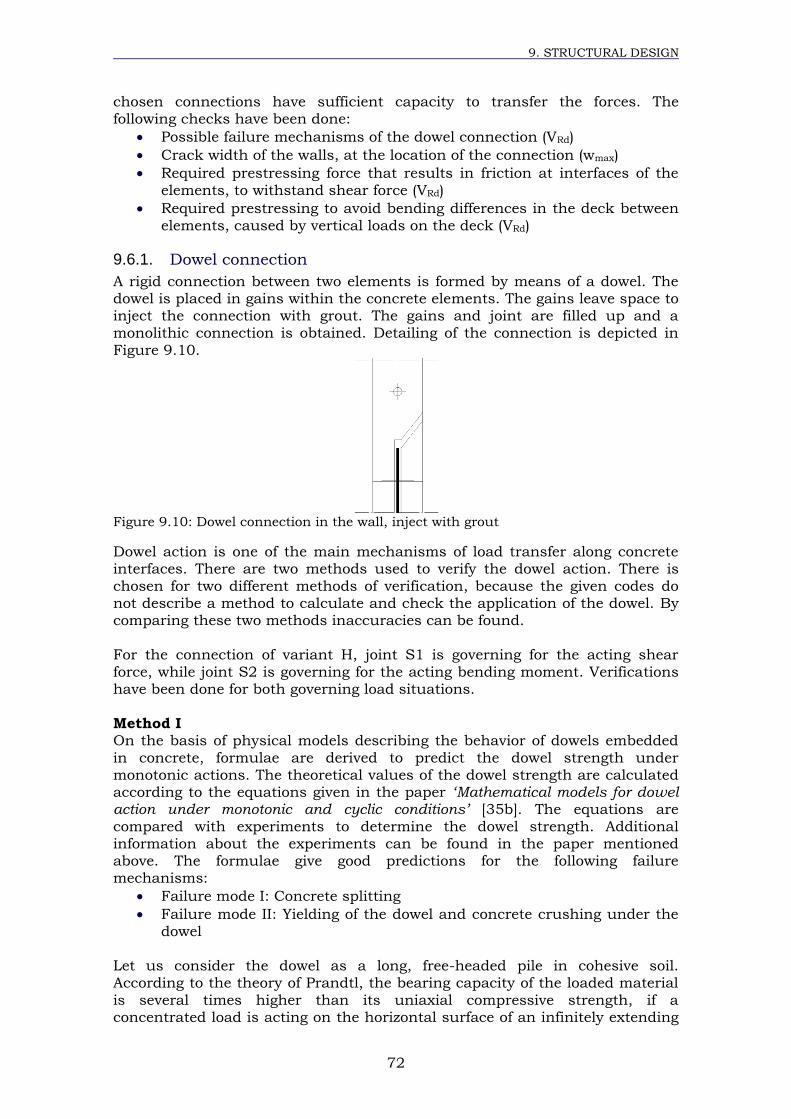
9. STRUCTURAL DESIGN
72
chosen connections have sufficient capacity to transfer the forces. The following checks have been done:
Possible failure mechanisms of the dowel connection (VRd)
Crack width of the walls, at the location of the connection (wmax)
Required prestressing force that results in friction at interfaces of the
elements, to withstand shear force (VRd)
Required prestressing to avoid bending differences in the deck between
elements, caused by vertical loads on the deck (VRd)
9.6.1. Dowel connection
A rigid connection between two elements is formed by means of a dowel. The dowel is placed in gains within the concrete elements. The gains leave space to inject the connection with grout. The gains and joint are filled up and a monolithic connection is obtained. Detailing of the connection is depicted in
Figure 9.10.
Figure 9.10: Dowel connection in the wall, inject with grout
Dowel action is one of the main mechanisms of load transfer along concrete interfaces. There are two methods used to verify the dowel action. There is
chosen for two different methods of verification, because the given codes do not describe a method to calculate and check the application of the dowel. By comparing these two methods inaccuracies can be found. For the connection of variant H, joint S1 is governing for the acting shear
force, while joint S2 is governing for the acting bending moment. Verifications have been done for both governing load situations. Method I On the basis of physical models describing the behavior of dowels embedded
in concrete, formulae are derived to predict the dowel strength under
monotonic actions. The theoretical values of the dowel strength are calculated according to the equations given in the paper ‘Mathematical models for dowel action under monotonic and cyclic conditions’ [35b]. The equations are
compared with experiments to determine the dowel strength. Additional information about the experiments can be found in the paper mentioned above. The formulae give good predictions for the following failure mechanisms:
Failure mode I: Concrete splitting
Failure mode II: Yielding of the dowel and concrete crushing under the
dowel Let us consider the dowel as a long, free-headed pile in cohesive soil. According to the theory of Prandtl, the bearing capacity of the loaded material
is several times higher than its uniaxial compressive strength, if a concentrated load is acting on the horizontal surface of an infinitely extending
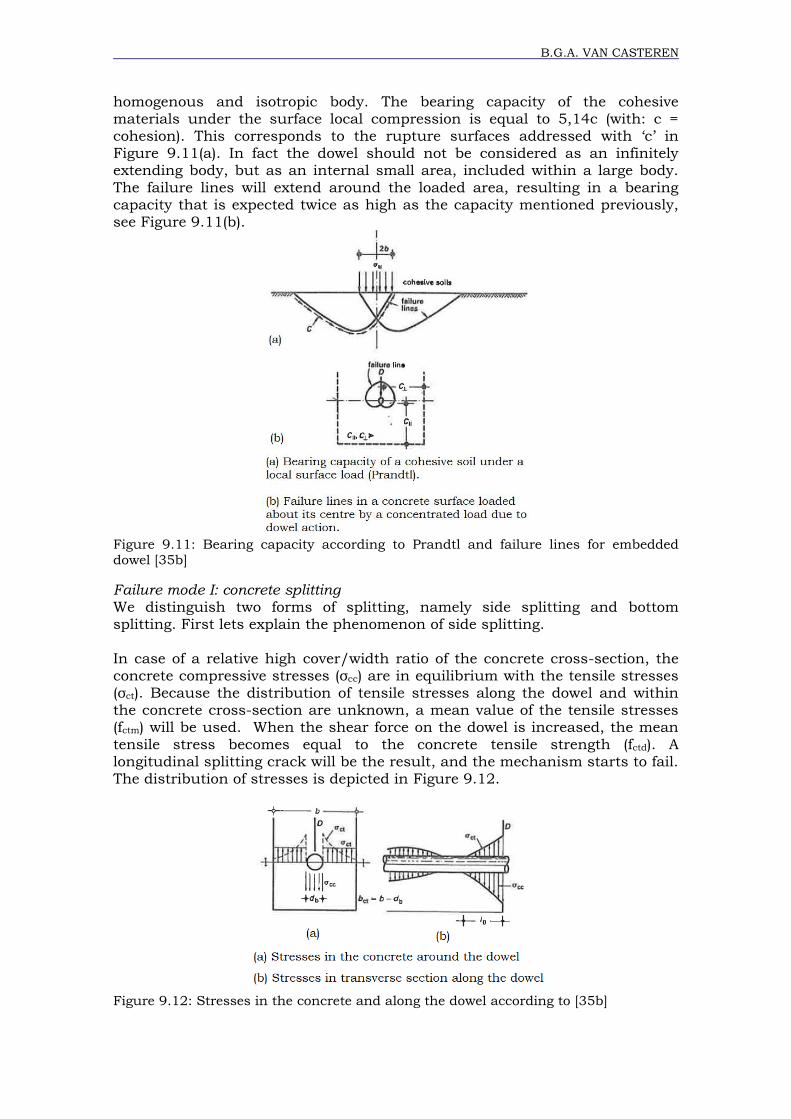
B.G.A. VAN CASTEREN
homogenous and isotropic body. The bearing capacity of the cohesive materials under the surface local compression is equal to 5,14c (with: c = cohesion). This corresponds to the rupture surfaces addressed with ‘c’ in
Figure 9.11(a). In fact the dowel should not be considered as an infinitely extending body, but as an internal small area, included within a large body.
The failure lines will extend around the loaded area, resulting in a bearing capacity that is expected twice as high as the capacity mentioned previously, see Figure 9.11(b).
Figure 9.11: Bearing capacity according to Prandtl and failure lines for embedded dowel [35b]
Failure mode I: concrete splitting We distinguish two forms of splitting, namely side splitting and bottom splitting. First lets explain the phenomenon of side splitting.
In case of a relative high cover/width ratio of the concrete cross-section, the concrete compressive stresses (σcc) are in equilibrium with the tensile stresses (σct). Because the distribution of tensile stresses along the dowel and within the concrete cross-section are unknown, a mean value of the tensile stresses (fctm) will be used. When the shear force on the dowel is increased, the mean
tensile stress becomes equal to the concrete tensile strength (fctd). A longitudinal splitting crack will be the result, and the mechanism starts to fail.
The distribution of stresses is depicted in Figure 9.12.
Figure 9.12: Stresses in the concrete and along the dowel according to [35b]
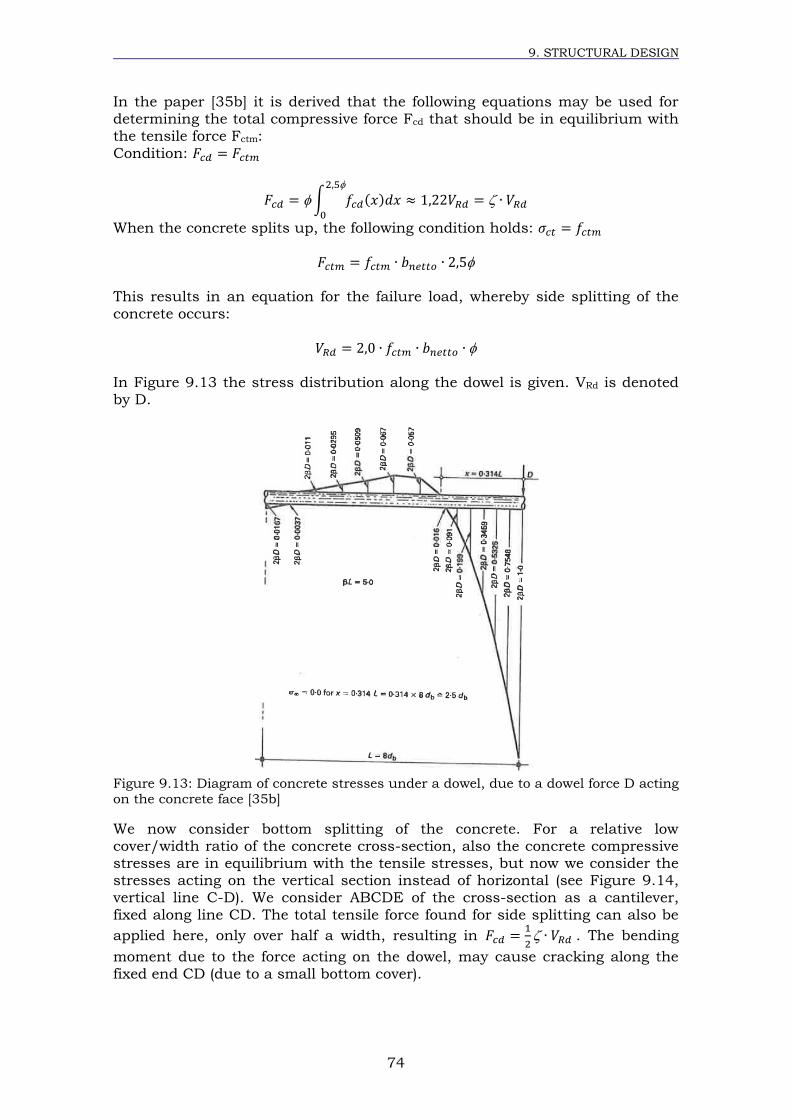
9. STRUCTURAL DESIGN
74
In the paper [35b] it is derived that the following equations may be used for determining the total compressive force Fcd that should be in equilibrium with the tensile force Fctm:
Condition:
When the concrete splits up, the following condition holds:
This results in an equation for the failure load, whereby side splitting of the
concrete occurs:
In Figure 9.13 the stress distribution along the dowel is given. VRd is denoted by D.
Figure 9.13: Diagram of concrete stresses under a dowel, due to a dowel force D acting on the concrete face [35b]
We now consider bottom splitting of the concrete. For a relative low cover/width ratio of the concrete cross-section, also the concrete compressive stresses are in equilibrium with the tensile stresses, but now we consider the stresses acting on the vertical section instead of horizontal (see Figure 9.14, vertical line C-D). We consider ABCDE of the cross-section as a cantilever,
fixed along line CD. The total tensile force found for side splitting can also be
applied here, only over half a width, resulting in
. The bending
moment due to the force acting on the dowel, may cause cracking along the fixed end CD (due to a small bottom cover).
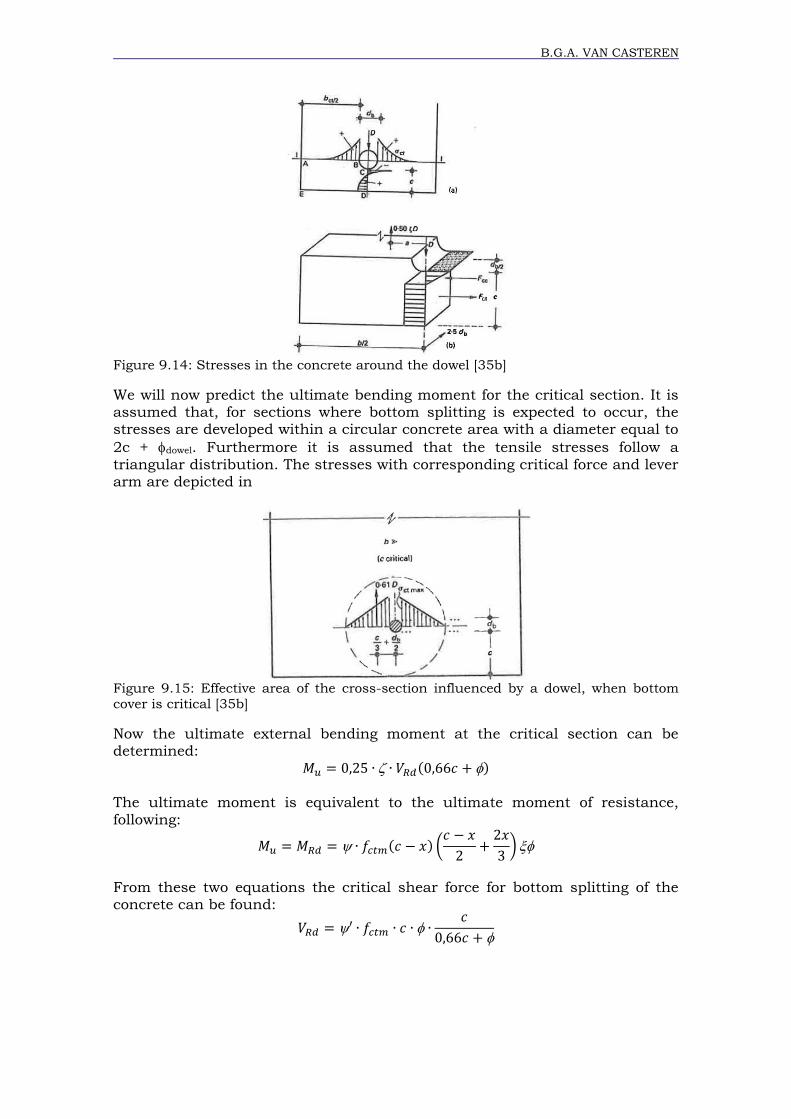
B.G.A. VAN CASTEREN
Figure 9.14: Stresses in the concrete around the dowel [35b]
We will now predict the ultimate bending moment for the critical section. It is assumed that, for sections where bottom splitting is expected to occur, the stresses are developed within a circular concrete area with a diameter equal to
2c + dowel. Furthermore it is assumed that the tensile stresses follow a
triangular distribution. The stresses with corresponding critical force and lever arm are depicted in
Figure 9.15: Effective area of the cross-section influenced by a dowel, when bottom cover is critical [35b]
Now the ultimate external bending moment at the critical section can be determined:
The ultimate moment is equivalent to the ultimate moment of resistance,
following:
From these two equations the critical shear force for bottom splitting of the concrete can be found:
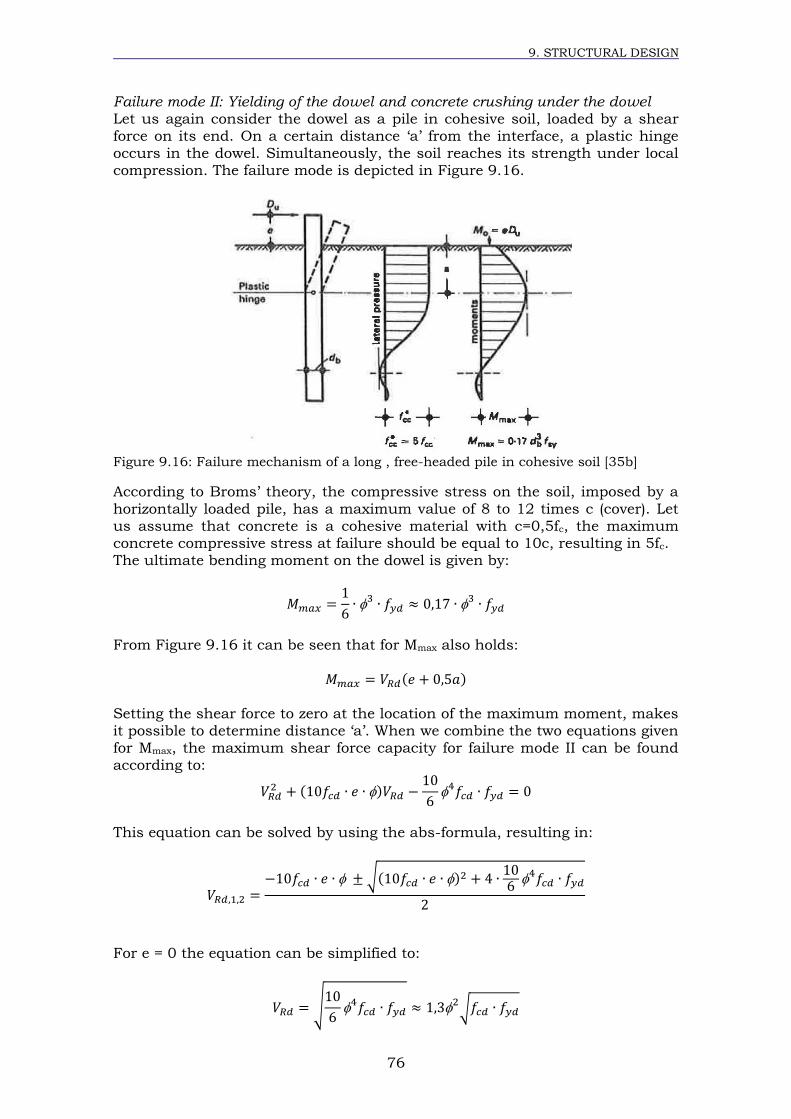
9. STRUCTURAL DESIGN
76
Failure mode II: Yielding of the dowel and concrete crushing under the dowel Let us again consider the dowel as a pile in cohesive soil, loaded by a shear force on its end. On a certain distance ‘a’ from the interface, a plastic hinge
occurs in the dowel. Simultaneously, the soil reaches its strength under local compression. The failure mode is depicted in Figure 9.16.
Figure 9.16: Failure mechanism of a long , free-headed pile in cohesive soil [35b]
According to Broms’ theory, the compressive stress on the soil, imposed by a
horizontally loaded pile, has a maximum value of 8 to 12 times c (cover). Let us assume that concrete is a cohesive material with c=0,5fc, the maximum concrete compressive stress at failure should be equal to 10c, resulting in 5fc. The ultimate bending moment on the dowel is given by:
From Figure 9.16 it can be seen that for Mmax also holds:
Setting the shear force to zero at the location of the maximum moment, makes it possible to determine distance ‘a’. When we combine the two equations given for Mmax, the maximum shear force capacity for failure mode II can be found according to:
This equation can be solved by using the abs-formula, resulting in:
For e = 0 the equation can be simplified to:
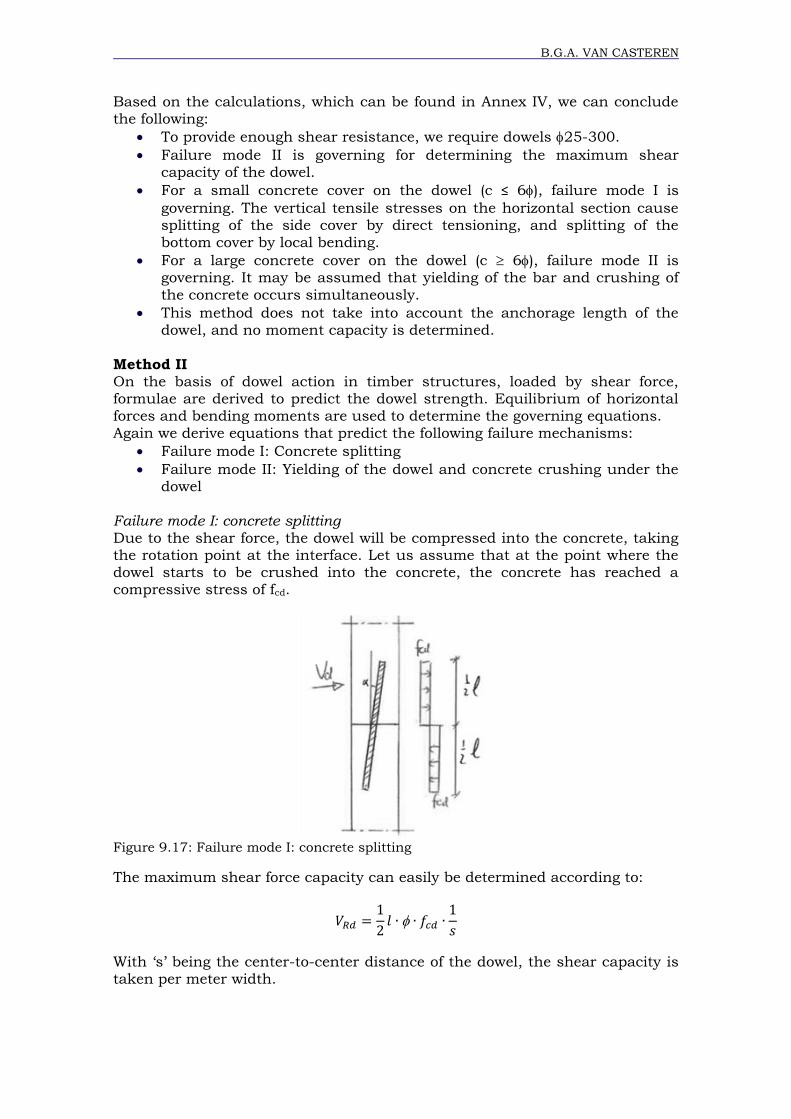
B.G.A. VAN CASTEREN
Based on the calculations, which can be found in Annex IV, we can conclude the following:
To provide enough shear resistance, we require dowels 25-300.
Failure mode II is governing for determining the maximum shear capacity of the dowel.
For a small concrete cover on the dowel (c ≤ 6 ), failure mode I is
governing. The vertical tensile stresses on the horizontal section cause splitting of the side cover by direct tensioning, and splitting of the
bottom cover by local bending.
For a large concrete cover on the dowel (c 6 ), failure mode II is governing. It may be assumed that yielding of the bar and crushing of
the concrete occurs simultaneously.
This method does not take into account the anchorage length of the dowel, and no moment capacity is determined.
Method II On the basis of dowel action in timber structures, loaded by shear force, formulae are derived to predict the dowel strength. Equilibrium of horizontal forces and bending moments are used to determine the governing equations.
Again we derive equations that predict the following failure mechanisms:
Failure mode I: Concrete splitting
Failure mode II: Yielding of the dowel and concrete crushing under the dowel
Failure mode I: concrete splitting Due to the shear force, the dowel will be compressed into the concrete, taking the rotation point at the interface. Let us assume that at the point where the dowel starts to be crushed into the concrete, the concrete has reached a compressive stress of fcd.
Figure 9.17: Failure mode I: concrete splitting
The maximum shear force capacity can easily be determined according to:
With ‘s’ being the center-to-center distance of the dowel, the shear capacity is taken per meter width.
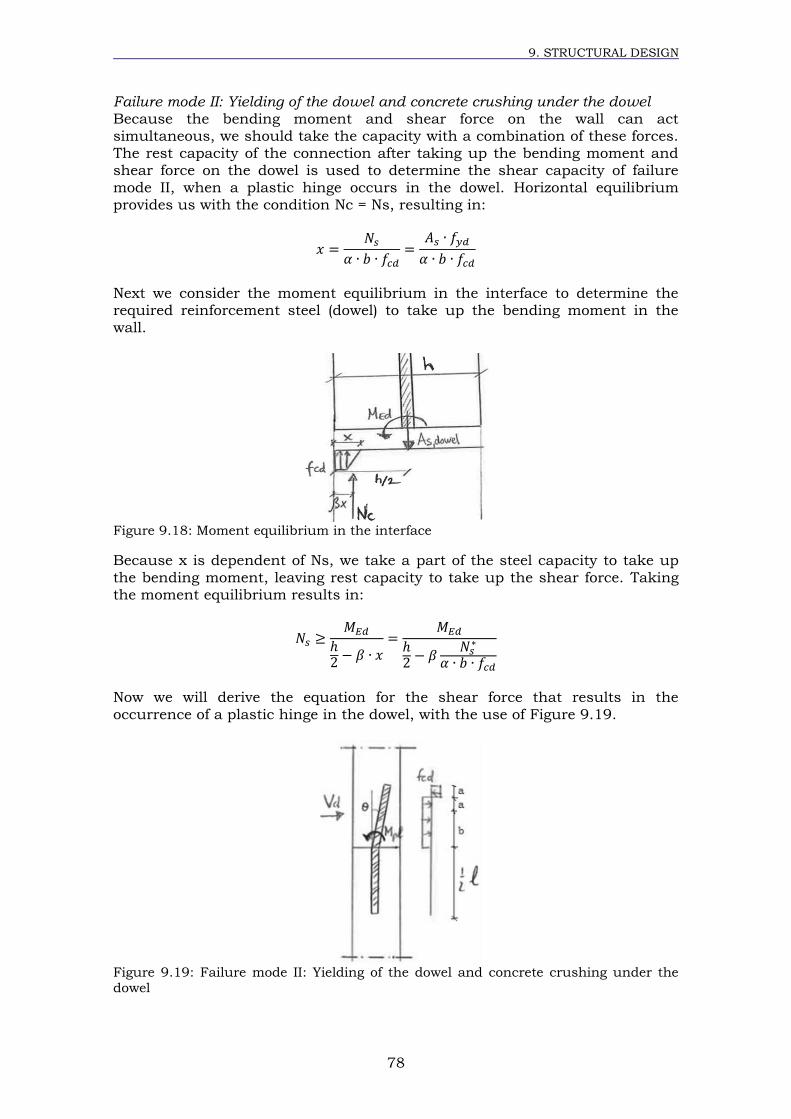
9. STRUCTURAL DESIGN
78
Failure mode II: Yielding of the dowel and concrete crushing under the dowel Because the bending moment and shear force on the wall can act simultaneous, we should take the capacity with a combination of these forces.
The rest capacity of the connection after taking up the bending moment and shear force on the dowel is used to determine the shear capacity of failure
mode II, when a plastic hinge occurs in the dowel. Horizontal equilibrium provides us with the condition Nc = Ns, resulting in:
Next we consider the moment equilibrium in the interface to determine the required reinforcement steel (dowel) to take up the bending moment in the
wall.
Figure 9.18: Moment equilibrium in the interface
Because x is dependent of Ns, we take a part of the steel capacity to take up
the bending moment, leaving rest capacity to take up the shear force. Taking the moment equilibrium results in:
Now we will derive the equation for the shear force that results in the
occurrence of a plastic hinge in the dowel, with the use of Figure 9.19.
Figure 9.19: Failure mode II: Yielding of the dowel and concrete crushing under the dowel
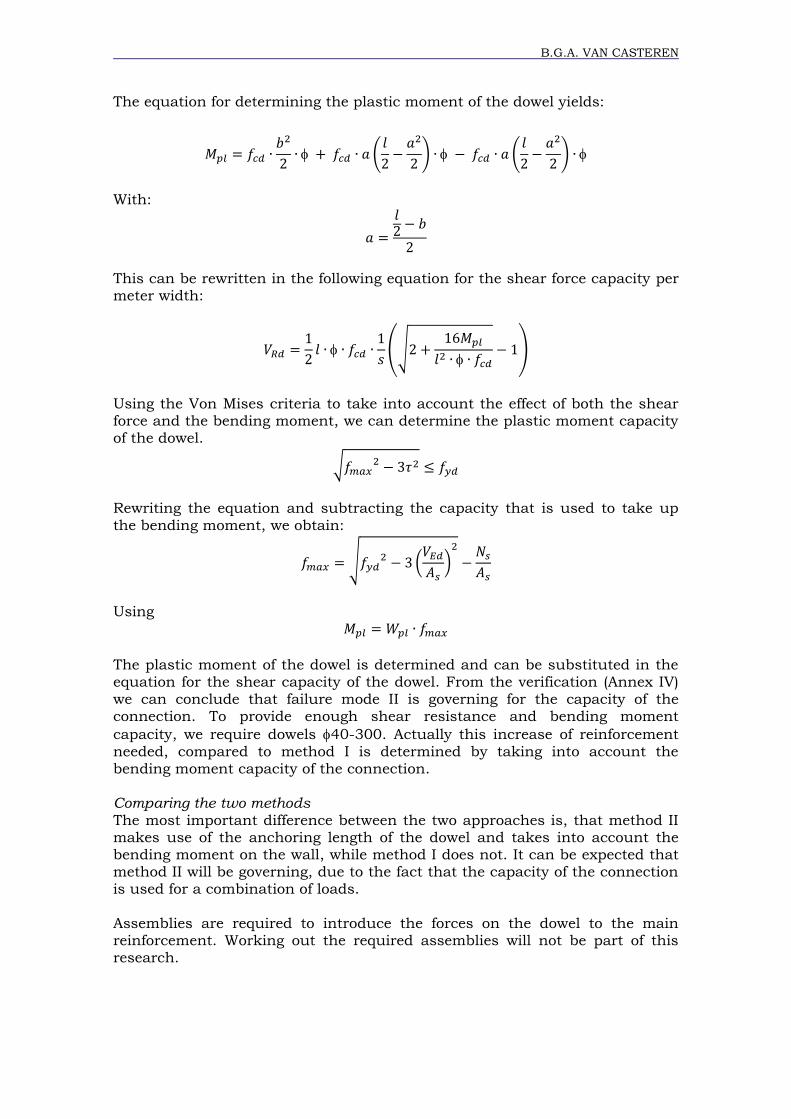
B.G.A. VAN CASTEREN
The equation for determining the plastic moment of the dowel yields:
With:
This can be rewritten in the following equation for the shear force capacity per meter width:
Using the Von Mises criteria to take into account the effect of both the shear force and the bending moment, we can determine the plastic moment capacity of the dowel.
Rewriting the equation and subtracting the capacity that is used to take up
the bending moment, we obtain:
Using
The plastic moment of the dowel is determined and can be substituted in the equation for the shear capacity of the dowel. From the verification (Annex IV)
we can conclude that failure mode II is governing for the capacity of the connection. To provide enough shear resistance and bending moment
capacity, we require dowels 40-300. Actually this increase of reinforcement
needed, compared to method I is determined by taking into account the
bending moment capacity of the connection. Comparing the two methods The most important difference between the two approaches is, that method II makes use of the anchoring length of the dowel and takes into account the bending moment on the wall, while method I does not. It can be expected that method II will be governing, due to the fact that the capacity of the connection is used for a combination of loads.
Assemblies are required to introduce the forces on the dowel to the main reinforcement. Working out the required assemblies will not be part of this research.
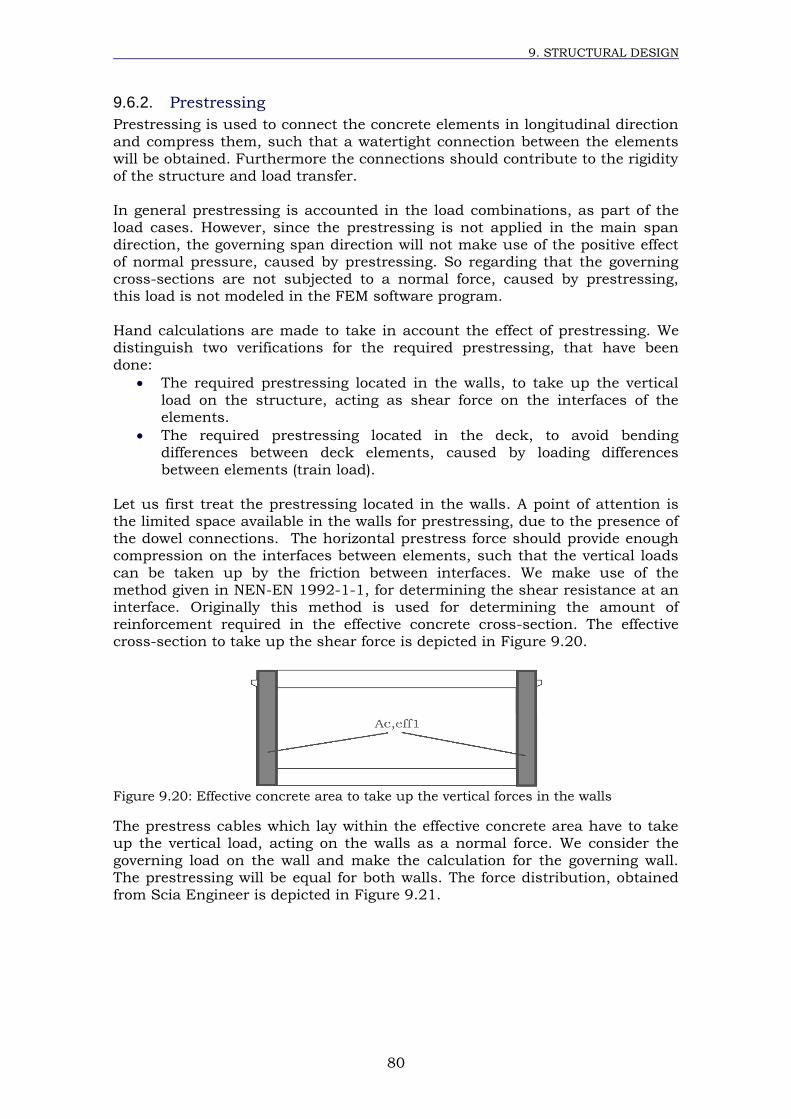
9. STRUCTURAL DESIGN
80
9.6.2. Prestressing
Prestressing is used to connect the concrete elements in longitudinal direction
and compress them, such that a watertight connection between the elements
will be obtained. Furthermore the connections should contribute to the rigidity of the structure and load transfer. In general prestressing is accounted in the load combinations, as part of the
load cases. However, since the prestressing is not applied in the main span direction, the governing span direction will not make use of the positive effect of normal pressure, caused by prestressing. So regarding that the governing cross-sections are not subjected to a normal force, caused by prestressing, this load is not modeled in the FEM software program.
Hand calculations are made to take in account the effect of prestressing. We distinguish two verifications for the required prestressing, that have been done:
The required prestressing located in the walls, to take up the vertical
load on the structure, acting as shear force on the interfaces of the elements.
The required prestressing located in the deck, to avoid bending differences between deck elements, caused by loading differences
between elements (train load).
Let us first treat the prestressing located in the walls. A point of attention is the limited space available in the walls for prestressing, due to the presence of the dowel connections. The horizontal prestress force should provide enough compression on the interfaces between elements, such that the vertical loads
can be taken up by the friction between interfaces. We make use of the method given in NEN-EN 1992-1-1, for determining the shear resistance at an interface. Originally this method is used for determining the amount of reinforcement required in the effective concrete cross-section. The effective cross-section to take up the shear force is depicted in Figure 9.20.
Figure 9.20: Effective concrete area to take up the vertical forces in the walls
The prestress cables which lay within the effective concrete area have to take up the vertical load, acting on the walls as a normal force. We consider the
governing load on the wall and make the calculation for the governing wall. The prestressing will be equal for both walls. The force distribution, obtained from Scia Engineer is depicted in Figure 9.21.
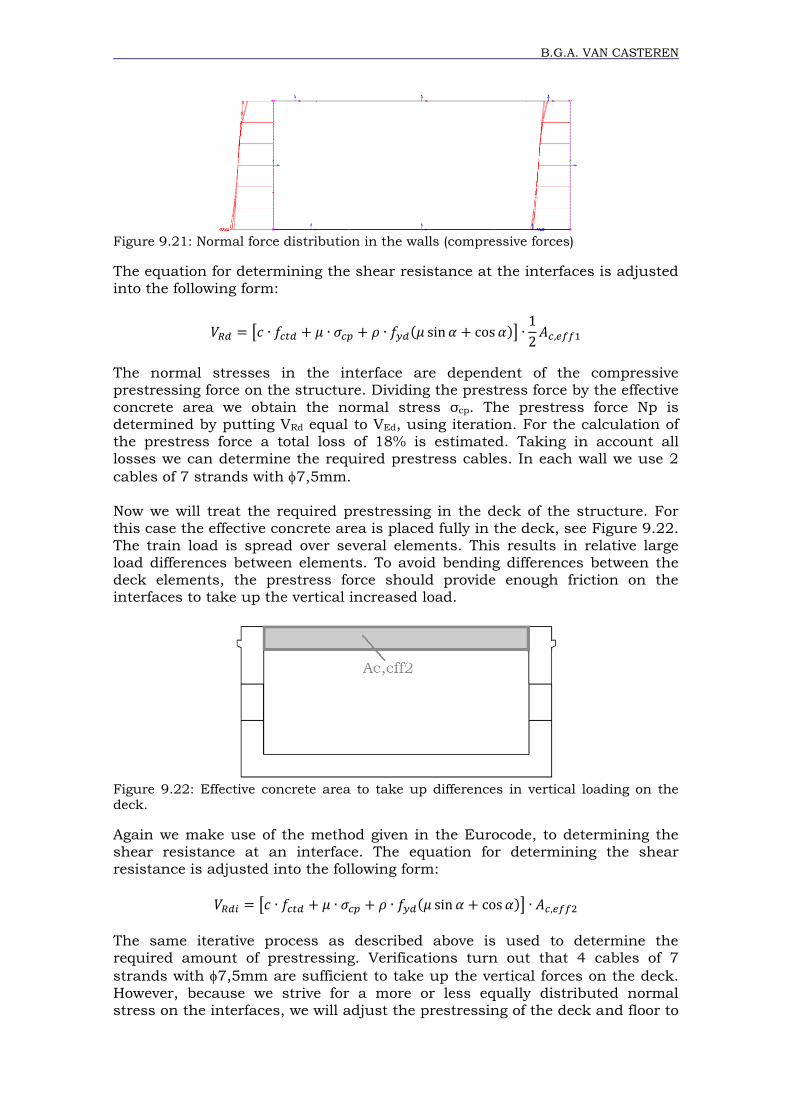
B.G.A. VAN CASTEREN
Figure 9.21: Normal force distribution in the walls (compressive forces)
The equation for determining the shear resistance at the interfaces is adjusted
into the following form:
The normal stresses in the interface are dependent of the compressive prestressing force on the structure. Dividing the prestress force by the effective
concrete area we obtain the normal stress σcp. The prestress force Np is determined by putting VRd equal to VEd, using iteration. For the calculation of the prestress force a total loss of 18% is estimated. Taking in account all
losses we can determine the required prestress cables. In each wall we use 2
cables of 7 strands with 7,5mm.
Now we will treat the required prestressing in the deck of the structure. For this case the effective concrete area is placed fully in the deck, see Figure 9.22.
The train load is spread over several elements. This results in relative large load differences between elements. To avoid bending differences between the deck elements, the prestress force should provide enough friction on the interfaces to take up the vertical increased load.
Figure 9.22: Effective concrete area to take up differences in vertical loading on the deck.
Again we make use of the method given in the Eurocode, to determining the shear resistance at an interface. The equation for determining the shear resistance is adjusted into the following form:
The same iterative process as described above is used to determine the required amount of prestressing. Verifications turn out that 4 cables of 7
strands with 7,5mm are sufficient to take up the vertical forces on the deck.
However, because we strive for a more or less equally distributed normal stress on the interfaces, we will adjust the prestressing of the deck and floor to
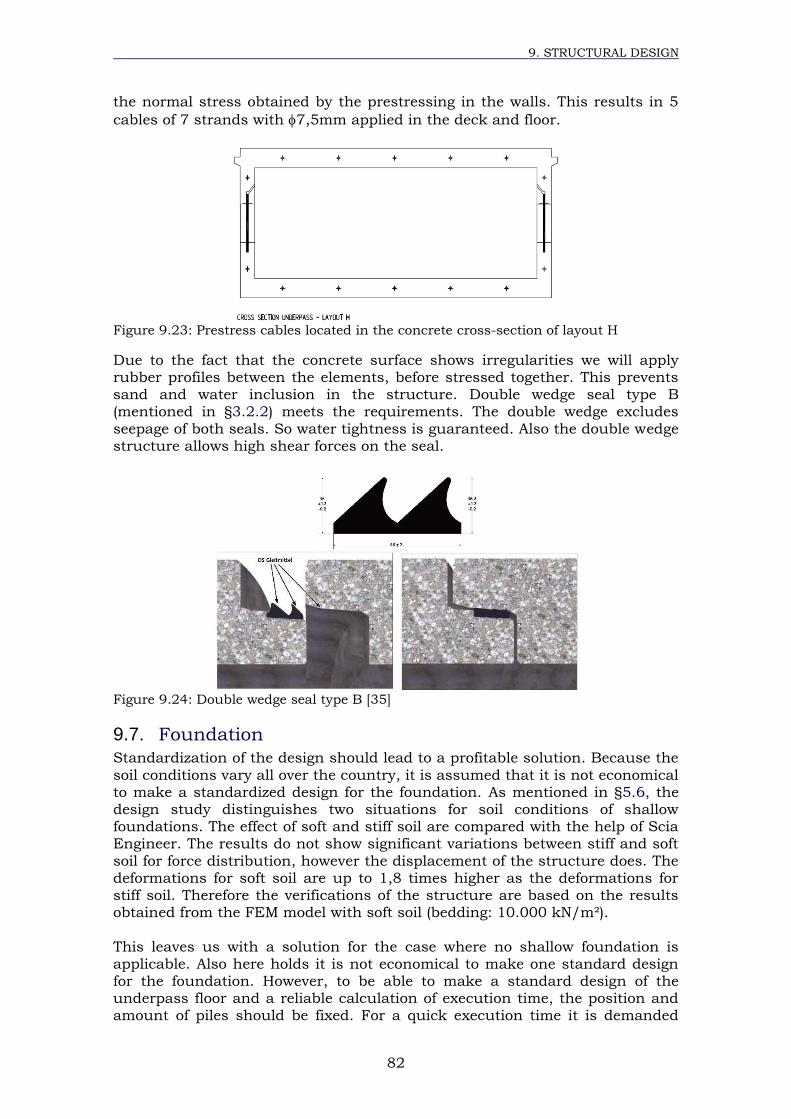
9. STRUCTURAL DESIGN
82
the normal stress obtained by the prestressing in the walls. This results in 5
cables of 7 strands with 7,5mm applied in the deck and floor.
Figure 9.23: Prestress cables located in the concrete cross-section of layout H
Due to the fact that the concrete surface shows irregularities we will apply rubber profiles between the elements, before stressed together. This prevents sand and water inclusion in the structure. Double wedge seal type B (mentioned in §3.2.2) meets the requirements. The double wedge excludes
seepage of both seals. So water tightness is guaranteed. Also the double wedge structure allows high shear forces on the seal.
Figure 9.24: Double wedge seal type B [35]
9.7. Foundation
Standardization of the design should lead to a profitable solution. Because the
soil conditions vary all over the country, it is assumed that it is not economical to make a standardized design for the foundation. As mentioned in §5.6, the design study distinguishes two situations for soil conditions of shallow foundations. The effect of soft and stiff soil are compared with the help of Scia Engineer. The results do not show significant variations between stiff and soft
soil for force distribution, however the displacement of the structure does. The deformations for soft soil are up to 1,8 times higher as the deformations for stiff soil. Therefore the verifications of the structure are based on the results obtained from the FEM model with soft soil (bedding: 10.000 kN/m²).
This leaves us with a solution for the case where no shallow foundation is applicable. Also here holds it is not economical to make one standard design for the foundation. However, to be able to make a standard design of the underpass floor and a reliable calculation of execution time, the position and amount of piles should be fixed. For a quick execution time it is demanded
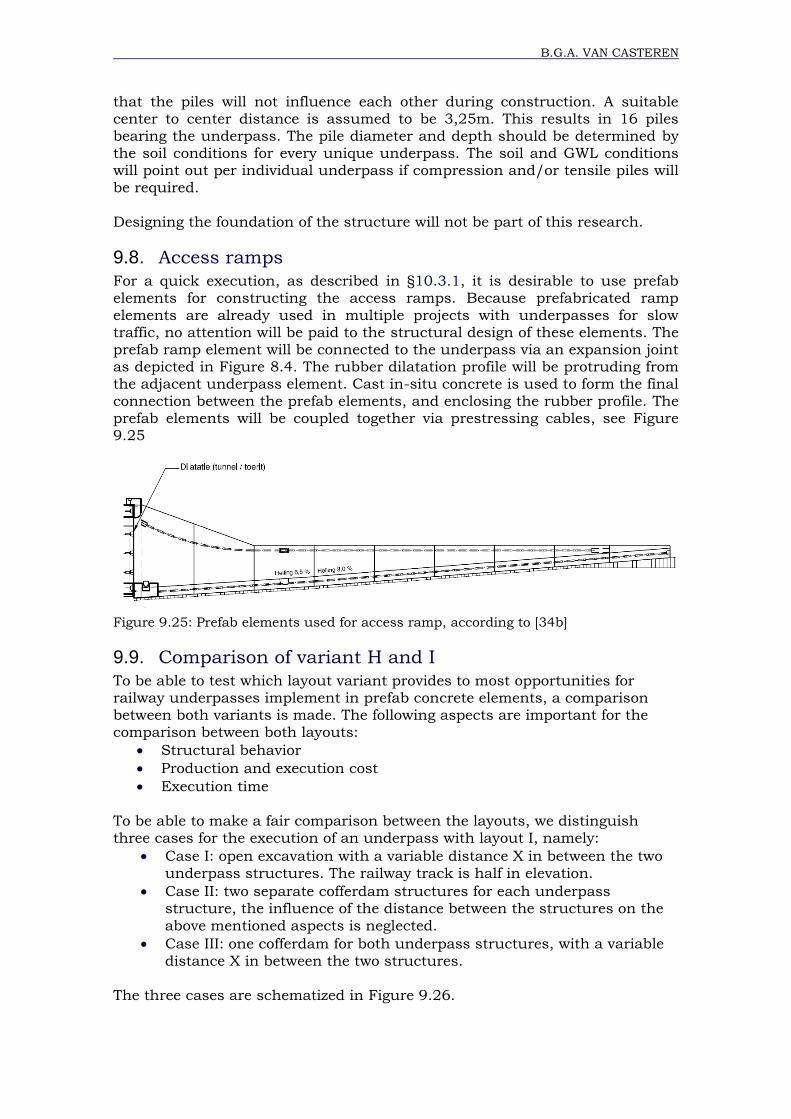
B.G.A. VAN CASTEREN
that the piles will not influence each other during construction. A suitable center to center distance is assumed to be 3,25m. This results in 16 piles bearing the underpass. The pile diameter and depth should be determined by
the soil conditions for every unique underpass. The soil and GWL conditions will point out per individual underpass if compression and/or tensile piles will
be required. Designing the foundation of the structure will not be part of this research.
9.8. Access ramps
For a quick execution, as described in §10.3.1, it is desirable to use prefab elements for constructing the access ramps. Because prefabricated ramp
elements are already used in multiple projects with underpasses for slow traffic, no attention will be paid to the structural design of these elements. The prefab ramp element will be connected to the underpass via an expansion joint as depicted in Figure 8.4. The rubber dilatation profile will be protruding from the adjacent underpass element. Cast in-situ concrete is used to form the final
connection between the prefab elements, and enclosing the rubber profile. The prefab elements will be coupled together via prestressing cables, see Figure 9.25
Figure 9.25: Prefab elements used for access ramp, according to [34b]
9.9. Comparison of variant H and I
To be able to test which layout variant provides to most opportunities for railway underpasses implement in prefab concrete elements, a comparison between both variants is made. The following aspects are important for the comparison between both layouts:
Structural behavior
Production and execution cost
Execution time
To be able to make a fair comparison between the layouts, we distinguish three cases for the execution of an underpass with layout I, namely:
Case I: open excavation with a variable distance X in between the two
underpass structures. The railway track is half in elevation.
Case II: two separate cofferdam structures for each underpass structure, the influence of the distance between the structures on the
above mentioned aspects is neglected.
Case III: one cofferdam for both underpass structures, with a variable
distance X in between the two structures. The three cases are schematized in Figure 9.26.
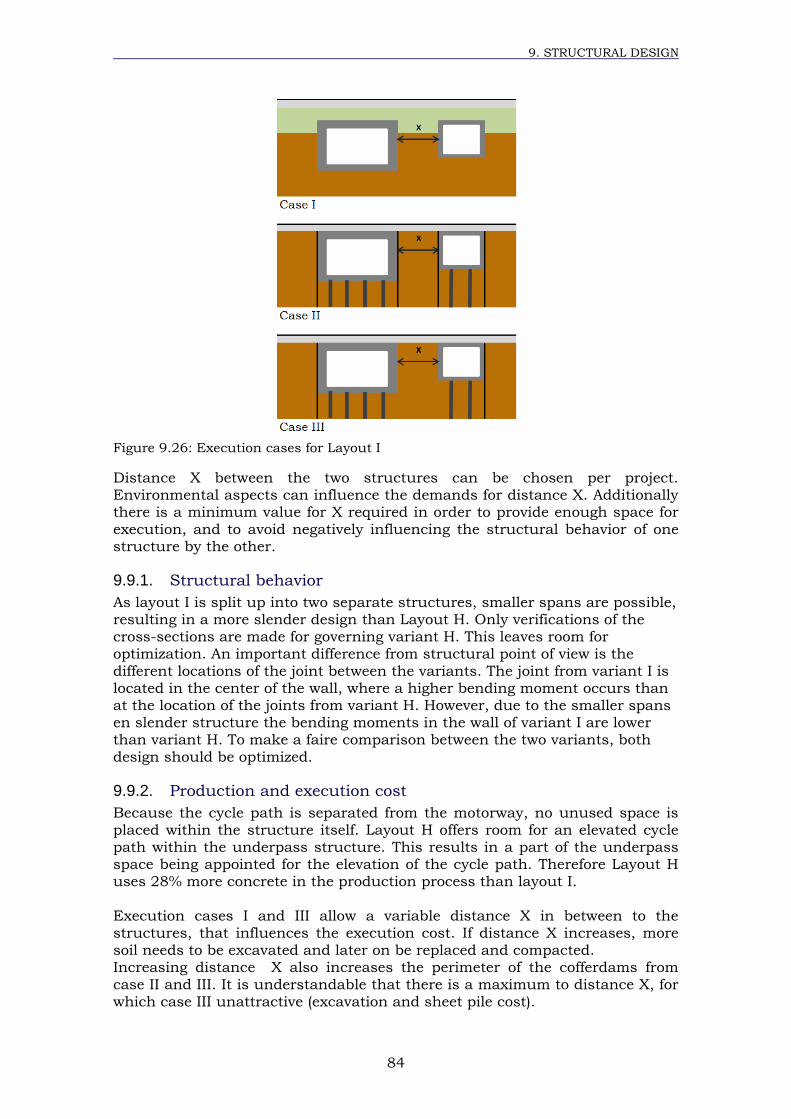
9. STRUCTURAL DESIGN
84
Figure 9.26: Execution cases for Layout I
Distance X between the two structures can be chosen per project. Environmental aspects can influence the demands for distance X. Additionally there is a minimum value for X required in order to provide enough space for
execution, and to avoid negatively influencing the structural behavior of one structure by the other.
9.9.1. Structural behavior
As layout I is split up into two separate structures, smaller spans are possible, resulting in a more slender design than Layout H. Only verifications of the cross-sections are made for governing variant H. This leaves room for optimization. An important difference from structural point of view is the
different locations of the joint between the variants. The joint from variant I is located in the center of the wall, where a higher bending moment occurs than at the location of the joints from variant H. However, due to the smaller spans en slender structure the bending moments in the wall of variant I are lower than variant H. To make a faire comparison between the two variants, both
design should be optimized.
9.9.2. Production and execution cost
Because the cycle path is separated from the motorway, no unused space is placed within the structure itself. Layout H offers room for an elevated cycle path within the underpass structure. This results in a part of the underpass space being appointed for the elevation of the cycle path. Therefore Layout H uses 28% more concrete in the production process than layout I.
Execution cases I and III allow a variable distance X in between to the structures, that influences the execution cost. If distance X increases, more soil needs to be excavated and later on be replaced and compacted. Increasing distance X also increases the perimeter of the cofferdams from
case II and III. It is understandable that there is a maximum to distance X, for which case III unattractive (excavation and sheet pile cost).
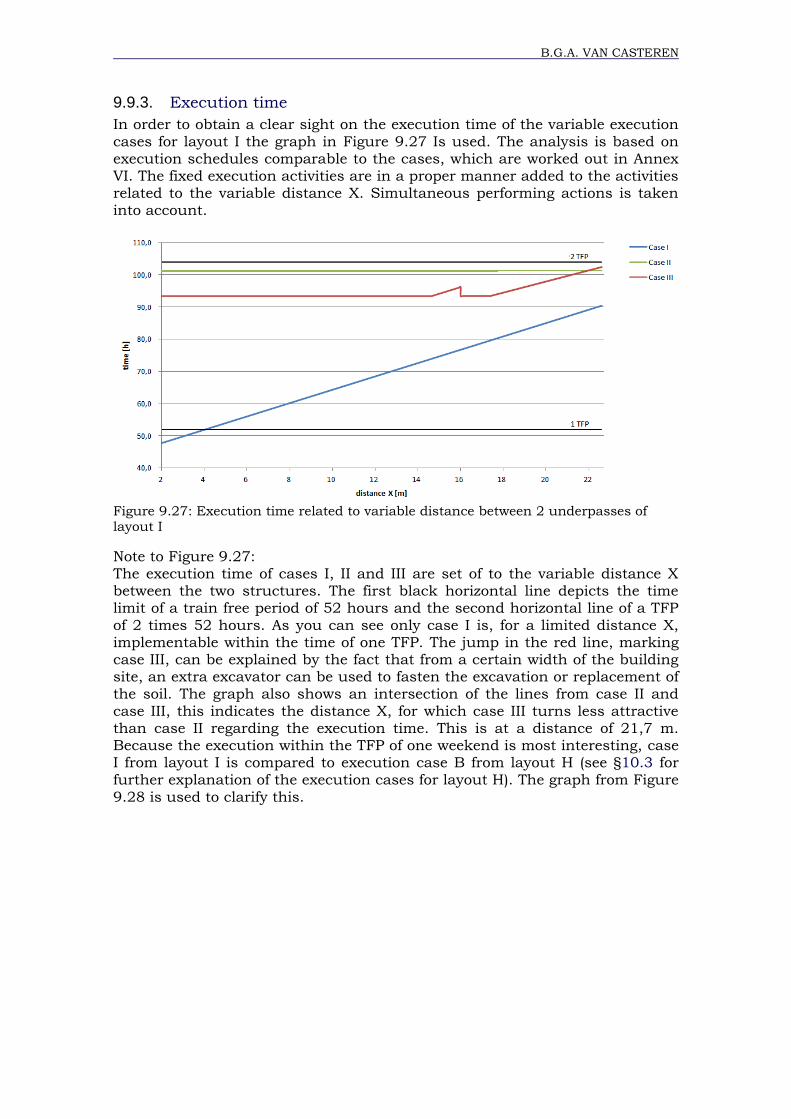
B.G.A. VAN CASTEREN
9.9.3. Execution time
In order to obtain a clear sight on the execution time of the variable execution
cases for layout I the graph in Figure 9.27 Is used. The analysis is based on
execution schedules comparable to the cases, which are worked out in Annex VI. The fixed execution activities are in a proper manner added to the activities related to the variable distance X. Simultaneous performing actions is taken into account.
Figure 9.27: Execution time related to variable distance between 2 underpasses of layout I
Note to Figure 9.27: The execution time of cases I, II and III are set of to the variable distance X between the two structures. The first black horizontal line depicts the time limit of a train free period of 52 hours and the second horizontal line of a TFP
of 2 times 52 hours. As you can see only case I is, for a limited distance X, implementable within the time of one TFP. The jump in the red line, marking case III, can be explained by the fact that from a certain width of the building site, an extra excavator can be used to fasten the excavation or replacement of the soil. The graph also shows an intersection of the lines from case II and
case III, this indicates the distance X, for which case III turns less attractive than case II regarding the execution time. This is at a distance of 21,7 m. Because the execution within the TFP of one weekend is most interesting, case I from layout I is compared to execution case B from layout H (see §10.3 for
further explanation of the execution cases for layout H). The graph from Figure
9.28 is used to clarify this.
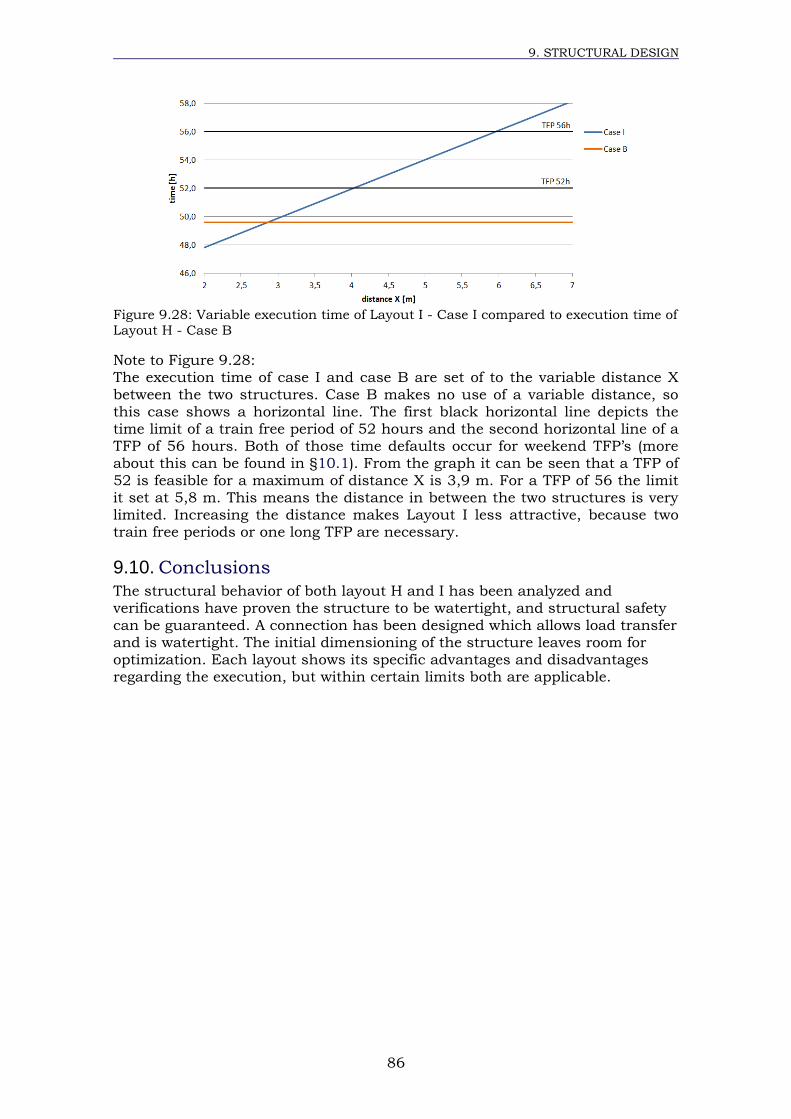
9. STRUCTURAL DESIGN
86
Figure 9.28: Variable execution time of Layout I - Case I compared to execution time of Layout H - Case B
Note to Figure 9.28: The execution time of case I and case B are set of to the variable distance X
between the two structures. Case B makes no use of a variable distance, so this case shows a horizontal line. The first black horizontal line depicts the time limit of a train free period of 52 hours and the second horizontal line of a TFP of 56 hours. Both of those time defaults occur for weekend TFP’s (more
about this can be found in §10.1). From the graph it can be seen that a TFP of
52 is feasible for a maximum of distance X is 3,9 m. For a TFP of 56 the limit it set at 5,8 m. This means the distance in between the two structures is very limited. Increasing the distance makes Layout I less attractive, because two train free periods or one long TFP are necessary.
9.10. Conclusions
The structural behavior of both layout H and I has been analyzed and verifications have proven the structure to be watertight, and structural safety
can be guaranteed. A connection has been designed which allows load transfer and is watertight. The initial dimensioning of the structure leaves room for optimization. Each layout shows its specific advantages and disadvantages regarding the execution, but within certain limits both are applicable.
87
10 Execution
It is unusual to execute railway underpasses in prefabricated concrete elements. Therefore the execution of this type of structure demands additional
attention and will be a challenging topic of this research. Regarding that the structures will underpass a railway it is necessary to plan a part of the construction activities during a train free period9 (TFP). Researching the feasibility of a prefabricated concrete structure aims to reduce the execution time and costs. It’s important to limit the execution time during the train free
period as much as possible, as financial benefits can be expected for short TFP’s.
10.1. Train free period
The train free period is a period for maintenance-, innovation- and repair
activities. A TFP has to be requested at the planning department of ProRail. To realize a safe process, a checklist that maps all necessary actions is used, the so called FOT10. A FOT is a schematic plan of the rail infrastructure which
indicates the part of the rail infrastructure which is not available for operation for a given period. The purpose of the infra deviation is to create a safe and efficient workspace. Safe for the workpeople and also for the surrounding transport process. The FOT must leave sufficient possibilities for an alternative to the operator. The train free period does not only bring restrictions regarding
the execution time, but also the execution method. Regarding the time and build space, there are restrictions to the placing of the elements. Since each building location is unique, it is very difficult to determine the required amount of time to execute the underpass. To obtain a realistic notion
of time to perform the execution of the underpass (during the train free period), an expert from Movares is interviewed (V.A.M. Ottenhof [45]). He has years of experience in the design and the safety-management of infrastructural projects, with multiple projects which concerns train free periods of railways. Next to his knowledge and experience, time-lapse movies of executions during
a train free period (source: Youtube©), as well as multiple execution schedules, of a train free period, are used and analyzed to obtain insights for actions of a train free period. From the analysis it can be concluded which actions are required during the
train free period and how much time they seize. The results of the analysis are captured in an overview of all actions and the required time (per unit), see Table 10.1. Where large variations in time per action are visible, we use minimum and maximum values for the action. The execution schedules of the following projects are used for the analysis:
9 Train Free Period (TFP), buitendienststelling (BD) 10 Functionele Onttrekkingstekening, Functional Diversion Drawing
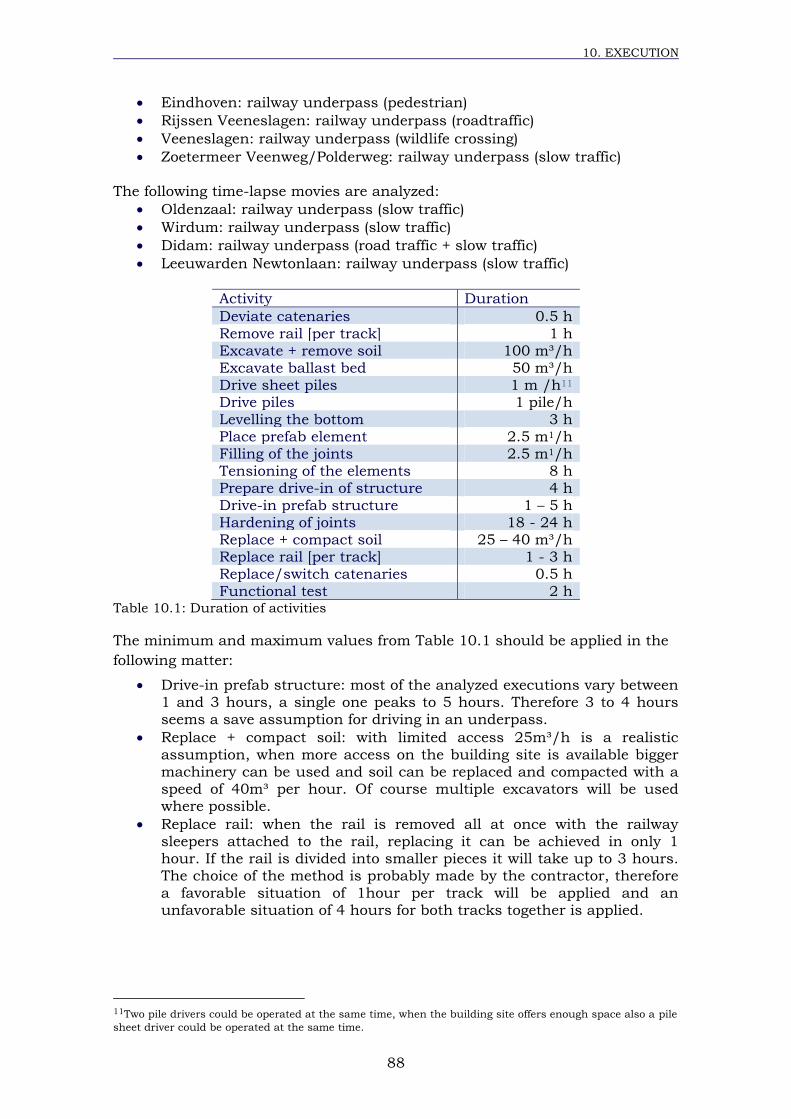
10. EXECUTION
88
Eindhoven: railway underpass (pedestrian)
Rijssen Veeneslagen: railway underpass (roadtraffic)
Veeneslagen: railway underpass (wildlife crossing)
Zoetermeer Veenweg/Polderweg: railway underpass (slow traffic)
The following time-lapse movies are analyzed:
Oldenzaal: railway underpass (slow traffic)
Wirdum: railway underpass (slow traffic)
Didam: railway underpass (road traffic + slow traffic)
Leeuwarden Newtonlaan: railway underpass (slow traffic)
Activity Duration
Deviate catenaries 0.5 h
Remove rail [per track] 1 h Excavate + remove soil 100 m³/h Excavate ballast bed 50 m³/h Drive sheet piles 1 m /h11 Drive piles 1 pile/h
Levelling the bottom 3 h Place prefab element 2.5 m1/h Filling of the joints 2.5 m1/h
Tensioning of the elements 8 h Prepare drive-in of structure 4 h
Drive-in prefab structure 1 – 5 h Hardening of joints 18 - 24 h Replace + compact soil 25 – 40 m³/h Replace rail [per track] 1 - 3 h Replace/switch catenaries 0.5 h
Functional test 2 h Table 10.1: Duration of activities
The minimum and maximum values from Table 10.1 should be applied in the
following matter:
Drive-in prefab structure: most of the analyzed executions vary between 1 and 3 hours, a single one peaks to 5 hours. Therefore 3 to 4 hours
seems a save assumption for driving in an underpass.
Replace + compact soil: with limited access 25m³/h is a realistic
assumption, when more access on the building site is available bigger
machinery can be used and soil can be replaced and compacted with a speed of 40m³ per hour. Of course multiple excavators will be used where possible.
Replace rail: when the rail is removed all at once with the railway
sleepers attached to the rail, replacing it can be achieved in only 1 hour. If the rail is divided into smaller pieces it will take up to 3 hours. The choice of the method is probably made by the contractor, therefore
a favorable situation of 1hour per track will be applied and an unfavorable situation of 4 hours for both tracks together is applied.
11Two pile drivers could be operated at the same time, when the building site offers enough space also a pile
sheet driver could be operated at the same time.
B.G.A. VAN CASTEREN
10.2. Planning
It’s important to know how much time is available for the actual execution of the structure. Multiple activities related to the train free period are required
before the actual construction of the structure can start or finish. The standard procedure is to plan the construction in a weekend train free period, for major execution activities longer periods are planned. There are different
guidelines to determine the timeframe of a weekend train free period. It is acceptable to take 52 – 56 hours for a weekend train free period. The preference might go to one long period above multiple short periods, however this strongly depends on the situation. Considering the research background of high repetition en generalization it is best to start from short weekend
periods. An alternative is to divert the railway crossing temporary. In this way there is more time available for the execution of the structure. However there are strong requirements to the train safety and security, which makes this solution less attractive. The vision of ProRail is “the less level railway crossings, the less risks” and therefore strives to replace as much level
crossings as possible by underpasses. Priority goes to situations in urban areas, however this brings a lot of interest parties and demands from the community which can result in an long preliminary stage of the design/execution. In the preliminary stage the future plans of the area are closely analyzed. For non-urban areas the preliminary stage is less complex.
Due to the fact that on almost every railway track in the Netherlands there are planned maintenance-, innovation- or repair activities, it is also possible to profit from other train free periods on the same track. When earlier train free periods are planned on the same track, small activities can be done prior to
the actual train free period planned for the execution of the underpass. Mostly the maintenance and repair activities are done in one night, so for instance a couple of piles can be driven in that period. Because those prior train free periods do not happen structurally on every track, we cannot rely on a profitable situation for every underpass. However, in practice it can turn out to
a profitable situation for various underpasses.
10.3. Execution during a train free period
There are two possible ways to install prefab elements of the underpass, namely lift each single element into the building site and place it in the final position, or installing all elements parallel to the building site and drive the complete structure into its final position. Both methods have their advantages
and disadvantages. Lifting the elements in position requires limited working space, and it is possible to erect the elements directly from the truck. The down side of this method is that additional time is needed to install the elements and mount them together. This method is visualized in Figure 10.1.
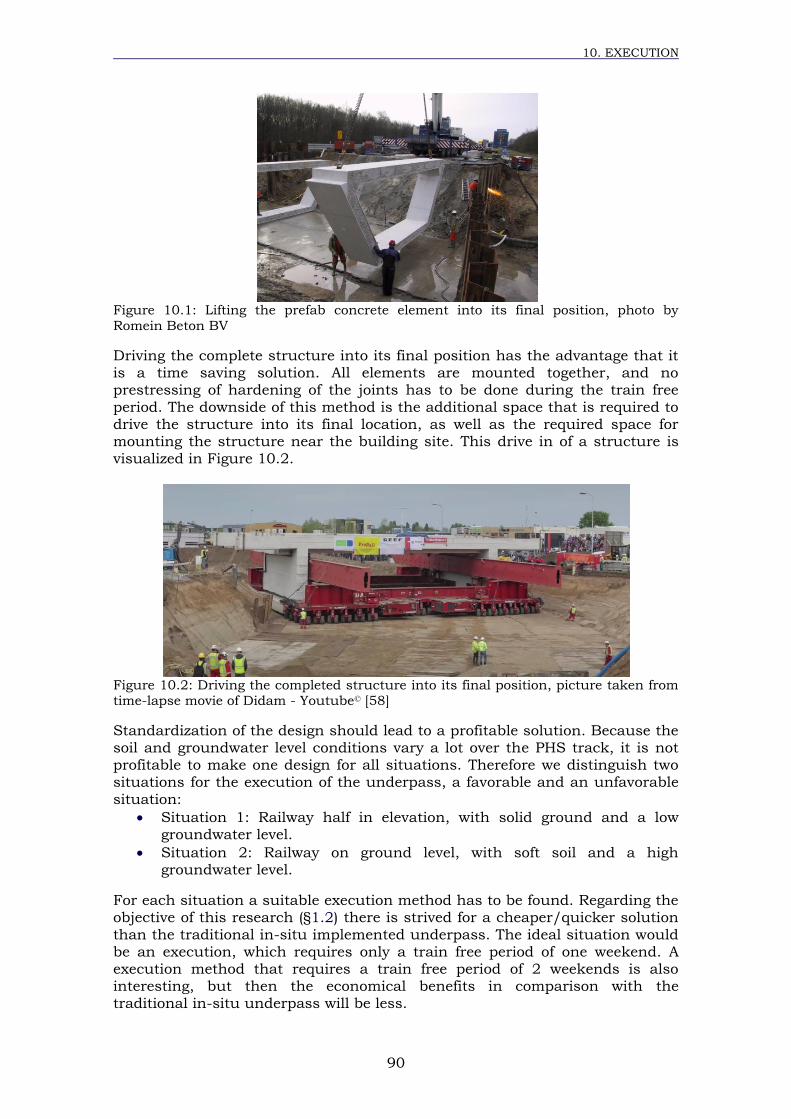
10. EXECUTION
90
Figure 10.1: Lifting the prefab concrete element into its final position, photo by Romein Beton BV
Driving the complete structure into its final position has the advantage that it is a time saving solution. All elements are mounted together, and no prestressing of hardening of the joints has to be done during the train free
period. The downside of this method is the additional space that is required to drive the structure into its final location, as well as the required space for mounting the structure near the building site. This drive in of a structure is
visualized in Figure 10.2.
Figure 10.2: Driving the completed structure into its final position, picture taken from time-lapse movie of Didam - Youtube© [58]
Standardization of the design should lead to a profitable solution. Because the soil and groundwater level conditions vary a lot over the PHS track, it is not profitable to make one design for all situations. Therefore we distinguish two
situations for the execution of the underpass, a favorable and an unfavorable
situation:
Situation 1: Railway half in elevation, with solid ground and a low groundwater level.
Situation 2: Railway on ground level, with soft soil and a high groundwater level.
For each situation a suitable execution method has to be found. Regarding the objective of this research (§1.2) there is strived for a cheaper/quicker solution
than the traditional in-situ implemented underpass. The ideal situation would be an execution, which requires only a train free period of one weekend. A execution method that requires a train free period of 2 weekends is also interesting, but then the economical benefits in comparison with the traditional in-situ underpass will be less.
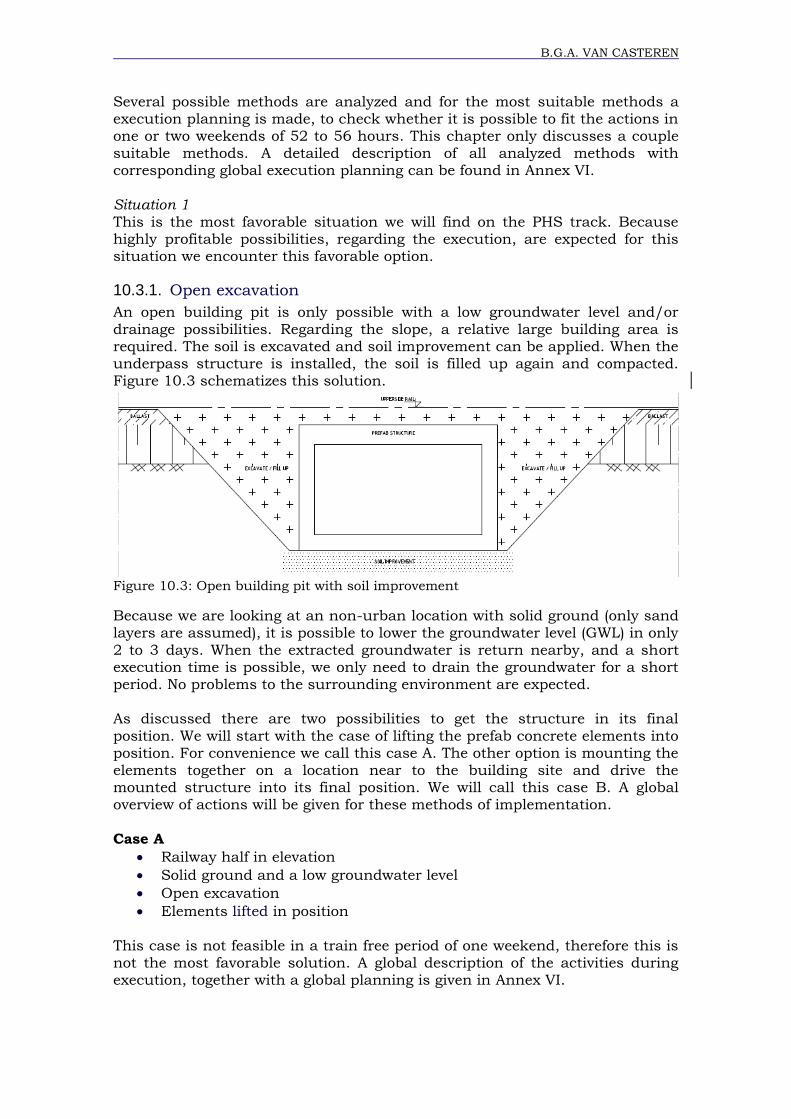
B.G.A. VAN CASTEREN
Several possible methods are analyzed and for the most suitable methods a execution planning is made, to check whether it is possible to fit the actions in one or two weekends of 52 to 56 hours. This chapter only discusses a couple
suitable methods. A detailed description of all analyzed methods with corresponding global execution planning can be found in Annex VI.
Situation 1 This is the most favorable situation we will find on the PHS track. Because highly profitable possibilities, regarding the execution, are expected for this situation we encounter this favorable option.
10.3.1. Open excavation
An open building pit is only possible with a low groundwater level and/or
drainage possibilities. Regarding the slope, a relative large building area is required. The soil is excavated and soil improvement can be applied. When the underpass structure is installed, the soil is filled up again and compacted. Figure 10.3 schematizes this solution.
Figure 10.3: Open building pit with soil improvement
Because we are looking at an non-urban location with solid ground (only sand layers are assumed), it is possible to lower the groundwater level (GWL) in only
2 to 3 days. When the extracted groundwater is return nearby, and a short execution time is possible, we only need to drain the groundwater for a short period. No problems to the surrounding environment are expected. As discussed there are two possibilities to get the structure in its final
position. We will start with the case of lifting the prefab concrete elements into position. For convenience we call this case A. The other option is mounting the
elements together on a location near to the building site and drive the mounted structure into its final position. We will call this case B. A global overview of actions will be given for these methods of implementation.
Case A
Railway half in elevation
Solid ground and a low groundwater level
Open excavation
Elements lifted in position
This case is not feasible in a train free period of one weekend, therefore this is not the most favorable solution. A global description of the activities during execution, together with a global planning is given in Annex VI.
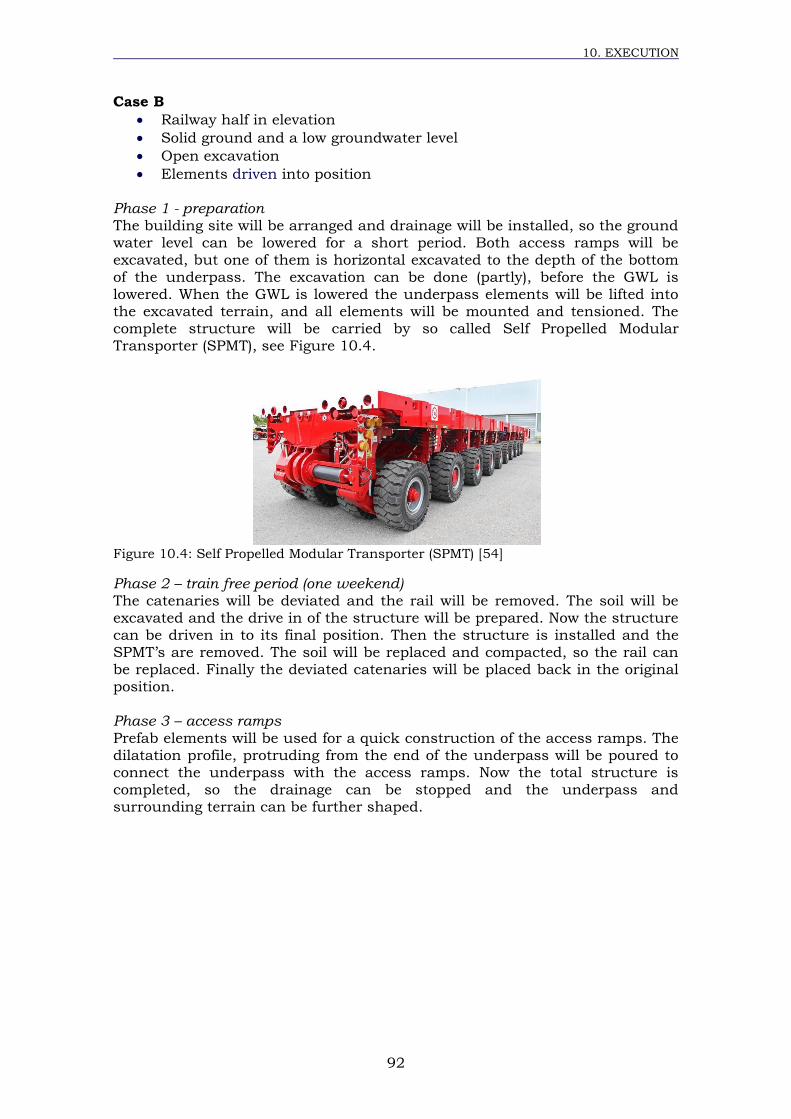
10. EXECUTION
92
Case B
Railway half in elevation
Solid ground and a low groundwater level
Open excavation
Elements driven into position
Phase 1 - preparation The building site will be arranged and drainage will be installed, so the ground water level can be lowered for a short period. Both access ramps will be excavated, but one of them is horizontal excavated to the depth of the bottom
of the underpass. The excavation can be done (partly), before the GWL is lowered. When the GWL is lowered the underpass elements will be lifted into the excavated terrain, and all elements will be mounted and tensioned. The complete structure will be carried by so called Self Propelled Modular Transporter (SPMT), see Figure 10.4.
Figure 10.4: Self Propelled Modular Transporter (SPMT) [54]
Phase 2 – train free period (one weekend) The catenaries will be deviated and the rail will be removed. The soil will be excavated and the drive in of the structure will be prepared. Now the structure can be driven in to its final position. Then the structure is installed and the
SPMT’s are removed. The soil will be replaced and compacted, so the rail can be replaced. Finally the deviated catenaries will be placed back in the original position. Phase 3 – access ramps
Prefab elements will be used for a quick construction of the access ramps. The dilatation profile, protruding from the end of the underpass will be poured to
connect the underpass with the access ramps. Now the total structure is completed, so the drainage can be stopped and the underpass and surrounding terrain can be further shaped.
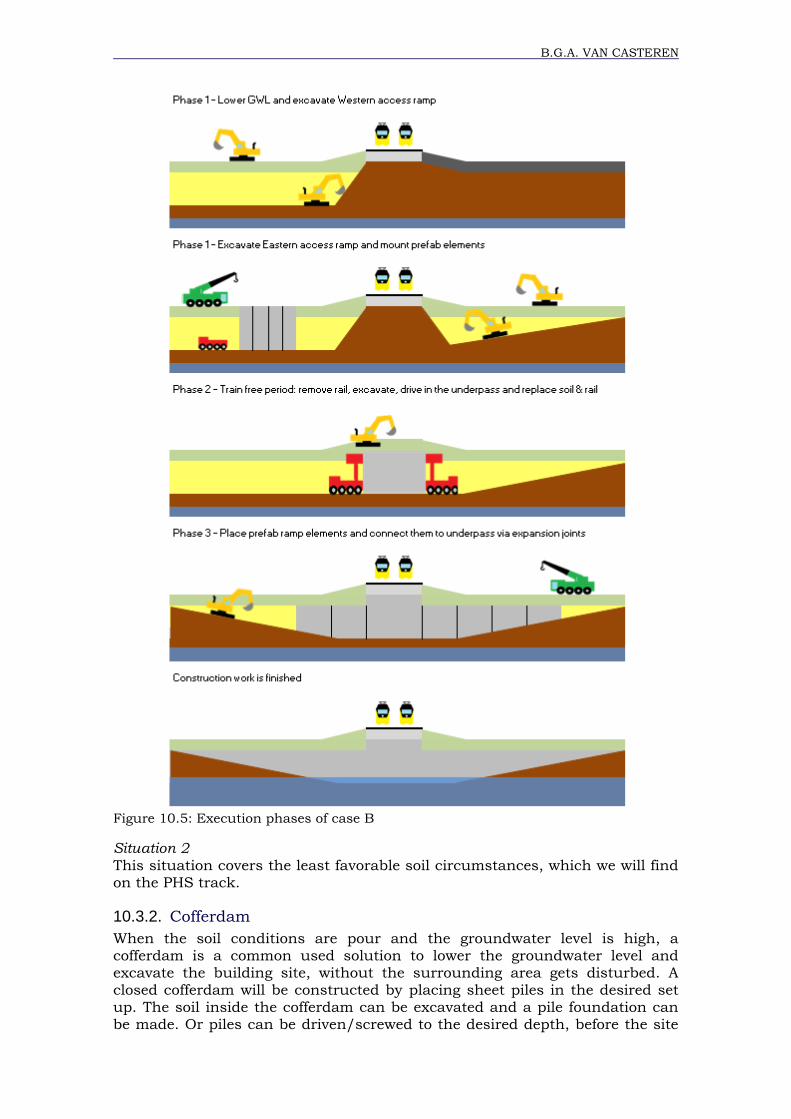
B.G.A. VAN CASTEREN
Figure 10.5: Execution phases of case B
Situation 2
This situation covers the least favorable soil circumstances, which we will find on the PHS track.
10.3.2. Cofferdam
When the soil conditions are pour and the groundwater level is high, a cofferdam is a common used solution to lower the groundwater level and excavate the building site, without the surrounding area gets disturbed. A closed cofferdam will be constructed by placing sheet piles in the desired set
up. The soil inside the cofferdam can be excavated and a pile foundation can be made. Or piles can be driven/screwed to the desired depth, before the site
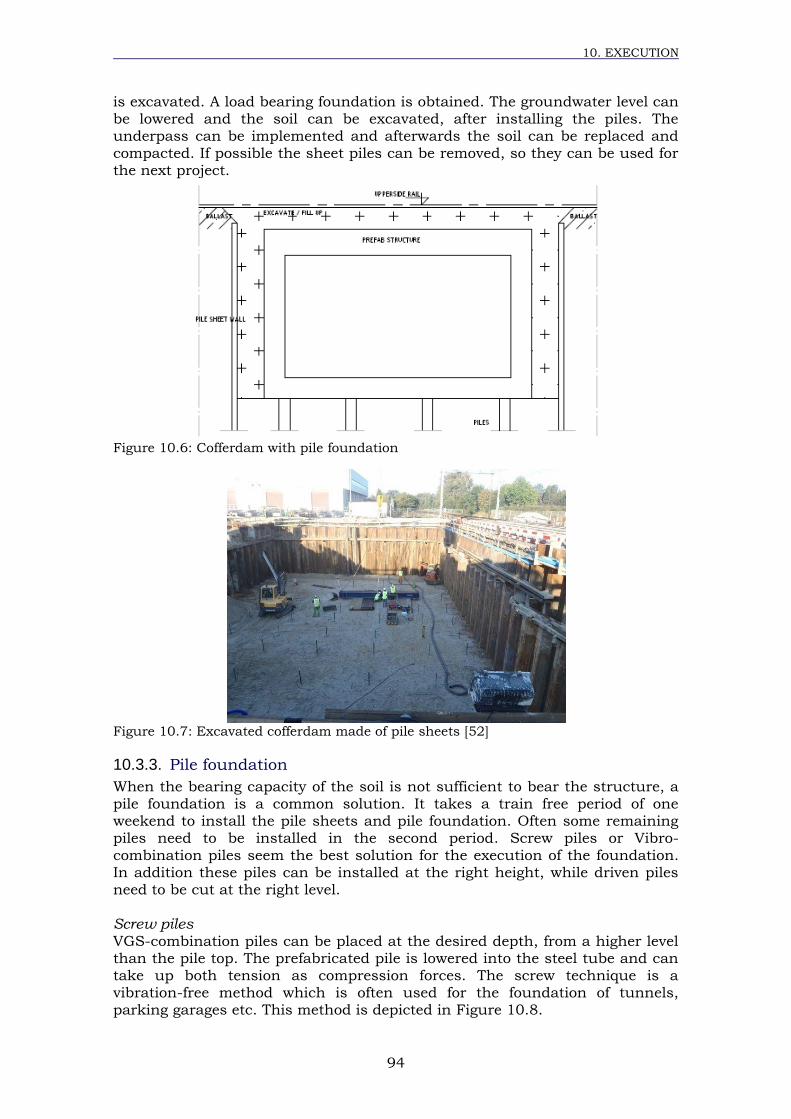
10. EXECUTION
94
is excavated. A load bearing foundation is obtained. The groundwater level can be lowered and the soil can be excavated, after installing the piles. The underpass can be implemented and afterwards the soil can be replaced and
compacted. If possible the sheet piles can be removed, so they can be used for the next project.
Figure 10.6: Cofferdam with pile foundation
Figure 10.7: Excavated cofferdam made of pile sheets [52]
10.3.3. Pile foundation
When the bearing capacity of the soil is not sufficient to bear the structure, a pile foundation is a common solution. It takes a train free period of one weekend to install the pile sheets and pile foundation. Often some remaining piles need to be installed in the second period. Screw piles or Vibro-
combination piles seem the best solution for the execution of the foundation. In addition these piles can be installed at the right height, while driven piles need to be cut at the right level. Screw piles VGS-combination piles can be placed at the desired depth, from a higher level than the pile top. The prefabricated pile is lowered into the steel tube and can take up both tension as compression forces. The screw technique is a vibration-free method which is often used for the foundation of tunnels, parking garages etc. This method is depicted in Figure 10.8.
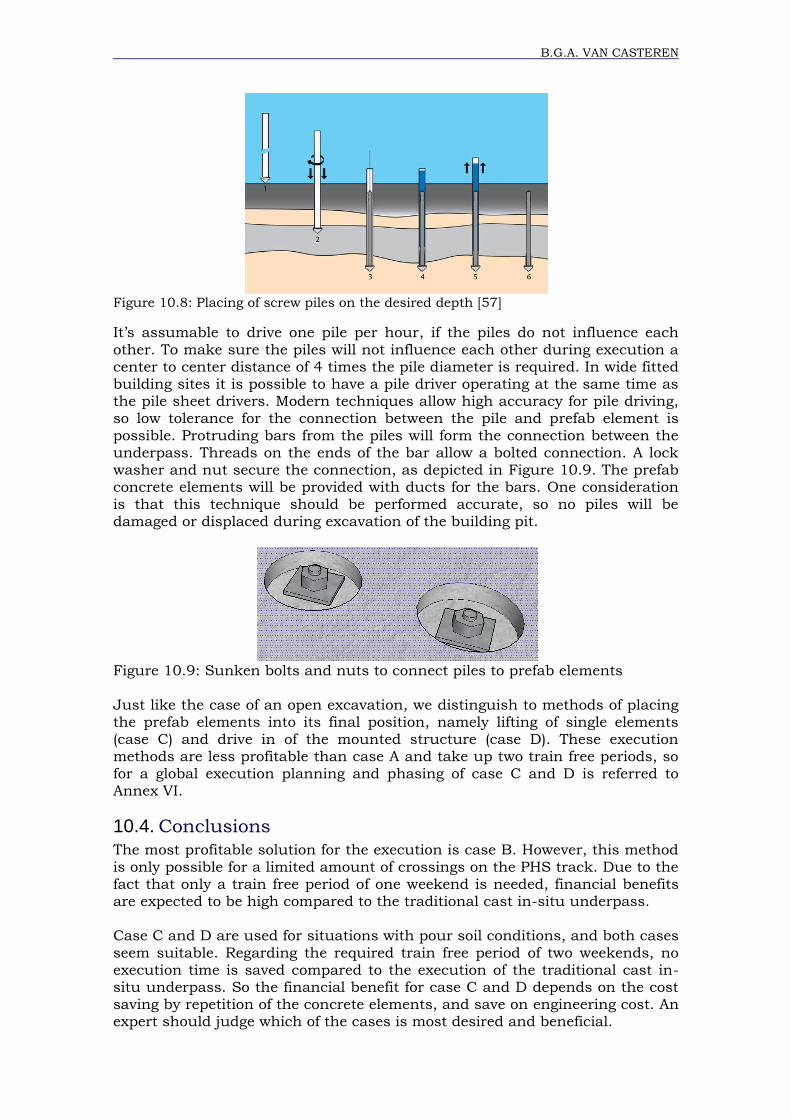
B.G.A. VAN CASTEREN
Figure 10.8: Placing of screw piles on the desired depth [57]
It’s assumable to drive one pile per hour, if the piles do not influence each
other. To make sure the piles will not influence each other during execution a center to center distance of 4 times the pile diameter is required. In wide fitted building sites it is possible to have a pile driver operating at the same time as the pile sheet drivers. Modern techniques allow high accuracy for pile driving, so low tolerance for the connection between the pile and prefab element is
possible. Protruding bars from the piles will form the connection between the underpass. Threads on the ends of the bar allow a bolted connection. A lock
washer and nut secure the connection, as depicted in Figure 10.9. The prefab concrete elements will be provided with ducts for the bars. One consideration is that this technique should be performed accurate, so no piles will be
damaged or displaced during excavation of the building pit.
Figure 10.9: Sunken bolts and nuts to connect piles to prefab elements
Just like the case of an open excavation, we distinguish to methods of placing the prefab elements into its final position, namely lifting of single elements
(case C) and drive in of the mounted structure (case D). These execution methods are less profitable than case A and take up two train free periods, so
for a global execution planning and phasing of case C and D is referred to Annex VI.
10.4. Conclusions
The most profitable solution for the execution is case B. However, this method
is only possible for a limited amount of crossings on the PHS track. Due to the fact that only a train free period of one weekend is needed, financial benefits are expected to be high compared to the traditional cast in-situ underpass. Case C and D are used for situations with pour soil conditions, and both cases
seem suitable. Regarding the required train free period of two weekends, no execution time is saved compared to the execution of the traditional cast in-situ underpass. So the financial benefit for case C and D depends on the cost saving by repetition of the concrete elements, and save on engineering cost. An expert should judge which of the cases is most desired and beneficial.

10. EXECUTION
96
It is recommended to work out the execution of all three cases on a more detailed scale to determine the more or less exact execution time and costs.
10.4.1. Alternative methods
Alternative execution methods could be interesting as well. Regarding the scope of this research there is only searched for the most common methods, which make it possible to execute the prefab underpass with prefab elements.
Further research should turn out if other methods could use more advantages of the prefab principle.
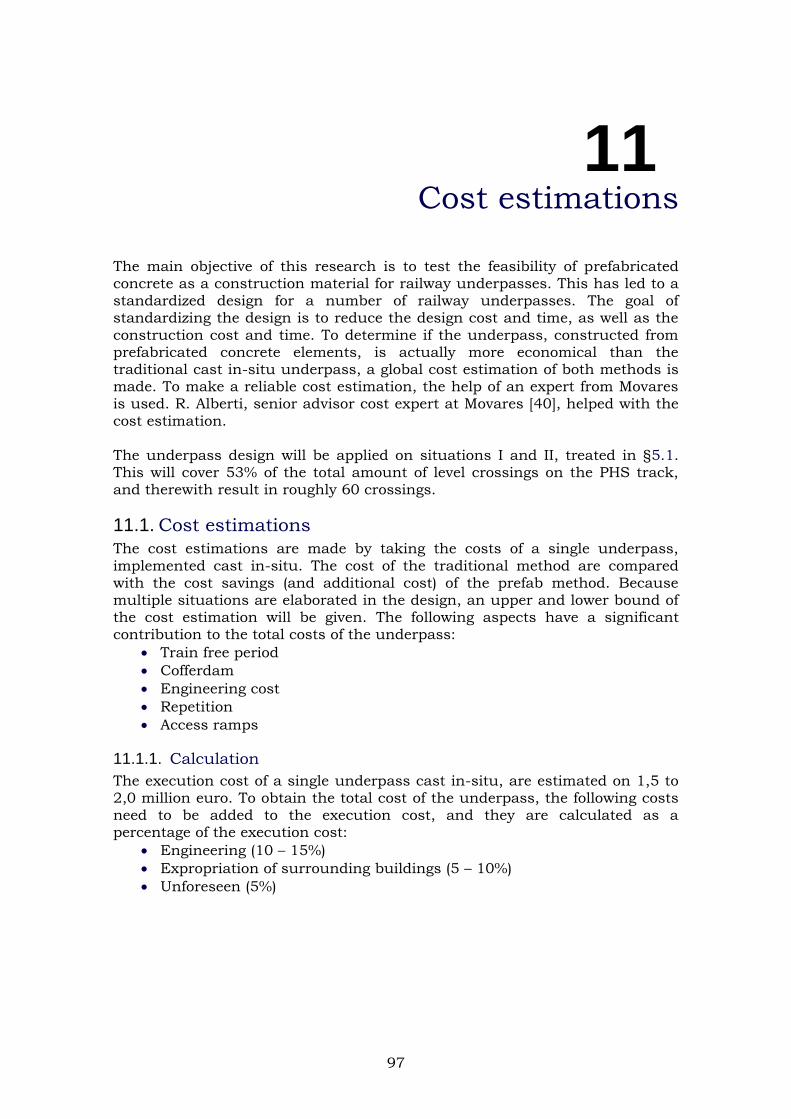
97
11 Cost estimations
The main objective of this research is to test the feasibility of prefabricated concrete as a construction material for railway underpasses. This has led to a standardized design for a number of railway underpasses. The goal of standardizing the design is to reduce the design cost and time, as well as the
construction cost and time. To determine if the underpass, constructed from prefabricated concrete elements, is actually more economical than the traditional cast in-situ underpass, a global cost estimation of both methods is made. To make a reliable cost estimation, the help of an expert from Movares is used. R. Alberti, senior advisor cost expert at Movares [40], helped with the
cost estimation. The underpass design will be applied on situations I and II, treated in §5.1.
This will cover 53% of the total amount of level crossings on the PHS track, and therewith result in roughly 60 crossings.
11.1. Cost estimations
The cost estimations are made by taking the costs of a single underpass,
implemented cast in-situ. The cost of the traditional method are compared with the cost savings (and additional cost) of the prefab method. Because multiple situations are elaborated in the design, an upper and lower bound of the cost estimation will be given. The following aspects have a significant contribution to the total costs of the underpass:
Train free period
Cofferdam
Engineering cost
Repetition
Access ramps
11.1.1. Calculation
The execution cost of a single underpass cast in-situ, are estimated on 1,5 to 2,0 million euro. To obtain the total cost of the underpass, the following costs need to be added to the execution cost, and they are calculated as a percentage of the execution cost:
Engineering (10 – 15%)
Expropriation of surrounding buildings (5 – 10%)
Unforeseen (5%)
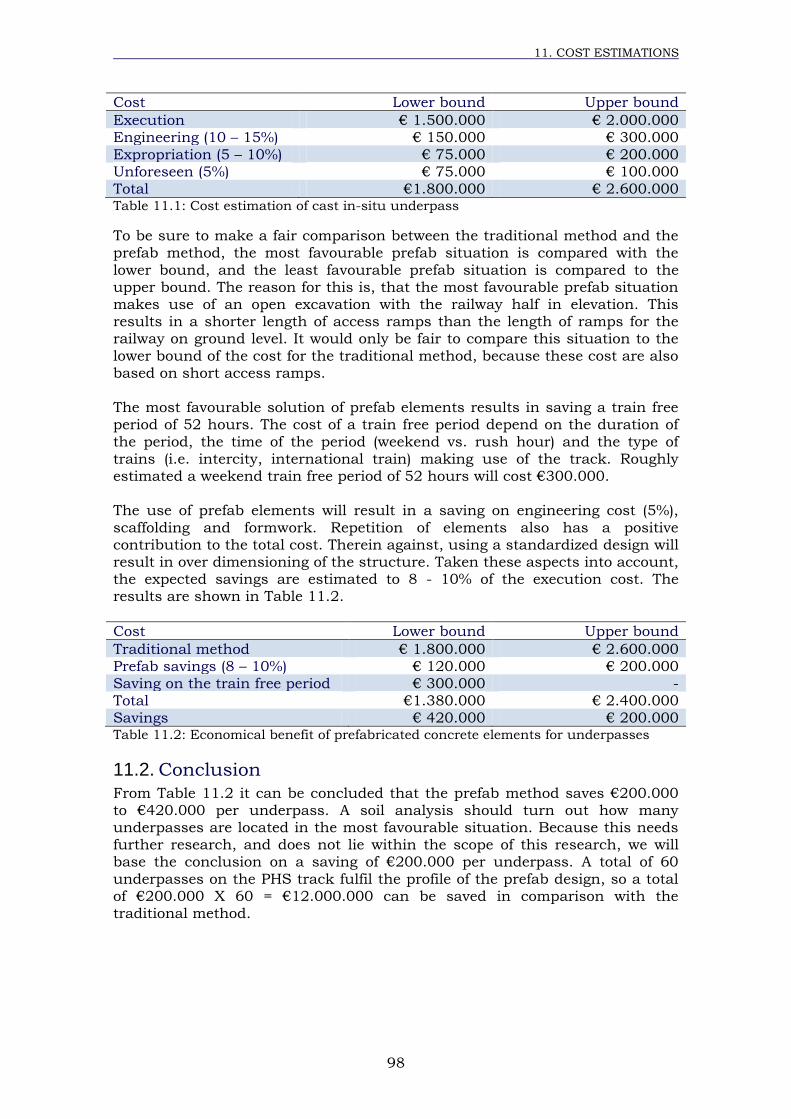
11. COST ESTIMATIONS
98
Cost Lower bound Upper bound
Execution € 1.500.000 € 2.000.000 Engineering (10 – 15%) € 150.000 € 300.000
Expropriation (5 – 10%) € 75.000 € 200.000 Unforeseen (5%) € 75.000 € 100.000 Total €1.800.000 € 2.600.000 Table 11.1: Cost estimation of cast in-situ underpass
To be sure to make a fair comparison between the traditional method and the prefab method, the most favourable prefab situation is compared with the
lower bound, and the least favourable prefab situation is compared to the upper bound. The reason for this is, that the most favourable prefab situation makes use of an open excavation with the railway half in elevation. This results in a shorter length of access ramps than the length of ramps for the railway on ground level. It would only be fair to compare this situation to the
lower bound of the cost for the traditional method, because these cost are also based on short access ramps. The most favourable solution of prefab elements results in saving a train free period of 52 hours. The cost of a train free period depend on the duration of
the period, the time of the period (weekend vs. rush hour) and the type of
trains (i.e. intercity, international train) making use of the track. Roughly estimated a weekend train free period of 52 hours will cost €300.000. The use of prefab elements will result in a saving on engineering cost (5%),
scaffolding and formwork. Repetition of elements also has a positive contribution to the total cost. Therein against, using a standardized design will result in over dimensioning of the structure. Taken these aspects into account, the expected savings are estimated to 8 - 10% of the execution cost. The results are shown in Table 11.2.
Cost Lower bound Upper bound
Traditional method € 1.800.000 € 2.600.000 Prefab savings (8 – 10%) € 120.000 € 200.000 Saving on the train free period € 300.000 - Total €1.380.000 € 2.400.000 Savings € 420.000 € 200.000 Table 11.2: Economical benefit of prefabricated concrete elements for underpasses
11.2. Conclusion
From Table 11.2 it can be concluded that the prefab method saves €200.000 to €420.000 per underpass. A soil analysis should turn out how many underpasses are located in the most favourable situation. Because this needs further research, and does not lie within the scope of this research, we will base the conclusion on a saving of €200.000 per underpass. A total of 60
underpasses on the PHS track fulfil the profile of the prefab design, so a total of €200.000 X 60 = €12.000.000 can be saved in comparison with the traditional method.
99
12 Conclusions & recommendations
12.1. Conclusion
The research question stated at the start of the thesis (§1.3) can be answered
with the following conclusions:
12.1.1. General
A solution for (railway)underpasses constructed with prefabricated concrete elements has been found. In the search for a solution that should be an attractive alternative to cast in-situ underpasses, the main structure has been standardized. The structure is applicable for a large amount of situations, herewith a high repetition factor can be obtained. If we look at the PHS track,
the design is applicable for at least 53% of the underpasses, but (with small
modifications) it could be a lot more. It is important to understand that not all components of a design, or aspects of its execution should be standardized, in order to obtain a financial benefit.
In this way over dimensioning of the structure can be avoided. Understanding of the structural behavior and the influences of the soil conditions on the structure and execution method, helps to distinguish which parts need to be standardized and which parts do not.
12.1.2. Element configuration
The element configuration is aligned with the maximum allowed transport dimensions with continued dispensation. Various configurations look promising for a solution to prefabricated concrete underpasses. The location of
the joints and the simplicity of the configuration turns out to be the most important criteria to base the design on.
12.1.3. Structural design
From the variant study for the element configuration two variants have been
found, which both seem applicable for the underpasses from situation I and II (§5.1) of the PHS track. The structural behavior of these element configurations has been analyzed and verifications have proven the structure
to be watertight, and structural safety can be guaranteed. A connection has been designed which allows load transfer and is watertight. Therefore the technical part of this research is proven to be a feasible alternative to the cast in-situ concrete underpass.
12.1.4. Execution
For the execution of the underpass multiple scenarios are considered, in order to obtain a feasible solution to the most common soil conditions. It turns out
that the use of prefab concrete elements comes to full advantage only for a limited amount of locations. Namely, for the railway half in elevation in combination with favourable soil conditions, such as solid ground and a low
12. CONCLUSIONS & RECOMMENDATIONS
100
groundwater level. For other soil conditions the application of prefab elements is more or less comparable to the execution timeframe of poured concrete.
12.1.5. Finances
The use of prefab elements has a positive effect on the design and construction cost. In general cost savings can be made on the engineering process of the underpass. Furthermore a high repetition of elements results in savings on the production costs. And the use of prefab elements make it possible to save on
the cost of a train free period, for a limited amount of situations. The financial benefit is estimated on €200.000 to €420.000 per underpass. So it can be concluded that the prefab underpass is a financially profitable alternative to the traditional underpass.
12.2. Recommendations
As this thesis leaves room for further research, several recommendations are
made. These recommendations focus on issues, from which it is expected that they can enlarge this research in a positive matter.
12.2.1. Other applications
It is recommended to research if the underpass design is applicable for other
underpasses on the PHS track than just the crossings from situation I and II (§5.1). In addition to that it is also likely that the prefabricated elements are applicable beyond the PHS track. A wider range of application can reduce the
production cost of prefabricated elements. As concluded from §6.3, element layout C scores high on the structural aspects of the multi-criteria-analysis. However, it has an undesirable score on the available width for the road profile, therefore this layout not worked out
any further. It is recommended to see for what purpose this layout can be used without giving any problems to the available dimensions.
12.2.2. Transportation possibilities
For this research the transport dimensions are limited to the current available truck & trailer combinations, however the maximum dispensation leaves room for new possibilities in the element configuration. Therefore it is recommended to analyze if it is financially profitable to adjust trailers or deep loaders to
desired element dimensions, and therewith enlarge the possibilities for the element configuration. This could make it possible to extend element layout C
to the ideal road profile, and become a very valuable addition to this research.
12.2.3. Structural design
As it is only tested if the structural design requires the demands of water tightness and structural safety, the design leaves room for optimization. Therefore it is recommended that the structural design will be optimized in order to obtain a more slender, and possible cheaper design.
12.2.4. Execution
It is recommended to work out the execution of the cases discussed in §10,
out on a more detailed scale, to determine the more or less exact execution time and costs. In this way a more precise planning and duration of the train free period can be obtained. Also alternative methods of execution should be investigated, to find out if the use of prefab elements can come to its full advantage for a larger range of situations.
101
References
Documentation
[1] Amaarouk, R., de Gijt, J.G., Braam, R. (2013), The feasibility of removable prefab diaphragm walls, Delft University of Technology, Stadsontwikkeling Rotterdam;
[2] B&P Bodeminjectie BV, Informatieblad bodeminjectie, www.bodeminjectie.nl;
[2b] Beijer, A.J., (2010), Ultra Rapid UnderPass – The adaption of the URUP method for the Netherlands, TU Delft Faculty of Civil Engineering and Geosciences;
[3] CIE4281 (2012), Designing and understanding precast concrete structure in buildings,TU Delft Faculty of Civil Engineering and Geosciences;
[4] COB (2014), Handboek Tunnelbouw – Civiel technisch ontwerp en Realisatie van tunnels, version 2014.1;
[5] CROW (2012), ASVV 2012 – Aanbevelingen voor verkeersvoorzieningen binnen de bebouwde kom:
[6] CROW (2013), Handboek wegontwerp 2013 – Erftoegangswegen; [7] CROW (2013), Handboek wegontwerp 2013 – Gebiedsontsluitingswegen;
[8] Cugla BV (2011), Product specificaties – Cuglaton COLD Stelmortel K70, www.cugla.nl;
[9] Cugla BV (2011), Product specificaties – Cuglaton Injectiemortel EN 447, www.cugla.nl;
[10] Cugla BV(2011), Product specificaties – Cuglaton Liquick 1mm, www.cugla.nl;
Glerum, A. (1982), Watertightness of concrete tunnel structures, Vakgroep waterbouwkunde afd. Civiele techniek TU Delft;
[11] Hogeslag, A.J., Vambersky, J.N.J.A. and Walraven, J.C. (1990), Prefabrication of Concrete Structures – International Seminar Delft 1990, Delft University Press;
[12] Ketel, J.A. (2001), Oceanium Blijdorp Rotterdam - Honderd procent waterdicht!, Cement 2001 nr. 4;
[13] Ministerie van Infrastructuur en Milieu (2013), Doorstroomstation Utrecht, version 1.0 Rijksoverheid;
[14] Ministerie van Infrastructuur en Milieu (2011), Reizen zonder spoorboekje – Programma Hoogfrequent Spoorvervoer, Rijksoverheid;
[14b] Nemetschek Scia (2013), Referentiehandleiding, Scia Engineer; [15] NEN-EN 1990+A1+A1/C2 (2011), Basis of structural design, Comité Européen
de Normalisation; [16] NEN-EN 1990+A1+A1/C2/NB (2011), Basis of structural design, Comité
Européen de Normalisation;
[17] NEN-EN 1991-1-5 (2003), Actions on structures – Part 1-5: General actions - Thermal actions, Comité Européen de Normalisation;
[18] NEN-EN 1991-1-5/NB (2003), Actions on structures – Part 1-5: General actions – Thermal actions, Comité Européen de Normalisation;
[19] NEN-EN 1991-2+C1 (2011), Actions on structures – Part 2: Traffic loads on bridges, Comité Européen de Normalisation;
[20] NEN-EN 1991-2+C1/NB (2011), Actions on structures – Part 2: Traffic loads on bridges, Comité Européen de Normalisation;
[21] NEN-EN 1992-1-1 (2005), Desing of concrete structures – General rules and rules for buildings, Comité Européen de Normalisation;
[22] NEN-EN 1992-1-1/NB (2005), Desing of concrete structures – General rules and rules for buildings, Comité Européen de Normalisation;
[23] NEN-EN 1992-2+C1 (2011), Desing of concrete structures – Design and detailing rules, Comité Européen de Normalisation;
REFERENCES
102
[24] NEN-EN 1992-2+C1/NB (2011), Desing of concrete structures – Design and detailing rules, Comité Européen de Normalisation;
[24b] Oldenhave, A.H. (2014), Starting a large diameter TBM from surface – feasibility study for the Netherlands, TU Delft Faculty of Civil Engineering and Geosciences;
[25] OVS00026-V006 (2013), Ontwerpvoorschrift – Profiel van Vrije Ruimte en Rode Meetgebied, Prorail;
[26] OVS00030-1-V003 (2013), Ontwerpvoorschrift – Kunstwerken – deel 1 – kunstwerken voor spoorverkeer, Prorail;
[27] OVS00030-6-V004 (2012), Ontwerpvoorschrift – Kunstwerken – deel 6 – Aanvullingen en wijzigingen op NEN-EN normen, Prorail;
[28] OVS00056-5.1-V007 (2013), Ontwerpvoorschrift – Baan en bovenbouw Deel 5.1 Spoor in ballast, Prorail;
[29] ProRail (2013), Functionele onttrekkingstekeningen - Instructie voor het ontwerpen van FOTs;
[30] RDW (2012), Overzicht maten en gewichten in Nederland – Regeling voertuigen 5.18.11-5.18.18;
[31] Rijkswaterstaat Ministerie van Infrastructuur en Milieu (2013), Richtlijnen Ontwerpen Kunstwerken ROK1.2,
[32] Romein Beton BV, Tunnels (Brochure), www.romein.nl; [33] Romein Beton BV (2007), Tunnels (Product sheet), www.romein.nl;
[34] Romein Beton BV (2014), Uitvoeringsontwerp – Overzichtstekening Tunnel KW 10, N62, Opdrachtgever Boskalis
[34b] Romein Beton BV (2014), Uitvoeringsontwerp – Overzichtstekening Tunnel met toeritten N207c-n452, Gouda Rosmalen, Opdrachtgever Heijmans integrale Projecten
[35] Steinhoff, A. (2014), Perfekt in Form – Rahmendichtungen im Vergleich, DS
Dichtungstechniek GmbH; [35b] Tassios, T.P., Vintzeleou, E.N. (1986), Mathematical models for dowel action
under monotonic and cyclic conditions, Magazine of concrete research: Vol. 38,
No. 134: March 1986 [36] Trelleborg Bakker B.V., Rubber Waterstops 10/05 (Brochure), Trelleborg
Engineered systems; [37] van Viegen, B.C.(2015), Underpasses for railways – standardization of the
design, TU Delft Faculty of Civil Engineering and Geosciences; [38] Vambersky, J.N.J.A., Walraven, J.C. (1986), Op druk belaste mortelvoegen,
Cement 1986 nr. 9;
[39] Vos, O.M.Th. (1993), Prefab-tunnelbouw als flexibel alternatief - 'n variant voor de Betuweroute – eindrapport, Strukton Betonbouw, Delft University of Applied
science;
Interviewed professionals:
[40] Alberti, R., Senior advisor cost estimations at Movares; [41] Awaad, H., Senior project manager at Movares, concrete structures; [42] de Vries, P., Head Commerce, marketing & calculation at Romein Beton BV,
prefab concrete underpasses; [43] Dijkstra, B., Advisor Geotechnics at Movares; [44] Freriks, W.G.M., Design manager/Project manager at Movares, concrete
railway structures; [45] Ottenhof, V.A.M., Advisor Civil Engineering/Physical safety at Movares, train
free period; [46] van Breukelen, T., Road designer at Movares, road/underpass profile; [47] van Vliet, R., Product manager at Culga BV, mortar joints;

Used websites
[48] maps.bodemdata.nl, BISNederland, soil data NL; [49] www.bodeminjectie.nl, soil injection;
[50] www.bronbemaling.nu, drainage; [51] www.demets.be, transport limitations; [52] www.hektec.nl, cofferdam underpass Oss; [53] www.liebherr.com, crane capacity; [54] www.nicolas.fr, SPMT; [55] www.tensa.nl, social safety; [56] www.vandervlist.com, transport limitations; [57] www.vroom.nl, screw piles;
[58] www-.youtube.com/watch?v=1sPo1tH8l9s, Didam;

REFERENCES
104
105
List of figures
Figure 3.1: Seal function diagram ........................................................................ 12 Figure 3.2: Sealing principles [39] ........................................................................ 13 Figure 3.3: Double wedge seal type A [35] ............................................................. 13 Figure 3.4: Double wedge seal type B [35] ............................................................. 14 Figure 4.1: Transport dimensions & capacities according to highway codes, based on: [3] ........................................................................................................ 16 Figure 4.2: Transport dimensions for continued dispensation [30] ........................ 16 Figure 4.3: Cargo dimensions per truck ................................................................ 17 Figure 4.4: Liebherr crane capacities [53] ............................................................. 18 Figure 5.1: Division of situations for level crossings .............................................. 19 Figure 5.2: Coordinate system of the underpass ................................................... 21 Figure 5.3: Schematization of railway track definitions [25] .................................. 22 Figure 5.4: PVR-GC for tunnel/closed cross-section/open box (no curvature) [25] ...................................................................................................................... 23 Figure 5.5: Clearance gauges for access roads according to CROW [6] ................... 24 Figure 5.6: Standard cross section access road type 1 with one side cycle path
for 2 directions according to CROW [6] ................................................................. 25 Figure 5.7: Ratio between height difference and slope for cycle traffic [6] ............... 25 Figure 5.8: Pedestrian and bicycle underpass with straight walls [5] ..................... 26 Figure 5.9: Pedestrian and bicycle underpass with corridor walls [5] ..................... 26 Figure 5.10: Deck width (y-direction) .................................................................... 26 Figure 5.11: Minimum dimensions underpass road profile .................................... 27 Figure 5.12: Ideal dimensions underpass road profile ........................................... 27 Figure 5.13: Light contributes to a comfortable feeling for slow traffic [55] ............ 28 Figure 5.14: Soil conditions in the Netherlands, by BIS Nederland [48] ................. 28 Figure 6.1: Cross-section underpass - Layout A .................................................... 35 Figure 6.2: Cross-section underpass - Layout B ................................................... 36 Figure 6.3: Cross-section underpass - Layout C ................................................... 37 Figure 6.4: Cross-section underpass - Layout D ................................................... 38 Figure 6.5: Cross-section underpass - Layout E ................................................... 39 Figure 6.6: Cross-section underpass - Layout F .................................................... 40 Figure 6.7: Cross-section underpass - Layout G ................................................... 41 Figure 6.8: Cross-section underpass - Layout H ................................................... 42 Figure 6.9:Overview of multi-criteria analysis ....................................................... 43 Figure 6.10: Both road profiles for underpasses of layout I ................................... 44 Figure 6.11: Cross-section underpass - Layout I: Left underpass for the motorway, right underpass for cyclists ................................................................. 45 Figure 6.12: Radar charts sensitivity analysis of layout adjustments .................... 46 Figure 7.1: Steel edge element deck ...................................................................... 48 Figure 7.2: Load model 71 [19] ............................................................................. 49 Figure 7.3: Horizontal loading on the ground retaining wall due to vertical LM71 ................................................................................................................... 50 Figure 7.4: Load model BM1 [19] .......................................................................... 51 Figure 7.5: Load model BM2 [19] .......................................................................... 52 Figure 8.1: Rigid dowel connection between prefab elements [34] .......................... 58 Figure 8.2: Watertight joint [33] ........................................................................... 58 Figure 8.3: Prefab access ramps [33] .................................................................... 59 Figure 8.4: Expansion joints [39] .......................................................................... 59
LIST OF FIGURES
106
Figure 8.5: W9UI joint [36] ................................................................................... 60 Figure 9.1: Cross-section of layout H .................................................................... 63 Figure 9.2: FEM modeling with Scia Engineer (left: load case on structure,
right: bending moment due to load) ...................................................................... 64 Figure 9.3: Cross-section of layout I ..................................................................... 64 Figure 9.4: Static scheme of the structure ............................................................ 65 Figure 9.5: Static scheme of the structure with the applied moments.................... 65 Figure 9.6: Bending moment diagram of Layout H corresponding to the results from hand calculations ........................................................................................ 67 Figure 9.7: Bending moment diagram corresponding to the results from Scia
Engineer .............................................................................................................. 67 Figure 9.8: Shear force diagram corresponding to Scia Engineer ........................... 67 Figure 9.9: Bending moment diagram of Layout I corresponding to the results from hand calculations ........................................................................................ 68 Figure 9.10: Dowel connection in the wall, inject with grout ................................. 72 Figure 9.11: Bearing capacity according to Prandtl and failure lines for embedded dowel [35b] .......................................................................................... 73 Figure 9.12: Stresses in the concrete and along the dowel according to [35b] ........ 73 Figure 9.13: Diagram of concrete stresses under a dowel, due to a dowel force D acting on the concrete face [35b] ....................................................................... 74 Figure 9.14: Stresses in the concrete around the dowel [35b] ................................ 75 Figure 9.15: Effective area of the cross-section influenced by a dowel, when bottom cover is critical [35b] ................................................................................ 75 Figure 9.16: Failure mechanism of a long , free-headed pile in cohesive soil
[35b] .................................................................................................................... 76 Figure 9.17: Failure mode I: concrete splitting ...................................................... 77 Figure 9.18: Moment equilibrium in the interface ................................................. 78 Figure 9.19: Failure mode II: Yielding of the dowel and concrete crushing under the dowel ................................................................................................... 78 Figure 9.20: Effective concrete area to take up the vertical forces in the walls ....... 80 Figure 9.21: Normal force distribution in the walls (compressive forces) ................ 81 Figure 9.22: Effective concrete area to take up differences in vertical loading on the deck. ......................................................................................................... 81 Figure 9.23: Prestress cables located in the concrete cross-section of layout H ...... 82 Figure 9.24: Double wedge seal type B [35] ........................................................... 82 Figure 9.25: Prefab elements used for access ramp, according to [34b] ................. 83 Figure 9.26: Execution cases for Layout I ............................................................. 84 Figure 9.27: Execution time related to variable distance between 2 underpasses of layout I ........................................................................................ 85 Figure 9.28: Variable execution time of Layout I - Case I compared to execution time of Layout H - Case B ..................................................................... 86 Figure 10.1: Lifting the prefab concrete element into its final position, photo by Romein Beton BV ................................................................................................. 90 Figure 10.2: Driving the completed structure into its final position, picture
taken from time-lapse movie of Didam - Youtube© [58] ......................................... 90 Figure 10.3: Open building pit with soil improvement ........................................... 91 Figure 10.4: Self Propelled Modular Transporter (SPMT) [54] ................................ 92 Figure 10.5: Execution phases of case B............................................................... 93 Figure 10.6: Cofferdam with pile foundation ......................................................... 94 Figure 10.7: Excavated cofferdam made of pile sheets [52] .................................... 94 Figure 10.8: Placing of screw piles on the desired depth [57] ................................. 95 Figure 10.9: Sunken bolts and nuts to connect piles to prefab elements ............... 95

I
ANNEX I:
Element configuration
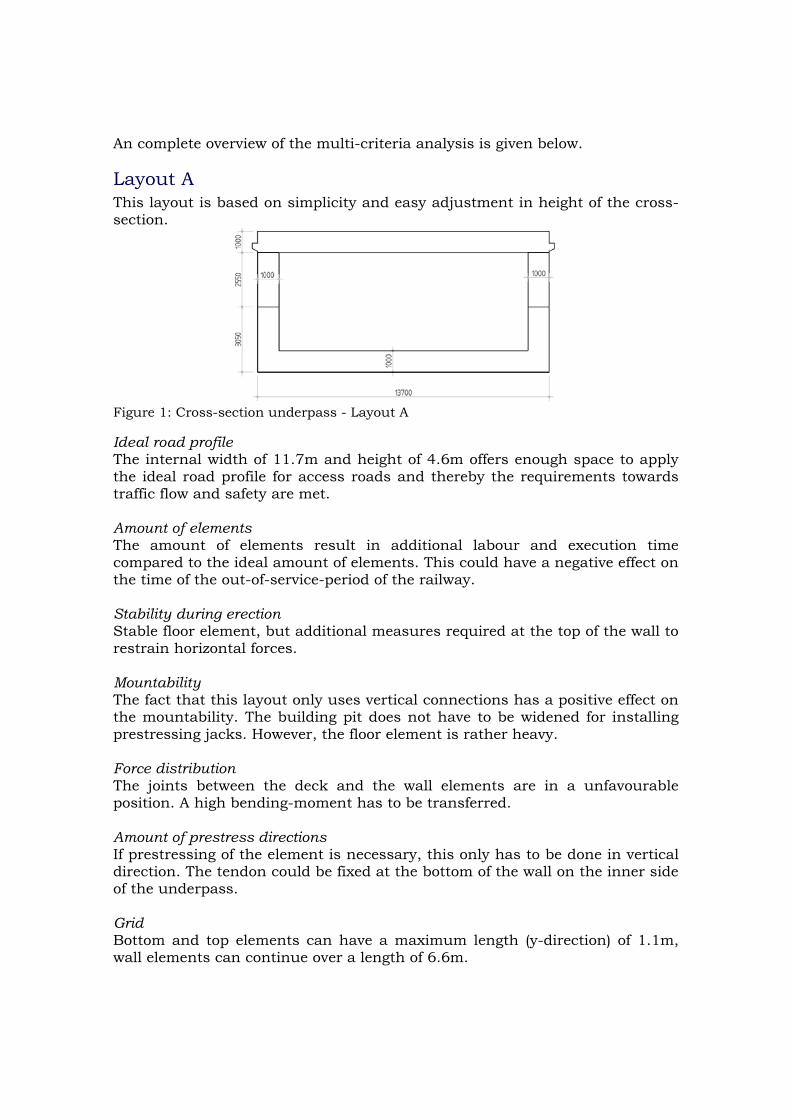
An complete overview of the multi-criteria analysis is given below.
Layout A This layout is based on simplicity and easy adjustment in height of the cross-section.
Figure 1: Cross-section underpass - Layout A
Ideal road profile The internal width of 11.7m and height of 4.6m offers enough space to apply the ideal road profile for access roads and thereby the requirements towards traffic flow and safety are met. Amount of elements The amount of elements result in additional labour and execution time compared to the ideal amount of elements. This could have a negative effect on the time of the out-of-service-period of the railway. Stability during erection Stable floor element, but additional measures required at the top of the wall to restrain horizontal forces. Mountability The fact that this layout only uses vertical connections has a positive effect on the mountability. The building pit does not have to be widened for installing prestressing jacks. However, the floor element is rather heavy. Force distribution The joints between the deck and the wall elements are in a unfavourable position. A high bending-moment has to be transferred. Amount of prestress directions If prestressing of the element is necessary, this only has to be done in vertical direction. The tendon could be fixed at the bottom of the wall on the inner side of the underpass. Grid Bottom and top elements can have a maximum length (y-direction) of 1.1m, wall elements can continue over a length of 6.6m.
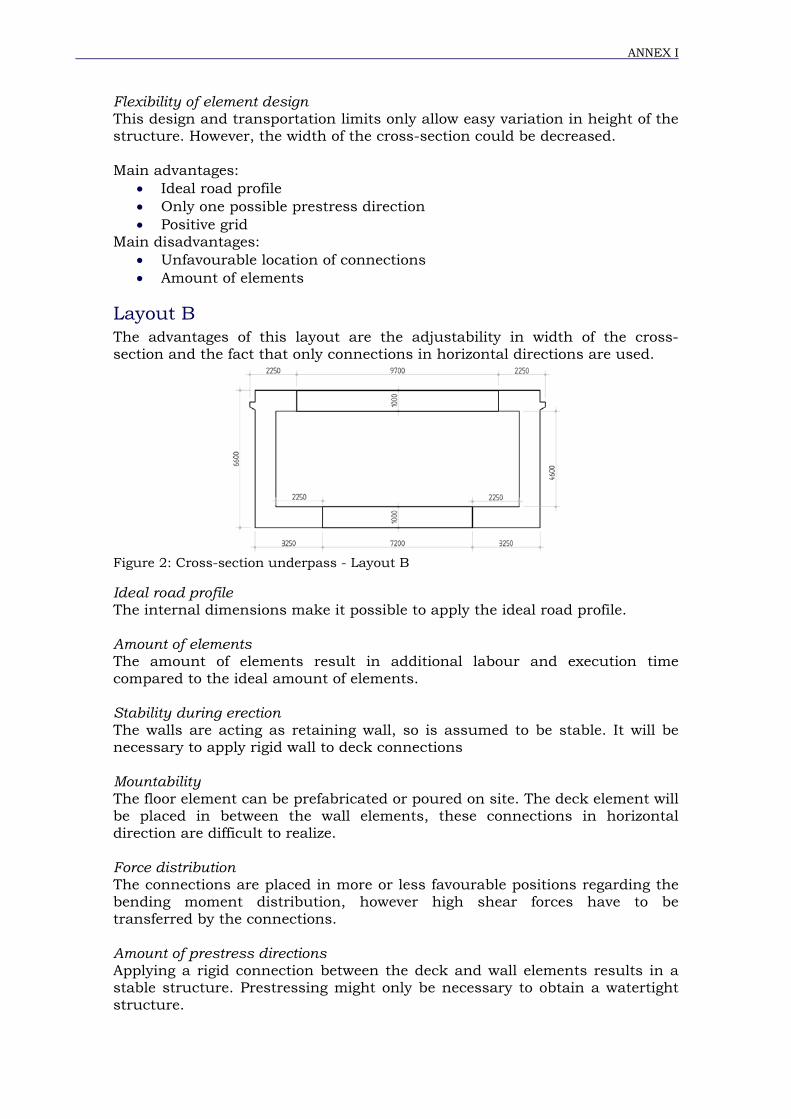
ANNEX I
Flexibility of element design This design and transportation limits only allow easy variation in height of the structure. However, the width of the cross-section could be decreased. Main advantages:
• Ideal road profile • Only one possible prestress direction • Positive grid
Main disadvantages: • Unfavourable location of connections • Amount of elements
Layout B The advantages of this layout are the adjustability in width of the cross-section and the fact that only connections in horizontal directions are used.
Figure 2: Cross-section underpass - Layout B
Ideal road profile The internal dimensions make it possible to apply the ideal road profile. Amount of elements The amount of elements result in additional labour and execution time compared to the ideal amount of elements. Stability during erection The walls are acting as retaining wall, so is assumed to be stable. It will be necessary to apply rigid wall to deck connections Mountability The floor element can be prefabricated or poured on site. The deck element will be placed in between the wall elements, these connections in horizontal direction are difficult to realize. Force distribution The connections are placed in more or less favourable positions regarding the bending moment distribution, however high shear forces have to be transferred by the connections. Amount of prestress directions Applying a rigid connection between the deck and wall elements results in a stable structure. Prestressing might only be necessary to obtain a watertight structure.
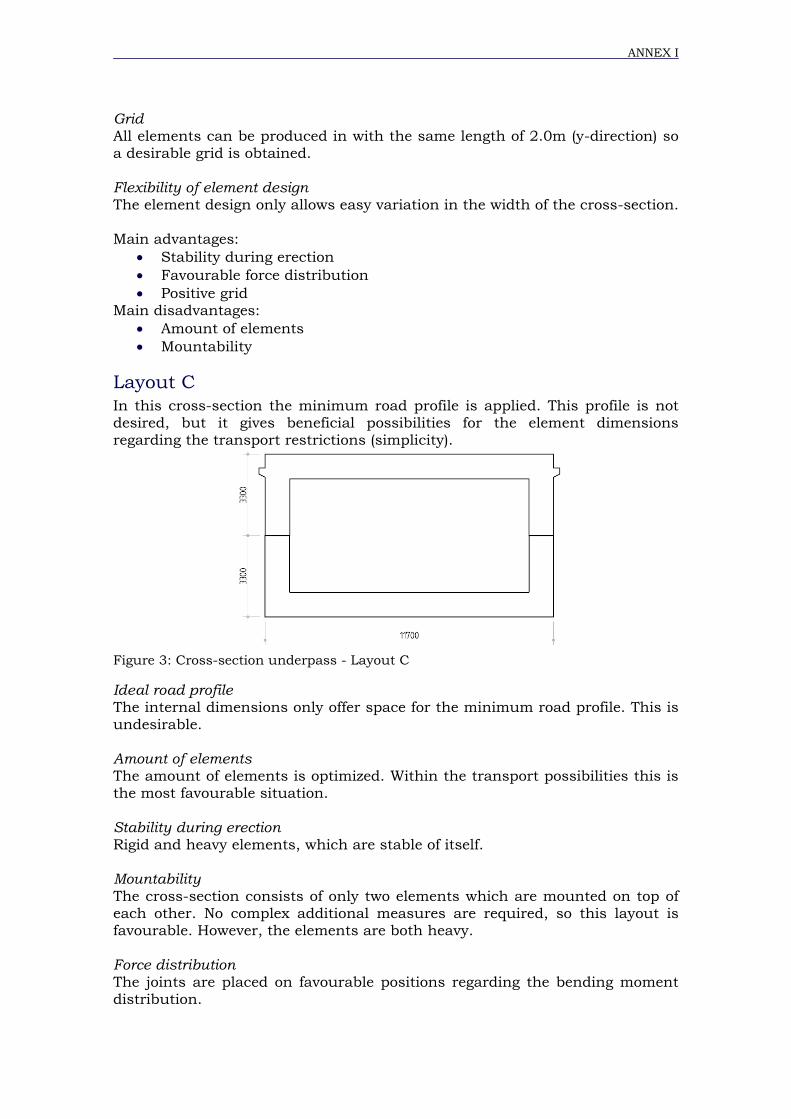
ANNEX I
Grid All elements can be produced in with the same length of 2.0m (y-direction) so a desirable grid is obtained. Flexibility of element design The element design only allows easy variation in the width of the cross-section. Main advantages:
• Stability during erection • Favourable force distribution • Positive grid
Main disadvantages: • Amount of elements • Mountability
Layout C In this cross-section the minimum road profile is applied. This profile is not desired, but it gives beneficial possibilities for the element dimensions regarding the transport restrictions (simplicity).
Figure 3: Cross-section underpass - Layout C
Ideal road profile The internal dimensions only offer space for the minimum road profile. This is undesirable. Amount of elements The amount of elements is optimized. Within the transport possibilities this is the most favourable situation. Stability during erection Rigid and heavy elements, which are stable of itself. Mountability The cross-section consists of only two elements which are mounted on top of each other. No complex additional measures are required, so this layout is favourable. However, the elements are both heavy. Force distribution The joints are placed on favourable positions regarding the bending moment distribution.
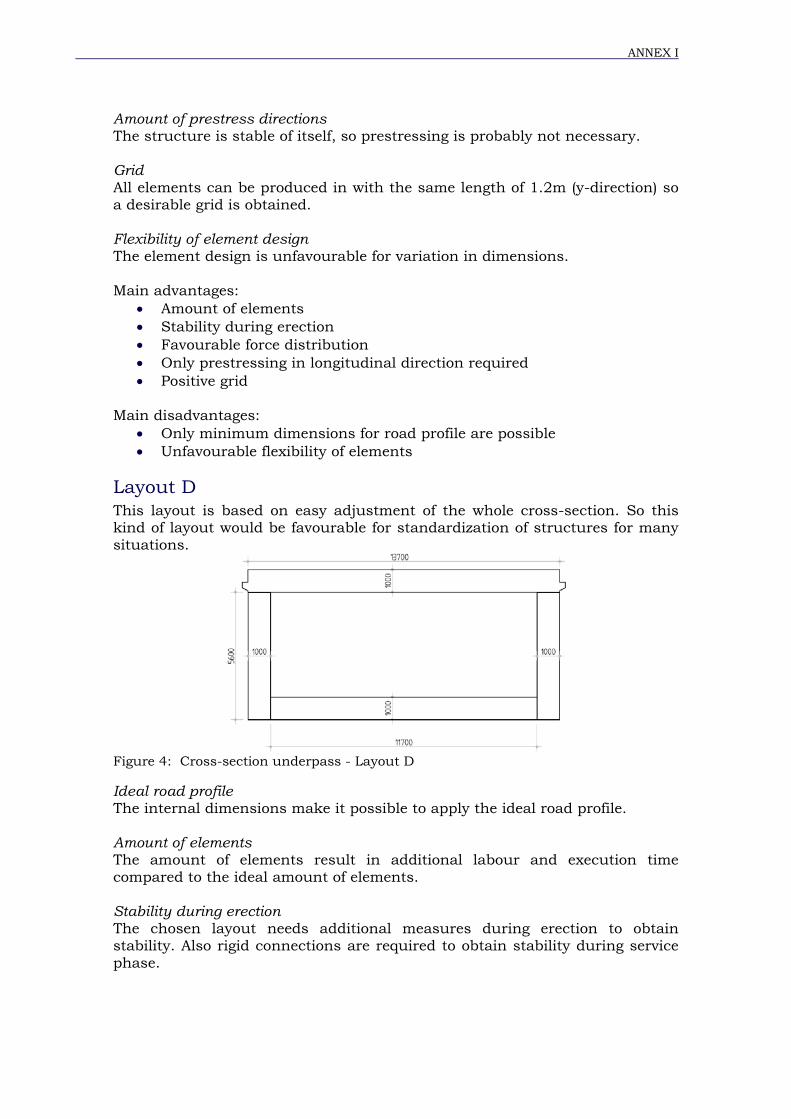
ANNEX I
Amount of prestress directions The structure is stable of itself, so prestressing is probably not necessary. Grid All elements can be produced in with the same length of 1.2m (y-direction) so a desirable grid is obtained. Flexibility of element design The element design is unfavourable for variation in dimensions. Main advantages:
• Amount of elements • Stability during erection • Favourable force distribution • Only prestressing in longitudinal direction required • Positive grid
Main disadvantages:
• Only minimum dimensions for road profile are possible • Unfavourable flexibility of elements
Layout D This layout is based on easy adjustment of the whole cross-section. So this kind of layout would be favourable for standardization of structures for many situations.
Figure 4: Cross-section underpass - Layout D
Ideal road profile The internal dimensions make it possible to apply the ideal road profile. Amount of elements The amount of elements result in additional labour and execution time compared to the ideal amount of elements. Stability during erection The chosen layout needs additional measures during erection to obtain stability. Also rigid connections are required to obtain stability during service phase.
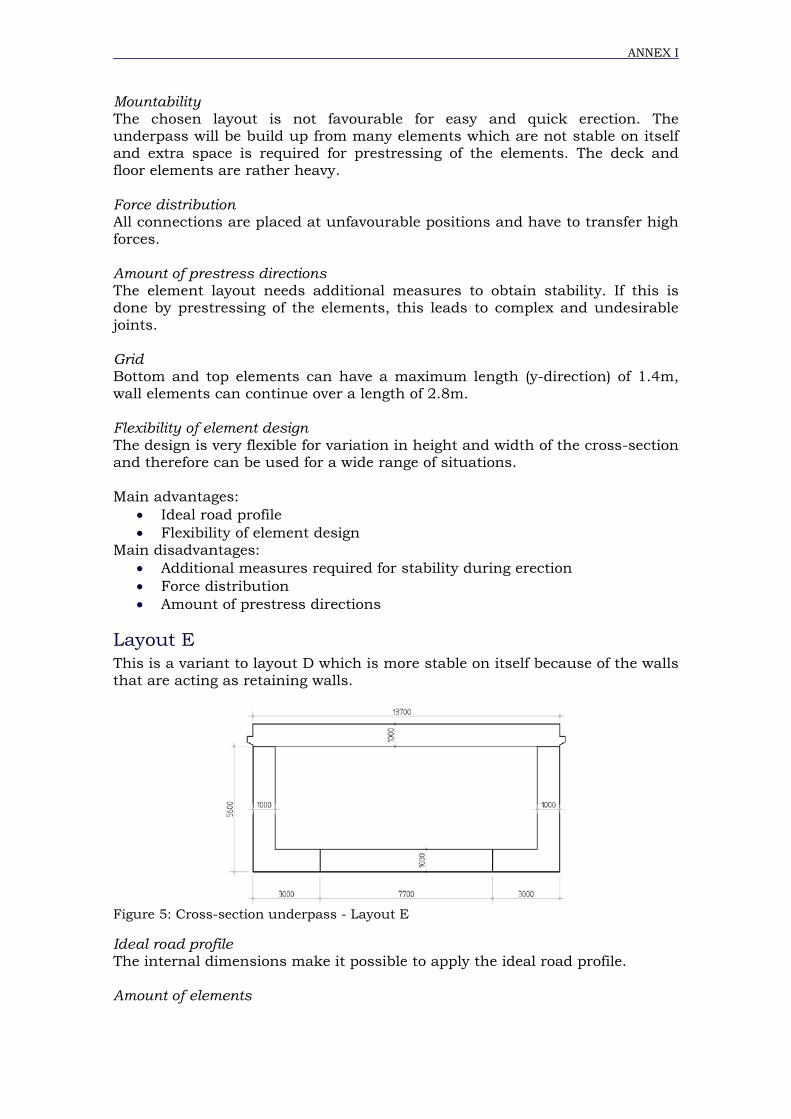
ANNEX I
Mountability The chosen layout is not favourable for easy and quick erection. The underpass will be build up from many elements which are not stable on itself and extra space is required for prestressing of the elements. The deck and floor elements are rather heavy. Force distribution All connections are placed at unfavourable positions and have to transfer high forces. Amount of prestress directions The element layout needs additional measures to obtain stability. If this is done by prestressing of the elements, this leads to complex and undesirable joints. Grid Bottom and top elements can have a maximum length (y-direction) of 1.4m, wall elements can continue over a length of 2.8m. Flexibility of element design The design is very flexible for variation in height and width of the cross-section and therefore can be used for a wide range of situations. Main advantages:
• Ideal road profile • Flexibility of element design
Main disadvantages: • Additional measures required for stability during erection • Force distribution • Amount of prestress directions
Layout E This is a variant to layout D which is more stable on itself because of the walls that are acting as retaining walls.
Figure 5: Cross-section underpass - Layout E
Ideal road profile The internal dimensions make it possible to apply the ideal road profile. Amount of elements
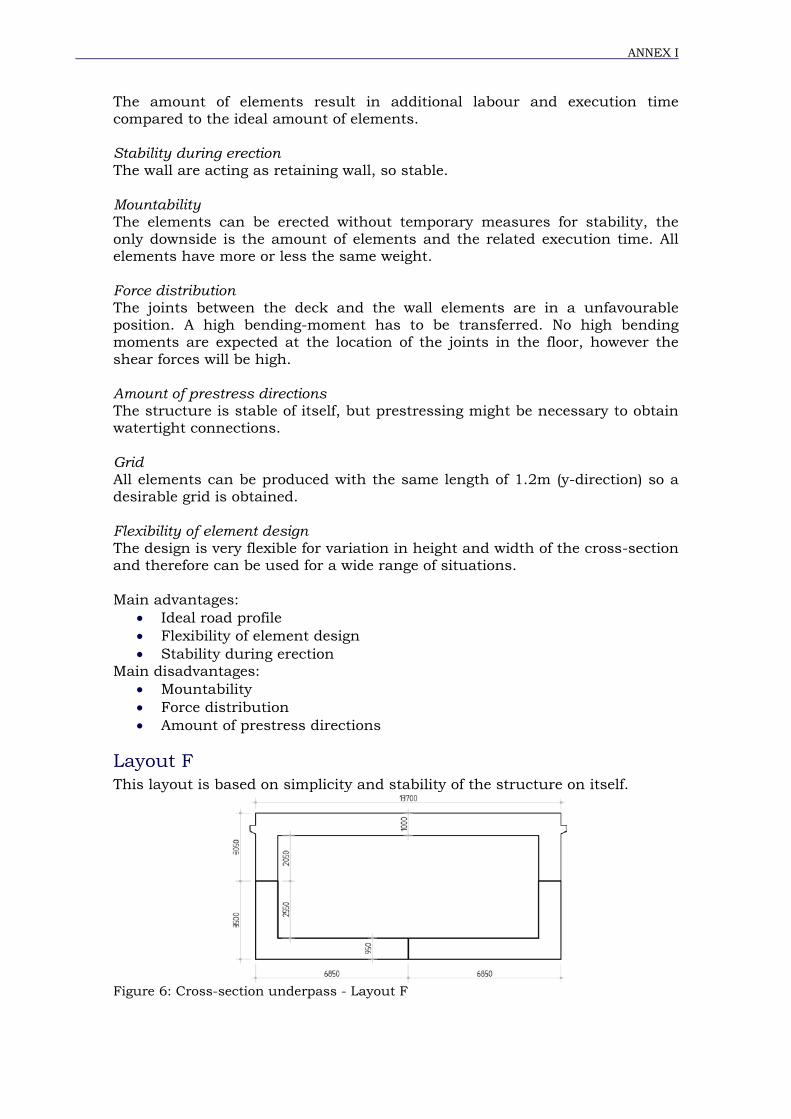
ANNEX I
The amount of elements result in additional labour and execution time compared to the ideal amount of elements. Stability during erection The wall are acting as retaining wall, so stable. Mountability The elements can be erected without temporary measures for stability, the only downside is the amount of elements and the related execution time. All elements have more or less the same weight. Force distribution The joints between the deck and the wall elements are in a unfavourable position. A high bending-moment has to be transferred. No high bending moments are expected at the location of the joints in the floor, however the shear forces will be high. Amount of prestress directions The structure is stable of itself, but prestressing might be necessary to obtain watertight connections. Grid All elements can be produced with the same length of 1.2m (y-direction) so a desirable grid is obtained. Flexibility of element design The design is very flexible for variation in height and width of the cross-section and therefore can be used for a wide range of situations. Main advantages:
• Ideal road profile • Flexibility of element design • Stability during erection
Main disadvantages: • Mountability • Force distribution • Amount of prestress directions
Layout F This layout is based on simplicity and stability of the structure on itself.
Figure 6: Cross-section underpass - Layout F
ANNEX I
Ideal road profile The internal dimensions make it possible to apply the ideal road profile. Amount of elements The amount of elements are more or less favourable. A short construction time should be possible. However the weight of the top element is very high and in combination with the large dimensions this results in additional measures regarding the transportation. Nevertheless it falls within the transport limitation. Stability during erection Rigid and heavy elements, which are stable of itself. Mountability The cross-section consists of only three elements which are mounted on top of each other. No complex additional measures are required, so favourable. However, namely the deck element is heavy. Force distribution The joint in the floor is in an unfavourable position, due to the high bending moment that needs to be transferred. Amount of prestress directions The structure is stable of itself, so prestressing is probably not necessary. Grid An element length (y-direction) of 1.1m can be realized. The bottom elements can have a length up to 2.2m. Flexibility of element design The element design is unfavourable for variation in dimensions. Main advantages:
• Stability during erection • Only prestressing in longitudinal direction required
Main disadvantages: • Flexibility of elements • Mountability • Force distribution
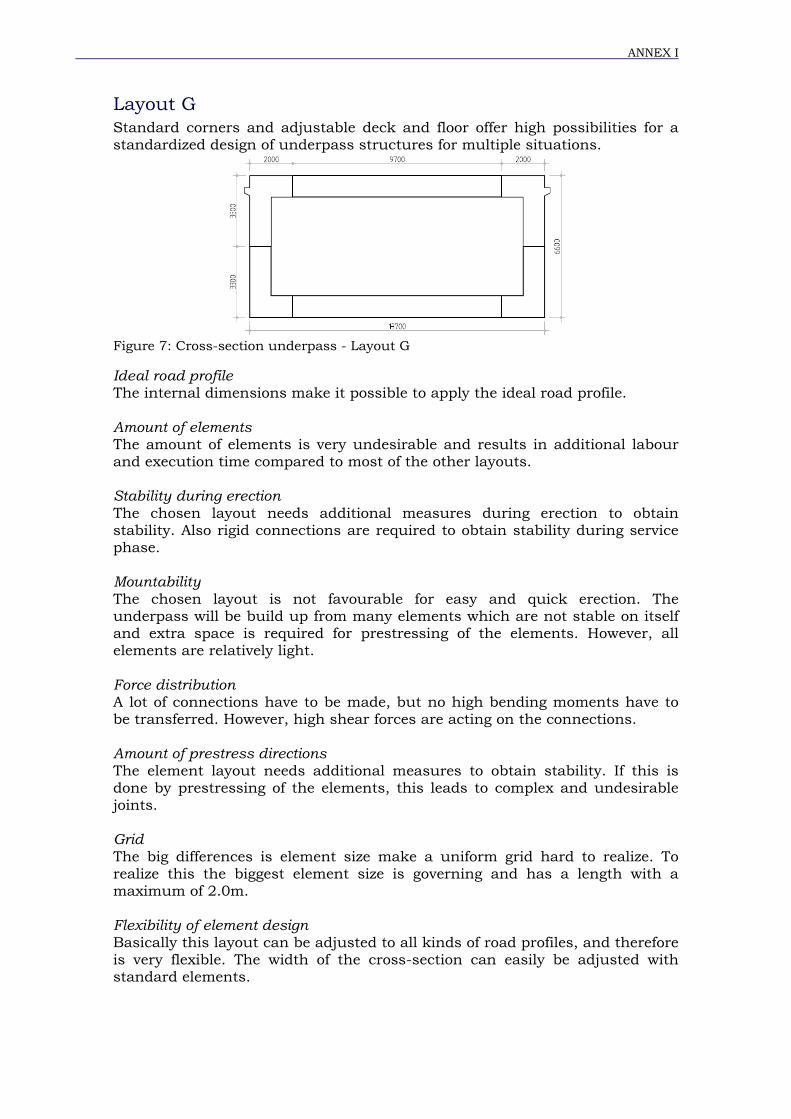
ANNEX I
Layout G Standard corners and adjustable deck and floor offer high possibilities for a standardized design of underpass structures for multiple situations.
Figure 7: Cross-section underpass - Layout G
Ideal road profile The internal dimensions make it possible to apply the ideal road profile. Amount of elements The amount of elements is very undesirable and results in additional labour and execution time compared to most of the other layouts. Stability during erection The chosen layout needs additional measures during erection to obtain stability. Also rigid connections are required to obtain stability during service phase. Mountability The chosen layout is not favourable for easy and quick erection. The underpass will be build up from many elements which are not stable on itself and extra space is required for prestressing of the elements. However, all elements are relatively light. Force distribution A lot of connections have to be made, but no high bending moments have to be transferred. However, high shear forces are acting on the connections. Amount of prestress directions The element layout needs additional measures to obtain stability. If this is done by prestressing of the elements, this leads to complex and undesirable joints. Grid The big differences is element size make a uniform grid hard to realize. To realize this the biggest element size is governing and has a length with a maximum of 2.0m. Flexibility of element design Basically this layout can be adjusted to all kinds of road profiles, and therefore is very flexible. The width of the cross-section can easily be adjusted with standard elements.
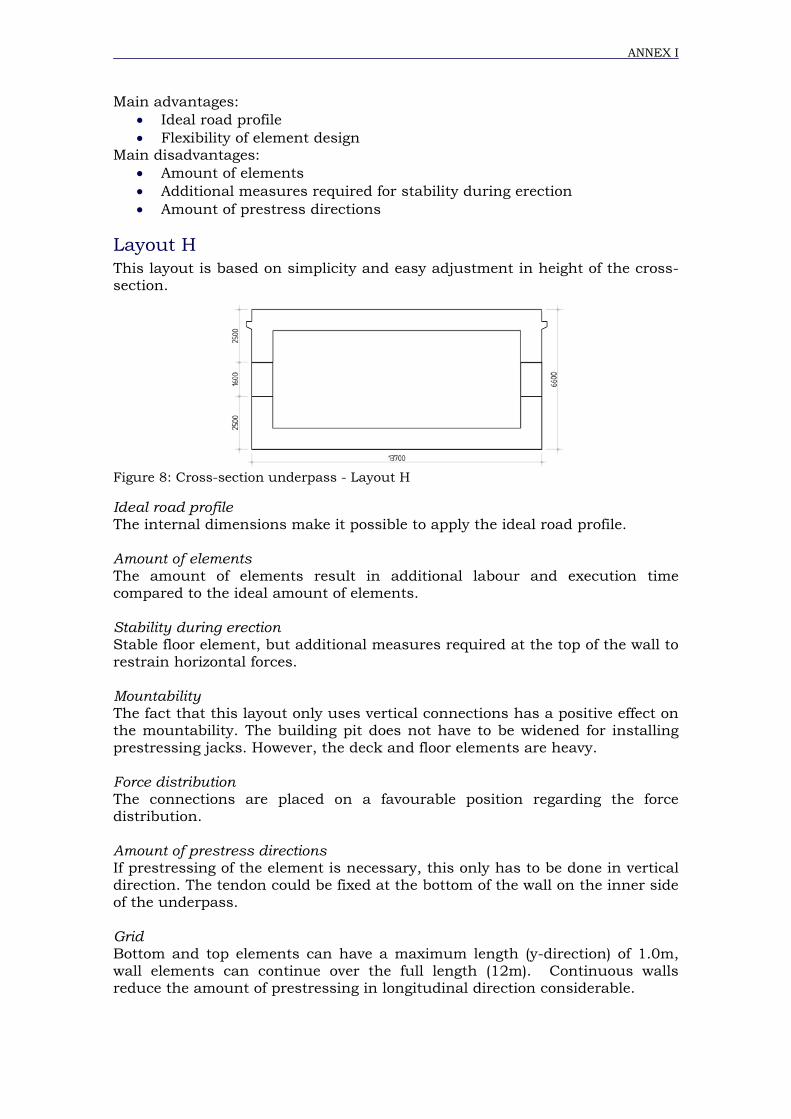
ANNEX I
Main advantages: • Ideal road profile • Flexibility of element design
Main disadvantages: • Amount of elements • Additional measures required for stability during erection • Amount of prestress directions
Layout H This layout is based on simplicity and easy adjustment in height of the cross-section.
Figure 8: Cross-section underpass - Layout H
Ideal road profile The internal dimensions make it possible to apply the ideal road profile. Amount of elements The amount of elements result in additional labour and execution time compared to the ideal amount of elements. Stability during erection Stable floor element, but additional measures required at the top of the wall to restrain horizontal forces. Mountability The fact that this layout only uses vertical connections has a positive effect on the mountability. The building pit does not have to be widened for installing prestressing jacks. However, the deck and floor elements are heavy. Force distribution The connections are placed on a favourable position regarding the force distribution. Amount of prestress directions If prestressing of the element is necessary, this only has to be done in vertical direction. The tendon could be fixed at the bottom of the wall on the inner side of the underpass. Grid Bottom and top elements can have a maximum length (y-direction) of 1.0m, wall elements can continue over the full length (12m). Continuous walls reduce the amount of prestressing in longitudinal direction considerable.
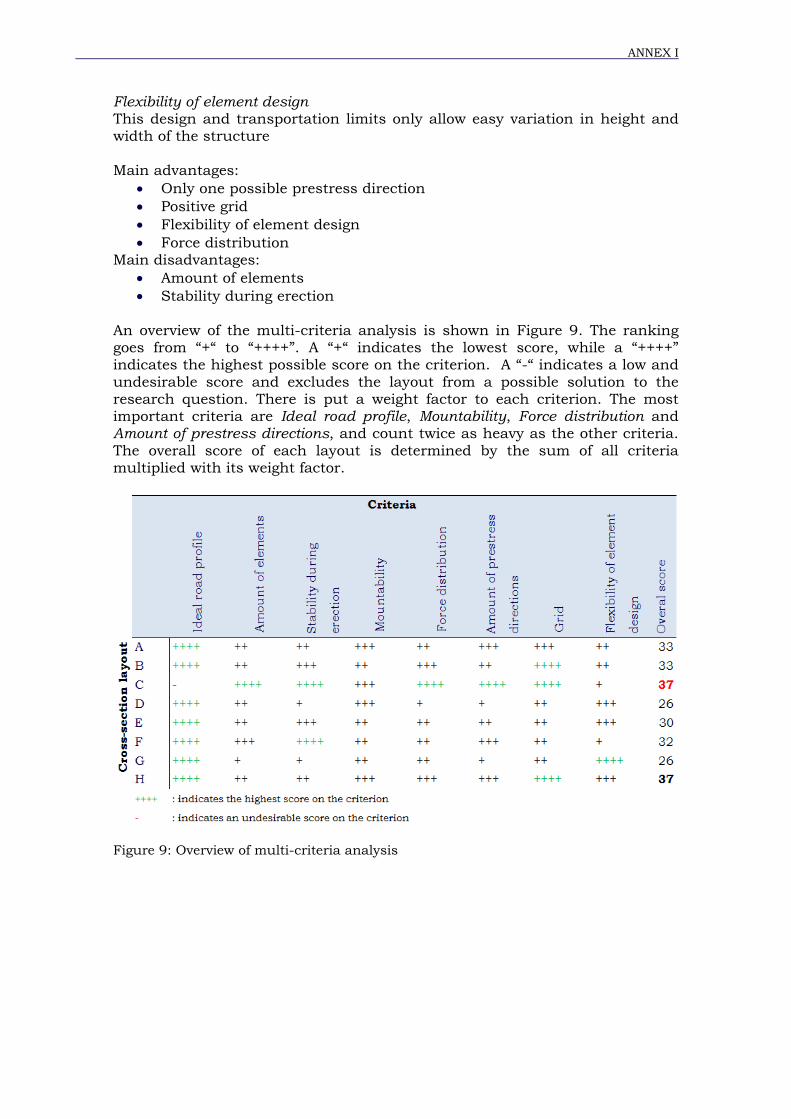
ANNEX I
Flexibility of element design This design and transportation limits only allow easy variation in height and width of the structure Main advantages:
• Only one possible prestress direction • Positive grid • Flexibility of element design • Force distribution
Main disadvantages: • Amount of elements • Stability during erection
An overview of the multi-criteria analysis is shown in Figure 9. The ranking goes from “+“ to “++++”. A “+“ indicates the lowest score, while a “++++” indicates the highest possible score on the criterion. A “-“ indicates a low and undesirable score and excludes the layout from a possible solution to the research question. There is put a weight factor to each criterion. The most important criteria are Ideal road profile, Mountability, Force distribution and Amount of prestress directions, and count twice as heavy as the other criteria. The overall score of each layout is determined by the sum of all criteria multiplied with its weight factor.
Figure 9: Overview of multi-criteria analysis

ANNEX I

II
ANNEX II:
Loads
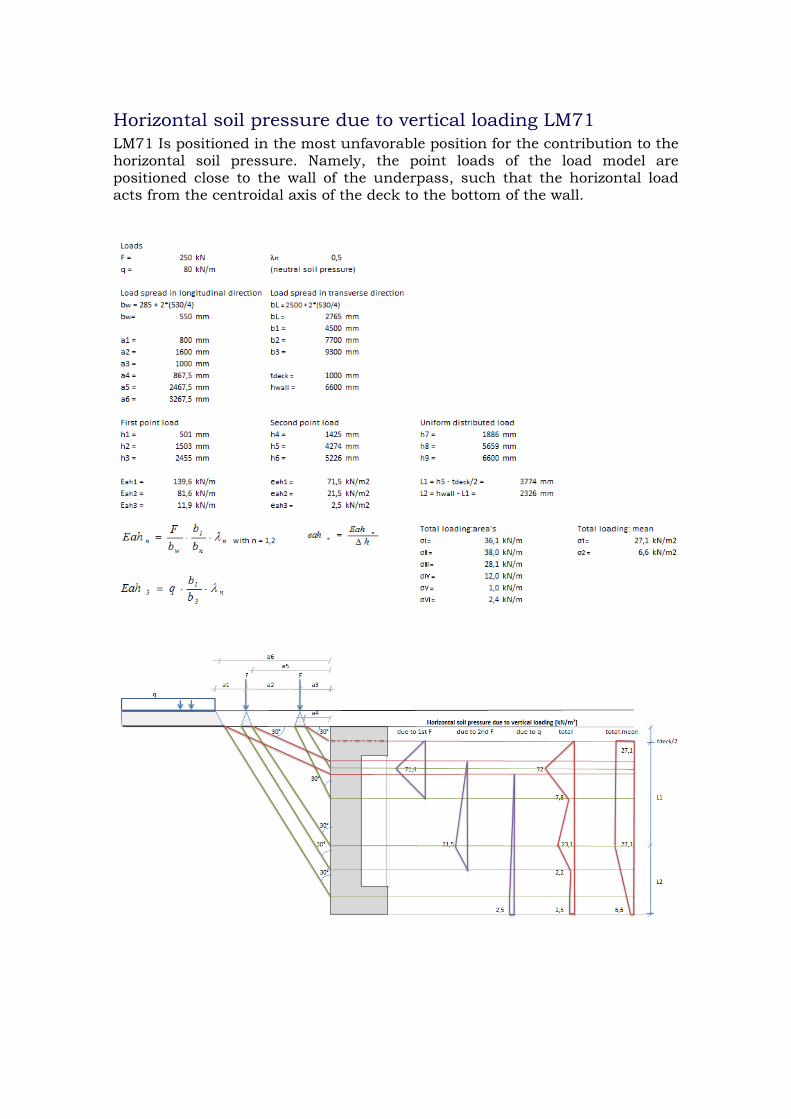
Horizontal soil pressure due to vertical loading LM71 LM71 Is positioned in the most unfavorable position for the contribution to the horizontal soil pressure. Namely, the point loads of the load model are positioned close to the wall of the underpass, such that the horizontal load acts from the centroidal axis of the deck to the bottom of the wall.
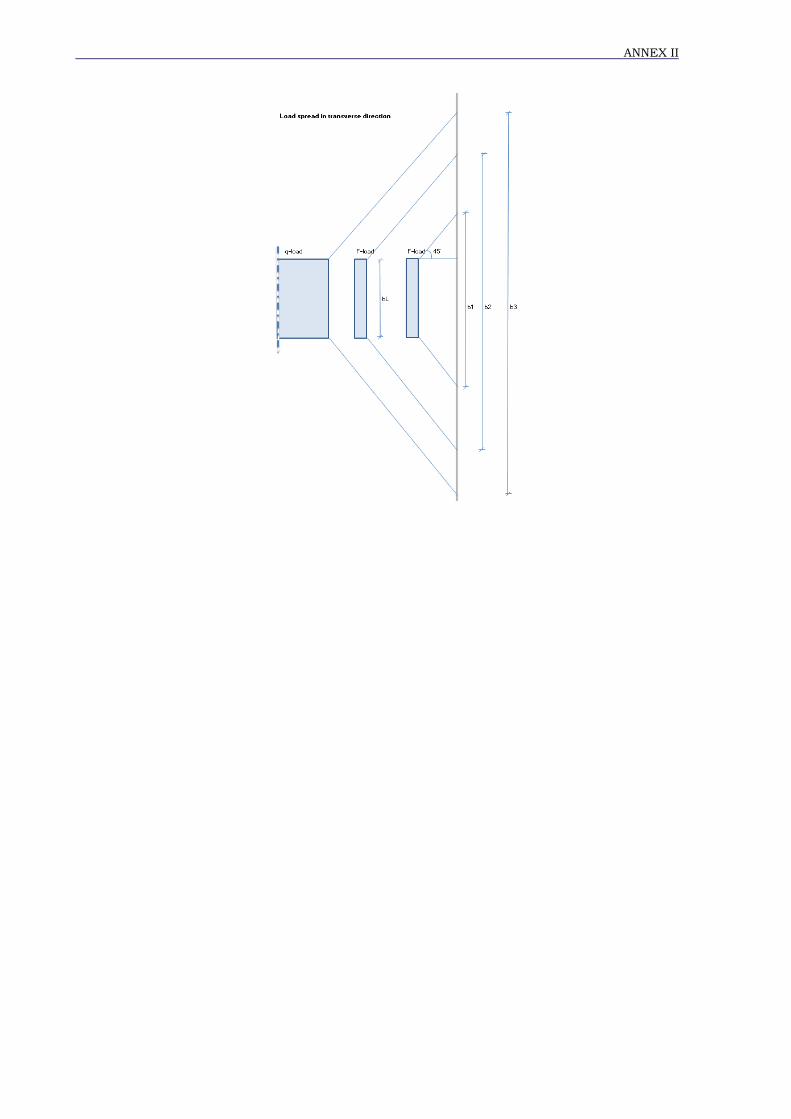
ANNEX II
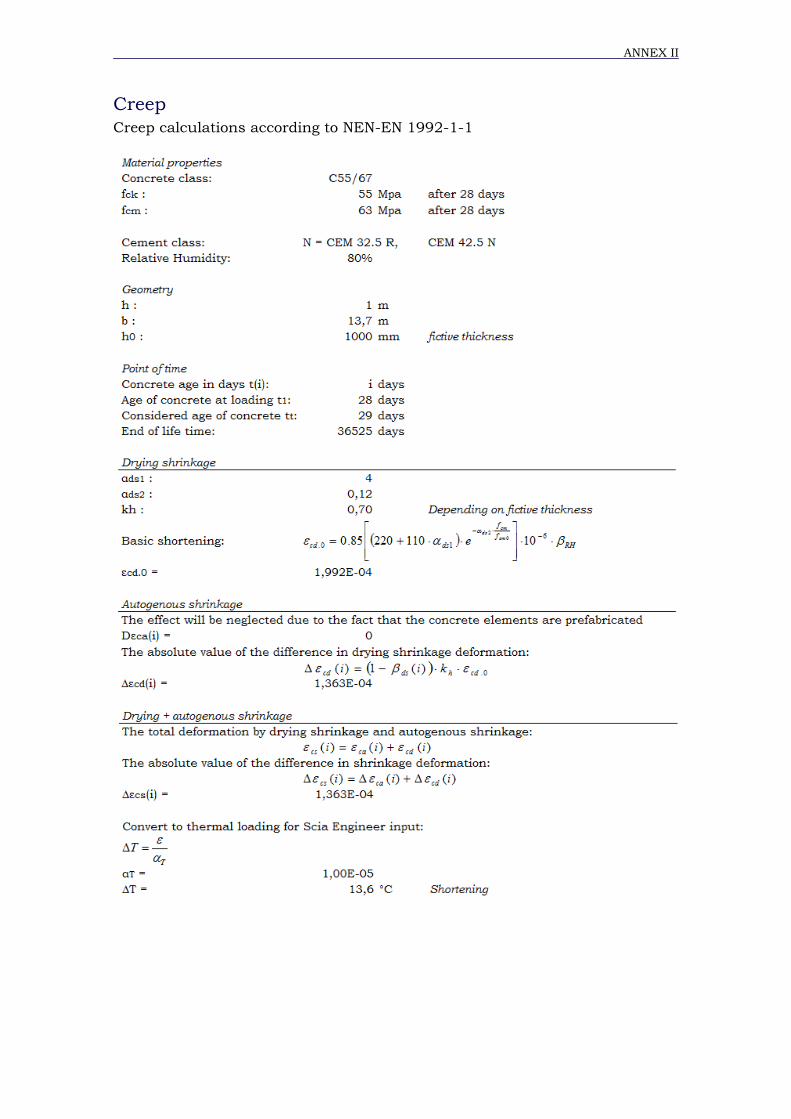
ANNEX II
Creep Creep calculations according to NEN-EN 1992-1-1
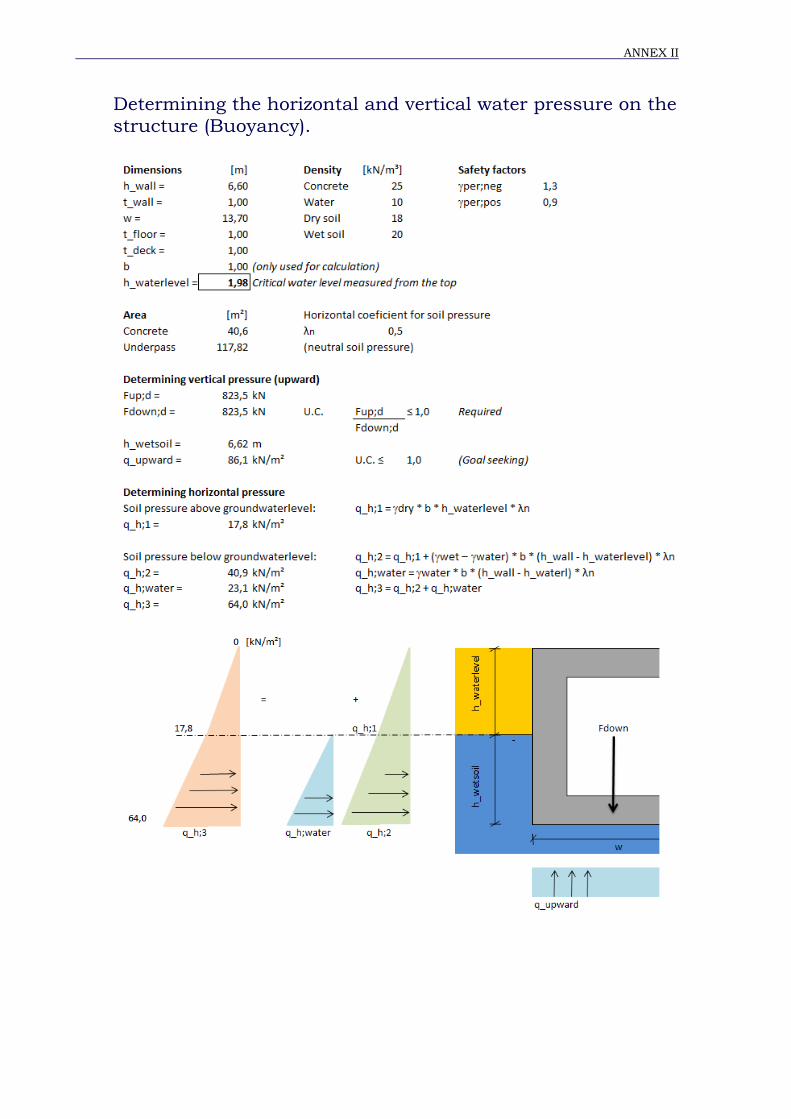
ANNEX II
Determining the horizontal and vertical water pressure on the structure (Buoyancy).

ANNEX II
III
ANNEX III:
Load cases and combinations
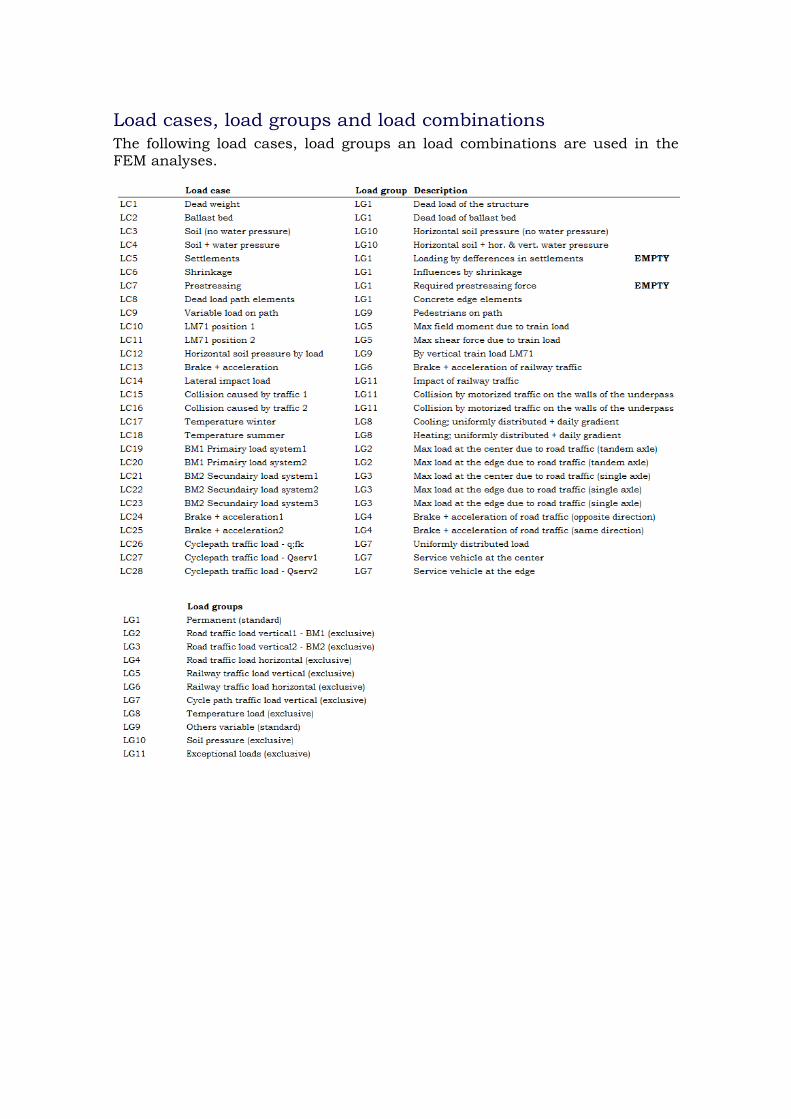
Load cases, load groups and load combinations The following load cases, load groups an load combinations are used in the FEM analyses.
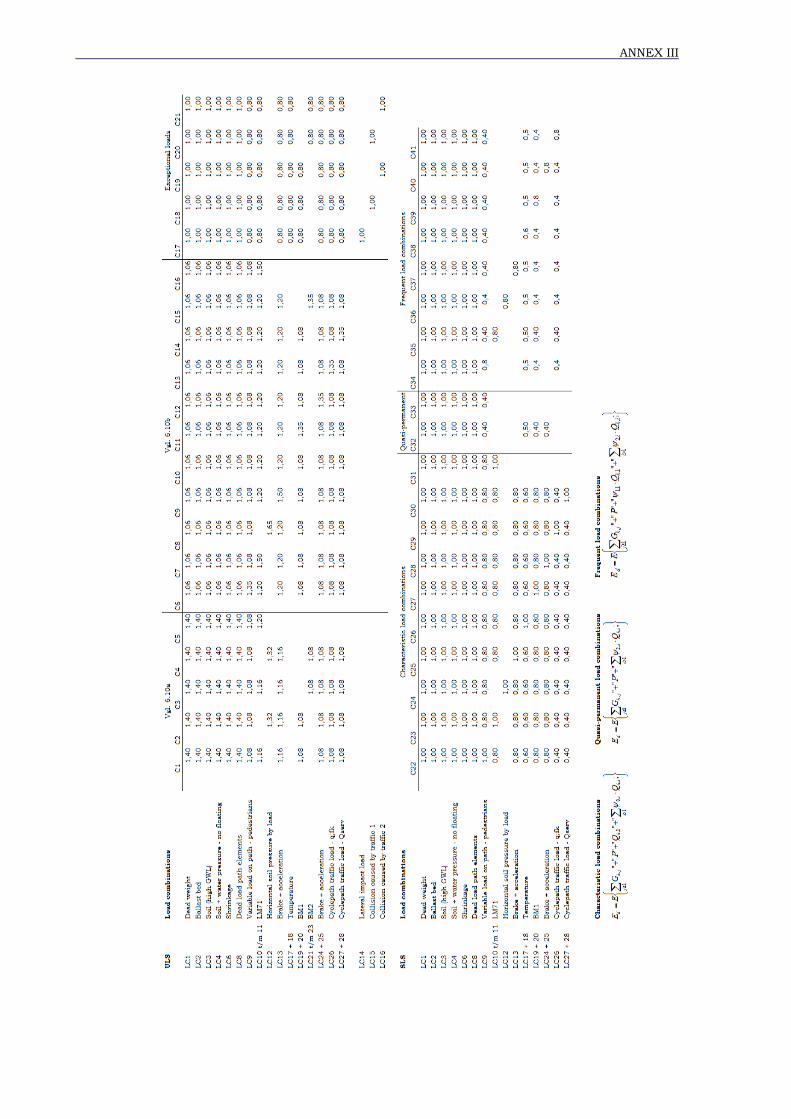
ANNEX III

IV
ANNEX IV:
Verification of the structure
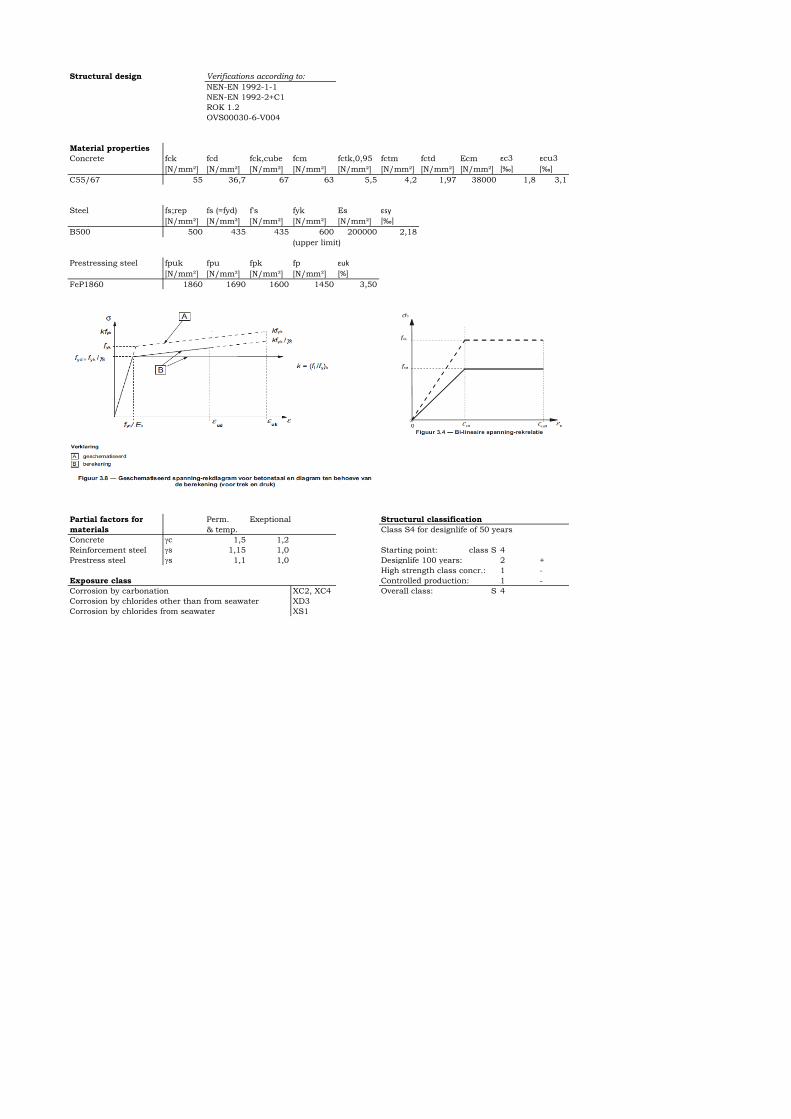
Structural design Verifications according to:
NEN-EN 1992-1-1
NEN-EN 1992-2+C1
ROK 1.2
OVS00030-6-V004
Material properties
Concrete fck fcd fck,cube fcm fctk,0,95 fctm fctd Ecm εc3 εcu3
[N/mm²] [N/mm²] [N/mm²] [N/mm²] [N/mm²] [N/mm²] [N/mm²] [N/mm²] [‰] [‰]
C55/67 55 36,7 67 63 5,5 4,2 1,97 38000 1,8 3,1
Steel fs;rep fs (=fyd) f's fyk Es εsy
[N/mm²] [N/mm²] [N/mm²] [N/mm²] [N/mm²] [‰]
B500 500 435 435 600 200000 2,18
(upper limit)
Prestressing steel fpuk fpu fpk fp εuk
[N/mm²] [N/mm²] [N/mm²] [N/mm²] [%]
FeP1860 1860 1690 1600 1450 3,50
Partial factors for Perm. Exeptional Structurul classification
materials & temp. Class S4 for designlife of 50 years
Concrete gc 1,5 1,2
Reinforcement steel gs 1,15 1,0 Starting point: class S 4
Prestress steel gs 1,1 1,0 Designlife 100 years: 2 +
High strength class concr.: 1 -
Exposure class Controlled production: 1 -
Corrosion by carbonation XC2, XC4 Overall class: S 4
Corrosion by chlorides other than from seawater XD3
Corrosion by chlorides from seawater XS1
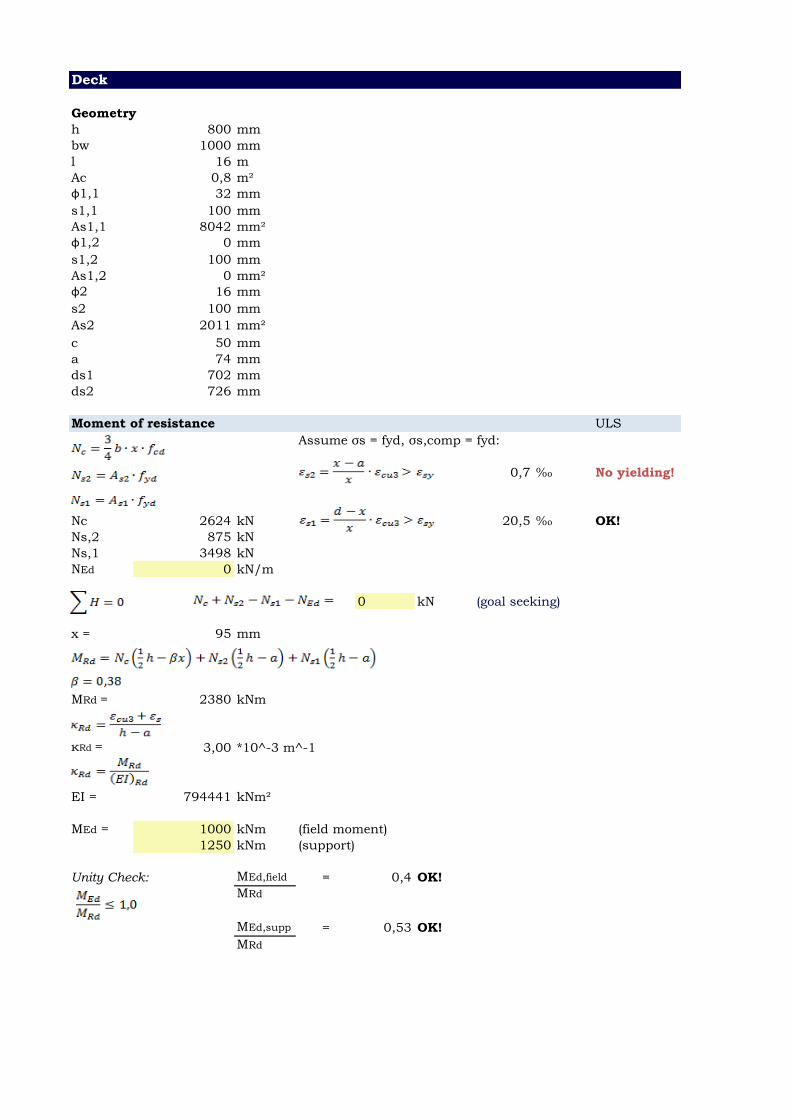
Deck
Geometry
h 800 mm
bw 1000 mm
l 16 m
Ac 0,8 m²
φ1,1 32 mm
s1,1 100 mm
As1,1 8042 mm²
φ1,2 0 mm
s1,2 100 mm
As1,2 0 mm²
φ2 16 mm
s2 100 mm
As2 2011 mm²
c 50 mm
a 74 mm
ds1 702 mm
ds2 726 mm
Moment of resistance ULS
Assume σs = fyd, σs,comp = fyd:
0,7 ‰ No yielding!
Nc 2624 kN 20,5 ‰ OK!
Ns,2 875 kN
Ns,1 3498 kN
NEd 0 kN/m
0 kN (goal seeking)
x = 95 mm
MRd = 2380 kNm
κRd = 3,00 *10^-3 m^-1
EI = 794441 kNm²
MEd = 1000 kNm (field moment)
1250 kNm (support)
Unity Check: MEd,field = 0,4 OK!
MRd
MEd,supp = 0,53 OK!
MRd

Shear resistance ULS
VEd = 550 kN
Check if shear assemblies are required
Minimum shear capacity of concrete:
with:
= 0,12
= 1,1%
= 1,52
Figure 6.3: Definition of Asl [21]
= 0,49
(The contribution of the normalforce (sigma,cp) is neglected)
VRd,c = 523 ≥ 355 kN
Unity check:
VEd = 1,05 NOT OK!
VRd,c
Shear reinforcement is required!
Design choices
Internal lever arm:
653 mm
Angle between shear assembly and longitudinal axis:
α = 90 °
Truss angle:
θ = 45 °
Figure 6.5: Truss model and notation for shear reinforced members [21]
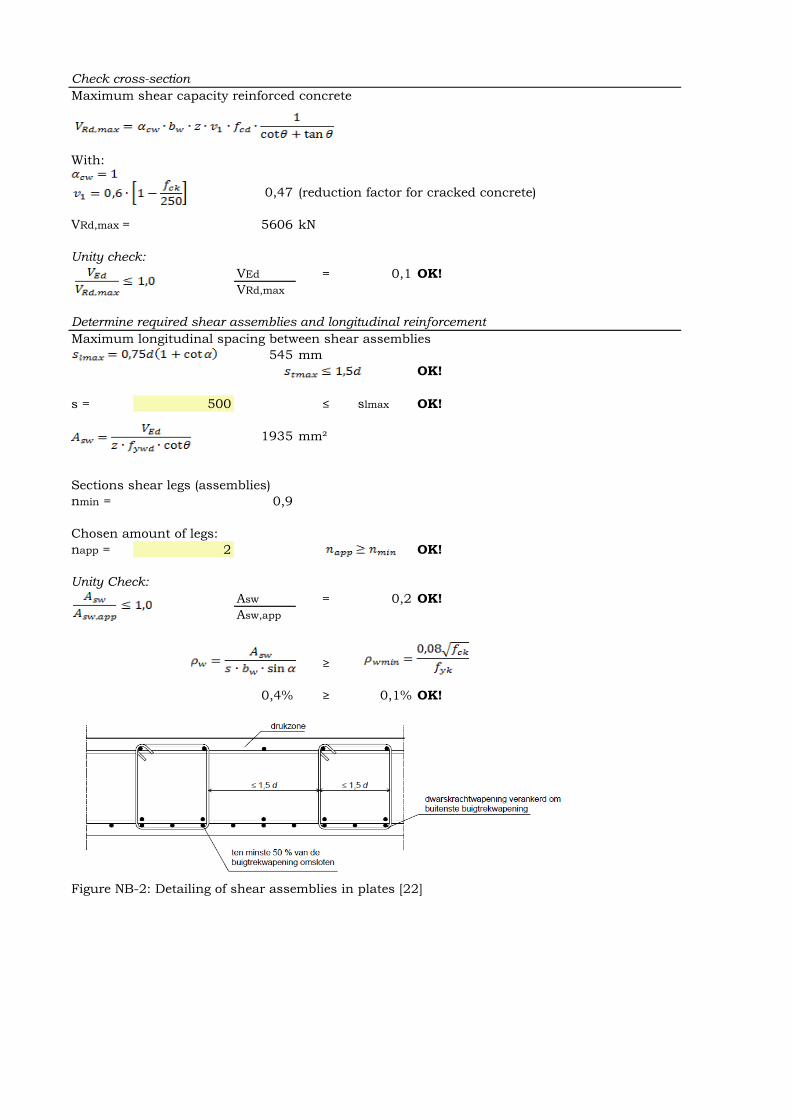
Check cross-section
Maximum shear capacity reinforced concrete
With:
0,47 (reduction factor for cracked concrete)
VRd,max = 5606 kN
Unity check:
VEd = 0,1 OK!
VRd,max
Determine required shear assemblies and longitudinal reinforcement
Maximum longitudinal spacing between shear assemblies
545 mm
OK!
s = 500 ≤ slmax OK!
1935 mm²
Sections shear legs (assemblies)
nmin = 0,9
Chosen amount of legs:
napp = 2 OK!
Unity Check:
Asw = 0,2 OK!
Asw,app
≥
0,4% ≥ 0,1% OK!
Figure NB-2: Detailing of shear assemblies in plates [22]

Deck midspan
Parameters interface between elements
h 800 mm
bi 1000 mm
Ac 8,0E+05 mm²
φ1,1 32 mm
s1,1 100 mm
ds1,1 718 mm
As1,1 8042 mm²
φ1,2 0 mm
s1,2 100 mm
ds1,2 700 mm
As1,2 0 mm²
f2 16 mm
s2 100 mm
ds2 726 mm
As2 2011 mm²
c 50 mm
a 82 mmfassembly 12 mm
Ap 0 mm ²
fp 0 mm ²
dp 0 mm
α 90 °
μ 0,7
Forces
VEd 550 kN
Nrep,1 250 kN (Characteristic load combination) (compression is positive)
Nrep,2 165 kN (Frequent load combination)
Mrep,1 750 kNm (Characteristic load combination)
Mrep,2 690 kNm (Frequent load combination)
Crack width control SLS
Centroidal axis determined from the bottom of the corss-section
z0 = 390 mm
ztop = 410 mm
Loads
Prestressing
= 0 N/mm²
= 0 kN
Mp = 0 kNm
Wc = 1,07E+08 mm³
0,0 N/mm²
0,0 N/mm²
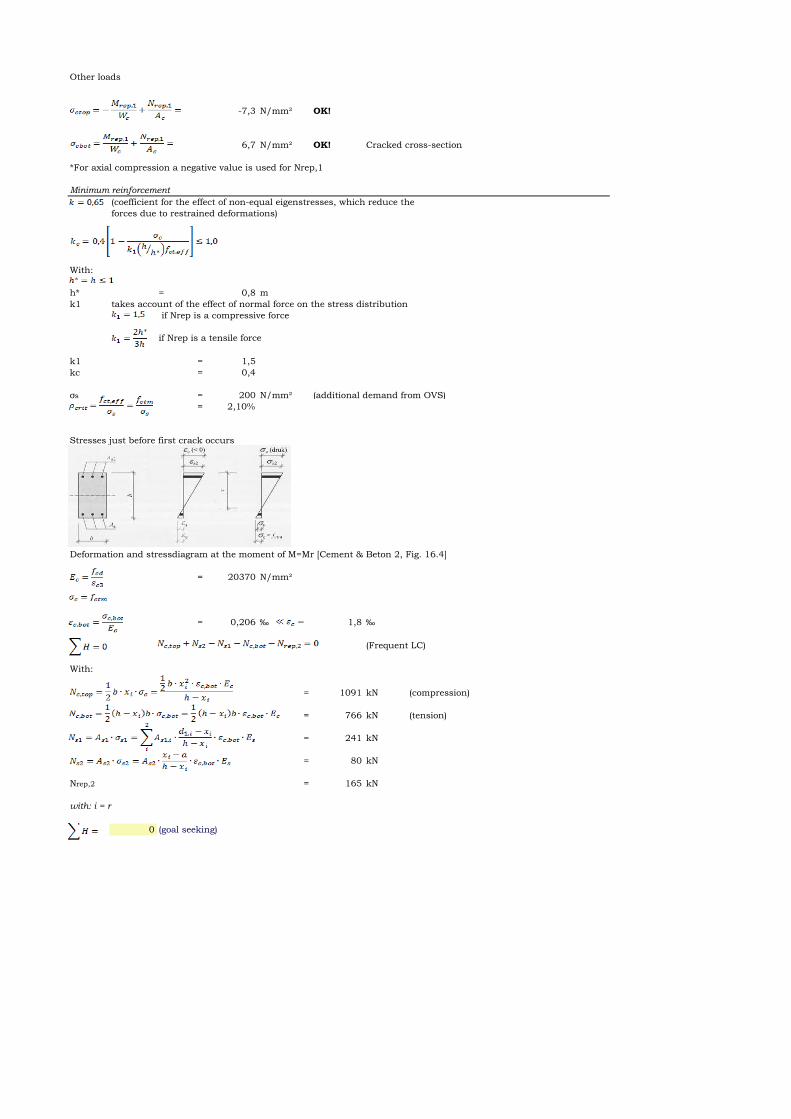
Other loads
-7,3 N/mm² OK!
6,7 N/mm² OK! Cracked cross-section
*For axial compression a negative value is used for Nrep,1
Minimum reinforcement
(coefficient for the effect of non-equal eigenstresses, which reduce the
forces due to restrained deformations)
With:
h* = 0,8 m
k1 takes account of the effect of normal force on the stress distribution
if Nrep is a compressive force
if Nrep is a tensile force
k1 = 1,5
kc = 0,4
σs = 200 N/mm² (additional demand from OVS)
= 2,10%
Stresses just before first crack occurs
Deformation and stressdiagram at the moment of M=Mr [Cement & Beton 2, Fig. 16.4]
= 20370 N/mm²
= 0,206 ‰ 1,8 ‰
(Frequent LC)
With:
= 1091 kN (compression)
= 766 kN (tension)
= 241 kN
= 80 kN
Nrep,2 = 165 kN
with: i = r
0 (goal seeking)
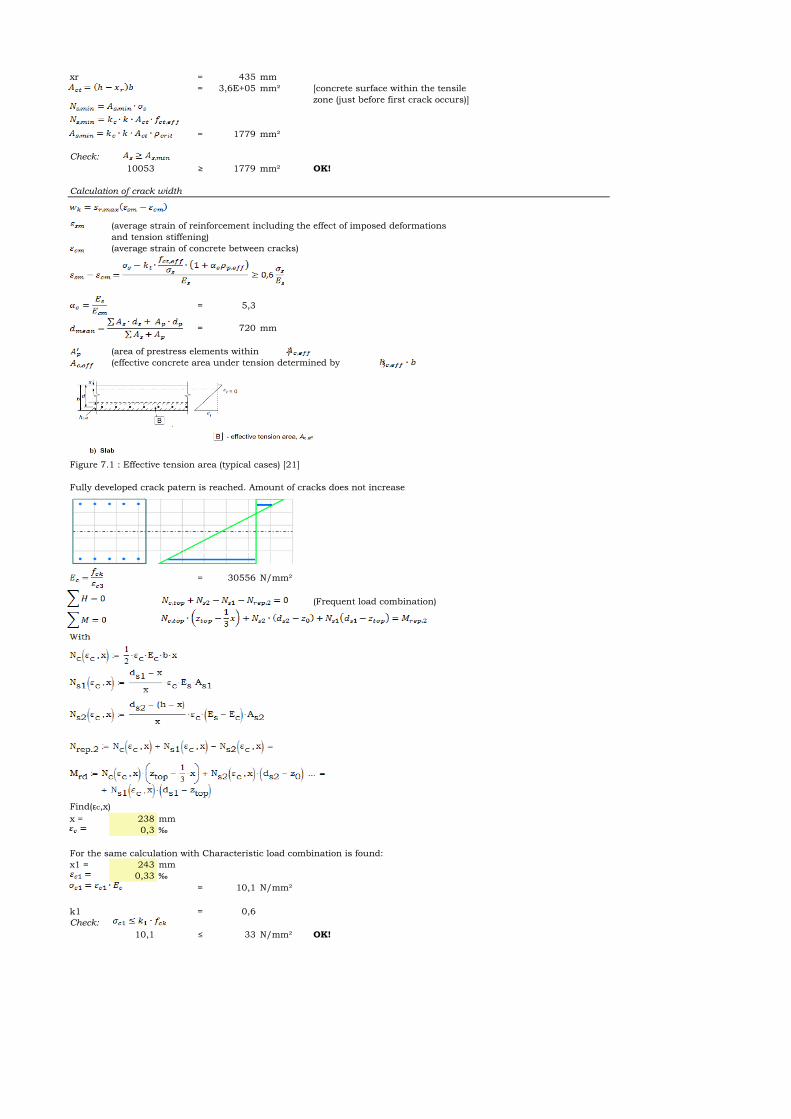
xr = 435 mm
= 3,6E+05 mm² [concrete surface within the tensile
zone (just before first crack occurs)]
= 1779 mm²
Check:
10053 ≥ 1779 mm² OK!
Calculation of crack width
(average strain of reinforcement including the effect of imposed deformations
and tension stiffening)
(average strain of concrete between cracks)
= 5,3
= 720 mm
(area of prestress elements within )
(effective concrete area under tension determined by )
Figure 7.1 : Effective tension area (typical cases) [21]
Fully developed crack patern is reached. Amount of cracks does not increase
= 30556 N/mm²
(Frequent load combination)
Find(ԑc,x)
x = 238 mm
0,3 ‰
For the same calculation with Characteristic load combination is found:
x1 = 243 mm
0,33 ‰
= 10,1 N/mm²
k1 = 0,6
Check:
10,1 ≤ 33 N/mm² OK!

= 121 N/mm²
min :
= 187,3333 mm
= 1,87E+05 mm²
= 4,29% (ony steel in tension zone is considered))
(long term loading)
Two approaches for determining the crack spacing
(1) In situations where bonded reinforcement is fixed at reasonbly close centres
within the tension zone (spacing ≤ 5(c+f/2), the max. final crack spacing may be
calculated from expression (7.11) (NEN-EN 1992-1-1):
(2) Where the spacing of the bonded reinforcement exceeds 5(c+f/2) or where no
bonded reinforcement is placed within the tension zone, an upper bound to the crack
width may be found by using expression (7.14) (NEN-EN 1992-1-1):
(7.14) (most likely not governing)
With:
k1 0,8 (used for reinforcement)
1,6 (used for prestressing steel)
k2 0,5 (for bending)
1,0 (for pure tension)
k3 3,4
k4 0,425
c (cover on longitudinal reinforcement)
Figure 7.2: Crack width, w, at concrete surface relative to distance from bar [21]
smax = 5(c+φassembly+feq/2)= 390 mm
= 26,66667 mm
= 316,3949 mm Equation (7.11) is used
= 0,363 ‰
= 0,115 mm
Cover and crack width
kx = 1,43
cnom = 35 mm (Tabel 4.2N NEN-EN 1992-1-1)
wmax = 0,2 mm (Tabel 7.1 NEN-EN 1992-1-1)
Unity check:
wk = 0,4 OK!
kx wmax
(7.11)

Deck
Geometry
h 800 mm
bw 1000 mm
l 16 m
Ac 0,8 m²
φ1,1 32 mm
s1,1 100 mm
As1,1 8042 mm²
φ1,2 0 mm
s1,2 100 mm
As1,2 0 mm²
φ2 16 mm
s2 100 mm
As2 2011 mm²
c 50 mm
a 74 mm
ds1 702 mm
ds2 726 mm
Moment of resistance ULS
Assume σs = fyd, σs,comp = fyd:
0,7 ‰ No yielding!
Nc 2624 kN 20,5 ‰ OK!
Ns,2 875 kN
Ns,1 3498 kN
NEd 0 kN/m
0 kN (goal seeking)
x = 95 mm
MRd = 2380 kNm
κRd = 3,00 *10^-3 m^-1
EI = 794441 kNm²
MEd = 1000 kNm (field moment)
1250 kNm (support)
Unity Check: MEd,field = 0,4 OK!
MRd
MEd,supp = 0,53 OK!
MRd
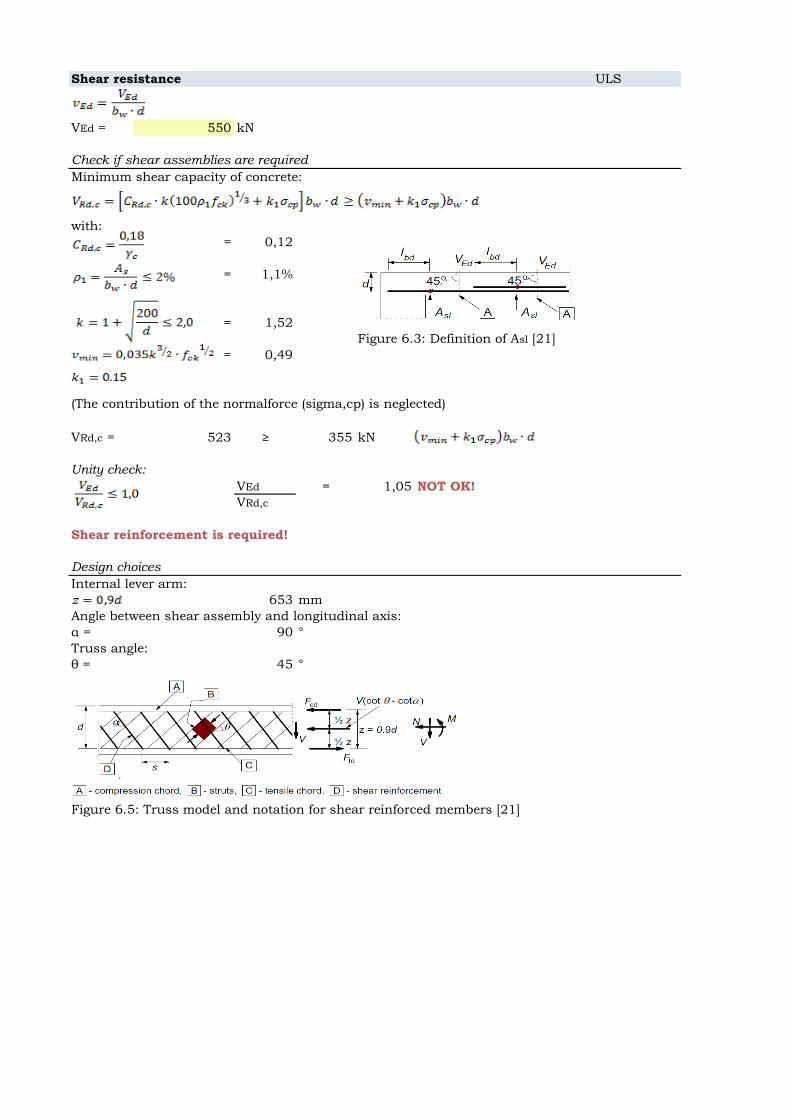
Shear resistance ULS
VEd = 550 kN
Check if shear assemblies are required
Minimum shear capacity of concrete:
with:
= 0,12
= 1,1%
= 1,52
Figure 6.3: Definition of Asl [21]
= 0,49
(The contribution of the normalforce (sigma,cp) is neglected)
VRd,c = 523 ≥ 355 kN
Unity check:
VEd = 1,05 NOT OK!
VRd,c
Shear reinforcement is required!
Design choices
Internal lever arm:
653 mm
Angle between shear assembly and longitudinal axis:
α = 90 °
Truss angle:
θ = 45 °
Figure 6.5: Truss model and notation for shear reinforced members [21]

Check cross-section
Maximum shear capacity reinforced concrete
With:
0,47 (reduction factor for cracked concrete)
VRd,max = 5606 kN
Unity check:
VEd = 0,1 OK!
VRd,max
Determine required shear assemblies and longitudinal reinforcement
Maximum longitudinal spacing between shear assemblies
545 mm
OK!
s = 500 ≤ slmax OK!
1935 mm²
Sections shear legs (assemblies)
nmin = 0,9
Chosen amount of legs:
napp = 2 OK!
Unity Check:
Asw = 0,2 OK!
Asw,app
≥
0,4% ≥ 0,1% OK!
Figure NB-2: Detailing of shear assemblies in plates [22]
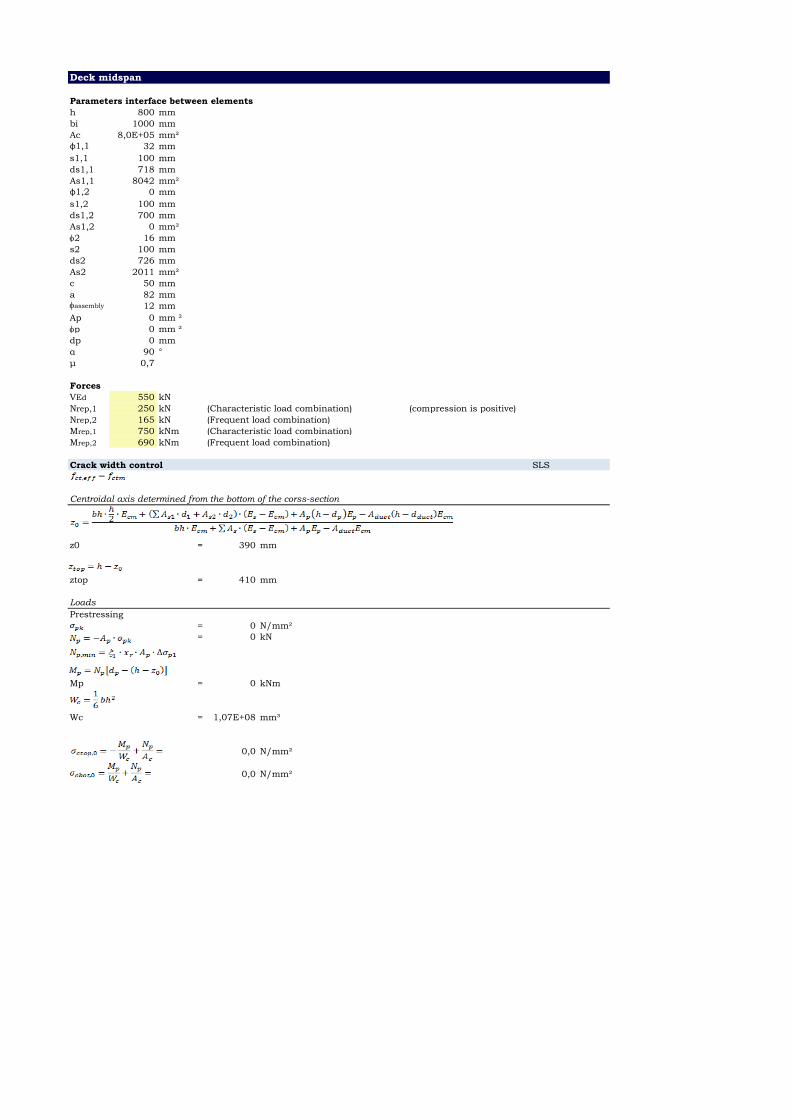
Deck midspan
Parameters interface between elements
h 800 mm
bi 1000 mm
Ac 8,0E+05 mm²
φ1,1 32 mm
s1,1 100 mm
ds1,1 718 mm
As1,1 8042 mm²
φ1,2 0 mm
s1,2 100 mm
ds1,2 700 mm
As1,2 0 mm²
f2 16 mm
s2 100 mm
ds2 726 mm
As2 2011 mm²
c 50 mm
a 82 mmfassembly 12 mm
Ap 0 mm ²
fp 0 mm ²
dp 0 mm
α 90 °
μ 0,7
Forces
VEd 550 kN
Nrep,1 250 kN (Characteristic load combination) (compression is positive)
Nrep,2 165 kN (Frequent load combination)
Mrep,1 750 kNm (Characteristic load combination)
Mrep,2 690 kNm (Frequent load combination)
Crack width control SLS
Centroidal axis determined from the bottom of the corss-section
z0 = 390 mm
ztop = 410 mm
Loads
Prestressing
= 0 N/mm²
= 0 kN
Mp = 0 kNm
Wc = 1,07E+08 mm³
0,0 N/mm²
0,0 N/mm²

Other loads
-7,3 N/mm² OK!
6,7 N/mm² OK! Cracked cross-section
*For axial compression a negative value is used for Nrep,1
Minimum reinforcement
(coefficient for the effect of non-equal eigenstresses, which reduce the
forces due to restrained deformations)
With:
h* = 0,8 m
k1 takes account of the effect of normal force on the stress distribution
if Nrep is a compressive force
if Nrep is a tensile force
k1 = 1,5
kc = 0,4
σs = 200 N/mm² (additional demand from OVS)
= 2,10%
Stresses just before first crack occurs
Deformation and stressdiagram at the moment of M=Mr [Cement & Beton 2, Fig. 16.4]
= 20370 N/mm²
= 0,206 ‰ 1,8 ‰
(Frequent LC)
With:
= 1091 kN (compression)
= 766 kN (tension)
= 241 kN
= 80 kN
Nrep,2 = 165 kN
with: i = r
0 (goal seeking)

xr = 435 mm
= 3,6E+05 mm² [concrete surface within the tensile
zone (just before first crack occurs)]
= 1779 mm²
Check:
10053 ≥ 1779 mm² OK!
Calculation of crack width
(average strain of reinforcement including the effect of imposed deformations
and tension stiffening)
(average strain of concrete between cracks)
= 5,3
= 720 mm
(area of prestress elements within )
(effective concrete area under tension determined by )
Figure 7.1 : Effective tension area (typical cases) [21]
Fully developed crack patern is reached. Amount of cracks does not increase
= 30556 N/mm²
(Frequent load combination)
Find(ԑc,x)
x = 238 mm
0,3 ‰
For the same calculation with Characteristic load combination is found:
x1 = 243 mm
0,33 ‰
= 10,1 N/mm²
k1 = 0,6
Check:
10,1 ≤ 33 N/mm² OK!
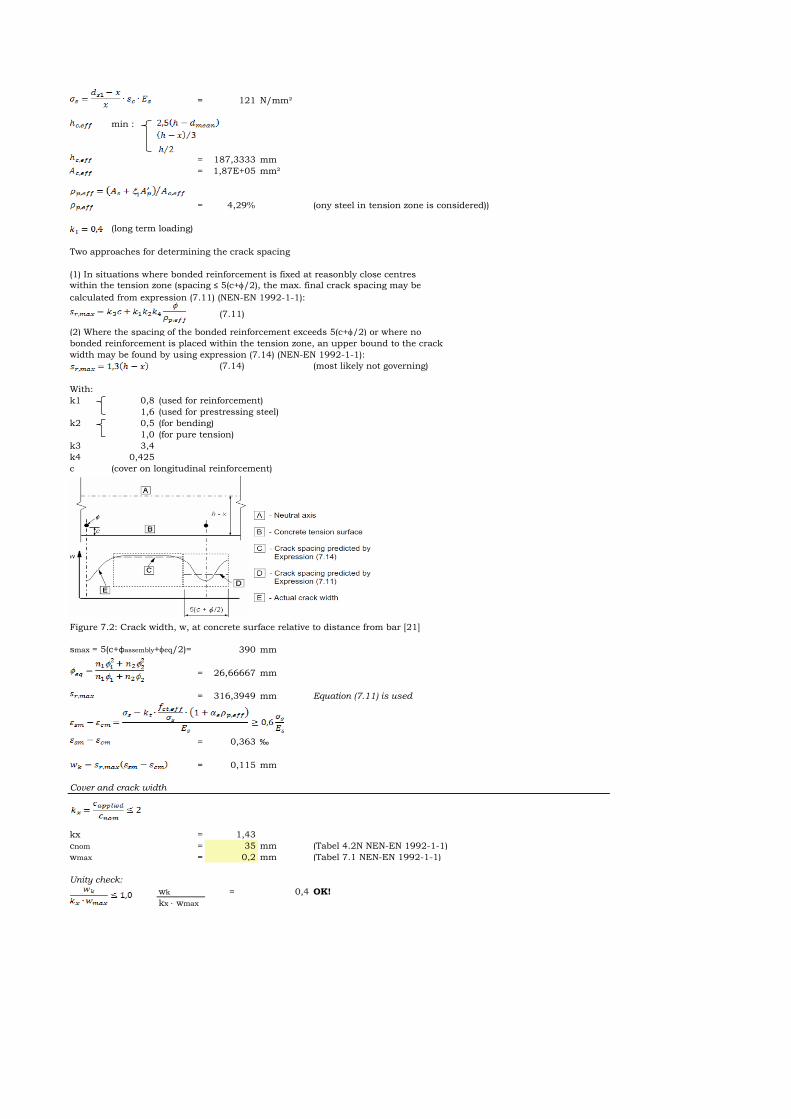
= 121 N/mm²
min :
= 187,3333 mm
= 1,87E+05 mm²
= 4,29% (ony steel in tension zone is considered))
(long term loading)
Two approaches for determining the crack spacing
(1) In situations where bonded reinforcement is fixed at reasonbly close centres
within the tension zone (spacing ≤ 5(c+f/2), the max. final crack spacing may be
calculated from expression (7.11) (NEN-EN 1992-1-1):
(2) Where the spacing of the bonded reinforcement exceeds 5(c+f/2) or where no
bonded reinforcement is placed within the tension zone, an upper bound to the crack
width may be found by using expression (7.14) (NEN-EN 1992-1-1):
(7.14) (most likely not governing)
With:
k1 0,8 (used for reinforcement)
1,6 (used for prestressing steel)
k2 0,5 (for bending)
1,0 (for pure tension)
k3 3,4
k4 0,425
c (cover on longitudinal reinforcement)
Figure 7.2: Crack width, w, at concrete surface relative to distance from bar [21]
smax = 5(c+φassembly+feq/2)= 390 mm
= 26,66667 mm
= 316,3949 mm Equation (7.11) is used
= 0,363 ‰
= 0,115 mm
Cover and crack width
kx = 1,43
cnom = 35 mm (Tabel 4.2N NEN-EN 1992-1-1)
wmax = 0,2 mm (Tabel 7.1 NEN-EN 1992-1-1)
Unity check:
wk = 0,4 OK!
kx wmax
(7.11)
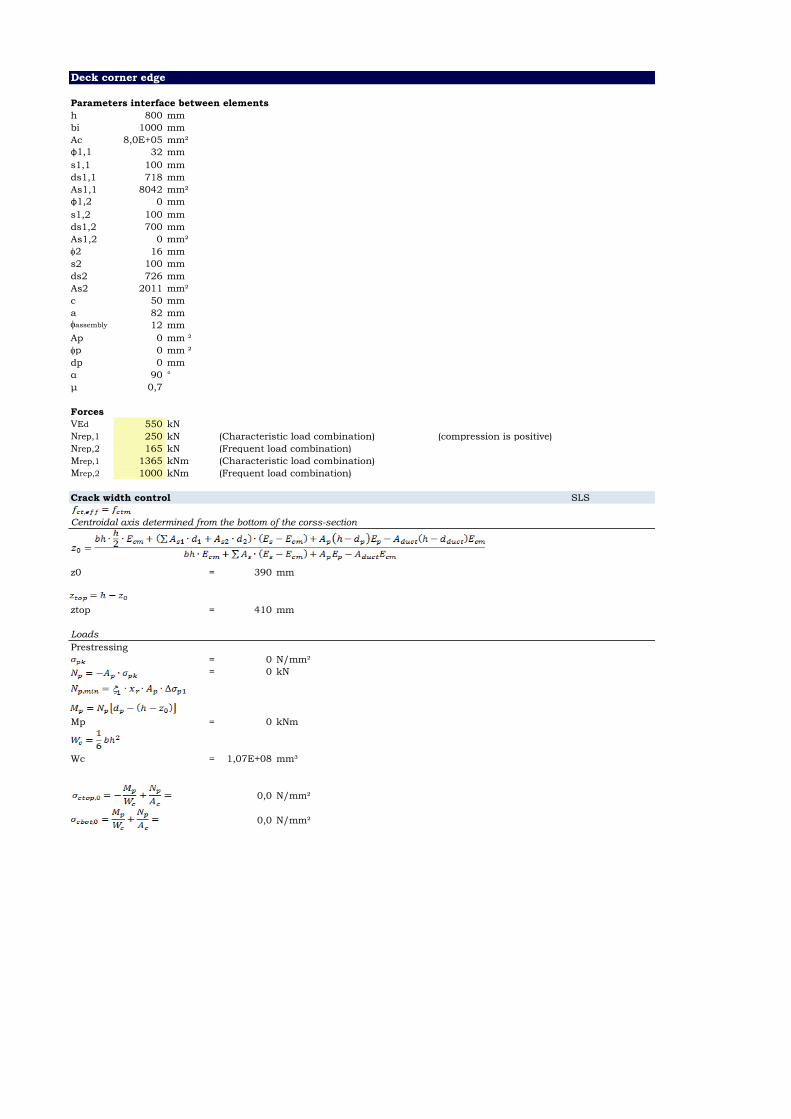
Deck corner edge
Parameters interface between elements
h 800 mm
bi 1000 mm
Ac 8,0E+05 mm²
φ1,1 32 mm
s1,1 100 mm
ds1,1 718 mm
As1,1 8042 mm²
φ1,2 0 mm
s1,2 100 mm
ds1,2 700 mm
As1,2 0 mm²
f2 16 mm
s2 100 mm
ds2 726 mm
As2 2011 mm²
c 50 mm
a 82 mmfassembly 12 mm
Ap 0 mm ²
fp 0 mm ²
dp 0 mm
α 90 °
μ 0,7
Forces
VEd 550 kN
Nrep,1 250 kN (Characteristic load combination) (compression is positive)
Nrep,2 165 kN (Frequent load combination)
Mrep,1 1365 kNm (Characteristic load combination)
Mrep,2 1000 kNm (Frequent load combination)
Crack width control SLS
Centroidal axis determined from the bottom of the corss-section
z0 = 390 mm
ztop = 410 mm
Loads
Prestressing
= 0 N/mm²
= 0 kN
Mp = 0 kNm
Wc = 1,07E+08 mm³
0,0 N/mm²
0,0 N/mm²
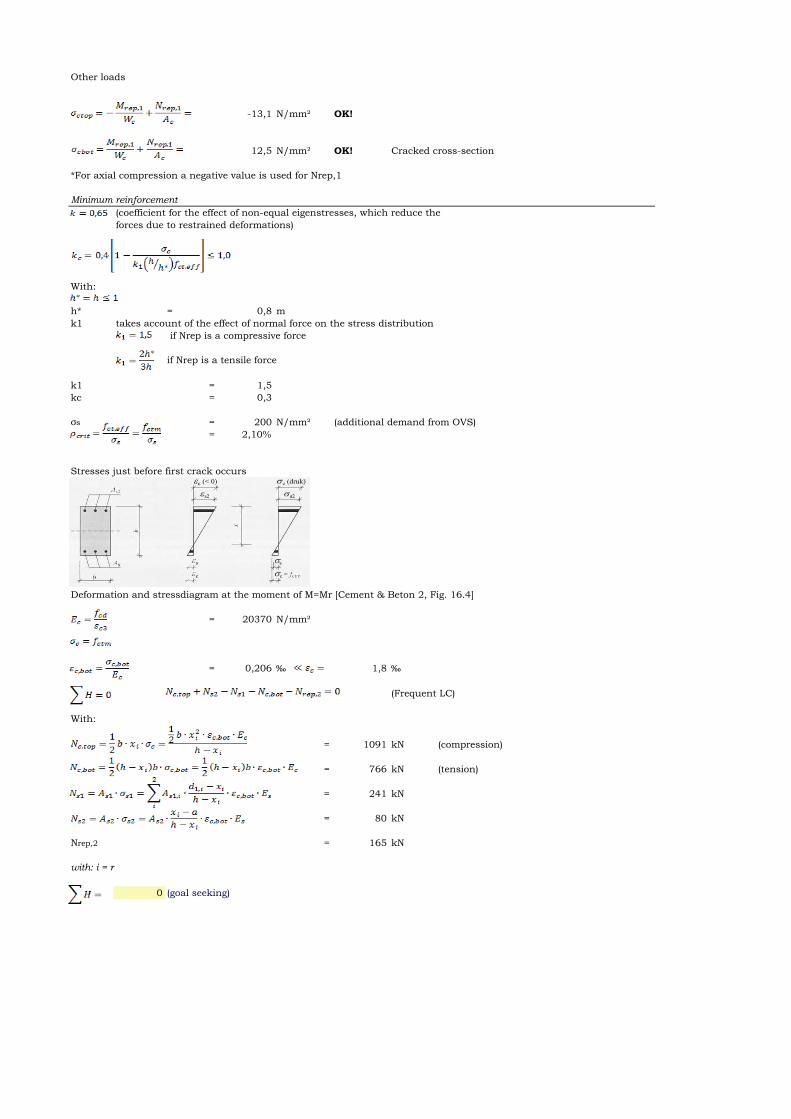
Other loads
-13,1 N/mm² OK!
12,5 N/mm² OK! Cracked cross-section
*For axial compression a negative value is used for Nrep,1
Minimum reinforcement
(coefficient for the effect of non-equal eigenstresses, which reduce the
forces due to restrained deformations)
With:
h* = 0,8 m
k1 takes account of the effect of normal force on the stress distribution
if Nrep is a compressive force
if Nrep is a tensile force
k1 = 1,5
kc = 0,3
σs = 200 N/mm² (additional demand from OVS)
= 2,10%
Stresses just before first crack occurs
Deformation and stressdiagram at the moment of M=Mr [Cement & Beton 2, Fig. 16.4]
= 20370 N/mm²
= 0,206 ‰ 1,8 ‰
(Frequent LC)
With:
= 1091 kN (compression)
= 766 kN (tension)
= 241 kN
= 80 kN
Nrep,2 = 165 kN
with: i = r
0 (goal seeking)
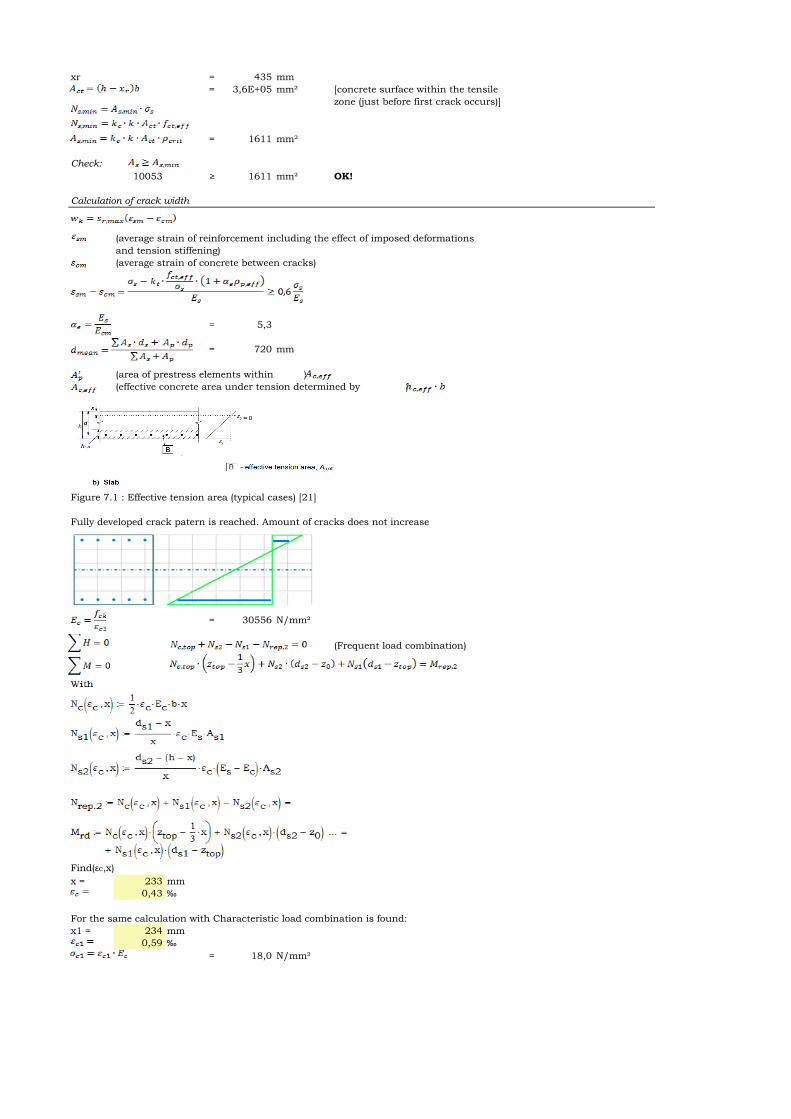
xr = 435 mm
= 3,6E+05 mm² [concrete surface within the tensile
zone (just before first crack occurs)]
= 1611 mm²
Check:
10053 ≥ 1611 mm² OK!
Calculation of crack width
(average strain of reinforcement including the effect of imposed deformations
and tension stiffening)
(average strain of concrete between cracks)
= 5,3
= 720 mm
(area of prestress elements within )
(effective concrete area under tension determined by )
Figure 7.1 : Effective tension area (typical cases) [21]
Fully developed crack patern is reached. Amount of cracks does not increase
= 30556 N/mm²
(Frequent load combination)
Find(ԑc,x)
x = 233 mm
0,43 ‰
For the same calculation with Characteristic load combination is found:
x1 = 234 mm
0,59 ‰
= 18,0 N/mm²
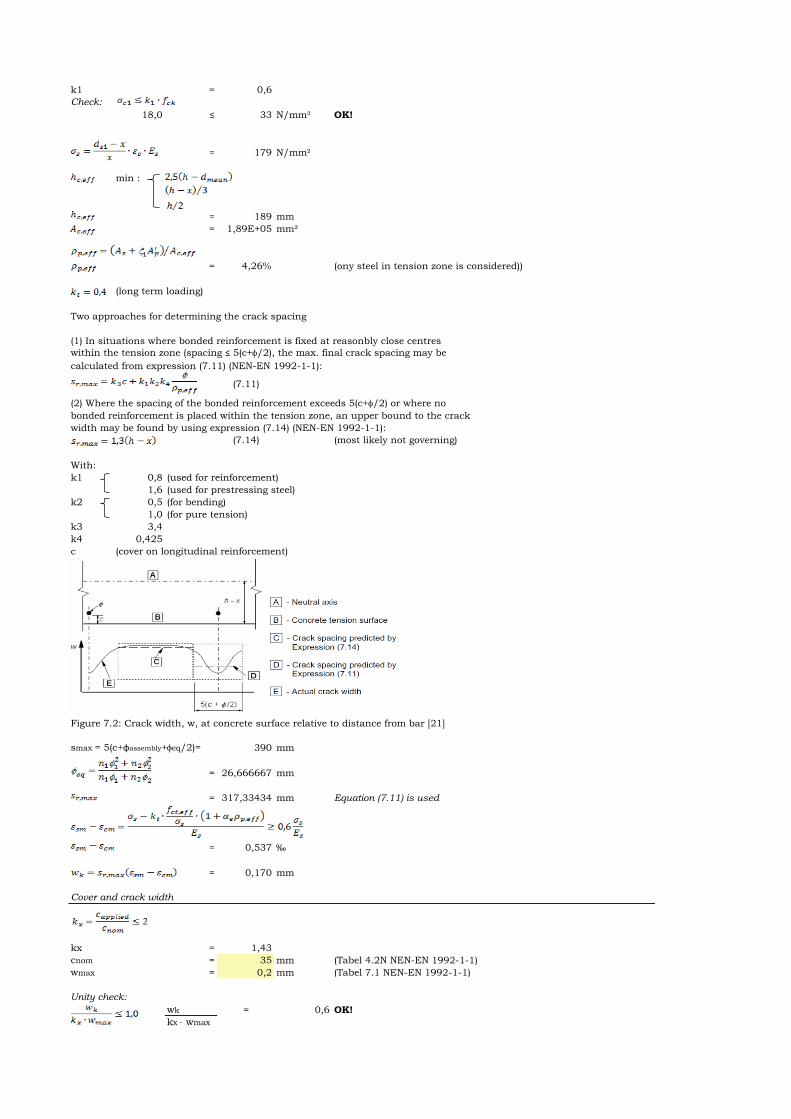
k1 = 0,6
Check:
18,0 ≤ 33 N/mm² OK!
= 179 N/mm²
min :
= 189 mm
= 1,89E+05 mm²
= 4,26% (ony steel in tension zone is considered))
(long term loading)
Two approaches for determining the crack spacing
(1) In situations where bonded reinforcement is fixed at reasonbly close centres
within the tension zone (spacing ≤ 5(c+f/2), the max. final crack spacing may be
calculated from expression (7.11) (NEN-EN 1992-1-1):
(2) Where the spacing of the bonded reinforcement exceeds 5(c+f/2) or where no
bonded reinforcement is placed within the tension zone, an upper bound to the crack
width may be found by using expression (7.14) (NEN-EN 1992-1-1):
(7.14) (most likely not governing)
With:
k1 0,8 (used for reinforcement)
1,6 (used for prestressing steel)
k2 0,5 (for bending)
1,0 (for pure tension)
k3 3,4
k4 0,425
c (cover on longitudinal reinforcement)
Figure 7.2: Crack width, w, at concrete surface relative to distance from bar [21]
smax = 5(c+φassembly+feq/2)= 390 mm
= 26,666667 mm
= 317,33434 mm Equation (7.11) is used
= 0,537 ‰
= 0,170 mm
Cover and crack width
kx = 1,43
cnom = 35 mm (Tabel 4.2N NEN-EN 1992-1-1)
wmax = 0,2 mm (Tabel 7.1 NEN-EN 1992-1-1)
Unity check:
wk = 0,6 OK!
kx wmax
(7.11)
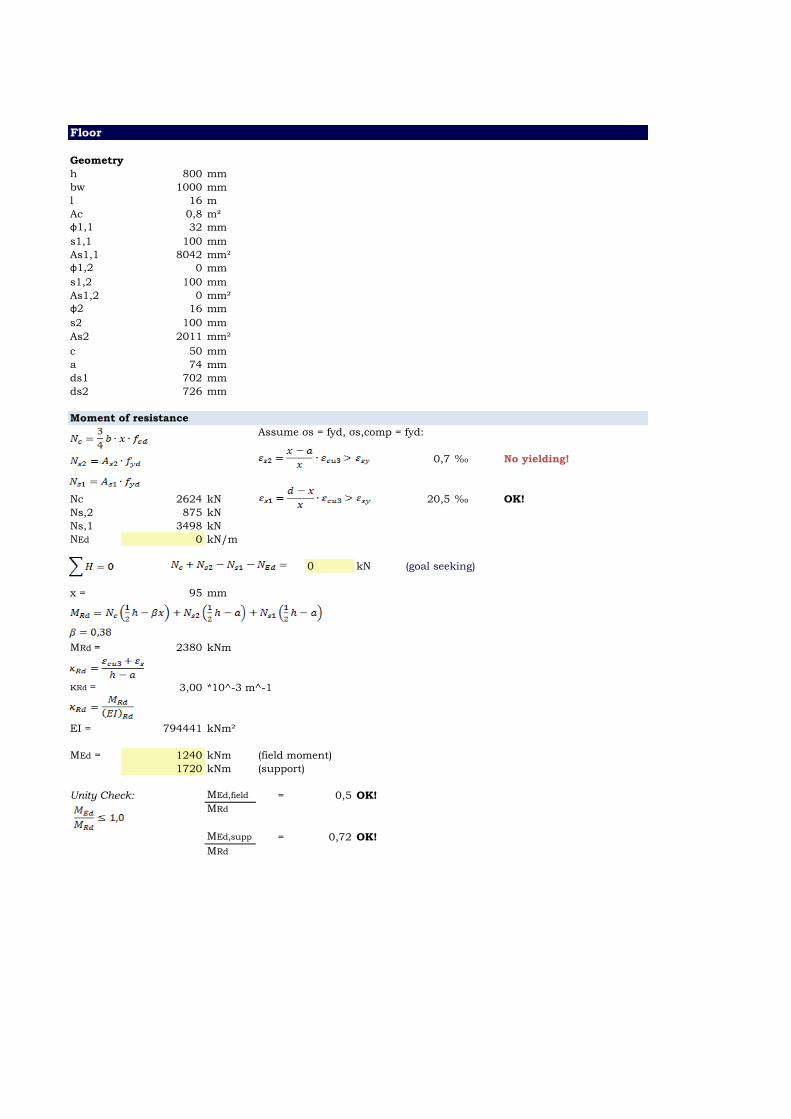
Floor
Geometry
h 800 mm
bw 1000 mm
l 16 m
Ac 0,8 m²
φ1,1 32 mm
s1,1 100 mm
As1,1 8042 mm²
φ1,2 0 mm
s1,2 100 mm
As1,2 0 mm²
φ2 16 mm
s2 100 mm
As2 2011 mm²
c 50 mm
a 74 mm
ds1 702 mm
ds2 726 mm
Moment of resistance
Assume σs = fyd, σs,comp = fyd:
0,7 ‰ No yielding!
Nc 2624 kN 20,5 ‰ OK!
Ns,2 875 kN
Ns,1 3498 kN
NEd 0 kN/m
0 kN (goal seeking)
x = 95 mm
MRd = 2380 kNm
κRd = 3,00 *10^-3 m^-1
EI = 794441 kNm²
MEd = 1240 kNm (field moment)
1720 kNm (support)
Unity Check: MEd,field = 0,5 OK!
MRd
MEd,supp = 0,72 OK!
MRd
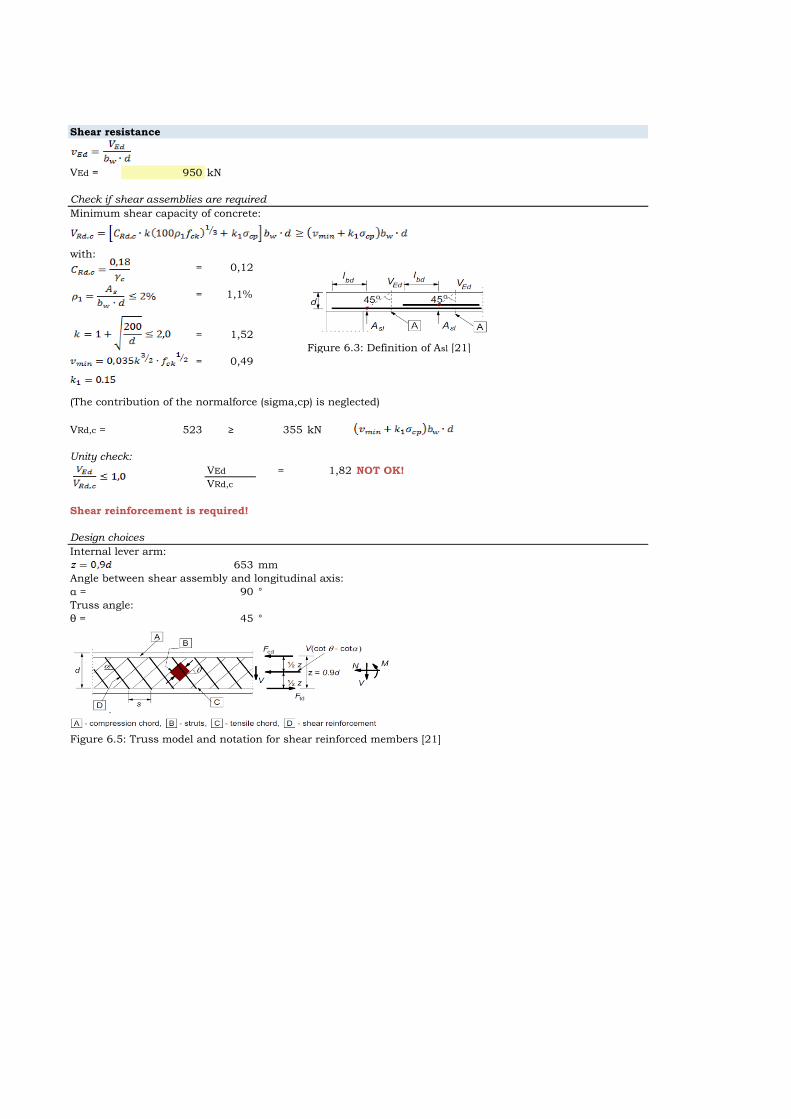
Shear resistance
VEd = 950 kN
Check if shear assemblies are required
Minimum shear capacity of concrete:
with:
= 0,12
= 1,1%
= 1,52
Figure 6.3: Definition of Asl [21]
= 0,49
(The contribution of the normalforce (sigma,cp) is neglected)
VRd,c = 523 ≥ 355 kN
Unity check:
VEd = 1,82 NOT OK!
VRd,c
Shear reinforcement is required!
Design choices
Internal lever arm:
653 mm
Angle between shear assembly and longitudinal axis:
α = 90 °
Truss angle:
θ = 45 °
Figure 6.5: Truss model and notation for shear reinforced members [21]
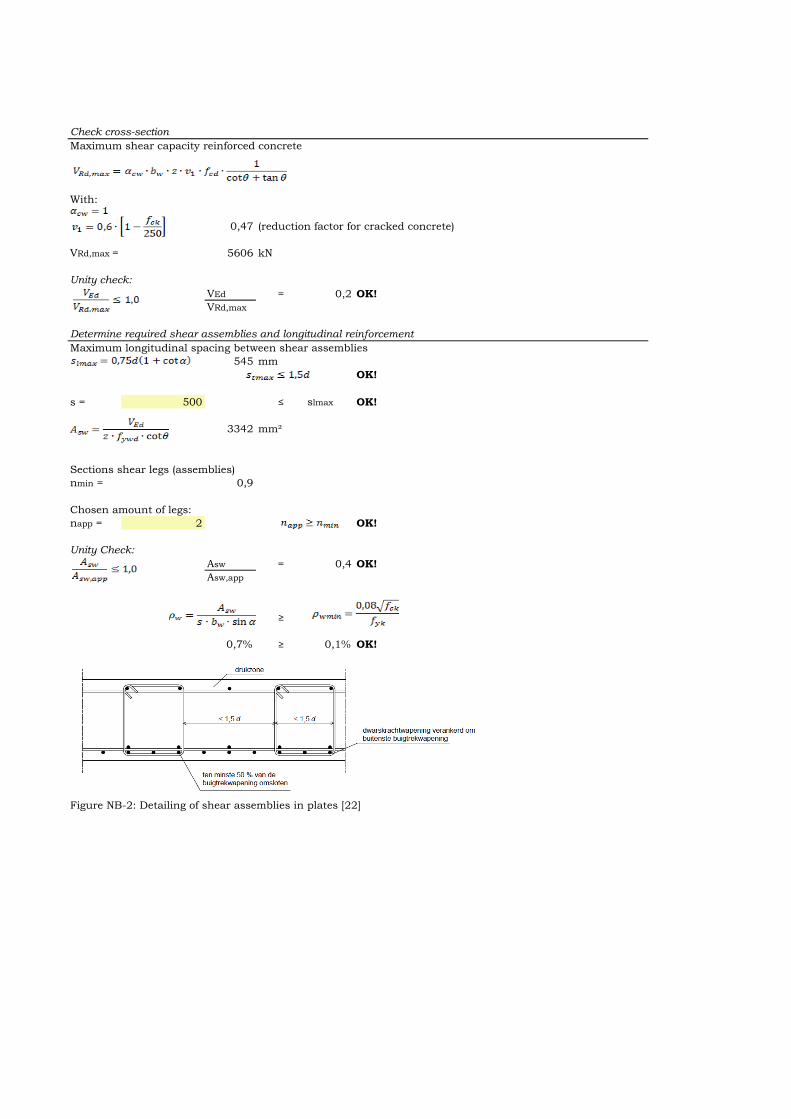
Check cross-section
Maximum shear capacity reinforced concrete
With:
0,47 (reduction factor for cracked concrete)
VRd,max = 5606 kN
Unity check:
VEd = 0,2 OK!
VRd,max
Determine required shear assemblies and longitudinal reinforcement
Maximum longitudinal spacing between shear assemblies
545 mm
OK!
s = 500 ≤ slmax OK!
3342 mm²
Sections shear legs (assemblies)
nmin = 0,9
Chosen amount of legs:
napp = 2 OK!
Unity Check:
Asw = 0,4 OK!
Asw,app
≥
0,7% ≥ 0,1% OK!
Figure NB-2: Detailing of shear assemblies in plates [22]
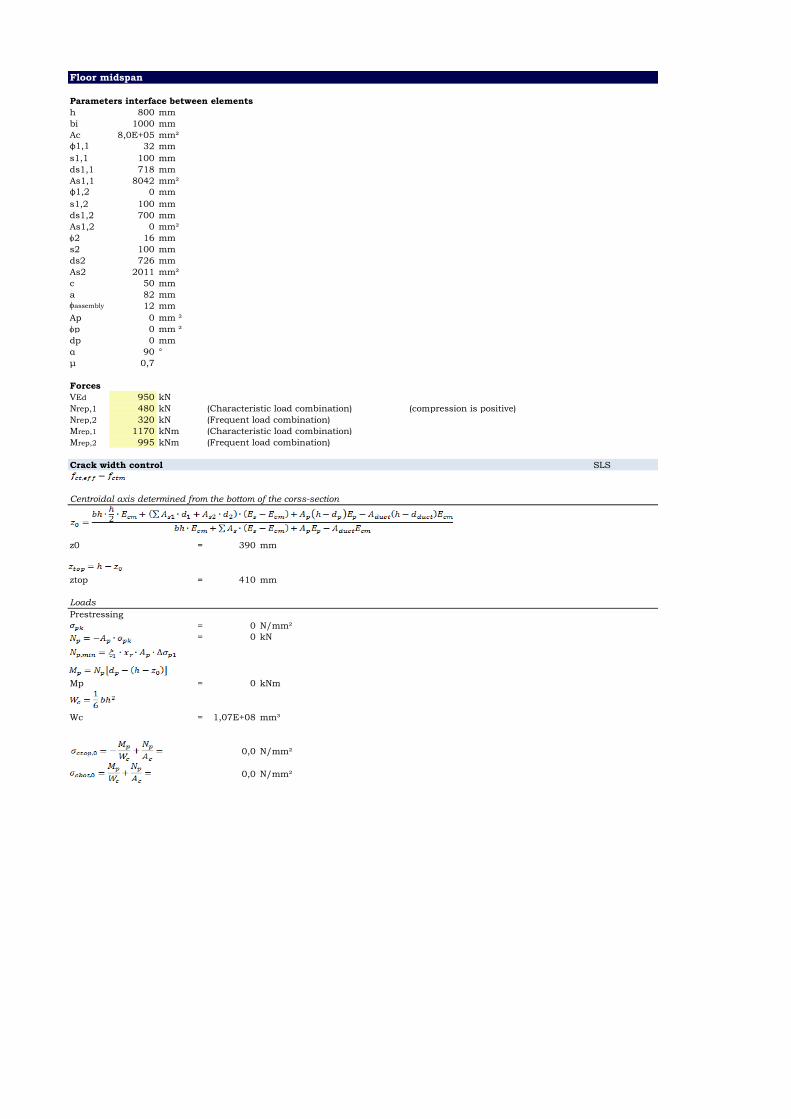
Floor midspan
Parameters interface between elements
h 800 mm
bi 1000 mm
Ac 8,0E+05 mm²
φ1,1 32 mm
s1,1 100 mm
ds1,1 718 mm
As1,1 8042 mm²
φ1,2 0 mm
s1,2 100 mm
ds1,2 700 mm
As1,2 0 mm²
f2 16 mm
s2 100 mm
ds2 726 mm
As2 2011 mm²
c 50 mm
a 82 mmfassembly 12 mm
Ap 0 mm ²
fp 0 mm ²
dp 0 mm
α 90 °
μ 0,7
Forces
VEd 950 kN
Nrep,1 480 kN (Characteristic load combination) (compression is positive)
Nrep,2 320 kN (Frequent load combination)
Mrep,1 1170 kNm (Characteristic load combination)
Mrep,2 995 kNm (Frequent load combination)
Crack width control SLS
Centroidal axis determined from the bottom of the corss-section
z0 = 390 mm
ztop = 410 mm
Loads
Prestressing
= 0 N/mm²
= 0 kN
Mp = 0 kNm
Wc = 1,07E+08 mm³
0,0 N/mm²
0,0 N/mm²
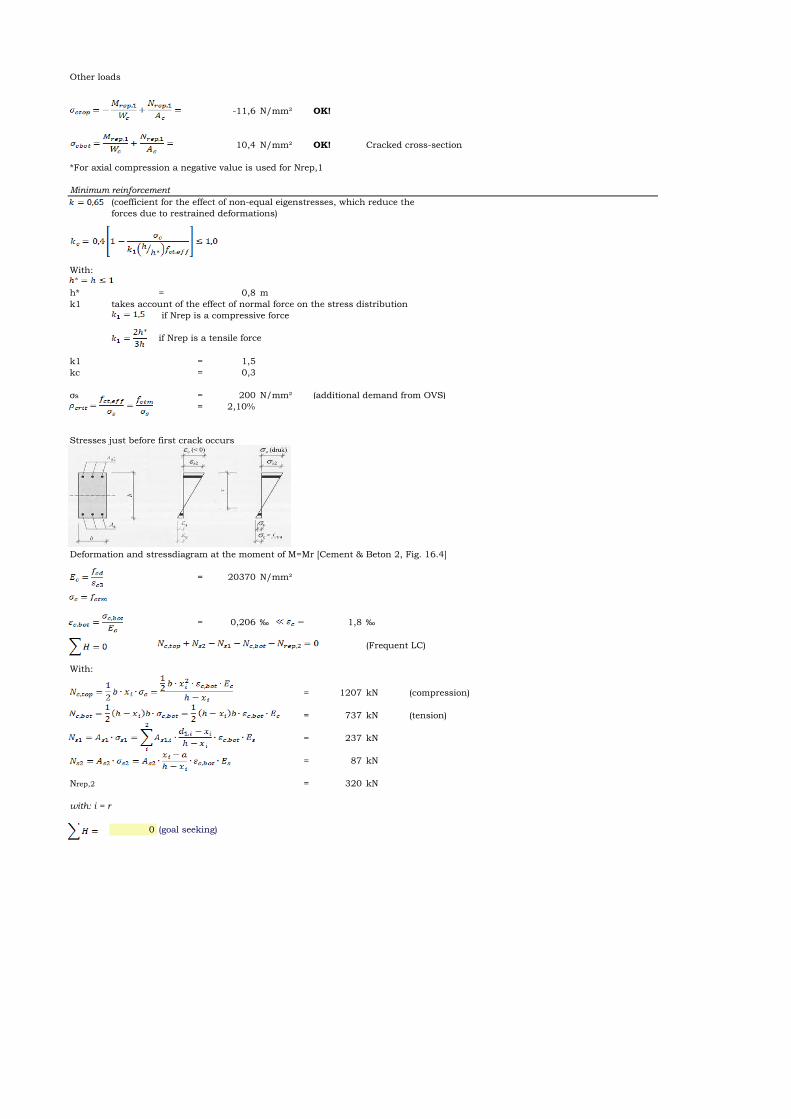
Other loads
-11,6 N/mm² OK!
10,4 N/mm² OK! Cracked cross-section
*For axial compression a negative value is used for Nrep,1
Minimum reinforcement
(coefficient for the effect of non-equal eigenstresses, which reduce the
forces due to restrained deformations)
With:
h* = 0,8 m
k1 takes account of the effect of normal force on the stress distribution
if Nrep is a compressive force
if Nrep is a tensile force
k1 = 1,5
kc = 0,3
σs = 200 N/mm² (additional demand from OVS)
= 2,10%
Stresses just before first crack occurs
Deformation and stressdiagram at the moment of M=Mr [Cement & Beton 2, Fig. 16.4]
= 20370 N/mm²
= 0,206 ‰ 1,8 ‰
(Frequent LC)
With:
= 1207 kN (compression)
= 737 kN (tension)
= 237 kN
= 87 kN
Nrep,2 = 320 kN
with: i = r
0 (goal seeking)
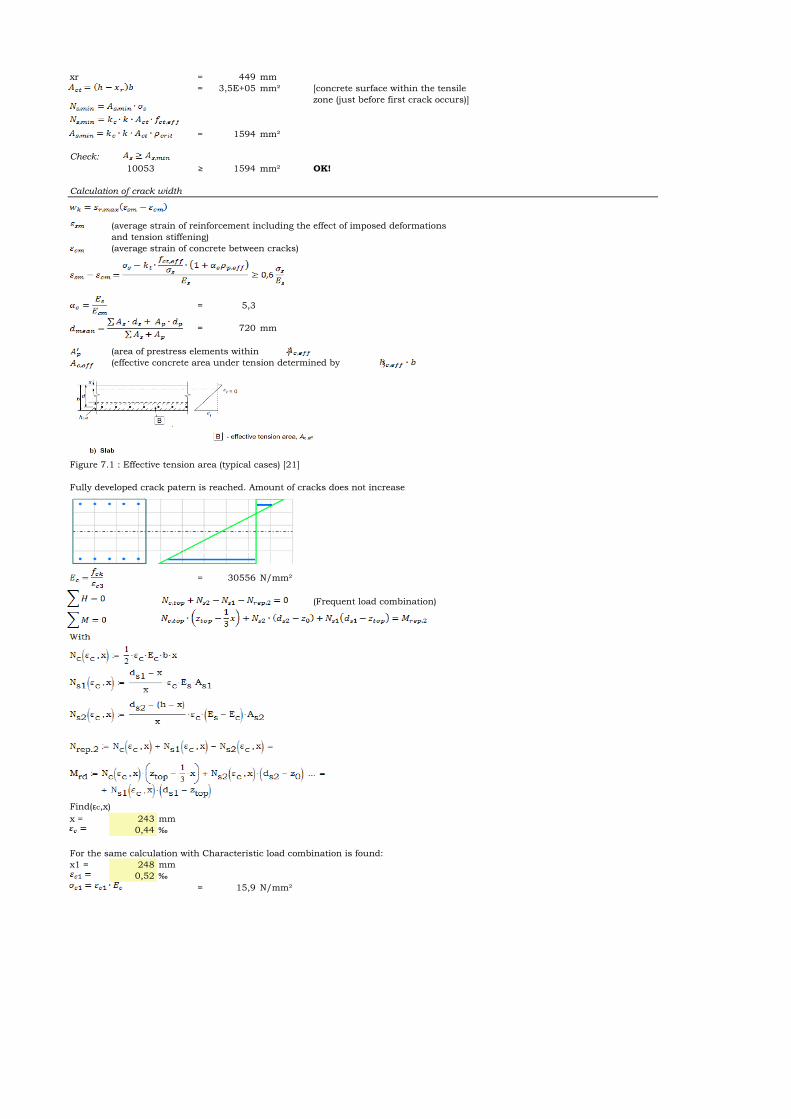
xr = 449 mm
= 3,5E+05 mm² [concrete surface within the tensile
zone (just before first crack occurs)]
= 1594 mm²
Check:
10053 ≥ 1594 mm² OK!
Calculation of crack width
(average strain of reinforcement including the effect of imposed deformations
and tension stiffening)
(average strain of concrete between cracks)
= 5,3
= 720 mm
(area of prestress elements within )
(effective concrete area under tension determined by )
Figure 7.1 : Effective tension area (typical cases) [21]
Fully developed crack patern is reached. Amount of cracks does not increase
= 30556 N/mm²
(Frequent load combination)
Find(ԑc,x)
x = 243 mm
0,44 ‰
For the same calculation with Characteristic load combination is found:
x1 = 248 mm
0,52 ‰
= 15,9 N/mm²
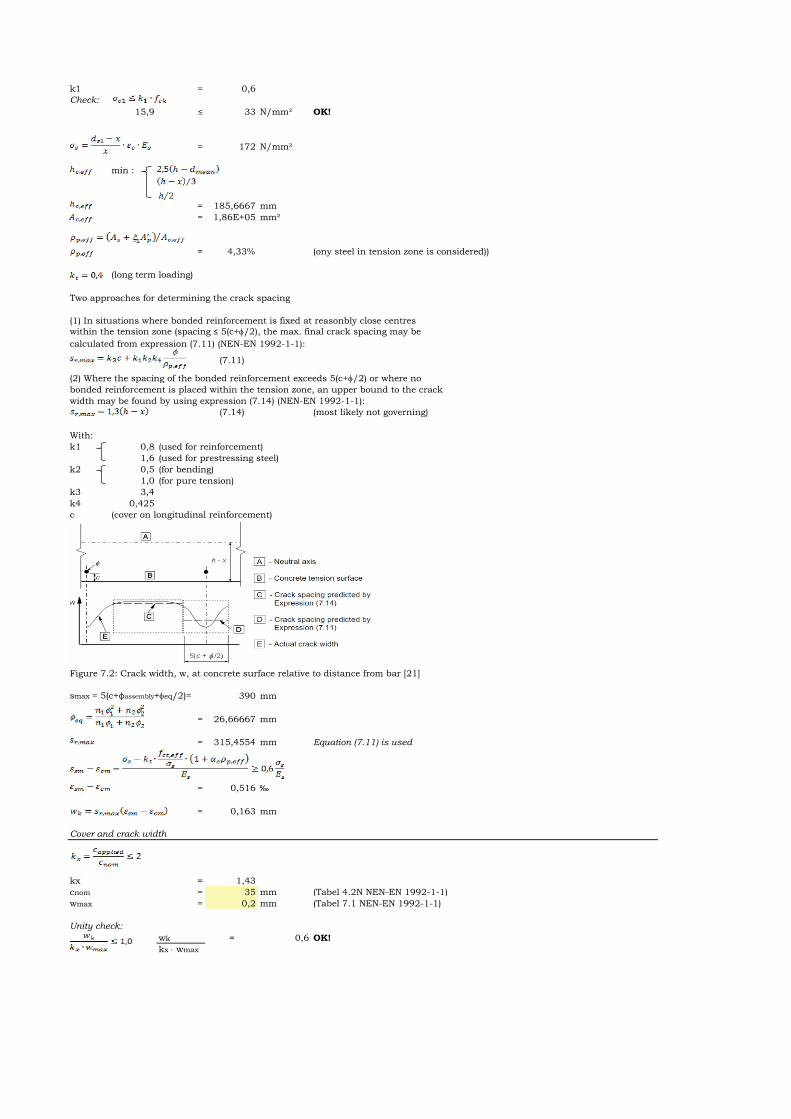
k1 = 0,6
Check:
15,9 ≤ 33 N/mm² OK!
= 172 N/mm²
min :
= 185,6667 mm
= 1,86E+05 mm²
= 4,33% (ony steel in tension zone is considered))
(long term loading)
Two approaches for determining the crack spacing
(1) In situations where bonded reinforcement is fixed at reasonbly close centres
within the tension zone (spacing ≤ 5(c+f/2), the max. final crack spacing may be
calculated from expression (7.11) (NEN-EN 1992-1-1):
(2) Where the spacing of the bonded reinforcement exceeds 5(c+f/2) or where no
bonded reinforcement is placed within the tension zone, an upper bound to the crack
width may be found by using expression (7.14) (NEN-EN 1992-1-1):
(7.14) (most likely not governing)
With:
k1 0,8 (used for reinforcement)
1,6 (used for prestressing steel)
k2 0,5 (for bending)
1,0 (for pure tension)
k3 3,4
k4 0,425
c (cover on longitudinal reinforcement)
Figure 7.2: Crack width, w, at concrete surface relative to distance from bar [21]
smax = 5(c+φassembly+feq/2)= 390 mm
= 26,66667 mm
= 315,4554 mm Equation (7.11) is used
= 0,516 ‰
= 0,163 mm
Cover and crack width
kx = 1,43
cnom = 35 mm (Tabel 4.2N NEN-EN 1992-1-1)
wmax = 0,2 mm (Tabel 7.1 NEN-EN 1992-1-1)
Unity check:
wk = 0,6 OK!
kx wmax
(7.11)
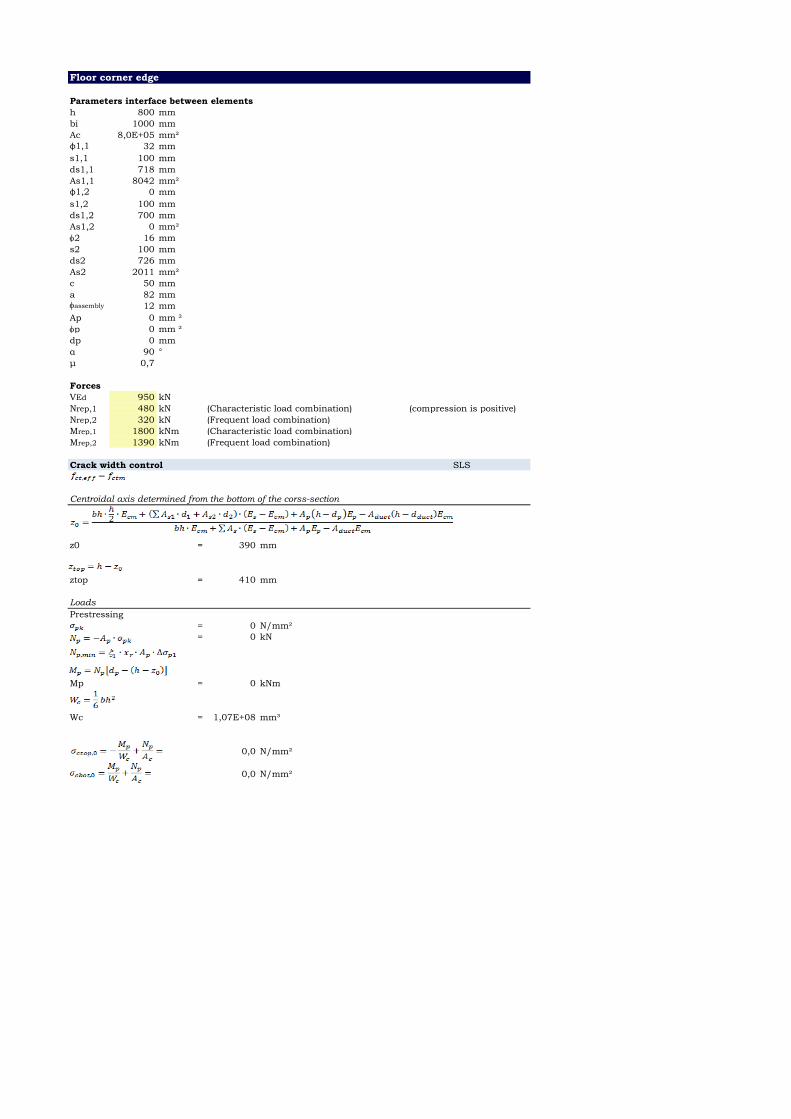
Floor corner edge
Parameters interface between elements
h 800 mm
bi 1000 mm
Ac 8,0E+05 mm²
φ1,1 32 mm
s1,1 100 mm
ds1,1 718 mm
As1,1 8042 mm²
φ1,2 0 mm
s1,2 100 mm
ds1,2 700 mm
As1,2 0 mm²
f2 16 mm
s2 100 mm
ds2 726 mm
As2 2011 mm²
c 50 mm
a 82 mmfassembly 12 mm
Ap 0 mm ²
fp 0 mm ²
dp 0 mm
α 90 °
μ 0,7
Forces
VEd 950 kN
Nrep,1 480 kN (Characteristic load combination) (compression is positive)
Nrep,2 320 kN (Frequent load combination)
Mrep,1 1800 kNm (Characteristic load combination)
Mrep,2 1390 kNm (Frequent load combination)
Crack width control SLS
Centroidal axis determined from the bottom of the corss-section
z0 = 390 mm
ztop = 410 mm
Loads
Prestressing
= 0 N/mm²
= 0 kN
Mp = 0 kNm
Wc = 1,07E+08 mm³
0,0 N/mm²
0,0 N/mm²

Other loads
-17,5 N/mm² OK!
16,3 N/mm² OK! Cracked cross-section
*For axial compression a negative value is used for Nrep,1
Minimum reinforcement
(coefficient for the effect of non-equal eigenstresses, which reduce the
forces due to restrained deformations)
With:
h* = 0,8 m
k1 takes account of the effect of normal force on the stress distribution
if Nrep is a compressive force
if Nrep is a tensile force
k1 = 1,5
kc = 0,3
σs = 200 N/mm² (additional demand from OVS)
= 2,10%
Stresses just before first crack occurs
Deformation and stressdiagram at the moment of M=Mr [Cement & Beton 2, Fig. 16.4]
= 20370 N/mm²
= 0,206 ‰ 1,8 ‰
(Frequent LC)
With:
= 1207 kN (compression)
= 737 kN (tension)
= 237 kN
= 87 kN
Nrep,2 = 320 kN
with: i = r
0 (goal seeking)
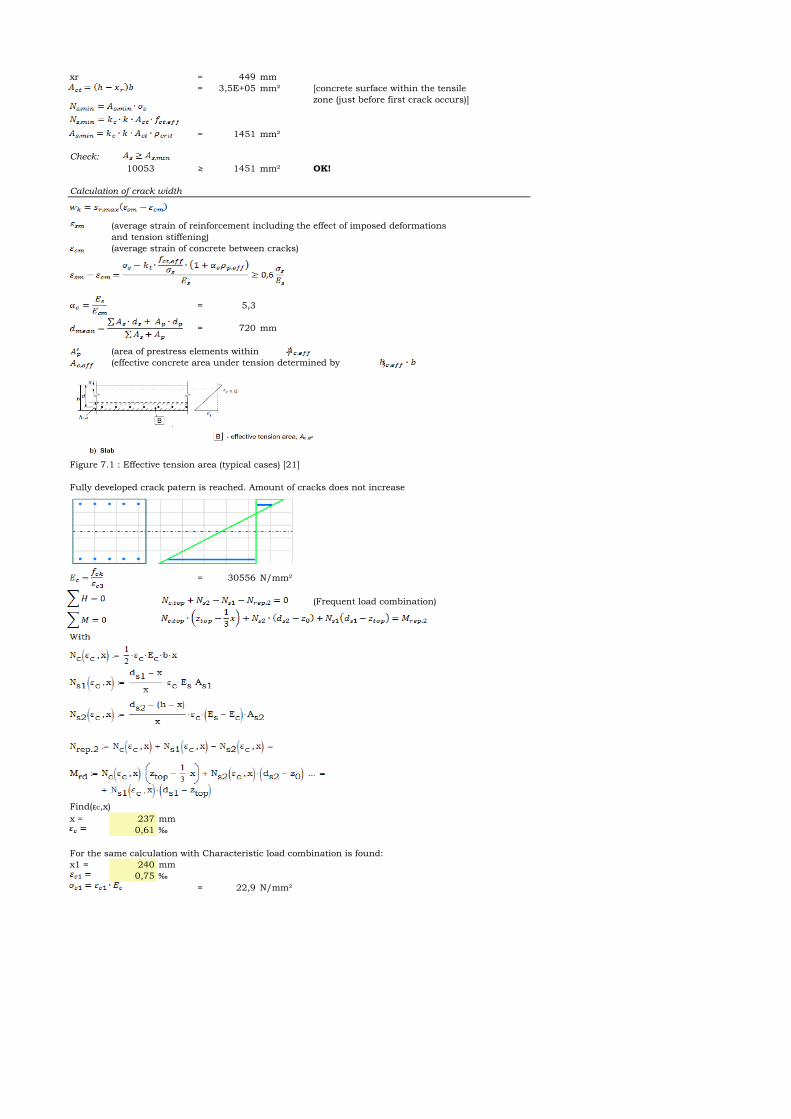
xr = 449 mm
= 3,5E+05 mm² [concrete surface within the tensile
zone (just before first crack occurs)]
= 1451 mm²
Check:
10053 ≥ 1451 mm² OK!
Calculation of crack width
(average strain of reinforcement including the effect of imposed deformations
and tension stiffening)
(average strain of concrete between cracks)
= 5,3
= 720 mm
(area of prestress elements within )
(effective concrete area under tension determined by )
Figure 7.1 : Effective tension area (typical cases) [21]
Fully developed crack patern is reached. Amount of cracks does not increase
= 30556 N/mm²
(Frequent load combination)
Find(ԑc,x)
x = 237 mm
0,61 ‰
For the same calculation with Characteristic load combination is found:
x1 = 240 mm
0,75 ‰
= 22,9 N/mm²

k1 = 0,6
Check:
22,9 ≤ 33 N/mm² OK!
= 248 N/mm²
min :
= 187,6667 mm
= 1,88E+05 mm²
= 4,29% (ony steel in tension zone is considered))
(long term loading)
Two approaches for determining the crack spacing
(1) In situations where bonded reinforcement is fixed at reasonbly close centres
within the tension zone (spacing ≤ 5(c+f/2), the max. final crack spacing may be
calculated from expression (7.11) (NEN-EN 1992-1-1):
(2) Where the spacing of the bonded reinforcement exceeds 5(c+f/2) or where no
bonded reinforcement is placed within the tension zone, an upper bound to the crack
width may be found by using expression (7.14) (NEN-EN 1992-1-1):
(7.14) (most likely not governing)
With:
k1 0,8 (used for reinforcement)
1,6 (used for prestressing steel)
k2 0,5 (for bending)
1,0 (for pure tension)
k3 3,4
k4 0,425
c (cover on longitudinal reinforcement)
Figure 7.2: Crack width, w, at concrete surface relative to distance from bar [21]
smax = 5(c+φassembly+feq/2)= 390 mm
= 26,66667 mm
= 316,5828 mm Equation (7.11) is used
= 0,743 ‰
= 0,235 mm
Cover and crack width
kx = 1,43
cnom = 35 mm (Tabel 4.2N NEN-EN 1992-1-1)
wmax = 0,2 mm (Tabel 7.1 NEN-EN 1992-1-1)
Unity check:
wk = 0,8 OK!
kx wmax
(7.11)
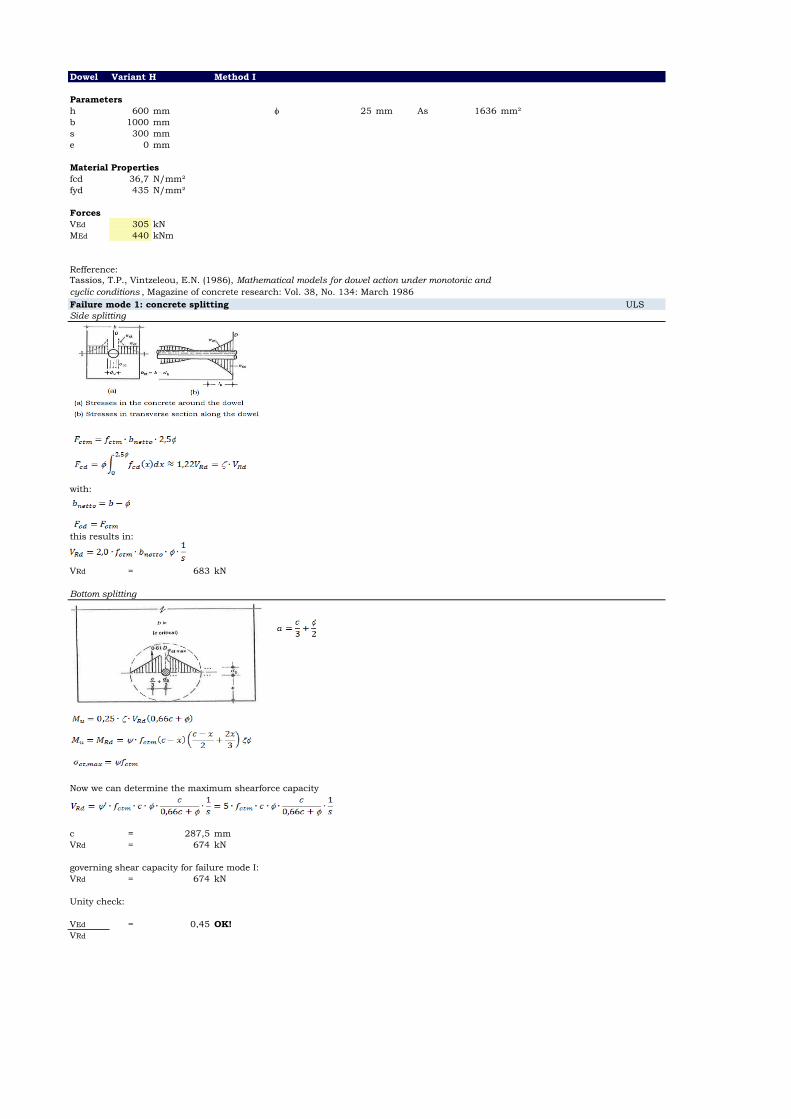
Dowel Variant H Method I
Parameters
h 600 mm f 25 mm As 1636 mm²
b 1000 mm f 40 mm As 4189 mm²
s 300 mm f 50 mm As 6545 mm²
e 0 mm
l 400 mm
Material Properties l 450 mm
fcd 36,7 N/mm² l 500 mm
fyd 435 N/mm² l 550 mm
l 600 mm
Forces l 650 mm
VEd 305 kN l 700 mm
MEd 440 kNm l 750 mm
l 800 mm
l 850 mm
Refference:
Tassios, T.P., Vintzeleou, E.N. (1986), Mathematical models for dowel action under monotonic and
cyclic conditions , Magazine of concrete research: Vol. 38, No. 134: March 1986
Failure mode 1: concrete splitting ULS
Side splitting
with:
this results in:
VRd = 683 kN
Bottom splitting
Now we can determine the maximum shearforce capacity
c = 287,5 mm
VRd = 674 kN
governing shear capacity for failure mode I:
VRd = 674 kN
Unity check:
VEd = 0,45 OK!
VRd
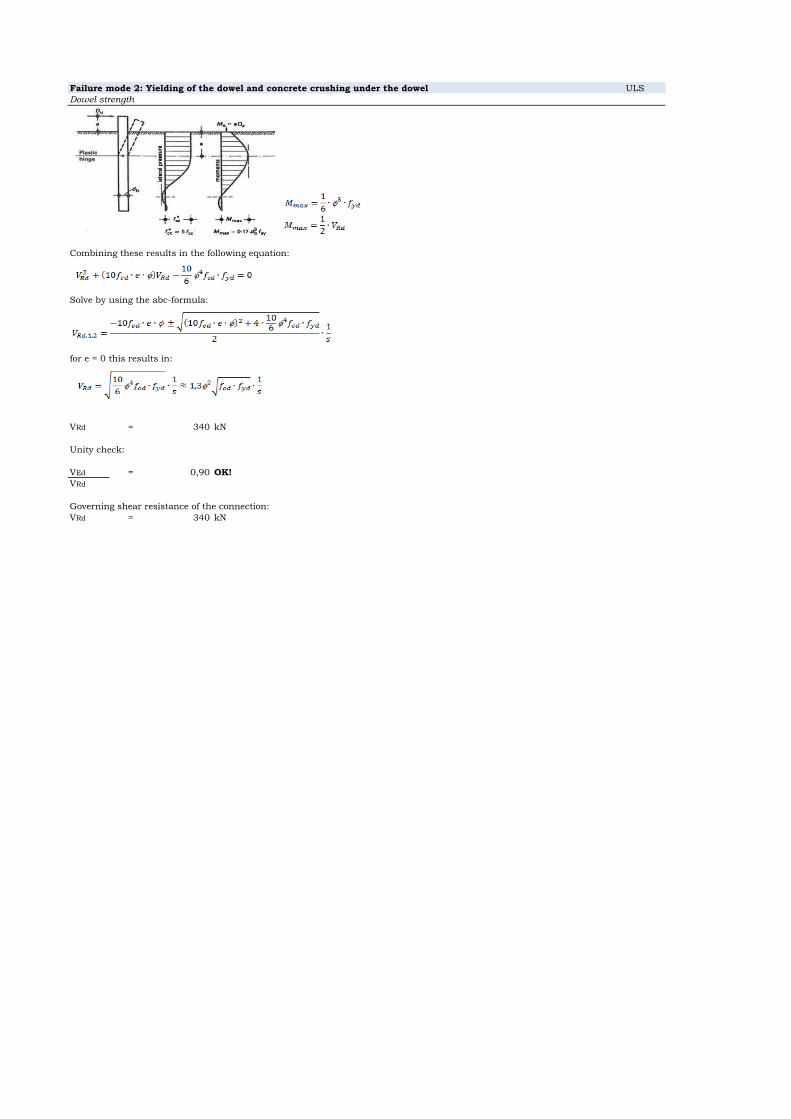
Failure mode 2: Yielding of the dowel and concrete crushing under the dowel ULS
Dowel strength
Combining these results in the following equation:
Solve by using the abc-formula:
for e = 0 this results in:
VRd = 340 kN
Unity check:
VEd = 0,90 OK!
VRd
Governing shear resistance of the connection:
VRd = 340 kN
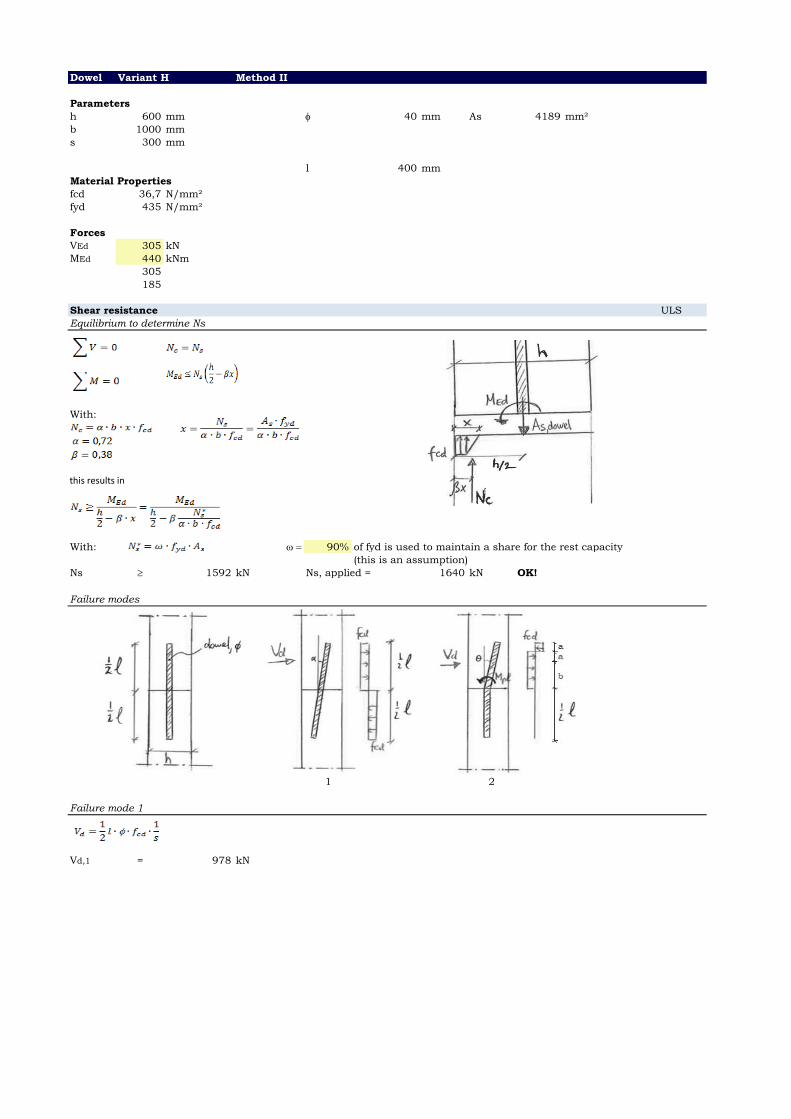
Dowel Variant H Method II
Parameters
h 600 mm f 40 mm As 4189 mm²
b 1000 mm f 40 mm As 4189 mm²
s 300 mm f 50 mm As 6545 mm²
l 400 mm
Material Properties l 450 mm
fcd 36,7 N/mm² l 500 mm
fyd 435 N/mm² l 550 mm
l 600 mm
Forces l 650 mm
VEd 305 kN l 700 mm
MEd 440 kNm l 750 mm
305 l 800 mm
185 l 850 mm
l 900 mm
Shear resistance ULS
Equilibrium to determine Ns
With:
this results in
With: w = 90% of fyd is used to maintain a share for the rest capacity
(this is an assumption)
Ns 1592 kN Ns, applied = 1640 kN OK!
Failure modes
1 2
Failure mode 1
Vd,1 = 978 kN
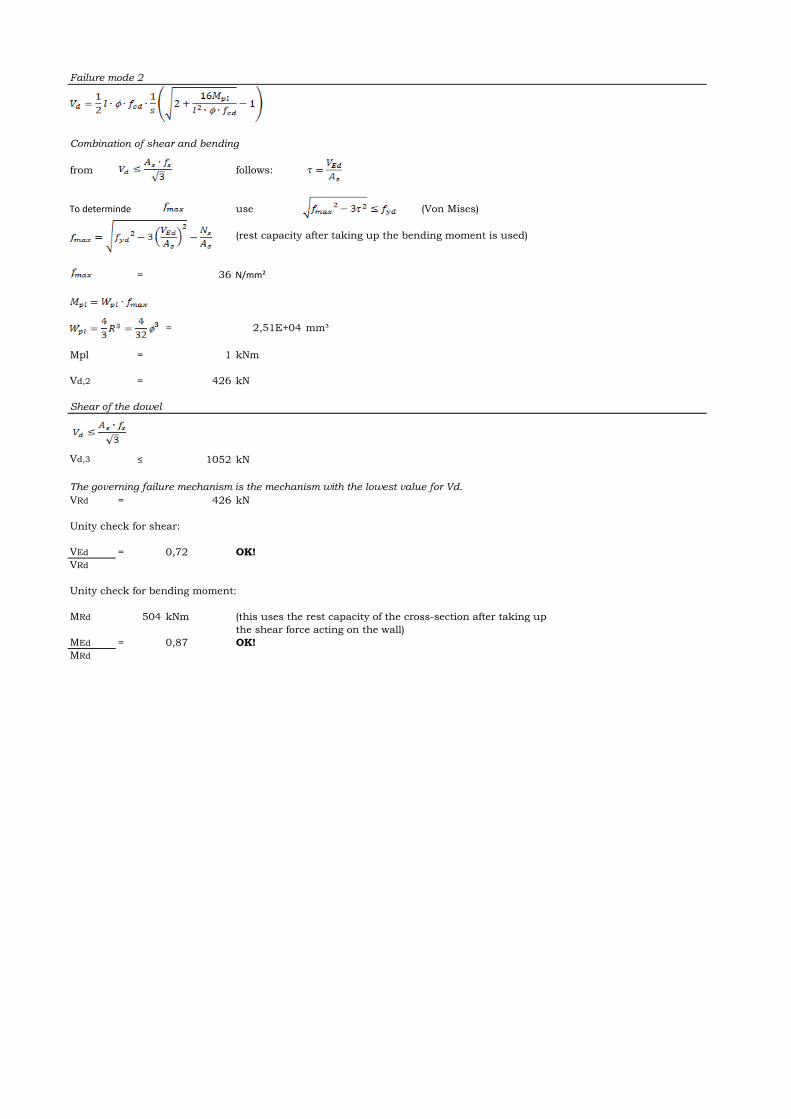
Failure mode 2
Combination of shear and bending
from follows:
To determinde use (Von Mises)
(rest capacity after taking up the bending moment is used)
= 36 N/mm²
= 2,51E+04 mm³
Mpl = 1 kNm
Vd,2 = 426 kN
Shear of the dowel
Vd,3 ≤ 1052 kN
The governing failure mechanism is the mechanism with the lowest value for Vd.
VRd = 426 kN
Unity check for shear:
VEd = 0,72 OK!
VRd
Unity check for bending moment:
MRd 504 kNm (this uses the rest capacity of the cross-section after taking up
the shear force acting on the wall)
MEd = 0,87 OK!
MRd
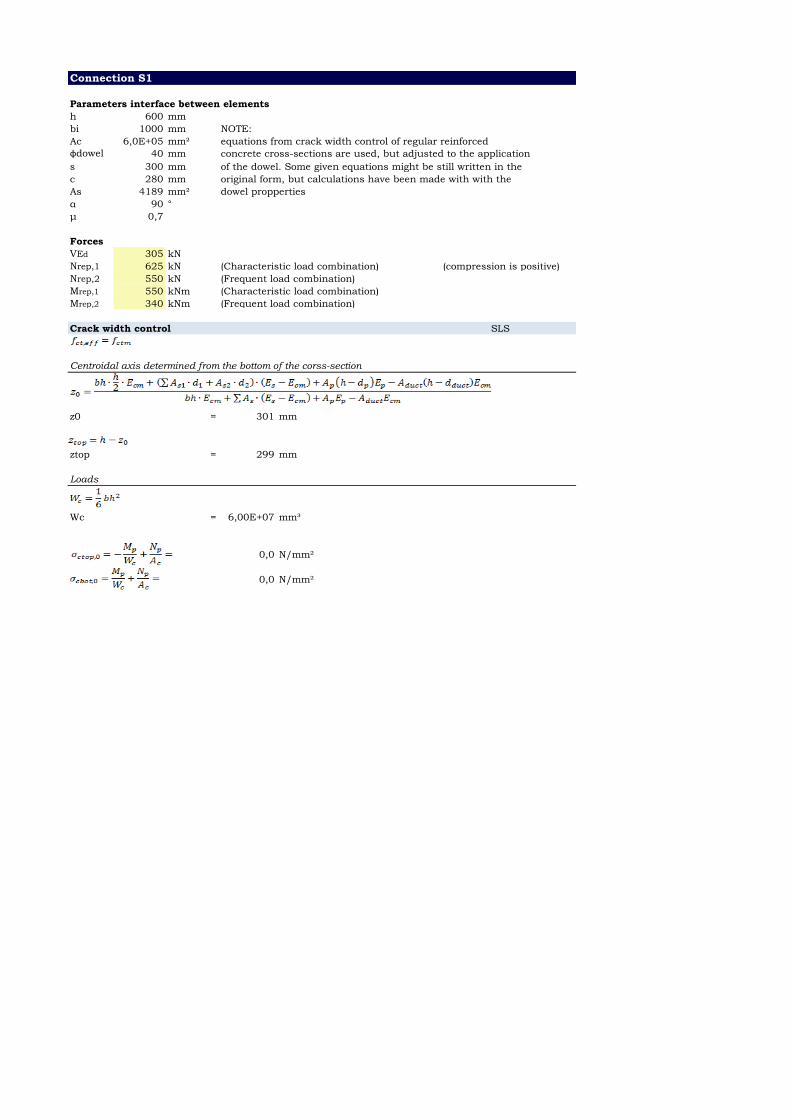
Connection S1
Parameters interface between elements
h 600 mm
bi 1000 mm NOTE:
Ac 6,0E+05 mm² equations from crack width control of regular reinforced
φdowel 40 mm concrete cross-sections are used, but adjusted to the application
s 300 mm of the dowel. Some given equations might be still written in the
c 280 mm original form, but calculations have been made with with the
As 4189 mm² dowel propperties
α 90 °
μ 0,7
Forces
VEd 305 kN
Nrep,1 625 kN (Characteristic load combination) (compression is positive)
Nrep,2 550 kN (Frequent load combination)
Mrep,1 550 kNm (Characteristic load combination)
Mrep,2 340 kNm (Frequent load combination)
Crack width control SLS
Centroidal axis determined from the bottom of the corss-section
z0 = 301 mm
ztop = 299 mm
Loads
Wc = 6,00E+07 mm³
0,0 N/mm²
0,0 N/mm²
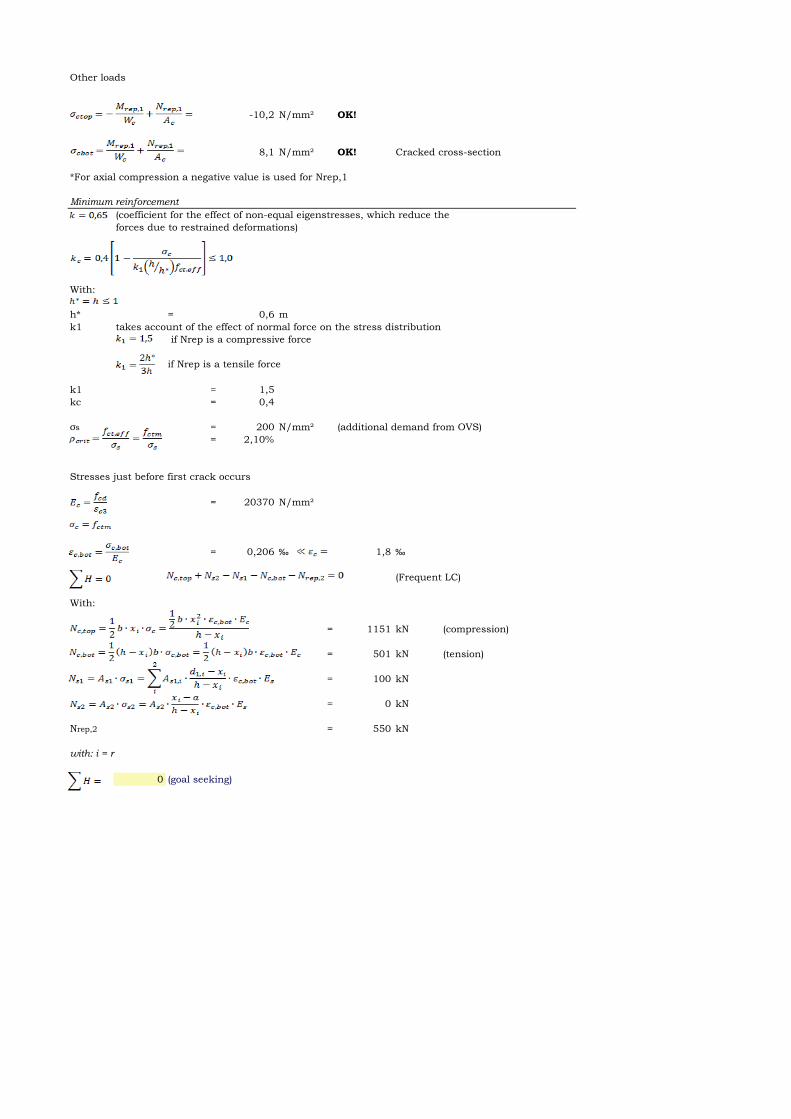
Other loads
-10,2 N/mm² OK!
8,1 N/mm² OK! Cracked cross-section
*For axial compression a negative value is used for Nrep,1
Minimum reinforcement
(coefficient for the effect of non-equal eigenstresses, which reduce the
forces due to restrained deformations)
With:
h* = 0,6 m
k1 takes account of the effect of normal force on the stress distribution
if Nrep is a compressive force
if Nrep is a tensile force
k1 = 1,5
kc = 0,4
σs = 200 N/mm² (additional demand from OVS)
= 2,10%
Stresses just before first crack occurs
= 20370 N/mm²
= 0,206 ‰ 1,8 ‰
(Frequent LC)
With:
= 1151 kN (compression)
= 501 kN (tension)
= 100 kN
= 0 kN
Nrep,2 = 550 kN
with: i = r
0 (goal seeking)
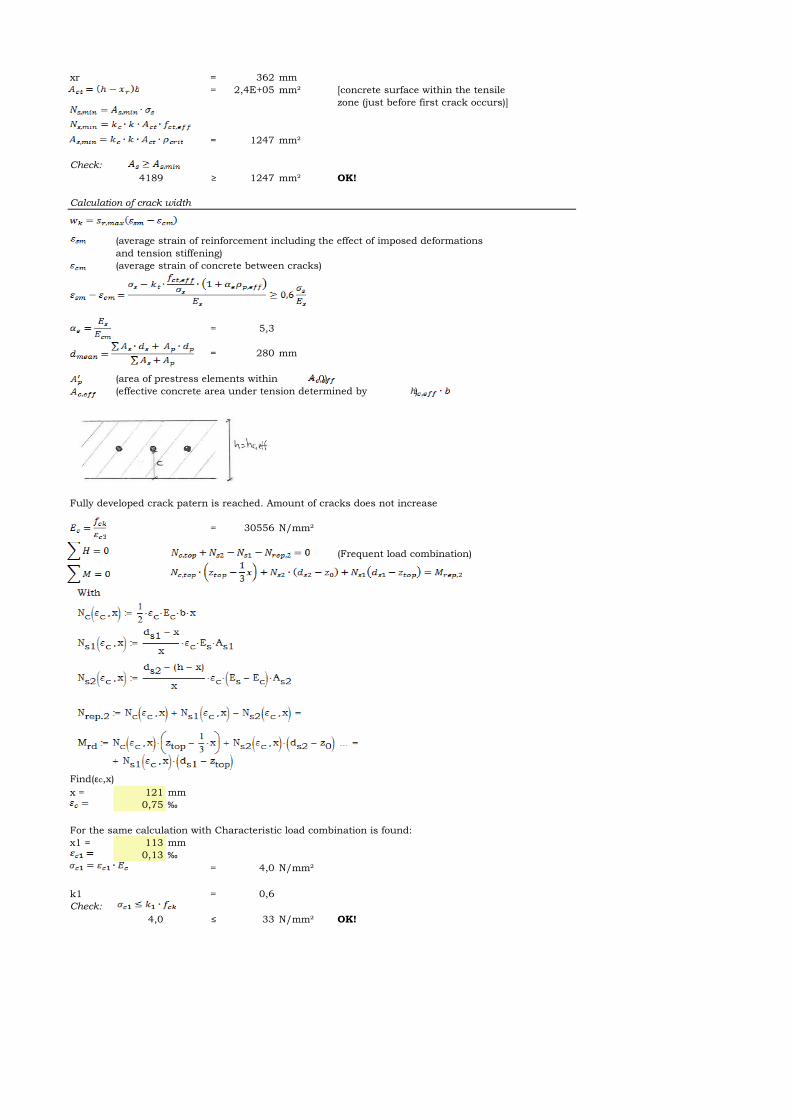
xr = 362 mm
= 2,4E+05 mm² [concrete surface within the tensile
zone (just before first crack occurs)]
= 1247 mm²
Check:
4189 ≥ 1247 mm² OK!
Calculation of crack width
(average strain of reinforcement including the effect of imposed deformations
and tension stiffening)
(average strain of concrete between cracks)
= 5,3
= 280 mm
(area of prestress elements within = 0)
(effective concrete area under tension determined by )
Fully developed crack patern is reached. Amount of cracks does not increase
= 30556 N/mm²
(Frequent load combination)
Find(ԑc,x)
x = 121 mm
0,75 ‰
For the same calculation with Characteristic load combination is found:
x1 = 113 mm
0,13 ‰
= 4,0 N/mm²
k1 = 0,6
Check:
4,0 ≤ 33 N/mm² OK!
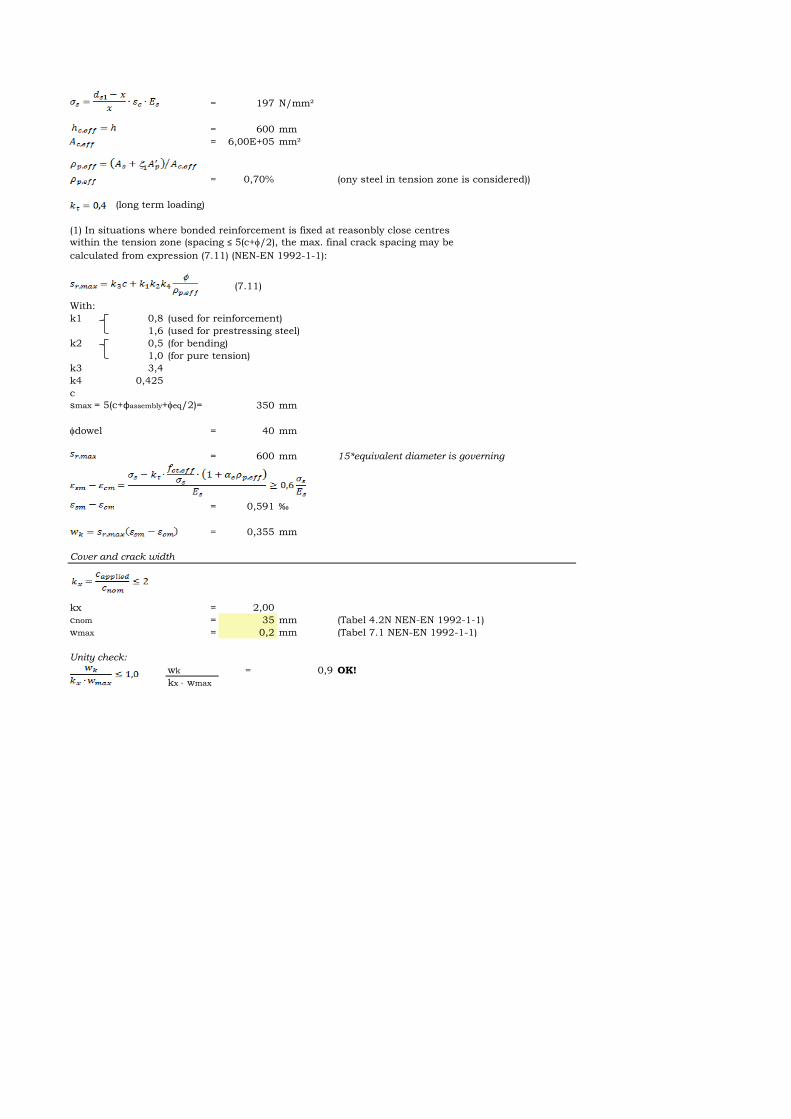
= 197 N/mm²
= 600 mm
= 6,00E+05 mm²
= 0,70% (ony steel in tension zone is considered))
(long term loading)
(1) In situations where bonded reinforcement is fixed at reasonbly close centres
within the tension zone (spacing ≤ 5(c+f/2), the max. final crack spacing may be
calculated from expression (7.11) (NEN-EN 1992-1-1):
With:
k1 0,8 (used for reinforcement)
1,6 (used for prestressing steel)
k2 0,5 (for bending)
1,0 (for pure tension)
k3 3,4
k4 0,425
c
smax = 5(c+φassembly+feq/2)= 350 mm
fdowel = 40 mm
= 600 mm 15*equivalent diameter is governing
= 0,591 ‰
= 0,355 mm
Cover and crack width
kx = 2,00
cnom = 35 mm (Tabel 4.2N NEN-EN 1992-1-1)
wmax = 0,2 mm (Tabel 7.1 NEN-EN 1992-1-1)
Unity check:
wk = 0,9 OK!
kx wmax
(7.11)
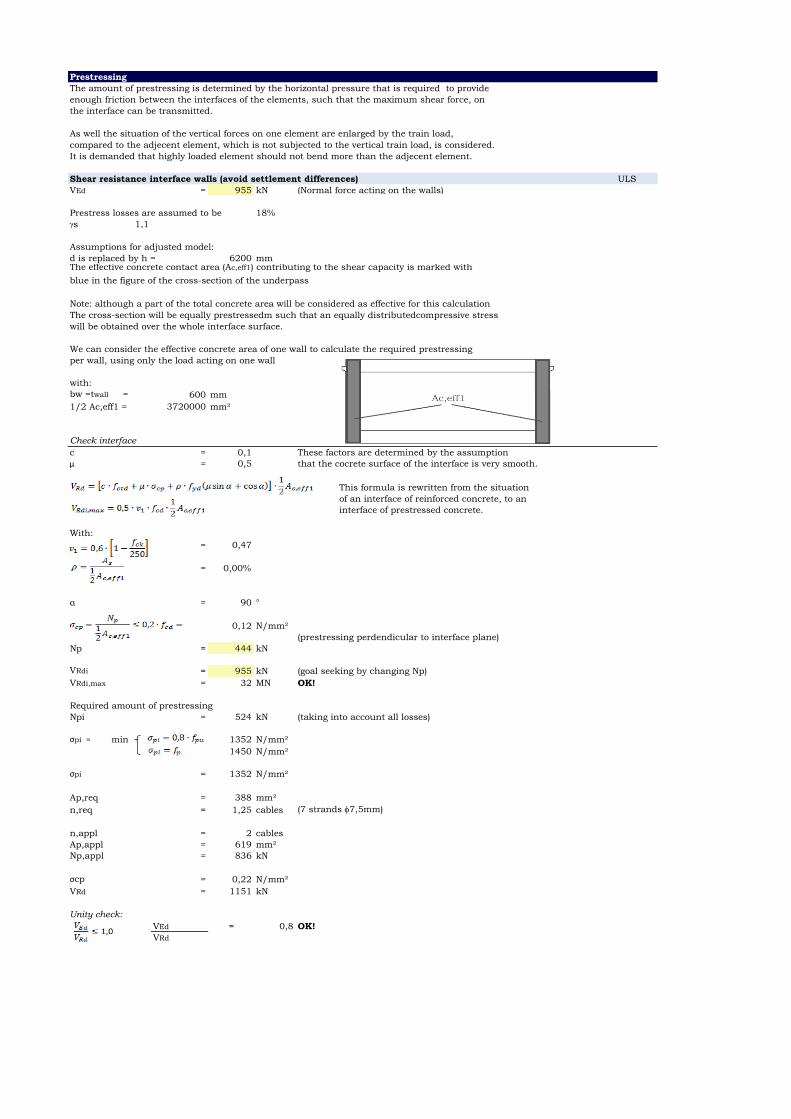
Prestressing
The amount of prestressing is determined by the horizontal pressure that is required to provide
enough friction between the interfaces of the elements, such that the maximum shear force, on
the interface can be transmitted.
As well the situation of the vertical forces on one element are enlarged by the train load,
compared to the adjecent element, which is not subjected to the vertical train load, is considered.
It is demanded that highly loaded element should not bend more than the adjecent element.
Shear resistance interface walls (avoid settlement differences) ULS
VEd = 955 kN (Normal force acting on the walls)
Prestress losses are assumed to be 18%
gs 1,1
Assumptions for adjusted model:
d is replaced by h = 6200 mmThe effective concrete contact area (Ac,eff1) contributing to the shear capacity is marked with
blue in the figure of the cross-section of the underpass
Note: although a part of the total concrete area will be considered as effective for this calculation
The cross-section will be equally prestressedm such that an equally distributedcompressive stress
will be obtained over the whole interface surface.
We can consider the effective concrete area of one wall to calculate the required prestressing
per wall, using only the load acting on one wall
with:
bw =twall = 600 mm
1/2 Ac,eff1 = 3720000 mm²
Check interface
c = 0,1 These factors are determined by the assumption
μ = 0,5 that the cocrete surface of the interface is very smooth.
This formula is rewritten from the situation
of an interface of reinforced concrete, to an
interface of prestressed concrete.
With:
= 0,47
= 0,00%
α = 90 °
0,12 N/mm²
(prestressing perdendicular to interface plane)
Np = 444 kN
VRdi = 955 kN (goal seeking by changing Np)
VRdi,max = 32 MN OK!
Required amount of prestressing
Npi = 524 kN (taking into account all losses)
σpi = min 1352 N/mm²
1450 N/mm²
σpi = 1352 N/mm²
Ap,req = 388 mm²
n,req = 1,25 cables (7 strands f7,5mm)
n,appl = 2 cables
Ap,appl = 619 mm²
Np,appl = 836 kN
σcp = 0,22 N/mm²
VRd = 1151 kN
Unity check:
VEd = 0,8 OK!
VRd
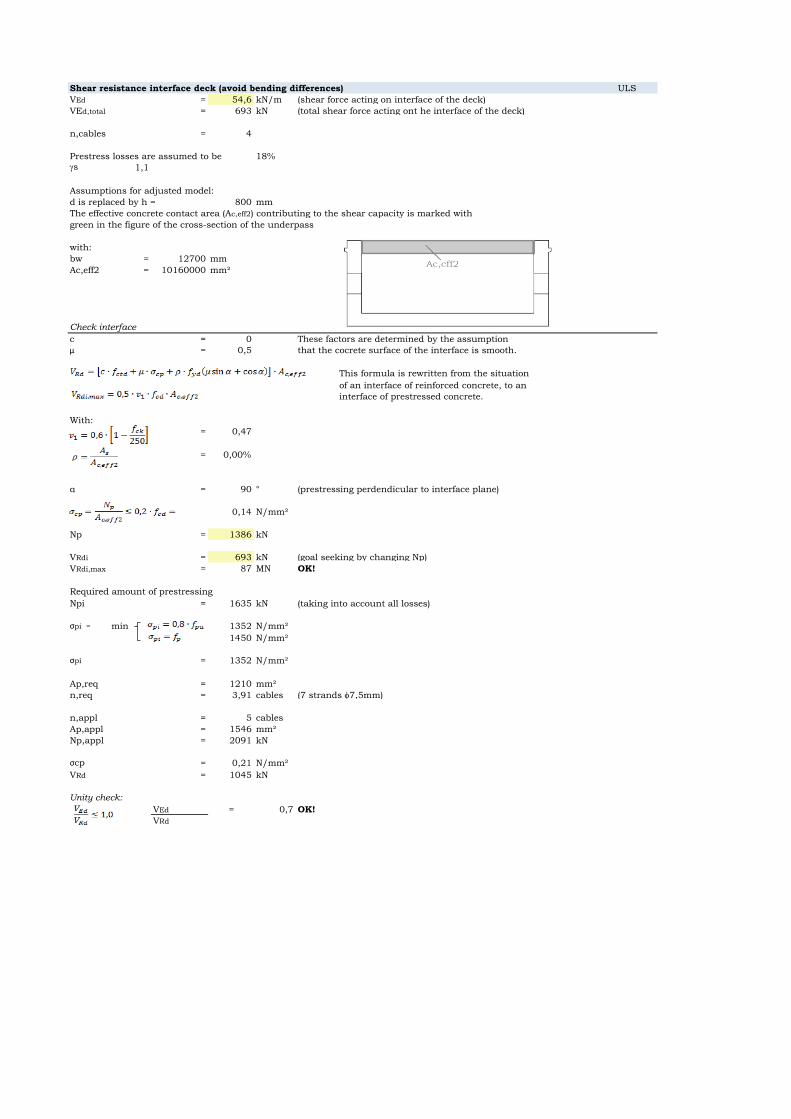
Shear resistance interface deck (avoid bending differences) ULS
VEd = 54,6 kN/m (shear force acting on interface of the deck)
VEd,total = 693 kN (total shear force acting ont he interface of the deck)
n,cables = 4
Prestress losses are assumed to be 18%gs 1,1
Assumptions for adjusted model:
d is replaced by h = 800 mm
The effective concrete contact area (Ac,eff2) contributing to the shear capacity is marked with
green in the figure of the cross-section of the underpass
with:
bw = 12700 mm
Ac,eff2 = 10160000 mm²
Check interface
c = 0 These factors are determined by the assumption
μ = 0,5 that the cocrete surface of the interface is smooth.
This formula is rewritten from the situation
of an interface of reinforced concrete, to an
interface of prestressed concrete.
With:
= 0,47
= 0,00%
α = 90 ° (prestressing perdendicular to interface plane)
0,14 N/mm²
Np = 1386 kN
VRdi = 693 kN (goal seeking by changing Np)
VRdi,max = 87 MN OK!
Required amount of prestressing
Npi = 1635 kN (taking into account all losses)
σpi = min 1352 N/mm²
1450 N/mm²
σpi = 1352 N/mm²
Ap,req = 1210 mm²
n,req = 3,91 cables (7 strands f7,5mm)
n,appl = 5 cables
Ap,appl = 1546 mm²
Np,appl = 2091 kN
σcp = 0,21 N/mm²
VRd = 1045 kN
Unity check:
VEd = 0,7 OK!
VRd

V
ANNEX V:
Connections
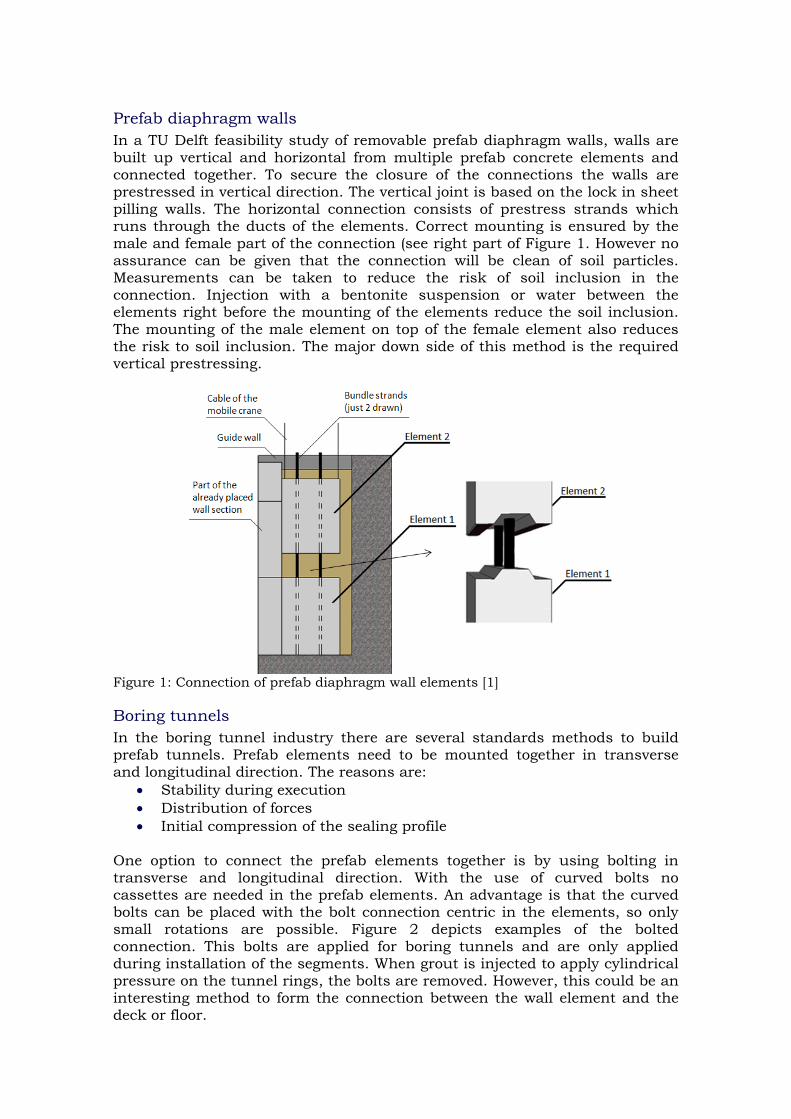
Prefab diaphragm walls In a TU Delft feasibility study of removable prefab diaphragm walls, walls are built up vertical and horizontal from multiple prefab concrete elements and connected together. To secure the closure of the connections the walls are prestressed in vertical direction. The vertical joint is based on the lock in sheet pilling walls. The horizontal connection consists of prestress strands which runs through the ducts of the elements. Correct mounting is ensured by the male and female part of the connection (see right part of Figure 1. However no assurance can be given that the connection will be clean of soil particles. Measurements can be taken to reduce the risk of soil inclusion in the connection. Injection with a bentonite suspension or water between the elements right before the mounting of the elements reduce the soil inclusion. The mounting of the male element on top of the female element also reduces the risk to soil inclusion. The major down side of this method is the required vertical prestressing.
Figure 1: Connection of prefab diaphragm wall elements [1]
Boring tunnels In the boring tunnel industry there are several standards methods to build prefab tunnels. Prefab elements need to be mounted together in transverse and longitudinal direction. The reasons are:
• Stability during execution • Distribution of forces • Initial compression of the sealing profile
One option to connect the prefab elements together is by using bolting in transverse and longitudinal direction. With the use of curved bolts no cassettes are needed in the prefab elements. An advantage is that the curved bolts can be placed with the bolt connection centric in the elements, so only small rotations are possible. Figure 2 depicts examples of the bolted connection. This bolts are applied for boring tunnels and are only applied during installation of the segments. When grout is injected to apply cylindrical pressure on the tunnel rings, the bolts are removed. However, this could be an interesting method to form the connection between the wall element and the deck or floor.
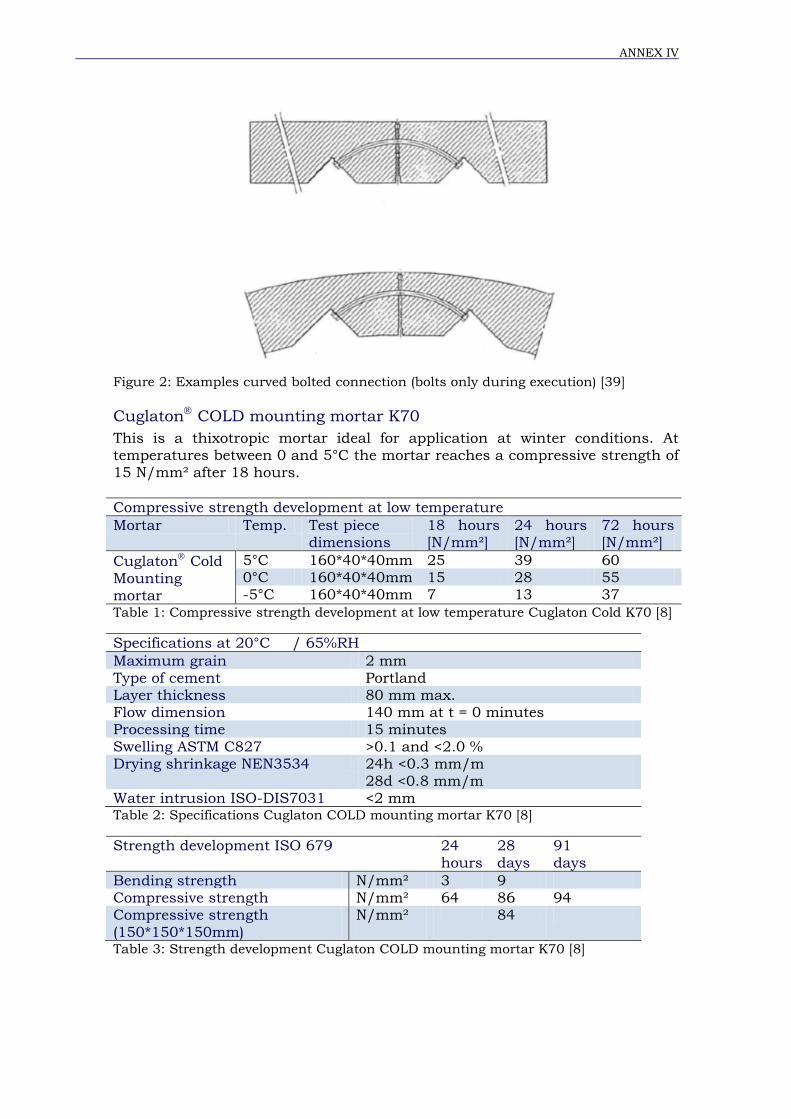
ANNEX IV
Figure 2: Examples curved bolted connection (bolts only during execution) [39]
Cuglaton COLD mounting mortar K70 This is a thixotropic mortar ideal for application at winter conditions. At temperatures between 0 and 5°C the mortar reaches a compressive strength of 15 N/mm² after 18 hours. Compressive strength development at low temperature Mortar Temp. Test piece
dimensions 18 hours [N/mm²]
24 hours [N/mm²]
72 hours [N/mm²]
Cuglaton Cold Mounting mortar
5°C 160*40*40mm 25 39 60 0°C 160*40*40mm 15 28 55 -5°C 160*40*40mm 7 13 37
Table 1: Compressive strength development at low temperature Cuglaton Cold K70 [8]
Specifications at 20°C / 65%RH Maximum grain 2 mm Type of cement Portland Layer thickness 80 mm max. Flow dimension 140 mm at t = 0 minutes Processing time 15 minutes Swelling ASTM C827 >0.1 and <2.0 % Drying shrinkage NEN3534 24h <0.3 mm/m
28d <0.8 mm/m Water intrusion ISO-DIS7031 <2 mm Table 2: Specifications Cuglaton COLD mounting mortar K70 [8]
Strength development ISO 679 24 hours
28 days
91 days
Bending strength N/mm² 3 9 Compressive strength N/mm² 64 86 94 Compressive strength (150*150*150mm)
N/mm² 84
Table 3: Strength development Cuglaton COLD mounting mortar K70 [8]

ANNEX IV

VI
ANNEX VI:
Execution
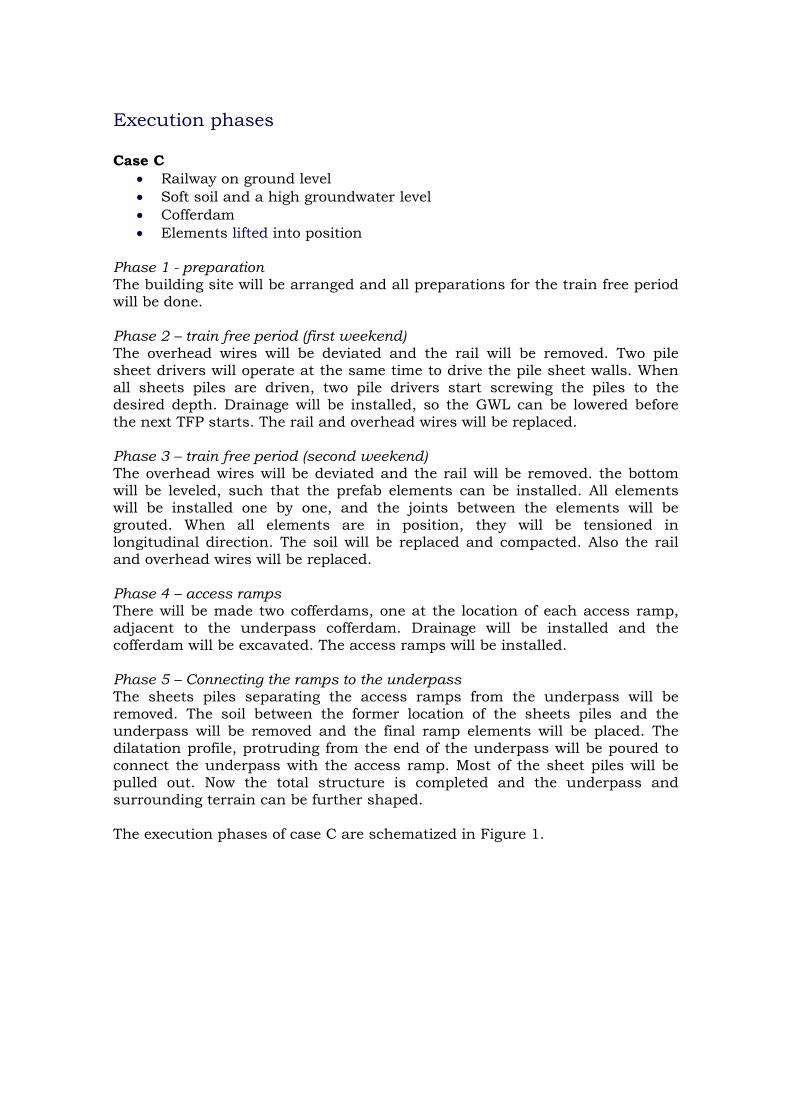
Execution phases Case C
• Railway on ground level • Soft soil and a high groundwater level • Cofferdam • Elements lifted into position
Phase 1 - preparation The building site will be arranged and all preparations for the train free period will be done. Phase 2 – train free period (first weekend) The overhead wires will be deviated and the rail will be removed. Two pile sheet drivers will operate at the same time to drive the pile sheet walls. When all sheets piles are driven, two pile drivers start screwing the piles to the desired depth. Drainage will be installed, so the GWL can be lowered before the next TFP starts. The rail and overhead wires will be replaced. Phase 3 – train free period (second weekend) The overhead wires will be deviated and the rail will be removed. the bottom will be leveled, such that the prefab elements can be installed. All elements will be installed one by one, and the joints between the elements will be grouted. When all elements are in position, they will be tensioned in longitudinal direction. The soil will be replaced and compacted. Also the rail and overhead wires will be replaced. Phase 4 – access ramps There will be made two cofferdams, one at the location of each access ramp, adjacent to the underpass cofferdam. Drainage will be installed and the cofferdam will be excavated. The access ramps will be installed. Phase 5 – Connecting the ramps to the underpass The sheets piles separating the access ramps from the underpass will be removed. The soil between the former location of the sheets piles and the underpass will be removed and the final ramp elements will be placed. The dilatation profile, protruding from the end of the underpass will be poured to connect the underpass with the access ramp. Most of the sheet piles will be pulled out. Now the total structure is completed and the underpass and surrounding terrain can be further shaped. The execution phases of case C are schematized in Figure 1.
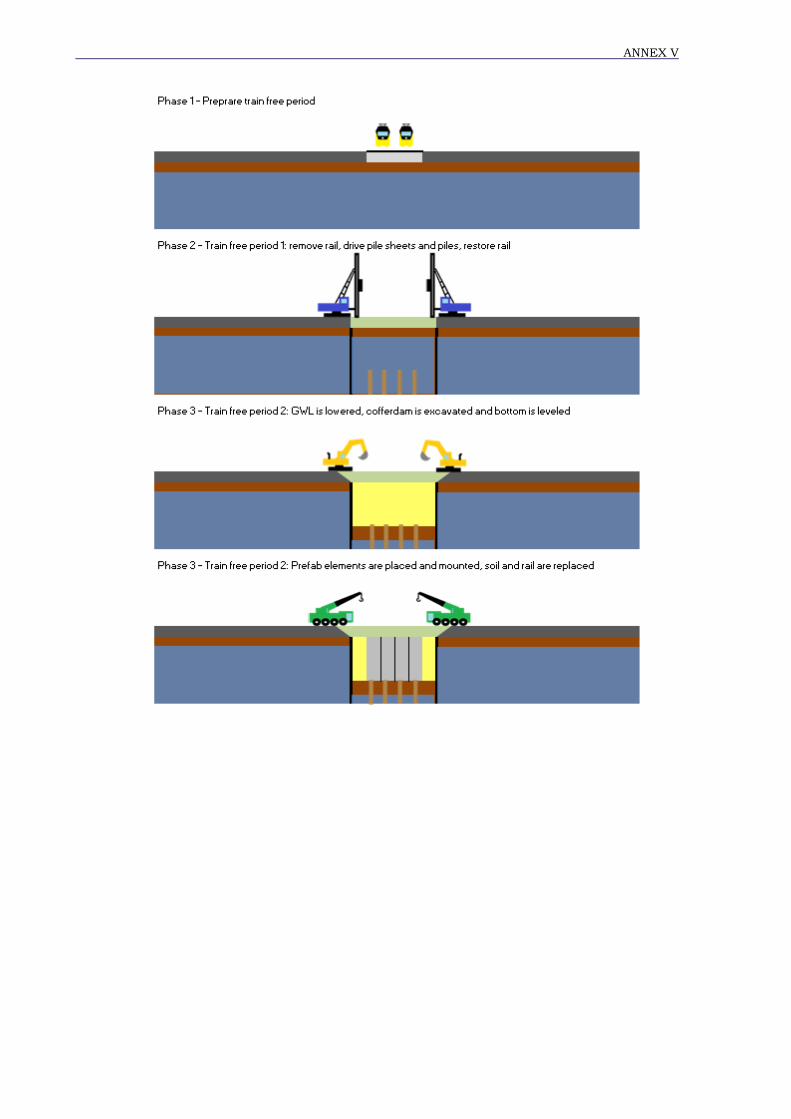
ANNEX V
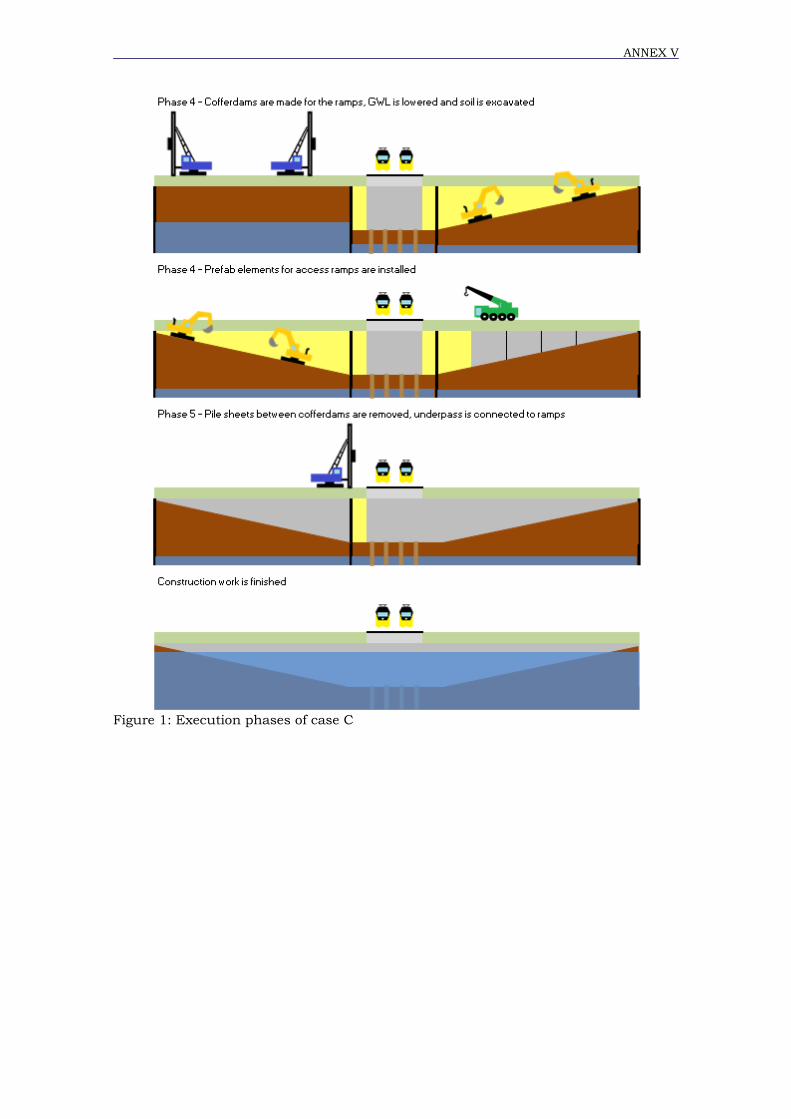
ANNEX V
Figure 1: Execution phases of case C
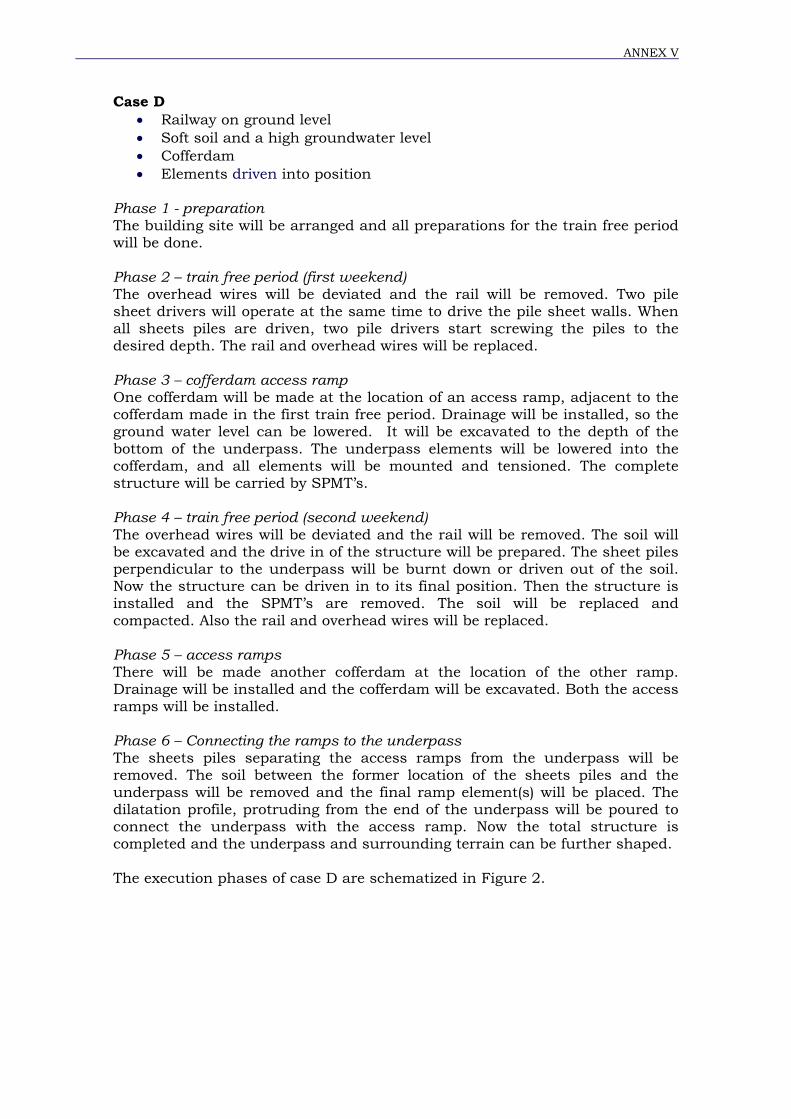
ANNEX V
Case D • Railway on ground level • Soft soil and a high groundwater level • Cofferdam • Elements driven into position
Phase 1 - preparation The building site will be arranged and all preparations for the train free period will be done. Phase 2 – train free period (first weekend) The overhead wires will be deviated and the rail will be removed. Two pile sheet drivers will operate at the same time to drive the pile sheet walls. When all sheets piles are driven, two pile drivers start screwing the piles to the desired depth. The rail and overhead wires will be replaced. Phase 3 – cofferdam access ramp One cofferdam will be made at the location of an access ramp, adjacent to the cofferdam made in the first train free period. Drainage will be installed, so the ground water level can be lowered. It will be excavated to the depth of the bottom of the underpass. The underpass elements will be lowered into the cofferdam, and all elements will be mounted and tensioned. The complete structure will be carried by SPMT’s. Phase 4 – train free period (second weekend) The overhead wires will be deviated and the rail will be removed. The soil will be excavated and the drive in of the structure will be prepared. The sheet piles perpendicular to the underpass will be burnt down or driven out of the soil. Now the structure can be driven in to its final position. Then the structure is installed and the SPMT’s are removed. The soil will be replaced and compacted. Also the rail and overhead wires will be replaced. Phase 5 – access ramps There will be made another cofferdam at the location of the other ramp. Drainage will be installed and the cofferdam will be excavated. Both the access ramps will be installed. Phase 6 – Connecting the ramps to the underpass The sheets piles separating the access ramps from the underpass will be removed. The soil between the former location of the sheets piles and the underpass will be removed and the final ramp element(s) will be placed. The dilatation profile, protruding from the end of the underpass will be poured to connect the underpass with the access ramp. Now the total structure is completed and the underpass and surrounding terrain can be further shaped. The execution phases of case D are schematized in Figure 2.
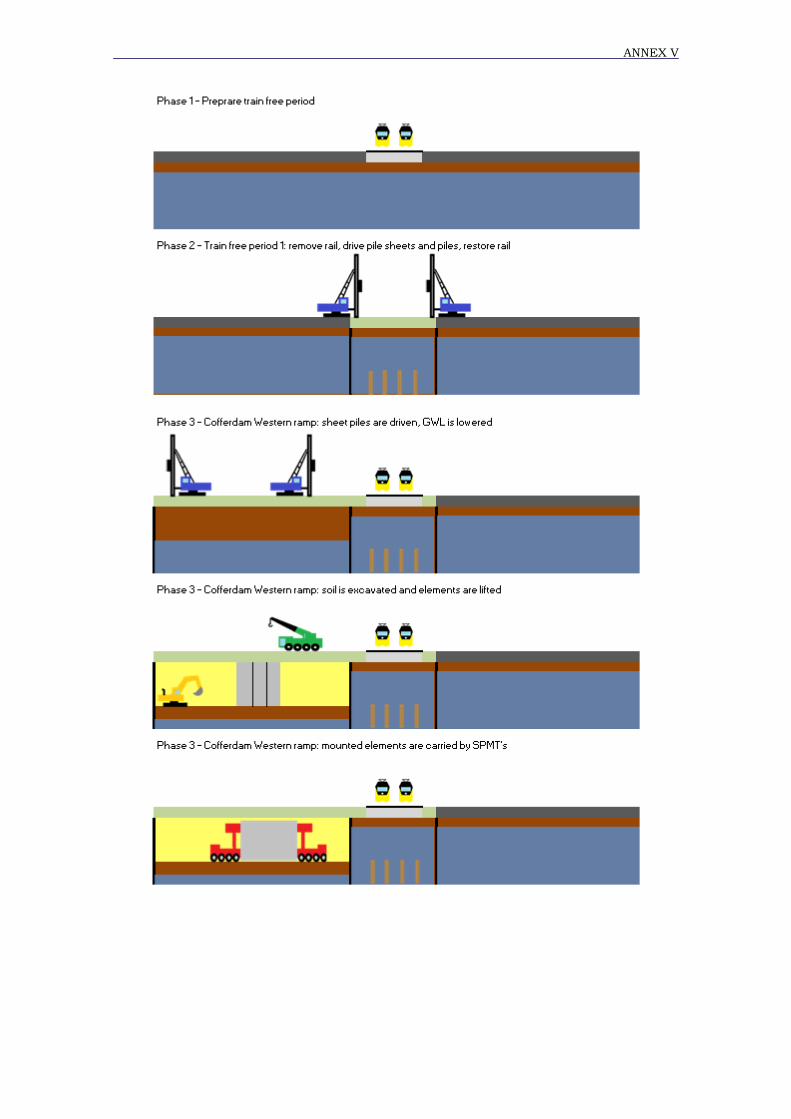
ANNEX V
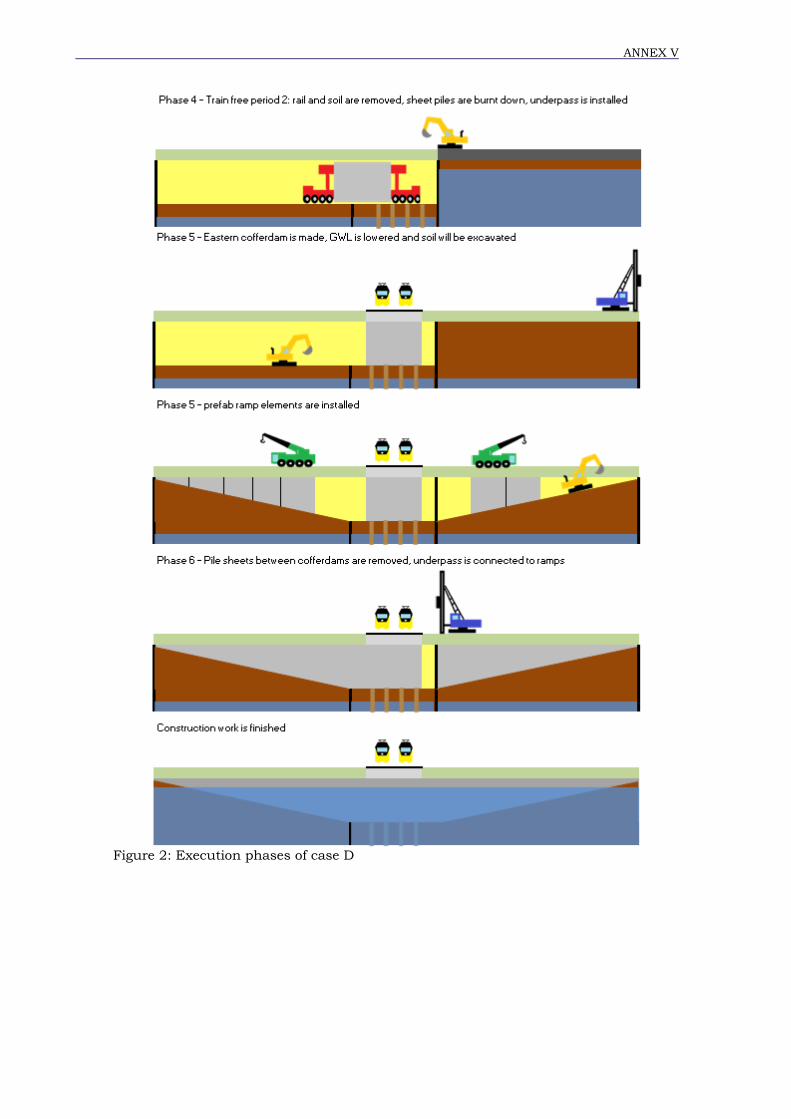
ANNEX V
Figure 2: Execution phases of case D
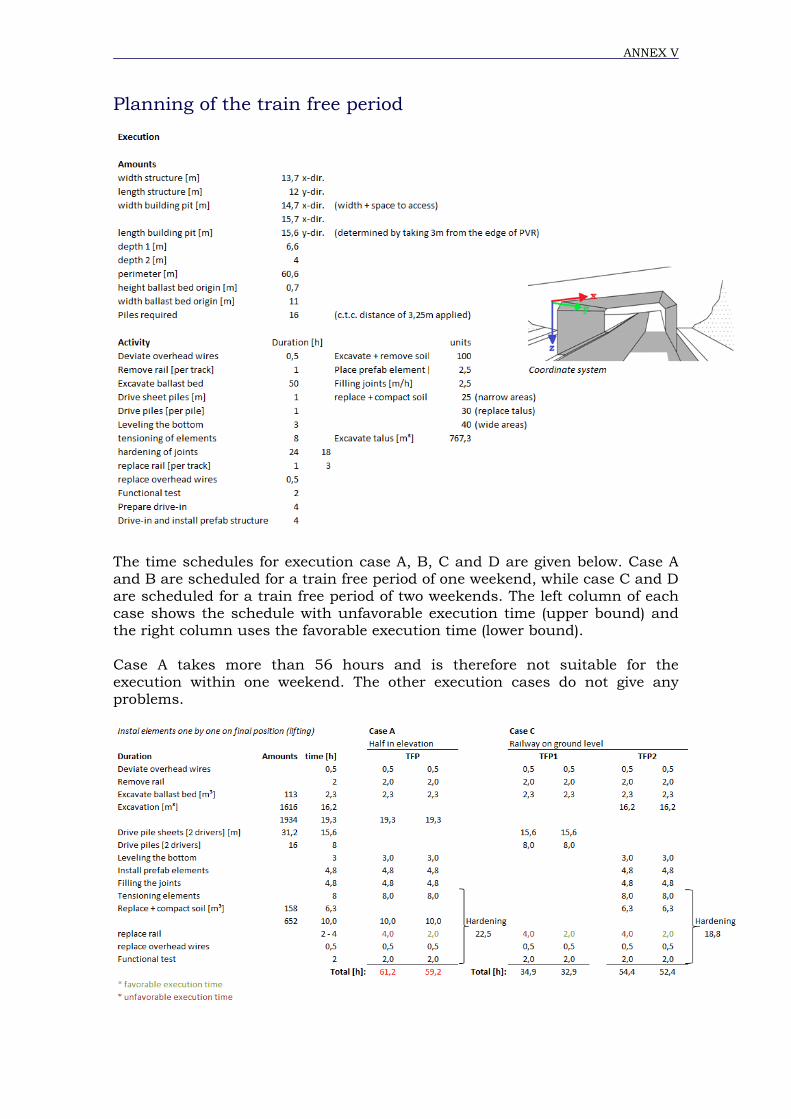
ANNEX V
Planning of the train free period
The time schedules for execution case A, B, C and D are given below. Case A and B are scheduled for a train free period of one weekend, while case C and D are scheduled for a train free period of two weekends. The left column of each case shows the schedule with unfavorable execution time (upper bound) and the right column uses the favorable execution time (lower bound). Case A takes more than 56 hours and is therefore not suitable for the execution within one weekend. The other execution cases do not give any problems.
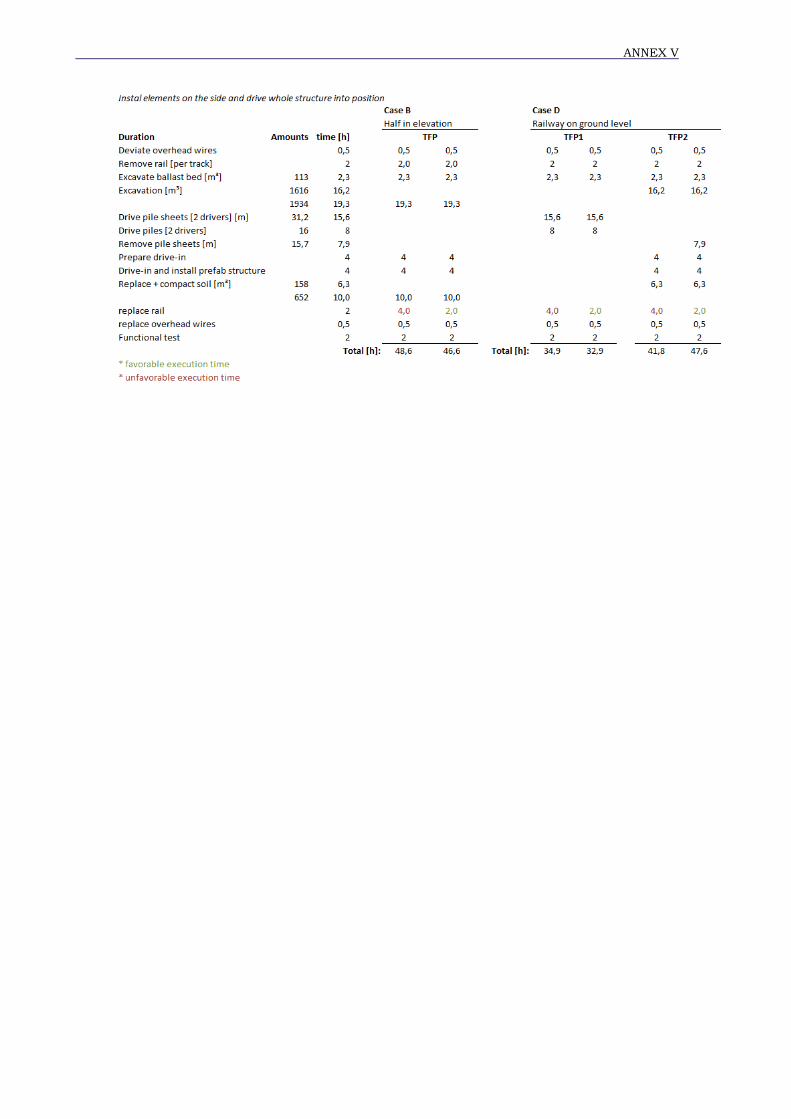
ANNEX V