Embed Size (px)
Citation preview

Feasibility of Textile Sector in Capital Market
2
COURSE: BUS 400 INTERNSHIP
Prepared For
Samina Haque
Internship Supervisor
BRAC Business School
BRAC University
Prepared By
Md. Mozammal Hossain
ID: 09304028
Internship Tenure: 12th August’13-12th
Dated: 15
December’13
th
January, 2014

3
Jan 15, 2014
Letter of Transmittal
Samina Haque
Internship Supervisor
BRAC Business School
BRAC University
66 Mohakhalu, Dhaka-1212
Subject- Submission of Internship Report
Dear Madam,
With great pleasure I am submitting the report on ‘Feasibility of Textile sector in Capital
Market’ that you have assigned me as an important requirement of BUS400 course. This course
has really helped me in accessing new knowledge that is interesting and beneficial. I have tried
my level best to prepare an effective and creditable report.
I have tried my best to follow your guidelines in every aspect of planning and preparing the
report. I wanted to collect what I believe to be most important information to make this report as
specific & coherent as possible. Here I have gathered information based on different sources
such as observation, job task, interviews and World Wide Web.
I honestly hope that my analysis, findings and opinion will give you real idea about Feasibility of
Textile sector in Capital Market.
I welcome your entire query and take pride to answer them
Thank you
Sincerely
……………………
Md. Mozammal Hossain
ID: 09304028

4
ACKNOWLEDGEMENT
All praise to Allah the almighty and the merciful. Without his blessing and endorsement this
report would not have been accomplished.
The successful completion of this report might never be possible in time without the help of
some person whose inspiration and suggestion made it happen. First of all, I wish to express my
sincere gratitude to my internship supervisor Samina Haque for her continuous support and
guidance while preparing this report. I am highly acknowledged for her insightful guidance and
continuous cooperation.
I am really thankful to Md. Shiful Islam, Manager and Salim Afzal Shawon, Assistant Manager
of IDLC Investments Ltd for providing me with all the necessary information to facilitate my
overall understanding of this project.
Furthermore, I want to thank all the concerning officials of the organization for furnishing me
with all the vital information and advice. I am heartily apologizing of any omitted name whose
contribution was also complimentary for any possible aspect. Without them this project would
have been very difficult.
I would also give thanks to my parents and some friends who kept supporting me on this long
process and it will be my utter pleasure if I can offer my gratitude for them.

5
IDLC Finance Limited is the leading non banking financial institution that started its journey in
1985 as pioneer in lease financing. Gradually during last 25 years of operations they provided the
Bangladeshi corporate and retail customers in various forms of financial services which are new
in kind in Bangladesh. At the moment they offer financial services under four divisions. Firstly,
Personal Division that offers deposit schemes, home loan, car loan, personal loan etc. Secondly,
SME Division which provides lease, term loan, factoring facilities to small and medium sized
enterprises in Bangladesh. Thirdly, Corporate Division which provides wide range of services to
large corporations of Bangladesh such as lease financing, sale and lease back, term loan, project
financing and many more. And the fourth division of IDLC Finance Limited is Capital Markets
Division. Under this division IDLC offers to its client merchant banking and brokerage services
of all sorts. The operations of this division are conducted through two subsidiaries IDLC
Investment Limited is the subsidiary which provides the merchant banking services. And IDLC
Securities is the subsidiary which provides the securities services.
Executive Summary
Merchant Banking is one of the key capital markets service provided by IDLC Finance Ltd. They
are the first Bangladeshi Financial Institutions to receive merchant banking license in January,
1998. And They Started Merchant Banking operation from 1999. Under the merchant banking
wing the services such as issue management, portfolio management and Corporate Advisory
Services are provided. During 2010 SEC came up with the law which required all the financial
institutions to make the merchant banking operation separate. As per requirement of the
Securities & Exchange Commission (SEC), IDLC formed a separate subsidiary on May 19, 2010
in the name of ‘IDLC Investments Limited’, in order to transfer its existing merchant banking
activities to the newly formed entity. IDLC applied to SEC to transfer the existing merchant
banking license of IDLC Finance Limited to IDLC Investments Limited. Accordingly, IDLC
Investments Limited has started its operations from August 16, 2011 to offer merchant banking
services to both our individual and institutional clients. Lastly this report contains overview of
IDLC finance and investments, job description, findings and analysis, detailed study on textile
sector, recommendation and calculation.
6
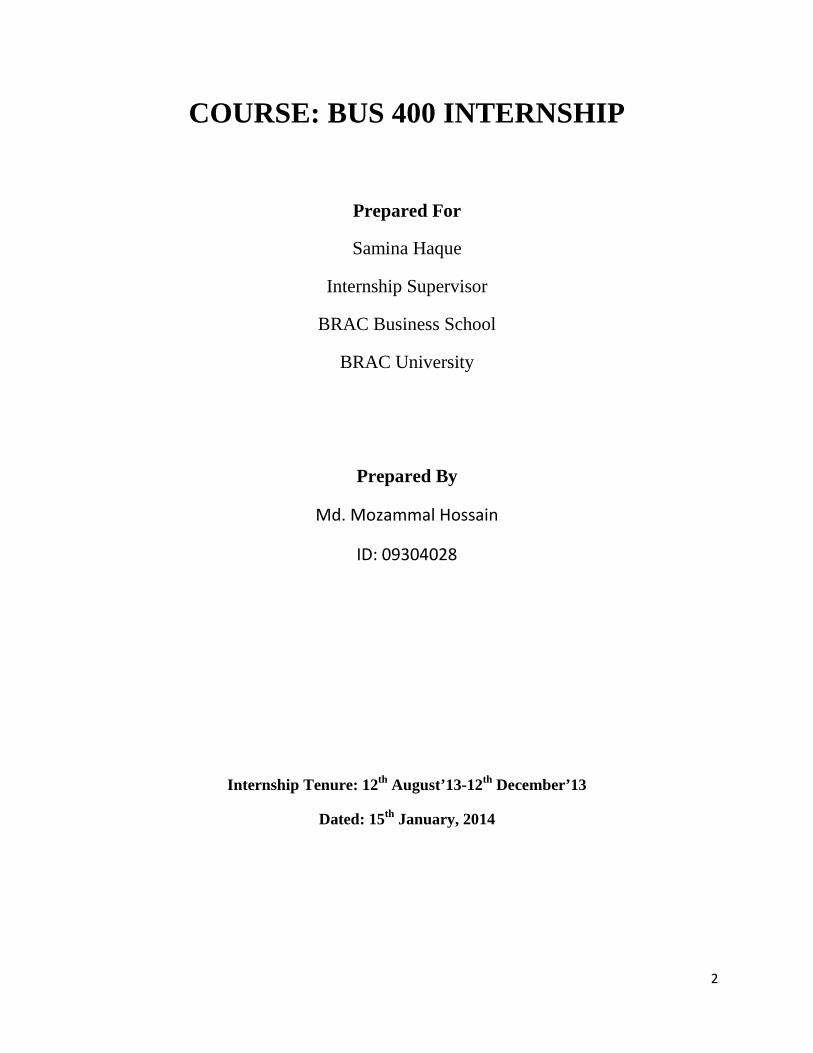
Table of Contents Page No.
1. Introduction
1.1 Overview of the Report 7
1.2 Objectives 7
1.3 Limitations 7
1.4 Methodology 7
2. Overview of IDLC Finance Ltd
2.1 Company profile 8
2.2 IDLC Finance Ltd Vision 8
2.3 IDLC Finance Ltd Mission 9
2.4 IDLC Finance Ltd Corporate Philosophy 9
2.5 IDLC Finance Ltd Strategic Objectives 9
3. Overview of IDLC Investments Ltd 3.1 Company Profile 10
3.2 Departments of IDLC Investments Ltd 10
3.3 Overview of Research Department 11
3.4 Hierarchy of Research Department 11
3.5 Services offered by Research Department 12
4. Job description 13-14
5. Overview of Textile sector of Bangladesh 5.1 Introduction 14
5.2 Company’s in Textile Sector 14-15
5.3 Risk Free Rate 16
5.4 Beta 16
5.5 Risk Premium 16
5.6 CAPM Model 16
6. Analysis of Textile Sector 6.1 Square Textile Ltd 17-19
6.2 Apex Spinning and Knitting Mills Ltd 19-22
6.3 Desh Garments Ltd 22-25
6.4 H.R. Textiles Ltd 25-27
6.5 Rahim Textiles Ltd 27-30
6.6 Stylecraft Ltd 30-32
6.7 Saiham Textiles Ltd 32-35
7. Findings and Analysis 35-36
8. Recommendation 36 9. Conclusion 37
10. Reference 38
11. Appendix 38

7
1.1 Overview of the report: This report is about the activities of research department of IDLC
Investments and detailed overview of textile sector in capital market. In this report the entire
activities of research department of IDLC Investments has been illustrated. The report
provides detailed description of textile sector. And lastly provide few recommendations
which may help research department to develop further.
1. Introduction
1.2 Objectives:
• To Provide Detailed Description of IDLC Investments Research Department
Activities.
• To Provide Detailed Description of Textile Sector in Capital Market.
• To provide Detailed Financial Analysis of Textile companies.
• To Identify Feasibility of Textile sector in Capital Market
• To Provide Recommendation which may help Capital Market Investor to Invest in
Textile Sector.
1.3 Limitations:
• Due to Confidentiality Important are missing which could make the report more
meaningful.
• Dividend Discount Model Does Not Always Provide Right Investment Decision.
• Resource Constraints.
1.4 Methodology:
• Information Used for preparing this Report is collected from IDLC Finance Ltd’s
Website and Annual Reports from IDLC Investments Research Departments Archive.
• Therefore, The Source of Information for this Report is both Primary and Secondary.
• The Financial Analysis Part is Self Generated.
• Websites of Different Company and Organization.

8
2. Overview of IDLC Finance Limited
2.1 Company Profile: IDLC Finance Limited Commenced its Journey in 1985 as The First
Leasing Company of the Country. In 1995, IDLC was licensed as a Financial Institution by the
Country’s Central Bank following the enactment of Financial Institution Act 1993.Over The Last
Two and a Half Decades IDLC Has grown in tandem with the country’s transition into a
developing country and emerged as Bangladesh’s leading multiproduct Financial Institutions. In
august 2007 it has changed its name to IDLC Finance Ltd from Industrial Development Leasing
Company of Bangladesh Ltd.
Since 1985, IDLC was the pioneer and Market Leader in Leasing Services. And The Company
Was Always regarded as an innovative financial solution provider. Now IDLC is able to offer its
customers integrated and customized financial solutions. The Company’s products and services
ranges from home loans, car loans, corporate and SME lease and term loan, structured finance
services ranging from capital restructuring and a complete suite of merchant banking and capital
market services.
IDLC Finance was established with the collaboration of reputed international development
agencies such as:
• Korean Development Leasing Corporation (KDLC), South Korea.
• Kookmin Bank, South Korea.
• International Finance Corporation (IFC)
• Aga Khan Fund for Economic Development (AKFED)
• German Investment and Development Company (DEG)
The primary goal of IDLC was to help modernize the financial services industry by
introducing modern modes of financing. And IDLC did it by pioneering the launch of a
multitude of financial products and services.
2.2 IDLC Finance Ltd’s Vision: “We will be the best financial brand in the country.”
9
2.3 IDLC Finance Ltd’s Mission: “We will focus on quality growth, superior customer
experience and sustainable business practices.”
2.4 IDLC Finance Ltd’s Corporate Philosophy: “Discharge IDLC’s functions with proper
accountability for actions and results and bind ourselves to the highest ethical standards.”
2.5 IDLC Finance Ltd’s Strategic Objectives:
• Grow and develop our talent pool
• Fully leverage new core banking platform
• Optimize distribution points
• Grow and Diversify funding sources
• Grow Sales and Service Capabilities in Consumer Division
• Aggressively grow SME Portfolio.
• Focus on top tier clients in corporate
• Consolidate capital market operations and enhance capabilities.
• Embrace internationally accepted corporate governance and sustainable business
practices.

10
3. Overview of IDLC Investments Ltd
3.1 Company Profile: As per requirement of the Securities & Exchange Commission (SEC),
IDLC formed a separate subsidiary on May 19, 2010 in the name of IDLC Investments Ltd in
order to transfer its existing merchant banking activities to the newly formed entity. IDLC
applied to SEC to transfer the existing Merchant Banking License of IDLC Finance Ltd to IDLC
Investments Ltd. Accordingly IDLC Investments Ltd has started its operation from august 16,
2011 to offer merchant banking services to both our individual and institutional clients.
3.2 Departments of IDLC Investments Ltd: Departments of IDLC Investments are as follows
11
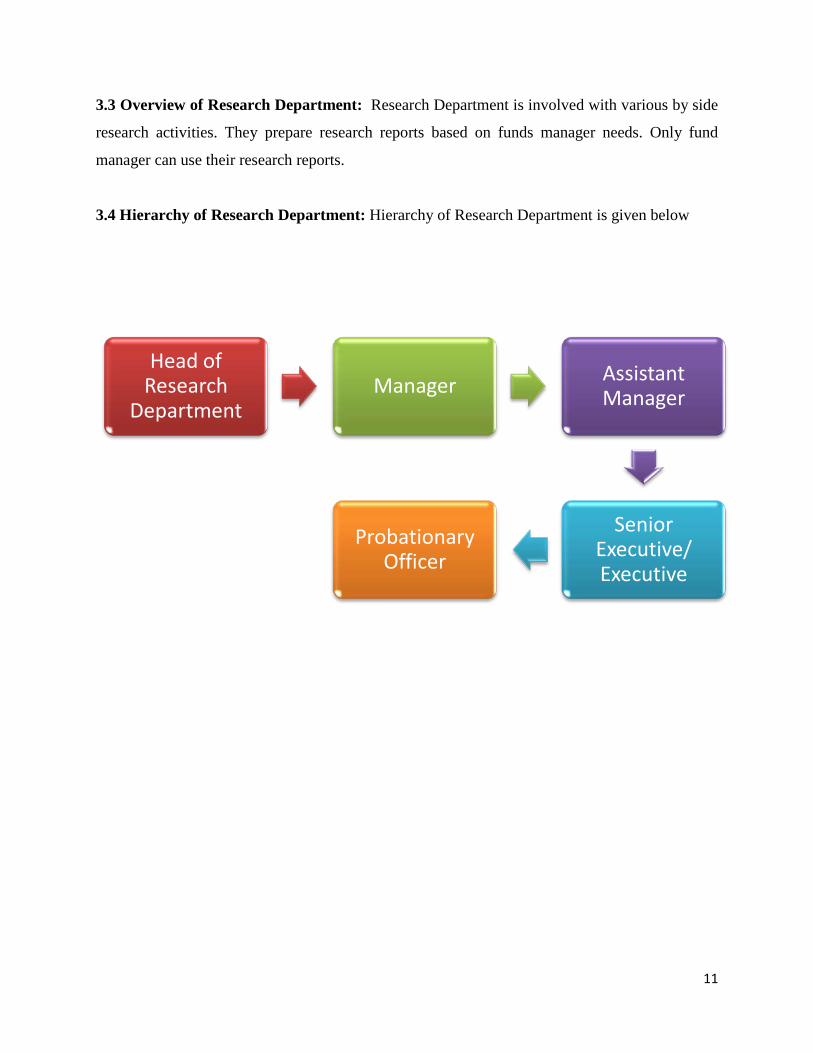
3.3 Overview of Research Department: Research Department is involved with various by side
research activities. They prepare research reports based on funds manager needs. Only fund
manager can use their research reports.
3.4 Hierarchy of Research Department: Hierarchy of Research Department is given below
Head of Research
DepartmentManager Assistant
Manager
Senior Executive/ Executive
Probationary Officer

12
3.5 Services offered by Research Department: Products and Services offered by IDLC
Investments Ltd are as follows
In Company Coverage Selected Company of a particular section has been taken for analysis.
Analysis has been done based on various methods. Secondly In Sector Coverage Analysis has
been done for selected sectors like Non Life Insurance, Pharmaceuticals, Banks, Non Banking
Financial Institution, Cement etc. Thirdly In Economic Coverage Analyst try to compare a
particular sector considering various factors like inflation, GDP growth, opportunities & threats
etc. Lastly Market Commentary is prepared everyday for investors and uploaded t into IDLC’s
official website. In preparation of this report various factors is considered which may have
impact on capital market. Beside this Shiful Islam, Manager (Research) is covering Non Life
Insurance and Fuel & Power Sector, Salim Afzal Shawon, Assistant Manager (Research) is
covering Bank, Non Banking Financial Institution & Pharmaceuticals Sector, Itrat Hossain,
Executive (Research) is covering Textile Sector and Daily Commentary Part, Arman Chowdhury
Nayan, Executive (Research) is covering Cement Sector.
Company Coverage
Sector Coverage
Economic Coverage
Market Commentry

13
I did my internship in Research department of IDLC Investments Ltd. Mr. Salim Afzal Shawon,
Assistant Manager was my on site supervisor. I was assigned with several tasks based on my
supervisor needs and other team member’s needs. I did following tasks for my supervisor
4. Job Description:
Project on Pharmaceuticals Sector.
Project on Banks and Non Banking Financial Institutions.
Project on Eastern Bank Ltd.
Prepare report on Bank’s Margin Loan.
Project on Square Pharmaceuticals.
Project on Bank Asia, BRAC Bank and South East Bank Ltd.
Project on Pioneer Insurance, City General Insurance and Northern Insurance Ltd.
Business Database update
Bank input data (No. of employees and credit rating)
Project on Square group.
Secondly I was assigned for following tasks by Md. Shiful Islam, Manager, and Research
Department:
Project on Non Life Insurance Company.
Prepare IPO Database.
Project on Bengal Windsor Ltd.
Project on Aftab Automobiles.
Thirdly I was assigned for following tasks by Itrat Hossain, Executive, and Research
Department:
Project on Textile Sector .
Lastly I was assigned for following tasks by Arman Chowdhury Nayan, Executive, and Research
Department

14
Project on Premier Power Generation Ltd.
Project on National Cement Mills Ltd.
Beside this I was assigned for management of annual report archive and categorization of
quarterly statements as per my respective department’s requirements.
5. Overview of Textile Sector of Bangladesh
5.1 Introduction: The Textile and Clothing Industries provide the single source of economic
growth in Bangladesh’s rapidly developing economy. In our country 40% industrial value
addition comes from Textile Industry. Textile industry provides 5 million jobs of which 80% are
women. In our Country over 81% of the export earning comes from textile and textile related
products. Bangladesh is the second largest apparel exporter of western countries. Sixty percent of
the export contracts of western brands are with European buyers and about sixty percent with
American buyers. Only 5 % of textile factories are owned by foreign investors with most of the
production being controlled by local investors. Structure of Textile Industry of Bangladesh is
given below
Particulars No of Mills
Yarn Manufacturing 373
Fabric Manufacturing 703
Dyeing, Printing and Finishing 203
Total 1306
5.2 Company’s in Textile Sector: Name of company’s listed under textile sector in DSE and
CSE are given below:
Ticker Company Name
ASHRAFTEX ASHRAF TEXTILE MILLS LTD
DELTASPINN DELTA SPINNERS LTD

15
ALLTEX ALLTEX INDUSTRIES LTD
ANLIMAYARN ANLIMA YEARN DYEING LTD
HRTEX H.R. TEXTILE MILLS LIMITED
SQUARETEXT SQUARE TEXTILES LTD
MALEKSPIN MALEK SPINNING MILLS LTD
DSHGARME DESH GARMENTS LIMITED
APEXSPINN APEX SPINNING & KNITTING MILLS LIMITED
PRIMETEX PRIME TEXTILE SPINNING MILLS LTD
DACCADYE THE DACCA DYEING & MANUFACTURING CO.LTD
METROSPIN METRO SPINNING LTD
SAIHAMTEX SAIHAM TEXTILE MILLS LTD
DULAMIACOT DULAMIA COTTON SPINNING MILLS LIMITED
RAHIMTEXT RAHIM TEXTILE MILLS LTD
MODERNDYE MODERN DYEING & SCREEN PRINTING LTD
CMCKAMAL CMC KAMAL TEXTILE MILLS LTD
TALLUSPIN TALLU SPINNING MILLS LIMITED
MITHUNKNIT MITHUN KNITTING AND DYEING ) LTD
SAFKOSPINN SAFKO SPINNING MILLS LTD
STYLECRAFT STYLECRAFT LIMITED
MAKSONSPIN MAKSONS SPINNING MILLS LIMITED
AL-HAJTEX AL-HAJ TEXTILE
RNSPIN R.N. SPINNING MILLS LIMITED
ZAHINTEX ZAHINTEX INDUSTRIES LIMITED
SAIHAMCOT Saiham Cotton Mills Limited
GENNEXT GENERATION NEXT FASHIONS LIMITED
ENVOYTEX ENVOY TEXTILES LIMITED
ARGONDENIM ARGON DENIMS LIMITED
FAMILYTEX FAMILYTEX (BD) LIMITED
PTL Paramount Textile Limited
Currently there are thirty one company listed in capital market. Source: StockBangladesh.com

16
5.3 Risk free rate: Risk free rate is the compensation that would be demanded by a
representative investor holding a representative market portfolio. I have considered 182 days t-
bill rate which is 8.14% as risk free rate. For every calculation, we will use 8.14% as risk free
rate.
5.4 Beta: Beta is a measure of the volatility or systematic risk of a security or a portfolio in
comparison to the market as a whole. Beta is used in the capital asset pricing model (CAPM), a
model that calculates the expected return of an asset based on its beta and expected returns. We
have found beta as follows:
Serial No: Company Name Beta
1. Square Textiles Ltd 0.9713
2. 0.6808 APEX SPINNING & KNITTING MILLS LIMITED
3. Desh Garments Limited 0.8668
4. H.R. Textiles Mills Ltd 1.12
5. Rahim Textile Mills Ltd 0.5736
6. Stylecraft Ltd 0.2664
7. Saiham Textile Mills Ltd 1.20
5.5 Risk Premium: A risk premium is the minimum amount of money by which the expected
return on a risky asset must exceed the known return on a risk-free asset.
5.6 CAPM Model: CAPM says that the expected return of a security or a portfolio equals the
rate on a risk free security plus a risk premium. If this expected return does not meet or beat the
required return then the investment should not be undertaken.

17
6. Analysis of Textile Sector
6.1 Square Textiles Ltd: Square Textile is a subsidiary company of Square Group. The
Company was incorporated as a public limited company in the year of 1994. . The operation was
started in 1997. It was enlisted in Dhaka Stock Exchange & Chittagong Stock Exchange in 2002.
Within a very short time of span the company achieved some significance success. Square
Textile receives Oeko-Tex standard 100 and ISO-9002 certificates in the year 2000.
Following formula will be used to find out the required rate of return of Square Textiles Ltd
Ke= Rf+ (Rm-Rf)*β
In this Formula,
Ke= required rate of return=10.38%
Rm= Return from market = November ′13−June ′13June ′13
=4230.72−3830.263830.26
=.1045=10.45%
RF= Risk free rate=.0814=8.14%
Β= Beta=0.9713
So, Ke = Rf+ (Rm-Rf)*β
=.0814+ (.1045-.0814)*0.9713 [By Replacing Value]
=.1038
=10.38%
Present value of Common stock:
Following Formula will be used to calculate present value of common stock

18
Po =Do (1+g)𝐾𝐾𝐾𝐾−𝑔𝑔
Here,
Cs= Present value of common stock=?
Do = Last Year Dividend 1.33Tk per Share
Ke= required rate of return=.1038or 10.38%
g= Growth rate= 10%
Square
Textiles Ltd
2008 2009 2010 2011 2012
Dividend
Paid
98583425 105876079 112934485 109744384 155849589
# Shares
Outstanding
58820044 70584053 81171661 97405993 116887192
Dividend Per
Year
1.68 1.50 1.39 1.13 1.33
Fv= Dividend paid in 2012 =1.33 tk/per share
PV = Dividend paid in 2008=1.68 tk/per share
Now,
Po =Do (1+g)𝐾𝐾𝐾𝐾−𝑔𝑔
=1.33(1+.10).1038−.10
= 385 taka
19
Assumption and Observation: Square Textile announced dividend in last 5 years. But the
amount of dividend reduces every year except in 2012. However, the dividend decreased, but it
decreased in a marginal amount. Increasing number of shares is one of the reasons behind lower
amount of dividend compared to that of previous years. The company increased the number of
shares for strengthening their paid up capital and expanding the business. The paid up capital
became twice in the last five years through bonus issuance. On the other hand, the company also
provided dividend to their shareholders. It was only possible for doing flourishing businesses in
the industry. As a result in 2012, the company offered 17% more dividend in per share compared
to that of previous year. But for conservative approach, I am assuming that dividend amount will
increase by 10% in next year. So I have considered growth rate= 10%.
Decision: Current market price of square textile is 91. On the other hand calculated intrinsic
value is 385 which are undervalued. If we consider 9% growth, the intrinsic value becomes
106.01 taka which is also higher than the market value. So I recommend investor to buy this
stock.
6.2 Apex Spinning & Knitting Mills Ltd: Apex Spinning and Knitting Mills Limited
(ASKML) was incorporated in 1990 as a public limited company and listed with our national
stock exchanges, which are Dhaka Stock Exchange, and Chittagong Stock Exchange. The
company was initially formed for processing and export of knit garments, however subsequently,
state of the art plant and equipment was added for handling all kinds of knitted fabrics and now
ASKML is a leading manufacturer and exporter of all kinds of textiles knitted garments. The
products of the Company include Pique Polo-shirts, Jersey Polo-shirts, Bubble knit Polo-shirts,
Golf shirts, Sweat shirts, Hooded Sweat shirts, Polo shirts, Sweat Pants, Basic Tee-shirts, Track
suits, Tank Tops, Big Tee-shirts, Heavy Tee-shirts, Jogging Suits, Turtle Neck Tee-shirts,
Jackets, Underwear, Children wear, men wear, babies wear etc.
Following formula will be used to find out the required rate of return of Apex Spinning &
Knitting Mills Ltd
Ke= Rf+ (Rm-Rf)*β
20
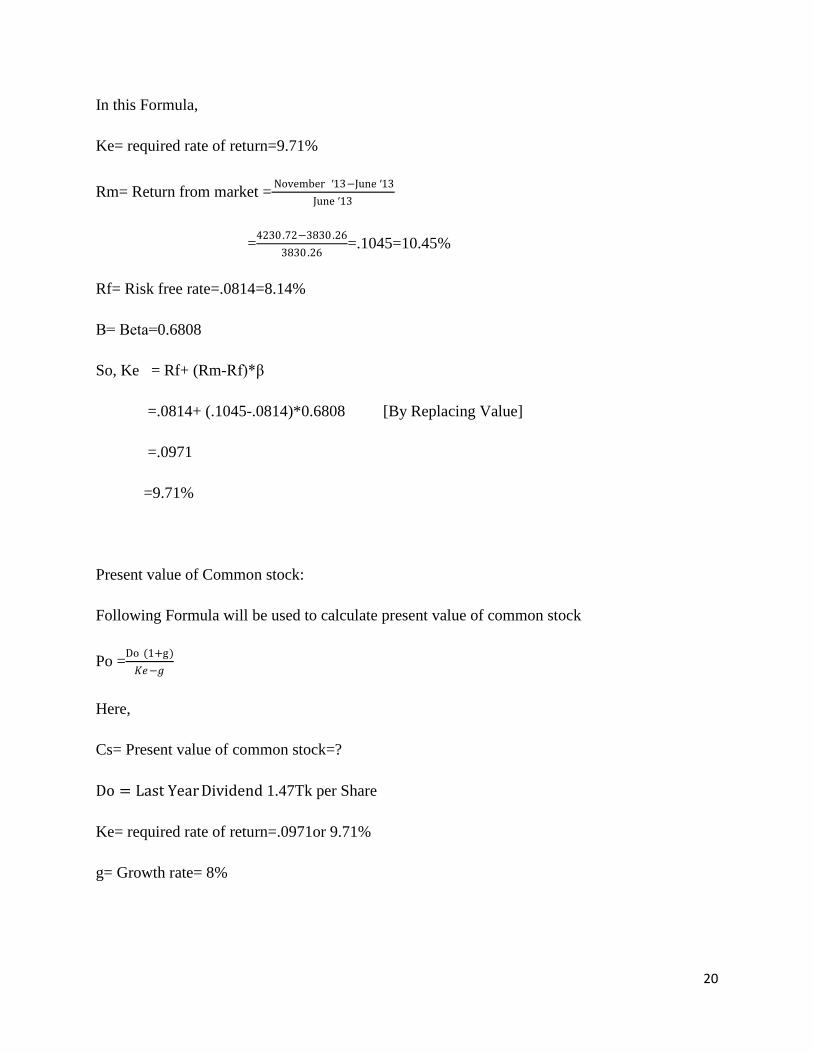
In this Formula,
Ke= required rate of return=9.71%
Rm= Return from market = November ′13−June ′13June ′13
=4230.72−3830.263830.26
=.1045=10.45%
Rf= Risk free rate=.0814=8.14%
Β= Beta=0.6808
So, Ke = Rf+ (Rm-Rf)*β
=.0814+ (.1045-.0814)*0.6808 [By Replacing Value]
=.0971
=9.71%
Present value of Common stock:
Following Formula will be used to calculate present value of common stock
Po =Do (1+g)𝐾𝐾𝐾𝐾−𝑔𝑔
Here,
Cs= Present value of common stock=?
Do = Last Year Dividend 1.47Tk per Share
Ke= required rate of return=.0971or 9.71%
g= Growth rate= 8%

21
Apex Spinning &
Knitting Mills
Ltd
2008 2009 2010 2011 2012
Dividend Paid
23450860 8763310 20178799 12083214 12327769
# Shares
Outstanding
8400000 8400000 8400000 8400000 8400000
Dividend Per
Year
2.79 1.04 2.40 1.43 1.47
Fv= Dividend paid in 2012 =1.47tk/per share
PV = Dividend paid in 2008=2.79tk/per share
Now,
Assume, growth rate
8%
Assume, growth rate
7%
Assume, growth rate 6% Assume, growth rate
5%
Po =Do (1+g)𝐾𝐾𝐾𝐾−𝑔𝑔
=1.47(1+.08).0971−.08
= 92.84taka
Po =Do (1+g)𝐾𝐾𝐾𝐾−𝑔𝑔
=1.47(1+.07).0971−.07
= 58.04taka
Po =Do (1+g)𝐾𝐾𝐾𝐾−𝑔𝑔
=1.47(1+.06).0971−.06
= 42taka
Po =Do (1+g)𝐾𝐾𝐾𝐾−𝑔𝑔
=1.47(1+.05).0971−.05
= 32.77taka
Assumption and observation: The Company is not doing business on a consistent basis. The
dividend rewarded to the shareholder is an evidence of it. Their paid up capital remained same
during the last five years. It reflects a more debt base financing. In 2012, the company paid
dividend 2% more than that of previous year. In this scenario, it is quite optimistic to hold a
growth rate 4%. Current market price of apex spinning and knitting mills ltd is 70.9 taka. If we

22
consider 8% growth rate, then it exceeds the current market price which is not realistic at all
considering the fundamentals of this company. Except this 8% growth rate, all other assumptions
are giving intrinsic values which are lowered than the market price.
Decision: Therefore, from my observation, it is extremely overvalued and my suggestion would
be not to buy this stock.
6.3 Desh Garments Limited: Desh Garments Ltd. (established 27th December 1977) was the
first export oriented ready-made garment industry in Bangladesh. It was set-up in joint venture
with Daewoo of South Korea. At its time of inception, Desh was the single largest and most
modern garment-manufacturing unit in the sub-continent. The import and introduction of
garments technology itself is credited to Desh Garments Ltd. In 1978, Desh Garments sent 130
workers and management trainees to be trained at Daewoo's state-of-the-art garment factories in
South Korea. The 130 Desh-selected trainees returned home after a six-month training period to
form the nucleus of the Ready Made Garment sector's technology and its core human resource
base. Desh Garment is seen as having given re-birth to the garments industry. It is a unique
example of a company establishing an industry and against all odds. Despite severe national
foreign exchange constraints and bureaucratic obstacles Desh became a very successful and
competitive producer in the international market.
Following formula will be used to find out the required rate of return of Desh Garments
Limited
Ke= Rf+ (Rm-Rf)*β
In this Formula,
Ke= required rate of return=10.14%
Rm= Return from market = November ′13−June ′13June ′13
=4230.72−3830.263830.26
=.1045=10.45%
Rf= Risk free rate=.0814=8.14%
23
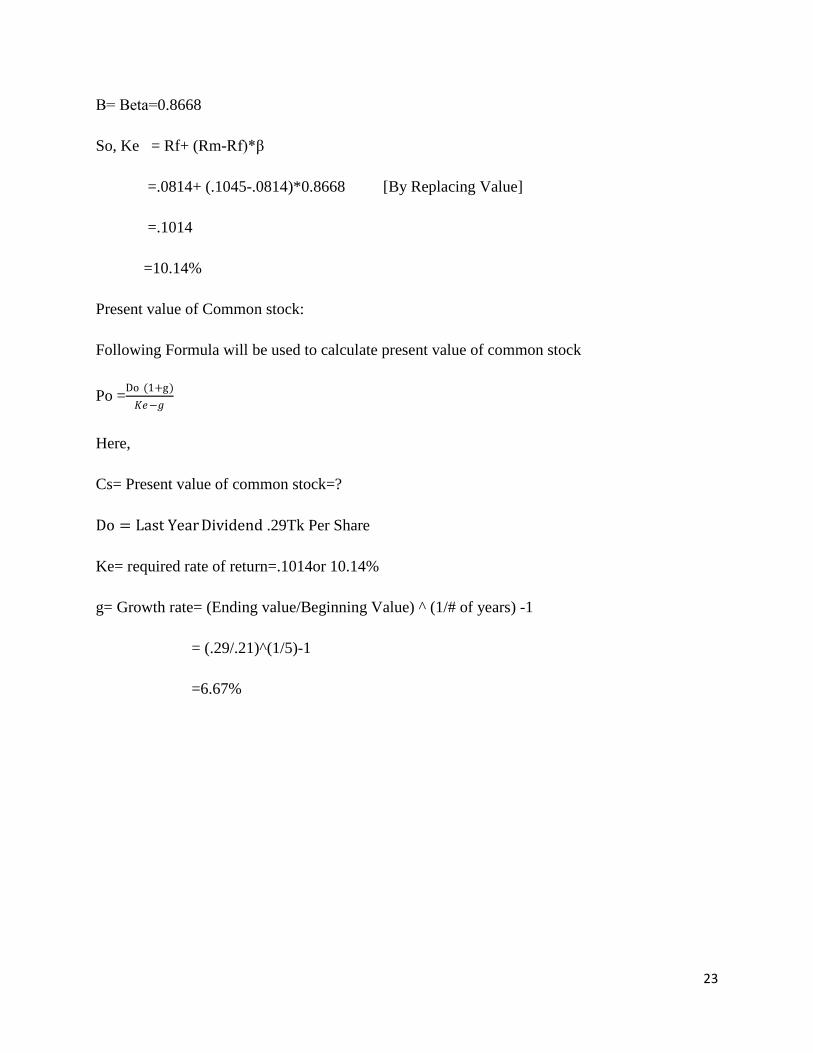
Β= Beta=0.8668
So, Ke = Rf+ (Rm-Rf)*β
=.0814+ (.1045-.0814)*0.8668 [By Replacing Value]
=.1014
=10.14%
Present value of Common stock:
Following Formula will be used to calculate present value of common stock
Po =Do (1+g)𝐾𝐾𝐾𝐾−𝑔𝑔
Here,
Cs= Present value of common stock=?
Do = Last Year Dividend .29Tk Per Share
Ke= required rate of return=.1014or 10.14%
g= Growth rate= (Ending value/Beginning Value) ^ (1/# of years) -1
= (.29/.21)^(1/5)-1
=6.67%

24
Now,
Po =D(1+g)𝐾𝐾𝐾𝐾−𝑔𝑔
= .29(1+.08).1014−.0667
= 9.03 taka
Again,
If we consider the growth rate 9%, then we get
Po =D(1+g)𝐾𝐾𝐾𝐾−𝑔𝑔
=.29(1+.08).1014−.09
= 27.47 taka
Assumption and observation: The Company paid dividend during the last five years. Except in
2010, the amount paid in dividend holds a constant growth. In 2012, the company paid dividend
more than that of the previous years. We are assuming that in 2013, the investors are going to get
dividend again. For calculating the growth rate, we take the cumulative average growth rate and
we obtain the growth rate 6.67%. Holding this growth rate, we find the intrinsic value 9.03 taka.
Desh Garments
Limited
2008 2009 2010 2011 2012
Dividend Paid
706800 706800 565440 706800 989520
# Shares
Outstanding
3370000 3370000 3370000 3370000 3370000
Dividend Per
Year
.21 .21 .18 .21 .29

25
The market value is 61.6 taka. So if we hold this growth rate, the stock is highly overvalued.
Again, if we reflect on all positive things for the company and assume the growth rate 9%, we
get the intrinsic value 27.47 taka which is also very lower than the market value.
Decision: So we can easily say that the stock is highly overvalued. In this regard, I would like to
suggest investors to not hold this stock.
6.4 H.R. Textiles Mills Ltd: This is a public limited company incorporated in Bangladesh under
the Companies Act 1913 on 3 December 1984 under the entrepreneurship of the Pride Group.
The company owns textile mills and its principal activities are knitting, processing and finishing
of textile products and making garments. The production capacity for the current year is 28 lac
Pcs for Finished Garments and 1980 MTs for Knit Fabrics.
Following formula will be used to find out the required rate of return of H.R. Textiles Mills Ltd
Ke= Rf+ (Rm-Rf)*β
In this Formula,
Ke= required rate of return=10.72%
Rm= Return from market = November ′13−June ′13June ′13
=4230.72−3830.263830.26
=.1045=10.45%
RF= Risk free rate=.0814=8.14%
Β= Beta=1.12
So, Ke = Rf+ (Rm-Rf)*β
=.0814+ (.1045-.0814)*1.12 [By Replacing Value]
=.1072
=10.72%

26
Present value of Common stock:
Following Formula will be used to calculate present value of common stock
Po =Do (1+g)𝐾𝐾𝐾𝐾−𝑔𝑔
Here,
Cs= Present value of common stock=?
Do = Last Year Dividend .22Tk Per Share
Ke= required rate of return=.1072or 10.72%
g= Growth rate= 8%
H.R. Textiles
Mills Ltd
2008 2009 2010 2011 2012
Dividend Paid
13246711 13246711 10076831 8071735 5716390
# Shares
Outstanding
20000000 20000000 20000000 22000000 25300000
Dividend Per
Year
.66 .66 .50 .37 .22
Fv= Dividend paid in 2012 =.22 tk/per share
Pv = Dividend paid in 2008=.66tk/per share
Assume, growth rate 10% Assume, growth rate 9% Assume, growth rate 8%
Po =Do (1+g)𝐾𝐾𝐾𝐾−𝑔𝑔
=.22(1+.10).1072−.10
= 33.61 taka
Po =Do (1+g)𝐾𝐾𝐾𝐾−𝑔𝑔
=.22(1+.09).1072−.09
= 13.94 taka
Po =Do (1+g)𝐾𝐾𝐾𝐾−𝑔𝑔
=.22(1+.08).1072−.08
= 8.73 taka

27
Assumption and observation: In 2008 and 2009, the company paid dividend .66 taka per share.
However, there was no growth but they hold a consistency. But in 2010, the company failed to
keep the consistency and reduced the amount compared to that of previous years. The same
incidents also happen in 2011 & 2012. In this scenario, it is very unlikely to predict a steady
growth rate. However I’ve taken 10%, 9% and 8% growth and get the value less than the market
price. The current market price of the stock is 41.5 taka. So the current market price is
overvalued compared to the intrinsic value which is calculated by assuming maximum growth
rate.
Decision: Therefore, I would like to suggest investors not to hold this stock.
6.5 Rahim Textile Mills Ltd: Rahim textile mills Ltd, a Public Limited Company has been
envisaged by a group of dynamic entrepreneurs who have been immense contribution to
development of the textile sector of Bangladesh. The sponsors have a very long history in
industrial management with the earlier generation starting in Bombay in the early 20th century.
Later on Moved to Bangladesh in 1974. The Company was incorporated in Bangladesh on
November 02, 1989 as Private Limited Company. Subsequently the company was converted into
a Public Limited Company on September 14, 2008 under the Companies Act 1994. The existing
project is located at Shafipur, Kaliakoir, and Gazipur and started its commercial operation on
January 01, 1991. Presently the project has in total 63,624 spindles with daily production
capacity of 32 tons of Combed and Carded Cotton Yarn. MSML is a deemed exporter and
majority of its goods are supplied to Knit industries for export.
Following formula will be used to find out the required rate of return of Rahim Textile Mills
Ltd
Ke= Rf+ (Rm-Rf)*β
In this Formula,
Ke= required rate of return=9.46%
28
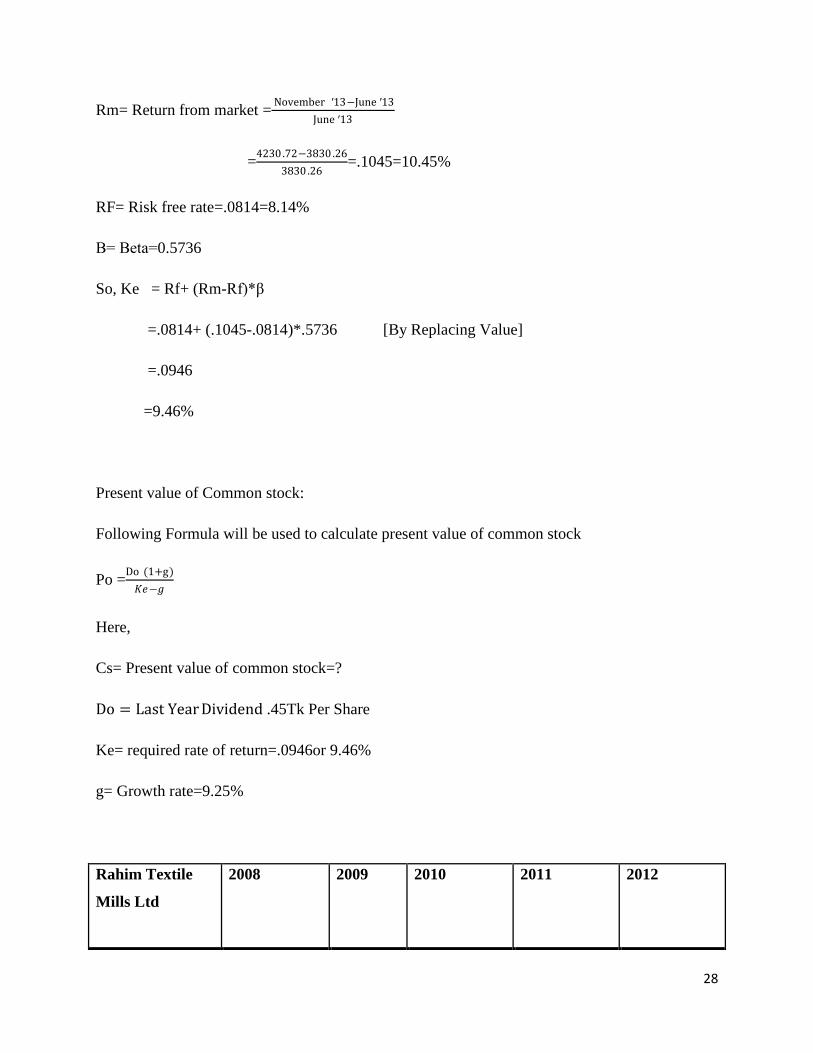
Rm= Return from market = November ′13−June ′13June ′13
=4230.72−3830.263830.26
=.1045=10.45%
RF= Risk free rate=.0814=8.14%
Β= Beta=0.5736
So, Ke = Rf+ (Rm-Rf)*β
=.0814+ (.1045-.0814)*.5736 [By Replacing Value]
=.0946
=9.46%
Present value of Common stock:
Following Formula will be used to calculate present value of common stock
Po =Do (1+g)𝐾𝐾𝐾𝐾−𝑔𝑔
Here,
Cs= Present value of common stock=?
Do = Last Year Dividend .45Tk Per Share
Ke= required rate of return=.0946or 9.46%
g= Growth rate=9.25%
Rahim Textile
Mills Ltd
2008 2009 2010 2011 2012

29
Dividend Paid
2511758 2511758 3043836 486576 916475
# Shares
Outstanding
1820000 1820000 1820000 1820000 2002000
Dividend Per
Year
1.38 1.38 1.67 .26 .45
Fv= Dividend paid in 2012 =.45tk/per share
PV = Dividend paid in 2008=1.38tk/per share
Assume growth rate 9% Assume growth rate 9.25%
Po =Do (1+g)𝐾𝐾𝐾𝐾−𝑔𝑔
=.45(1+.09).0946−.09
= 106.63 taka
Po =Do (1+g)𝐾𝐾𝐾𝐾−𝑔𝑔
=.45(1+.0925).0946−.0925
= 234.1071 taka
Assumption and observation: In 2008 and 2009, the company gave the same amount as
dividend. There was not any growth but at least there wasn’t any diminution. In 2010, the
company paid a higher dividend compared to that of previous years. It was increased by almost
20%. But in 2011, the amount decreased by a huge amount. It might have several reasons. The
company could use the profit in different machineries or in other capital expenditure. In 2012,
the company increased their paid up capital as well as provided dividend which was two times
compared to that of previous year. In 2012, amount of dividend increases by 32% compared to
that of previous year. Considering the situation, I’ve made my valuation for the conservative and
risky investors. For conservative investors, I have assumed the growth rate 9% which makes the
stock overvalued in the market. The current market price of the stock is 231.2 taka. On the other
hand, I’ve also assumed a growth rate of 9.25% which makes the stock undervalued.

30
Decision: Considering last two years scenario, I would like to suggest investors to buy this stock
because 9.25% growth is not unachievable for this company.
6.6 Stylecraft Ltd: Stylecraft Limited was incorporated on 25 January 1983 as a private limited
company in Bangladesh. On 1983 it was made into a public limited company as well. Stylecraft
Limited is one of the age-old manufacturers of garments in Bangladesh. In 2011 the company
reached all time high of production of 470431 dozens of garments as compared to 390945
dozens during the year 2009-2010.
Following formula will be used to find out the required rate of return of Stylecraft Ltd
Ke= Rf+ (Rm-Rf)*β
In this Formula,
Ke= required rate of return=8.75%
Rm= Return from market = November ′13−June ′13June ′13
=4230.72−3830.263830.26
=.1045=10.45%
RF= Risk free rate=.0814=8.14%
Β= Beta=0.2664
So, Ke = Rf+ (Rm-Rf)*β
=.0814+ (.1045-.0814)*0.2664 [By Replacing Value]
=.0875
=8.75%

31
Present value of Common stock:
Following Formula will be used to calculate present value of common stock
Po =Do (1+g)𝐾𝐾𝐾𝐾−𝑔𝑔
Here,
Cs= Present value of common stock=?
Do = Last Year Dividend 3.82 Tk per Share
Ke= required rate of return=.0875or 8.75%
g= Growth rate=8%
Stylecraft Ltd 2008 2009 2010 2011 2012
Dividend Paid
1382051 1628178 1629345 1634880 2104880
# Shares
Outstanding
550000 550000 550000 550000 550000
Dividend Per
Year
2.51 2.96 2.96 2.97 3.82
Now,
FV=PV(1+g)^n
3.82=2.51(1+g)^5
(1+g)^5=3.82/2.51
g= .087622 or 8.76%
We’ll take 8% as growth rate.

32
Now,
Assume growth rate 8% Assume growth rate 6% Assume growth rate 4%
Po =D(1+g)𝐾𝐾𝐾𝐾−𝑔𝑔
=3.82(1+.08).0875−.08
= 550.08 taka
Po =D(1+g)𝐾𝐾𝐾𝐾−𝑔𝑔
=3.82(1+.06).0875−.06
= 83.63 taka
Po =D(1+g)𝐾𝐾𝐾𝐾−𝑔𝑔
=3.82(1+.04).0875−.0
= 147.24 taka
Assumption and observation: During 2008 to 2012, the company paid dividend on a consistent
basis. Prior to 2012, the amount increased in a marginal rate. But in 2012, it improved in a huge
amount. For getting the growth rate, we’ve convert the future values into present values. We got
the growth rate 8.76%. Assuming growth rate 8%, we are getting the intrinsic value of 550.08
taka. If we assume the worst scenario, at least a growth of 4%, we get the intrinsic value of
147.24 taka. The current market price of Stylecraft is 41.5 taka. So it is undervalued in market
considering the growth rate 4%. Considering the scenario of this company, it is absolutely
achievable to maintain a growth rate of 4%.
Decision: So I would like to suggest investors to buy this stock.
6.7 Saiham Textile Mills Ltd: This modern composite Textile Mill was established in 1982
with New Japanese machineries with a capacity of producing 7 million yards of finished fabrics
per year. In 1992 a modern Yarn Spinning Unit with 30,000 spindles equipped with Japanese
machinery was added in the Textile Unit. This mill produces cotton and polyester yarns for
domestic and export market. Currently the management of this industrial unit is in a process of
turning the entire Textile Mill into a Yarn-Spinning Mill. To manufacture quality yarns the
management uses lean manufacturing methods, statistical process control, total preventive
maintenance and statistical quality control in their factory production line. This helps to maintain
the high class quality that is demanded by various customers.
Following formula will be used to find out the required rate of return of Saiham Textile Mills
Ltd

33
Ke= Rf+ (Rm-Rf)*β
In this Formula,
Ke= required rate of return=10.91%
Rm= Return from market = November ′13−June ′13June ′13
=4230.72−3830.263830.26
=.1045=10.45%
RF= Risk free rate=.0814=8.14%
Β= Beta= 1.20
So, Ke = Rf+ (Rm-Rf)*β
=.0814+ (.1045-.0814)*1.20 [By Replacing Value]
=.1091
=10.91%
Present value of Common stock:
Following Formula will be used to calculate present value of common stock
Po =Do (1+g)𝐾𝐾𝐾𝐾−𝑔𝑔
Here,
Cs= Present value of common stock=?
Do = Last Year Dividend 1.5Tk Per Share
Ke= required rate of return=.1091or 10.91%
g= Growth rate=?

34
Saiham Textile
Mills Ltd
2008 2009 2010 2011 2012
Dividend Paid
12500000 12500000 12500000 0 37500000
# Shares
Outstanding
12500000 12500000 12500000 25000000 25000000
Dividend Per
Year
1 1 1 0 1.5
Fv= Dividend paid in 2012 =1.5tk/per share
PV = Dividend paid in 2008=1 tk/per share
CAGR=.0845 or 8.45%
Assume growth rate 8.45% Assume growth rate 6% Assume growth rate 4%
Po =Do (1+g)𝐾𝐾𝐾𝐾−𝑔𝑔
=1.5(1+.0845).1091−.0845
= 66.12 taka
Po =Do (1+g)𝐾𝐾𝐾𝐾−𝑔𝑔
=1.5(1+.06).1091−.06
= 32.38 taka
Po =Do (1+g)𝐾𝐾𝐾𝐾−𝑔𝑔
=1.5(1+.04).1091−.04
= 22.79 taka
Assumption and observation: The Company paid the dividend during last five years except in
2011. In 2008, 2009 & 2010, the company provided the same amount. In 2011, the company
didn’t disburse any dividend. Increasing paid up capital might be one of the reason and we got
the result immediately in the next year. The company did the business well in 2012 and rewarded
the shareholder three times dividend in 2012. It means with their increased paid up capital, the
company increased their profit and provided a good amount as dividend to their shareholder. For
calculating the growth rate, we used cumulative average growth rate and we found a growth rate
of 8.45%. Assuming this growth rate, we found the intrinsic value 66.12 taka. The current market
35
price of this stock is 28.5 taka. So if we consider this growth rate, the stock is undervalued. On
the other hand, if we consider the growth rate 6%, we get the intrinsic value 32.38 taka and the
market price also becomes undervalued compared to intrinsic value. Again if we consider 4%,
we obtain an intrinsic value of 22.79 taka and the market price is slightly overvalued compared
to intrinsic value. Now, reflect on the business in 2012, it is very much achievable to maintain a
growth rate of 6 to 8% for the company. The 6-8% growth rate makes the stock undervalued
compared to market price. So I would like to suggest the investors to buy this stock.
Decision: Current market price of Saiham textile is 28.5 taka. On the other hand calculated
intrinsic value is 66.12 taka which is undervalued. So I recommend to buy this stock.
7. Findings and Analysis
Findings and Analysis of analysis part are given below
In 2012 Square Textile increased the number of shares for strengthening their paid up
capital and expanding business.
Square Textile paid up capital became twice in the last five years through bonus issuance.
Apex Spinning paid up capital remain same during the last five years which reflects
more debt base financing.
In 2012 Desh Garments paid more dividend compared to previous year which is
promising to shareholders.
HR Textile declares dividend to the shareholders consistently but there is no growth.
In 2011 Rahim Textile dividend decreased by huge amount. It might have several reasons
such as the company could use the profit in different machineries or in other capital
expenditure.
In 2012 Rahim Textile increased their paid up capital as well as provided dividend which
is two times higher compared to previous year.
In 2012 Stylecraft’s dividend amount increased in a marginal rate.

36
In 2012 Saiham Textile increased their profit and provided a good amount of dividend to
their Shareholder
IDLC’s Research coverage includes but not limited to listed companies, sector and economy of
Bangladesh. Our qualified and dedicated professionals provide insightful opinion regarding
different covered areas to facilitate your investment decision. Our footprint reached at global
village through information hubs like Bloomberg along with frequent publications in local
media. Recommendations for Analysis part are given below
8. Recommendation
Investors should focus on company fundamentals rather than market trends. Company
fundamentals are as follows
Total Sales
Earnings Per Share
Net Asset Value
Net Profit
Net Profit Margin and so on.
Investors should also analysis macroeconomic environment before buying any textile
company’s share. Macroeconomic environment consists of
Political Factors
Relationship with foreign buyers
Relationship between labor and owner and so on
Investors should also focus on price sensitive information for buying any textile
company’s share. Price sensitive information might be:
Purchase new assets
Increase paid up capital and so on

37
IDLC Finance Ltd operates its capital market operation via to subsidiaries. One is IDLC
Investments ltd. Which look after IDLC’s merchant banking operation such as issue
management, portfolio management, Research, Finance and Control, Settlement etc. The Capital
Markets operation of IDLC Finance Ltd was offered since 1999 but its activities started
increasing gradually during 2007 onwards. And by 2010 this division became the most dominant
contributor to the revenue and profit of entire IDLC Finance Ltd. And Now IDLC is determined
to improve these services further in order to strengthen their position in capital markets and
contribute heavily in making this market efficient in near future. Moreover I have applied CAPM
model in order to asses’ feasibility of textile sector in capital market. In addition dividend
discount model is not the only method to asses’ feasibility of textile sector. There are many
promising companies in textile sector like argon denim, malek spinning, paramount textile,
envoy textile who didn’t provide dividend. These companies are doing well and investors can
buy these companies share.
9. Conclusion
38
Primary sources of Data are given below:
10. References
Arman Chowdhury Nayan, Executive, Research Department
Itrat Hossain, Executive, Research Department
Ashraful Hasib, Probationary Officer, Investment Banking
Secondary sources of data are given below:
www.idlc.com
www.investopedia.com
www.wikipedia.com
www.btmadhaka.com
www.bangladesh-bank.org
www.dsebd.org
www.lankabangla.duinvest.com
www.saiham.com
www.deshgroup.com
www.textile.squaregroup.com
www.rahimtextile.com
www.apexknitting.com
Annual Report Portal of IDLC Investments Ltd (2008-2012)
11. Appendix
List of Abbreviation:
DSE: Dhaka Stock Exchange
CSE: Chittagong Stock Exchange
SEC: Securities and Exchange Commission
CAGR: Compound Annual Growth Rate