Embed Size (px)
Citation preview

FEASIBILITY STUDY FOR E-MOBILITY
IMPLEMENTATION IN THE FES PREFECTURE
-Capstone Design-
Spring 2021
Houssam Benaa
Supervised by
Pr. Rachid Lghoul
© SCHOOL OF SCIENCE & ENGINEERING–AL AKHAWAYN UNIVERSITY
i
FEASIBILITY STUDY FOR E-MOBILITY IMPLEMENTATION IN THE FES PREFECTURE
Capstone
Student Statement:
“I, Houssam Benaa, have applied ethics in the different engineering design processes and in the
final proposed report. I have chosen my references, and cited them appropriately. I have held the
safety of the public to be paramount and have addressed this in the presented report wherever
applicable.”
Houssam Benaa
Approved by
Pr. Rachid Lghoul

ii
ACKNOWLEDGEMENTS
I would like to express my deepest thanks and gratitude to all those who contributed to the
accomplishment of this report by sharing their expertise, skills, and their guidance throughout the
period of my capstone.
I would like to express my deepest and most sincere gratitude to Pr. Rachid Lghoul, who assisted
me, and undertook the role of my supervisor throughout the entire capstone period. He has guided
me and made sure to teach and provide me with the basic instruments I needed to carry my research
in the best circumstances, despite the hard conditions that this pandemic has brought, and the
challenge to conduct the capstone remotely.
I would like to thank Dr. Yassine Salih Alj for providing me with all the sufficient information and
answering all my questions concerning the capstone design requirements as it was a new experience
for me.
I would also like to express my sincere recognition and thanks to my family and friends who knew
how to support and help me throughout the period of my capstone.
iii
ABSTRACT IN ENGLISH
Nowadays, the world’s dependency on fossil fuels is increasing day after day. According to a report
by the US EIA, “Energy Information Administration”, which forecasted the energy consumption
increase to be around 28%, between the year 2015 and 2040, with fossil fuels taking most of the
energy sources at around 77%. This increase in energy consumption will eventually lead to an
increase in CO2 emissions estimated at around 16% [1], has a direct relationship with the
phenomenon of Global Warming: a phenomenon responsible mainly for the increase of the
temperature of planet Earth, instability of weather throughout the seasons, and the rise of sea levels.
[2]
In an attempt to give possible solutions to the issues mentioned above, this research will present a
more in depth approach in the way of the implementation of e-mobility as a means of transportation
in the Moroccan context, with an emphasis on the Fès Prefecture This report will be held through
performing literature review in the first place, and taking examples of countries who have adopted
e-mobility as a clean alternative to conventional means of transportation, and performing a survey
our targeted region and analyzing its results, and finally an optimization method and decision
making approaches will be taken on a part of the region in order to find suitable locations for EV’s
charging stations.

iv
ABSTRACT IN FRENCH
De nos jours, la dépendance mondiale aux énergies fossiles augmente de jour en jour, selon un
rapport de l'EIA « l'Agence d'Information sur l'Energie» des États-Unis, on prévoit une
augmentation de la consommation énergétique d'environ 28% entre 2015 et 2040, dans laquelle les
énergies fossiles prennent la majeure partie des sources d'énergie, environ 77%. Cette
augmentation en terme de consommation d'énergie conduira éventuellement à une augmentation
des émissions de CO2 qui à son tour, est estimée voir une augmentation d’environ 16% [1], ce qui
a une relation directe avec le réchauffement climatique : le phénomène principalement responsable
de l'augmentation de la température de la planète, de l'instabilité du temps au fil des saisons et de
l'élévation du niveau de la mer. [2]
Pour tenter d'apporter des solutions possibles aux problématiques évoquées ci-dessus, cette
recherche présentera une approche plus approfondie concernant la mise en œuvre de la mobilité
électrique comme moyen de transport dans le contexte marocain, avec une concentration sur la
région de Fès-Meknès. Effectuant une revue de la littérature en premier lieu, en prenant des
exemples de pays qui ont adopté la mobilité électrique comme alternative propre aux moyens de
transport conventionnels, et ensuite en réalisant une enquête sur notre région ciblée et en analysant
ses résultats. Finalement, nous procéderons à utiliser des méthodes d’optimisation et des approches
de prise de décision sur une partie de la région afin de trouver les emplacements appropriés pour
placer les bornes de recharge pour les véhicules électriques.
v
TABLE OF CONTENTS
Student Statement: ............................................................................................................................. i
ACKNOWLEDGEMENTS ......................................................................................................... ii
ABSTRACT IN ENGLISH ........................................................................................................ iii
ABSTRACT IN FRENCH .......................................................................................................... iv
LIST OF FIGURES AND TABLES ........................................................................................ viii
List of Abbreviations ................................................................................................................... xi
1 INTRODUCTION ................................................................................................................. 1
2 LITERATURE REVIEW ...................................................................................................... 2
2.1 Transportation and impact on environment globally ............................................................ 2
2.2 Transportation in the Moroccan Context and its Impact on the Environment: ..................... 5
2.3 E-Mobility as a Potential Solution ........................................................................................ 6
2.3.1 Leading Countries in Terms of E-mobility ........................................................................ 6
2.3.2 E-mobility in the Moroccan Context ....................................................................................... 7
2.3.2.1 Morocco’s Vision towards Sustainability ............................................................................ 7
2.3.2.2 EVs Status in Morocco ......................................................................................................... 8
2.3.2.3 Charging Stations ................................................................................................................. 9
2.3.2.4 Incentives and Goals Put by the Moroccan Government to Promote E-mobility .............. 11
3 METHODOLOGY .............................................................................................................. 12
3.1 Online Survey ...................................................................................................................... 12
3.2.1 Overview of Analytical Hierarchy Process ..................................................................... 14
3.2.2 Overview of the Fuzzy Analytical Hierarchy Process ..................................................... 18
3.2.3 Overview of Technique for Order Preference by Similarity to an Ideal Solution ........... 22
3.3 Overview of ArcGIS ................................................................................................................ 27
vi
4 RESULTS AND DISCUSSIONS ....................................................................................... 30
4.1 Study Area ........................................................................................................................... 30
4.2 Socio-economic Survey Results’ Analysis ......................................................................... 31
4.2.1 Respondent’s Profile ........................................................................................................ 31
4.2.2 The Travel Behavior and Modes ..................................................................................... 32
4.2.3 Awareness and Willingness to Adopt E-Mobility ........................................................... 33
4.2.4 Price Tolerance ................................................................................................................ 34
4.2.5 Motives of the Acquisition of EVs .................................................................................. 34
4.2.6 Constraints of the Acquisition of EVs ............................................................................. 35
4.2.7 Preferences in Term of Charging Stations ....................................................................... 36
4.3 Case study: Finding Optimal Locations for Potential Charging Stations in the Fes Prefecture
37
4.3.1 Choice of Criteria ............................................................................................................ 37
4.3.2 Criteria Suitability Maps ................................................................................................. 37
4.3.2.1 Population Density ....................................................................................................... 39
4.3.2.2 Parking Areas ............................................................................................................... 39
4.3.2.3 Proximity to Roads ...................................................................................................... 40
4.3.2.4 Shopping Malls ............................................................................................................ 41
4.3.2.5 Bus Stations ................................................................................................................. 41
4.3.2.6 Gas Stations ................................................................................................................. 42
4.3.2.7 Active Population ......................................................................................................... 43
4.3.2.8 Green Areas ................................................................................................................. 43
4.3.2.9 Land Slope ................................................................................................................... 44
4.3.2.10 Land Value ....................................................................................................................... 45
vii
4.3.3 MCDM ............................................................................................................................. 46
4.3.3.1 AHP results .................................................................................................................. 46
4.3.3.2 Fuzzy AHP Results ...................................................................................................... 50
4.3.4 Overlaying the Results in ArcGIS ................................................................................... 51
4.3.5 Ranking Alternatives Using TOPSIS .............................................................................. 57
5 STEEPLE ANALYSIS ....................................................................................................... 60
6 CONCLUSION AND FUTURE WORK ............................................................................ 61
7 REFERENCES .................................................................................................................... 62
APPENDIX A : Project Initial Specification ............................................................................. 67
APPENDIX B : Socio-Economic Survey ................................................................................... 68
APPENDIX C: Suitability Maps Data ........................................................................................ 72
viii
LIST OF FIGURES AND TABLES
Fig. 1: Percentage of CO2 emission per sector [5] .......................................................................... 3
Fig. 2: Percentage concentration of each greenhouse gas [6] .......................................................... 3
Fig. 3: Change in concentration of CO2 globally from 1800 till 2019[7] ....................................... 4
Fig. 4: Surface temperature change over the years (1880-2010) [8] ............................................... 4
Fig. 5: Mean sea level change (1900-2020) [9] ............................................................................... 5
Fig. 6: Projected electric vehicles number in Morocco [19] ............................................................ 9
Fig. 7: Map of existing charging stations [21] ............................................................................... 10
Fig. 8: Workflow diagram of the study .......................................................................................... 12
Fig. 9: General form of the AHP hierarchy ................................................................................... 14
Fig. 10: AHP flowchart .................................................................................................................. 17
Fig. 11: Fuzzy AHP flowchart ....................................................................................................... 22
Fig. 12: Illustration of TOPSIS’ main concept [38] ...................................................................... 23
Fig. 13: TOPSIS flowchart ............................................................................................................ 27
Fig. 14: Flowchart for raster suitability map ................................................................................. 29
Fig. 15: Flowchart for Euclidean distance suitability map ............................................................ 29
Fig. 16: Flowchart for slope suitability map .................................................................................. 29
Fig. 17: Map of the study area (Fes prefecture) ............................................................................. 30
Fig. 18: Respondents’ age categories ............................................................................................ 32
Fig. 19: Respondents activity status and sector ............................................................................ 32
Fig. 20: Means and reasons of transport ........................................................................................ 33
Fig. 21: Travel distance and cost ................................................................................................... 33
Fig. 22: Respondents’ price increase tolerance ............................................................................. 34

ix
Fig. 23: Motives for acquiring an EV ............................................................................................ 35
Fig. 24: Constraints of acquiring an EV ........................................................................................ 36
Fig. 25: Location and charging time preferences........................................................................... 37
Fig. 26: Criteria scores after reclassification ................................................................................. 38
Fig. 27: Density suitability map ..................................................................................................... 39
Fig. 28: Parking areas suitability map ........................................................................................... 40
Fig. 29: Proximity to roads suitability map ................................................................................... 40
Fig. 30: Shopping malls suitability map ........................................................................................ 41
Fig. 31: Bus stations suitability map .............................................................................................. 42
Fig. 32: Gas stations suitability map .............................................................................................. 42
Fig. 33: Active population suitability map .................................................................................... 43
Fig. 34: Green areas suitability map .............................................................................................. 44
Fig. 35: Land slope suitability map ............................................................................................... 45
Fig. 36: Land value suitability map ............................................................................................... 45
Fig. 37: AHP hierarchy .................................................................................................................. 46
Fig. 38: Pairwise matrix of accessibility sub-criteria .................................................................... 47
Fig. 39: Pairwise matrix of cost-efficiency sub-criteria ................................................................ 47
Fig. 40: Pairwise matrix for the accessibility scenario .................................................................. 47
Fig. 41: Pairwise matrix for the environment scenario .................................................................. 47
Fig. 42: Standardized matrix of accessibility sub-criteria .............................................................. 48
Fig. 43: Standardized matrix of cost efficiency sub-criteria .......................................................... 48
Fig. 44: Standardized matrix of the accessibility scenario ............................................................ 48
Fig. 45: Standardized matrix of the environmental impact scenario ............................................. 48
Fig. 46: Final weights of criteria – accessibility scenario .............................................................. 49

x
Fig. 47: Final weights of criteria – environment scenario ............................................................. 49
Fig. 48: Fuzzy AHP Hierarchy ..................................................................................................... 50
Fig. 49: Pairwise matrix for Fuzzy AHP ....................................................................................... 50
Fig. 50: Normalized Fuzzy AHP matrix with final weights .......................................................... 51
Fig. 51: Suitability map for AHP accessibility scenario ................................................................ 52
Fig. 52: Suitability map for AHP environmental impact scenario ................................................ 52
Fig. 53: Suitability map for Fuzzy AHP ........................................................................................ 53
Fig. 54: Suitability index sum map ................................................................................................ 54
Fig. 55: Intersection map ............................................................................................................... 55
Fig. 56: Alternative EVCS map ..................................................................................................... 55
Fig. 57: Close up view of alternative EVCS map .......................................................................... 56
Fig. 58: Alternative EVCS coordinates ......................................................................................... 56
Fig. 59: Initial TOPSIS comparison matrix ................................................................................... 57
Fig. 60: Normalized TOPSIS matrix .............................................................................................. 57
Fig. 61: Weighted normalized TOPSIS matrix .............................................................................. 58
Fig. 62: Alternatives ranking using even weights .......................................................................... 58
Fig. 63: Alternatives ranking using accessibility weights ............................................................. 59
Table 1: AHP scale and linguistic definition [36] ......................................................................... 15
Table 2: Reference table for random indexes [36] ........................................................................ 16
Table 3: Fuzzy AHP scale and linguistic definition [30] .............................................................. 19
xi
LIST OF ABBREVIATIONS
CO2: Carbon dioxide.
GHG: Greenhouse gases.
EV/EVs: Electric Vehicles.
EVCS: Electric Vehicles Charging Stations.
MCDM: Multi-Criteria Decision-Making.
AHP: Analytical Hierarchy Process.
FAHP: Fuzzy Analytical Hierarchy Process.
TOPSIS: Technique for Order Preference by Similarity to an Ideal Solution.
GIS: Geographical Information System.

1
1 INTRODUCTION
Transportation is one of the most essential and vital sectors in the world. It makes our life much
easier and more convenient. Whether it’s for transporting goods or only for the simple desire to
move freely, it greatly extends our reach. It is also one of the factors that helped us reach a huge
economic growth. Moreover, the field of transportation and logistics is one of the biggest markets
globally, its total operations have generated a dazzling trade value of 5.5 trillion euros in 2018 [3],
from the transportation of goods, to passengers.
However, this huge increase in demand for transportation have also led to an increasing demand
for fossil fuels, which constitute around 84% of our energy consumption sources [4]. This reliance
on fossil fuels has several negative impacts, of which we can identify
- Non-renewability: fossil fuels are considered to be non-renewable sources of energy that
took a millions of years to be made.
- Pollution: Pollution is one of the main issues that humanity faces today, it affects our well-
being, and affects all types of living creatures. In our case, we will be focusing on air
pollution, which is mainly caused by the excessive use of fossil fuels, from factories gas
emissions, to cars gas emission, this kind of pollution has been associated with many
diseases ranging from asthma to extreme lung disease. These gas emissions go under the
name of the greenhouse gases, which will be discussed in detail later on in the report.
In an incentive to find solutions, this report will present some solutions in order to try to reduce
these greenhouse gases emissions by the implementation of electric vehicles instead of
conventional gas vehicles, and studying furthermore some examples of countries that have been
successful in implementing e-mobility as a sustainable alternative to conventional means of
transportation, and analyze their strengths, also, we will see the incentives that the Moroccan
government have put in order to promote e-mobility within our society.
Moreover, this report will include a survey concerning people’s willingness to switch to the use of
electric vehicles containing various questions that will help us draw constructive conclusion.
2
Furthermore, this report will also be a chance to introduce some optimization and multi criteria
decision making methods, in a study case performed on a part from the Fès-Meknès region, by
collecting different parameters that will help chose the most suitable locations for placing charging
stations for electric vehicles.
2 LITERATURE REVIEW
2.1 Transportation and impact on environment globally
When in regular amounts, CO2 or carbon dioxide is a crucial element of our ecosystem.
Nonetheless, when in huge amounts, it becomes destructive. With 13.41 gigatons of CO2 emitted
in 2016 worldwide, transport is the second largest contributor to the emission of greenhouse gases
through the production of energy and electricity, without considering emissions due to
infrastructure building (concrete for the construction of bridges, deforestation, etc.). CO2 emissions
from transportation depend on several variables: the total distance traveled, the number of
passengers per vehicle, the fuel used and the type of journey. Moreover, statistics show an
increasing number of cars in circulation in the world, as well as an explosion in air traffic and world
trade in goods. [5]
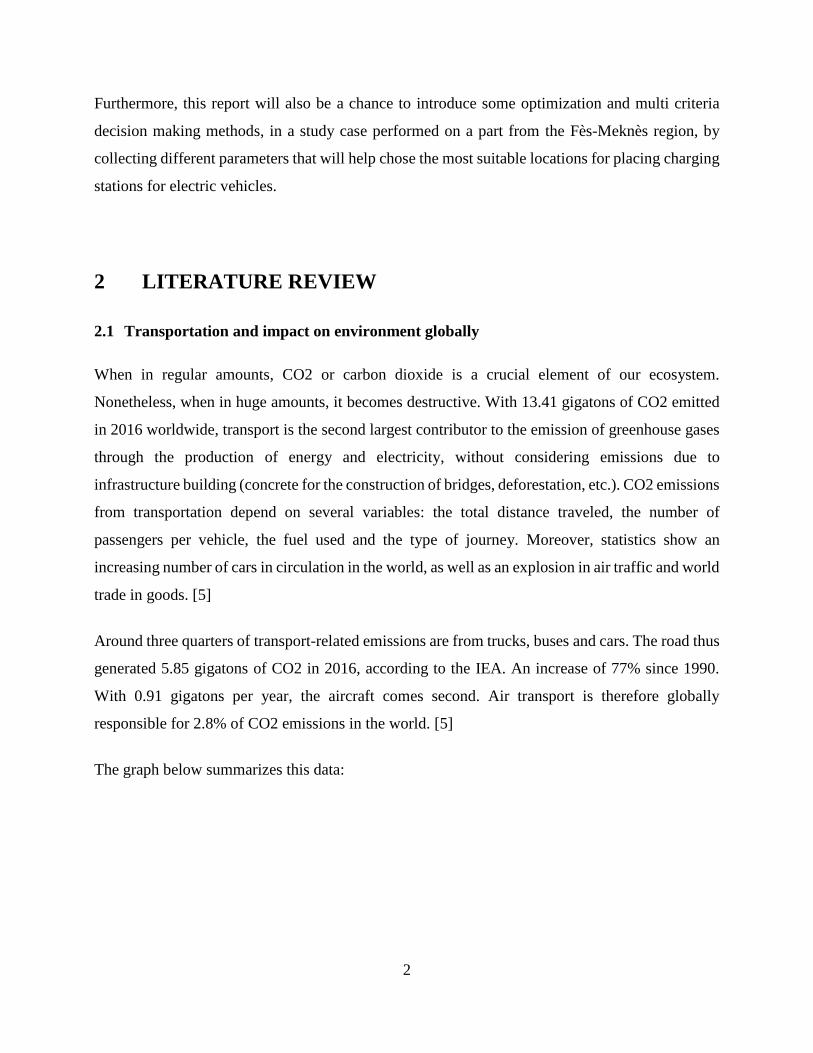
Around three quarters of transport-related emissions are from trucks, buses and cars. The road thus
generated 5.85 gigatons of CO2 in 2016, according to the IEA. An increase of 77% since 1990.
With 0.91 gigatons per year, the aircraft comes second. Air transport is therefore globally
responsible for 2.8% of CO2 emissions in the world. [5]
The graph below summarizes this data:

3
Fig. 1: Percentage of CO2 emission per sector [5]
Globally, CO2 constitutes the vast majority of the greenhouse gases emitted. As of 2020, it holds
a percentage of 76% of the total greenhouse gases emissions. As the following graph suggests:
Fig. 2: Percentage concentration of each greenhouse gas [6]
Global warming is one of these drawbacks of the increasing amounts of CO2. This anomaly is the
result of having excess greenhouse gases (GHG), that eventually, stop or limit sunlight from
reflecting out of the Earth’s surface, thus, creating a rise in the temperature. This phenomenon is
accompanied by many other changes and circumstances, such as the rise of the level of the seas,
change in seasons, and change in meteorology patterns. Knowing that CO2 constitutes the vast
0% 20% 40% 60% 80% 100%
141.50% 18.90% 8.40% 24.40% 6.80%
Energy generation Industry Residential Transportation Other

4
majority of greenhouse effect gases, it would only be fair to try and see if there’s any relationship
between the change in CO2 concentration, and the phenomenon listed previously:
Fig. 3: Change in concentration of CO2 globally from 1800 till 2019[7]
Fig. 4: Surface temperature change over the years (1880-2010) [8]
5
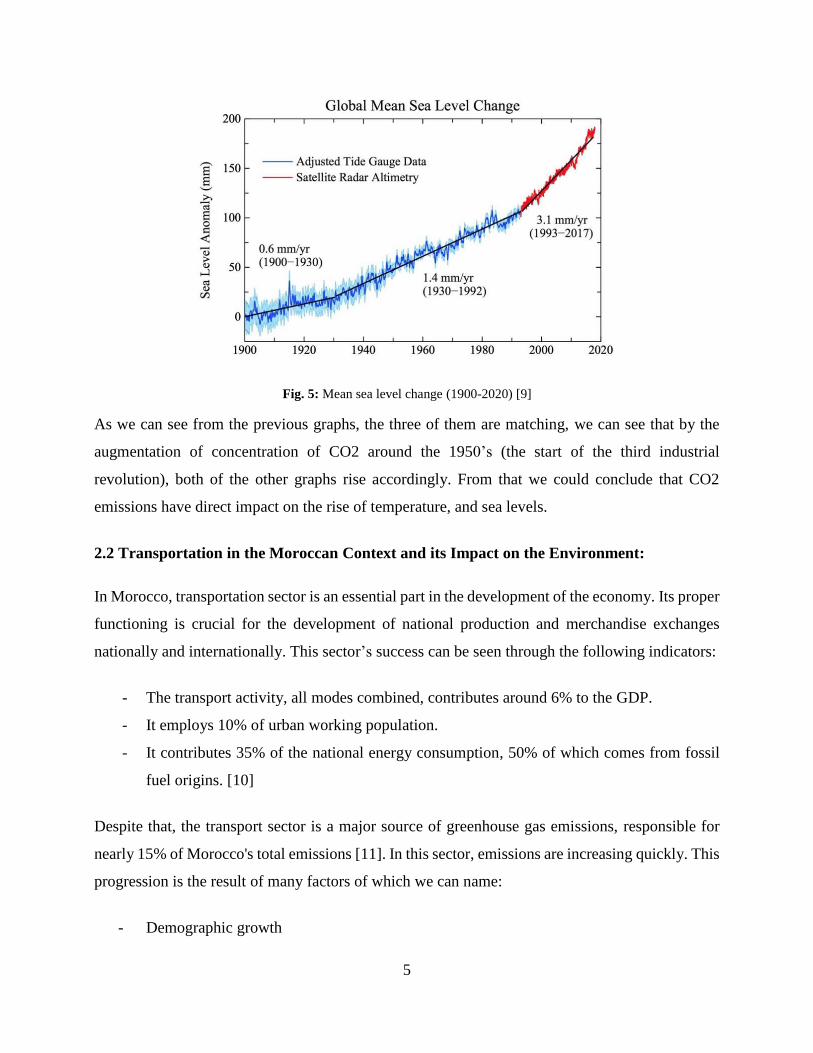
Fig. 5: Mean sea level change (1900-2020) [9]
As we can see from the previous graphs, the three of them are matching, we can see that by the
augmentation of concentration of CO2 around the 1950’s (the start of the third industrial
revolution), both of the other graphs rise accordingly. From that we could conclude that CO2
emissions have direct impact on the rise of temperature, and sea levels.
2.2 Transportation in the Moroccan Context and its Impact on the Environment:
In Morocco, transportation sector is an essential part in the development of the economy. Its proper
functioning is crucial for the development of national production and merchandise exchanges
nationally and internationally. This sector’s success can be seen through the following indicators:
- The transport activity, all modes combined, contributes around 6% to the GDP.
- It employs 10% of urban working population.
- It contributes 35% of the national energy consumption, 50% of which comes from fossil
fuel origins. [10]
Despite that, the transport sector is a major source of greenhouse gas emissions, responsible for
nearly 15% of Morocco's total emissions [11]. In this sector, emissions are increasing quickly. This
progression is the result of many factors of which we can name:
- Demographic growth

6
- The acceleration of urbanization
- The opening up of the rural world and access to social services
- Petroleum vehicles.
However, air pollution is mainly due to emissions from diesel vehicles. In Morocco, diesel vehicles
represent 49% and gasoline ones represent 51%. For example, the results of the study conducted
by the National Environmental Laboratory, which has established a network to monitor the quality
of air in the city of Rabat using a mobile laboratory has shown that the S02 parameters and the
particles in suspension (PS) which exceed the standards come mainly from diesel vehicles while
the CO and Pb parameters emitted by gasoline vehicles remain below standards [12].
From that example, we could conclude that in the absence of industrial pollution, the air pollution
in Morocco is due mainly to emissions from diesel vehicles.
2.3 E-Mobility as a Potential Solution
In order to limit the effects of this fast growth in air pollutant concentration, a solution has to be
found. This solution has to be sustainable while maintaining the convenience of the current
transportation means. In this case, e-mobility could be used as a replacement for conventional
mobility. This traveling mode that has been gradually implemented within the global society
represents a sustainable solution to limit the growth of CO2 emissions.
E-mobility can be defined as the use of fully electric vehicles, or partially electric, also known as
hybrid vehicles, with the main goal of reducing our dependency on fossil fuels [13].
2.3.1 Leading Countries in Terms of E-mobility
As a starting point, we can take the example from some leading countries who have succeeded in
implementing e-mobility into the everyday transportation. And for that, Norway, China, France,
Germany, and Netherlands will be taken as an example.
Norway is considered to be the pioneer of e-mobility, with the fact that more than 50% of the cars
that were newly sold were electric, or hybrid, and as of 2025, it is expected to only sell EVs [14].

7
This success is mainly due to the policies and approaches taken by the Norwegian government of
which we can identify:
- Tax deductions (purchase taxes, and the 25% VAT are waived)
- Purchasing aids.
- Free parking, and free charging stations.
Moving on to China, which makes up the biggest part of EVs market, with a record of around
650,000 registered EV in 2017 which is roughly the third of the total EVs globally. China’s success
is mainly due to strategies taken by the government that sets a quota of 10% EVs sales for newly
acquired cars [15].
France has one of the highest growth rates in terms of use of EVs, the country has seen a ten times
increase since 2012 counting around 118,770 EV as of 2017. This can be mainly explained by the
rigorous purchasing aids that the government gives to people willing to acquire an EV: e.g. in case
of purchase of a vehicle that emits less than 20g of CO2, the buyer can receive up to 7000 €, also,
the presence of around 30000 EVCS which means that every there’s one station for 7 electric
vehicle [16].
While Germany is considered to have the largest petroleum automobiles market in the world, in
2016, the government launched a one-billion-euro fund to promote the e-mobility field, from tax
reductions -50% tax credit reduction at purchase of an EV -to the establishment of new charging
stations [17].
Netherlands has one of the most suitable floors for the development of e-mobility, since over 90%
of its population lives in the urban side of the country. Having around 25,300 charging stations, it
can only be logical to have around a 61% increase in EVs registrations in 2016 [17].
2.3.2 E-mobility in the Moroccan Context
2.3.2.1 Morocco’s Vision towards Sustainability
Morocco has taken some courageous measures to promote sustainability and help combat the effect
of global warming. Starting by organizing the climate conference COP22, in 2016 in Marrakech,

8
in which Morocco submitted its Nationally Determined Contributions (NDC’s). Those NDC’s go
along with the Paris Agreement of the United Nations Framework Conventions on Climate Change,
UNFCCC, in which Morocco developed a strategy to diminish its GHG emissions by 42% by 2030
[18] by obliging decision makers in administrations to:
- Provide the majority of electrical power from renewable energies. 52% will be used, of
which 20% is coming from solar energies, 20% from wind turbines, and 12% from dams
and hydraulic nature by 2030.
- Be able to achieve a increase of 15% in terms of energy savings by 2030.
- Decrease energy consumption of buildings, industrial infrastructures, and transportation by
12%, and 15%, by 2020, and 2030 respectively.
- Attain a total of energy savings of 48% in industry sector, 23% in transport sector, 19% in
residential sector, and 10% in services.
- Establish an increase capacity of 3900 MW in power plants using combined-cycle
technology and natural gas by 2030.
- Reduce cumulative CO2 emissions in the transport sector by 9.5% (50 Megatonnes).
- Provide big industries with imported gas, and that went through the re-gaseification process.
2.3.2.2 EVs Status in Morocco
The Moroccan EVs market is composed mainly of European and Asian vehicles, from
manufacturers such as Toyota, Hyundai, Renault, Honda etc..However, Toyota holds the biggest
share of the market with its hybrid cars, which do not require charging as the car itself regenerates
power using braking, and from its fuel engine. Morocco, as of 2018, accounted of 1300 EVs and
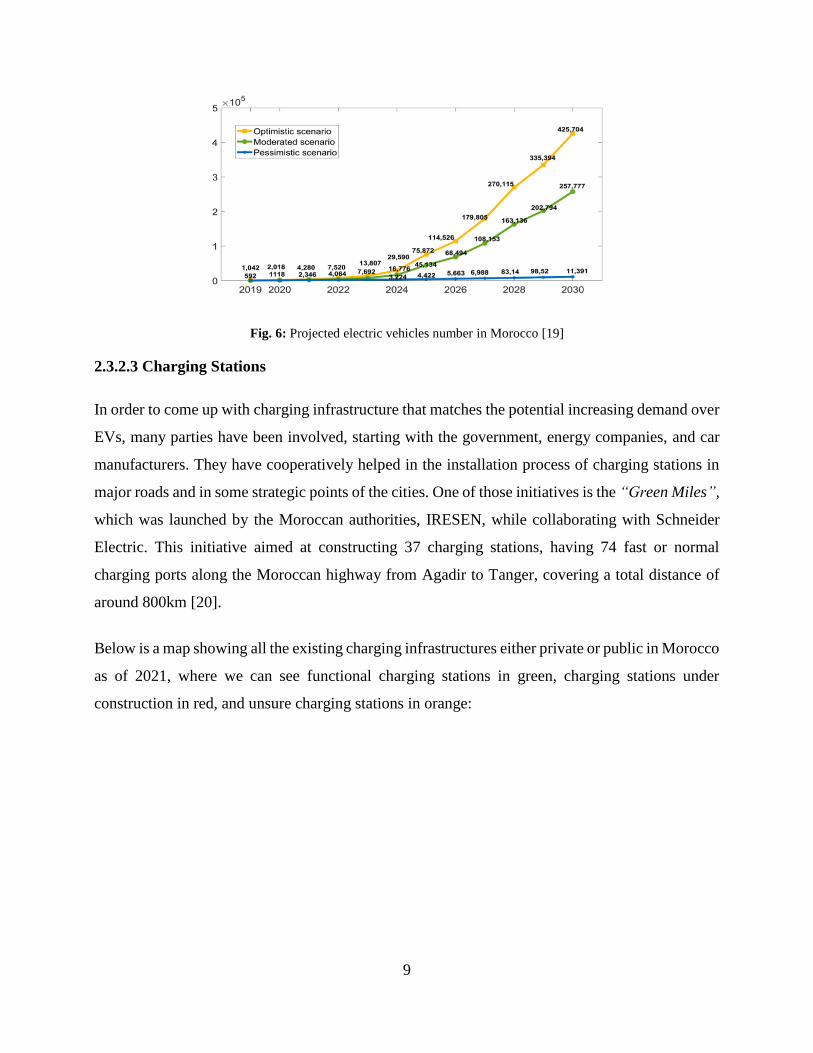
hybrid EVs. This number has doubled to reach a total of 2717 unit circulating by the end of 2019.
This number is expected to grow exponentially by 2030, as the forecasts show that Morocco will
account around 425,704 electric vehicle[19]. The below graph shows the different scenarios
forecasted:
9
Fig. 6: Projected electric vehicles number in Morocco [19]
2.3.2.3 Charging Stations
In order to come up with charging infrastructure that matches the potential increasing demand over
EVs, many parties have been involved, starting with the government, energy companies, and car
manufacturers. They have cooperatively helped in the installation process of charging stations in
major roads and in some strategic points of the cities. One of those initiatives is the “Green Miles”,
which was launched by the Moroccan authorities, IRESEN, while collaborating with Schneider
Electric. This initiative aimed at constructing 37 charging stations, having 74 fast or normal
charging ports along the Moroccan highway from Agadir to Tanger, covering a total distance of
around 800km [20].
Below is a map showing all the existing charging infrastructures either private or public in Morocco
as of 2021, where we can see functional charging stations in green, charging stations under
construction in red, and unsure charging stations in orange:

10
Fig. 7: Map of existing charging stations [21]
While it is a solid start, there is still a need for more charging stations, as the already existing ones
aren’t enough to match the 425,704 EV forecasted for 2030.For that, a proper study and literature
review has to be done in order to identify the criteria that should be taken into consideration when
choosing optimal locations for EVCS. According to Philipsen et al., one of the requirements and
criteria is to use the waiting time of charging meaningfully [22].This tells us that in order for
locations to be suitable, it has to be close to place where there is acticity. Also, De Gennaro et al.,
took into consideration the parking behavior, meaning the possibility to park your vehicle and use
alternative means of transportation, meaning that it has to be close to transport stations, and parking
lots[23]. Whereas Andrenacci et al. have taken approaches that analyze the main routes taken by
EV users, and cluster the regurarly visited places [24]. Cai et al. and Sharaki et al. both agreed to
follow the same approach of tracking the routes used by cabs in Beijin as a case study, and identify
the busiest nodes inside the city[25] [26]. Morissey et al have identified that home charging is the
most used way of charging, followed by gas stations, parking areas charging. Xi et al. developed
an approach that takes into consideration the demographics, and economic behaviors, e.g.
population density, income rate, etc…[27]
11
2.3.2.4 Incentives and Goals Put by the Moroccan Government to Promote E-mobility
The Moroccan government put many incentives and policies into action that encourage
implementing e-mobility as a new transportation mode, and made reaching the full potential of the
projection by 2030 as a goal. Those incentives can be summarized as follows in a report made by
the government [28]:
- Full exemption from the annual ownership special tax since 2017.
- The regional and political stability of the country attracts foreign investors, and car
manufacturers.
- A reduction of customs of 2.5% for vehicles impoted from Europe, or outside Europe.
- Financing and investing in research related to e-mobility, especially in smart charging, and
charging infrastructures, e.g. “i-Smart” first local made EV charger co-developed by
IRESEN, and Polytechnic Mohamed 6 University (UM6P)[29].
- Replacing 30% of its service vehicles, around 35,400 cars with EVs or HEVs by 2022.

12
3 METHODOLOGY
Throughout this report, many methods and software were used, we were able to combine the results
of a survey, with multi-criteria decision-making, and ArcGIS in order to solve an optimization
problem concerning the locations of potential electric vehicles’ charging stations with a guidance
from Guler, Yomralioglu’s approach [30], in order to do so, the below workflow has been followed:
Fig. 8: Workflow diagram of the study
3.1 Online Survey
In this report, a socio-economic survey was run with the main goal of studying the willingness of
a sample of Moroccans to adopt e-mobility instead of conventional mobility. The online platform
“Google Forms” have been used to collect the answers. This platform is a free one, meaning that
the user gets the option to create surveys with unlimited questions. Also, it allows for flexibility in
terms of the types of questions. Our survey consisted of a mix of multiple choice, and checkbox
questions. The main reasons why we opted for an online survey are:
- The ease of collecting data and answers.
- Reaching many societal categories, through social media use.
13
- The ease of processing the collected answers and generating meaningful graphs out of them.
- The current situation of the COVID-19 pandemic limits our options for performing in
person surveys.
3.2 Multi-Criteria Decision-Making
In the professional world, experts and decision makers find themselves in a situation in which they
need to choose from 2 alternatives, this process is intuitive, and simple when only one criterion is
taken into consideration, however, this process becomes complex when multiple criteria are
involved, for that, Multi-Criteria Decision-Making field must be established[31].
Multi-Criteria Decision-Making is, as its name suggests, a managerial field that makes use of
algebraic methods, and software, in order to help decision makers derive weights of criteria, choose
between alternatives, or rank them accordingly.
The first application of MCDM methods historically recorded have started with Benjamin Franklin
in 1772, with his famous “Moral or Prudential Algebra”[32], in a letter to his friend Joseph Priestly,
in which he described an approach towards making a complicated decision, involving various
criteria. He developed a model in which he tabulated the pros and cons of each alternative, and
weighting them accordingly, however, his model was only efficient in the case of 2 alternatives.
Around 200 years later, and exactly in 1976, more developed methods that aim to choose between
multiple alternative have been developed [33], and introduced by Ralph Keeney and Howard Raiffa
in their book “Decisions with Multiple Objectives: Preferences and Value Tradeoffs” that also
involves different decision makers. This has been followed by a generalization of the word MCDM,
by Stanley Zionts in 1979, in an article entitled “MCDM – If not a Roman numeral, then what?”
[34], which was aimed for managers.
Nowadays, the use of software in order to help in the process of MCDM is widely spread, as it is
considered to be more accurate, and time efficient. In this paper, AHP, fuzzy AHP, and TOPSIS
methods have been used, each of which will be detailed next on the report, with their uses, concepts,
and limitations.
14
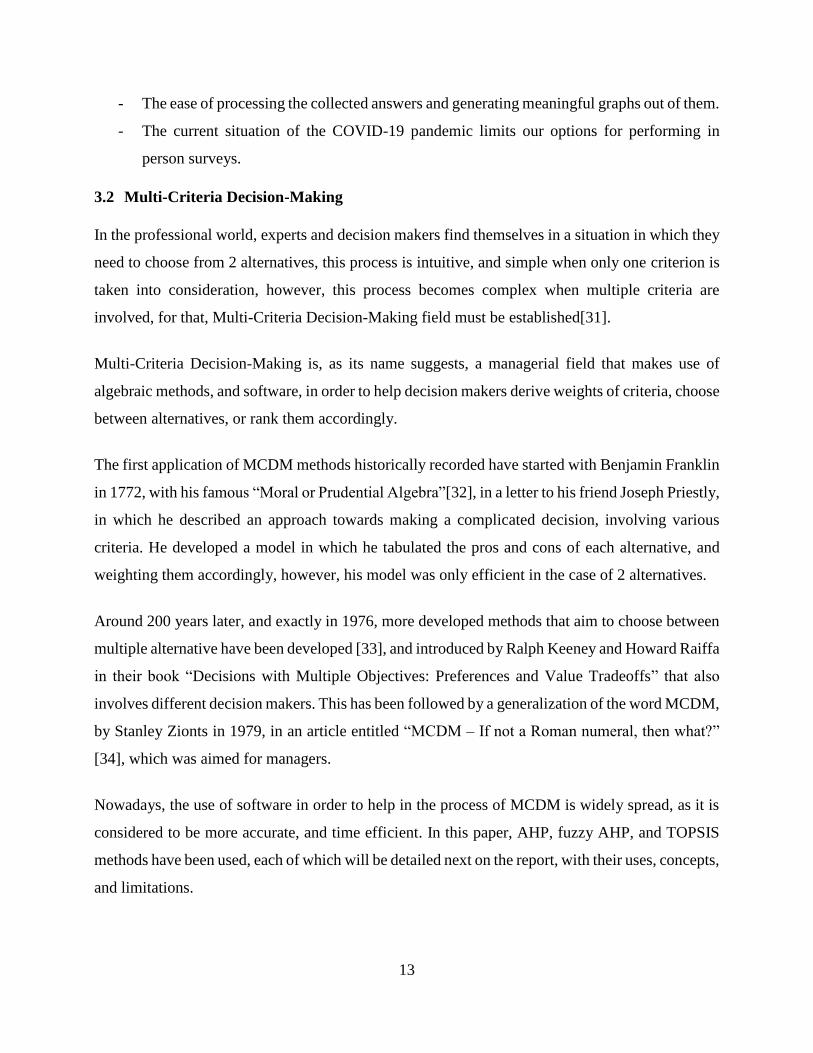
3.2.1 Overview of Analytical Hierarchy Process
AHP or Analytical Hierarchy Process is a tool that makes use of linear algebra, and matrix theory,
with the aim of solving complicated multiple-criteria decision-making problems that many
scenarios, or levels [35]. The AHP is an efficient and sophisticated MCDM technique that helps
people, and most precisely decision makers to prioritize and decide better when both quantitative
and qualitative factors of decision-making are taken into consideration. This technique was initially
developed by Thomas Saaty in 1970, and it proposes a ratio scale that represents the priority of
each criteria compared. Initially, Saaty suggested that 4 steps have to be followed in order to reach
an acceptable and accurate result. These steps consist respectively of modeling, valuation,
prioritization, and synthesis. In the first phase, this whole process is formulated hierarchically, and
the constructed hierarchy tree consists usually of at least 3 levels, with the goal at the top level,
criteria at the second level, and goal alternatives at the third level. As suggested by the following
figure:
Fig. 9: General form of the AHP hierarchy
The second phase consists of pairing the different criteria, and comparing the importance of every
single one. The AHP technique is based upon a 9 point scale estimation to convey the beliefs and
preferences level for a criteria over another, and then, a pairwise matrix is created, where criteria
are compared to one another as shown in the following table that shows every index and its
corresponding definition:

15
Table 1: AHP scale and linguistic definition [36]
Setting the intensity of importance allows us then to give independent evaluations for each
criterion, hence, quantify the problem, and make it simpler in building the pairwise matrix 𝐴 =
[𝑎𝑖𝑗]𝑛∗𝑛 which is formulated as follows:
𝐴 =
[ 𝑎11 𝑎12 … … 𝑎1𝑛
𝑎21 𝑎22 … … 𝑎2𝑛
⋮ ⋮ … … ⋮⋮ ⋮ … … ⋮
𝑎𝑛1 𝑎𝑛2 … … 𝑎𝑛𝑛]
Where 𝑎𝑖𝑗 is the pairwise intensity of importance, and it is mandatory that matrices diagonal
elements are equal to 1, in other words, 𝑎𝑖𝑖=1, and that the elements of the lower triangle of the
matrix are the inverse of the ones in the upper triangle, which means 𝑎𝑖𝑗 =1
𝑎𝑗𝑖, by using the results
of this matrix, we can generate an eigenvector of weights according to the model proposed by
Saaty, and use Eq.1[35], to normalize the result:
𝑎𝑖𝑗 =𝑎𝑖𝑗
∑ 𝑎𝑖𝑗𝑛𝑗=1
(1)
After getting the values for the normalized 𝑎𝑖𝑗, we form a new matrix that contains all the
normalized values, the final result is obtained by using equation (2)[35], in which the weight are
obtained by respecting the number of criteria, sub-criteria, and alternatives :
16
𝑤𝑖𝑗 = ∑ 𝑎𝑖𝑗
𝑛𝑗=1
𝑛 (2)
With 𝑖, 𝑗 = 1,2,3………… , 𝑛
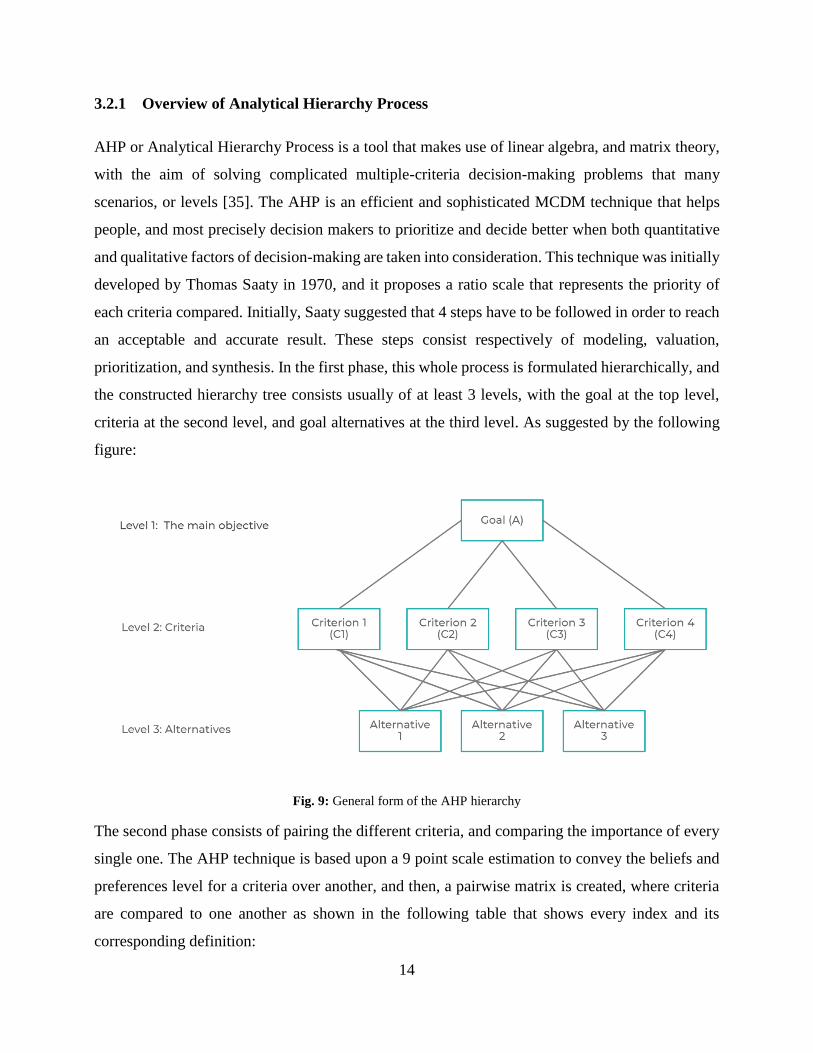
The AHP model developed by Saaty also proposes mathematical approaches to determine the
firmness, and the accuracy of the estimations in the matrix. Hence, the consistency ratio (CR) can
be calculated based on the specific values, or properties of the matrix. Generally, the eigenvalue
𝜆𝑚𝑎𝑥 which is the largest, is also ≥𝑛, with 𝑛 being the number of columns or rows. From that
assumption, Saaty could come up with the equation for consistency index (CI), which is obtained
by equation (3)[35]:
𝐶𝐼 = 𝜆𝑚𝑎𝑥 − 𝑛
𝑛 − 1 (3)
With CI being the consistency index, n the number of criteria that are compared within the matrix,
and 𝜆𝑚𝑎𝑥 the largest eigenvalue obtained from the matrix, in order to find it we need to first divide
the elements of weighted sum by the preference vector, and 𝜆𝑚𝑎𝑥is the average of the result, if
CI=0 we could say that we have a perfect consistency.
After calculating CI, it is compared to reference values, and if it doesn’t achieve that value, then
the importance indexes that were previously set in the matrix need to be reconsidered. However,
that consistency index alone wouldn’t give us any information about the accuracy of our model, it
needs a reference frame. For that, Saaty developed a random index table, which is the following:
Table 2: Reference table for random indexes [36]
This table gives a random index for each corresponding value of n, number of criteria, which will
be used in determining the consistency ratio, CR. This ratio is calculated following equation 4, and
takes as inputs the consistency index CI, and the random index RI, the equation is as follows:

17
𝐶𝑅 = 𝐶𝐼
𝑅𝐼 (4)
RI is retrieved from the table, and CI is calculated, we can say that the model, and the pairwise
matrix is consistent if the 𝐶𝑅 ≤ 0.10, otherwise, if 𝐶𝑅 ≥ 0.10 that means that the model we have
built is inconsistent. In case of inconsistency, the results of the study might not be meaningful and
would give wrong judgements, however, this inconsistency can be fixed by reconsidering and
reviewing the intensity of importance of each criterion on its own.
The AHP method can be summarized by the following flowchart:
Fig. 10: AHP flowchart
18
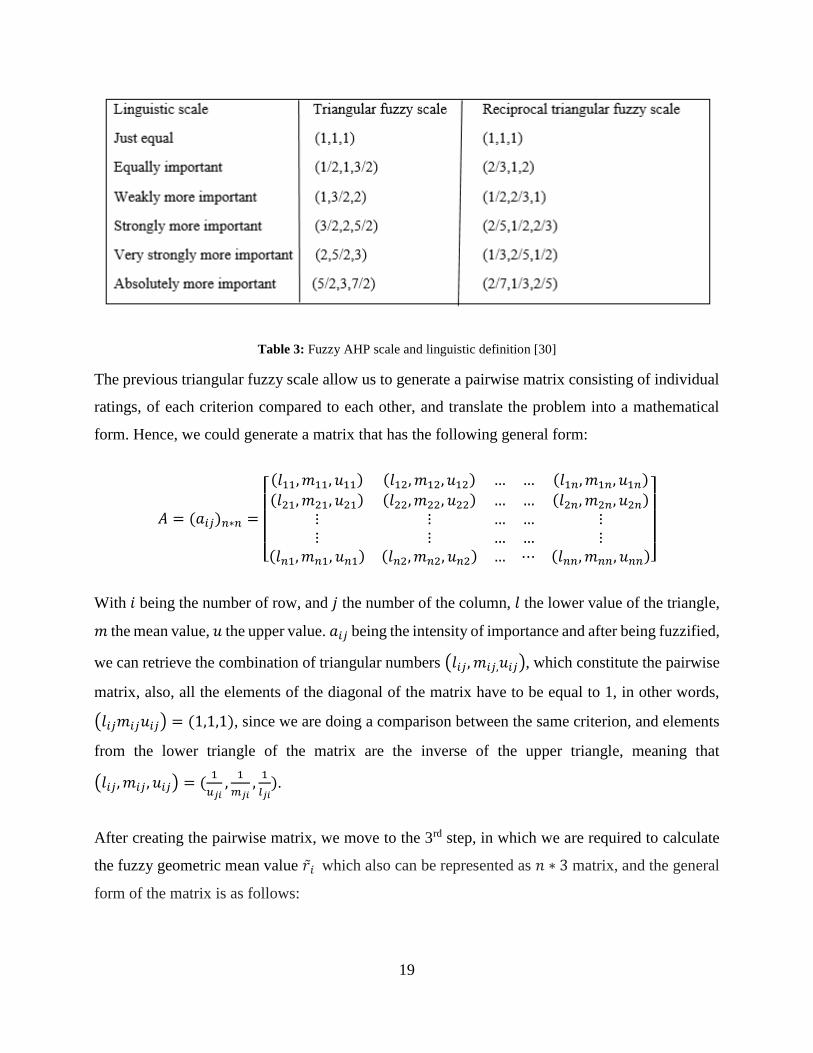
3.2.2 Overview of the Fuzzy Analytical Hierarchy Process
FAHP or Fuzzy Analytical Hierarchy Process is an extension to the AHP model, it corrects the
inaccuracy and the ambiguity that AHP is unable of processing and dealing with. All of that through
setting a range of values, instead of the tight value given by the AHP (1-9 scale), in order to
minimize the uncertainty. It is commonly used and preferred because of the kind of flexibility it
gives to decision makers, taking into consideration the fact that they cannot give exact ratings or
judgments during the process of pairwise comparison. As FAHP can translate the human thoughts
more accurately in the case of complex problems that involve a large amount of criteria.[37]
There exists many FAHP methods that have been developed by numerous researchers. The latest
one, and the one we are interested in is the Van Laarhoven & Pedrycz model, which was developed
in 1983 and presents an algorithm, which is considered to be the direct successor of Saaty’s AHP
theory. It makes use of triangular fuzzy numbers, and the calculations are almost the same as in
AHP. Van Laarhoven & Pedrycz’ model requires decision makers to perform 6 steps, with the first
one being the modeling of the problem, which also follows the same example of AHP (Fig.9), and
consists of at least 3 levels, with the main goal being at the top level, criteria at the second level,
and the generated alternatives at the third and lower level.
The second step consists of setting the pairwise matrix, and pairing the different criteria with one
another. The FAHP method proposes a different scale from the one of AHP, and this scale is
composed of triangular numbers instead of crisp numbers, and these numbers have different
meaning and linguistic translations, and they give an estimation of the degree of importance
between criteria. Based on that, the pairwise matrix can be created. The following figure shows the
scale for FAHP method:
19
Table 3: Fuzzy AHP scale and linguistic definition [30]
The previous triangular fuzzy scale allow us to generate a pairwise matrix consisting of individual
ratings, of each criterion compared to each other, and translate the problem into a mathematical
form. Hence, we could generate a matrix that has the following general form:
𝐴 = (𝑎𝑖𝑗)𝑛∗𝑛 =
[ (𝑙11,𝑚11, 𝑢11) (𝑙12, 𝑚12, 𝑢12) … … (𝑙1𝑛,𝑚1𝑛, 𝑢1𝑛)
(𝑙21, 𝑚21, 𝑢21) (𝑙22,𝑚22, 𝑢22) … … (𝑙2𝑛, 𝑚2𝑛, 𝑢2𝑛)⋮ ⋮ … … ⋮⋮ ⋮ … … ⋮
(𝑙𝑛1,𝑚𝑛1, 𝑢𝑛1) (𝑙𝑛2,𝑚𝑛2, 𝑢𝑛2) … ⋯ (𝑙𝑛𝑛, 𝑚𝑛𝑛, 𝑢𝑛𝑛)]
With 𝑖 being the number of row, and 𝑗 the number of the column, 𝑙 the lower value of the triangle,
𝑚 the mean value, 𝑢 the upper value. 𝑎𝑖𝑗 being the intensity of importance and after being fuzzified,
we can retrieve the combination of triangular numbers (𝑙𝑖𝑗, 𝑚𝑖𝑗,𝑢𝑖𝑗), which constitute the pairwise
matrix, also, all the elements of the diagonal of the matrix have to be equal to 1, in other words,
(𝑙𝑖𝑗𝑚𝑖𝑗𝑢𝑖𝑗) = (1,1,1), since we are doing a comparison between the same criterion, and elements
from the lower triangle of the matrix are the inverse of the upper triangle, meaning that
(𝑙𝑖𝑗, 𝑚𝑖𝑗 , 𝑢𝑖𝑗) = (1
𝑢𝑗𝑖,
1
𝑚𝑗𝑖,
1
𝑙𝑗𝑖).
After creating the pairwise matrix, we move to the 3rd step, in which we are required to calculate
the fuzzy geometric mean value 𝑟̃ 𝑖 which also can be represented as 𝑛 ∗ 3 matrix, and the general
form of the matrix is as follows:

20
𝑟̃ 𝑖 =
[ (𝑙11 ∗ 𝑙12 ∗ … ∗ 𝑙1𝑛)
1𝑛 (𝑚11 ∗ 𝑚12 ∗ … ∗ 𝑚1𝑛)
1𝑛 (𝑢11 ∗ 𝑢12 ∗ … ∗ 𝑢1𝑛)
1𝑛
(𝑙21 ∗ 𝑙22 ∗ … ∗ 𝑙2𝑛)1𝑛 (𝑚21 ∗ 𝑚22 ∗ … ∗ 𝑚2𝑛)
1𝑛 (𝑢21 ∗ 𝑢22 ∗ … ∗ 𝑢2𝑛)
1𝑛
⋮ ⋮ ⋮
⋮ ⋮ ⋮
(𝑙𝑛1 ∗ 𝑙𝑛2 ∗ … ∗ 𝑙𝑛𝑛)1𝑛 (𝑚𝑛1 ∗ 𝑚𝑛2 ∗ … ∗ 𝑚𝑛𝑛)
1𝑛 (𝑢𝑛1 ∗ 𝑢𝑛2 ∗ … ∗ 𝑢𝑛𝑛)
1𝑛]
Where 𝑙, 𝑚, 𝑢 are respectively, the lower, middle, upper, values of the triangular number, and n
being the number of the criteria.
Moving on to the 4th step where we calculate the fuzzy weights of the geometric mean value matrix,
by using an eigenvector that we calculate. The weights are calculated using the following
equation[37]:
𝑤 = 𝑟̃ 𝑖 × (𝑟̃ 1 + 𝑟̃ 2 + 𝑟̃ 3 …+ 𝑟̃ 𝑛)−1 (5)
Where 𝑟̃ 𝑖 is the value of the matrix row elements, multiplied by the reciprocal sum of all the rows
in the fuzzy geometric mean value matrix. And the sum can be performed by summing the lower,
middle, upper values one with each other. As we can see in the following equations[37]:
𝑟̃ 1 + 𝑟̃ 2 + 𝑟̃ 3 …+ 𝑟̃ 𝑛 = ((𝑙11 ∗ 𝑙12 ∗ …∗ 𝑙1𝑛)1
𝑛 + (𝑙21 ∗ 𝑙22 ∗ … ∗ 𝑙2𝑛)1
𝑛 + ⋯+ (𝑙𝑛1 ∗ 𝑙𝑛2 ∗ …∗ 𝑙𝑛𝑛)1
𝑛, (𝑚11 ∗
𝑚12 ∗ … ∗ 𝑚1𝑛)1
𝑛 + (𝑚21 ∗ 𝑚22 ∗ … ∗ 𝑚2𝑛)1
𝑛 + ⋯+ (𝑚𝑛1 ∗ 𝑚𝑛2 ∗ …∗ 𝑚𝑛𝑛)1
𝑛, (𝑢11 ∗ 𝑢12 ∗ …∗ 𝑢1𝑛)1
𝑛 + (𝑢21 ∗
𝑢22 ∗ … ∗ 𝑢2𝑛)1
𝑛 + ⋯+ (𝑢𝑛1 ∗ 𝑢𝑛2 ∗ …∗ 𝑢𝑛𝑛)1
𝑛) (6)
And the inverse is performed based on (𝑙𝑖𝑗, 𝑚𝑖𝑗 , 𝑢𝑖𝑗) = (1
𝑢𝑗𝑖,
1
𝑚𝑗𝑖,
1
𝑙𝑗𝑖) formula.
The 5th step consists of performing an arithmetic average calculations of each row from the fuzzy
weighted matrix following the formula:

21
𝑤 =
[ 𝑙1 + 𝑚1 + 𝑢1
3𝑙2 + 𝑚2 + 𝑢2
3⋮⋮
𝑙𝑛 + 𝑚𝑛 + 𝑢𝑛
3 ]
A 6th step is required in order to normalize the resulting weights, and get an accurate percentage,
that represents our degree of preference. The matrix becomes as follows:
𝑤𝑛𝑜𝑟 =
[
𝑤1
∑ 𝑤𝑖𝑛𝑖=1𝑤2
∑ 𝑤𝑖𝑛𝑖=1
⋮⋮
𝑤𝑛
∑ 𝑤𝑖𝑛𝑖=1 ]
The 7th step as in Saaty’s AHP, we need to calculate the consistency of the model, and compare it
to reference values, and for that CI or consistency index is to be used, 𝜆𝑚𝑎𝑥, the largest eigenvalue,
needs to be determined, in order to do so, the following equation is used[37]:
𝜆𝑚𝑎𝑥 = (∑𝑤11−𝑛1 × 𝑤𝑛𝑜𝑟1 + ⋯+ ∑𝑤1𝑛−𝑛𝑖 × 𝑤𝑛𝑜𝑟 𝑛) (7)
After calculating 𝜆𝑚𝑎𝑥 we could then proceed to calculate the consistency index CI, using the
formula of Eq.3, then the consistency ratio CR needs to be determined, in order to do that, we
retrieve the random index RI from table 2 which corresponds to the number of criteria we had as
inputs, then only, we could calculate the consistency ratio by applying Eq.4. After calculation, the
CR needs to be compared to a reference value, which in our case is 0.10. If 𝐶𝑅 < 0.10, we can say
that our model is consistent, and the weights we have generated for each criteria represent the
reality, however, if the 𝐶𝑅 > 0.10 we say that our model is inconsistent by the the CR percentage,
22
and that our ratings for certain criteria do not match, meaning that our initial pairwise need to be
reexamined, or even reconstructed in case of a large value of CR [37].
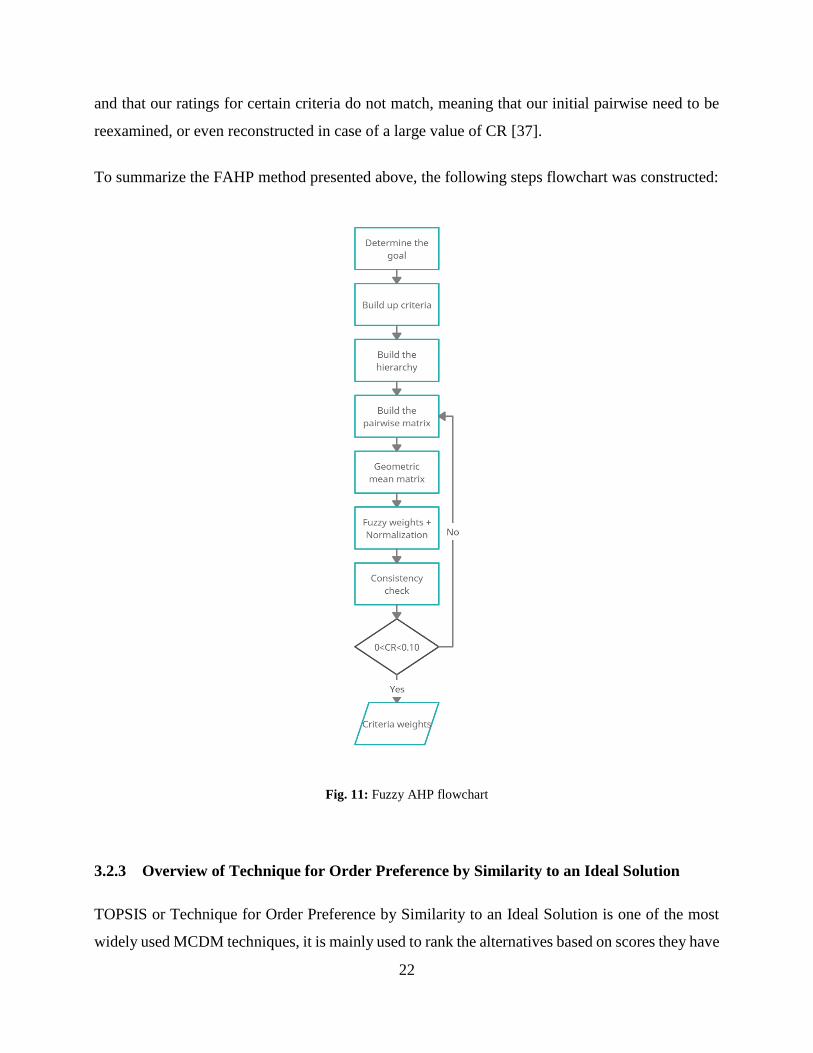
To summarize the FAHP method presented above, the following steps flowchart was constructed:
Fig. 11: Fuzzy AHP flowchart
3.2.3 Overview of Technique for Order Preference by Similarity to an Ideal Solution
TOPSIS or Technique for Order Preference by Similarity to an Ideal Solution is one of the most
widely used MCDM techniques, it is mainly used to rank the alternatives based on scores they have
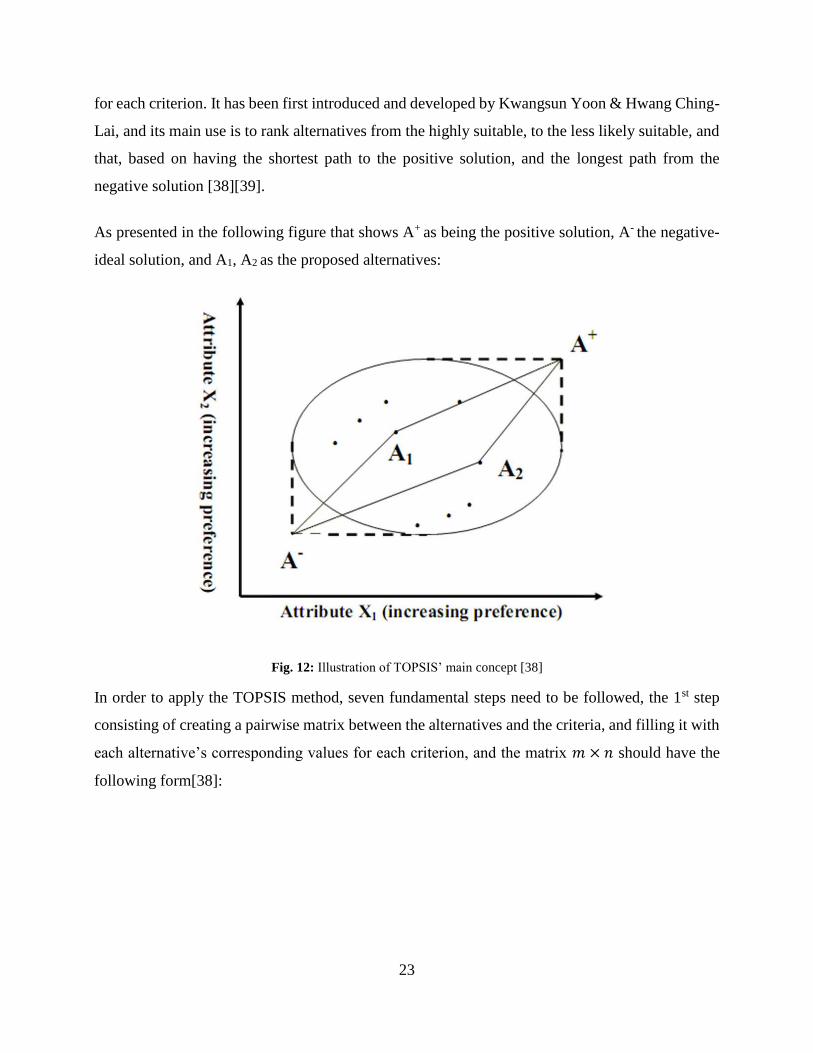
23
for each criterion. It has been first introduced and developed by Kwangsun Yoon & Hwang Ching-
Lai, and its main use is to rank alternatives from the highly suitable, to the less likely suitable, and
that, based on having the shortest path to the positive solution, and the longest path from the
negative solution [38][39].
As presented in the following figure that shows A+ as being the positive solution, A- the negative-
ideal solution, and A1, A2 as the proposed alternatives:
Fig. 12: Illustration of TOPSIS’ main concept [38]
In order to apply the TOPSIS method, seven fundamental steps need to be followed, the 1st step
consisting of creating a pairwise matrix between the alternatives and the criteria, and filling it with
each alternative’s corresponding values for each criterion, and the matrix 𝑚 × 𝑛 should have the
following form[38]:

24
𝑥1 𝑥2 … … 𝑥𝑛
𝑥𝑖𝑗 =
𝐴1
𝐴2
⋮⋮
𝐴𝑚 [ 𝑥11 𝑥12 … … 𝑥1𝑛
𝑥21 𝑥22 … … 𝑥2𝑛
⋮ ⋮ … … ⋮⋮ ⋮ … … ⋮
𝑥𝑚1 𝑥𝑚2 … … 𝑥𝑚𝑛]
Where A is alternatives, xn is the criteria, xmn is the rating for the criteria, n the number of criteria,
and m the number of alternatives.
In the 2nd step, the normalized pairwise matrix is calculated, in order to have a unified point of start,
to perform our analysis, This step is performed first by dividing each score by the magnitude of the
sum of all values of the criterion, as we can see in the following equation[38] :
�̄�𝑖𝑗 = 𝑥𝑖𝑗
√∑ 𝑥𝑖𝑗2𝑛
𝑖=1
(8)
After the normalization process, we plug in the normalized values in the matrix, and with that we
could generate the TOPSIS normalized, which general form looks like the following:
𝑁 =
𝐴1
𝐴2
⋮⋮
𝐴𝑚 [ �̄�11 �̄�12 … … �̄�1𝑛
�̄�21 �̄�22 … … �̄�2𝑛
⋮ ⋮ … … ⋮⋮ ⋮ … … ⋮
�̄�𝑚1 �̄�𝑚2 … … �̄�𝑚𝑛]
We then move to the 3rd step which is facultative, and depends mainly on the preference of the
decision maker, this step that consists of generating a weighted normalized in case of weight vector
𝑤𝑗 = (𝑤1, 𝑤2, … , 𝑤𝑛) was given, calculating the weighted normalized values of the matrix is a
must, in order to do so, we use the following equation[38]:
𝑣𝑖𝑗 = �̄�𝑖𝑗 × 𝑤𝑗 (9)
We then we plug the values back into the matrix, and it becomes as follows[38]:

25
𝑊 =
𝐴1
𝐴2
⋮⋮
𝐴𝑚 [ 𝑣11 𝑣12 … … 𝑣1𝑛
𝑣21 𝑣22 … … 𝑣2𝑛
⋮ ⋮ … … ⋮⋮ ⋮ … … ⋮
𝑣𝑚1 𝑣𝑚2 … … 𝑣𝑚𝑛]
The 4th step consists of calculating the ideal best and the ideal worst value, in this step, criteria
needs to be classified into 2 classes, we need to check whether the criterion is beneficial or non-
beneficial. Beneficial criterion means that the greater its value is, the more beneficial it will be, as
an example a revenue, and non-beneficial criteria means that the larger the value, the least
beneficial this criterion will be, for example cost of production. The following logic is used in
determining the ideal best, and the ideal worst[38].
𝑉+ = {max(𝑣𝑖𝑗) , 𝑖𝑓 𝑥𝑖 𝑖𝑠 𝑏𝑒𝑛𝑒𝑓𝑖𝑐𝑖𝑎𝑙
min(𝑣𝑖𝑗) , 𝑖𝑓 𝑥𝑖 𝑖𝑠 𝑛𝑜𝑛 − 𝑏𝑒𝑛𝑒𝑓𝑖𝑐𝑖𝑎𝑙
𝑉− = {min(𝑣𝑖𝑗) , 𝑖𝑓 𝑥𝑖 𝑖𝑠 𝑏𝑒𝑛𝑒𝑓𝑖𝑐𝑖𝑎𝑙
max(𝑣𝑖𝑗) , 𝑖𝑓 𝑥𝑖 𝑖𝑠 𝑛𝑜𝑛 − 𝑏𝑒𝑛𝑒𝑓𝑖𝑐𝑖𝑎𝑙
With V+, V- being the ideal best, and the ideal worst scenarios respectively.
The main goal of the 5th step is to determine the Euclidean distance of each alternative from the
ideal best V+, and the ideal worst V-, and the tool that allows us to do so is the following:
For the ideal best:
𝑆𝑖+ = [∑ (𝑣𝑖𝑗 − 𝑉+
𝑗)2𝑛
𝑗=1 ]1
2 → 𝑆𝑖+ =
[ 𝑆1
+
𝑆2+
⋮⋮
𝑆𝑛+]
(9)
For the ideal worst:
26
𝑆𝑖− = [∑ (𝑣𝑖𝑗 − 𝑉−
𝑗)2𝑛
𝑗=1 ]1
2 → 𝑆𝑖− =
[ 𝑆1
−
𝑆2−
⋮⋮
𝑆𝑛−]
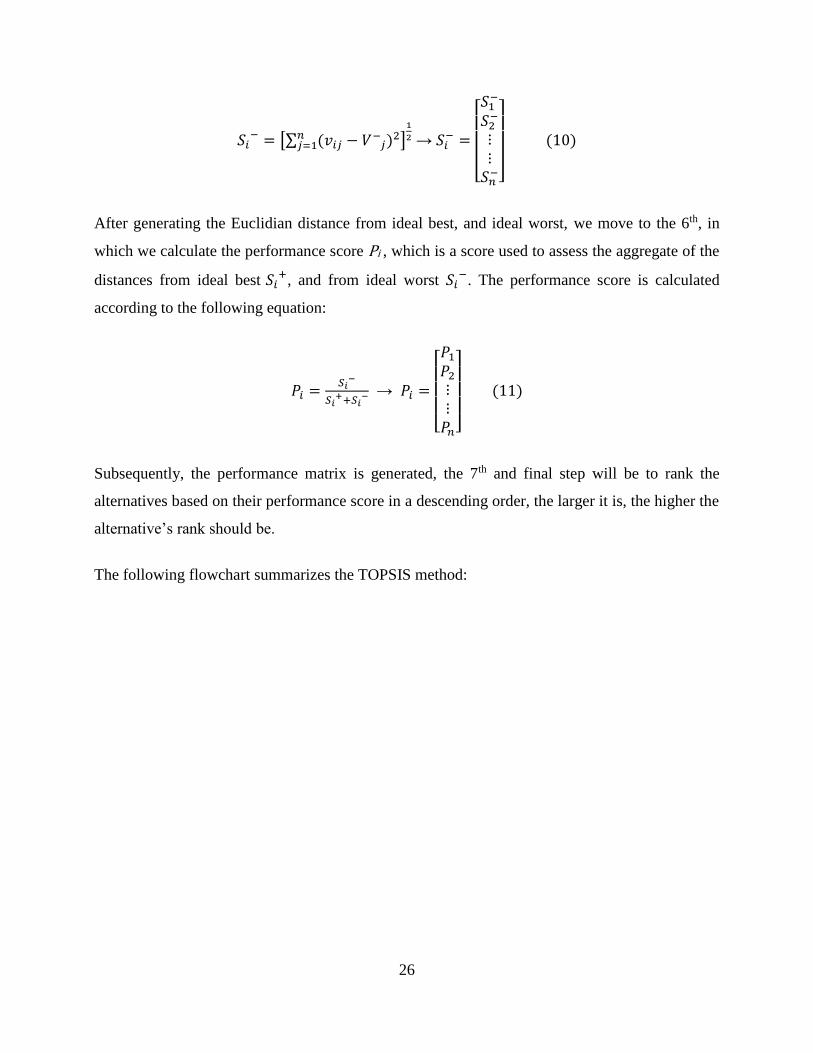
(10)
After generating the Euclidian distance from ideal best, and ideal worst, we move to the 6th, in
which we calculate the performance score Pi , which is a score used to assess the aggregate of the
distances from ideal best 𝑆𝑖+
, and from ideal worst 𝑆𝑖−
. The performance score is calculated
according to the following equation:
𝑃𝑖 =𝑆𝑖
−
𝑆𝑖++𝑆𝑖
− → 𝑃𝑖 =
[ 𝑃1
𝑃2
⋮⋮𝑃𝑛]
(11)
Subsequently, the performance matrix is generated, the 7th and final step will be to rank the
alternatives based on their performance score in a descending order, the larger it is, the higher the
alternative’s rank should be.
The following flowchart summarizes the TOPSIS method:
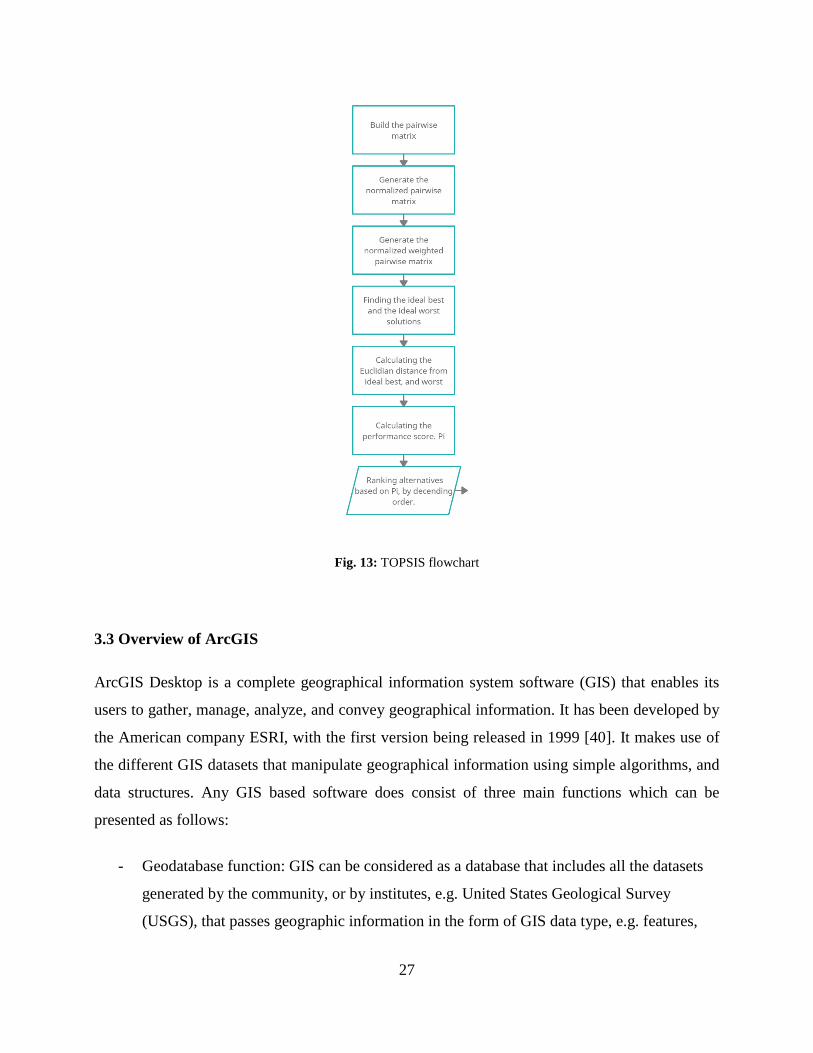
27
Fig. 13: TOPSIS flowchart
3.3 Overview of ArcGIS
ArcGIS Desktop is a complete geographical information system software (GIS) that enables its
users to gather, manage, analyze, and convey geographical information. It has been developed by
the American company ESRI, with the first version being released in 1999 [40]. It makes use of
the different GIS datasets that manipulate geographical information using simple algorithms, and
data structures. Any GIS based software does consist of three main functions which can be
presented as follows:
- Geodatabase function: GIS can be considered as a database that includes all the datasets
generated by the community, or by institutes, e.g. United States Geological Survey
(USGS), that passes geographic information in the form of GIS data type, e.g. features,

28
rasters, shapefile…, and the main data types we’re interested in here are shapefiles, and
rasters. Shapefiles is as the name suggests is made out of shapes that can be in the form of
points, lines, and polygons. Each shapefile contains the geographic location of each of the
previously cited shapes. Whereas rasters can be simply defined as datasets that enclose a
matrix of pixels where each one contains a specific value bounded to a geographical
location.
- Geovisualization function: the GIS software uses intelligent maps in order to display the
features, and the relationship these features have on the earth map. This feature would
help us later on to perform analysis, or edit data easily.
- Geoprocessing function: this function makes use of multiple algorithms, and functions
used by GIS software in order to make transformations, and modifications, to original
datasets, and create new datasets with different arrangements, make calculations, refine
datasets to your need.
ArcGIS proposes all of these features, for geodatabase function, in the form of “catalog”
feature, geovisualization through the world map, and geoprocessing through its toolbox, each
of which will be detailed in due time.
Professionals in many industries use ArcGIS in a wide variety of applications, including
planning and analysis, asset management, operational awareness, field operations such as
mobile inspection and deployment of emergency, market research, resource management,
logistics, education and awareness. Typically, these professionals use ArcGIS because it helps
them in:
- Solving problems, and making optimal decisions.
- Successful planning, and anticipating the changes.
- Managing and executing various operations efficiently.
In our case, five main features will be used to generate suitability maps in ArcGIS:
- Slope: It takes as an input a digital elevation model, and outputs the slope.
- Feature to raster: This function helps convert feature attributes or polygons that we can
find on the table of attributes, into a raster, or a visualization of that feature.

29
- Euclidean distance: This function calculates the Euclidean distance from a certain points
or polygon.
- Reclassify: This function helps reclassifying or modifying the data in order to achieve a
desired output.
- Weighted sum: This function works by multiplying each raster by its specific weight, then
summing up all the rasters to generate a new raster.
- Raster calculator (con): This function helps perform algebra operations on rasters, the
con tool is a conditional function that helps filter out the raster, and keep only the desired
values.
The below procedures have to be followed in order to generate the suitability maps:
Fig. 14: Flowchart for raster suitability map
Fig. 15: Flowchart for Euclidean distance suitability map
Fig. 16: Flowchart for slope suitability map
30
4 RESULTS AND DISCUSSIONS
4.1 Study Area
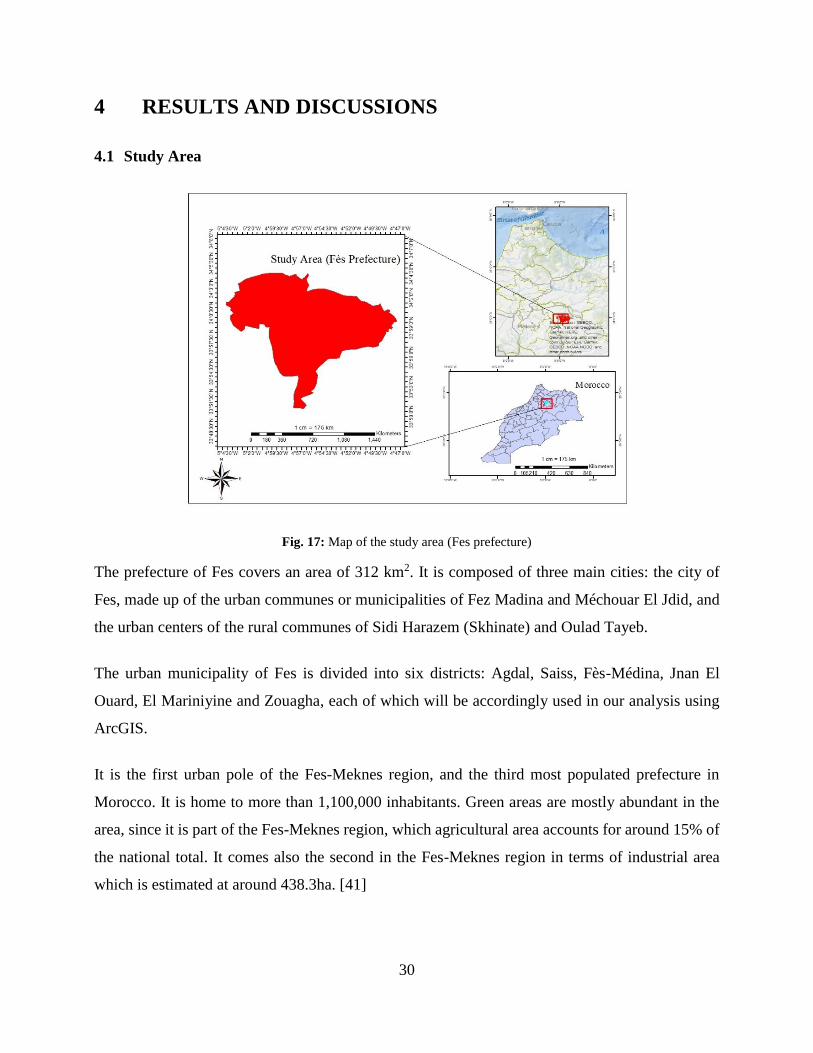
Fig. 17: Map of the study area (Fes prefecture)
The prefecture of Fes covers an area of 312 km2. It is composed of three main cities: the city of
Fes, made up of the urban communes or municipalities of Fez Madina and Méchouar El Jdid, and
the urban centers of the rural communes of Sidi Harazem (Skhinate) and Oulad Tayeb.
The urban municipality of Fes is divided into six districts: Agdal, Saiss, Fès-Médina, Jnan El
Ouard, El Mariniyine and Zouagha, each of which will be accordingly used in our analysis using
ArcGIS.
It is the first urban pole of the Fes-Meknes region, and the third most populated prefecture in
Morocco. It is home to more than 1,100,000 inhabitants. Green areas are mostly abundant in the
area, since it is part of the Fes-Meknes region, which agricultural area accounts for around 15% of
the national total. It comes also the second in the Fes-Meknes region in terms of industrial area
which is estimated at around 438.3ha. [41]
31
4.2 Socio-economic Survey Results’ Analysis
As mentioned in the methodology chapter, a socio-economic survey was performed on a sample
of 167 people, for the sake of determining people’s knowledge, and willingness to switch to e-
mobility as a transportation mode. The survey consisted of 3 main themes:
- Questions related to the respondent’s profile, e.g. the age, and activity status.
- Questions related to the knowledge of the subject.
- Questions related to the constraints of adaptation of e-mobility.
4.2.1 Respondent’s Profile
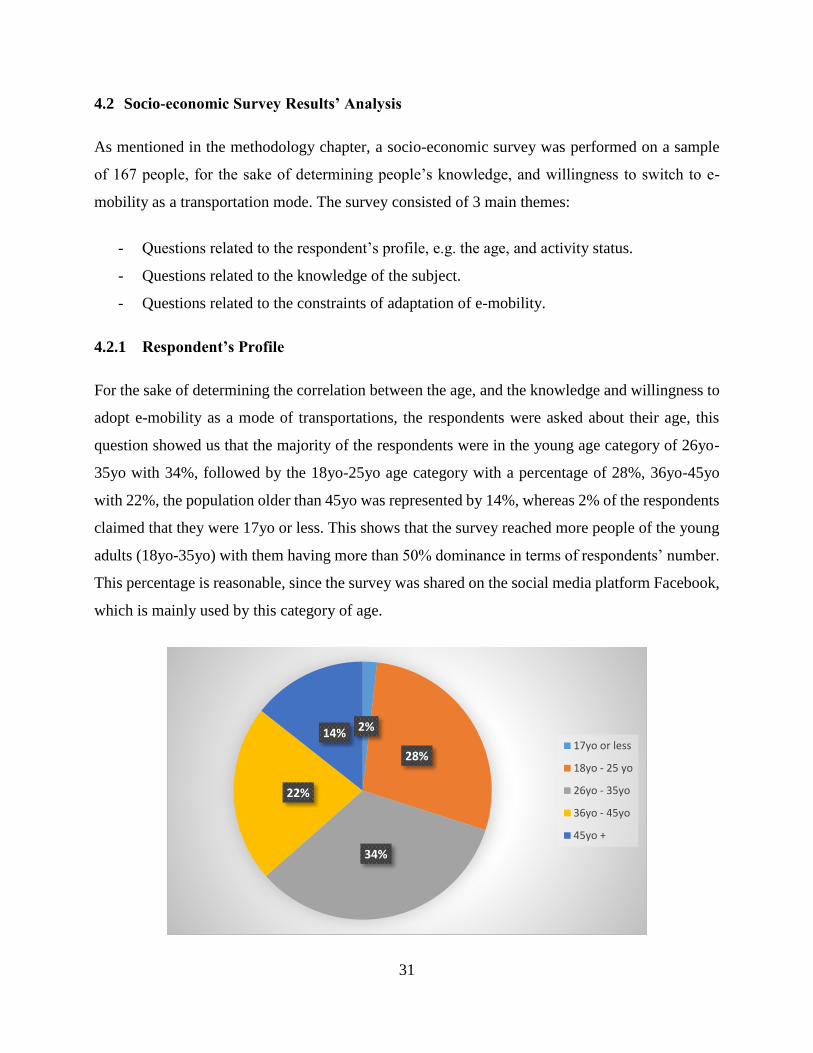
For the sake of determining the correlation between the age, and the knowledge and willingness to
adopt e-mobility as a mode of transportations, the respondents were asked about their age, this
question showed us that the majority of the respondents were in the young age category of 26yo-
35yo with 34%, followed by the 18yo-25yo age category with a percentage of 28%, 36yo-45yo
with 22%, the population older than 45yo was represented by 14%, whereas 2% of the respondents
claimed that they were 17yo or less. This shows that the survey reached more people of the young
adults (18yo-35yo) with them having more than 50% dominance in terms of respondents’ number.
This percentage is reasonable, since the survey was shared on the social media platform Facebook,
which is mainly used by this category of age.
2%
28%
34%
22%
14%17yo or less
18yo - 25 yo
26yo - 35yo
36yo - 45yo
45yo +
32
Fig. 18: Respondents’ age categories
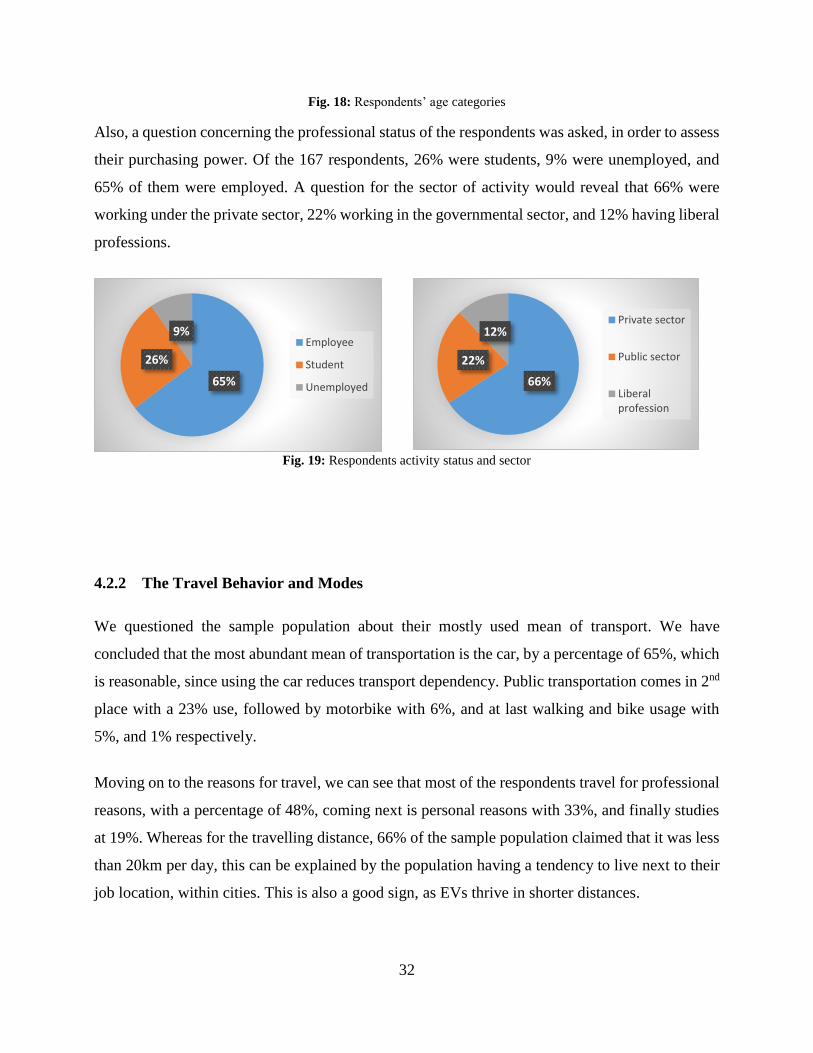
Also, a question concerning the professional status of the respondents was asked, in order to assess
their purchasing power. Of the 167 respondents, 26% were students, 9% were unemployed, and
65% of them were employed. A question for the sector of activity would reveal that 66% were
working under the private sector, 22% working in the governmental sector, and 12% having liberal
professions.
Fig. 19: Respondents activity status and sector
4.2.2 The Travel Behavior and Modes
We questioned the sample population about their mostly used mean of transport. We have
concluded that the most abundant mean of transportation is the car, by a percentage of 65%, which
is reasonable, since using the car reduces transport dependency. Public transportation comes in 2nd
place with a 23% use, followed by motorbike with 6%, and at last walking and bike usage with
5%, and 1% respectively.
Moving on to the reasons for travel, we can see that most of the respondents travel for professional
reasons, with a percentage of 48%, coming next is personal reasons with 33%, and finally studies
at 19%. Whereas for the travelling distance, 66% of the sample population claimed that it was less
than 20km per day, this can be explained by the population having a tendency to live next to their
job location, within cities. This is also a good sign, as EVs thrive in shorter distances.
66%
22%
12%Private sector
Public sector
Liberalprofession
65%
26%
9%Employee
Student
Unemployed

33
For the price of travel, most of the respondents claimed that they were paying less than 500MAD
(43%), which is still a high price, compared to the case of owning an EV where it can go as low as
250MAD per month (see Appendix B). From that, we can conclude that the majority of the
respondents’ traveling behaviors are favorable towards the implementation of EVs.
Fig. 20: Means and reasons of transport
Fig. 21: Travel distance and cost
4.2.3 Awareness and Willingness to Adopt E-Mobility
When asked about their awareness about the existence of EVs in the Moroccan automobile market,
88% of them answered favorably. However, when asked about their willingness to switch to the
use of EVs, the results showed us that 63% of the sample population were for that switch, whereas
37% refused, since the majority were for the switch, this makes our study more valuable.
65%6%
1%
23%
5%
Car
Motorbike
Bike
Publictransportation
Walking
19%
48%
33%
Studies
Professionalreasons
Personalreasons
43%
38%
19%
Less than500mad
Between500mad and1000mad
More than1000mad
66%
25%
9%Less than 20km
Between 20kmand 40km
More than40km

34
4.2.4 Price Tolerance
Here, people were asked about the maximum price they were willing to spend in order to acquire
an EV. The findings were that 41% were not ready for any increase, whereas 43% were willing to
pay an extra 10%, and finally 16% of the population were ready to pay a 20% increase. The
following graph sums up the answers:
Fig. 22: Respondents’ price increase tolerance
4.2.5 Motives of the Acquisition of EVs
We asked people about their motivation to acquire an EV, the question was presented in a checkbox
type, meaning that people can chose more than one answer. It has been found that the main motive
behind acquiring an EV is the positive impact it has on the environment with 72.4%, this shows
that the Moroccans are becoming aware of the dangers of pollution due to the use of fuel has on
the environment. We also found that the second motive is the cheap cost of electricity, which is
true since the price of the kWh in Morocco is at an average of 1.17MAD [42]. The following graph
represents the answers received:
16%
43%
41%
20% increase over aconventional car
10% increase over aconventional car
Not ready for anincrease

35
Fig. 23: Motives for acquiring an EV
4.2.6 Constraints of the Acquisition of EVs
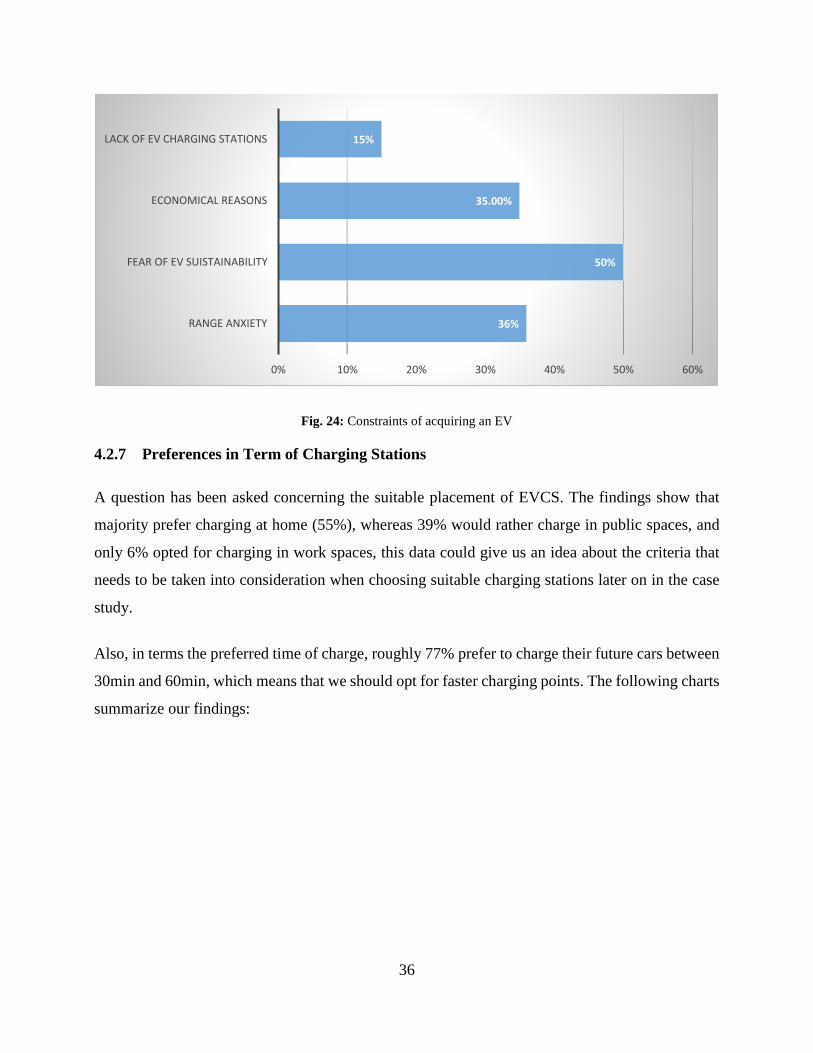
The people who opposed to switch to the use of EVs have been asked about the reasons behind
that. The findings show that the majority were afraid of the sustainability of EVs which
understandable, since it’s something new to us, and people would want to stick with conventional
cars since they have been with us for a long period of time. However, EVs do not require much
maintenance to stay in a good condition, it only requires an annual check, for the state of batteries.
Coming in second place is range anxiety at 36%, which is understandable since EVs have ranges
less than conventional cars. This point is also related to the lack of EV charging stations which
constitutes 15% of total responses, and which is also the main focus of the study.
72.40%
31.40%
50.50%
42.90%
0.00% 10.00% 20.00% 30.00% 40.00% 50.00% 60.00% 70.00% 80.00%
POSTIVE IMPACT ON ENVIRONMENT
CHEAP COST OF MAINTENANCE
CHEAP COST OF ELECTRICITY
THE PLEASURE OF DRIVING
36
Fig. 24: Constraints of acquiring an EV
4.2.7 Preferences in Term of Charging Stations
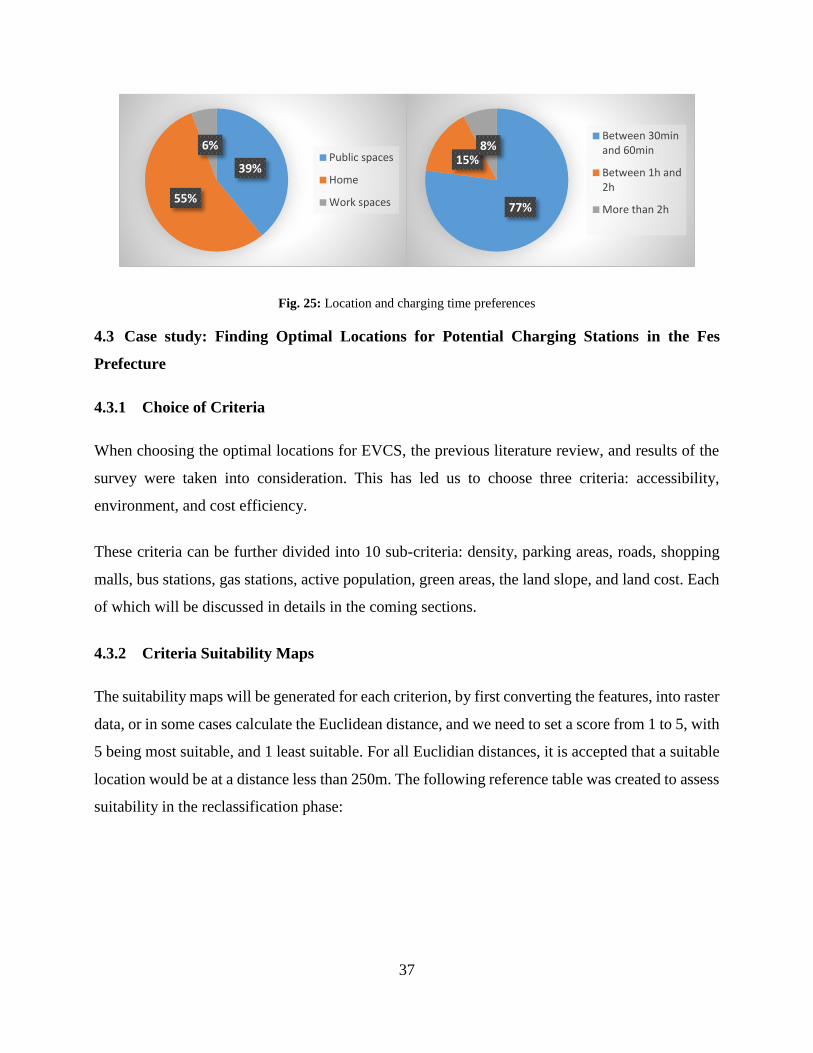
A question has been asked concerning the suitable placement of EVCS. The findings show that
majority prefer charging at home (55%), whereas 39% would rather charge in public spaces, and
only 6% opted for charging in work spaces, this data could give us an idea about the criteria that
needs to be taken into consideration when choosing suitable charging stations later on in the case
study.
Also, in terms the preferred time of charge, roughly 77% prefer to charge their future cars between
30min and 60min, which means that we should opt for faster charging points. The following charts
summarize our findings:
36%
50%
35.00%
15%
0% 10% 20% 30% 40% 50% 60%
RANGE ANXIETY
FEAR OF EV SUISTAINABILITY
ECONOMICAL REASONS
LACK OF EV CHARGING STATIONS
37
Fig. 25: Location and charging time preferences
4.3 Case study: Finding Optimal Locations for Potential Charging Stations in the Fes
Prefecture
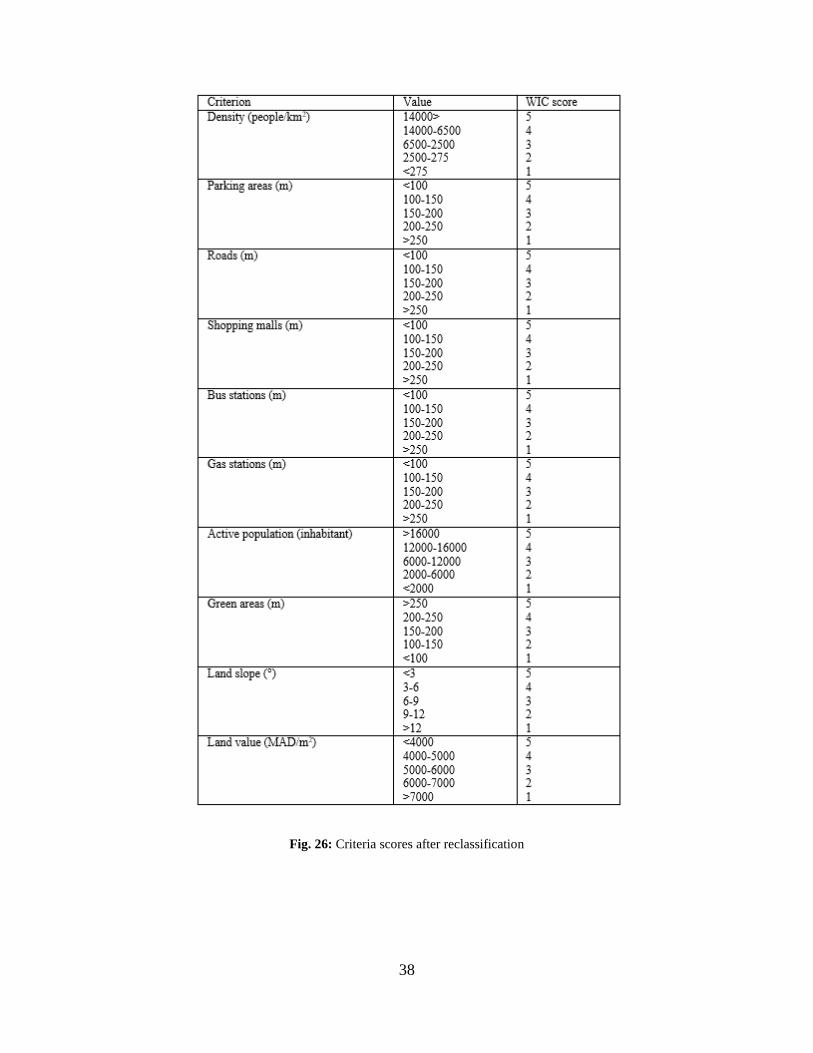
4.3.1 Choice of Criteria
When choosing the optimal locations for EVCS, the previous literature review, and results of the
survey were taken into consideration. This has led us to choose three criteria: accessibility,
environment, and cost efficiency.
These criteria can be further divided into 10 sub-criteria: density, parking areas, roads, shopping
malls, bus stations, gas stations, active population, green areas, the land slope, and land cost. Each
of which will be discussed in details in the coming sections.
4.3.2 Criteria Suitability Maps
The suitability maps will be generated for each criterion, by first converting the features, into raster
data, or in some cases calculate the Euclidean distance, and we need to set a score from 1 to 5, with
5 being most suitable, and 1 least suitable. For all Euclidian distances, it is accepted that a suitable
location would be at a distance less than 250m. The following reference table was created to assess
suitability in the reclassification phase:
39%
55%
6%Public spaces
Home
Work spaces 77%
15%8%
Between 30minand 60min
Between 1h and2h
More than 2h
38
Fig. 26: Criteria scores after reclassification

39
4.3.2.1 Population Density
Charging stations are mostly needed in areas where we find a high population density. The denser
an area is, the more likely to be a high number of EVs users. Hence the location of the EVCS will
be more suitable.
In this analysis, the data for density for each district in the prefecture of Fes has been retrieved
from the monography report of the Fes-Meknes region, made by the HCP (Haut Commissariat au
Plan) [43], and converted into raster datatype using to raster function in ArcGIS.
Fig. 27: Density suitability map
4.3.2.2 Parking Areas
The data retrieved from the survey shows that people would prefer to have charging stations around
parking areas, meaning that the closer the EVCS is to a parking area, the more suitable it will be.
The data for parking areas have been retrieved from a shapefile containing land occupation for
Morocco [44], then we had to extract only the data about parking areas of the Fes prefecture using
extract by mask feature. Those parking areas are constituted of private, and public ones. Hence, the
following suitability map have been generated:

40
Fig. 28: Parking areas suitability map
4.3.2.3 Proximity to Roads
Proximity to roads is an important criterion that should be taken into consideration when choosing
optimal location for EVCS. The data for roads have been retrieved from a shapefile found online
for Morocco [45], and then it had to be refined, in order to create a layer that only contains roads
of Fes prefecture. Euclidian distance has been calculated, and after reclassifying we were able to
generate the following map:
Fig. 29: Proximity to roads suitability map
41
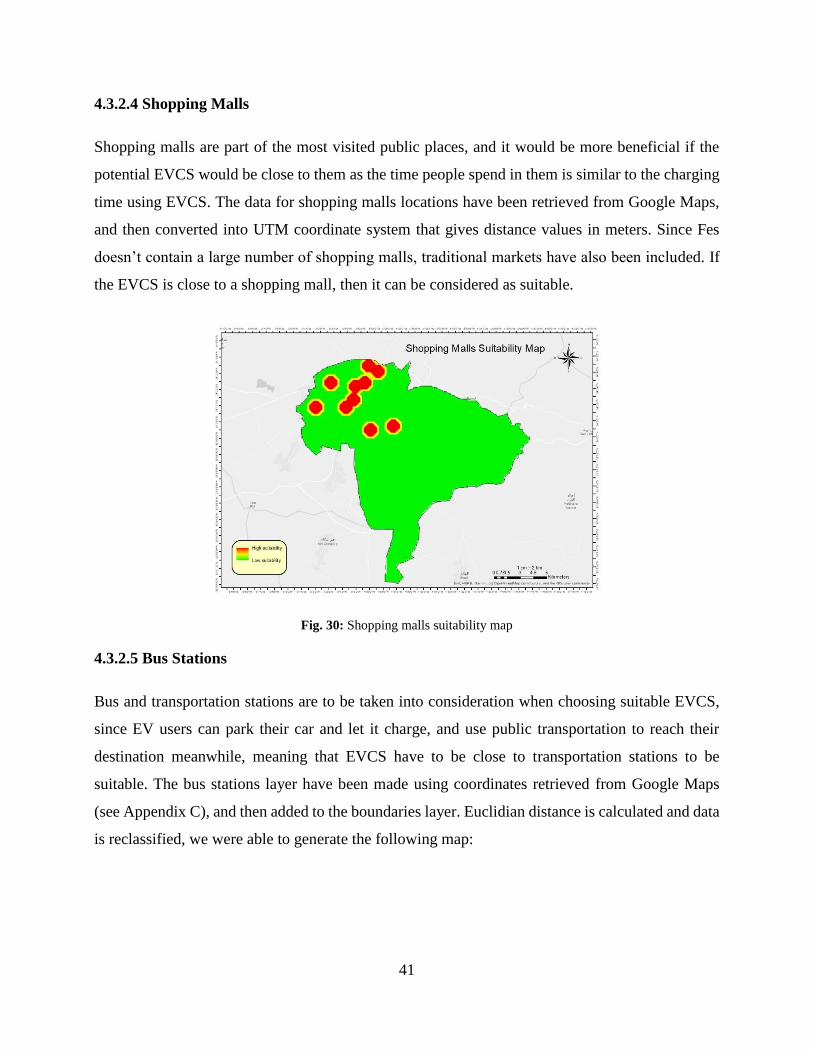
4.3.2.4 Shopping Malls
Shopping malls are part of the most visited public places, and it would be more beneficial if the
potential EVCS would be close to them as the time people spend in them is similar to the charging
time using EVCS. The data for shopping malls locations have been retrieved from Google Maps,
and then converted into UTM coordinate system that gives distance values in meters. Since Fes
doesn’t contain a large number of shopping malls, traditional markets have also been included. If
the EVCS is close to a shopping mall, then it can be considered as suitable.
Fig. 30: Shopping malls suitability map
4.3.2.5 Bus Stations
Bus and transportation stations are to be taken into consideration when choosing suitable EVCS,
since EV users can park their car and let it charge, and use public transportation to reach their
destination meanwhile, meaning that EVCS have to be close to transportation stations to be
suitable. The bus stations layer have been made using coordinates retrieved from Google Maps
(see Appendix C), and then added to the boundaries layer. Euclidian distance is calculated and data
is reclassified, we were able to generate the following map:

42
Fig. 31: Bus stations suitability map
4.3.2.6 Gas Stations
When thinking about suitable locations of EVCS, the first thing that comes in mind is gas stations,
since they were already planned accordingly with the traffic needs, thus, the closer the EVCS to
already existing gas stations, the more suitable the location will be. The gas stations’ layer is created
by using coordinates from Google maps (see Appendix C)
Fig. 32: Gas stations suitability map
43
4.3.2.7 Active Population
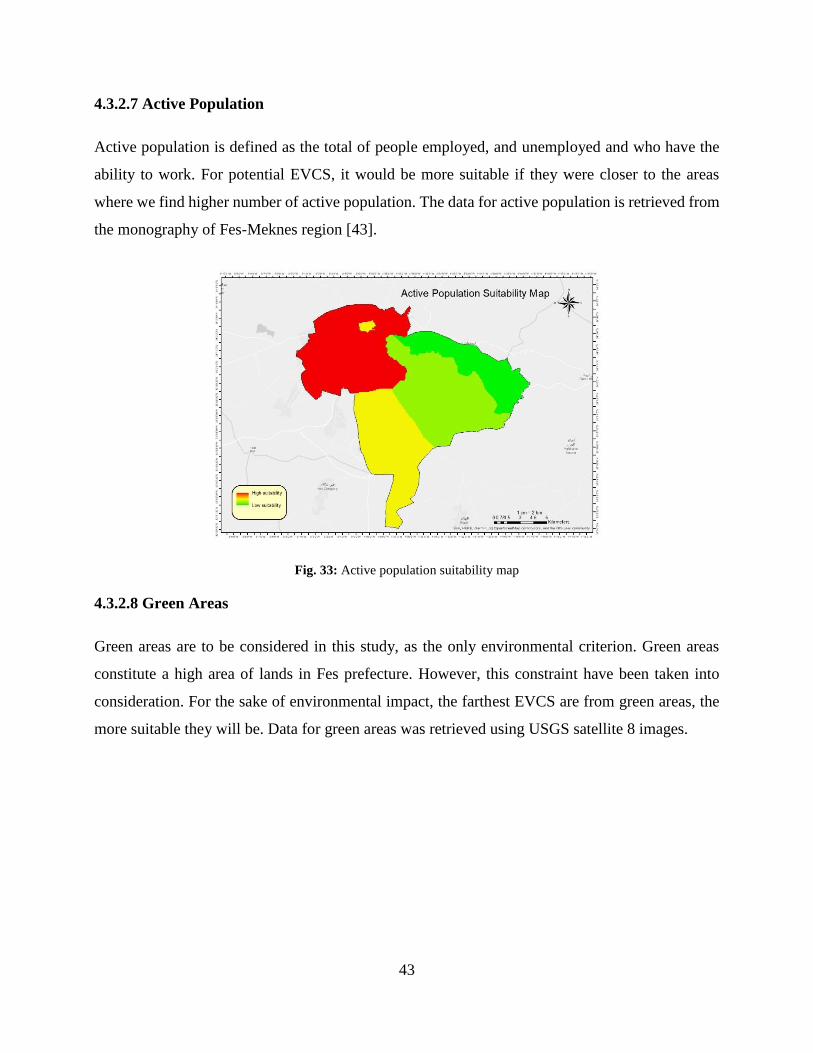
Active population is defined as the total of people employed, and unemployed and who have the
ability to work. For potential EVCS, it would be more suitable if they were closer to the areas
where we find higher number of active population. The data for active population is retrieved from
the monography of Fes-Meknes region [43].
Fig. 33: Active population suitability map
4.3.2.8 Green Areas
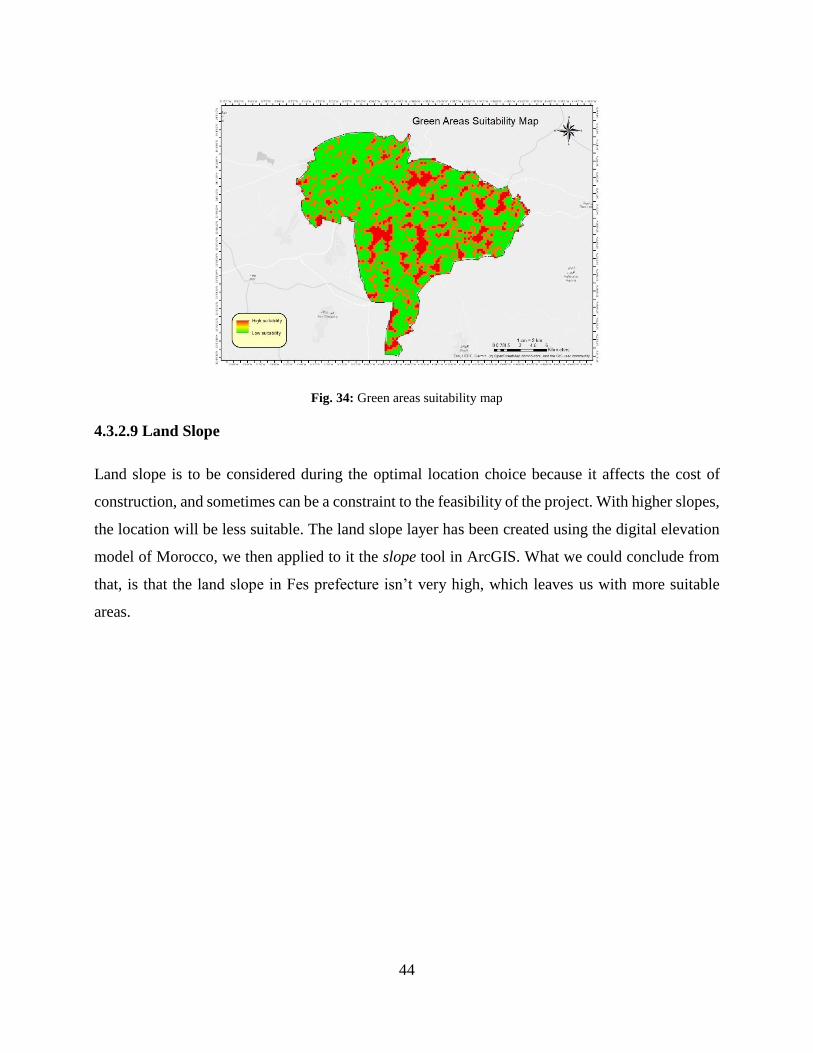
Green areas are to be considered in this study, as the only environmental criterion. Green areas
constitute a high area of lands in Fes prefecture. However, this constraint have been taken into
consideration. For the sake of environmental impact, the farthest EVCS are from green areas, the
more suitable they will be. Data for green areas was retrieved using USGS satellite 8 images.
44
Fig. 34: Green areas suitability map
4.3.2.9 Land Slope
Land slope is to be considered during the optimal location choice because it affects the cost of
construction, and sometimes can be a constraint to the feasibility of the project. With higher slopes,
the location will be less suitable. The land slope layer has been created using the digital elevation
model of Morocco, we then applied to it the slope tool in ArcGIS. What we could conclude from
that, is that the land slope in Fes prefecture isn’t very high, which leaves us with more suitable
areas.

45
Fig. 35: Land slope suitability map
4.3.2.10 Land Value
In order for the location of EVCS to be cost efficient, land value should be taken into account,
meaning that the less costly the land is, the more suitable the location would be. The data for some
districts of Fes prefecture have been retrieved by taking the average from a report for sales of lands
in Fes prefecture [46], and added to the attribute table of the districts’ boundaries.
Fig. 36: Land value suitability map

46
4.3.3 MCDM
4.3.3.1 AHP results
Fig. 37: AHP hierarchy
AHP have been applied in this case to generate weights for each sub-criteria from Fig.37. For our
approach, we have decided to opt for two scenarios. The first one in which we favor accessibility,
and the second where we favor the environmental impact.
We have started first by building a pairwise matrix for sub-criteria of accessibility and cost
efficiency, then, a pairwise matrix has been built for each case. Comparing the three main criteria
which are accessibility, environmental impact, and cost efficiency to make our model more
accurate. The coefficients of importance were taken from Table 1. Below are the pairwise matrices
for each case.
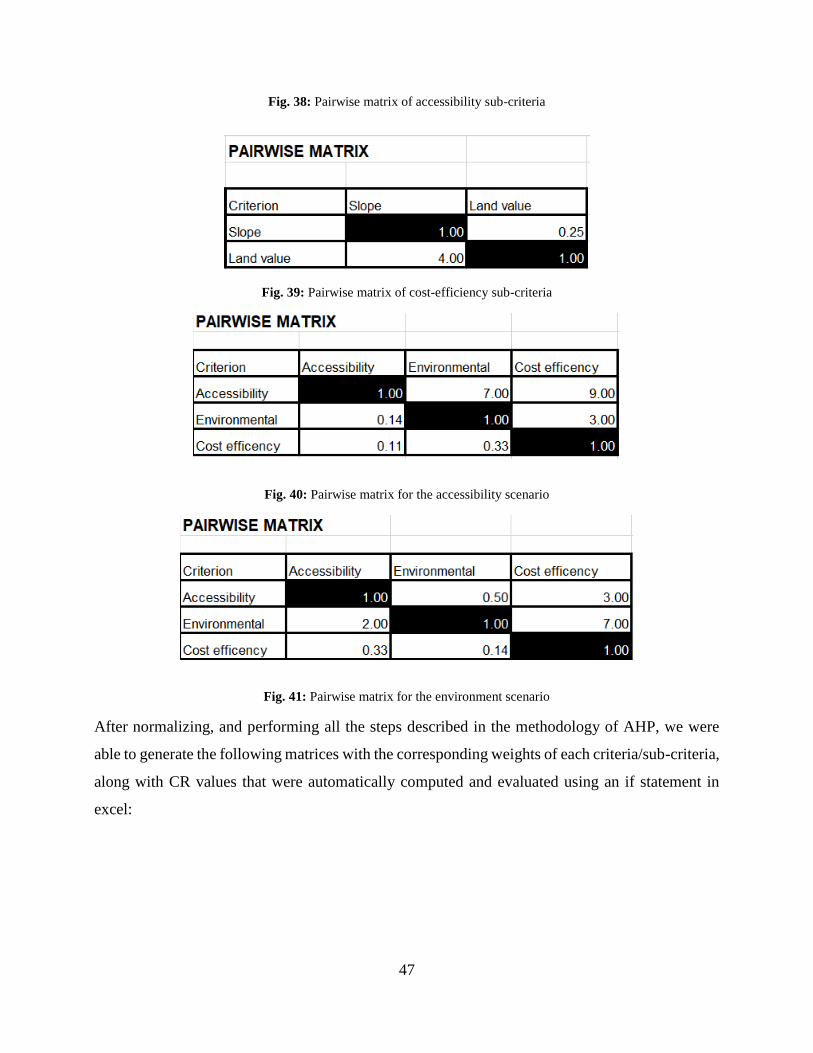
47
Fig. 38: Pairwise matrix of accessibility sub-criteria
Fig. 39: Pairwise matrix of cost-efficiency sub-criteria
Fig. 40: Pairwise matrix for the accessibility scenario
Fig. 41: Pairwise matrix for the environment scenario
After normalizing, and performing all the steps described in the methodology of AHP, we were
able to generate the following matrices with the corresponding weights of each criteria/sub-criteria,
along with CR values that were automatically computed and evaluated using an if statement in
excel:

48
Fig. 42: Standardized matrix of accessibility sub-criteria
Fig. 43: Standardized matrix of cost efficiency sub-criteria
Fig. 44: Standardized matrix of the accessibility scenario
Fig. 45: Standardized matrix of the environmental impact scenario
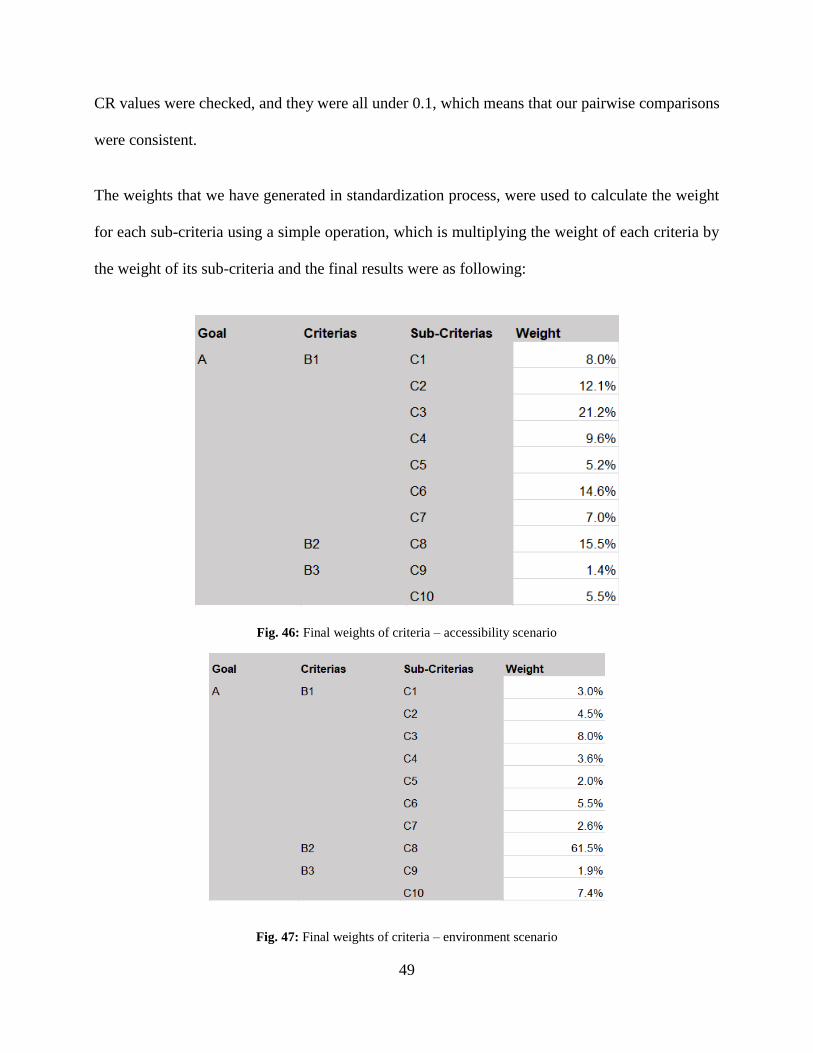
49
CR values were checked, and they were all under 0.1, which means that our pairwise comparisons
were consistent.
The weights that we have generated in standardization process, were used to calculate the weight
for each sub-criteria using a simple operation, which is multiplying the weight of each criteria by
the weight of its sub-criteria and the final results were as following:
Fig. 46: Final weights of criteria – accessibility scenario
Fig. 47: Final weights of criteria – environment scenario

50
4.3.3.2 Fuzzy AHP Results
Fig. 48: Fuzzy AHP Hierarchy
We have also decided to use the FAHP as a way to minimize the margin of error, and be sure about
our estimation. In this case, we have opted to use the ten criteria without having them clustered just
like we did in AHP, because FAHP already gives a freedom to the user, since it uses the triangular
numbers. Below is the pairwise matrix generated for FAHP approach:
Fig. 49: Pairwise matrix for Fuzzy AHP
After normalization, and applying the methods described in the methodology chapter, it has
resulted in the following matrix and weights:
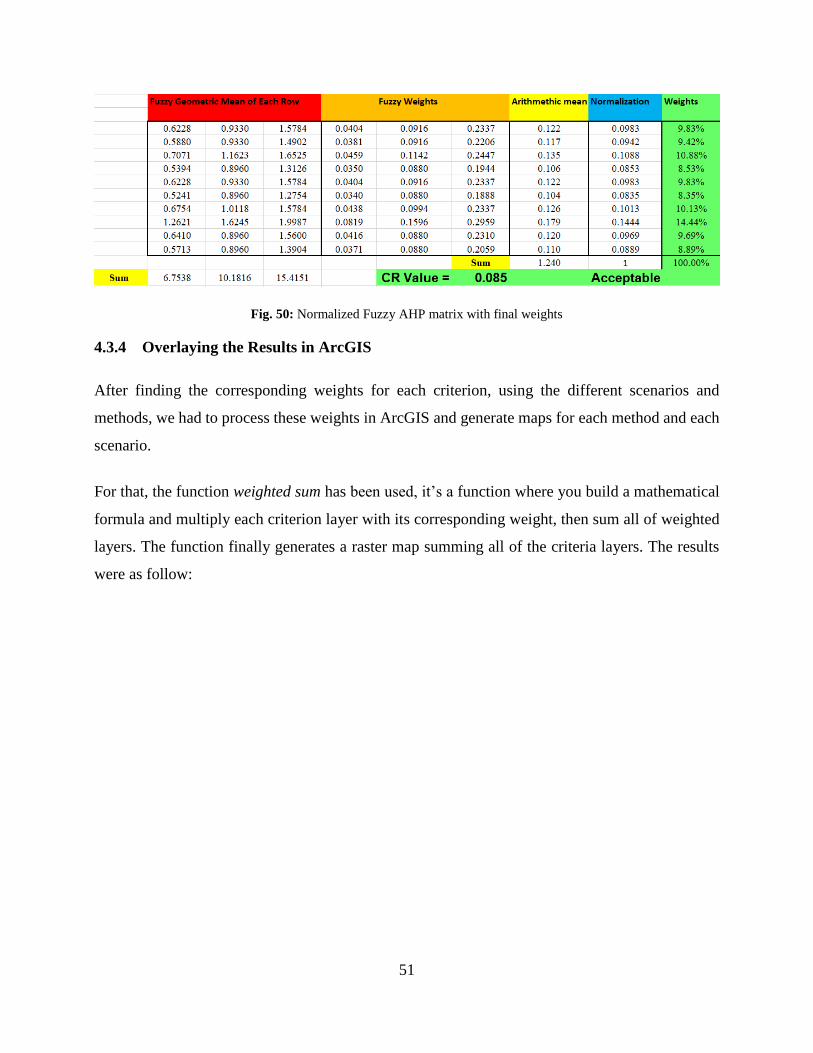
51
Fig. 50: Normalized Fuzzy AHP matrix with final weights
4.3.4 Overlaying the Results in ArcGIS
After finding the corresponding weights for each criterion, using the different scenarios and
methods, we had to process these weights in ArcGIS and generate maps for each method and each
scenario.
For that, the function weighted sum has been used, it’s a function where you build a mathematical
formula and multiply each criterion layer with its corresponding weight, then sum all of weighted
layers. The function finally generates a raster map summing all of the criteria layers. The results
were as follow:

52
Fig. 51: Suitability map for AHP accessibility scenario
Fig. 52: Suitability map for AHP environmental impact scenario
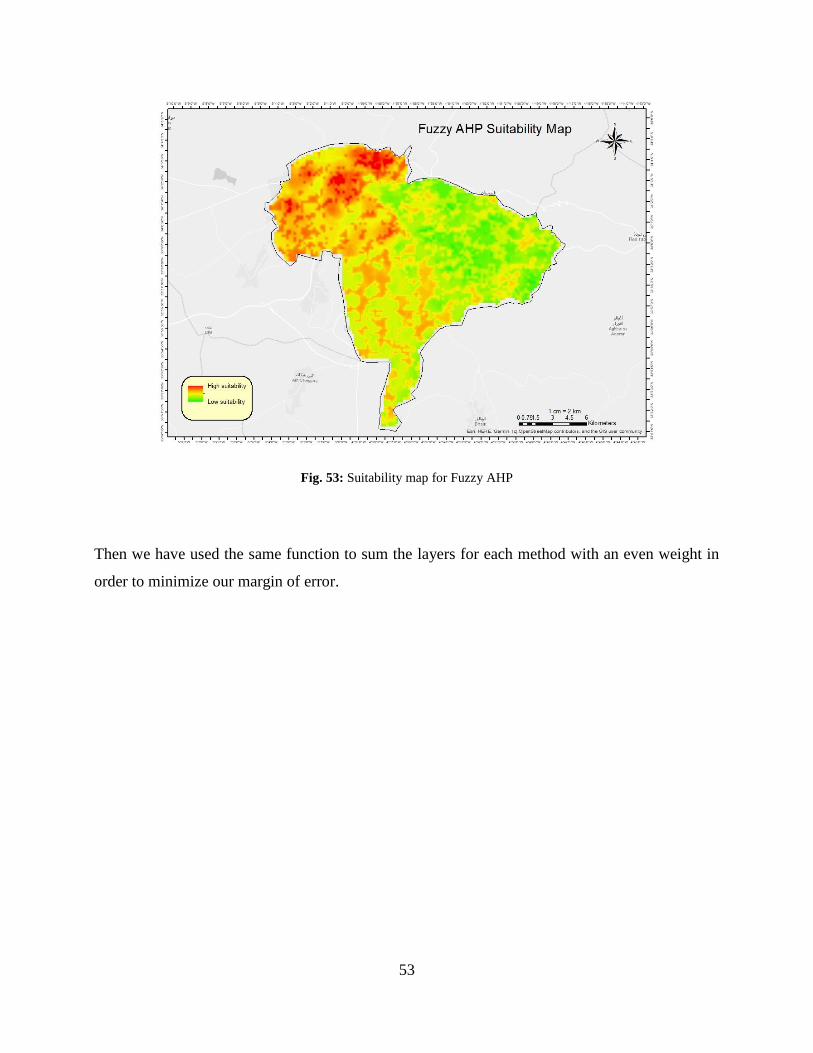
53
Fig. 53: Suitability map for Fuzzy AHP
Then we have used the same function to sum the layers for each method with an even weight in
order to minimize our margin of error.
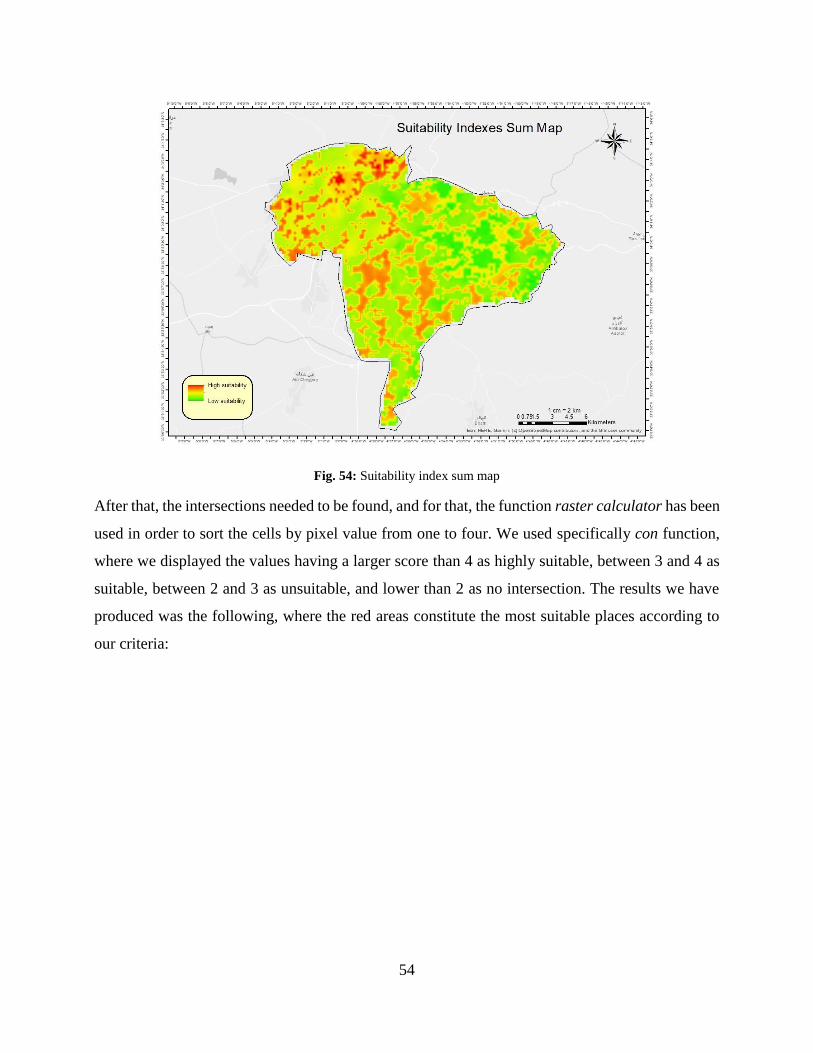
54
Fig. 54: Suitability index sum map
After that, the intersections needed to be found, and for that, the function raster calculator has been
used in order to sort the cells by pixel value from one to four. We used specifically con function,
where we displayed the values having a larger score than 4 as highly suitable, between 3 and 4 as
suitable, between 2 and 3 as unsuitable, and lower than 2 as no intersection. The results we have
produced was the following, where the red areas constitute the most suitable places according to
our criteria:

55
Fig. 55: Intersection map
In order to visualize it better, markers have been put manually, as we can see in the next two figures:
Fig. 56: Alternative EVCS map
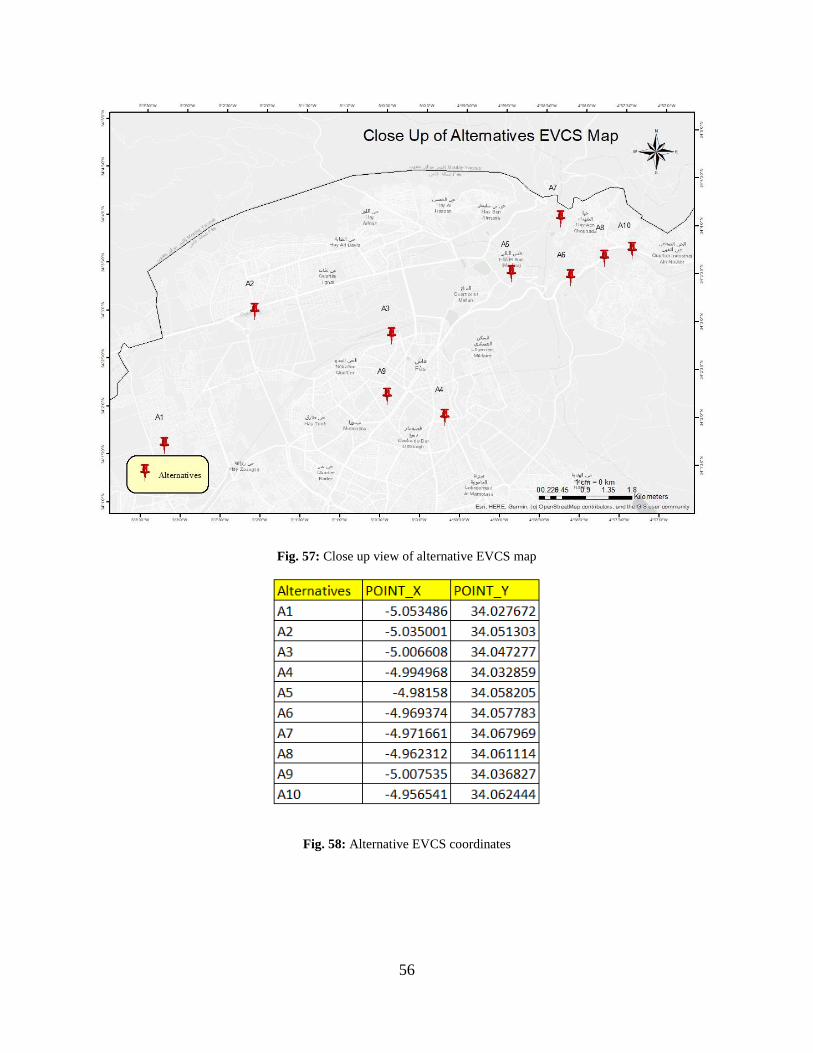
56
Fig. 57: Close up view of alternative EVCS map
Fig. 58: Alternative EVCS coordinates

57
4.3.5 Ranking Alternatives Using TOPSIS
As stated in the methodology chapter, TOPSIS method has been used to rank the alternative
locations. Two approaches have been taken, one where we use the weights generated from the AHP
accessibility scenario, and a second where we consider the criteria weights as being even. In order
to retrieve the values of each criterion for each alternative, the ArcGIS pixel inspector tool has been
used to display the pixel value of each alternative, which will later be used in generating the
pairwise matrix for TOPSIS. After entering the pixel value for each alternative we could set up the
following comparison matrix:
Fig. 59: Initial TOPSIS comparison matrix
Fig. 60: Normalized TOPSIS matrix

58
Fig. 61: Weighted normalized TOPSIS matrix
Fig. 62: Alternatives ranking using even weights
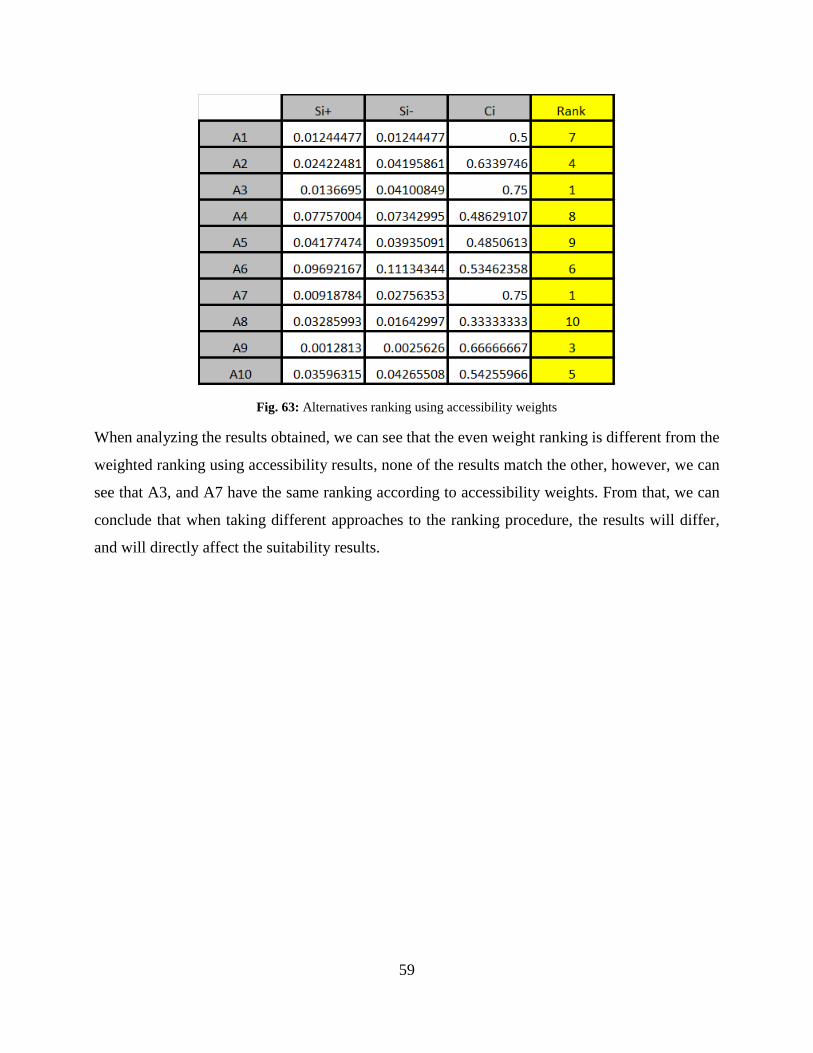
59
Fig. 63: Alternatives ranking using accessibility weights
When analyzing the results obtained, we can see that the even weight ranking is different from the
weighted ranking using accessibility results, none of the results match the other, however, we can
see that A3, and A7 have the same ranking according to accessibility weights. From that, we can
conclude that when taking different approaches to the ranking procedure, the results will differ,
and will directly affect the suitability results.

60
5 STEEPLE ANALYSIS
Societal:
- Raise awareness concerning the use of electric vehicles instead of the gas ones.
Technological:
- We made use of mathematical equations, and GIS technology that will serve as a basis for our
choice of optimized locations for charging stations.
Environmental:
- The shift from the use of gas fueled vehicles to electric ones will result in less CO2 emissions,
thus, a cleaner environment.
- The environmental impact was taken into consideration when choosing the suitable locations, in
such way that it has to be far from green areas.
Ethical:
- All the information and sources that were used in this project are ethical, and followed all
principles of honesty.
Political:
- Our project might have an impact on the political level, as it could be an endorsement to a
candidate’s working plan.
Legal:
- This project goes along with the government’s laws and plans towards renewable energies’
management and development.
Economical:
61
- Positive impact on the economical level, as the price for electricity is cheaper than the price of
gas and is also more sustainable.
- Cost efficiency has been taken into consideration when choosing optimal locations through slope,
and land value criteria.
6 CONCLUSION AND FUTURE WORK
The issue of air pollution caused by excessive emissions of CO2 has raised the concerns of many
experts and specialists. The consequences of this raise are not to be neglected, and possible
solutions had to be found. One of these solutions is the adoption of e-mobility, which aims to
substitute the use of conventional petroleum vehicles by electric or hybrid ones. As presented
throughout the project, this alternative traveling mode represents the future of transportation, and
has the potential to become the dominant mean of transportation- especially in Morocco where
there is still ground for research and development.
Throughout the project, the people’s willingness to shift to the use of EVs has been assessed
through a socio-economic survey in order to evaluate the feasibility of our study. Moreover, the
second part consisted of a case study for the Fes prefecture in order to determine the most suitable
locations for EVCS, by using MCDM techniques and ArcGIS geo-analysis features. This study has
been successful as we were able to determine ten suitable EVCS spots, and ranked those
accordingly using different approaches.
However, the criteria that have been chosen for the study have been shown to favor urban areas
over rural areas, all of the ten alternative charging stations were found to be within the urban
perimeter of Fes prefecture. For future work, more research should be done as to include EVCS
location choice criteria that guarantees equal chances between urban, and rural areas. Also, the
electricity grid has to be taken into consideration, because EVCS will represent an extra load on it,
and simulations have to be done accordingly in order to insure its safety.

62
7 REFERENCES
[1] R. Showstack, “World's Heavy Dependence on Fossil Fuels Projected to Continue,” Eos, 18-
Sep-2017. [Online]. Available: https://eos.org/articles/worlds-heavy-dependence-on-fossil-
fuels-projected-to-continue.
[2] M. E. Mann, “Global warming,” Encyclopædia Britannica, 16-Mar-2021. [Online]. Available:
https://www.britannica.com/science/global-warming.
[3] E. Mazareanu, “Topic: Logistics industry worldwide,” Statista, 25-Jan-2021. [Online].
Available: https://www.statista.com/topics/5691/logistics-industry-worldwide.
[4] R. Rapier, “Fossil Fuels Still Supply 84 Percent Of World Energy - And Other Eye Openers
From BP's Annual Review,” Forbes, 20-Jun-2020. [Online]. Available:
https://www.forbes.com/sites/rrapier/2020/06/20/bp-review-new-highs-in-global-energy-
consumption-and-carbon-emissions-in-2019/?sh=389cd0c766a1.
[5] C. Deluzarche, “Transport et CO2 : quelle part des émissions ?,” Futura, 27-Nov-2019.
[Online]. Available: https://www.futura-sciences.com/planete/questions-reponses/pollution-
transport-co2-part-emissions-1017/.
[6] Mira Okshevsky & Let's Talk Science and M. Okshevsky, “Cows, Methane, and Climate
Change,” Let's Talk Science, 15-Mar-2020. [Online]. Available:
https://letstalkscience.ca/educational-resources/stem-in-context/cows-methane-and-climate-
change.
[7] H. Ritchie and M. Roser, “CO2 emissions,” Our World in Data, May-2017. [Online]. Available:
https://ourworldindata.org/co2-emissions.
[8] NASA, “Global Warming,” NASA, 03-Jun-2010. [Online]. Available:
https://earthobservatory.nasa.gov/features/GlobalWarming/page2.php.
[9] N.-A. Mörner, “Global Sea Level Variations,” Research Gate, Jul. 2018.

63
[10] Haut Commissariat au Plan, “ANNUAIRE STATISTIQUE DU MAROC, Année 2019” HCP,
Rabat, Morocco, rep., 2020.
[11] N. Machouri, “Le secteur des transports et la pollution atmosphérique au Maroc,” 2008.
[Online]. Available: https://www.sifee.org/static/uploaded/Files/ressources/actes-des-
colloques/geneve/session-10/7_Machouri_comm.pdf.
[12] Haut Commissariat au Plan, “STATISTIQUES ENVIRONNEMENTALES AU MAROC”
HCP, Rabat, Morocco, rep., 2008.
[13] SPI Lasers, “What is Electro Mobility (e-mobility) ? ,” 09-Dec-2020. [Online]. Available:
https://www.spilasers.com/case-study-e-mobility/what-is-e-mobility/.
[14] A. C. Mersky, F. Sprei, C. Samaras, and Z. S. Qian, “Effectiveness of incentives on electric
vehicle adoption in Norway,” Transportation Research Part D: Transport and Environment,
vol. 46, pp. 56–68, 2016.
[15] W. Li, M. Yang, and S. Sandu, “Electric vehicles in China: A review of current policies,”
Energy & Environment, vol. 29, no. 8, pp. 1512–1524, 2018.
[16] C. Midler and F. Von Pechmann, “Du véhicule électrique à l’électromobilité,” Le journal de
l'école de Paris du management, vol. 114, no. 4, p. 8, 2015.
[17] G. Santos and H. Davies, “Incentives for quick penetration of electric vehicles in five
European countries: Perceptions from experts and stakeholders,” Transportation Research
Part A: Policy and Practice, vol. 137, pp. 326–342, 2020.
[18] H. Diab, “EV READINESS ASSESSMENT,” 2018. [Online]. Available:
http://www.uemi.net/uploads/4/8/9/5/48950199/uemi_ev_readiness_morocco1.pdf.
[19] H. Ben Sassi, C. Alaoui, F. Errahimi, and N. Es-Sbai, “Vehicle-to-grid technology and its
suitability for the Moroccan national grid,” Journal of Energy Storage, vol. 33, 2021.
64
[20] ALD Automotive, “AUTOROUTES DU MAROC: INSTALLATION DES PREMIÈRES
BORNES DE RECHARGE DES VÉHICULES ÉLECTRIQUES,” 13-Apr-2020. [Online].
Available: https://www.aldautomotive.ma/qui-sommes-nous-
/news/articleid/2755/autoroutes-du-maroc-installation-des-premi%C3%A8res-bornes-de-
recharge-des-v%C3%A9hicules-%C3%A9lectriques.
[21] Voiture électrique et hybride au Maroc, “Map des bornes de recharges au Maroc.” [Online].
Available: http://www.voitureelectrique.ma/borne-de-recharge-maroc/.
[22] R. Philipsen, T. Schmidt, and M. Ziefle, “A Charging Place to Be - Users’ Evaluation Criteria
for the Positioning of Fast-charging Infrastructure for Electro Mobility,” Procedia
Manufacturing, vol. 3, pp. 2792–2799, 2015.
[23] M. De Gennaro, E. Paffumi, and G. Martini, “Customer-driven design of the recharge
infrastructure and Vehicle-to-Grid in urban areas: A large-scale application for electric
vehicles deployment,” Energy, vol. 82, pp. 294–311, 2015.
[24] N. Andrenacci, R. Ragona, and G. Valenti, “A demand-side approach to the optimal
deployment of electric vehicle charging stations in metropolitan areas,” Applied Energy, vol.
182, pp. 39–46, 2016.
[25] H. Cai, X. Jia, A. S. F. Chiu, X. Hu, and M. Xu, “Siting public electric vehicle charging
stations in Beijing using big-data informed travel patterns of the taxi fleet,” Transportation
Research Part D: Transport and Environment, vol. 33, pp. 39–46, 2014.
[26] N. Shahraki, H. Cai, M. Turkay, and M. Xu, “Optimal locations of electric public charging
stations using real world vehicle travel patterns,” Transportation Research Part D: Transport
and Environment, vol. 41, pp. 165–176, 2015.
[27] P. Morrissey, P. Weldon, and M. O’Mahony, “Future standard and fast charging infrastructure
planning: An analysis of electric vehicle charging behaviour,” Energy Policy, vol. 89, pp.
257–270, 2016.
65
[28] A. Abdoun, “Voiture électrique : le Maroc a des parts à prendre dans la compétition mondiale,”
Challenge Maroc, 08-Feb-2021. [Online]. Available: https://www.challenge.ma/voiture-
electrique-le-maroc-a-des-parts-a-prendre-dans-la-competition-mondiale-174578/.
[29] M. Nassar, “Morocco launches its 1st local-made smart charger of e-vehicles,” Csr Egypt, 21-
Dec-2020. [Online]. Available: https://www.csregypt.com/en/morocco-launches-its-1st-
local-made-smart-charger-of-e-vehicle/.
[30] D. Guler and T. Yomralioglu, “Suitable location selection for the electric vehicle fast charging
station with AHP and fuzzy AHP methods using GIS,” Annals of GIS, vol. 26, no. 2, pp. 169–
189, 2020.
[31] Y. Zhong, D. Chen, G. Cui, Y. Jia, L. Li, and Y. Liao, “The Theory of Multi-criteria and
Multiple Constraint-level Linear Programming for Oilfield Development,” Procedia
Computer Science, vol. 17, pp. 141–148, 2013.
[32] W. L. Etter, “BENJAMIN FRANKLIN AND PRUDENTIAL ALGEBRA,” Decision
Sciences, vol. 5, no. 1, pp. 145–147, 1974.
[33] R. L. Keeney, H. Raiffa, and D. W. Rajala, “Decisions with Multiple Objectives: Preferences
and Value Trade-Offs,” IEEE Transactions on Systems, Man, and Cybernetics, vol. 9, no. 7,
pp. 403–403, 1979.
[34] S. Zionts, “MCDM—If Not a Roman Numeral, Then What?,” Interfaces, vol. 9, no. 4, pp. 94–
101, 1979.
[35] T. L. Saaty, “A scaling method for priorities in hierarchical structures,” Journal of
Mathematical Psychology, vol. 15, no. 3, pp. 234–281, 1977.
[36] M. Akalin, G. Turhan, and A. Sahin, “The Application of AHP Approach for Evaluating
Location Selection Elements for Retail Store,” International Journal of Research in Business
and Social Science (2147-4478), vol. 2, no. 4, pp. 01–20, 2013.
66
[37] S. Sharp and P. Hall, “Fuzzy AHP Group Decision Analysis and its Application for the
Evaluation of Energy Sources,” 2009.
[38] Y.-J. Lai, T.-Y. Liu, and C.-L. Hwang, “TOPSIS for MODM,” European Journal of
Operational Research, vol. 76, no. 3, pp. 486–500, 1994.
[39] V. Balioti, C. Tzimopoulos, and C. Evangelides, “Multi-Criteria Decision Making Using
TOPSIS Method Under Fuzzy Environment. Application in Spillway Selection,”
Proceedings, vol. 2, no. 11, p. 637, 2018.
[40] ESRI, “Qu'est-ce que ArcGIS ?,” ArcGIS Resource Center. [Online]. Available:
https://resources.arcgis.com/fr/help/getting-started/articles/026n00000014000000.htm.
[41] “Fès,” Région Fès Meknès, 04-Apr-2018. [Online]. Available: http://www.region-fes-
meknes.ma/fr/provinces/fes/.
[42] Z. Mokadmi and B. Rahmouni, “Electric Energy Value Chain In Morocco,”
INTERNATIONAL JOURNAL OF SCIENTIFIC & TECHNOLOGY RESEARCH , vol. 8, no.
12, pp. 3830–3835, Dec. 2019.
[43] Haut Commissariat au Plan, “Annuaire Statistique Régional Fès-Meknès” HCP, Rabat,
Morocco, rep., 2019.
[44] Geomatic_content, “Découpage administratif du Maroc,” ArcGIS Hub, 31-May-2018.
[Online]. Available: https://hub.arcgis.com/datasets/21bcbcaa915c433ba7c7850bafeede7b.
[45] DIVA-GIS, “Spatial Data Download - Morocco Roads,” DIVA. [Online]. Available:
https://www.diva-gis.org/datadown.
[46] Direction Générale des Impôts , “Référentiel des Prix des Transactions Immobilières de FES
,” 2017. [Online]. Available: https://portail.tax.gov.ma/wps/wcm/connect/2a28961f-681c-
4a6e-8ae1
b85d22d96b83/r%C3%A9f+Fes+final+10052017.pdf?MOD=AJPERES&CACHEID=2a28
961f-681c-4a6e-8ae1-b85d22d96b83.

67
APPENDIX A : Project Initial Specification
BENAA Houssam EMS FEASIBILITY STUDY FOR E-MOBILITY IN THE FES-MEKNES REGION PR. RACHID LGHOUL SPRING 2021 The main purpose of this capstone project is to study the feasibility of e-mobility implementation in the Fes-Meknes region, with a goal of minimizing the gas emissions resulting from the use of gas powered vehicles. The analysis phase will consist of three parts. In the first part, there will be a talk about e-mobility in the global context, and its current level of development, and how it has changed the world ever since its beginning. In the second part, an introduction about the study region will be introduced, along with some key data that will help us in drawing conclusions in the design phase. The third part which will consist of performing a survey concerning people’s willingness to take part in such operation, starting from collecting data about the survey takers, their willingness to switch to electrical vehicles, how much they are willing to pay, etc, and making visualizations out of this data. After finishing the analysis part, it’s time for the design part to start. The idea here is to find a way in which we can implement our e-mobility approach, in order to make the charging stations as reachable as possible to people of Fes-Meknes region, also after collecting data, we can find alternative solutions for mobility inside of big cities such as e-bikes, etc… The implementation and testing part will consist of the use of some mathematical equations, along with the use maps, in order to solve for the optimal points in which the charging stations can be centred and most reachable to almost all the region’s population, also we will use the same approach in order to have stations for e-bikes. For the social impact, we can say that this project can raise awareness about the positive environmental impact this shift from gas powered vehicles, to electrical vehicles. As for the ethical impact, this project respects the ethics of innovation and engineering processes.
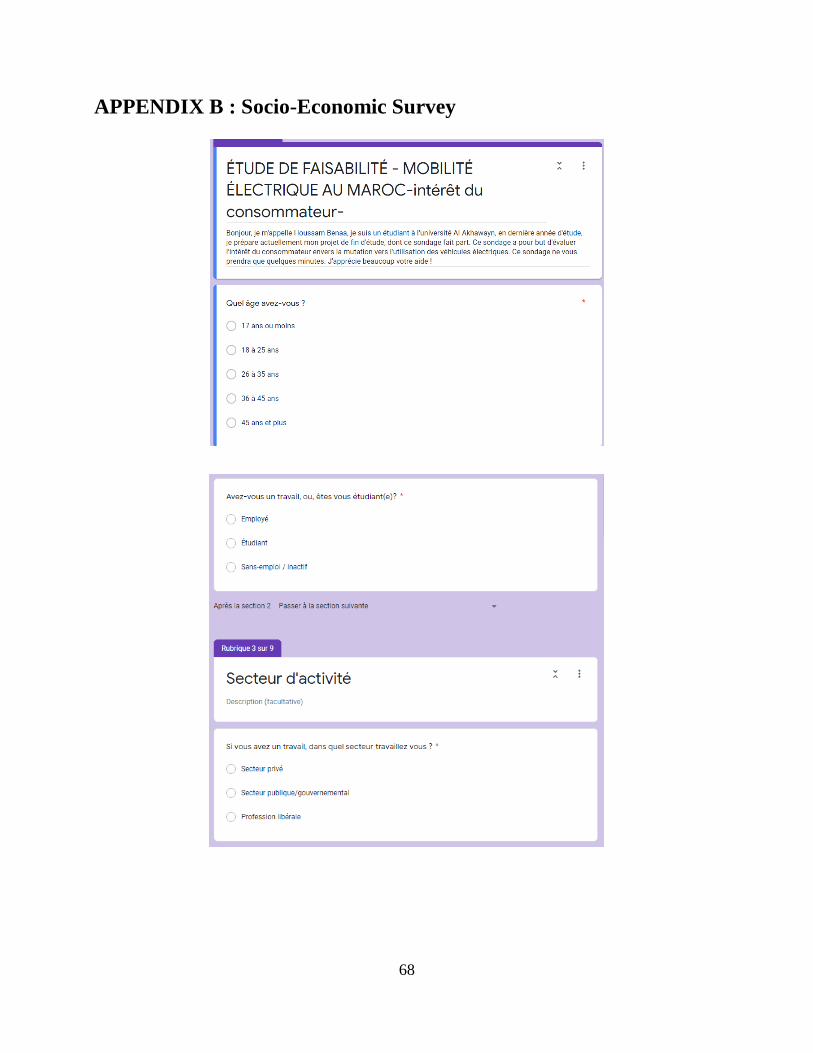
68
APPENDIX B : Socio-Economic Survey

69

70

71
Overview of the survey’s questions.
Average electricity cost for EV per month
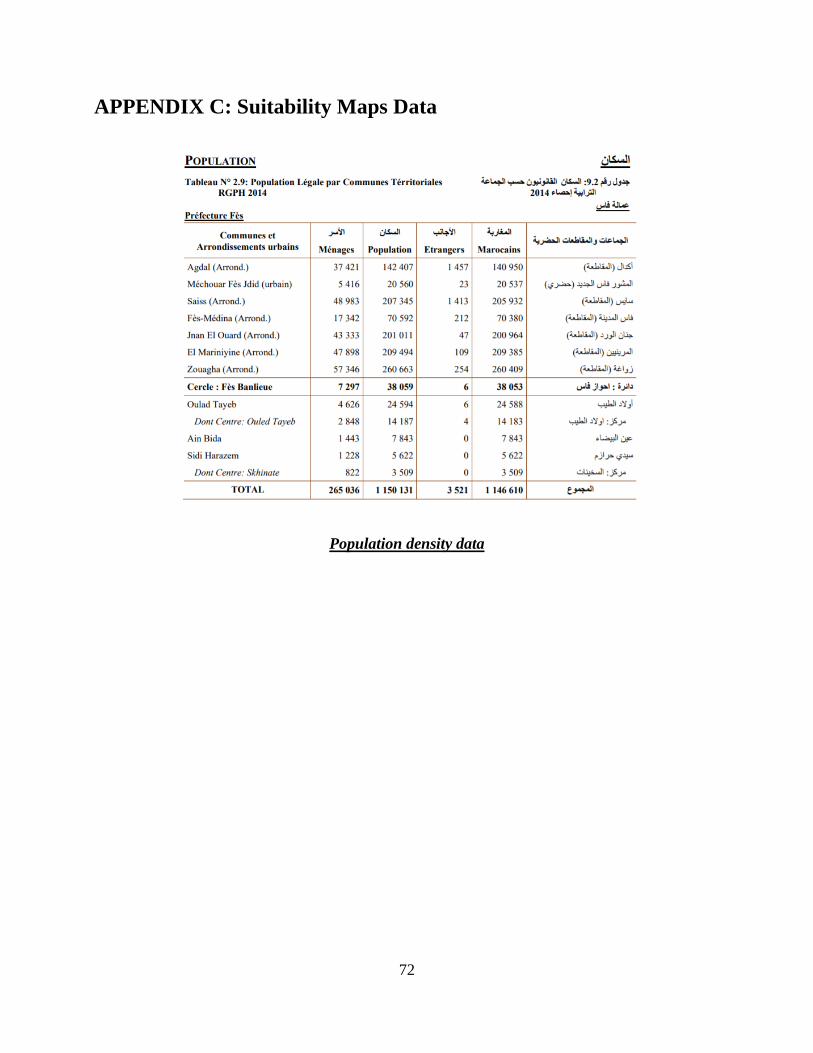
72
APPENDIX C: Suitability Maps Data
Population density data

73
Fes digital elevation model
Fes bus stations coordinates
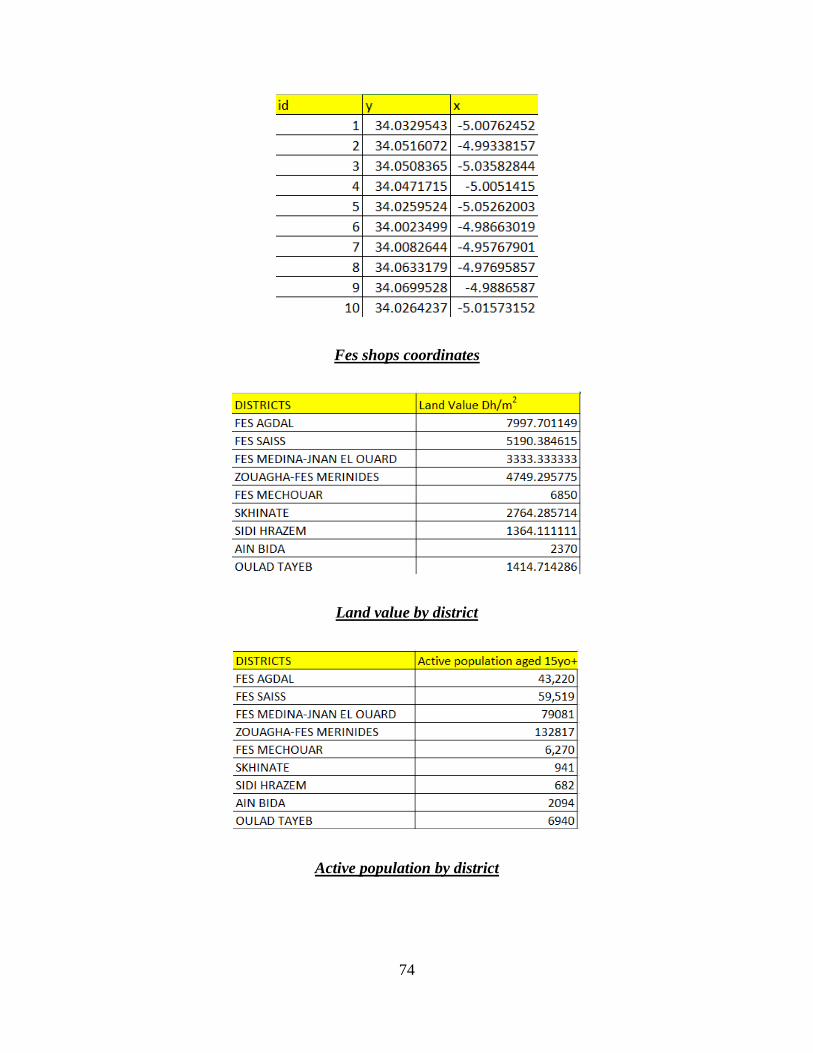
74
Fes shops coordinates
Land value by district
Active population by district

75
Fes green areas Landsat 8 image
Fes roads shapefile

76
Fes’ gas stations coordinates
Fes’ parking areas shapefile