Embed Size (px)
Citation preview

FEASIBILITY STUDY FOR
EXPANSION OF
EDUCATIONAL PROGRAMS
WESTERN WASHINGTON UNIVERSITY
Final Report
December 20, 2018
www.mgtconsulting.com

Western Washington University December 21, 2018
Feasibility Study for the Expansion of Educational Programs Final Report P a g e | i
Western Washington University FEASIBILITY STUDY FOR EXPANSION OF EDUCATIONAL PROGRAMS
December 21, 2018
TABLE OF CONTENTS
1.0: INTRODUCTION ......................................................................................................................................................... 1
1.1 STUDY BACKGROUND ................................................................................................................... 1
1.2 STUDY OBJECTIVES ........................................................................................................................ 2
1.3 REPORT OUTLINE .......................................................................................................................... 2
2.0: MARKET REVIEW .......................................................................................................................................................... 4
2.1 REGIONAL POPULATION ............................................................................................................... 4
2.2 KITSAP COUNTY PROFILE .............................................................................................................. 5
2.2 JEFFERSON COUNTY PROFILE...................................................................................................... 12
2.3 CLALLAM COUNTY PROFILE ........................................................................................................ 17
2.4 MASON COUNTY PROFILE ........................................................................................................... 22
2.5 ACCESS BARRIERS........................................................................................................................ 28
2.7 SUMMARY OF FINDINGS ............................................................................................................. 30
3.0: CURRENT EDUCATIONAL OPPORTUNITIES ON THE PENINSULAS ................................................... 32
3.1 LOCAL POST-SECONDARY PROVIDERS LOCATED IN THE REGION ............................................... 32
3.2 POST SECONDARY ENROLLMENT TRENDS: COMMUNITY COLLEGES ......................................... 34
3.3 POST SECONDARY ENROLLMENT TRENDS: FOUR-YEAR PUBLIC INSTITUTIONS ......................... 35
3.4 WWU DEGREE AWARD TRENDS ................................................................................................. 40
3.5 SUMMARY OF FINDINGS ............................................................................................................. 41
4.0: STAKEHOLDER INPUT ............................................................................................................................................. 42
4.1 STAKEHOLDER FINDINGS ............................................................................................................ 42
4.2 ONLINE SURVEY FINDINGS .......................................................................................................... 50
5.0: PROGRAM NEEDS ...................................................................................................................................................... 51
5.1 MARKET OBSERVATIONS AND FINDINGS .................................................................................... 51
6.0: DELIVERY OPTIONS AND FINANCIAL MODELS ........................................................................................... 54
POTENTIAL DELIVERY MODELS FOR CONSIDERATION ........................................................................... 54
APPENDIX A – EMPLOYMENT DATA BY COUNTY ............................................................................................. 63
APPENDIX B – DISTANCE FROM POPULATION HUBS TO EDUCATIONAL SITES ................................. 67
APPENDIX C – TRANSPORTATION ACCESS ON THE PENINSULAS ............................................................ 71
APPENDIX D – STATEWIDE PUBLIC INSTITUTION DEGREE AWARD TRENDS ...................................... 74
APPENDIX E – ONLINE SURVEY RESULTS ................................................................................................................ 76

Western Washington University December 21, 2018
Feasibility Study for the Expansion of Educational Programs Final Report P a g e | 1
1.0: INTRODUCTION
In May 2018, Western Washington University (WWU) retained MGT Consulting to conduct a Feasibility
Study for Expansion of the WWU Educational Programs on the Kitsap and Olympic Peninsulas. The study
was designed to document current and future higher education needs of local residents, workers, and
employers; and identify the extent of demand for underserved populations and unmet academic program
needs.
MGT reviewed market demographic, economic, and educational data, and collected key stakeholder input
at the state, institution, and community levels. In cooperation with WWU officials, the consultant team
collected and analyzed a variety of demographic, education, and occupational data points to assess needs
and access to baccalaureate and graduate degrees across the region.
This report presents data, findings, and recommendations which are intended to inform any decisions of
WWU leaders as plans evolve to continue to expand and improve access to post-secondary programming
in the region.
1.1 STUDY BACKGROUND
The geographic area designated as the focal point of this study consists of four counties: Clallam,
Jefferson, Kitsap, and Mason, as shown in Exhibit 1-1.
EXHIBIT 1-1 MAP OF THE FOUR-COUNTY REGION CONSIDERED UNDER THE SCOPE OF THE STUDY
Source: CAI, 2018.
1.0 INTRODUCTION
Western Washington University December 21, 2018
Feasibility Study for the Expansion of Educational Programs Final Report P a g e | 2
1.2 STUDY OBJECTIVES
The primary objectives of the Western Washington University feasibility study are:
1. Assessment of the four-year higher education needs and demand in the region, taking into account student demand and economic and workforce needs.
2. Assessment of the current limitations to physical and online access to higher education in the region, including transportation and commuting challenges, inconsistent availability of high quality internet service, and other impediments to access.
3. Assessment and comparison of the feasibility of multiple options for expanding baccalaureate and other higher education services in the region, including but not limited to one or more of the following: the development of a four-year university campus, the expansion of current degree and certificate programs in partnership with local community and technical colleges, and/or online and distance education programs.
4. Determine optimal location(s) for providing additional higher education services, if feasible, taking into account population, demand, and access, as well as existing higher education capital resources.
5. The final feasibility study should include prioritized recommendations that integrate considerations related to the nature of academic programs, location(s), and delivery method(s), as well as options for multiple phases of implementation.
1.3 REPORT OUTLINE
The needs assessment report that follows is presented in the following sequence of five additional
chapters:
2.0 Market Review – provides population, education, and occupational characteristics, data points, and
trends of the defined market encompassing the four-county region. The market data help to identify
potential segments of the population who may need higher education access, as well as potential
barriers that must be addressed to adequately serve these populations.
3.0 Current Advanced Degree Opportunities on the Kitsap and Olympic Peninsulas – provides profiles
of current local providers offering programs, and their relative capacities to serve the region.
4.0 Stakeholder Input – summarizes qualitative input from local stakeholders, including employers,
educators, and local community and business leaders from across the region. These stakeholders
were interviewed regarding expressed program needs and gaps, along with common points of
interest related to post-secondary degree access in the region.
5.0 Program Needs – offers a summation of key findings, and conclusions of the consultant team based
upon the information and data compiled in previous sections of the report contributing to:
Our understanding and analysis of the current situation in the Kitsap and Olympic Peninsulas related to market factors and existing needs and access, and

1.0 INTRODUCTION
Western Washington University December 21, 2018
Feasibility Study for the Expansion of Educational Programs Final Report P a g e | 3
Our experience advising system, college, and community leaders in similar circumstances which seek to address unmet needs; improve local access to education and training programs; maintain an adequately skilled local workforce; and maintain long-term economic stability of the region.
6.0 Delivery Options and Financial Models – offers a variety of feasible educational expansion delivery
options for the university’s consideration, along with our recommendations for those which could
be deemed most promising. The financial feasibility of each option is presented.

Western Washington University December 21, 2018
Feasibility Study for the Expansion of Educational Programs Final Report P a g e | 4
2.0: MARKET REVIEW
The foundation of any academic needs study is a clear understanding of the current population features
of the geographic market under consideration. Each metric offers one piece of the puzzle in the
description of the region and allows us to develop insights into the educational needs, barriers, and access
opportunities which impact a skilled workforce. Since the four-counties under the scope of this study vary
significantly in population, density, geography, and access issues, we present profiles of each county
independently in this chapter, beginning with population counts and demographics. Our data collection
also includes growth rate trends and projections, educational attainment, education participation, and
pipeline (k-12) indicators. Furthermore, this chapter contains enrollment data for various degree
programs among residents of the four-county area. It concludes with occupational growth projections
that identify the magnitude of local employment openings requiring degrees.
Note that population projections for each county in the analysis are provided with high, medium, and low
estimated projections. In the interest of providing a conservative, but accurate estimate of growth,
discussions of these data that follow in this chapter refer to the medium projections.
2.1 REGIONAL POPULATION
As shown in Exhibit 2-1, nearly 422,000 people live in the four-county study area, which has grown slightly
over the last four years (2.1%), at less than half the rate of the state (5.0%). The region has added nearly
8,700 residents since 2012. The four-county area constitutes approximately 6% of the population of the
state. Kitsap, in addition to being the largest County in the region (more than 60% of the study area), has
grown most over the last five years (2.4%).
EXHIBIT 2-1 FOUR-COUNTY REGION AND STATE POPULATION, 2012 AND 2016
Source: U.S. Census Bureau, 2012-2016 American Community Survey 5-Year Estimates, 2018.
Exhibit 2-2 displays the 2016 population of each county by race. As shown, the majority of residents in
each county are White, but American Indian and Alaska Natives comprise more than 2% of the region’s
population (approximately 9,100 residents). A number of indigenous peoples are concentrated on the
peninsulas, including Hoh, Jamestown S’Klallam, the Lower Elwha Klallam Tribe, Makah, Port Gamble
S’Klallam, Quileute, Quinault, Suquamish, and Skokomish. Clallam is home to more than 3,400 residents
who are considered indigenous peoples, more than any other county in the region, and 4.7% of the
county’s population. These residents have unique cultural challenges that need to be addressed when
considering post-secondary program access.
Clallam Jefferson Kitsap Mason Regional
TotalWashington
2012 71,411 29,802 251,400 60,545 413,158 6,738,714
2016 72,969 30,333 257,488 61,060 421,850 7,073,146
# change 1,558 531 6,088 515 8,692 334,432
% change 2.2% 1.8% 2.4% 0.9% 2.1% 5.0%

2.0 MARKET REVIEW
Western Washington University December 21, 2018
Feasibility Study for the Expansion of Educational Programs Final Report P a g e | 5
EXHIBIT 2-2 2016 COUNTY POPULATIONS BY RACE
Source: U.S. Census Bureau, 2012-2016 American Community Survey 5-Year Estimates, 2018.
2.2 KITSAP COUNTY PROFILE
The four-county region was home to nearly 424,000 residents in 2015, with more than 60% of the
population concentrated in Kitsap County.
EXHIBIT 2-3 KITSAP COUNTY WITHIN THE STUDY REGION
Source: CAI, 2018.
Clallam Jefferson Kitsap Mason Regional
Total
White 64,423 27,602 210,358 51,497 353,880
Black or African American 775 278 6,273 1,118 8,444
American Indian and Alaska Native 3,425 607 2,996 2,050 9,078
Asian 1,127 482 11,966 907 14,482
Native Hawaiian or Other Pacific I slander 47 44 2,037 136 2,264
Some other race 648 200 4,899 2,330 8,077
Two or more races 2,524 1,120 18,959 3,022 25,625
Total Population 72,969 30,333 257,488 61,060 421,850

2.0 MARKET REVIEW
Western Washington University December 21, 2018
Feasibility Study for the Expansion of Educational Programs Final Report P a g e | 6
EXHIBIT 2-4 QUICK FACTS ABOUT KITSAP COUNTY
METRIC KITSAP Population Growth, 2010-2040 29%
Unemployment Rate, Compared to State and Nation Declining, but higher than the state and nation for two
years
Total Covered Employment Growth, 2001-17 19%
Population in pipeline for degree attainment* 65,000
HS Diplomas Awarded, 2015 Nearly 2,600
HS Graduates Enrolled in College, 2015 Nearly 60%
Adjusted HS Graduation Rate, 2016-17 82.2%
Enrollment in four-year State Institutions, 2016-17 Nearly 3,000
Institution with Largest Share of Students from the
County, 2016-17
University of Washington: 827 undergrads, 195
graduate students
WWU Enrollments from the County, 2016-17 Nearly 600 students
Most Commonly Available Occupations Government, healthcare, retail, hospitality
Average annual salary Approximately $50,000
Occupational Projections for Jobs Requiring Four-Year
Degrees**
Majority will be in healthcare (specifically, registered
nurses), education, IT, and management
Notes: *The population in pipeline for degree attainment is defined as those who have earned a high school diploma, but not a baccalaureate degree. **Kitsap is a member of the Olympic Consortium WDA, along with Clallam and Jefferson Counties.
KITSAP POPULATION TRENDS AND PROJECTIONS
Despite its smaller geography, Kitsap County has the largest population of the four counties in the study
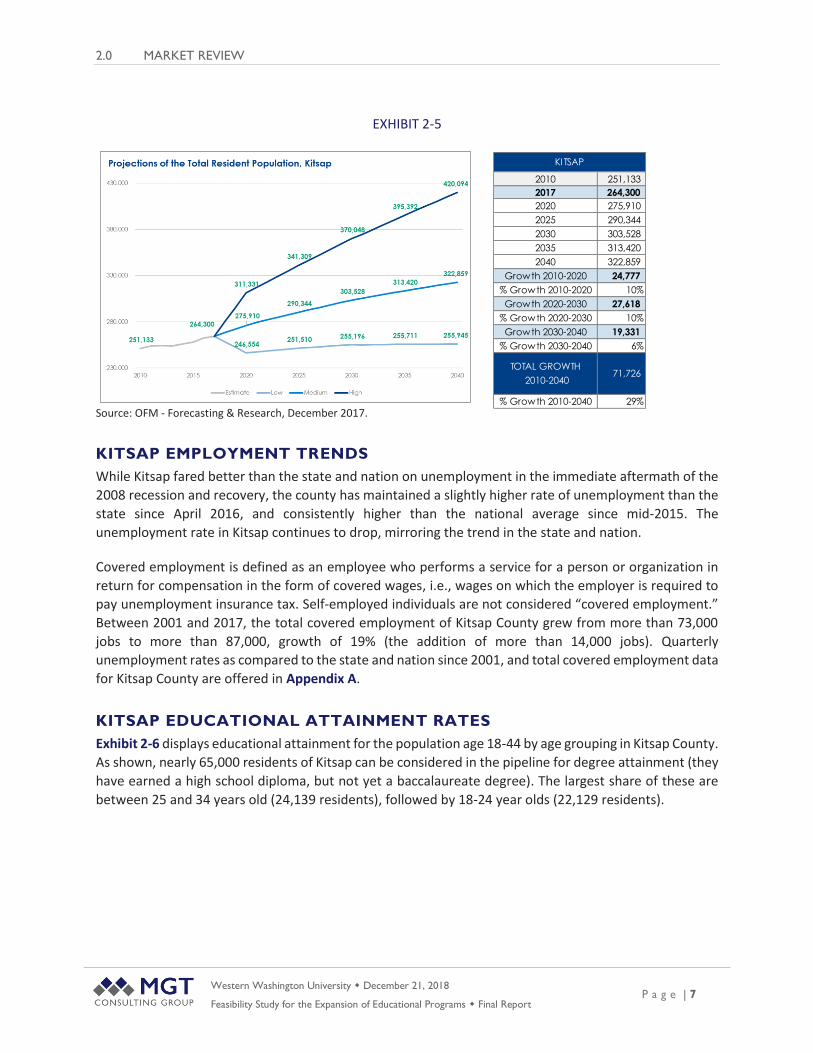
scope by far, with over 264,000 residents in 2017, as shown in Exhibit 2-5. That count is projected to grow
to nearly 323,000 by 2040 (an increase of 29% since 2010).
2.0 MARKET REVIEW
Western Washington University December 21, 2018
Feasibility Study for the Expansion of Educational Programs Final Report P a g e | 7
2010 251,133
2017 264,300
2020 275,910
2025 290,344
2030 303,528
2035 313,420
2040 322,859
Growth 2010-2020 24,777
% Growth 2010-2020 10%
Growth 2020-2030 27,618
% Growth 2020-2030 10%
Growth 2030-2040 19,331
% Growth 2030-2040 6%
TOTAL GROWTH
2010-204071,726
% Growth 2010-2040 29%
KITSAP
EXHIBIT 2-5
Source: OFM - Forecasting & Research, December 2017.
KITSAP EMPLOYMENT TRENDS
While Kitsap fared better than the state and nation on unemployment in the immediate aftermath of the
2008 recession and recovery, the county has maintained a slightly higher rate of unemployment than the
state since April 2016, and consistently higher than the national average since mid-2015. The
unemployment rate in Kitsap continues to drop, mirroring the trend in the state and nation.
Covered employment is defined as an employee who performs a service for a person or organization in
return for compensation in the form of covered wages, i.e., wages on which the employer is required to
pay unemployment insurance tax. Self-employed individuals are not considered “covered employment.”
Between 2001 and 2017, the total covered employment of Kitsap County grew from more than 73,000
jobs to more than 87,000, growth of 19% (the addition of more than 14,000 jobs). Quarterly
unemployment rates as compared to the state and nation since 2001, and total covered employment data
for Kitsap County are offered in Appendix A.
KITSAP EDUCATIONAL ATTAINMENT RATES
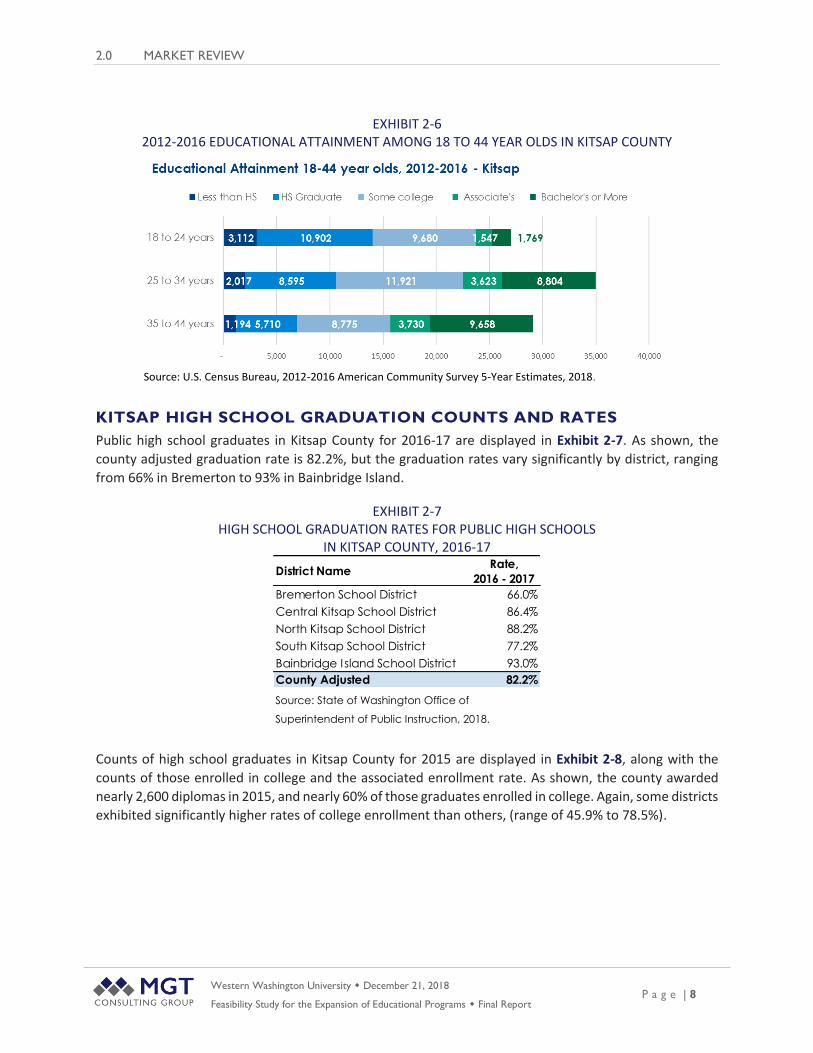
Exhibit 2-6 displays educational attainment for the population age 18-44 by age grouping in Kitsap County.
As shown, nearly 65,000 residents of Kitsap can be considered in the pipeline for degree attainment (they
have earned a high school diploma, but not yet a baccalaureate degree). The largest share of these are
between 25 and 34 years old (24,139 residents), followed by 18-24 year olds (22,129 residents).
2.0 MARKET REVIEW
Western Washington University December 21, 2018
Feasibility Study for the Expansion of Educational Programs Final Report P a g e | 8
EXHIBIT 2-6 2012-2016 EDUCATIONAL ATTAINMENT AMONG 18 TO 44 YEAR OLDS IN KITSAP COUNTY
Source: U.S. Census Bureau, 2012-2016 American Community Survey 5-Year Estimates, 2018.
KITSAP HIGH SCHOOL GRADUATION COUNTS AND RATES
Public high school graduates in Kitsap County for 2016-17 are displayed in Exhibit 2-7. As shown, the
county adjusted graduation rate is 82.2%, but the graduation rates vary significantly by district, ranging
from 66% in Bremerton to 93% in Bainbridge Island.
EXHIBIT 2-7 HIGH SCHOOL GRADUATION RATES FOR PUBLIC HIGH SCHOOLS
IN KITSAP COUNTY, 2016-17
Source: State of Washington Office of
Superintendent of Public Instruction, 2018.
Counts of high school graduates in Kitsap County for 2015 are displayed in Exhibit 2-8, along with the
counts of those enrolled in college and the associated enrollment rate. As shown, the county awarded
nearly 2,600 diplomas in 2015, and nearly 60% of those graduates enrolled in college. Again, some districts
exhibited significantly higher rates of college enrollment than others, (range of 45.9% to 78.5%).
District NameRate,
2016 - 2017
Bremerton School District 66.0%
Central Kitsap School District 86.4%
North Kitsap School District 88.2%
South Kitsap School District 77.2%
Bainbridge Island School District 93.0%
County Adjusted 82.2%

2.0 MARKET REVIEW
Western Washington University December 21, 2018
Feasibility Study for the Expansion of Educational Programs Final Report P a g e | 9
EXHIBIT 2-8 HIGH SCHOOL GRADUATION COUNTS, AND COLLEGE ENROLLMENT COUNTS AND RATES FOR PUBLIC
HIGH SCHOOLS IN KITSAP COUNTY 2015
Source: State of Washington Office of Superintendent of Public Instruction, 2018.
KITSAP EMPLOYER AND OCCUPATIONAL DATA
The top 10 employers in Kitsap County are shown in Exhibit 2-9. Defense, government, healthcare, and
education constitute the bulk of the employment opportunities in the region.
EXHIBIT 2-9
Source: Kitsap Economic Development Alliance, 2017.
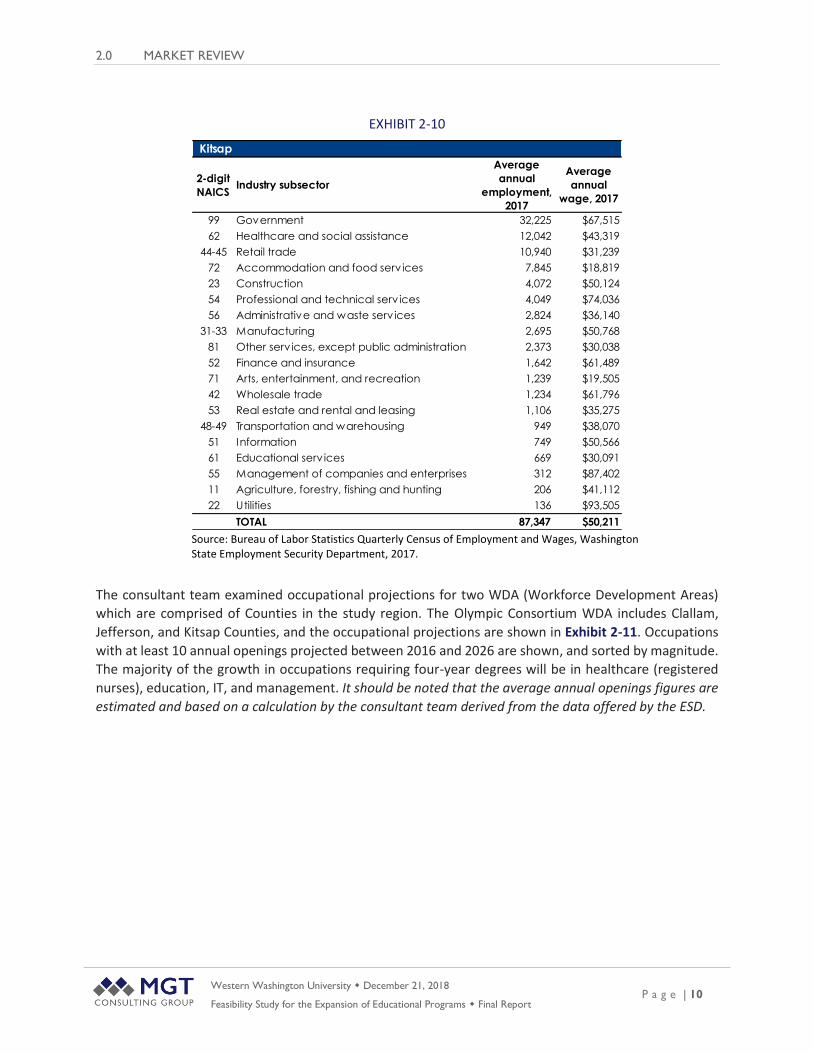
Available jobs by industry and average annual wage in Kitsap County are shown in Exhibit 2-10. Not
surprisingly, positions in government, healthcare, retail, and hospitality are most frequent in the region.
The average annual salary for these positions is approximately $50,000.
District Name
High-
School
Graduates,
2015
College
Enrolled,
2015
Rate,
2015
Bremerton School District 283 130 45.9%
Central Kitsap School District 866 503 58.1%
North Kitsap School District 433 307 70.9%
South Kitsap School District 663 322 48.6%
Bainbridge Island School District 326 256 78.5%
County 2,571 1,518 59.0%
Major Employers Sector Total Employed
Naval Base Kitsap Defense 33,800
Washington State Other-public 2,100
Harrison Medical Center Healthcare 2,000
Kitsap County County Serv ices 1,112
Central Kitsap School District Education 990
Port Madison Enterprises Hospitality, retail 962
South Kitsap School District Education 808
Haselwood Auto Group Retail 710
Fred Meyer Retail 574
North Kitsap School District Education 533
Kitsap County Top 10 Employers
2.0 MARKET REVIEW
Western Washington University December 21, 2018
Feasibility Study for the Expansion of Educational Programs Final Report P a g e | 10
EXHIBIT 2-10
Source: Bureau of Labor Statistics Quarterly Census of Employment and Wages, Washington State Employment Security Department, 2017.
The consultant team examined occupational projections for two WDA (Workforce Development Areas)
which are comprised of Counties in the study region. The Olympic Consortium WDA includes Clallam,
Jefferson, and Kitsap Counties, and the occupational projections are shown in Exhibit 2-11. Occupations
with at least 10 annual openings projected between 2016 and 2026 are shown, and sorted by magnitude.
The majority of the growth in occupations requiring four-year degrees will be in healthcare (registered
nurses), education, IT, and management. It should be noted that the average annual openings figures are
estimated and based on a calculation by the consultant team derived from the data offered by the ESD.
Kitsap
2-digit
NAICSIndustry subsector
Average
annual
employment,
2017
Average
annual
wage, 2017
99 Government 32,225 $67,515
62 Healthcare and social assistance 12,042 $43,319
44-45 Retail trade 10,940 $31,239
72 Accommodation and food serv ices 7,845 $18,819
23 Construction 4,072 $50,124
54 Professional and technical serv ices 4,049 $74,036
56 Administrative and waste serv ices 2,824 $36,140
31-33 Manufacturing 2,695 $50,768
81 Other serv ices, except public administration 2,373 $30,038
52 Finance and insurance 1,642 $61,489
71 Arts, entertainment, and recreation 1,239 $19,505
42 Wholesale trade 1,234 $61,796
53 Real estate and rental and leasing 1,106 $35,275
48-49 Transportation and warehousing 949 $38,070
51 Information 749 $50,566
61 Educational serv ices 669 $30,091
55 Management of companies and enterprises 312 $87,402
11 Agriculture, forestry, fishing and hunting 206 $41,112
22 Utilities 136 $93,505
TOTAL 87,347 $50,211

2.0 MARKET REVIEW
Western Washington University December 21, 2018
Feasibility Study for the Expansion of Educational Programs Final Report P a g e | 11
EXHIBIT 2-11 OCCUPATIONS REQUIRING A BACHELOR’S DEGREE WITH AT LEAST 10 ESTIMATED
ANNUAL OPENINGS WITHIN THE OLYMPIC WDA 2016-2026
Source: Washington State Employment Security Department, 2018.
When considering occupations within the Olympic Consortium which would require a master’s degree,
the counts naturally become much smaller. The average annual openings across the 10-year time horizon
(2016-2026), as shown in Exhibit 2-12. Occupations with at least one opening projected between 2016
and 2026 are shown, and sorted by magnitude. As shown, approximately 48 positions requiring a master’s
Occupations Requiring a Bachelor's Degree for Entry
Estimated
employment
2016
Estimated
employment
2026
Total Growth
2016-2026
Growth Rate
2016-2026
Average
annual
openings
2016-2026
(calculation)
Total, All Occupations 140,976 159,791 18,815 13% 10,519
Registered Nurses 2,269 2,756 487 21% 137
General and Operations Managers 1,929 2,213 284 15% 136
Business Operations Specialists, All Other 1,882 2,037 155 8% 110
Elementary School Teachers, Except Special Education 1,364 1,545 181 13% 63
Managers, All Other 850 955 105 12% 57
Construction Managers 613 729 116 19% 57
Accountants and Auditors 831 958 127 15% 56
Management Analysts 790 854 64 8% 49
Computer Occupations, All Other 628 701 73 12% 47
Human Resources Specialists 631 710 79 13% 46
Teachers and Instructors, All Other 921 1,030 109 12% 44
Nuclear Engineers 825 851 26 3% 43
Secondary School Teachers, Except Special and
Career/Technical Education758 855 97 13% 35
Software Developers, Applications 382 628 246 64% 32
Mechanical Engineers 579 603 24 4% 27
Writers and Authors 434 388 -46 -11% 25
Engineers, All Other 394 410 16 4% 24
Buyers and Purchasing Agents 432 458 26 6% 23
Market Research Analysts and Marketing Specialists 260 353 93 36% 21
Chief Executives 301 364 63 21% 21
Child, Family, and School Social Workers 356 397 41 12% 19
Coaches and Scouts 245 283 38 16% 18
Clergy 214 320 106 50% 17
Middle School Teachers, Except Special and
Career/Technical Education374 423 49 13% 17
Civil Engineers 311 326 15 5% 16
Financial Managers 257 303 46 18% 16
Medical and Health Services Managers 236 283 47 20% 14
Kindergarten Teachers, Except Special Education 309 350 41 13% 14
Cost Estimators 154 185 31 20% 14
Graphic Designers 214 228 14 7% 14
Clinical Laboratory Technologists and Technicians 242 270 28 12% 14
Loan Officers 195 213 18 9% 13
Special Education Teachers, Kindergarten and Elementary
School267 301 34 13% 12
Sales Managers 167 194 27 16% 12
Network and Computer Systems Administrators 184 209 25 14% 12
Directors, Religious Activities and Education 117 178 61 52% 11
Securities, Commodities, and Financial Services Sales
Agents202 206 4 2% 10
Social and Community Service Managers 134 164 30 22% 10
Computer Systems Analysts 141 176 35 25% 10

2.0 MARKET REVIEW
Western Washington University December 21, 2018
Feasibility Study for the Expansion of Educational Programs Final Report P a g e | 12
degree are projected to be available between 2016 and 2026 in the Olympic WDA, primarily in the fields
of healthcare and education.
EXHIBIT 2-12 OCCUPATIONS REQUIRING A MASTER’S DEGREE WITH AT LEAST 10 ESTIMATED TOTAL OPENINGS
WITHIN THE OLYMPIC WDA 2016-2026
Source: Washington State Employment Security Department, 2018.
2.2 JEFFERSON COUNTY PROFILE
The smallest share of four-county region in 2017 reside in Jefferson County, approximately 7% of the
region’s overall population.
EXHIBIT 2-13 JEFFERSON COUNTY WITHIN THE STUDY REGION
Source: CAI, 2018.
Occupations Requiring a Master's Degree for Entry
Estimated
employment
2016
Estimated
employment
2026
Total Growth
2016-2026
Growth Rate
2016-2026
Average
annual
openings
2016-2026
(calculation)
Total, All Occupations 140,976 159,791 18,815 13% 2,104
Speech-Language Pathologists 142 165 23 16% 9
Occupational Therapists 91 110 19 21% 7
Librarians 149 165 16 11% 7
Nurse Practitioners 83 101 18 22% 5
Physician Assistants 78 94 16 21% 5
Health Diagnosing and Treating Practitioners, All Other 51 61 10 20% 4
Community and Social Service Specialists, All Other 40 50 10 25% 3
Instructional Coordinators 54 61 7 13% 3
Anthropologists and Archeologists 17 25 8 47% 2
Farm and Home Management Advisors 27 29 2 7% 1
Art, Drama, and Music Teachers, Postsecondary 27 30 3 11% 1
Nursing Instructors and Teachers, Postsecondary 23 26 3 13% 1
Survey Researchers 10 11 1 10% 1

2.0 MARKET REVIEW
Western Washington University December 21, 2018
Feasibility Study for the Expansion of Educational Programs Final Report P a g e | 13
EXHIBIT 2-14 QUICK FACTS ABOUT JEFFERSON COUNTY
METRIC JEFFERSON
Population Growth, 2010-2040 34%
Unemployment Rate, Compared to State and Nation
Closely mirrored the state between 2001 and 2010, but
has remained higher than both the state and national
average since 2011
Total Covered Employment Growth, 2001-17 4% - The lowest growth rate in the region
Population in pipeline for degree attainment* 4,200
HS Diplomas Awarded, 2015 170
HS Graduates Enrolled in College, 2015 Nearly 58%
Adjusted HS Graduation Rate, 2016-17 78%
Enrollment in four-year State Institutions, 2016-17 Nearly 400
Institution with Largest Share of Students from the
County, 2016-17
University of Washington, 60 undergraduates and 16
graduate students
WWU Enrollments from the County, 2016-17 Nearly 70 (almost all undergraduates)
Most Commonly Available Occupations Government, retail, hospitality, and healthcare
Average annual salary Nearly $39,000
Occupational Projections for Jobs Requiring Four-Year
Degrees**
Majority will be in healthcare (specifically, registered
nurses), education, IT, and management Notes: *The population in pipeline for degree attainment is defined as those who have earned a high school diploma, but not a baccalaureate degree. ** Jefferson is a member of the Olympic Consortium WDA, along with Clallam and Kitsap Counties.

2.0 MARKET REVIEW
Western Washington University December 21, 2018
Feasibility Study for the Expansion of Educational Programs Final Report P a g e | 14
JEFFERSON POPULATION TRENDS AND PROJECTIONS
Jefferson County is sparsely populated, with approximately 31,000 residents in 2017. That count is
projected to grow approximately 34% between 2010 and 2040 (an increase of nearly 40,000 residents).
EXHIBIT 2-15
Source: OFM - Forecasting & Research, December 2017.
JEFFERSON EMPLOYMENT TRENDS
The unemployment rate in Jefferson closely mirrored that of the state between 2001 and 2010, but has
remained higher than both the state and national average since 2011. The unemployment rate in Jefferson
continues to drop, mirroring the trend in the state and nation.
Between 2001 and 2017, Jefferson County added just 369 jobs, representing a growth in total covered
employment of 4%, the lowest growth rate in the region. The quarterly unemployment rates as compared
to the state and nation since 2001, and total covered employment data for Jefferson County are offered
in Appendix A.
JEFFERSON EDUCATIONAL ATTAINMENT RATES
The educational attainment levels 18-44 year olds in Jefferson County is shown by age grouping in Exhibit
2-16. Approximately 4,200 residents of Jefferson can be considered in the pipeline for degree attainment
(they have earned a high school diploma, but not yet a baccalaureate degree). The largest share of these
are between 25 and 34 years old (1,721 residents), followed by 35-44 year olds (1,454 residents). Jefferson
County has the largest share of individuals 18-44 who have earned a baccalaureate degree or higher
among the four-county region (25%).
2010 29,872
2017 31,360
2020 32,646
2025 34,211
2030 36,253
2035 38,609
2040 39,889
Growth 2010-2020 2,774
% Growth 2010-2020 9%
Growth 2020-2030 3,607
% Growth 2020-2030 11%
Growth 2030-2040 3,636
% Growth 2030-2040 10%
TOTAL GROWTH
2010-204010,017
% Growth 2010-2040 34%
JEFFERSON

2.0 MARKET REVIEW
Western Washington University December 21, 2018
Feasibility Study for the Expansion of Educational Programs Final Report P a g e | 15
EXHIBIT 2-16 2012-2016 EDUCATIONAL ATTAINMENT AMONG 18 TO 44 YEAR OLDS IN JEFFERSON COUNTY
Source: U.S. Census Bureau, 2012-2016 American Community Survey 5-Year Estimates, 2018.
JEFFERSON HIGH SCHOOL GRADUATION COUNTS AND RATES
Exhibit 2-17 displays the public high school graduate rates in Jefferson County for 2016-17. As shown, the
overall adjusted county rate is approximately 78%, but there is significant variation by district, ranging
from 69% in Quilcene to nearly 88% in Chimacum.
EXHIBIT 2-17 HIGH SCHOOL GRADUATION RATES FOR PUBLIC HIGH SCHOOLS IN JEFFERSON COUNTY
2016-17
Source: State of Washington Office of Superintendent of Public Instruction, 2018.
Jefferson County counts of high school graduates for 2015 are displayed in Exhibit 2-18, along with the
counts of those who enrolled in college and the associated enrollment rate. As shown, the county awarded
170 diplomas in 2015, and nearly 58% of those graduates enrolled in college, only a slightly smaller share
than the leader on this metric Kitsap County (59%).
District NameRate,
2016 - 2017
Chimacum School District 87.6%
Port Townsend School District 77.0%
Quilcene School District 69.2%
County Adjusted 78.2%

2.0 MARKET REVIEW
Western Washington University December 21, 2018
Feasibility Study for the Expansion of Educational Programs Final Report P a g e | 16
EXHIBIT 2-18 HIGH SCHOOL GRADUATION COUNTS, AND COLLEGE ENROLLMENT COUNTS AND RATES
FOR PUBLIC HIGH SCHOOLS IN JEFFERSON COUNTY 2015
Source: State of Washington Office of Superintendent of Public Instruction, 2018.
JEFFERSON EMPLOYER AND OCCUPATIONAL DATA
Available jobs by industry and average annual wage in Jefferson County are shown in Exhibit 2-19. As
shown, positions in government, retail, hospitality, and healthcare are most common in the region. The
average annual salary for these positions is nearly $39,000.
EXHIBIT 2-19
Source: Bureau of Labor Statistics Quarterly Census of Employment and Wages, Washington State Employment Security Department, 2017.
Occupational projections in Jefferson County are included in Exhibit 2-11 and 2-12 which displays the
Olympic Consortium WDA data (which includes Clallam and Kitsap Counties).
District Name
High-
School
Graduates,
2015
College
Enrolled,
2015
Rate,
2015
Chimacum School District 68 34 50.0%
Port Townsend School District 90 57 63.3%
Quilcene School District 12 7 58.3%
County 170 98 57.6%
Jefferson
2-digit
NAICSIndustry subsector
Average
annual
employment,
2017
Average
annual
wage, 2017
99 Government 2,441 $53,730
44-45 Retail trade 1,018 $26,521
72 Accommodation and food serv ices 916 $17,573
62 Healthcare and social assistance 817 $29,120
23 Construction 663 $42,893
31-33 Manufacturing 640 $53,430
81 Other serv ices, except public administration 428 $31,212
56 Administrative and waste serv ices 259 $29,977
54 Professional and technical serv ices 244 $50,546
42 Wholesale trade 200 $35,713
11 Agriculture, forestry, fishing and hunting 196 $35,281
53 Real estate and rental and leasing 185 $24,132
61 Educational serv ices 160 $27,162
52 Finance and insurance 138 $50,390
71 Arts, entertainment, and recreation 127 $14,413
51 Information 111 $41,933
48-49 Transportation and warehousing 58 $34,769
22 Utilities 33 $86,935
TOTAL 8,643 $38,853
2.0 MARKET REVIEW
Western Washington University December 21, 2018
Feasibility Study for the Expansion of Educational Programs Final Report P a g e | 17
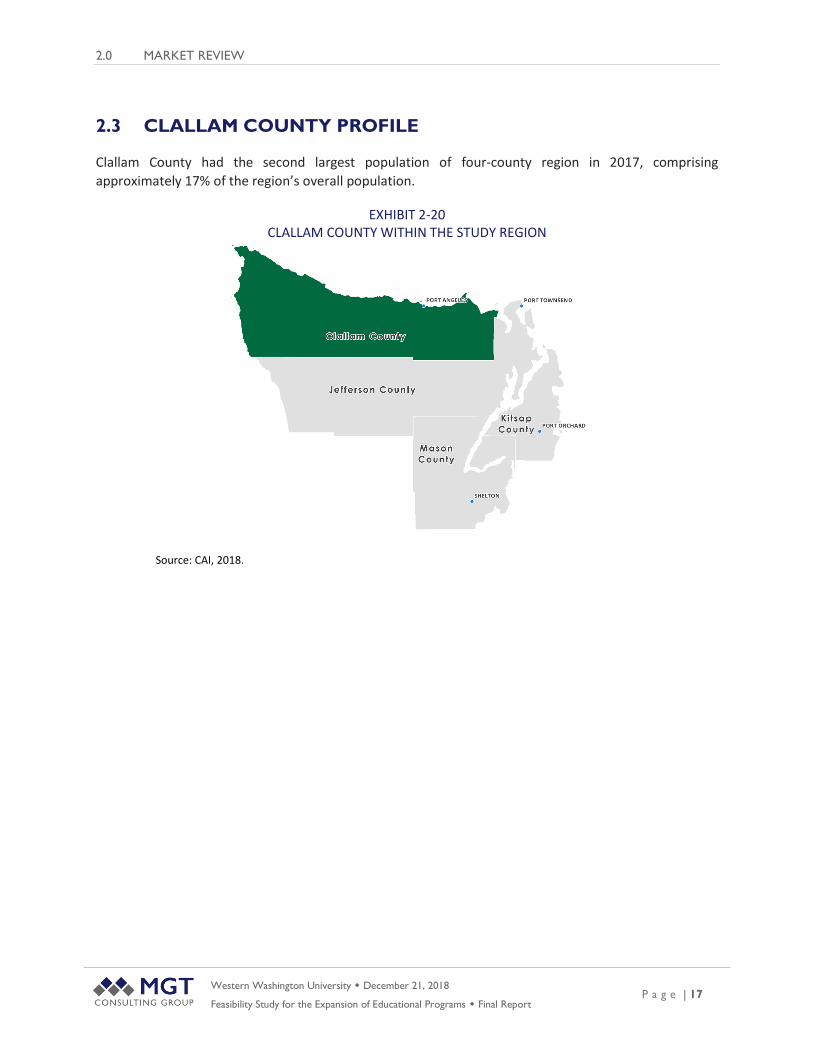
2.3 CLALLAM COUNTY PROFILE
Clallam County had the second largest population of four-county region in 2017, comprising
approximately 17% of the region’s overall population.
EXHIBIT 2-20 CLALLAM COUNTY WITHIN THE STUDY REGION
Source: CAI, 2018.
2.0 MARKET REVIEW
Western Washington University December 21, 2018
Feasibility Study for the Expansion of Educational Programs Final Report P a g e | 18
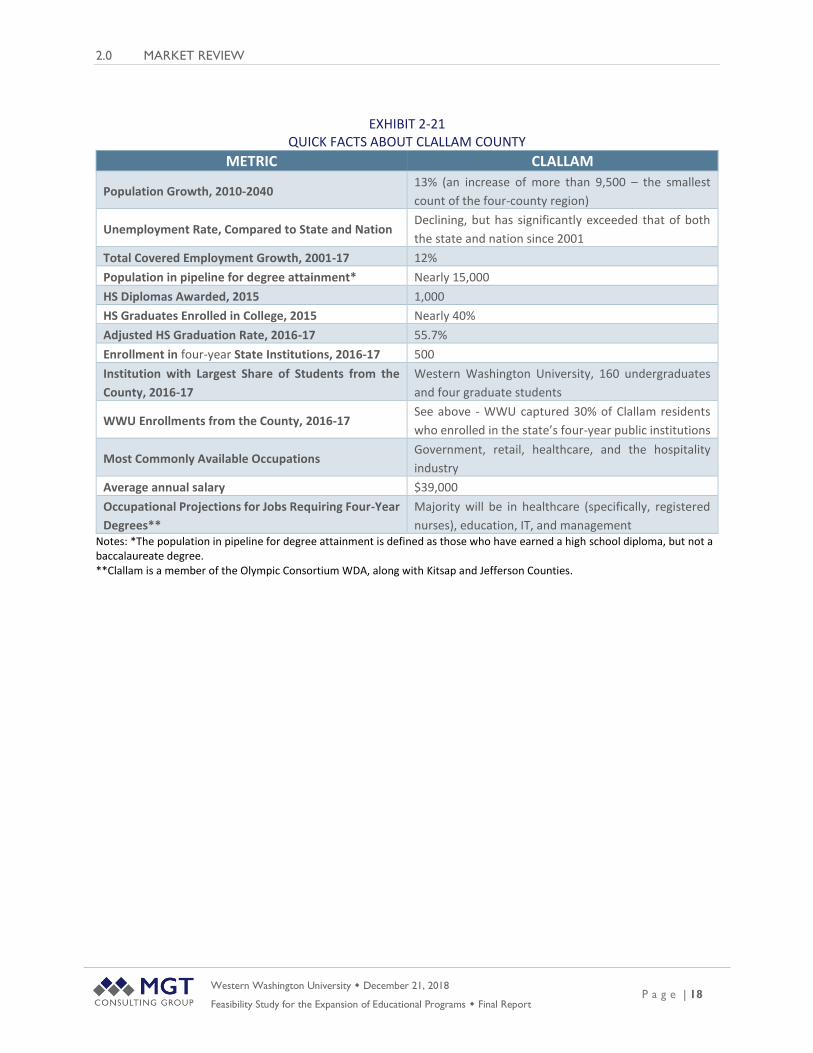
EXHIBIT 2-21 QUICK FACTS ABOUT CLALLAM COUNTY
METRIC CLALLAM
Population Growth, 2010-2040 13% (an increase of more than 9,500 – the smallest
count of the four-county region)
Unemployment Rate, Compared to State and Nation Declining, but has significantly exceeded that of both
the state and nation since 2001
Total Covered Employment Growth, 2001-17 12%
Population in pipeline for degree attainment* Nearly 15,000
HS Diplomas Awarded, 2015 1,000
HS Graduates Enrolled in College, 2015 Nearly 40%
Adjusted HS Graduation Rate, 2016-17 55.7%
Enrollment in four-year State Institutions, 2016-17 500
Institution with Largest Share of Students from the
County, 2016-17
Western Washington University, 160 undergraduates
and four graduate students
WWU Enrollments from the County, 2016-17 See above - WWU captured 30% of Clallam residents
who enrolled in the state’s four-year public institutions
Most Commonly Available Occupations Government, retail, healthcare, and the hospitality
industry
Average annual salary $39,000
Occupational Projections for Jobs Requiring Four-Year
Degrees**
Majority will be in healthcare (specifically, registered
nurses), education, IT, and management Notes: *The population in pipeline for degree attainment is defined as those who have earned a high school diploma, but not a baccalaureate degree. **Clallam is a member of the Olympic Consortium WDA, along with Kitsap and Jefferson Counties.

2.0 MARKET REVIEW
Western Washington University December 21, 2018
Feasibility Study for the Expansion of Educational Programs Final Report P a g e | 19
CLALLAM POPULATION TRENDS AND PROJECTIONS
Clallam County was home to more than 74,000 residents in 2017. The County population is projected to
increase to nearly 81,000 by 2040 (13% growth between 2010 and 2040). This growth rate is the smallest
of the four-county region.
EXHIBIT 2-22
Source: OFM - Forecasting & Research, December 2017.
CLALLAM EMPLOYMENT TRENDS
The unemployment rate in Clallam County exceeded that of both the state and nation since 2001. The
unemployment rate in Clallam has dropped substantially in recent years, although not as quickly as that
of the state and nation.
Clallam County added 2,542 jobs between 2001 and 2017, representing 12% growth in total covered
employment. The quarterly unemployment rates as compared to the state and nation since 2001, and
total covered employment data for Clallam County are offered in Appendix A.
CLALLAM EDUCATIONAL ATTAINMENT RATES
The educational attainment levels of 18-44 year old residents of Clallam County is shown by age grouping
in Exhibit 2-23. Nearly 15,000 residents of Clallam fall in the pipeline for degree attainment (awarded a
high school diploma, but not yet a baccalaureate degree). The largest share of these are between 25 and
34 years old (5,647 residents), followed by 35-44 year olds (4,997 residents). Clallam and Mason Counties
have the smallest share of individuals 18-44 who have earned a baccalaureate degree or higher among
the four-county region (13% each).
2010 71,404
2017 74,240
2020 74,707
2025 76,847
2030 78,683
2035 80,123
2040 80,928
Growth 2010-2020 3,303
% Growth 2010-2020 5%
Growth 2020-2030 3,976
% Growth 2020-2030 5%
Growth 2030-2040 2,245
% Growth 2030-2040 3%
TOTAL GROWTH
2010-20409,524
% Growth 2010-2040 13%
CLALLAM

2.0 MARKET REVIEW
Western Washington University December 21, 2018
Feasibility Study for the Expansion of Educational Programs Final Report P a g e | 20
EXHIBIT 2-23 2012-2016 EDUCATIONAL ATTAINMENT AMONG 18 TO 44 YEAR OLDS IN CLALLAM COUNTY
Source: U.S. Census Bureau, 2012-2016 American Community Survey 5-Year Estimates, 2018.
CLALLAM HIGH SCHOOL GRADUATION COUNTS AND RATES
The 2016-17 public high school graduation rates for Clallam County are displayed in Exhibit 2-24. As
shown, the overall adjusted county rate is nearly 56%, but rates for the reported districts are higher (60.6%
to 94.6%). Note: The difference between the overall county HS graduation rate and the individual districts
graduation rates is due to special accountability rules applied by OSPI for the calculation of HS graduation
rates in Washington. Specific school types are not included in the calculation of district graduation rates
e.g. juvenile justice schools, special needs schools. In Clallam county specifically, the Insight School of
Washington and the Quileute Tribal School are excluded from the Quillayute Valley district aggregation as
the school district is not accountable for the results at these schools. These schools together have fewer
than 680 students. The overall HS graduation rate includes all schools in the county, resulting in an
appearance of discrepancy in the data OSPI provides.
EXHIBIT 2-24 HIGH SCHOOL GRADUATION RATES FOR PUBLIC HIGH SCHOOLS IN CLALLAM COUNTY
2016-17
Source: State of Washington Office of Superintendent of
Public Instruction, 2018.
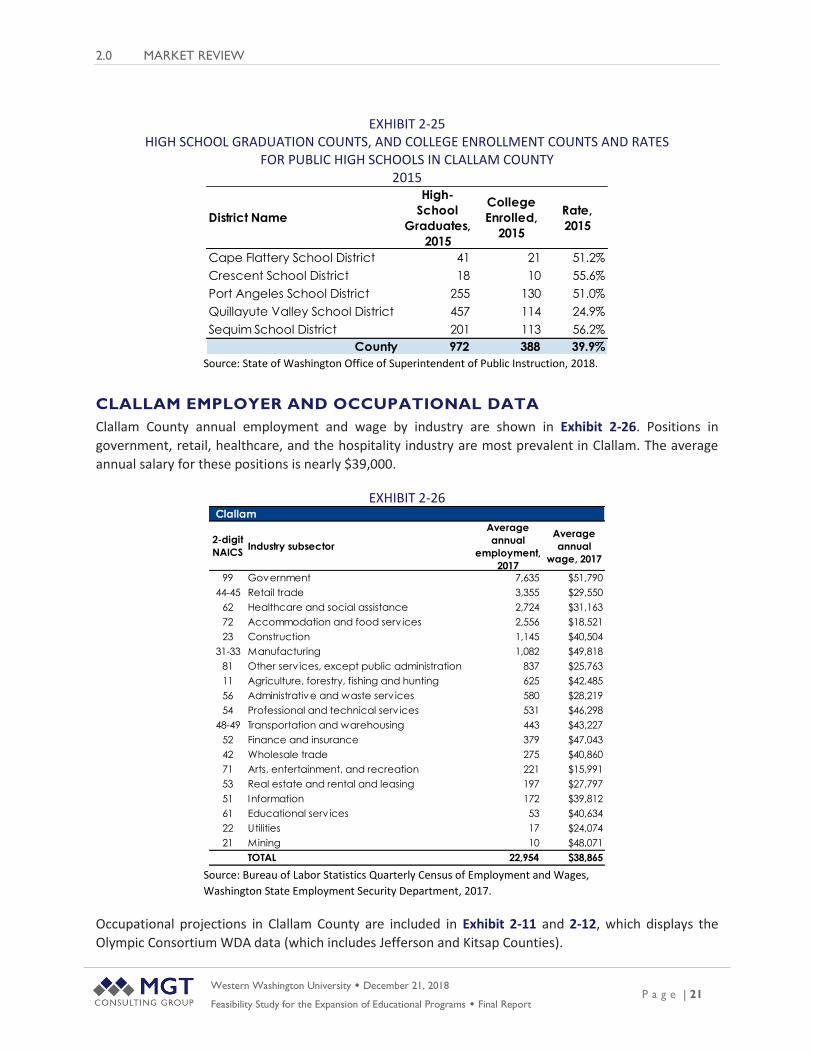
Counts of high school graduates in Clallam County for 2015 are displayed in Exhibit 2-25. Also displayed
are counts of those who enrolled in college and the associated enrollment rate. As shown, 972 diplomas
were awarded in Clallam in 2015, and nearly 40% of those graduates enrolled in college. This college
enrollment rate is the lowest of the four counties in the region.
District NameRate,
2016 - 2017
Cape Flattery School District 94.6%
Crescent School District 82.4%
Port Angeles School District 79.5%
Quillayute Valley School District 60.6%
Sequim School District 87.4%
County Adjusted 55.7%
2.0 MARKET REVIEW
Western Washington University December 21, 2018
Feasibility Study for the Expansion of Educational Programs Final Report P a g e | 21
EXHIBIT 2-25 HIGH SCHOOL GRADUATION COUNTS, AND COLLEGE ENROLLMENT COUNTS AND RATES
FOR PUBLIC HIGH SCHOOLS IN CLALLAM COUNTY 2015
Source: State of Washington Office of Superintendent of Public Instruction, 2018.
CLALLAM EMPLOYER AND OCCUPATIONAL DATA
Clallam County annual employment and wage by industry are shown in Exhibit 2-26. Positions in
government, retail, healthcare, and the hospitality industry are most prevalent in Clallam. The average
annual salary for these positions is nearly $39,000.
EXHIBIT 2-26
Source: Bureau of Labor Statistics Quarterly Census of Employment and Wages,
Washington State Employment Security Department, 2017.
Occupational projections in Clallam County are included in Exhibit 2-11 and 2-12, which displays the
Olympic Consortium WDA data (which includes Jefferson and Kitsap Counties).
District Name
High-
School
Graduates,
2015
College
Enrolled,
2015
Rate,
2015
Cape Flattery School District 41 21 51.2%
Crescent School District 18 10 55.6%
Port Angeles School District 255 130 51.0%
Quillayute Valley School District 457 114 24.9%
Sequim School District 201 113 56.2%
County 972 388 39.9%
Clallam
2-digit
NAICSIndustry subsector
Average
annual
employment,
2017
Average
annual
wage, 2017
99 Government 7,635 $51,790
44-45 Retail trade 3,355 $29,550
62 Healthcare and social assistance 2,724 $31,163
72 Accommodation and food serv ices 2,556 $18,521
23 Construction 1,145 $40,504
31-33 Manufacturing 1,082 $49,818
81 Other serv ices, except public administration 837 $25,763
11 Agriculture, forestry, fishing and hunting 625 $42,485
56 Administrative and waste serv ices 580 $28,219
54 Professional and technical serv ices 531 $46,298
48-49 Transportation and warehousing 443 $43,227
52 Finance and insurance 379 $47,043
42 Wholesale trade 275 $40,860
71 Arts, entertainment, and recreation 221 $15,991
53 Real estate and rental and leasing 197 $27,797
51 Information 172 $39,812
61 Educational serv ices 53 $40,634
22 Utilities 17 $24,074
21 Mining 10 $48,071
TOTAL 22,954 $38,865
2.0 MARKET REVIEW
Western Washington University December 21, 2018
Feasibility Study for the Expansion of Educational Programs Final Report P a g e | 22
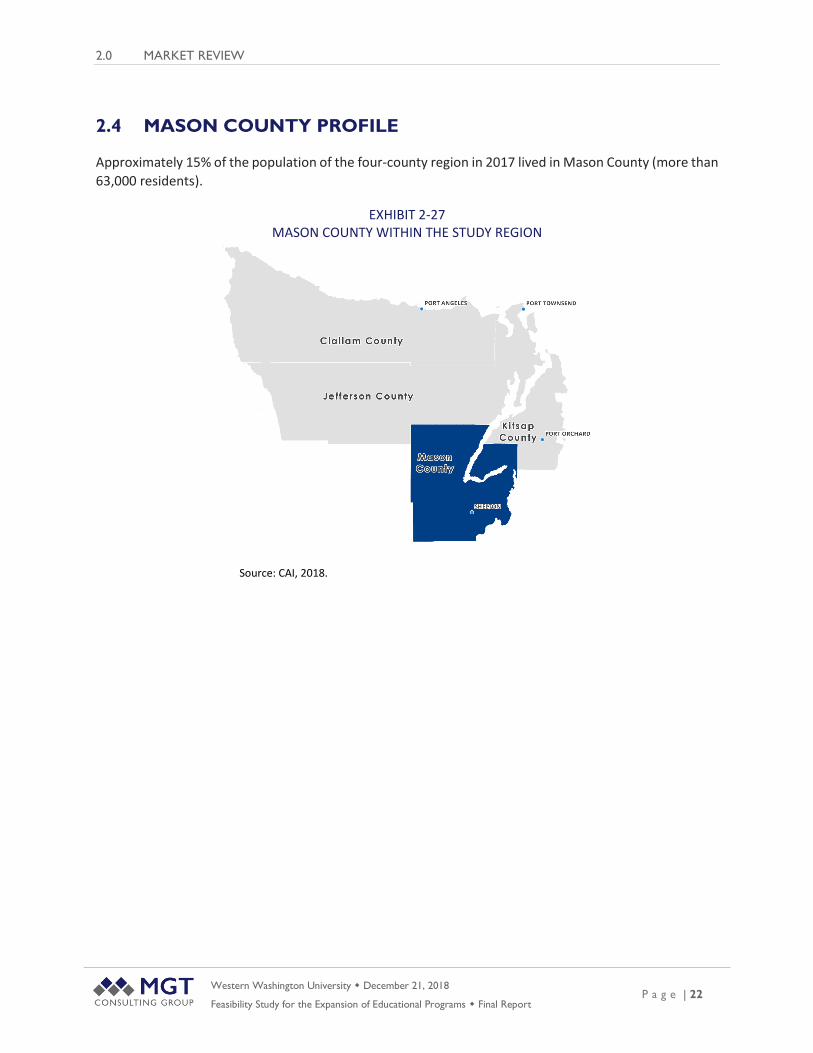
2.4 MASON COUNTY PROFILE
Approximately 15% of the population of the four-county region in 2017 lived in Mason County (more than
63,000 residents).
EXHIBIT 2-27 MASON COUNTY WITHIN THE STUDY REGION
Source: CAI, 2018.

2.0 MARKET REVIEW
Western Washington University December 21, 2018
Feasibility Study for the Expansion of Educational Programs Final Report P a g e | 23
2010 60,699
2017 63,190
2020 67,621
2025 72,339
2030 76,530
2035 80,985
2040 84,976
Growth 2010-2020 6,922
% Growth 2010-2020 11%
Growth 2020-2030 8,909
% Growth 2020-2030 13%
Growth 2030-2040 8,446
% Growth 2030-2040 11%
TOTAL GROWTH
2010-204024,277
% Growth 2010-2040 40%
MASON
EXHIBIT 2-28 QUICK FACTS ABOUT MASON COUNTY
METRIC MASON Population Growth, 2010-2040 40%
Unemployment Rate, Compared to State and Nation
Consistently exceeded the state and the nation since
2001, rate has dropped in recent years, mirroring
national and state trends
Total Covered Employment Growth, 2001-17 17%
Population in pipeline for degree attainment* Nearly 9,000
HS Diplomas Awarded, 2015 More than 500
HS Graduates Enrolled in College, 2015 43%
Adjusted HS Graduation Rate, 2016-17 75.5%
Enrollment in four-year State Institutions, 2016-17 Nearly 350, primarily as undergraduates.
Institution with Largest Share of Students from the
County, 2016-17
Western Washington University and the Evergreen
State University (92 total students, respectively).
WWU Enrollments from the County, 2016-17 45 (nearly all undergraduates)
Most Commonly Available Occupations Government, retail, healthcare, & hospitality
Average annual salary $40,000
Occupational Growth Projections for Jobs
Requiring Four-Year Degrees** Healthcare (primarily registered nurses), education,
and management
Note: *The population in pipeline for degree attainment is defined as those who have earned a high school diploma, but not a
baccalaureate degree.
** Mason is a member of the Pacific Mountain WDA, along with Grays Harbor, Lewis, Pacific, and Thurston Counties. An
important consideration in reviewing these data, is the relative size of Mason County as a share of the WDA - 8% of the total
covered employment of the collective counties in the WDA.
MASON POPULATION TRENDS AND PROJECTIONS
Mason County projects the strongest growth of the study area. The population of the county is projected
to grow to nearly 85,000 by 2040 (an increase of 40% over 2010).
EXHIBIT 2-29
Source: OFM - Forecasting & Research, December 2017.

2.0 MARKET REVIEW
Western Washington University December 21, 2018
Feasibility Study for the Expansion of Educational Programs Final Report P a g e | 24
MASON EMPLOYMENT TRENDS
Mason County’s rate of unemployment has exceeded the state and the nation consistently since 2001,
though it has dropped in recent years, mirroring the national and state trends.
The total covered employment of Mason County grew from nearly 12,000 jobs in 2001 to more than
14,000 in 2017, growth of 17%. The quarterly unemployment rate as compared to the state and nation
since 2001, and total covered employment data for Mason County are offered in Appendix A.
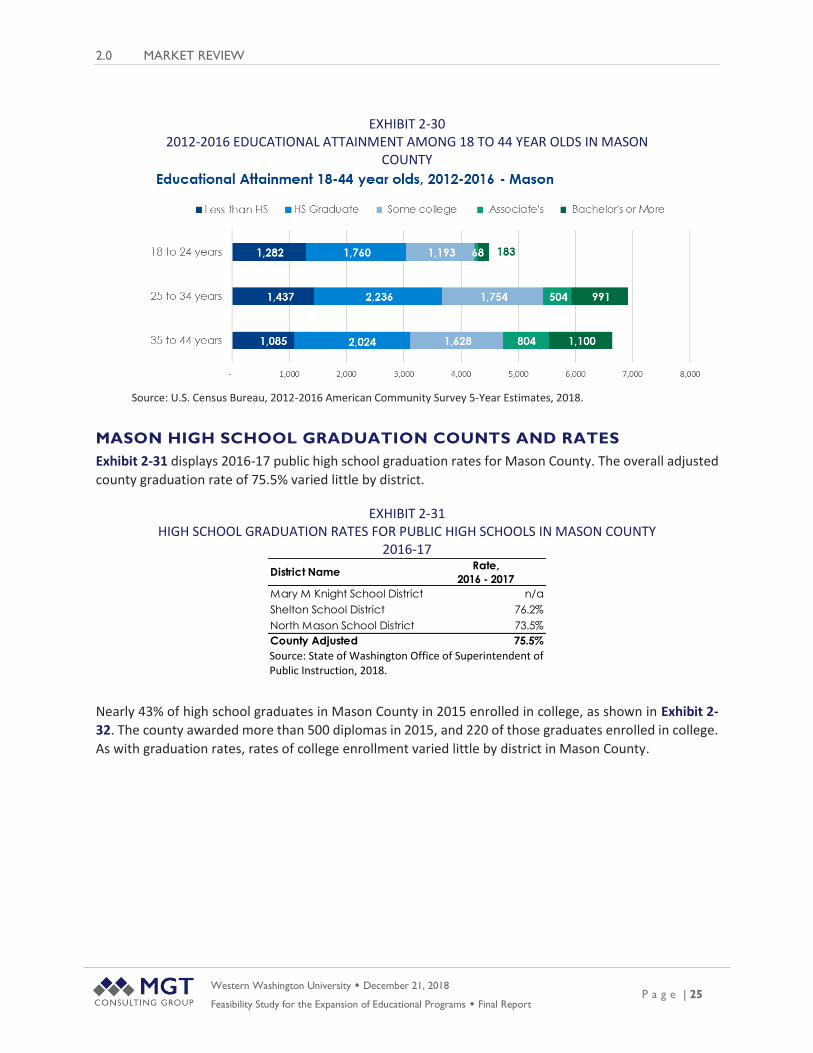
MASON EDUCATIONAL ATTAINMENT RATES
The educational attainment for the population age 18-44 by age grouping in Mason County is displayed
in Exhibit 2-30. Nearly 9,000 Mason County residents can be considered part of the pipeline for degree
attainment (awarded a high school diploma, but not yet a baccalaureate degree). The largest share of
these are between 25 and 34 years old (4,494 residents) followed by 35-44 year olds (4,456 residents).
2.0 MARKET REVIEW
Western Washington University December 21, 2018
Feasibility Study for the Expansion of Educational Programs Final Report P a g e | 25
EXHIBIT 2-30 2012-2016 EDUCATIONAL ATTAINMENT AMONG 18 TO 44 YEAR OLDS IN MASON
COUNTY
Source: U.S. Census Bureau, 2012-2016 American Community Survey 5-Year Estimates, 2018.
MASON HIGH SCHOOL GRADUATION COUNTS AND RATES
Exhibit 2-31 displays 2016-17 public high school graduation rates for Mason County. The overall adjusted
county graduation rate of 75.5% varied little by district.
EXHIBIT 2-31 HIGH SCHOOL GRADUATION RATES FOR PUBLIC HIGH SCHOOLS IN MASON COUNTY
2016-17
Source: State of Washington Office of Superintendent of Public Instruction, 2018.
Nearly 43% of high school graduates in Mason County in 2015 enrolled in college, as shown in Exhibit 2-
32. The county awarded more than 500 diplomas in 2015, and 220 of those graduates enrolled in college.
As with graduation rates, rates of college enrollment varied little by district in Mason County.
District NameRate,
2016 - 2017
Mary M Knight School District n/a
Shelton School District 76.2%
North Mason School District 73.5%
County Adjusted 75.5%

2.0 MARKET REVIEW
Western Washington University December 21, 2018
Feasibility Study for the Expansion of Educational Programs Final Report P a g e | 26
EXHIBIT 2-32 HIGH SCHOOL GRADUATION COUNTS, AND COLLEGE ENROLLMENT COUNTS AND RATES FOR
PUBLIC HIGH SCHOOLS IN MASON COUNTY 2015
Source: State of Washington Office of Superintendent of Public Instruction, 2018.
MASON EMPLOYER AND OCCUPATIONAL DATA
Available jobs by industry and average annual wage in Mason County are shown in Exhibit 2-33. The most
prevalent positions in the county are in government, retail, healthcare, and hospitality. The average
annual salary for these positions is approximately $40,000, the second lowest in the four-county region.
EXHIBIT 2-33
Source: Bureau of Labor Statistics Quarterly Census of Employment and Wages, Washington State Employment Security Department, 2017.
The Pacific Mountain WDA includes Mason County along with Grays Harbor, Lewis, Pacific, and Thurston
Counties, and the occupational projections are shown in Exhibit 2-34. Occupations with at least 40 annual
openings projected between 2016 and 2026 are shown, and sorted by magnitude of the growth
District Name
High-
School
Graduates,
2015
College
Enrolled,
2015
Rate,
2015
Mary M Knight School District 11 5 45.5%
Shelton School District 318 128 40.3%
North Mason School District 185 87 47.0%
County 514 220 42.8%
Mason
2-digit
NAICSIndustry subsector
Average
annual
employment,
2017
Average
annual
wage, 2017
99 Government 5,670 $50,134
44-45 Retail trade 1,822 $29,204
62 Healthcare and social assistance 1,146 $31,086
72 Accommodation and food serv ices 1,090 $21,797
31-33 Manufacturing 935 $43,037
23 Construction 605 $37,224
11 Agriculture, forestry, fishing and hunting 549 $41,808
42 Wholesale trade 423 $48,636
81 Other serv ices, except public administration 387 $25,776
56 Administrative and waste serv ices 275 $30,500
52 Finance and insurance 253 $43,675
54 Professional and technical serv ices 240 $49,283
48-49 Transportation and warehousing 227 $37,284
71 Arts, entertainment, and recreation 127 $21,490
53 Real estate and rental and leasing 104 $23,203
51 Information 78 $36,420
61 Educational serv ices 41 $24,314
21 Mining 27 $53,116
22 Utilities 20 $20,010
TOTAL 14,018 $40,210

2.0 MARKET REVIEW
Western Washington University December 21, 2018
Feasibility Study for the Expansion of Educational Programs Final Report P a g e | 27
anticipated by 2026. The majority of the growth in occupations requiring four-year degrees in the Pacific
Mountain WDA will be in healthcare (registered nurses), education, and management.
Note: An important consideration in reviewing these data is the relative size of Mason County as a share
of the WDA. Mason County’s total covered employment comprises 12% of the population of the collective
counties in the Pacific Mountain WDA, so caution should be used when interpreting these data. A relatively
small share of projected positions in this WDA would likely be in Mason County.
EXHIBIT 2-34 OCCUPATIONS REQUIRING A BACHELOR’S DEGREE WITH AT LEAST 20 ESTIMATED
ANNUAL OPENINGS WITHIN THE PACIFIC MOUNTAIN WDA 2016-2026
Source: Washington State Employment Security Department, 2018. Note: The average annual openings figures are estimated and based on a calculation by the consultant team derived from the data offered by the ESD.
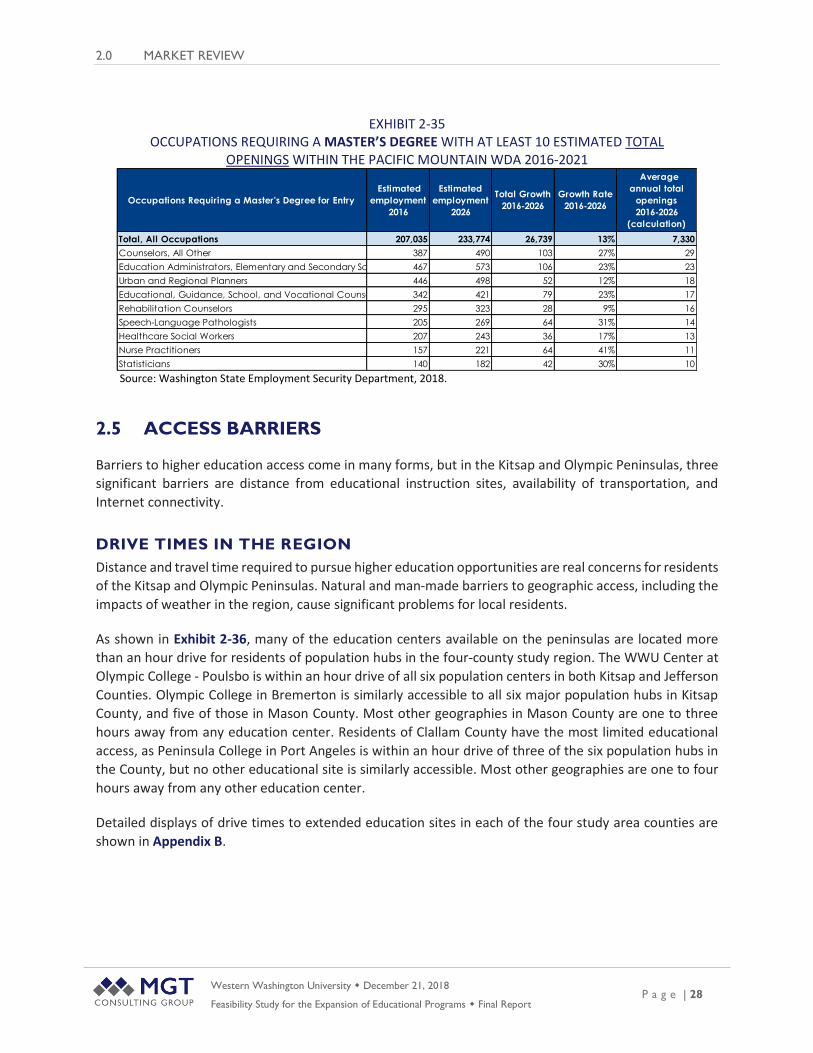
When considering occupations within the Pacific Mountain which would require a master’s degree, the
counts become much smaller. For this measure, we have chosen to display the total estimated openings
across the 2016-2021 time horizon, as shown in Exhibit 2-35. Occupations with at least 10 openings
projected between 2016 and 2026 are shown, and sorted by magnitude of openings anticipated by 2021.
As shown, approximately 150 positions fitting these criteria are projected in the Pacific Mountain WDA,
primarily in the field of healthcare, counseling/social services, and education.
Note: Again, an important consideration in reviewing these data is the relative size of Mason County as a
share of the WDA. Mason County’s total covered employment comprises 12% of the population of the
collective counties in the Pacific Mountain WDA, so caution should be used when interpreting these data.
A relatively small share of projected positions in this WDA would likely be in Mason County.
Occupations Requiring a
Bachelor's Degree for Entry
Estimated
employment
2016
Estimated
employment
2026
Total Growth
2016-2026
Growth Rate
2016-2026
Average
annual total
openings
2016-2026
(calculation)
Total, All Occupations 207,035 233,774 26,739 13% 14,986
General and Operations Managers 4,657 5,126 469 10% 317
Registered Nurses 2,895 3,644 749 26% 181
Computer Systems Analysts 1,700 1,946 246 14% 110
Management Analysts 1,556 1,744 188 12% 101
Elementary School Teachers, Except Special Education 1,989 2,410 421 21% 98
Accountants and Auditors 1,431 1,622 191 13% 96
Computer Network Architects 1,740 1,782 42 2% 93
Teachers and Instructors, All Other 1,741 2,138 397 23% 91
Managers, All Other 1,210 1,331 121 10% 80
Business Operations Specialists, All Other 1,162 1,361 199 17% 73
Financial Managers 1,106 1,251 145 13% 67Secondary School Teachers, Except Special and
Career/Technical Education 1,356 1,643 287 21% 67
Human Resources Specialists 881 954 73 8% 63
Construction Managers 483 606 123 25% 47
Financial Analysts 939 1,007 68 7% 47
Civil Engineers 884 929 45 5% 46
Public Relations Specialists 746 817 71 10% 46
Compliance Officers 845 917 72 9% 43
Kindergarten Teachers, Except Special Education 807 979 172 21% 40
2.0 MARKET REVIEW
Western Washington University December 21, 2018
Feasibility Study for the Expansion of Educational Programs Final Report P a g e | 28
EXHIBIT 2-35 OCCUPATIONS REQUIRING A MASTER’S DEGREE WITH AT LEAST 10 ESTIMATED TOTAL
OPENINGS WITHIN THE PACIFIC MOUNTAIN WDA 2016-2021
Source: Washington State Employment Security Department, 2018.
2.5 ACCESS BARRIERS
Barriers to higher education access come in many forms, but in the Kitsap and Olympic Peninsulas, three
significant barriers are distance from educational instruction sites, availability of transportation, and
Internet connectivity.
DRIVE TIMES IN THE REGION
Distance and travel time required to pursue higher education opportunities are real concerns for residents
of the Kitsap and Olympic Peninsulas. Natural and man-made barriers to geographic access, including the
impacts of weather in the region, cause significant problems for local residents.
As shown in Exhibit 2-36, many of the education centers available on the peninsulas are located more
than an hour drive for residents of population hubs in the four-county study region. The WWU Center at
Olympic College - Poulsbo is within an hour drive of all six population centers in both Kitsap and Jefferson
Counties. Olympic College in Bremerton is similarly accessible to all six major population hubs in Kitsap
County, and five of those in Mason County. Most other geographies in Mason County are one to three
hours away from any education center. Residents of Clallam County have the most limited educational
access, as Peninsula College in Port Angeles is within an hour drive of three of the six population hubs in
the County, but no other educational site is similarly accessible. Most other geographies are one to four
hours away from any other education center.
Detailed displays of drive times to extended education sites in each of the four study area counties are
shown in Appendix B.
Occupations Requiring a Master's Degree for Entry
Estimated
employment
2016
Estimated
employment
2026
Total Growth
2016-2026
Growth Rate
2016-2026
Average
annual total
openings
2016-2026
(calculation)
Total, All Occupations 207,035 233,774 26,739 13% 7,330
Counselors, All Other 387 490 103 27% 29
Education Administrators, Elementary and Secondary School 467 573 106 23% 23
Urban and Regional Planners 446 498 52 12% 18
Educational, Guidance, School, and Vocational Counselors 342 421 79 23% 17
Rehabilitation Counselors 295 323 28 9% 16
Speech-Language Pathologists 205 269 64 31% 14
Healthcare Social Workers 207 243 36 17% 13
Nurse Practitioners 157 221 64 41% 11
Statisticians 140 182 42 30% 10

2.0 MARKET REVIEW
Western Washington University December 21, 2018
Feasibility Study for the Expansion of Educational Programs Final Report P a g e | 29
EXHIBIT 2-36 EDUCATIONAL CENTERS OFFERING WWU PROGRAMMING WITHIN ONE HOUR DRIVE
DISTANCE FROM POPULATION HUBS IN THE FOUR-COUNTY REGION
Source: Western Washington University, 2018; Google API, 2018, Community Attributes, Inc., 2018.
TRANSPORTATION ACCESS
Households with limited access to personal transportation can have challenges pursuing higher education.
In Kitsap County, between 15% and 22% of the population centers in the county have either no car or
share a car between multiple household members, limiting their ability to access face-to-face educational
programming. Given the magnitude of the share of the population of the four-county study region who
live in Kitsap County, this constitutes a significant portion of potential students who have challenges
accessing in-class coursework.
Between 5% and 23% of residents in the population centers in Jefferson County have either no car or
share a car between multiple household members. Transportation access is most problematic in Port
Hadlock-Irondale (23% have limited access) and Port Townsend (21%), the two largest geographies in the
County.
In Clallam County, more than 20% of the households in most population centers have limited access to
transportation. Transportation access is most problematic in Clallam Bay (52% have limited access), along
with Neah Bay and Sequim (30%, each).
More than 20% of households in the two largest cities within Mason County have limited access to
transportation, Shelton (27%) and Belfair (22%). Skokomish has more significant transportation issues
(32%), but because of its relatively small size, this impacts a smaller number of residents.
Detailed information about transportation access within population centers within each of the four study
area counties are shown in Appendix C.
INTERNET ACCESS ACROSS THE REGION
Internet access in the region can be a challenge for some local residents. Availability and consistency of
Internet signals can make participation in online program offerings impossible, and even make traditional
programming a challenge. It is not responsibility of WWU to upgrade tech infrastructure for the region;
this would be the onus of state and local authorities. That being said, the institution does need to consider
Kitsap Jefferson Clallam Mason
Burien Woodring College of Education
Everett University Center
Extended Education Bellingham
North Seattle College
Olympic College, Bremerton all 6 hubs 5 of 6 hubs
Peninsula College, Port Angeles 3 of 6 hubs
Shannon Point Marine Center
Tacoma Achool District Professional Development Center
WWU at Peninsula College
WWU Center at OC Poulsbo all 6 hubs all 6 hubs
2.0 MARKET REVIEW
Western Washington University December 21, 2018
Feasibility Study for the Expansion of Educational Programs Final Report P a g e | 30
these challenges and develop alternative, economical delivery methods to reach those with limited
connectivity, especially in outlying areas.
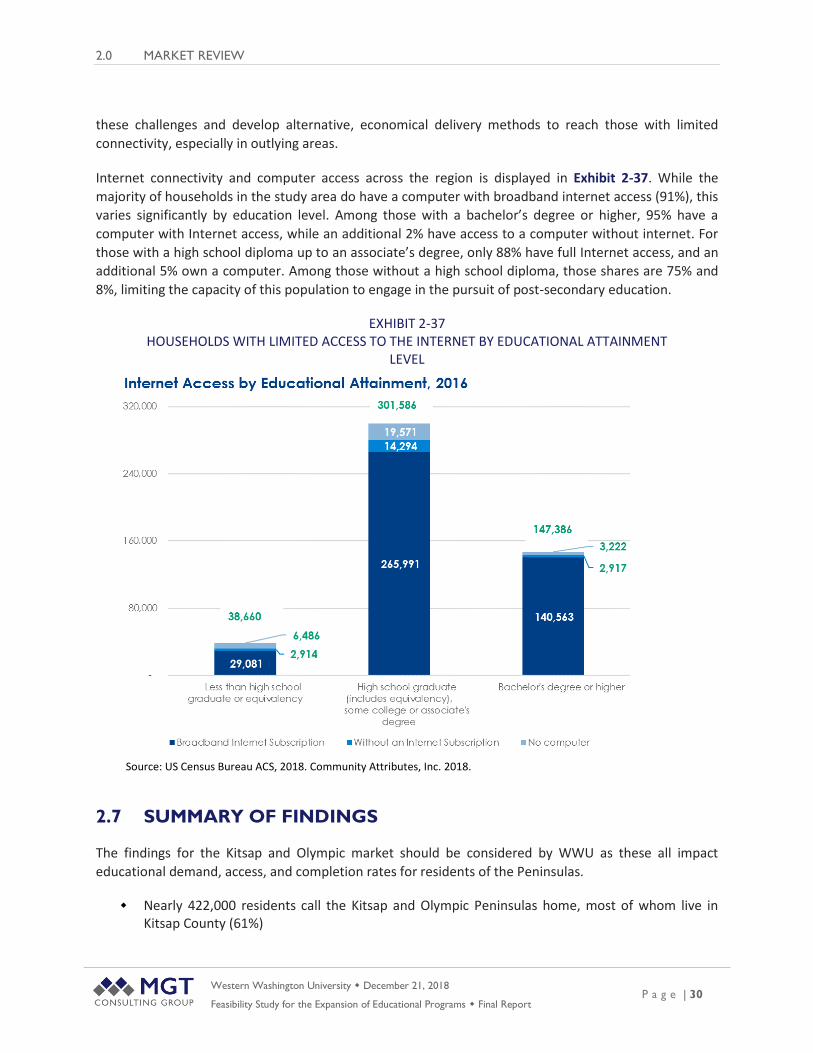
Internet connectivity and computer access across the region is displayed in Exhibit 2-37. While the
majority of households in the study area do have a computer with broadband internet access (91%), this
varies significantly by education level. Among those with a bachelor’s degree or higher, 95% have a
computer with Internet access, while an additional 2% have access to a computer without internet. For
those with a high school diploma up to an associate’s degree, only 88% have full Internet access, and an
additional 5% own a computer. Among those without a high school diploma, those shares are 75% and
8%, limiting the capacity of this population to engage in the pursuit of post-secondary education.
EXHIBIT 2-37 HOUSEHOLDS WITH LIMITED ACCESS TO THE INTERNET BY EDUCATIONAL ATTAINMENT
LEVEL
Source: US Census Bureau ACS, 2018. Community Attributes, Inc. 2018.
2.7 SUMMARY OF FINDINGS
The findings for the Kitsap and Olympic market should be considered by WWU as these all impact
educational demand, access, and completion rates for residents of the Peninsulas.
Nearly 422,000 residents call the Kitsap and Olympic Peninsulas home, most of whom live in Kitsap County (61%)

2.0 MARKET REVIEW
Western Washington University December 21, 2018
Feasibility Study for the Expansion of Educational Programs Final Report P a g e | 31
Total covered employment has risen since 2001 in every county, ranging from 4% in Jefferson County (369 jobs), to 19% in Kitsap County (more than 14,000 jobs).
Unemployment rates in each of the four counties has been higher than both the state and nation in recent years, the disparity being greater in Clallam, Jefferson, and Mason than in Kitsap County.
In 2017, unemployment claims in the study region were most prevalent in the areas of Construction and Extraction (5,934), Management (2,500), Transportation and Material Moving (1,809), Production Construction and Extraction (1,774), and Office and Administrative Support (1,752).
Average salaries in the region range from $39,000 in Jefferson to over $50,000 in Kitsap County.
Adjusted high school graduation rates in the region range from 55.7% in Clallam County to 82.2% in Kitsap. Similarly, college enrollment rates range from 39.9% in Clallam County to 59.0% in Kitsap.
Top employers in the region include military/defense, healthcare, and education.
The majority of available positions in the region through 2026 will be in the fields of healthcare (specifically, registered nurses), education, IT, and management.
The majority of homes in the study area have a computer with a broadband Internet subscription (91%), 4% have a computer but no Internet access, while 5% have no computer.

Western Washington University December 21, 2018
Feasibility Study for the Expansion of Educational Programs Final Report P a g e | 32
3.0: CURRENT EDUCATIONAL OPPORTUNITIES ON
THE PENINSULAS
Collaboration among a number of higher education institutions is required to adequately serve the needs
of the region encompassed by the four counties which are the focus of this study. These needs include all
levels of higher education, and encompass degree programs, certificates, and continuing education
opportunities delivered across a variety of models - on-campus, at off-site locations, and on-line. The
consultant team offers below a summary of major postsecondary education providers with a presence in
the area. Their respective enrollment patterns, along with those of the four-year public institutions serving
students across the state, are offered to understand current local access issues, capacity, and program
mix. Note that all academic programs/disciplines are not necessarily available locally, and enrollments are
institution-wide, and do not break out enrollment at regional centers, unless otherwise indicated.
3.1 LOCAL POST-SECONDARY PROVIDERS LOCATED IN THE
REGION
Two public colleges have campuses located in the study region, and each offers programming in
conjunction with Western Washington to local residents. A brief description of each institution is
presented below:
OLYMPIC COLLEGE
Olympic College is a public two-year community college that educates more than
13,000 students a year. Founded in 1946, the college has three campuses - in
Bremerton, Poulsbo, and Shelton - and serves a population of 280,000 residents
living in Kitsap and Mason Counties.
THE OLYMPIC COLLEGE MISSION:
Olympic College enriches our diverse communities through quality education and support so students
achieve their educational goals.
PENINSULA COLLEGE
Peninsula College is a public, comprehensive community college, one of 34 community and technical
colleges in the state of Washington. The College service district encompasses Clallam and Jefferson
Counties.
The main campus is located in Port Angeles and occupies 75 acres in the foothills of the Olympic
Mountains. Extension sites are located in Forks and Port Townsend.

3.0 CURRENT EDUCATIONAL OPPORTUNITIES ON THE PENINSULAS
Western Washington University December 21, 2018
Feasibility Study for the Expansion of Educational Programs Final Report P a g e | 33
PENINSULA COLLEGE’S MISSION:
Peninsula College provides educational opportunities in the areas of academic
transfer, professional and technical, basic skills, and continuing education. The
College also contributes to the cultural and economic enrichment of Clallam and
Jefferson Counties.
WESTERN WASHINGTON UNIVERSITY
Western Washington University enrolls approximately 16,000
students, primarily in undergraduate programs. The institution offers
more than 160 academic programs, and a student-to-faculty ratio of
18:1. Though WWU’s mail campus is located in Bellingham,
Washington, it has a presence in the Kitsap and Olympic peninsulas
through several shared sites, including:
Western Washington University at Olympic College – Bremerton
Western Washington University at Peninsula College – Port Angeles
Western Washington University Center at Olympic College – Poulsbo
SEA Discovery Center – Poulsbo
Cyber Range – Poulsbo
A listing of degree programs available through WWU on the peninsulas with their 2018 enrollments, along
with two proposed, are provided in Exhibit 3-1. These programs are offered through cooperative
agreements with Olympic College (Bremerton and Poulsbo) and Peninsula College (Port Angeles). As
shown, nearly 125 students are engaged in face-to-face classroom instruction through WWU
programming on the peninsulas, primarily in Poulsbo (63 students) and Bremerton (48 students). At
Bremerton, the Education baccalaureate and post-bacc certificate programs are most popular, while the
Business Administration program enrolls the largest share of students at Poulsbo.

3.0 CURRENT EDUCATIONAL OPPORTUNITIES ON THE PENINSULAS
Western Washington University December 21, 2018
Feasibility Study for the Expansion of Educational Programs Final Report P a g e | 34
EXHIBIT 3-1 PROGRAMS AVAILABLE THROUGH WWU ON THE KITSAP AND OLYMPIC PENINSULAS
Source: Western Washington University, 2018.
3.2 POST SECONDARY ENROLLMENT TRENDS: COMMUNITY
COLLEGES
Both Olympic College and Peninsula College have evidenced declining enrollment in recent years, as
shown provided in Exhibit 3-2. Olympic College has seen a 13% decline in enrollments since 2012, more
than 1,000 students. A slightly more significant decline has been seen at Peninsula College, with a 15%
drop in the last five years (369 students). At both institutions, most of the enrollments lost have been full-
time students (550 students at Olympic and 281 at Peninsula).
EXHIBIT 3-2 OLYMPIC COLLEGE AND PENINSULA COLLEGE ENROLLMENTS BY STATUS, 2012-2016
A number of certificates and two-year degree programs are offered at Olympic College and Peninsula
College, in addition to a limited number of baccalaureate degrees. The degrees awarded by each
Bremerton Poulsbo Port Angeles Online
Education for Inclusive Environments plus
Certification
Bachelor's/
Post-bacc42
Business Administration Bachelor's 26
Cybersecurity Bachelor's 4
Environmental Policy Bachelor's 11 8
Environmental Science Bachelor's 16 5
Multi-disciplinary Studies Bachelor's 6
Human Services Bachelor's 45
Education Administration - Principal or
Superintendent CertificateMaster's 6
48 63 13 45
Early Childhood Education Bachelor's X X
Business and Sustainability Bachelor's X
Current Programming - Fall 2018 Enrollments
Discipline LevelEducational Site
Proposed Additional Programming for 2019
2018 Total Enrollments by Educational Site

3.0 CURRENT EDUCATIONAL OPPORTUNITIES ON THE PENINSULAS
Western Washington University December 21, 2018
Feasibility Study for the Expansion of Educational Programs Final Report P a g e | 35
institution in 2017 are shown in Exhibit 3-3. As shown, the most popular degree programs on the
peninsulas are general studies, engineering technologies, health professions, and business.
EXHIBIT 3-3 2017 OLYMPIC COLLEGE AND PENINSULA COLLEGE DEGREE AWARDS BY PROGRAM
Source: IPEDS, 2018.
3.3 POST SECONDARY ENROLLMENT TRENDS: FOUR-YEAR
PUBLIC INSTITUTIONS
Enrollments for students from the four-county region attending the six four-year public institutions are provided in Exhibit 3-4 through 3-10. The data reflect enrollments throughout each institution, and are not limited to sites on the peninsulas.
KITSAP COUNTY
Nearly 3,000 Kitsap County residents enrolled in four-year public institutions in the state in 2016-17, the
majority as undergraduates. The largest share of these enrollments were at the University of Washington
(827 undergraduates and 195 graduate students), as shown in Exhibit 3-4. WWU enrolled nearly 600
students from Kitsap County (almost all of them as undergraduates) in 2016-17, making it the college of
choice for one in five Kitsap residents who attend four-year public institutions in the state.
Certificate Associate Total Certificate Associate Total
General Studies and Humanities 676 676 289 289 965
Engineering Technologies & Engineering-related Fields 543 301 844 18 8 26 870
Health Professions 148 98 246 112 46 158 404
Business Management 118 95 213 157 16 173 386
Precision Production 100 30 130 132 9 141 271
Education 114 14 128 38 38 166
Computer Information Sciences 20 22 42 94 24 118 160
Mechanic and Repair Technologies/Technicians 1 1 56 3 59 60
Personal and Culinary Serv ices 8 13 21 14 14 35
Family and Consumer Sciences/Human Sciences 4 4 20 8 28 32
Construction Trades 1 1 22 2 24 25
Agriculture/Agriculture Operations & Related Sciences 0 19 19 19
Engineering 18 18 18
Physical Sciences 9 9 9
Homeland Security, Law Enforcement, Firefighting, & Related Protective Serv ices 4 1 5 2 2 7
Communications Technologies/Technicians & Support Serv ices 3 1 4 4
Legal Professions and Studies 0 1 1 1
Social Sciences 1 1 1
Olympic College Peninsula CollegeDegrees Granted in 2017
Grand
total
3.0 CURRENT EDUCATIONAL OPPORTUNITIES ON THE PENINSULAS
Western Washington University December 21, 2018
Feasibility Study for the Expansion of Educational Programs Final Report P a g e | 36
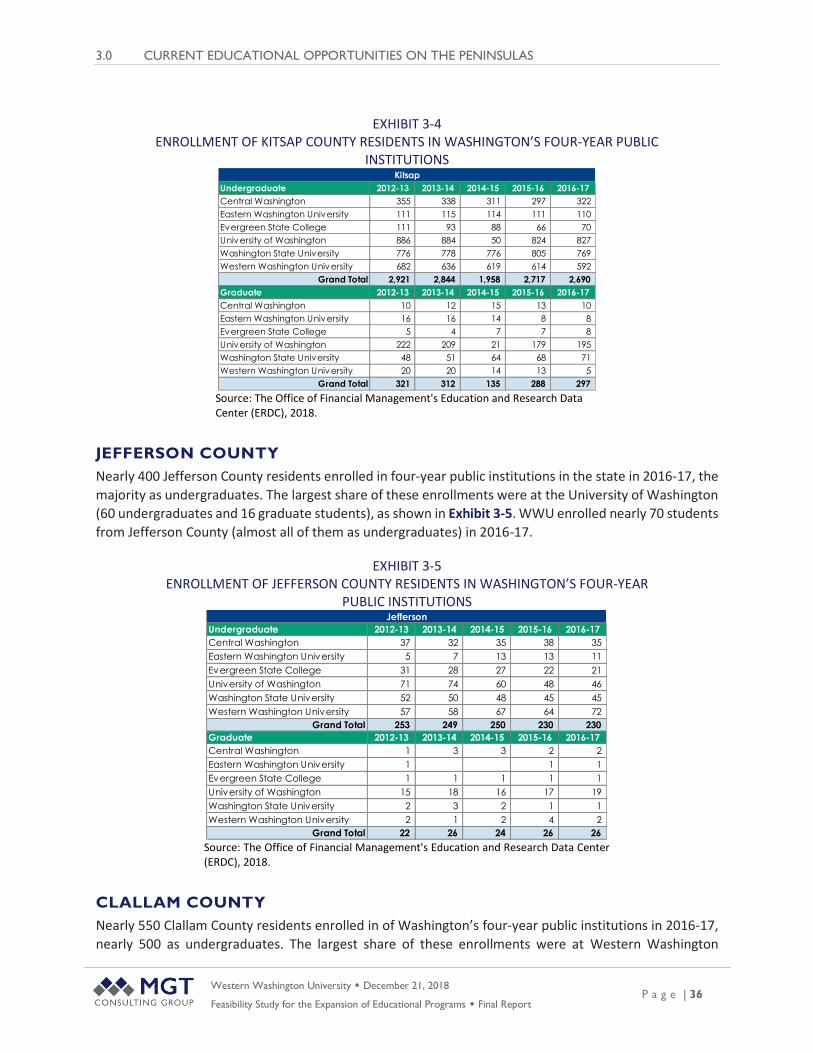
EXHIBIT 3-4 ENROLLMENT OF KITSAP COUNTY RESIDENTS IN WASHINGTON’S FOUR-YEAR PUBLIC
INSTITUTIONS
Source: The Office of Financial Management's Education and Research Data Center (ERDC), 2018.
JEFFERSON COUNTY
Nearly 400 Jefferson County residents enrolled in four-year public institutions in the state in 2016-17, the
majority as undergraduates. The largest share of these enrollments were at the University of Washington
(60 undergraduates and 16 graduate students), as shown in Exhibit 3-5. WWU enrolled nearly 70 students
from Jefferson County (almost all of them as undergraduates) in 2016-17.
EXHIBIT 3-5 ENROLLMENT OF JEFFERSON COUNTY RESIDENTS IN WASHINGTON’S FOUR-YEAR
PUBLIC INSTITUTIONS
Source: The Office of Financial Management's Education and Research Data Center (ERDC), 2018.
CLALLAM COUNTY
Nearly 550 Clallam County residents enrolled in of Washington’s four-year public institutions in 2016-17,
nearly 500 as undergraduates. The largest share of these enrollments were at Western Washington
Undergraduate 2012-13 2013-14 2014-15 2015-16 2016-17
Central Washington 355 338 311 297 322
Eastern Washington University 111 115 114 111 110
Evergreen State College 111 93 88 66 70
University of Washington 886 884 50 824 827
Washington State University 776 778 776 805 769
Western Washington University 682 636 619 614 592
Grand Total 2,921 2,844 1,958 2,717 2,690
Graduate 2012-13 2013-14 2014-15 2015-16 2016-17
Central Washington 10 12 15 13 10
Eastern Washington University 16 16 14 8 8
Evergreen State College 5 4 7 7 8
University of Washington 222 209 21 179 195
Washington State University 48 51 64 68 71
Western Washington University 20 20 14 13 5
Grand Total 321 312 135 288 297
Kitsap
Undergraduate 2012-13 2013-14 2014-15 2015-16 2016-17
Central Washington 37 32 35 38 35
Eastern Washington University 5 7 13 13 11
Evergreen State College 31 28 27 22 21
University of Washington 71 74 60 48 46
Washington State University 52 50 48 45 45
Western Washington University 57 58 67 64 72
Grand Total 253 249 250 230 230
Graduate 2012-13 2013-14 2014-15 2015-16 2016-17
Central Washington 1 3 3 2 2
Eastern Washington University 1 1 1
Evergreen State College 1 1 1 1 1
University of Washington 15 18 16 17 19
Washington State University 2 3 2 1 1
Western Washington University 2 1 2 4 2
Grand Total 22 26 24 26 26
Jefferson

3.0 CURRENT EDUCATIONAL OPPORTUNITIES ON THE PENINSULAS
Western Washington University December 21, 2018
Feasibility Study for the Expansion of Educational Programs Final Report P a g e | 37
University (160 undergraduates and four graduate students), as shown in Exhibit 3-6. WWU captured 30%
of Clallam’s residents who enrolled in the state’s four-year public institutions.
EXHIBIT 3-6 ENROLLMENT OF CLALLAM COUNTY RESIDENTS IN WASHINGTON’S FOUR-YEAR PUBLIC
INSTITUTIONS
Source: The Office of Financial Management's Education and Research Data Center (ERDC), 2018.
MASON COUNTY
Nearly 350 Mason County residents enrolled in Washington’s four-year public institutions in 2016-17,
primarily as undergraduates. The largest shares of these enrollments were at Western Washington
University (92 total students) and the Evergreen State University (92 total students), as shown in Exhibit
3-7. Nearly half of all residents of the region who enrolled in Washington’s four-year institutions that year
chose one of these two institutions.
EXHIBIT 3-7 ENROLLMENT OF MASON COUNTY RESIDENTS IN WASHINGTON’S FOUR-YEAR PUBLIC
INSTITUTIONS
Source: The Office of Financial Management's Education and Research Data Center (ERDC), 2018.
Undergraduate 2012-13 2013-14 2014-15 2015-16 2016-17
Central Washington 82 92 75 68 61
Eastern Washington University 48 44 29 32 35
Evergreen State College 30 31 28 28 26
University of Washington 112 103 97 102 100
Washington State University 97 96 107 113 114
Western Washington University 121 118 126 142 160
Grand Total 490 484 462 485 496
Graduate 2012-13 2013-14 2014-15 2015-16 2016-17
Central Washington 2 2 1 3 3
Eastern Washington University 2 1 3 2 2
Evergreen State College 2 3 5 3 3
University of Washington 25 27 33 25 23
Washington State University 5 5 6 9 11
Western Washington University 5 2 3 7 4
Grand Total 41 40 51 49 46
Clallam
Undergraduate 2012-13 2013-14 2014-15 2015-16 2016-17
Central Washington 73 69 70 76 61
Eastern Washington University 25 23 25 19 18
Evergreen State College 79 74 90 77 82
University of Washington 69 76 65 61 64
Washington State University 99 89 95 80 84
Western Washington University 57 53 53 54 44
Grand Total 402 384 398 367 353
Graduate 2012-13 2013-14 2014-15 2015-16 2016-17
Central Washington 4 2 2 2 1
Eastern Washington University 1 2 1
Evergreen State College 5 8 6 7 10
University of Washington 16 19 22 19 18
Washington State University 9 5 8 4 6
Western Washington University 1 1 1
Grand Total 34 35 41 34 36
Mason

3.0 CURRENT EDUCATIONAL OPPORTUNITIES ON THE PENINSULAS
Western Washington University December 21, 2018
Feasibility Study for the Expansion of Educational Programs Final Report P a g e | 38
REGIONAL ENROLLMENT COMPARISON
Exhibit 3-8 displays the 2016-17 enrollments of undergraduate and graduate students in public four-year
institutions by county. As shown, Kitsap County residents make up the largest share of enrollments from
the region at every institution, with the exception of Evergreen State College, at both the graduate and
undergraduate levels. Enrollments from Jefferson County represent the smallest share of enrollments
from the region at all institutions.
EXHIBIT 3-8 2016-17 ENROLLMENTS ORIGINATING FROM THE FOUR-COUNTY REGION BY
INSTITUTION
Source: The Office of Financial Management's Education and Research Data Center (ERDC), 2018.
PROGRAM ENROLLMENT BY COUNTY
Undergraduate program enrollments originating from the four-county area in 2016-17 are shown in
Exhibit 3-9, along with WWU’s share of those enrollments. As shown, WWU offers degrees in nearly all of
the programs which are most popular with residents of the four-county area. It should be noted that the
counts below differ somewhat from those reported above. The data originate from different sources, and
may not be comparing exactly the same type of student.
Clallam Jefferson Kitsap MasonRegional
TotalClallam Jefferson Kitsap Mason
Central Washington 61 35 322 61 479 13% 7% 67% 13%
Eastern Washington University 35 11 110 18 174 20% 6% 63% 10%
Evergreen State College 26 21 70 82 199 13% 11% 35% 41%
University of Washington 100 46 827 64 1,037 10% 4% 80% 6%
Washington State University 114 45 769 84 1,012 11% 4% 76% 8%
Western Washington University 160 72 592 44 868 18% 8% 68% 5%
Grand Total 496 230 2,690 353 3,769 13% 6% 71% 9%
Clallam Jefferson Kitsap MasonRegional
TotalClallam Jefferson Kitsap Mason
Central Washington 3 2 10 1 16 19% 13% 63% 6%
Eastern Washington University 2 1 8 11 18% 9% 73% 0%
Evergreen State College 3 1 8 10 22 14% 5% 36% 45%
University of Washington 23 19 195 18 255 9% 7% 76% 7%
Washington State University 11 1 71 6 89 12% 1% 80% 7%
Western Washington University 4 2 5 1 12 33% 17% 42% 8%
Grand Total 46 26 297 36 405 11% 6% 73% 9%
Share of Undergraduate EnrollmentsUndergraduate Enrollments
Graduate Enrollments Share of Graduate Enrollments

3.0 CURRENT EDUCATIONAL OPPORTUNITIES ON THE PENINSULAS
Western Washington University December 21, 2018
Feasibility Study for the Expansion of Educational Programs Final Report P a g e | 39
EXHIBIT 3-9 UNDERGRADUATE ENROLLMENTS IN MOST POPULAR PROGRAMS AVAILABLE AT FOUR-
YEAR PUBLIC INSTITUTIONS ORIGINATING FROM THE FOUR-COUNTY AREA, 2016-17
Source: Western Washington University, 2018.
Exhibit 3-10 offers 2016-17 graduate enrollments originating from the four-county area, along with
WWU’s share of those enrollments. As shown, WWU offers degrees in four disciplines which are most
popular with residents of the four county area, but only enrolls a majority of students from the region in
Biological and Biomedical Sciences.
Clallam Jefferson Kitsap MasonRegional
Total
24 Liberal Arts and Sciences, General Studies 45 22 122 67 256 ✓ 2%
52Business, Management, Marketing, and
Related Support Serv ices27 5 196 18 246
✓ 22%
14 Engineering 19 5 132 13 169 ✓ 8%
45 Social Sciences 23 8 126 10 167 ✓ 25%
13 Education 19 7 99 3 128 ✓ 45%
26 Biological and Biomedical Sciences 10 7 99 10 126 ✓ 16%
11Computer and Information Sciences and
Support Serv ices8 7 82 12 109
✓ 17%
51 Health Professions and Related Programs 14 7 79 8 108 ✓ 18%
3 Natural Resources and Conservation 15 4 73 9 101 ✓ 51%
42 Psychology 9 6 60 4 79 ✓ 23%
9Communication, Journalism, and Related
Programs8 5 57 2 72
✓ 13%
40 Physical Sciences 10 8 46 7 71 ✓ 18%
44 Public Administration and Social Serv ice 6 2 47 4 59 ✓ 73%
50 Visual and Performing Arts 3 3 51 1 58 ✓ 31%
43 Homeland Security, Law Enforcement, 10 3 39 4 56
23 English Language and Literature/Letters 9 5 34 3 51 ✓ 49%
30 Multi/Interdisciplinary Studies 1 2 30 8 41 ✓ 46%
54 History 8 2 28 2 40 ✓ 30%
16 Foreign Languages, Literatures, and 4 2 23 2 31 ✓ 45%
31 Parks, Recreation, Leisure, and Fitness 8 4 16 3 31 ✓ 39%
27 Mathematics and Statistics 6 2 19 3 30 ✓ 23%
5 Area, Ethnic, Cultural, Gender, and Group 3 1 17 4 25
19Family and Consumer Sciences/Human
Sciences6 2 16 1 25
1 Agriculture, Agriculture Operations, and 4 14 4 22
49 Transportation and Materials Moving 2 1 9 3 15
4 Architecture and Related Serv ices 1 1 10 2 14
15 Engineering Technologies and Engineering- 2 8 1 11
38 Philosophy and Religious Studies 1 1 9 11 ✓ 27%
22 Legal Professions and Studies 2 6 8
281 124 1,547 208 2,160
99 None 192 88 939 97 1,316
473 212 2,486 305 3,476
Total Declared Majors
Total Enrollment
WWU Share
of Regional
Enrollments
CIP Program Description
Enrollments Across Four-Year
Public InstitutionsWWU
Offering

3.0 CURRENT EDUCATIONAL OPPORTUNITIES ON THE PENINSULAS
Western Washington University December 21, 2018
Feasibility Study for the Expansion of Educational Programs Final Report P a g e | 40
EXHIBIT 3-10 GRADUATE ENROLLMENTS IN MOST POPULAR PROGRAMS AVAILABLE AT FOUR-YEAR
PUBLIC INSTITUTIONS ORIGINATING FROM THE FOUR-COUNTY AREA, 2016-17
Source: Western Washington University, 2018.
3.4 WWU DEGREE AWARD TRENDS
Access is critical, but completion is also a key measure of meeting local education needs. WWU awarded
72 certificates in 2017, increasing the number of these awards by 19% over 2015. (Note: These certificate
totals do not include post-baccalaureate and post-master’s certificate awards.)
Bachelor’s degree awards rose by 7% over the last three years at Western Washington University from
3,166 to nearly 3,400, the largest increase among the four-year institutions in the state.
It is important to note that these degree award counts are institutional totals, and that they reflect
certificates and degrees granted to students originating from both within and outside the study region.
Tables with additional details of degree awards for all four-year state institutions are provided in Appendix
D.
Kitsap Jefferson Clallam MasonRegional
Total
51 Health Professions and Related Programs 89 5 15 7 116 ✓ 4%
44Public Administration and Social Serv ice
Professions27 2 3 6 38
13 Education 24 1 2 9 36 ✓ 8%
52 Business, Management, Marketing, and 23 1 1 1 26
14 Engineering 21 3 1 25
3 Natural Resources and Conservation 11 1 2 2 16 ✓ 6%
22 Legal Professions and Studies 9 1 2 4 16
11 Computer and Information Sciences and 12 1 2 15
26 Biological and Biomedical Sciences 3 2 7 1 13 ✓ 62%
4 Architecture and Related Serv ices 6 2 8
40 Physical Sciences 4 2 1 7
15 Engineering Technologies and Engineering- 5 1 6
25 Library Science 5 1 6
27 Mathematics and Statistics 4 1 5
45 Social Sciences 3 2 5
5 Area, Ethnic, Cultural, Gender, and Group 4 4
9 Communication, Journalism, and Related 2 2 4
16 Foreign Languages, Literatures, and 3 3
30 Multi/Interdisciplinary Studies 2 1 3
42 Psychology 2 1 3
54 History 2 1 3
23 English Language and Literature/Letters 1 1 2
31 Parks, Recreation, Leisure, and Fitness 2 2
50 Visual and Performing Arts 1 1 2
19 Family and Consumer Sciences/Human 1 1
266 20 46 33 365
99 None 5 5
271 20 46 33 370
Total Declared Majors
Total Enrollment
WWU Share
of Regional
Enrollments
CIP Program Description
Enrollments Across Four-Year Public Institutions
WWU
Offering

3.0 CURRENT EDUCATIONAL OPPORTUNITIES ON THE PENINSULAS
Western Washington University December 21, 2018
Feasibility Study for the Expansion of Educational Programs Final Report P a g e | 41
3.5 SUMMARY OF FINDINGS
Two public colleges have campuses located in the study region – Peninsula College and Olympic College. Both provide educational programming in cooperation with WWU for residents of the four-county area.
Programs are available through WWU on the peninsulas in the areas of education, business administration, cybersecurity, and environmental policy.
Nearly three quarters of enrollments at all four-year state institutions originating from the region are residents of Kitsap County (71% of undergraduates and 73% of graduate enrollments).
WWU offers degrees in nearly all of the programs which are most popular with residents of the four-county area.
Popular undergraduate programs among students from the region include Liberal Arts and Sciences, General Studies and Humanities (256 enrolled students), Business, Management, Marketing, and Related Support Services (246), Engineering (169), Social Sciences (167), Education (128), Biological and Biomedical Sciences (126), Computer and Information Sciences and Support Services (109), Health Professions and Related Programs (108), and Natural Resources and Conservation (101).

Western Washington University December 21, 2018
Feasibility Study for the Expansion of Educational Programs Final Report P a g e | 42
4.0: STAKEHOLDER INPUT
In any regional assessment of higher education access, it is important to look beyond the demographic
data (population trends, educational participation and attainment rates, and occupational projections)
across the study area to identify postsecondary education needs. It is critical to seek direct feedback from
local employers and community leaders knowledgeable about the market in order to have a complete
understanding of the needs in the region. To this end, MGT conducted qualitative interviews on the Kitsap
and Olympic Peninsulas during a site visit (and by phone when necessary) over the course of several weeks
in July and August 2018.
Since the study area is so broad, a variety of stakeholder input efforts were engaged. MGT conducted
group meetings, phone interviews, and an online survey to assess the perceptions of stakeholders on the
ground of the need for, and access to, baccalaureate and graduate degree programs throughout the
Peninsulas.
MGT conducted extensive meetings with regional stakeholders. Efforts were made to engage the
following groups:
Educational leaders from public K-12 and postsecondary sectors
Employers
Industry representatives
Representatives of Naval Base Kitsap and the Puget Sound Naval Shipyard
Workforce and Economic Development Councils
Regional STEM Network Representatives
Community leaders in Bremerton, Poulsbo, Port Townsend, Port Angeles, and Shelton
Representatives of local Native American tribes
Administration, faculty, and staff of WWU, along with representatives from Peninsula and Olympic Colleges.
The focus of each interview and group meeting was identification of existing barriers for local residents,
employees, and employers who require or seek postsecondary education and training opportunities to
upgrade skills, or earn credentialing, a certificate, or degree completion. Stakeholders were asked to
identify any barriers to higher education opportunities. Each respondent offered their perceptions and
opinions about programs of need, appropriate delivery options, and potential solutions to improving or
expanding local access across the designated study region.
4.1 STAKEHOLDER FINDINGS
Focus groups were held in 11 locations in the region during the last week of July. The dates and locations
of each group are shown in Exhibit 4-1. More than 100 stakeholders participated in focus groups
throughout the region.

4.0 STAKEHOLDER INPUT
Western Washington University December 21, 2018
Feasibility Study for the Expansion of Educational Programs Final Report P a g e | 43
EXHIBIT 4-1 MEETING PARTICIPANTS
THEMES FROM COMMUNITY CONVERSATIONS
The qualitative interview process is intended to generate discussion to inform the planning efforts of the
WWU decision-making team as they seek to create enhanced access to educational opportunities for the
residents of the region. This chapter presents the consulting team’s summary of the perceptions, needs,
issues, and concerns expressed by the collection of interview participants. While the stakeholders we
contacted do not represent every possible viewpoint on the issue of instructional needs and access, we
feel confident that the summation of their remarks does express the opinions of many in the region.
Without fail, all stakeholders expressed support for expanding access to postsecondary education
opportunities throughout the region, and were supportive of Western Washington’s involvement and
willingness to expand local opportunities.
Group Meeting Participant List
West Sound STEM Network Dr. Kareen Borders, and Network Partners (K-12, Business and Education)
Peninsula College
Dr. Luke Robins, President; Sharon Buck, VP, Instruction; Jack Huls, VP,
Student Services; Carie Edmiston, Interim VP, Finance and
Administration; Mia Boster, Dean, ProfTech; Bruce Hattendorf, Dean, Arts
& Sciences
Kitsap Economic Development
Alliance
John Powers, Executive Director; KEDA Executive Committee (Business,
Government, Education) Dan Pike (Puget Sound Regional Council),
Monica Blackwell (KEDA Board Chair), Allison Sadler (City of Bremerton),
Kathy Cocus (KEDA Business Development Director), David Tucker
(Business Owner)
Olympic College President's Cabinet
Dr. Marty Cavalluzzi, President; and President's Cabinet: Mary Garguile,
VP Instruction; Elaine Williams-Bryant, VP Student Services/Engagement;
Cheryl Nunez, VP Equity and Inclusion; Janelle Whitely, VP Administrative
Services; Allison Phayre, Exec. Director Institutional Effectiveness; Adam
Leonard, Assistant to the President
City of Poulsbo Becky Erickson, Mayor; Gary Nystul, City Council Member;
WWU Peninsulas Faculty/StaffMarlene Harlan, Candi Merrill, Heather Hutchins, Erik Fretheim, Jenise
Bauman, Troy Abel, Mary Sass, Crystal Cline, Sylvia Yang, Denise Kilkenny
Puget Sound Naval Shipyard Ann Mechling, Chief Learning Officer, Adrian Weber, Engineering HR
Pathways to Success Team
Emily Manson, Pathways to Success Kitsap, Jefferson, & Clallam
Counties; Tiffany Skidmore, Kitsap Career Counselor; Jamila Larson,
Kitsap Career Counselor
Mason County
Allison Smith, Director, OC Shelton; Heidi McCutcheon, Exec Dir Shelton
Mason County Chamber of Commerce; Steve Warner, Olympic College
Trustee; Kathy McDowell, City of Shelton Commissioner
Port Townsend
Nancy Bluestein-Johnson, WWU Staff; Lela Hilton, Public Development
Authority Board Member; Kate Dean, Jefferson County Commissioner
and Chair of Olympic Consortium Board; Beth Anders, Jamestown
S'Klallam Tribe Higher Education; Rachelle Blankenship, Jamestown
S'Klallam Tribe Higher Education; Kim Kettel, Jamestown S'Klallam Tribe
Higher Education; Jessica Egnew, Lower Elwha Tribe Higher Education;
Janine Boire, Port Townsend Marine Science Center; Dave Robison,
Executive Director, Fort Worden; Rufina Garay, Strategic Director, Fort
Worden; Todd Hutton, former University President, Utica; John Polm, Port
Townsend School District Superintendent; Carrie Ehrhardt, Port Townsend
High School Principal; Anna Green, Peninsula College Port Townsend Site
Director; Other Business Leaders and Community Members
Suquamish Tribe
Brenda Guerrero, Higher Education Director; Joe Davalos,
Superintendent Suquamish Education Dept; Barbara Lawrence, Tribe
Elder

4.0 STAKEHOLDER INPUT
Western Washington University December 21, 2018
Feasibility Study for the Expansion of Educational Programs Final Report P a g e | 44
Items that follow in this section represent themes expressed by community leaders, educators, and
employers during the interview process, and reflect their concerns, perceptions of current conditions in
the region, and perceived needs of Kitsap and Olympic Peninsula residents, employers, and employees
relative to higher education access issues.
SUPPORT FOR WWU EXPANSION
Stakeholders in every meeting indicated a desire to have an educational site located in close proximity to
their community. The meeting in Port Townsend, in particular, garnered tremendous interest, with more
than 40 attendees. Obviously, WWU needs to make careful decisions about the placement of educational
resources in area with the most potential for impact and success.
Anecdotally, declining activity at the Poulsbo Center by Olympic College is concerning for the community.
The site is seen as a valuable resource, and the College’s continued presence and success in that area of
Kitsap County is important to local leaders.
BARRIERS TO ACCESS
The four-county region has significant geographic and physical barriers and in many locations, limited
Internet access which curtails residents’ ability to access both traditional and distance learning options
currently available across the region.
Transportation to and from Seattle from Kitsap County is continuously improving with addition of more
fast ferry routes. This will likely positively impact population growth on the peninsulas, as it will be easier
for residents to live there, and commute to Seattle for work. Population growth may increase demand for
educational access and enhance opportunities for WWU expansion in the region as well.
Port Townsend has a slightly older population, many of retirement age and college level educated, but
still seeks additional baccalaureate and continuing education opportunities locally. The repurpose of Fort
Worden, with facilities appropriate for instructional programming (including housing in a conference
center style setting) is one avenue for program expansion.
WORKFORCE AND PROGRAM ALIGNMENT
Stakeholders understand that the connection between educational providers, applicable programs, and
workforce needs is important. Local employers, in particular the shipyard, naval base, and associated
suppliers and surrounding industries will be a significant source of many opportunities requiring
educational credentials (degrees, certificates, and continuing education), and targeting programming to
the needs of these employers will be critical to the success of any expansion efforts on the Kitsap
Peninsula.
Community leaders noted a number of programs which offer the most promise, including project
management (especially for government workforce and contractors), engineering/technology, human
resources, and finance/accounting. Additionally, a degree completion program for those with some
college credits (but no degree) would be valuable for a number of adult learners in the region.
Additionally, there is considerable need for a skilled workforce pipeline in health care related professions,
particularly patient care at all levels.

4.0 STAKEHOLDER INPUT
Western Washington University December 21, 2018
Feasibility Study for the Expansion of Educational Programs Final Report P a g e | 45
INSTITUTIONAL COOPERATION AND PARTNERSHIP
In consultant team meetings, community college administrators from both Olympic College and Peninsula
College expressed strong interest in continued and expanded partnership with WWU to assist their
students in completing four-year degrees. However, representatives of both institutions expressed
concern that potential WWU local expansion might negatively impact their own enrollments if Western
instructional portfolio were to include introductory major courses and general education courses that the
community colleges currently offer. They would like any WWU expansion to be developed under a 2+2
model that would benefit all parties.
UNIQUE CONCERNS FROM INDIVIDUAL CONVERSATIONS
Local representatives in each meeting with the consultant team often expressed concerns and needs
unique to their respective communities/region, and a summary of these key points are offered below:
WEST SOUND STEM NETWORK:
Most significant barriers are limited flexibility of higher education programs and delivery options.
Western could engage with elementary school students early to expose them to math, science, and other curricula for high demand technical careers (don’t start at the high school level).
Potential to get WWU involved in apprenticeship programs tied to local employer needs and credentialing.
PENINSULA COLLEGE:
Premier/specialty programs of local need: Cybersecurity, Nursing, Online Hospitality, Multimedia, Medical Assisting, Welding, Addiction Studies, Composites and Composites Recycling, Bachelor’s Applied Business, Early Childhood Education.
The College’s High Flex Option allows enrollment in online or face-to-face (can come to class or not come to class because everything is online), helps smooth enrollment and program offerings.
Barriers to entry: time, financial demands, local economics, difficulty creating critical mass to sustaining a program long term.
Finish Line Fund helps provide financial aid for students near completion (within ¼ of graduation).
Five native nations served in the area which are not homogenous in attitudes and culture. There is a strong sense of community and family within these populations, making it hard to leave local community for traditional college setting.
Potential education bachelor’s to train teachers to meet shortage in peninsula high demand areas (now have to staff with education specialty licenses).
KITSAP ECONOMIC DEVELOPMENT COUNCIL:
Not a full four-year curriculum in the area and no student housing is available.
Technical training options are limited with narrow focus on shipyard, but missing other employment opportunities (e.g.: law enforcement professionals shortage), more certification options are needed for multiple occupations at both two-year and four-year program levels.
Retraining/improving skills for displaced workers, and for those employees who wish to advance.

4.0 STAKEHOLDER INPUT
Western Washington University December 21, 2018
Feasibility Study for the Expansion of Educational Programs Final Report P a g e | 46
Manufacturing positions going unfilled (need a more well-rounded approach to skills training).
Soft skills training is lacking at all levels. Incorporate into two-year and four-year curriculum of all majors.
Cultural challenges (figuring out ways to weave culture into education/community, partnering with the local tribes).
Opportunities to expand programs with the shipyard (fuel research with boats, etc.), interest in engineering programs related to defense manufacturing, healthcare (7-10% of workforce), teacher shortages.
Fast Ferry from Kingston will bring changes to community. Additional residents with post-secondary education needs of every kind.
Affordability is a concern, and with a large population of veterans in the region, many could utilize financial aid from GI Bill and higher education institutions must accommodate the needs of veterans.
OLYMPIC COLLEGE MEETING WITH PRESIDENT & PRESIDENT’S CABINET:
Flagship programs: Business, Industrial Trade, Early Childhood Education, Nursing, Practical Nursing, Medical Assisting, PSNS Apprentice, Welding, Organizational Leadership & Technical Management, Digital Media, Engineering (partnership with WSU).
Regarding workforce development, OC maintains a strong connection to the K-12 community through WFD and Tech Prep program and with certification for new teachers coming from industry, para-educators transitioning to teaching.
Programmatic needs expressed included Healthcare: electronic medical records, dental hygiene program, nursing expansion, surgical tech, apprenticeship opportunities with Department of Labor, expansion of online programs (requires more human capital capabilities), Aviation - piloting, drones.
Barriers to overcome: topical and geographical, affordability, technology, program awareness and public’s lack of knowledge that these programs exist and lead to good paying job opportunities.
POULSBO MAYOR AND CITY COUNCIL MEMBERS:
Few if any two-year degree programs being offered in the Poulsbo facility by Olympic College – Could/would WWU take over the Poulsbo building if OC pulls out completely?
Poulsbo geographical advantage, North Sound traffic coming through, added potential from new Fast Ferry route(s).
Housing issues, home sharing options for affordability (Housing Kitsap).
WESTERN WASHINGTON UNIVERSITY – POULSBO CENTER:
Program Needs: Master’s degree programing, one possibility is in Education, this would allow students to stay in Kitsap County area, Human Services (online only major currently), Computer Science, IT, Cyber, and Business Management/Finance.
Financial constraints of potential students - difference in tuition and fees between campuses.
Ability to finish a program online if students must take leave from in-class options.

4.0 STAKEHOLDER INPUT
Western Washington University December 21, 2018
Feasibility Study for the Expansion of Educational Programs Final Report P a g e | 47
Need to offer more support to first generation students, veterans, etc. for entry, retention and degree completion.
NAVAL SHIPYARD:
Hire 600-800 new employees per year - 90 engineers needed, 21 interns (non-nuclear), could probably double number when including nuclear. Approximately 290 are white collar jobs.
Try to get interns at end of sophomore year (pays for books, tuition, guaranteed jobs) need 640 hours before they can transfer over.
Washington State students can work during the school year to get internship hours
WSU doesn’t graduate enough engineers to meet hiring needs (only mechanical program locally).
Advanced degree in Engineering is needed – and students don’t get enough exposure to nuclear engineering, despite the related naval operations in the area.
Advanced manufacturing/3-D printing type/additive manufacturing skills needed.
Problems in retaining employees within work units. Numerous opportunities for skilled employees at shipyard/Navy civilian workers to move out and up on base.
WORKSOURCE:
Work with 16-2four-year age group and adults - dislocated and adult workers who need training, are unemployed (skills or vocational training)in Kitsap, Jefferson, and Clallam.
Jefferson most lacking in opportunities.
Program Needs: Housing availability, short term certifications, and basic job skills. Long-term goal of post-secondary degree completion.
Old Human Services model from WWU (structured cohort model) more classroom-based vs. online programs vs. Model of South Seattle College (offers short term low cost programs).
Need to get locals familiar with what a university experience would look like, including the application process, and financial opportunities available to low income students.
Community colleges moving away from the trades and leaving a gap in the community which needs to be filled.
60% of clients in medical/healthcare fields.
SHELTON:
Shelton OC Campus strategic plan – where can WWU partnership help in that plan to sustain enrollments, pathways to a four-year degree option, specialty training from a broad curriculum portfolio of Western Washington?
Needs: Agriculture/aquaculture (Shellfish and Forestry), Environmental Science, Hospitality (entry level skills), OC starting Hospitality certificate (could WWU offer BA?), Healthcare, Business Administration, Political Science, Trades (like Construction).
OC teacher education program (hybrid program) offered in Shelton, partner with Shelton School District.

4.0 STAKEHOLDER INPUT
Western Washington University December 21, 2018
Feasibility Study for the Expansion of Educational Programs Final Report P a g e | 48
Reaching out to underserved populations like Latinos and the large untapped Native American communities.
Barriers: Cost, as the average income is lower. Students start here, but can’t finish here due to lack of programmatic offerings, lack of knowledge that they can attend/qualify for college, counselling/guidance at the K-12 level lacking.
Local Needs: Transportation (lack of bus routes), midcareer retooling options, sustainability, IT professionals (cybersecurity, network side).
PORT TOWNSEND MEETING:
Needs: Workforce replenishment, vocational rehabilitation, hard for people to identify the opportunities that are available to them - need to ensure that whatever is done is inclusive of all members of society and make retraining affordable for people.
Would like to see symposiums, training, intensives (continuing education) offered in the area.
Blue collar work paying more and has a shortage of workers, many qualified workers leave for Seattle. More difficult to get folks interested in college completion beyond the two-year level if unemployment is low, wages are increasing, and jobs are plentiful.
OC trains for shipyards and hospitals, but not the construction industry, which has seen declining numbers in recent years.
Barriers: Feeder programs to four-year degree pursuit are nearly non-existent in the area, housing issues, nowhere for students to live, awareness of financial options, some people need help learning how to use computers before they can access distance learning.
The community is in transition, with many baby boomers, hard to attract younger workers due to few family wage jobs. It’s also a retirement community, based on tourism and hospitality industry.
Would like higher education in Jefferson County to advance the working age population as well.
Potential to partner with WWU to add additional course work to turn out more well-rounded students with the soft skills employers seek.
Would like a marine science degree, but realize the affordability issue of such. Northwest Maritime Center has the potential to create interest or partnerships.
Port Townsend is a sophisticated community in terms of higher education. WWU can sit down with the community and identify ways to create certifications that businesses in the area will recognize. Creative, small scale ideas.
A past vision had been to have a place for all colleges to deliver programs and instruction, but somewhere along the line that did not come to fruition.
Becoming Professional Series from local nonprofit: Area has vast knowledge of higher education programing and operations from the people who moved here after retirement, and can help train and mentor the younger generation and work with students in becoming more professional, which will help build bridges between students and the community.
There is no small business development program in the area, or federal programs that could be implemented to help create access to higher education and training.

4.0 STAKEHOLDER INPUT
Western Washington University December 21, 2018
Feasibility Study for the Expansion of Educational Programs Final Report P a g e | 49
Rethinking Rural: Program created to emphasize to local youth that success can be had without moving away.
Issues with teacher hiring - particularly in Special Ed, many unfilled positions, teacher education programs need to be more readily available, and open to a variety of audiences and pathways.
Broaden teacher certification program offerings.
SUQUAMISH TRIBAL EDUCATION MEETING
The community has been a strong partnering with OC with WWU involved.
The tribe views the Sea Center takeover by WWU as a positive thing.
Higher Ed is very important to the tribe, all levels of education are represented among tribal members. There are issues with students not wanting to leave home, with a limited support system off the reservation.
Career path emphasis – hospitality and service, seafood industry (divers and packers), education, wellness, law enforcement, natural resources, recreation, planning and administration.
Since the casino opening, there has been increased monetary commitment to education, early learning center, head start, college scholarships.
Would value a Suquamish campus where post-secondary providers can come in and partner to teach classes, creating an academic network utilizing the existing social network, and remove issues around barriers to transportation, housing, family, etc.
Human services in demand but 100% online makes it unattractive for many students.
Some students need classes in the 90s (college prep) before they can attempt 100 level courses. When students don’t pass these classes, they tend to stop all together.
Tribe offers child care when classes are in session – day and evening.
The Suquamish Tribe World View is an interdisciplinary mindset, with an emphasis on the relationships between things/people/nature. An institution with an understanding of that concept would be a welcome educational partner.
Exposure to the experience of college is needed to allow potential students to decide where they want to go/what they would like to study and career to pursue.
Potential WWU, OC, and Suquamish partnership on a capital project to create a college space (classrooms for college credit) at Suquamish Shores or Old Tribal Center (already remodeled to be a school).
PROGRAMS OF NEED ACCORDING TO REGIONAL STAKEHOLDERS
IT/Network/Cyber Security
Computer Systems & Software Development
Business Admin/Finance
Teachers/Educators
Environmental Science/Aquaculture
Engineering (Nuclear, Industrial, Mechanical, Electrical)
4.0 STAKEHOLDER INPUT
Western Washington University December 21, 2018
Feasibility Study for the Expansion of Educational Programs Final Report P a g e | 50
Human Resources
Biology/Chemistry
Hospitality
Social Work
Marine Science
Law Enforcement/Criminal Justice
4.2 ONLINE SURVEY FINDINGS
An online survey was initially distributed to stakeholders throughout the Kitsap and Olympic Peninsulas,
including business owners, governmental officials, school/college administrators, community leaders, and
tribal representatives, and 65 community members completed the instrument. The largest shares of
respondents were business owner/managers (26%), school superintendents (14%), local or state
government officials (9%), and college faculty/staff/administrator and community leaders (8%, each).
Most represented or served Kitsap County (83%).
More than half of all respondents indicated that technology, healthcare, education, and construction
development sectors have a significant need for workers requiring education/training beyond a high
school diploma.
Local program availability was indicated by the overwhelming majority of respondents as a significant
barrier to the pursuit of education in the region (87%), followed by transportation/distance issues (60%),
financial constraints (58%), and program flexibility (57%).
In an effort to identify degree programs needed on the Kitsap and Olympic Peninsulas, the online survey
asked respondents to identify the programs (and degree level) that would be most beneficial to the region.
More than half of survey respondents indicated that four-year degree programs in healthcare, education
engineering, and technology fields would be valuable. Additionally, one third to one half indicated that
degrees (two-year or four-year) would be of benefit to the region, including healthcare, technology,
social services and business/management.
Detailed online survey findings are offered in Appendix E.
In addition to the community survey effort, an online survey was developed for distribution to students
in the region. Due to low response (22 completions), the results are extremely limited and not
generalizable to the broader student population. That being said, it is illustrative to examine the results
which are shared below.
Most responding students were currently pursuing a four-year degree (17 responses) but have a goal of
completing a master’s degree (15 responses). Most believe they will or may need to leave the Kitsap
Peninsula to pursue their academic goals (16 responses). Barriers to the local pursuit of post-secondary
education included program availability in the region (18 responses), financial constraints/affordability
(17 responses), and program flexibility (14 responses).
Western Washington University December 21, 2018
Feasibility Study for the Expansion of Educational Programs Final Report P a g e | 51
5.0: PROGRAM NEEDS
This higher education needs assessment initiated by Western Washington University is intended to
identify opportunities to expand access to higher education in the Kitsap and Olympic Peninsula market.
Access to, and utilization of, public higher education by residents within the geographic scope of the study
has been historically hindered due to a variety of factors, including the rural nature of outlying areas in
several counties, natural and manmade obstacles to access education delivery sites (particularly those
offering a complete four-year degree completion option) combined with local economic disparities,
workforce profiles, and employer mix. For the Peninsulas community as a whole, increasing access to the
state’s higher education degree programs locally is both an educational goal, as well as an economic
sustainability imperative.
This chapter offers a summary of the consultant’s observations from the needs assessment study, along
with an outline of issues, and concerns for consideration which could impact demand as WWU examines
options to enhance access to baccalaureate and graduate level programs across the region given the
educational assets available.
5.1 MARKET OBSERVATIONS AND FINDINGS
Based on the occupational projections across the study area, there will be a strong need for candidates with appropriate healthcare training in the region (particularly registered nurses), along with teachers at both the elementary and secondary levels. WWU’s Education programming is available at the OC Bremerton campus, but could readily be expanded to other sites, as needed.
A good number of managerial positions are projected in the region in a variety of occupational and industry settings, so expansion of the WWU business administration/management program (currently at Poulsbo) may make it available to a broader region across the Peninsulas.
While these projections reflect the situation in both WDAs that cover the four-county market area of this study, one cannot put too much stock in the Pacific Mountain WDA data as Mason County constitutes only 8% of the total covered employment of that WDA, based on available state data.
Unemployment is higher in Clallam, Jefferson, and Mason than the state as a whole, and the current national average. That is true for Kitsap County too, but to a lesser degree. There could be real opportunities for WWU alone, or in collaboration with the two local community colleges, to offer degree completion pathways or career retraining for this population segment.
Several local school districts have fairly strong high school graduation rates, but less than stellar college-going rates. Again, there may be opportunities among WWU and other local post-secondary providers to help improve college participation and completion in those districts.

5.0 PROGRAM NEEDS
Western Washington University December 21, 2018
Feasibility Study for the Expansion of Educational Programs Final Report P a g e | 52
EXHIBIT 5-7 WWU ENROLLMENT BY PROGRAM ON THE PENINSULAS
Source: Western Washington University, 2018.
CONCLUSIONS
WWU has a history and current visible presence on the peninsulas, particularly through shared locations
with Olympic College and Peninsula College.
Western Washington as a whole, currently enrolls a significant portion of peninsula residents who are
attending one of the public four-year institutions in the state.
There is significant local interest and support from stakeholders in the region in an expanded presence of
WWU across the peninsulas.
If WWU expands their offerings on the peninsulas, although the full impact on the Bellingham campus is
unknown, it seems unlikely that significant numbers of students would leave that site in favor of pursuing
education locally. A more likely scenario would be an overall increase in WWU enrollments through the
expanded presence in Kitsap and the Olympic Peninsulas, depending on program mix, location, and
delivery model.
The likely programs for expansion should emanate from:
Local workforce needs
Program pathways (2+2 articulation) with the two local community colleges
Multiple sites and delivery options on the peninsulas
Existing program portfolio on the Bellingham campus
There is a possibility that one or more programs with potential for development on the peninsulas would
be entirely new to WWU. If so, the approval process must be figured into any program expansion timeline.
Bremerton Poulsbo Port Angeles Online
Education for Inclusive Environments plus
Certification
Bachelor's/
Post-bacc42
Business Administration Bachelor's 26
Cybersecurity Bachelor's 4
Environmental Policy Bachelor's 11 8
Environmental Science Bachelor's 16 5
Multi-disciplinary Studies Bachelor's 6
Human Services Bachelor's 45
Education Administration - Principal or
Superintendent CertificateMaster's 6
48 63 13 45
Early Childhood Education Bachelor's X X
Business and Sustainability Bachelor's X
Current Programming - Fall 2018 Enrollments
Discipline LevelEducational Site
Proposed Additional Programming for 2019
2018 Total Enrollments by Educational Site

5.0 PROGRAM NEEDS
Western Washington University December 21, 2018
Feasibility Study for the Expansion of Educational Programs Final Report P a g e | 53
The educational access needs stretch into areas with relatively small populations, geographically removed
from the existing WWU educational sites on the peninsulas, which often have limited local two-year
degree program options. Given resource limitations to have a physical presence in these smaller remote
locations, creative delivery solutions will need to be developed.
Baccalaureate degree program access is limited in the region by distance, natural, or man-made physical
barriers, and technical connectivity challenges.
Indigenous peoples in the region have unique needs and cultural traditions that may impact their interest
and participation in post-secondary educational programming, but tribal leaders would entertain
additional opportunities that would conform to and enhance cultural traditions and constraints. They also
have business and financial interests which require personnel with post-secondary credentials at all levels.
These tribes operate their own elementary and secondary education programs, which may require
teachers and administrators with education credentials, as well.
The current peninsula locations where WWU offers programming seem to be appropriate for the various
population centers across the four counties under study. The smaller and isolated communities westward
to the coast continue to have limited access, and lack the population density to justify a stand-alone WWU
education center or site. However, the needs of these peninsula residents should be addressed in some
manner, and the institution may need to partner creatively with local entities (public or private) across
this region to deliver instruction and academic programming to local residents.
WWU expansion across the peninsulas will likely require a gradual build-up, relative to program mix,
enrollment targets, staffing levels, and space needs and capacity. Collectively, the current WWU
programming capacity and enrollment provides a stable base for an incremental program expansion
approach noted above for both existing programming and the introduction of new options.

Western Washington University December 21, 2018
Feasibility Study for the Expansion of Educational Programs Final Report P a g e | 54
6.0: DELIVERY OPTIONS AND FINANCIAL MODELS
As Western Washington University continues to address demand for degrees and continuing education
on the Kitsap and Olympic Peninsulas, the need for their own permanent space for program expansion
has become more apparent. The market data shows continued growth in population and jobs, and
confirms gaps in local access to four-year and graduate degree programming in each of the four counties
of the anticipated WWU service area. The bulk of the area’s population resides within Kitsap County and
it continues to be a focal point for the University. That being said, continued delivery of WWU programs
to the other three counties (Jefferson, Clallam, and Mason) is of importance to Western Washington
leadership as well.
This final chapter of the Feasibility Study Report outlines possible new and continued options for program
delivery expansion across the Kitsap and Olympic Peninsulas. It further tests the financial feasibility of a
permanent WWU facility in the area of North Kitsap County (Poulsbo) for future expansion. Such a new
facility should not exclude growth of current and potential new distance delivery options WWU could
consider to reach outlying areas, smaller pockets of need, and opportunities to overcome both physical
and technological barriers particularly prevalent across the vast area of the Olympic Peninsula. Continued
collaboration with both Olympic and Peninsula Colleges is a critical component to improving access to
four-year, graduate, and continuing education in this growing area of Washington.
POTENTIAL DELIVERY MODELS FOR CONSIDERATION
The following possible options offered for expansion of WWU program access on the Kitsap and Olympic
Peninsulas are not mutually exclusive. The expanse of the four-county area, distance, and difficulty
reaching current delivery points for in-class programming, and the unreliability of Internet network
services in some of the more remote areas, make a multiple option approach to delivery of higher
education degree programs a necessity if improved access is paramount. The options initially put forth
include:
1. Pursue a Stand-Alone WWU Higher Education Center
Initially develop a new stand-alone WWU Education Center facility.
Longer-term, expansion to a full WWU branch campus.
2. Continue Shared Usage of the Olympic College Higher Education Center at Poulsbo
Continue shared use of the OC Center as currently arranged, with program portfolio expansion as capacity permits.
Obtain “ownership” of the Olympic College Higher Education Center, and expand WWU degree offerings at upper division and graduate level.
Pursue a new stand-alone WWU Center on the current Poulsbo site.

6.0 DELIVERY OPTIONS AND FINANCIAL MODELS
Western Washington University December 21, 2018
Feasibility Study for the Expansion of Educational Programs Final Report P a g e | 55
3. Offer Multiple Delivery Points Across the Four-County Region
Continue current program delivery at Olympic College’s Bremerton and Shelton campuses, and Peninsula College’s Port Angeles campus.
As localized demand increases, add delivery of new programs at Olympic and Peninsula College sites across the region.
Expand program delivery in Port Townsend at Fort Worden.
Develop additional remote delivery sites through partnerships with local public or private entities, primarily for online program delivery.
The feasibility analysis component of this study focuses primarily on the establishment of a Western
Washington facility on the Kitsap Peninsula. We believe that would be the initial starting point for
establishing a permanent WWU presence on the peninsulas.
Based on the data collected on needs and demand across the region, Western should pursue a new stand-alone education center to accommodate near-term growth, while continuing to collaborate on a 2+2 model with the local community colleges. As the greatest opportunity for increasing enrollments and degree production is expected in population-dense Kitsap County, and Western has had experience and success with its collaborative ventures and extended outreach, this analysis focuses primarily on the feasibility of a WWU facility in Poulsbo.
Furthermore, simultaneously WWU expansion of multipoint delivery options in more remote parts of the region to increase access to four-year degree options, must be strategic, deliberate and collaborative.
The current Western Washington delivery site in Poulsbo consists of leased space in Olympic College’s
Education Center building. Although the arrangement is mutually beneficial, one disadvantage is that
Western has only “tenant” status in the current facility. However, this Olympic College site has the acreage
to accommodate two or three additional buildings, dependent on their footprint. This location is a known
higher education delivery point on the Kitsap Peninsula for both two-year and four-year programming and
its location provides access for residents and workers from points north.
Western Washington University wishes to test the feasibility of developing a building in the Poulsbo area
to ensure the programs offered by the University will be available to residents of the Kitsap Peninsula and
beyond, with the potential for several programs such as Education, Environmental Policy/Management
and Cybersecurity becoming destination programs. The existing Poulsbo site option was identified as the
most viable given the demand in the region and the availability of land at no cost on a site where Olympic
College has their facility. This would not preclude WWU from continued offering of programs in Bremerton
or other sites on the peninsulas.
The development of the financial analysis to test a stand-alone WWU facility includes a number of
assumptions (see Exhibit 6-1).
The starting tuition rate was obtained from the Western Washington University budget office , and includes the operating fee and the capital building fee for tuition. Other fees were not included in the tuition calculation, as the fee schedule for the Poulsbo Center was not available.
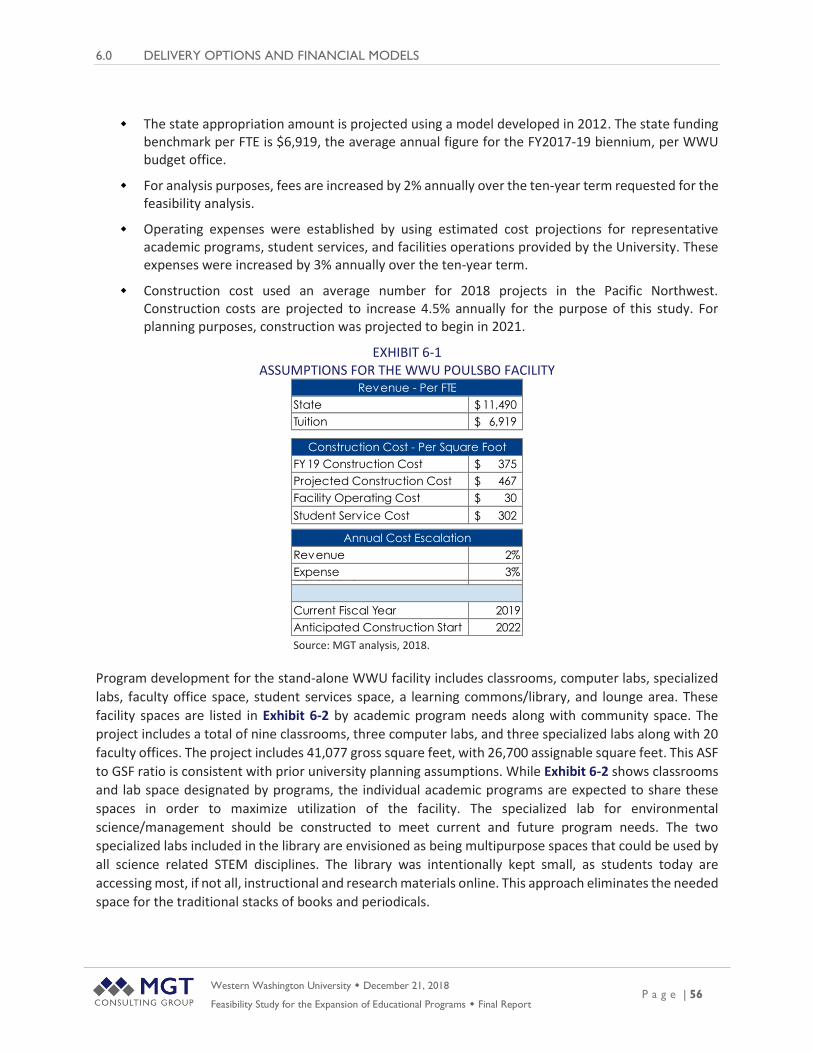
6.0 DELIVERY OPTIONS AND FINANCIAL MODELS
Western Washington University December 21, 2018
Feasibility Study for the Expansion of Educational Programs Final Report P a g e | 56
The state appropriation amount is projected using a model developed in 2012. The state funding benchmark per FTE is $6,919, the average annual figure for the FY2017-19 biennium, per WWU budget office.
For analysis purposes, fees are increased by 2% annually over the ten-year term requested for the feasibility analysis.
Operating expenses were established by using estimated cost projections for representative academic programs, student services, and facilities operations provided by the University. These expenses were increased by 3% annually over the ten-year term.
Construction cost used an average number for 2018 projects in the Pacific Northwest. Construction costs are projected to increase 4.5% annually for the purpose of this study. For planning purposes, construction was projected to begin in 2021.
EXHIBIT 6-1 ASSUMPTIONS FOR THE WWU POULSBO FACILITY
Source: MGT analysis, 2018.
Program development for the stand-alone WWU facility includes classrooms, computer labs, specialized
labs, faculty office space, student services space, a learning commons/library, and lounge area. These
facility spaces are listed in Exhibit 6-2 by academic program needs along with community space. The
project includes a total of nine classrooms, three computer labs, and three specialized labs along with 20
faculty offices. The project includes 41,077 gross square feet, with 26,700 assignable square feet. This ASF
to GSF ratio is consistent with prior university planning assumptions. While Exhibit 6-2 shows classrooms
and lab space designated by programs, the individual academic programs are expected to share these
spaces in order to maximize utilization of the facility. The specialized lab for environmental
science/management should be constructed to meet current and future program needs. The two
specialized labs included in the library are envisioned as being multipurpose spaces that could be used by
all science related STEM disciplines. The library was intentionally kept small, as students today are
accessing most, if not all, instructional and research materials online. This approach eliminates the needed
space for the traditional stacks of books and periodicals.
State 11,490$
Tuition 6,919$
FY 19 Construction Cost 375$
Projected Construction Cost 467$
Facility Operating Cost 30$
Student Serv ice Cost 302$
Revenue 2%
Expense 3%Construction 4.5%
Current Fiscal Year 2019
Anticipated Construction Start 2022
Revenue - Per FTE
Construction Cost - Per Square Foot
Annual Cost Escalation
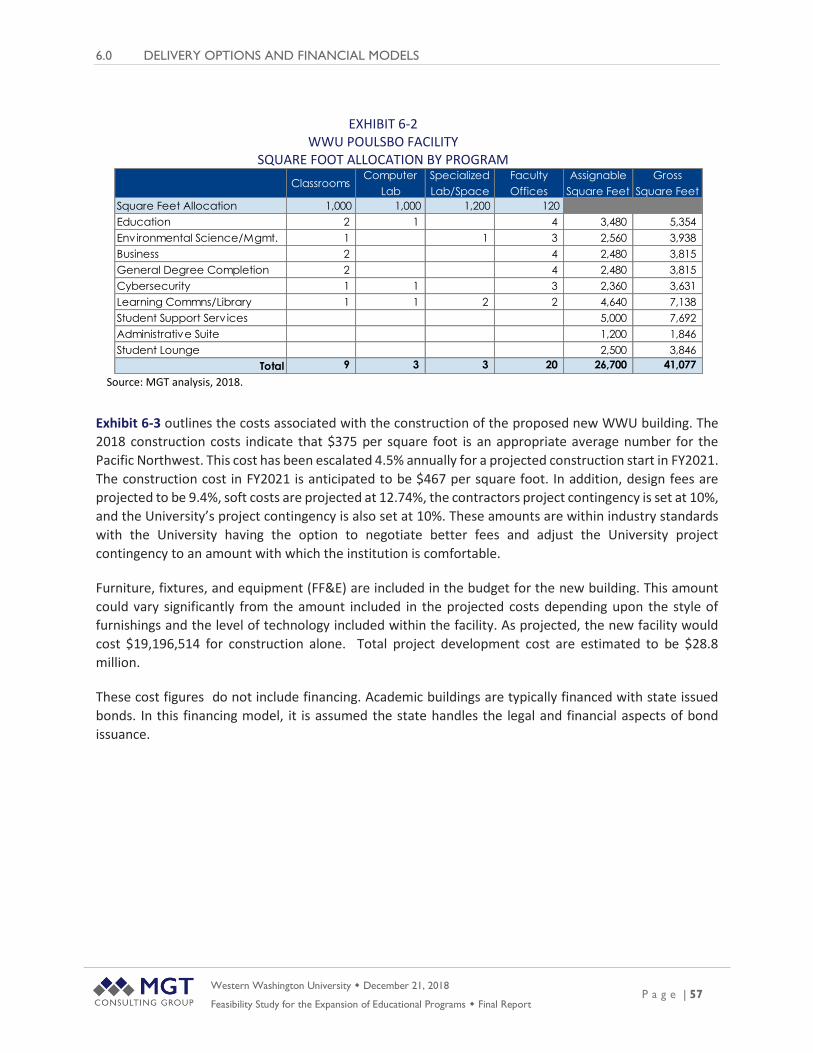
6.0 DELIVERY OPTIONS AND FINANCIAL MODELS
Western Washington University December 21, 2018
Feasibility Study for the Expansion of Educational Programs Final Report P a g e | 57
EXHIBIT 6-2 WWU POULSBO FACILITY
SQUARE FOOT ALLOCATION BY PROGRAM
Source: MGT analysis, 2018.
Exhibit 6-3 outlines the costs associated with the construction of the proposed new WWU building. The
2018 construction costs indicate that $375 per square foot is an appropriate average number for the
Pacific Northwest. This cost has been escalated 4.5% annually for a projected construction start in FY2021.
The construction cost in FY2021 is anticipated to be $467 per square foot. In addition, design fees are
projected to be 9.4%, soft costs are projected at 12.74%, the contractors project contingency is set at 10%,
and the University’s project contingency is also set at 10%. These amounts are within industry standards
with the University having the option to negotiate better fees and adjust the University project
contingency to an amount with which the institution is comfortable.
Furniture, fixtures, and equipment (FF&E) are included in the budget for the new building. This amount
could vary significantly from the amount included in the projected costs depending upon the style of
furnishings and the level of technology included within the facility. As projected, the new facility would
cost $19,196,514 for construction alone. Total project development cost are estimated to be $28.8
million.
These cost figures do not include financing. Academic buildings are typically financed with state issued
bonds. In this financing model, it is assumed the state handles the legal and financial aspects of bond
issuance.
ClassroomsComputer
Lab
Specialized
Lab/Space
Faculty
Offices
Assignable
Square Feet
Gross
Square Feet
Square Feet Allocation 1,000 1,000 1,200 120
Education 2 1 4 3,480 5,354
Environmental Science/Mgmt. 1 1 3 2,560 3,938
Business 2 4 2,480 3,815
General Degree Completion 2 4 2,480 3,815
Cybersecurity 1 1 3 2,360 3,631
Learning Commns/Library 1 1 2 2 4,640 7,138
Student Support Serv ices 5,000 7,692
Administrative Suite 1,200 1,846
Student Lounge 2,500 3,846
Total 9 3 3 20 26,700 41,077

6.0 DELIVERY OPTIONS AND FINANCIAL MODELS
Western Washington University December 21, 2018
Feasibility Study for the Expansion of Educational Programs Final Report P a g e | 58
EXHIBIT 6-3 WWU POULSBO FACILITY
SUMMARY OF PROJECT SPECIFICATIONS, REVENUE AND EXPENSE BASES, CAPITALIZED COSTS, DEBT, AND DEBT SERVICE
Source: MGT analysis, 2018.
Number of Classrooms 9 Cost of Construction $19,196,514
Number of Computer Labs 3 Design Fees and Serv ices $1,804,472
Number of Faculty Offices 20 Project Management Fee $0
Gross Square Feet (GSF) to Be Constructed 41,077 Project Related Soft Costs $2,444,687
FY Construction Cost Per Gross Square Foot (GSF) $467 Furniture, Fixtures, and Equipment $1,510,000
Site Develoment Costs (included in construction cost) $0 Contingency $3,839,303
Site Acquisition Costs $0 Project Development Costs, Total $28,794,977
Design Fees and Serv ices, % of Construction Cost 9.40%
Soft Costs (% of Construction Cost) 12.74%
Owner's Construction Contingency, % of Construction Cost 10.00%
Project Contingency, % of Project Cost 10.00% Project Development Cost $28,794,977
Facilities Management, % of Project Cost 0.00%
Calendar Date of Occupancy Aug 2022
First Fiscal Year of Occupancy 2023
Furnishings & Equipment (FF&E), FY 19 Average Per Classroom $80,000
Signage $40,000
Furnishings & Equipment (FF&E), FY 19 Average Per Lab $100,000
Furnishings & Equipment (FF&E), FY 19 Average Per Office $5,000
Furnishings & Equipment (FF&E), FY 19 Average Other Areas $250,000
Debt Serv ice Coverage Target 1.2
AMOUNTS TO BE CAPITALIZED
PROJECT SPECIFICATIONS PROJECT DEVELOPMENT COSTS

6.0 DELIVERY OPTIONS AND FINANCIAL MODELS
Western Washington University December 21, 2018
Feasibility Study for the Expansion of Educational Programs Final Report P a g e | 59
OPERATIONAL COST ESTIMATES
Based on the expansion and addition of program offerings at the proposed new WWU Education Center,
full-time equivalent enrollment is projected to grow from 57 in Fall 2018 to 164 by Fall 2028, as shown in
Exhibit 6-4. Note: The projected enrollments include upper-division students only, split by cohort. For
example, the 40 students projected to enroll in Business in 2029 consist of 20 juniors and 20 seniors. These
projections represent a starting point, and input from WWU should allow for a potentially more accurate
model as further program details are developed.
Fall 2019 includes the addition of a bachelor’s program in Early Childhood Education, and a bachelor’s program in Business and Sustainability. The Early Childhood program starts with an enrollment of five FTEs, and grows to 20 over the first four years.
The Business and Sustainability program FTEs are included with the other Business FTEs.
A General Degree Completion program is introduced in the FY2022 to accommodate area residents who are looking to complete their four-year degree.
New degree programs would also be introduced in FY2024 and FY2027. While these programs have not been specifically identified, potential candidates are Human Resources, Program Management, and Engineering.
The Cyber Security program will grow as the demand for employees is high. If Western Washington University continues to expand their “cyber-free zone” capacity and collaboration with other such programs nation-wide this program may grow more quickly than projected, and become a destination program.
Another potential destination program is the Environmental Science and Environmental Management. The proximity to the Olympic Peninsula’s rain forest along with the Sea Discovery Center will continue to provide opportunities for both learning and research not found elsewhere.
A limitation for some of these programs will be the availability of housing. The limited number of FTEs
would impact the financial viability of any on-campus student housing project. Additionally, the number
of FTEs would not immediately support any on-site food service beyond vending machines.
EXHIBIT 6-4 PROJECTED FTE BY PROGRAM
Source: MGT analysis, 2018.
Exhibits 6-5, 6-6 and 6-76-6 show the projected financial performance of the Center’s instructional
program based on costs calculated using Western Washington’s project cost estimator and the revenue
generated through tuition and anticipated state funding. As Exhibit 6-5 indicates, for the first few fiscal
Fiscal Year 2019 2020 2021 2022 2023 2024 2025 2026 2027 2028 2029
Education 0 5 10 15 20 20 20 22 24 26 28
Environmental Science/Mgmt. 27 27 28 28 29 29 29 29 30 30 31
Business 26 32 33 34 35 36 37 38 39 40 40
General Degree Completion 0 5 7 10 10 12 12 14 14
Cybersecurity 4 5 5 6 6 7 8 9 10 11 12
New Program 1 5 10 15 20 22 24
New Program 2 5 10 15
Total FTE 57 69 76 88 97 107 114 125 140 153 164

6.0 DELIVERY OPTIONS AND FINANCIAL MODELS
Western Washington University December 21, 2018
Feasibility Study for the Expansion of Educational Programs Final Report P a g e | 60
years before a new facility is completed, the Center should generate a positive bottom line, given current
parameters and programming models. Once the new building opens in FY2023, the additional facilities
costs will result in an annual net loss. This deficit will decline annually as enrollment grows and new
programs are added, until FY2029 when the new facility is again operating with a positive cash flow.
Exhibit 6-6 shows the cost of the various programs in FY2019 dollars. These numbers are then adjusted
for inflation using a 3% annual inflation factor. The revenue numbers grow at a 2% rate of inflation. The
growth in enrollment over the ten-year period allows revenue to grow at a faster rate than the expenses,
even though expense escalation exceeds revenue escalation as adjusted for inflation. The costs for the
student services component are shown in Exhibit 6-7. These costs take an incremental approach, as the
staffing and service level will need to increase as the enrollment grows. Some services, such as student
health, are cost prohibitive given the enrollment levels projected, but could be added at a time when
enrollment numbers could support the service. The building’s operation costs were set at $29.51 per
square foot in FY2019 dollars. Both the student services and building operation costs have been escalated
at 3% per year to adjust for inflation.
The expenses for the General Degree Completion program used the History program in the project cost estimator provided by the University as a benchmark. Expenses for the Business programs allocated half of the students to Accounting and half of the students to Marketing and Finance, depicted in the WWU project cost estimator. The two new programs utilize the Communications program column in the project estimator to determine potential costs. Once the Center’s specific programs are identified and specifics defined, the expense parameters per FTE for each program would need to be adjusted either up or down based on their actual cost. Over the 10 years of the Center build-out feasibility analysis, the program generates a revenue surplus each year.
EXHIBIT 6-5
OPERATING BUDGET SUMMARY
Source: MGT analysis, 2018.
Fiscal Year 2019 2020 2021 2022 2023 2024 2025 2026 2027 2028 2029
FTE 57 69 76 88 97 107 114 125 140 153 164
Headcount 125 151 167 193 213 235 250 274 307 336 360
State Appropriation per FTE 11,490$ 11,720$ 11,954$ 12,193$ 12,437$ 12,686$ 12,940$ 13,198$ 13,462$ 13,732$ 14,006$
Total State Appropriation 808,666$ 908,519$ 1,073,009$ 1,206,403$ 1,357,390$ 1,475,115$ 1,649,800$ 1,884,731$ 2,100,937$ 2,297,024$
Tuition per FTE 6,919$ 7,057$ 7,199$ 7,342$ 7,489$ 7,639$ 7,792$ 7,948$ 8,107$ 8,269$ 8,434$
Total Tuition 486,959$ 547,088$ 646,140$ 726,467$ 817,387$ 888,279$ 993,470$ 1,134,940$ 1,265,133$ 1,383,212$
1,295,625$ 1,455,607$ 1,719,148$ 1,932,870$ 2,174,778$ 2,363,394$ 2,643,269$ 3,019,671$ 3,366,070$ 3,680,237$
Education 83,191$ 97,436$ 112,462$ 128,302$ 132,151$ 136,116$ 145,648$ 168,298$ 179,127$ 190,454$
Env ironmental Science/Mgmt. 154,544$ 161,697$ 166,548$ 174,213$ 179,439$ 184,823$ 190,367$ 199,082$ 205,054$ 214,392$
Business 311,769$ 325,489$ 339,754$ 354,579$ 369,990$ 386,006$ 427,248$ 419,946$ 437,916$ 451,053$
General Degree Completion -$ -$ 107,485$ 120,183$ 150,017$ 154,518$ 169,504$ 174,589$ 190,809$ 196,533$
Cybersecurity 110,665$ 121,298$ 132,468$ 144,200$ 160,511$ 165,326$ 183,002$ 188,492$ 207,636$ 213,865$
New Program 1 -$ -$ -$ -$ 100,480$ 116,408$ 133,200$ 163,563$ 174,114$ 185,151$
New Program 2 -$ -$ -$ -$ -$ -$ -$ 109,797$ 127,202$ 145,552$
Facility Costs 1,364,322$ 1,405,251$ 1,447,409$ 1,490,831$ 1,535,556$ 1,581,623$ 1,629,072$
Student Serv ices 47,460$ 53,810$ 64,124$ 149,015$ 161,176$ 171,556$ 185,678$ 203,854$ 309,614$ 328,710$
707,629$ 759,731$ 922,841$ 2,434,814$ 2,659,017$ 2,762,162$ 2,925,478$ 3,163,176$ 3,413,096$ 3,554,783$
$587,996 $695,876 $796,308 ($501,945) ($484,239) ($398,768) ($282,209) ($143,506) ($47,026) $125,454Net Profit/Loss
Total Expense
Total Revenue
Revenue
Expense

6.0 DELIVERY OPTIONS AND FINANCIAL MODELS
Western Washington University December 21, 2018
Feasibility Study for the Expansion of Educational Programs Final Report P a g e | 61
EXHIBIT 6-6 PROGRAM COST IN FY2019 DOLLARS USING WWU PROGRAM COST ESTIMATOR
Source: MGT analysis, 2018.
EXHIBIT 6-7 STUDENT SERVICES COST IN FY2019 DOLLARS USING WWU PROGRAM COST ESTIMATOR
Source: MGT analysis, 2018.
In summary, a new facility in Poulsbo would not only enhance Western Washington University’s presence
on the Kitsap Peninsula, but would serve as a “base of operations” to continue to distribute more
programs across both the Kitsap and Olympic Peninsulas for four-year and graduate degree completion.
The WWU facility would be located at a “known” site for higher education delivery, and be complimentary
to the activities, programs and services currently offered at that site by Olympic College. A local
permanent WWU facility would also provide additional educational and research opportunities for faculty
and students. The proposed new WWU facility would increase accessibility to a portfolio of programs for
populations that currently have limited opportunities without leaving the Peninsulas. A new facility would
allow for additional program expansion to serve this region of the state, and enable programmatic,
instructional, and support service adjustments, as needed, to meet changing local demand.
Fiscal Year 2019 2020 2021 2022 2023 2024 2025 2026 2027 2028 2029
Education 0 5 10 15 20 20 20 22 24 26 28
Environmental Science/Mgmt. 27 27 28 28 29 29 29 29 30 30 31
Business 26 32 33 34 35 36 37 38 39 40 40
General Degree Completion 0 0 0 5 7 10 10 12 12 14 14
Cybersecurity 4 5 5 6 6 7 8 9 10 11 12
New Program 1 0 0 0 0 0 5 10 15 20 22 24
New Program 2 0 0 0 0 0 0 0 0 5 10 15
FTE 57 69 76 88 97 107 114 125 140 153 164
Headcount 125 151 167 193 213 235 250 274 307 336 360
Fiscal Year 2019 2020 2021 2022 2023 2024 2025 2026 2027 2028 2029
Education 80,768$ 91,843$ 102,919$ 113,995$ 113,995$ 113,995$ 118,425$ 132,856$ 137,286$ 141,716$
Env ironmental Science/Mgmt. 150,043$ 152,415$ 152,415$ 154,786$ 154,786$ 154,786$ 154,786$ 157,157$ 157,157$ 159,528$
Business 302,688$ 306,805$ 310,923$ 315,039$ 319,157$ 323,274$ 347,392$ 331,509$ 335,626$ 335,626$
General Degree Completion 98,364$ 106,781$ 129,406$ 129,406$ 137,822$ 137,822$ 146,239$ 146,239$
Cybersecurity 107,442$ 114,335$ 121,227$ 128,120$ 138,458$ 138,458$ 148,797$ 148,797$ 159,136$ 159,136$
New Program 1 86,675$ 97,490$ 108,304$ 129,118$ 133,444$ 137,770$
New Program 2 86,675$ 97,490$ 108,304$
Cost by Program FY 19 Dollars
Projected FTE by Program
Fiscal Year 2019 2020 2021 2022 2023 2024 2025 2026 2027 2028 2029
FTE 57 69 76 88 97 107 114 125 140 153 164
Headcount 125 151 167 193 213 235 250 274 307 336 360
Fiscal Year 2019 2020 2021 2022 2023 2024 2025 2026 2027 2028 2029
Base Student Serv ices per Student 302$ 311$ 321$ 330$ 340$ 350$ 361$ 372$ 383$ 394$ 406$
Total Student Serv ices (Headcount) 37,814$ 47,148$ 53,490$ 63,793$ 72,427$ 82,291$ 90,304$ 101,989$ 117,654$ 132,436$ 146,217$
Program Support Superv isor 76,248$ 78,535$ 80,891$ 83,318$ 85,817$ 88,392$ 91,044$
Program Support Superv isor 88,392$ 91,044$
Total Student Serv ices 38,117$ 47,460$ 53,810$ 64,124$ 149,015$ 161,176$ 171,556$ 185,678$ 203,854$ 309,614$ 328,710$
Projected FTE/Headcount
Cost by Program FY 19 Dollars

6.0 DELIVERY OPTIONS AND FINANCIAL MODELS
Western Washington University December 21, 2018
Feasibility Study for the Expansion of Educational Programs Final Report P a g e | 62
DISCLAIMER
MGT’s analysis of the feasibility of WWU’s expansion options on the Kitsap and Olympic Peninsulas relies
on the accuracy of information provided by the University as well as near-term and long-term assumptions
influenced by factors outside of MGT’s control and for which may adversely impact WWU’s expansion
plans. Changes such as WWU’s financial parameters, program delivery models, construction materials,
and related costs, as well as state, local, and global economic conditions, may impact both the demand
for WWU programs, costs and/or the project’s financial feasibility. Additional risks to the expansion plans
include but are not limited to changes in the regional workforce, program/credential needs, competitive
programs, regulatory changes, and legislative budget allocation and policy.

Western Washington University December 21, 2018
Feasibility Study for the Expansion of Educational Programs Final Report P a g e | 63
APPENDIX A – EMPLOYMENT DATA BY COUNTY
EXHIBIT A-1
Source: Bureau of Labor Statistics Local Area Unemployment Statistics.
EXHIBIT A-2
Source: Bureau of Labor Statistics Quarterly Census of Employment and Wages.

APPENDIX A – EMPLOYMENT DATA BY COUNTY
Western Washington University December 21, 2018
Feasibility Study for the Expansion of Educational Programs Final Report P a g e | 64
EXHIBIT A-3
Source: Bureau of Labor Statistics Local Area Unemployment Statistics.
EXHIBIT A-4
Source: Bureau of Labor Statistics Quarterly Census of Employment and Wages.
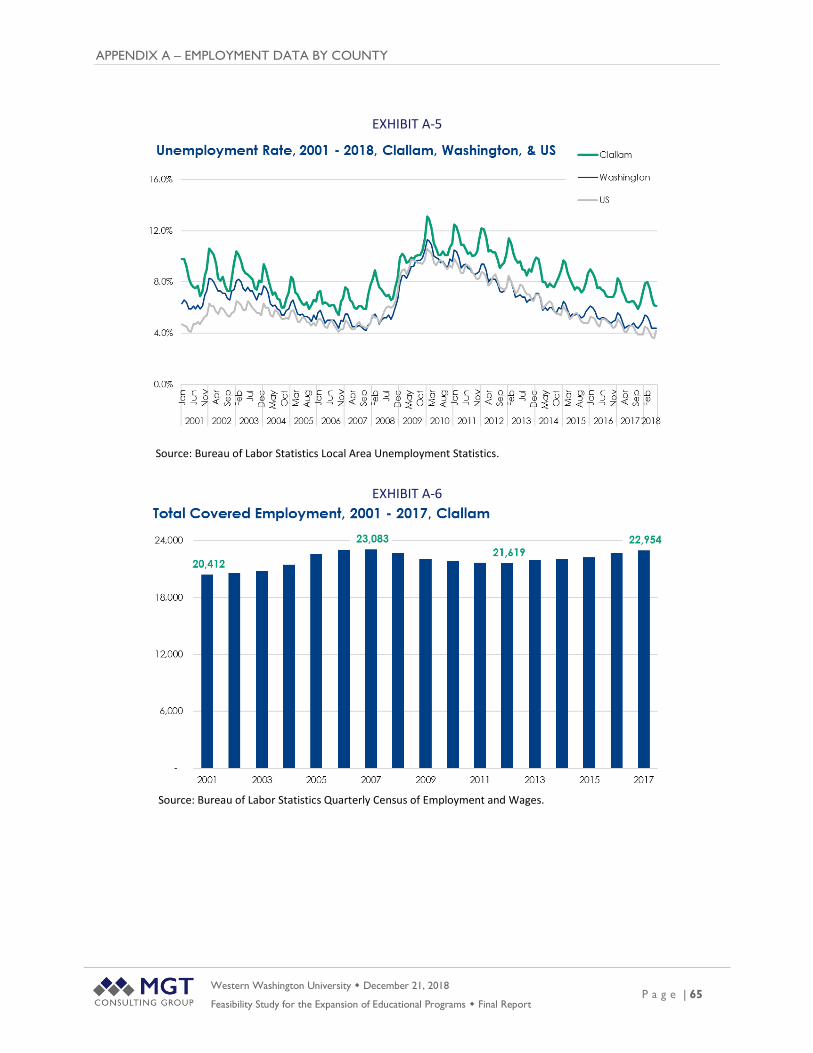
APPENDIX A – EMPLOYMENT DATA BY COUNTY
Western Washington University December 21, 2018
Feasibility Study for the Expansion of Educational Programs Final Report P a g e | 65
EXHIBIT A-5
Source: Bureau of Labor Statistics Local Area Unemployment Statistics.
EXHIBIT A-6
Source: Bureau of Labor Statistics Quarterly Census of Employment and Wages.

APPENDIX A – EMPLOYMENT DATA BY COUNTY
Western Washington University December 21, 2018
Feasibility Study for the Expansion of Educational Programs Final Report P a g e | 66
EXHIBIT A-7
Source: Bureau of Labor Statistics Local Area Unemployment Statistics.
EXHIBIT A-8
Source: Bureau of Labor Statistics Quarterly Census of Employment and Wages.

Western Washington University December 21, 2018
Feasibility Study for the Expansion of Educational Programs Final Report P a g e | 67
APPENDIX B – DISTANCE FROM POPULATION
HUBS TO EDUCATIONAL SITES
What follows are displays of drive times to extended education sites in each of the four study area
counties.
EXHIBIT B-1 AVERAGE DRIVE TIMES FROM WWU EXTENDED EDUCATION LOCATIONS TO
POPULATION HUBS IN KITSAP COUNTY, 2018
Source: Western Washington University, 2018; Google API, 2018, Community Attributes, Inc., 2018. Note: Average drive times include peak time and low traffic volume estimates.
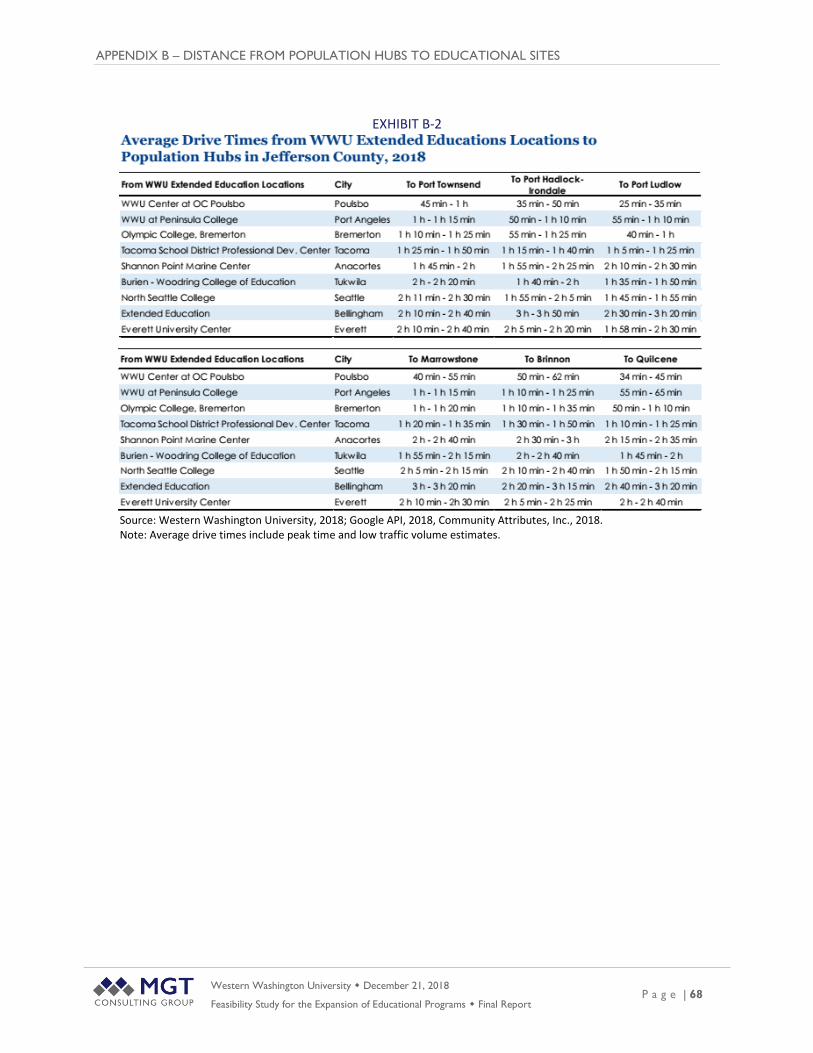
APPENDIX B – DISTANCE FROM POPULATION HUBS TO EDUCATIONAL SITES
Western Washington University December 21, 2018
Feasibility Study for the Expansion of Educational Programs Final Report P a g e | 68
EXHIBIT B-2
Source: Western Washington University, 2018; Google API, 2018, Community Attributes, Inc., 2018. Note: Average drive times include peak time and low traffic volume estimates.

APPENDIX B – DISTANCE FROM POPULATION HUBS TO EDUCATIONAL SITES
Western Washington University December 21, 2018
Feasibility Study for the Expansion of Educational Programs Final Report P a g e | 69
EXHIBIT B-3
Source: Western Washington University, 2018; Google API, 2018, Community Attributes, Inc., 2018. Note: Average drive times include peak time and low traffic volume estimates.

APPENDIX B – DISTANCE FROM POPULATION HUBS TO EDUCATIONAL SITES
Western Washington University December 21, 2018
Feasibility Study for the Expansion of Educational Programs Final Report P a g e | 70
EXHIBIT B-4
Source: Western Washington University, 2018; Google API, 2018, Community Attributes, Inc., 2018. Note: Average drive times include peak time and low traffic volume estimates.

Western Washington University December 21, 2018
Feasibility Study for the Expansion of Educational Programs Final Report P a g e | 71
APPENDIX C – TRANSPORTATION ACCESS ON THE
PENINSULAS
The percent of households within each county population center which have limited transportation access
are displayed in the exhibits below.
EXHIBIT C-1
Source: US Census Bureau ACS, 2018. Community Attributes, Inc. 2018. Note: Other areas includes 20 places with less than 2,000 households each. East Port Orchard, Suquamish, and Manchester are examples of places in “Other Kitsap Areas.”
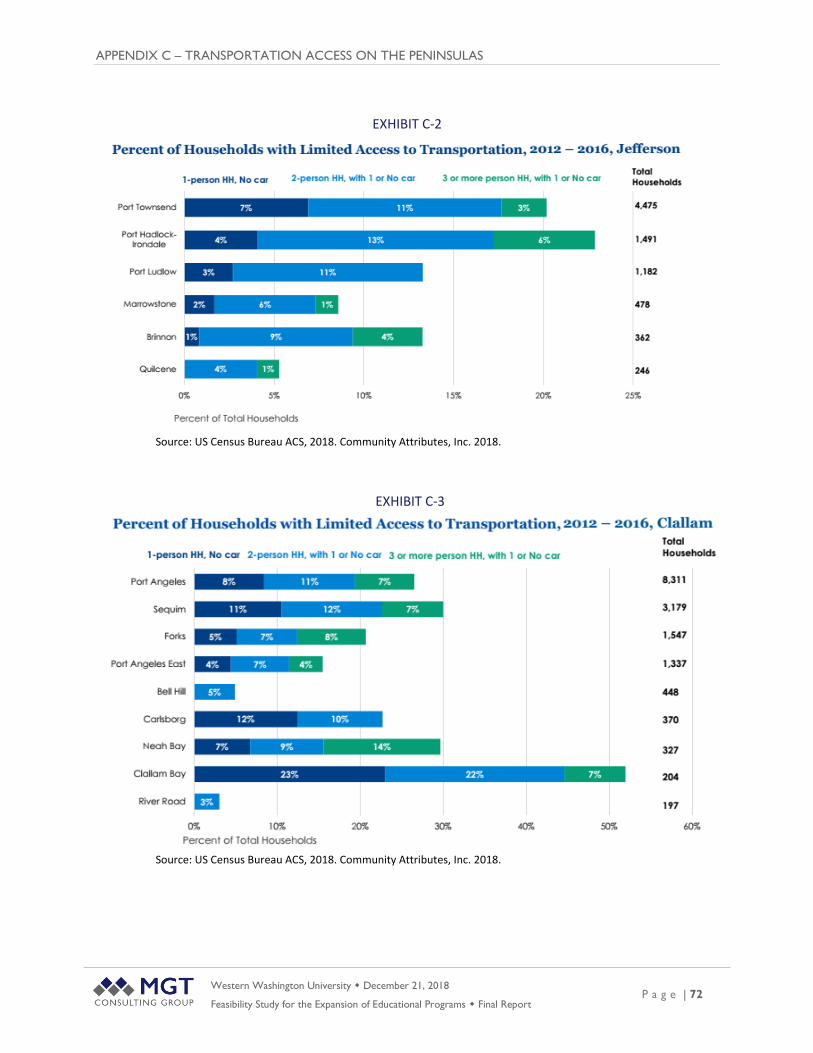
APPENDIX C – TRANSPORTATION ACCESS ON THE PENINSULAS
Western Washington University December 21, 2018
Feasibility Study for the Expansion of Educational Programs Final Report P a g e | 72
EXHIBIT C-2
Source: US Census Bureau ACS, 2018. Community Attributes, Inc. 2018.
EXHIBIT C-3
Source: US Census Bureau ACS, 2018. Community Attributes, Inc. 2018.

APPENDIX C – TRANSPORTATION ACCESS ON THE PENINSULAS
Western Washington University December 21, 2018
Feasibility Study for the Expansion of Educational Programs Final Report P a g e | 73
EXHIBIT C-4
Source: US Census Bureau ACS, 2018. Community Attributes, Inc. 2018.

Western Washington University December 21, 2018
Feasibility Study for the Expansion of Educational Programs Final Report P a g e | 74
APPENDIX D – STATEWIDE PUBLIC INSTITUTION
DEGREE AWARD TRENDS
Access is critical, but completion is also a key measure of meeting local education needs. As shown in
Exhibit D-1, the six four-year public institutions in the state have collectively increased their certificate
awards by 11% since 2015, an increase of 43 certificates across all institutions. Certificate awards
increased at Washington State and Western Washington (41% and 9%, respectively, but declined at
Central Washington and Eastern Washington (41% and 19%, respectively) over the same time horizon. It
is important to note that these degree awards are institutional totals, and reflect certificates granted to
students originating from both within and outside the study region. In addition, these certificate totals do
not include post-baccalaureate and post-master’s certificate awards.
EXHIBIT D-1 CERTIFICATES (LESS THAN ONE YEAR) GRANTED BY INSTITUTION
2015 THROUGH 2017
Source: IPEDS, 2018.
Bachelor’s degree awards rose by 2% over the last three years among state institutions (a total increase
of 553 awards). Degree awards declined at Central Washington University (-3%), Eastern Washington
University (-3%), The Evergreen State College(-10%). The other state institutions evidenced increases in
degree awards from 2% to 7% over the three year period.
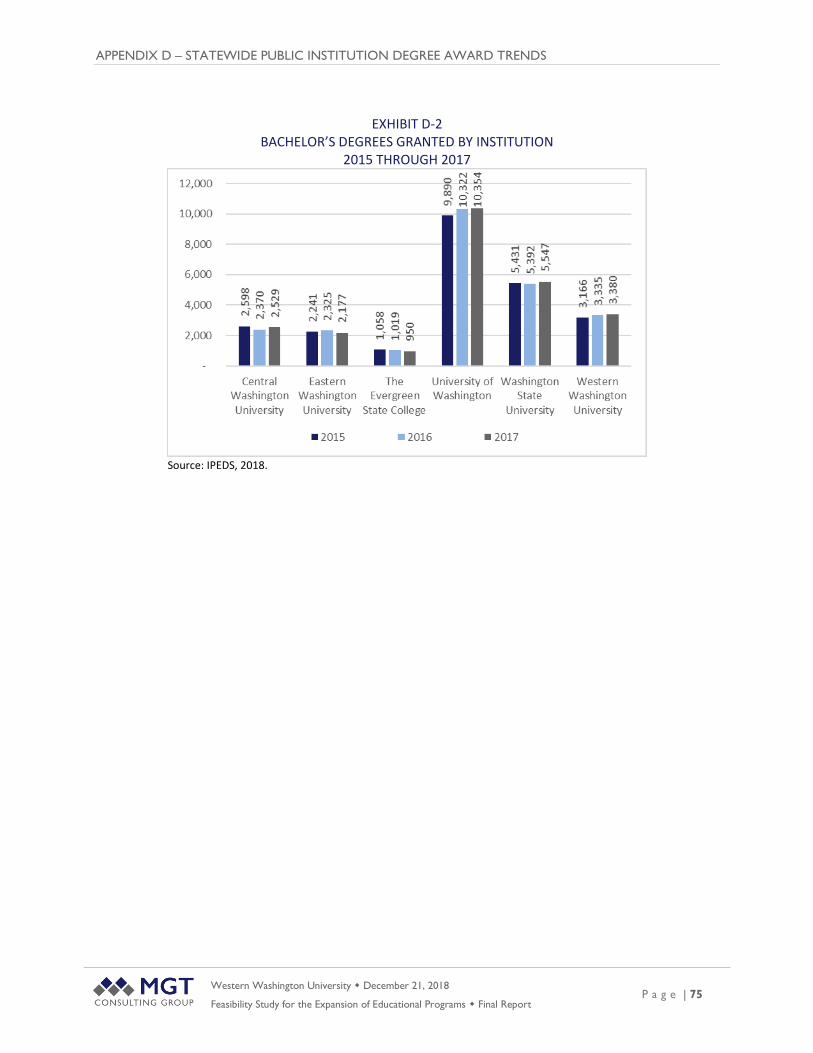
APPENDIX D – STATEWIDE PUBLIC INSTITUTION DEGREE AWARD TRENDS
Western Washington University December 21, 2018
Feasibility Study for the Expansion of Educational Programs Final Report P a g e | 75
EXHIBIT D-2 BACHELOR’S DEGREES GRANTED BY INSTITUTION
2015 THROUGH 2017
Source: IPEDS, 2018.

Western Washington University December 21, 2018
Feasibility Study for the Expansion of Educational Programs Final Report P a g e | 76
APPENDIX E – ONLINE SURVEY RESULTS
An online survey was initially distributed to stakeholders throughout the Kitsap and Olympic Peninsulas,
including business owners, governmental officials, school/college administrators, community leaders, and
tribal representatives, as shown in Exhibit E-1. Sixty-five community members completed the instrument.
EXHIBIT E-1 ONLINE SURVEY RESPONDENT PROFILE
(N=65)
Source: MGT Stakeholder Survey Analysis, 2018.
Of those respondents who indicated they College Faculty/Staff/Administrator, all were employed by
WWU, although one was retired.
The overwhelming majority of survey respondents represent Kitsap County (83%), while smaller shares of
respondents serve/represent the other counties in the study (10% to 17%), as shown in Exhibit E-2.

APPENDIX E – ONLINE SURVEY RESULTS
Western Washington University December 21, 2018
Feasibility Study for the Expansion of Educational Programs Final Report P a g e | 77
EXHIBIT E-2 COUNTIES REPRESENTED OR SERVED BY SURVEY RESPONDENTS
(N=63)
Source: MGT Stakeholder Survey Analysis, 2018.
The feedback gathered through the online survey are presented in Exhibit A-3 through A-5.
Respondents were asked Which of the following industry/employment sectors in your community have a
significant need for workers requiring education/training beyond a high school diploma? and responses
are shown in Exhibit E-3.
10%
13%
17%
83%
Mason
Jefferson
Clallam
Kitsap
0% 10% 20% 30% 40% 50% 60% 70% 80% 90%

APPENDIX E – ONLINE SURVEY RESULTS
Western Washington University December 21, 2018
Feasibility Study for the Expansion of Educational Programs Final Report P a g e | 78
EXHIBIT E-3 EMPLOYMENT SECTORS WITH SIGNIFICANT NEED FOR WORKERS WITH TRAINING
REQUIRED BEYOND A HIGH SCHOOL DIPLOMA (N=60)
Respondents were asked to identify the major obstacles/barriers currently faced by residents and
employees seeking college degrees in the local area, and the results are shown in Exhibit E-4. As shown,
program availability was indicated by the overwhelming majority of respondents (87%) as a significant
barrier, followed by transportation/distance (60%), financial constraints (58%), and program flexibility
(57%). Other barriers were indicated by fewer than half of survey responses.

APPENDIX E – ONLINE SURVEY RESULTS
Western Washington University December 21, 2018
Feasibility Study for the Expansion of Educational Programs Final Report P a g e | 79
EXHIBIT E-4 BARRIERS FACED BY RESIDENTS AND EMPLOYEES SEEKING COLLEGE DEGREES LOCALLY
(N=60)
Source: MGT Stakeholder Survey Analysis, 2018.
In an effort to identify degree programs needed on the Kitsap and Olympic Peninsulas, the online survey
asked respondents to identify the programs (and degree level) would be most beneficial to the region. As
shown in Exhibit E-5, more than half of survey respondents indicated that four-year degree programs in
several disciplines would be valuable (yellow highlights), including healthcare, education engineering, and
technology fields. Additionally, one third to one half indicated that degrees (two- or four-year) would be
of benefit to the region, including healthcare, technology, social services, and business.

APPENDIX E – ONLINE SURVEY RESULTS
Western Washington University December 21, 2018
Feasibility Study for the Expansion of Educational Programs Final Report P a g e | 80
EXHIBIT E-5 DEGREE PROGRAMS WHICH WOULD MOST BENEFIT THE LOCAL AREA
Source: MGT Stakeholder Survey Analysis, 2018.
Two-Year
Degree/
Certificate
Four-Year
Degree
Post-Bacc
Certificate
Graduate
Degree
Continuing
Education
Banking/Accounting/Finance 18% 37% 5% 6% 8%
Business/Marketing 14% 46% 12% 8% 12%
Computer Science/Programming/Coding 35% 65% 23% 17% 22%
Cyber Security 35% 51% 17% 15% 20%
Education 14% 60% 25% 32% 25%
Engineering - Mechanical, Electrical, Structural, Nuclear 14% 52% 26% 25% 18%
Environmental Science/Policy 8% 43% 15% 23% 15%
Food Science 29% 17% 8% 2% 11%
Healthcare 38% 58% 28% 26% 23%
Hospitality/Tourism/Recreation 22% 23% 2% 0% 3%
Human Resources 23% 31% 6% 3% 8%
Information Technology 35% 52% 26% 17% 18%
Materials Science 15% 32% 14% 8% 8%
Math 11% 31% 15% 11% 5%
Science - Biology, Chemistry, Physics 14% 48% 20% 17% 20%
Social Serv ices/Human Serv ices 28% 38% 17% 12% 17%