Embed Size (px)
Citation preview

Feasibility Study for R2RW Plant Nursery
Mont Pellier, St. James
Feasibility Study for R2RW Plant Nursery
Mont Pellier, St. James


Ridge to Reef Watershed Project USAID Contract No. 532-C-00-00-00235-00
FFEEAASSIIBBIILLIITTYY SSTTUUDDYY FFOORR RR22RRWW PPLLAANNTT NNUURRSSEERRYY
MMOONNTT PPEELLLLIIEERR,, SSTT .. JJAAMMEESS
November 2001
Prepared for the
Government of Jamaica’s National Environment and Planning Agency
And the
United States Agency for International Development
Implemented by:
Associates in Rural Development, Inc. P.O. Box 1397
Burlington, Vermont 05402
Prepared by:
Richard J. Lumsden

Feasibility Study for R2RW Nursery – Mont Pellier, St. James ii
Feasibility Study for R2RW Nursery – Mont Pellier, St. James iii
TTAABBLLEE OOFF CCOONNTTEENNTTSS
EXECUTIVE SUMMARY ..........................................................................................................................1
1.0 INTRODUCTION AND BACKGROUND..............................................................................................4
1.1 COUNTRY BACKGROUND - JAMAICA ....................................................................................................4 1.2 PROJECT BACKGROUND ...................................................................................................................4
2.0 LOCATION ANALYSIS .....................................................................................................................6
2.1 PROJECT AREA ..........................................................................................................................6 2.2 PROJECT SITE ..........................................................................................................................7
3.0 PROJECT DESCRIPTION .................................................................................................................9
3.1 PROPOSED DEVELOPMENT - PLANT NURSERY ......................................................................................9 3.2 TECHNICAL ASPECTS .......................................................................................................................9 3.3 ENVIRONMENTAL ASPECTS..............................................................................................................10 3.4 PROJECT BENEFITS .......................................................................................................................10
4.0 CROP PRODUCTION ANALYSIS....................................................................................................12
4.1 LAND CAPABILITY - PROJECT AREA ..................................................................................................12 4.2 EXISTING PRODUCTION - PROJECT AREA ..........................................................................................12 4.3 PLANNED PRODUCTION - PROJECT AREA ..........................................................................................13
5.0 MARKET ANALYSIS.......................................................................................................................15
5.1 TARGET MARKET SEGMENTS - BY CROP...........................................................................................15 5.2 MARKET ANALYSIS - OVERVIEW .......................................................................................................16 5.3 MARKET ANALYSIS - BY CROP.........................................................................................................17 5.4 COMPETITIVE ANALYSIS ..................................................................................................................22 5.5 SEEDLING MARKET PROJECTIONS - PROPOSED R2RW PLANT NURSERY ...............................................23 5.6 MARKETING PLAN ........................................................................................................................26
6.0 ORGANIZATION AND MANAGEMENT............................................................................................27
6.1 MANAGEMENT OBJECTIVES .............................................................................................................27 6.2 ORGANIZATIONAL STRUCTURE - OPTIONS ..........................................................................................27 6.3 REVIEW OF COMMUNITY NURSERIES.................................................................................................30 6.4 IMPLEMENTATION AND MANAGEMENT................................................................................................32 6.5 IMPLEMENTATION SCHEDULE...........................................................................................................34
7.0 FINANCIAL ANALYSIS...................................................................................................................36
7.1 PROJECT INVESTMENT COST AND F INANCING .....................................................................................36 7.2 PROJECTED PRODUCTION AND ANNUAL INCOME.................................................................................36 7.3 ANNUAL EXPENDITURE ...................................................................................................................37 7.4 PROJECTED FINANCIAL STATEMENTS ................................................................................................38 7.5 RATIO AND SENSITIVITY ANALYSIS ....................................................................................................39
8.0 CONCLUSION ........................................................................................................................40
Tables Table 1 Land Capability: Project Area Table 2a All-Island Estimates of Crop Area Reaped: 1991 - 2000 Table 2b All-Island Estimates of Crop Production: 1991 - 2000 Table 2c All-Island Estimates of Crop Production per Hectare: 1991 - 2000
Feasibility Study for R2RW Nursery – Mont Pellier, St. James
iv
Table 3 Comparative Estimates of Crop Production and Area Reaped by Parish: 1999 - 2000
Table 4 Estimates of Area Reaped by Parish & Crop Group in Project Area: 2000 Table 5 Project Area: Farm Holdings by Size (1996) Table 6 Project Area: Farm Holdings by Land Use (1996) Table 7a Project Area: Area of Holdings under Crop Cultivation (1996) Table 7b Project Area: Area of Holdings in Permanent Crops (1996) Table 7c Project Area: Area of Holdings in Legumes, Vegetables and Condiments (1996) Table 7d Project Area: Area of Holdings Fruits, Cereals and Tubers (1996) Table 8 Estimates of Area Reaped by Parish & Crop Detail in Project Area – Selected
Crops: 2000 Table 9 Estimates of Area Reaped by Extension Area & Crop Detail in Great River Watershed Area – Selected Crops: 2000 Table 10 Planned Production in Project Area: Selected Projects Table 11 Target Crops: Selection Criteria Table 11a Selection Criteria: Details of Crops which do not use Commercial Seedlings Table 12 Estimated Total Demand – Selected Crops: 2000 Table 12a Estimated Total Potential Production Crop Area – Selected Crops: 2000 Table 13 Crop Production and Area Reaped – Selected Crops: 1991, 1999 & 2000 Table 14 Crop Conversion Tables Table 15 Competitive Analysis Table 16a Projected Seedling Market: Annual Acceptance Rates by Crop in GRW Table 16b Projected Seedling Market: Annual Acceptance Rates by Crop in Rest of Project
Area Table 17a R2RW Plant Nursery – Projected Market by Crop Area in GRW:
Years 1 - 10 Table 17b R2RW Plant Nursery – Projected Market by Crop Area in Rest of Project Area: Years 1 - 10 Table 17c R2RW Plant Nursery – Total Projected Market by Crop Area in Project
Area: Years 1 - 10 Table 18 R2RW Plant Nursery – Projected Seedling Market by Crop: Years 1 - 10 Figures Figure 1 Great River Watershed Area Figure 2 Project Area Figure 3 Great River Watershed Area by Extension Area Figure 4 Project Location Figure 5 R2RW Plant Nursery – Proposed Organizational Structure Figure 6 Implementation Schedule Financial Tables Table 1 Capital Expenditure Schedule Table 1a Nursery Construction – Details Table 1b Irrigation System – Details Table 1c Nursery Materials & Equipment – Details Table 2 Foreign & Local Content of Project Cost Table 3 Depreciation and Amortization Schedule Table 4 Production Projections Table 4a Direct Cost Projections Table 4b Production Capacity Analysis Table 5 Revenue Projections

Feasibility Study for R2RW Nursery – Mont Pellier, St. James v
Table 6 Ten (10) Year Income Statement Projections Table 7 Vertical Analysis of Income Statement Projections Table 8 Ten (10) Year Operating Cash Flow Projections Table 9 Ten (10) Year Balance Sheet Projections Table 10 Ten (10) Year Sources and Uses of Funds Projections Table 11 Ratio Analysis Table 12 Sensitivity Analysis Appendices Appendix 1 List of Persons Interviewed Appendix 2 Bibliography Appendix 3 Jamaica: Non-Traditional Fresh Produce Exports: 1999-2000 Appendix 4 Jamaica: Use of Hot Pepper and Escallion by Agro-Processors:
1995-1998 Appendix 5 Jamaica – Imports and Exports of Selected Crops: 2000 Appendix 6 List of Project Meetings Abbreviations R2RW Ridge to Reef Watershed Project GRW Great River Watershed MINAG Ministry of Agriculture RADA Rural Agricultural Development Authority NGO Non-Governmental Organization CBO Community-Based Organization JEA Jamaica Exporters Association Acknowledgements The Consultant would like to acknowledge the invaluable technical assistance provided by Dr. George Wilson, Watershed Management Specialist – Ridge to Reef Watershed Project, during the preparation of the Feasibility Study.
Feasibility Study for R2RW Nursery – Mont Pellier, St. James 1
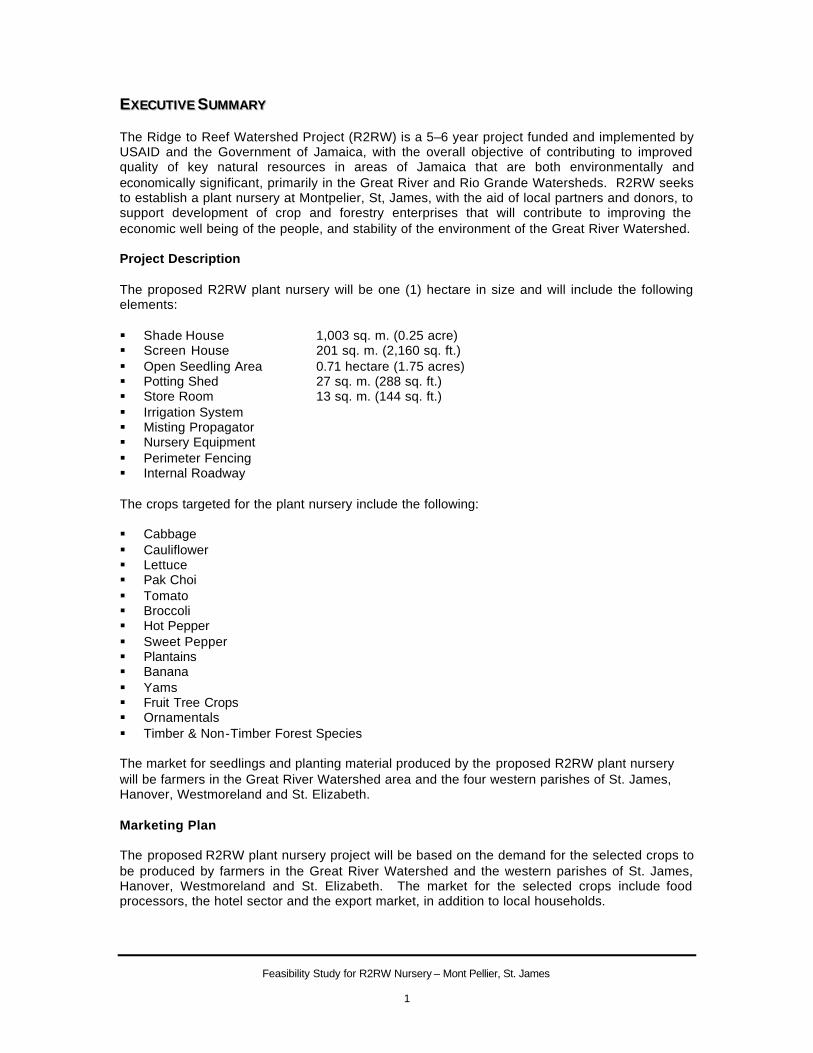
EEXXEECCUUTTIIVVEE SSUUMMMMAARRYY The Ridge to Reef Watershed Project (R2RW) is a 5–6 year project funded and implemented by USAID and the Government of Jamaica, with the overall objective of contributing to improved quality of key natural resources in areas of Jamaica that are both environmentally and economically significant, primarily in the Great River and Rio Grande Watersheds. R2RW seeks to establish a plant nursery at Montpelier, St, James, with the aid of local partners and donors, to support development of crop and forestry enterprises that will contribute to improving the economic well being of the people, and stability of the environment of the Great River Watershed. Project Description The proposed R2RW plant nursery will be one (1) hectare in size and will include the following elements: § Shade House 1,003 sq. m. (0.25 acre) § Screen House 201 sq. m. (2,160 sq. ft.) § Open Seedling Area 0.71 hectare (1.75 acres) § Potting Shed 27 sq. m. (288 sq. ft.) § Store Room 13 sq. m. (144 sq. ft.) § Irrigation System § Misting Propagator § Nursery Equipment § Perimeter Fencing § Internal Roadway The crops targeted for the plant nursery include the following: § Cabbage § Cauliflower § Lettuce § Pak Choi § Tomato § Broccoli § Hot Pepper § Sweet Pepper § Plantains § Banana § Yams § Fruit Tree Crops § Ornamentals § Timber & Non-Timber Forest Species The market for seedlings and planting material produced by the proposed R2RW plant nursery will be farmers in the Great River Watershed area and the four western parishes of St. James, Hanover, Westmoreland and St. Elizabeth. Marketing Plan The proposed R2RW plant nursery project will be based on the demand for the selected crops to be produced by farmers in the Great River Watershed and the western parishes of St. James, Hanover, Westmoreland and St. Elizabeth. The market for the selected crops include food processors, the hotel sector and the export market, in addition to local households.
Feasibility Study for R2RW Nursery – Mont Pellier, St. James 2
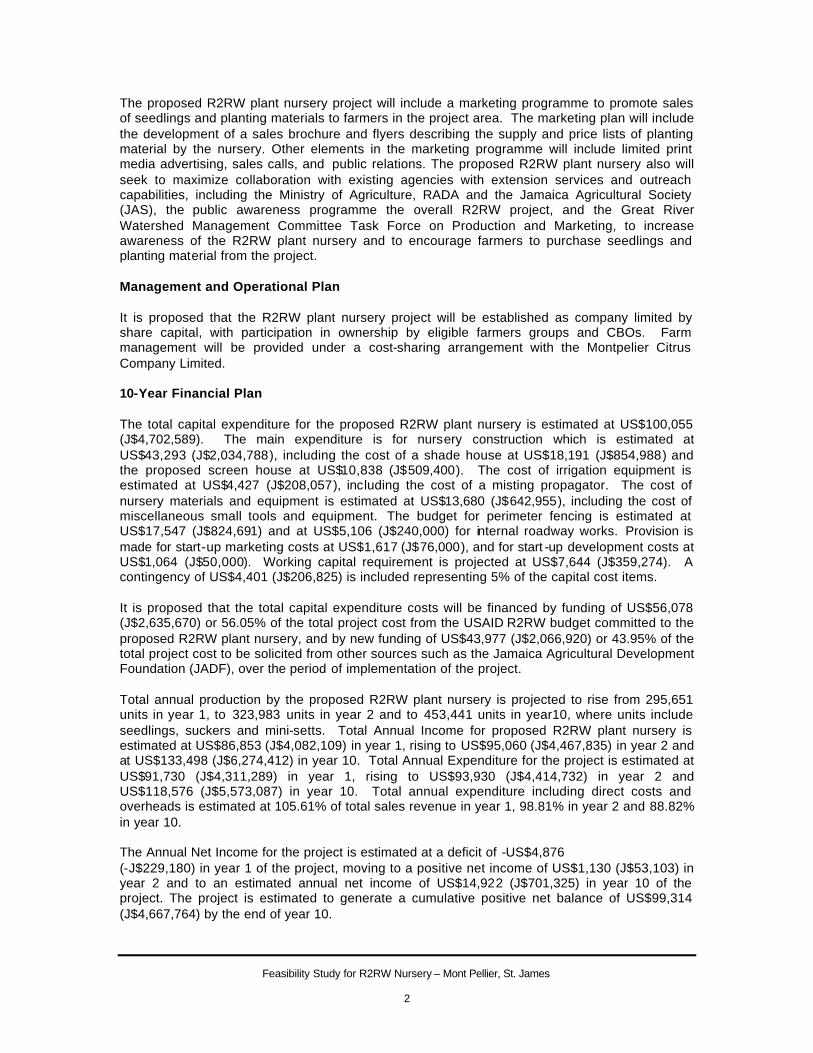
The proposed R2RW plant nursery project will include a marketing programme to promote sales of seedlings and planting materials to farmers in the project area. The marketing plan will include the development of a sales brochure and flyers describing the supply and price lists of planting material by the nursery. Other elements in the marketing programme will include limited print media advertising, sales calls, and public relations. The proposed R2RW plant nursery also will seek to maximize collaboration with existing agencies with extension services and outreach capabilities, including the Ministry of Agriculture, RADA and the Jamaica Agricultural Society (JAS), the public awareness programme the overall R2RW project, and the Great River Watershed Management Committee Task Force on Production and Marketing, to increase awareness of the R2RW plant nursery and to encourage farmers to purchase seedlings and planting material from the project. Management and Operational Plan It is proposed that the R2RW plant nursery project will be established as company limited by share capital, with participation in ownership by eligible farmers groups and CBOs. Farm management will be provided under a cost-sharing arrangement with the Montpelier Citrus Company Limited. 10-Year Financial Plan The total capital expenditure for the proposed R2RW plant nursery is estimated at US$100,055 (J$4,702,589). The main expenditure is for nursery construction which is estimated at US$43,293 (J$2,034,788), including the cost of a shade house at US$18,191 (J$854,988) and the proposed screen house at US$10,838 (J$509,400). The cost of irrigation equipment is estimated at US$4,427 (J$208,057), including the cost of a misting propagator. The cost of nursery materials and equipment is estimated at US$13,680 (J$642,955), including the cost of miscellaneous small tools and equipment. The budget for perimeter fencing is estimated at US$17,547 (J$824,691) and at US$5,106 (J$240,000) for internal roadway works. Provision is made for start-up marketing costs at US$1,617 (J$76,000), and for start -up development costs at US$1,064 (J$50,000). Working capital requirement is projected at US$7,644 (J$359,274). A contingency of US$4,401 (J$206,825) is included representing 5% of the capital cost items. It is proposed that the total capital expenditure costs will be financed by funding of US$56,078 (J$2,635,670) or 56.05% of the total project cost from the USAID R2RW budget committed to the proposed R2RW plant nursery, and by new funding of US$43,977 (J$2,066,920) or 43.95% of the total project cost to be solicited from other sources such as the Jamaica Agricultural Development Foundation (JADF), over the period of implementation of the project. Total annual production by the proposed R2RW plant nursery is projected to rise from 295,651 units in year 1, to 323,983 units in year 2 and to 453,441 units in year10, where units include seedlings, suckers and mini-setts. Total Annual Income for proposed R2RW plant nursery is estimated at US$86,853 (J$4,082,109) in year 1, rising to US$95,060 (J$4,467,835) in year 2 and at US$133,498 (J$6,274,412) in year 10. Total Annual Expenditure for the project is estimated at US$91,730 (J$4,311,289) in year 1, rising to US$93,930 (J$4,414,732) in year 2 and US$118,576 (J$5,573,087) in year 10. Total annual expenditure including direct costs and overheads is estimated at 105.61% of total sales revenue in year 1, 98.81% in year 2 and 88.82% in year 10. The Annual Net Income for the project is estimated at a deficit of -US$4,876 (-J$229,180) in year 1 of the project, moving to a positive net income of US$1,130 (J$53,103) in year 2 and to an estimated annual net income of US$14,922 (J$701,325) in year 10 of the project. The project is estimated to generate a cumulative positive net balance of US$99,314 (J$4,667,764) by the end of year 10.
Feasibility Study for R2RW Nursery – Mont Pellier, St. James 3
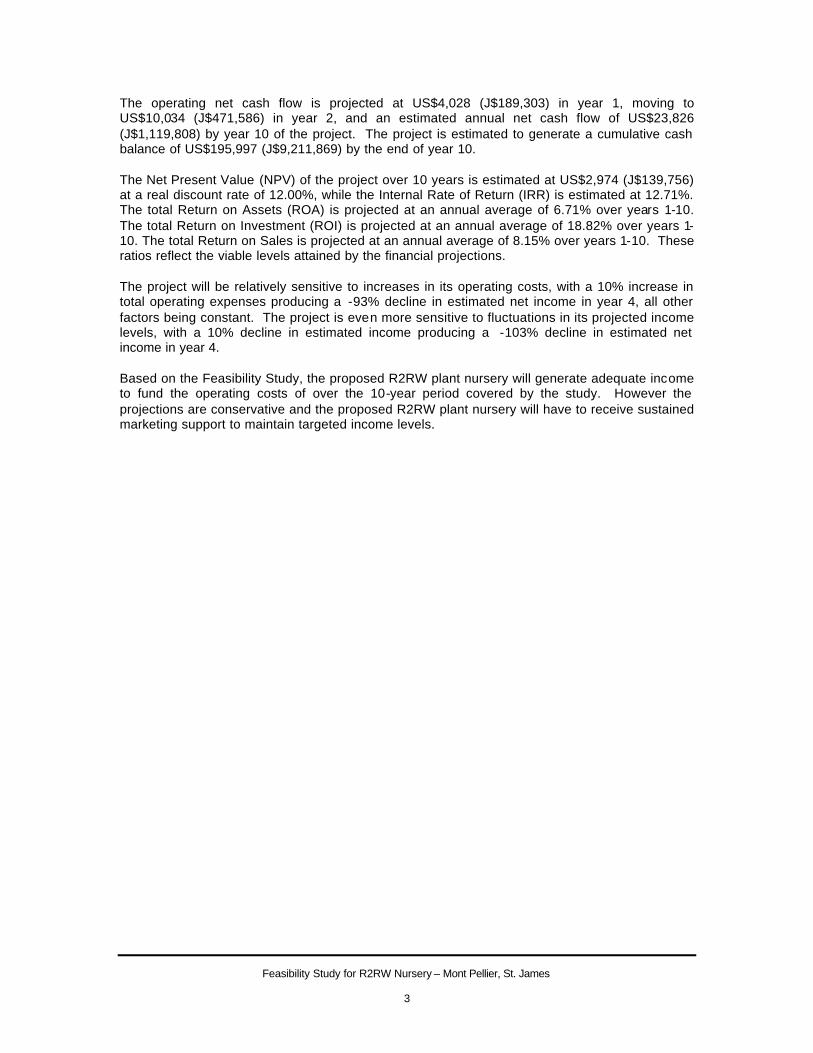
The operating net cash flow is projected at US$4,028 (J$189,303) in year 1, moving to US$10,034 (J$471,586) in year 2, and an estimated annual net cash flow of US$23,826 (J$1,119,808) by year 10 of the project. The project is estimated to generate a cumulative cash balance of US$195,997 (J$9,211,869) by the end of year 10. The Net Present Value (NPV) of the project over 10 years is estimated at US$2,974 (J$139,756) at a real discount rate of 12.00%, while the Internal Rate of Return (IRR) is estimated at 12.71%. The total Return on Assets (ROA) is projected at an annual average of 6.71% over years 1-10. The total Return on Investment (ROI) is projected at an annual average of 18.82% over years 1-10. The total Return on Sales is projected at an annual average of 8.15% over years 1-10. These ratios reflect the viable levels attained by the financial projections. The project will be relatively sensitive to increases in its operating costs, with a 10% increase in total operating expenses producing a -93% decline in estimated net income in year 4, all other factors being constant. The project is even more sensitive to fluctuations in its projected income levels, with a 10% decline in estimated income producing a -103% decline in estimated net income in year 4. Based on the Feasibility Study, the proposed R2RW plant nursery will generate adequate income to fund the operating costs of over the 10-year period covered by the study. However the projections are conservative and the proposed R2RW plant nursery will have to receive sustained marketing support to maintain targeted income levels.
Feasibility Study for R2RW Nursery – Mont Pellier, St. James 4
11..00 IINNTTRROODDUUCCTTIIOONN AANNDD BBAACCKKGGRROOUUNNDD 1.1 Country Background - Jamaica Jamaica is the third largest island in the Caribbean with a land area of 4,411 square miles, (11,425 sq. km.) and is located in a favourable central geographical position, approximately 500 miles (800 km) or 1½-2 hours flying time south of Miami. Jamaica has a population of 2.5 million people, of which 66% are under 29 years of age, and an estimated annual population growth rate of 1.1%. The economy of Jamaica is based primarily on the mining and export of bauxite and alumina, a growing tourism sector, production of a range of domestic and export agricultural crops, a limited industrial base and relatively developed financial and commercial sectors. Continued attempts for economic reform by successive governments resulted in an economic expansion in the late 1980s, which was sustained during much of the decade of the 1990s until the contraction of the economy in recent years. The commitment to political democracy is paralleled by the island's respect for private property and the free market. Jamaica also possesses the largest English-speaking workforce in the Caribbean Basin, estimated at some 1,150,000 persons in 1995. Jamaica is also well provided with the required infrastructure for economic growth including reliable electricity supply; abundant supply of potable water; an advanced telephone and international telecommunications system including direct dialing to most countries of the world; and one of the most extensive road networks of any developing country in the hemisphere. Jamaica has two (2) international airports, the Norman Manley International Airport in the capital city of Kingston and the Donald Sangster International Airport in Montego Bay. The island also has a total of four (4) international cruise ship ports. Jamaica has seen some development in environmental conservation and sustainable development in recent years, including the role of the Natural Resource Conservation Authority (NRCA) as the main body responsible for environmental policy, planning and enforcement, and its proposed merger with other agencies including the Town Planning Agency to form the National Environment and Planning Agency (NEPA). The recent completion of the South Coast Sustainable Development Plan as well as the adoption of the Policy for Jamaica’s System of Protected Areas are positive developments. These are complemented by the activities of a number of non-governmental organizations (NGOs) and umbrella organizations including the Environmental Foundation of Jamaica (EFJ), National Environmental Societies Trust (NEST), Caribbean Coastal Area Management Foundation (CCAM) and the Jamaica Conservation and Development Trust (JCDT). However, Jamaica’s environment and natural resources are still threatened by unsustainable levels of deforestation in watershed areas and pollution, and increased work by public and private sector agencies and NGOs will be required in order to address these environmental issues adequately. 1.2 Project Background The Ridge to Reef Watershed Project (R2RW) is a 5–6 year project funded and implemented by USAID and the Government of Jamaica (GOJ), with the overall objective of contributing to improved quality of key natural resources in areas of Jamaica that are both environmentally and economically significant. R2RW comprises three main components: (i) Assisting targeted organizations to identify and promote sustainable environmental management practices by resource users; (ii) Identifying and supporting solutions to improve the enforcement of targeted existing environmental regulations, primarily in the Great River and Rio Grande Watersheds; and (iii) Providing assistance to key organizations to support, coordinate, and expand watershed management efforts in Jamaica.
Feasibility Study for R2RW Nursery – Mont Pellier, St. James 5
The Great River Watershed The Great River traverses or forms the border between four parishes namely St Elizabeth, St James, Hanover and Westmoreland. The area designated as the Great River Watershed falls under the administrative jurisdictions of four parishes. A recent Rapid Assessment of the watershed indicates that farming activities have declined and once popular enterprises including beef cattle and banana are no longer as significant in the economy of the watershed. Beef cattle farming has declined due to a fall in demand for beef on the local market and the preference of hotels and high-end restaurants for Grade A imported beef. The decline of banana is caused by Black Sigatoka disease that destroys the leaves of banana and plantain plants. Due to low fruit and vegetable production the Great River Watershed is not exploiting to the fullest the market that the greater Montego Bay area offers. In addition forestry in the watershed is not as extensive as desired and consequently is not contributing to its full potential to the economy or the environment. However there have been some positive trends in citrus and coffee production. R2RW Plant Nursery Project In order to contribute to the environmental and economic objectives in the GRW, the R2RW project seeks to establish a plant nursery at Montpelier, St, James, with the aid of local partners and donors, to support development of crop and forestry enterprises that will contribute to improving the economic well being of the people, and stability of the environment of the GRW. R2RW wishes the plant nursery to be a sustainable contribution to the development of the watershed and to continue to function beyond the end of funding by USAID. R2RW has undertaken the preparation of a Feasibility Study of the proposed R2RW plant nursery for the next ten (10) years, taking into account demand and financial analysis, stakeholder perspectives and ownership and management alternatives, in order to place its long-term operation on a sustainable basis.
Feasibility Study for R2RW Nursery – Mont Pellier, St. James 6
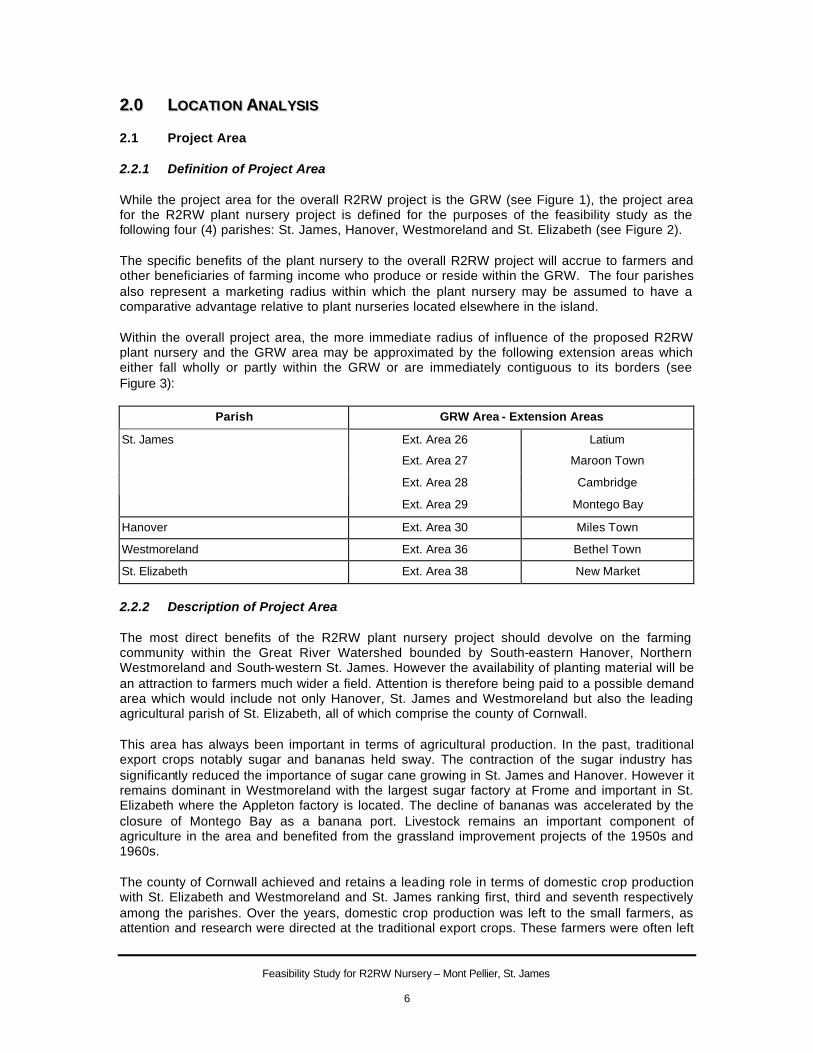
22..00 LLOOCCAATTII OONN AANNAALLYYSSIISS 2.1 Project Area 2.2.1 Definition of Project Area While the project area for the overall R2RW project is the GRW (see Figure 1), the project area for the R2RW plant nursery project is defined for the purposes of the feasibility study as the following four (4) parishes: St. James, Hanover, Westmoreland and St. Elizabeth (see Figure 2). The specific benefits of the plant nursery to the overall R2RW project will accrue to farmers and other beneficiaries of farming income who produce or reside within the GRW. The four parishes also represent a marketing radius within which the plant nursery may be assumed to have a comparative advantage relative to plant nurseries located elsewhere in the island. Within the overall project area, the more immediate radius of influence of the proposed R2RW plant nursery and the GRW area may be approximated by the following extension areas which either fall wholly or partly within the GRW or are immediately contiguous to its borders (see Figure 3):
Parish GRW Area - Extension Areas
Ext. Area 26 Latium
Ext. Area 27 Maroon Town
Ext. Area 28 Cambridge
St. James
Ext. Area 29 Montego Bay
Hanover Ext. Area 30 Miles Town
Westmoreland Ext. Area 36 Bethel Town
St. Elizabeth Ext. Area 38 New Market
2.2.2 Description of Project Area The most direct benefits of the R2RW plant nursery project should devolve on the farming community within the Great River Watershed bounded by South-eastern Hanover, Northern Westmoreland and South-western St. James. However the availability of planting material will be an attraction to farmers much wider a field. Attention is therefore being paid to a possible demand area which would include not only Hanover, St. James and Westmoreland but also the leading agricultural parish of St. Elizabeth, all of which comprise the county of Cornwall. This area has always been important in terms of agricultural production. In the past, traditional export crops notably sugar and bananas held sway. The contraction of the sugar industry has significantly reduced the importance of sugar cane growing in St. James and Hanover. However it remains dominant in Westmoreland with the largest sugar factory at Frome and important in St. Elizabeth where the Appleton factory is located. The decline of bananas was accelerated by the closure of Montego Bay as a banana port. Livestock remains an important component of agriculture in the area and benefited from the grassland improvement projects of the 1950s and 1960s. The county of Cornwall achieved and retains a leading role in terms of domestic crop production with St. Elizabeth and Westmoreland and St. James ranking first, third and seventh respectively among the parishes. Over the years, domestic crop production was left to the small farmers, as attention and research were directed at the traditional export crops. These farmers were often left
Feasibility Study for R2RW Nursery – Mont Pellier, St. James 7
to produce on small holdings on lands with severe agricultural limitations due to slopes and highly erodable soils. Under pressure for lands to cultivate, natural forests on slopes with thin soils overlaying limestone formations were cleared with predictable and disastrous results. Hence the need for extensive re-afforestation and soil conservation practices. Hanover and St. James have a similar pattern of agricultural practices and production as a result of the similarity in topography, rainfall and history of land ownership. The terrain rises from a narrow coastal strip to altitudes of some 2,000 feet above sea level merging into a southern white limestone plateau and hills suitable only for natural forests related to the Cockpit Country. There is a very limited amount of Class 1 & 2 agricultural lands and the bulk of the agriculture practised is rainfall dependent. In St. James where sugar cane and bananas once occupied some 90 percent of the farms, there is now much greater emphasis on citrus and coffee production. Attention is now being given to orchards of avocado and mangoes as well as pineapples and solo papaya. There is mixed cultivation of ground provisions such as yams, cocoes, dasheen, sweet potatoes, plantains and fruit trees including breadfruit, soursop, otaheitie apples, ackees, etc. More recently a number of exotic vegetables are being grown to meet the needs of the tourist trade. The parish is currently producing between 4 &5 per cent of the domestic crops annually. Hanover ranks as one of the smallest parishes producing between 2 and 3 per cent of the island's domestic crops with a profile similar to that of St. James. Cocoa is a traditional crop in this parish and citrus cultivation has expanded. This parish has suffered extensively from soil erosion and a lot of work has been done to introduce soil conservation practices. Westmoreland has a good deal of lands below a 5 degree slope but much of this has severe drainage limitations. As a result most of that portion which may be drained and made arable is either in pastures or sugarcane which is the most important cultivated crop. The parish ranks second in terms of livestock production. Despite this it ranks third in domestic crop production. It is no different to St. James, Hanover or Northern St. Elizabeth in terms of its domestic crop profile. The land being farmed by the small farmers is similar in topography and the problems experienced by them are the same. There is a difference however in Southern St. Elizabeth where one of the most productive areas remains under constant threat of drought from low rainfall (about 35 inches with a seasonal distribution) and a fairly porous soil. Farmers resort to heavy mulching and rudimentary drip irrigation to survive. Despite all this St. Elizabeth remains the top producer in domestic crops with a reputation for quality production. They produce a wide range of ground provisions, condiments and vegetables including exotics for the hotel and supermarket trade. 2.2 Project Site 2.2.1 Location The proposed site for the R2RW plant nursery will be in Montpelier, St. James, directly adjacent to the former Cornwall Dairies site now owned by the Montpelier Citrus Company. The location of the project site is shown in Figure 4. 2.2.2 Characteristics Size The total proposed site for the R2RW plant nursery is estimated at one (1) hectare (2.47 acres) as follows: Area Hectares Acres Shade House 0.10 0.25 Open Nursery Beds 0.71 1.75 Ancillary Space 0.19 0.47 Total 1.00 2.47
Feasibility Study for R2RW Nursery – Mont Pellier, St. James 8
Shape Assumed to be regular rectangular plot Topography Flat and gently sloping land 2.2.3 Services Road Access Good access by Montpelier main road or from Montpelier Citrus Company
property. Water Water available from 3 inch pipe fed by spring at Blue Hole approximately 200 feet above the site. Electricity Available from power lines on Montpelier main road.
Feasibility Study for R2RW Nursery – Mont Pellier, St. James 9
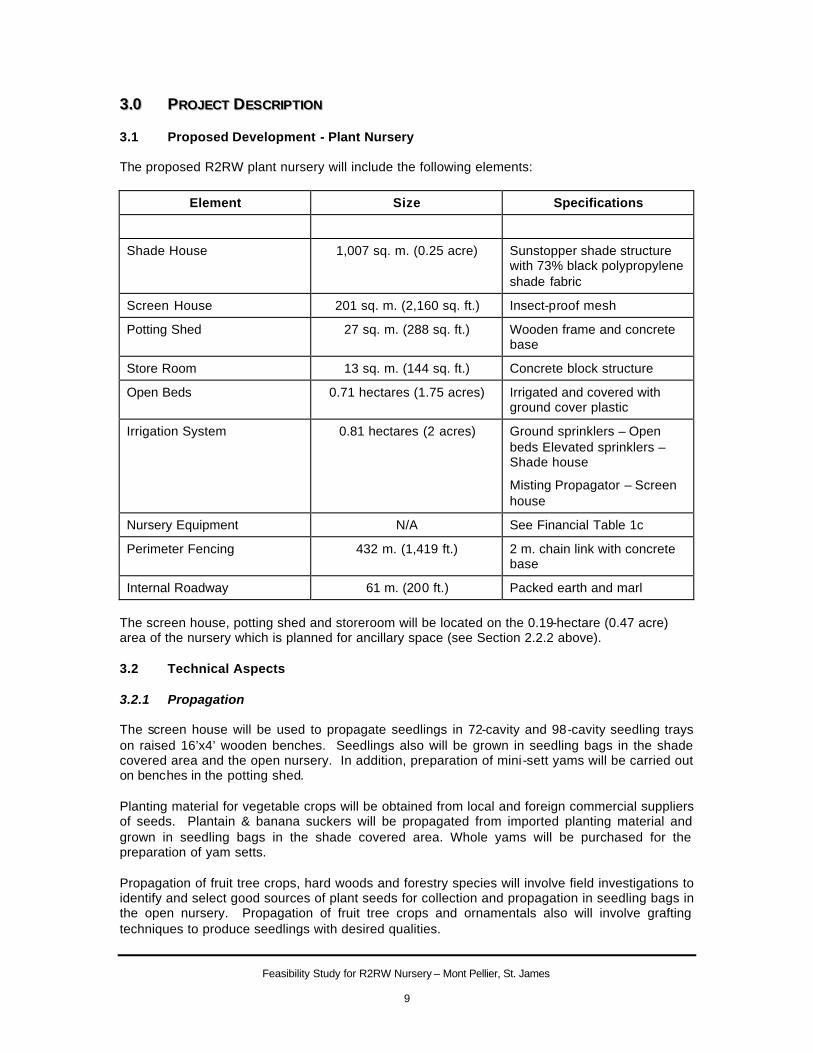
33..00 PPRROOJJEECCTT DDEESSCCRRIIPPTTIIOONN 3.1 Proposed Development - Plant Nursery The proposed R2RW plant nursery will include the following elements:
Element Size Specifications
Shade House 1,007 sq. m. (0.25 acre) Sunstopper shade structure with 73% black polypropylene shade fabric
Screen House 201 sq. m. (2,160 sq. ft.) Insect-proof mesh
Potting Shed 27 sq. m. (288 sq. ft.) Wooden frame and concrete base
Store Room 13 sq. m. (144 sq. ft.) Concrete block structure
Open Beds 0.71 hectares (1.75 acres) Irrigated and covered with ground cover plastic
Irrigation System 0.81 hectares (2 acres) Ground sprinklers – Open beds Elevated sprinklers – Shade house
Misting Propagator – Screen house
Nursery Equipment N/A See Financial Table 1c
Perimeter Fencing 432 m. (1,419 ft.) 2 m. chain link with concrete base
Internal Roadway 61 m. (200 ft.) Packed earth and marl The screen house, potting shed and storeroom will be located on the 0.19-hectare (0.47 acre) area of the nursery which is planned for ancillary space (see Section 2.2.2 above). 3.2 Technical Aspects 3.2.1 Propagation The screen house will be used to propagate seedlings in 72-cavity and 98-cavity seedling trays on raised 16’x4’ wooden benches. Seedlings also will be grown in seedling bags in the shade covered area and the open nursery. In addition, preparation of mini-sett yams will be carried out on benches in the potting shed. Planting material for vegetable crops will be obtained from local and foreign commercial suppliers of seeds. Plantain & banana suckers will be propagated from imported planting material and grown in seedling bags in the shade covered area. Whole yams will be purchased for the preparation of yam setts. Propagation of fruit tree crops, hard woods and forestry species will involve field investigations to identify and select good sources of plant seeds for collection and propagation in seedling bags in the open nursery. Propagation of fruit tree crops and ornamentals also will involve grafting techniques to produce seedlings with desired qualities.
Feasibility Study for R2RW Nursery – Mont Pellier, St. James
10
Planting media will include commercial potting mixes for vegetable seedlings and suckers. 3.2.2 Irrigation The open nursery will be irrigated by a ground sprinkler system while the shade covered area will be irrigated by elevated sprinklers attached overhead to the shade structure. A misting propagator will be installed in the screen house. The irrigation system will be gravity-fed at a pressure of approximately 40 psi from a spring at 200 feet above the site. 3.2.3 Cultivation The screen house will provide an environment which is free from insects and other vectors. Weed control in the shade house and open nursery will be effected by use of polypropylene ground cover plastic. Water-soluble fertilizer will be applied through the irrigation system and misting propagator according to the regimen for each crop. Insecticides such as Malathion and Diazinon and soil and systemic fungicides such as Redimil and Basudin will be applied according to manufacturers’ specifications and the growing conditions. Plants typically will be ready for sale at the appropriate age and height for transplanting depending on the specific crop, and will be sold either as rooted plugs or in seedling bags. Yam mini-setts will be prepared in setts from purchased whole yams and dipped in fungicide. Yam mini-setts will be planted in the field and grown out under contract by selected farmers in the GRW, to provide seed yams as planting material to be sold to yam farmers in the project area. 3.3 Environmental Aspects The environmental aspects of the proposed R2RW plant nursery will be of priority importance in the development of the project. All steps will be taken to ensure that the land clearing and construction work takes place in accordance with recommended measures for environmental conservation. Environmental risk mitigation measures including minimizing dust and noise pollution during the construction and operating stages and proper procedures for waste water and solid waste disposal will be employed. While it would be desirable for the proposed nursery to practice organic farming, the nursery will be located in close proximity to farming using chemicals, including the adjacent Montpelier Citrus Company nursery. In addition, as organic farming is not widespread in the project area, the benefits of providing organically grown seedlings would not be realized by farmers. Consequently, the proposed nursery will employ chemical fertilizers and pesticides, until the farming conditions in the project area are conducive to the introduction of organic farming. 3.4 Project Benefits The benefits of the proposed R2RW plant nursery in the GRW and the four western parishes will include the following: § Introduction of improved varieties of selected crops with higher yield, resistance to disease
and lower mortality rates § Reduced time and resources spent by farmers in self-propagation of planting material § Establishment of efficient and modern plant propagation centre in the GRW § Availability of high-quality planting material on consistent and predictable basis allowing
farmers to plan production

Feasibility Study for R2RW Nursery – Mont Pellier, St. James
11
§ Demonstration of benefits of efficient plant propagation methods § Increased yield and income to farmers in the GRW
Feasibility Study for R2RW Nursery – Mont Pellier, St. James
12
44..00 CCRROOPP PPRROODDUUCCTTIIOONN AANNAALLYYSSIISS 4.1 Land Capability - Project Area The crop production analysis begins with an analysis of the land capability of the project area. The following Table 1 sets out the land capability of the four parishes in the project area by land class. As the table shows, the four parishes have a total area of approximately 283,945 hectares, of which 55,957 hectares or 19.7% of the total area is represented by land in Class I and II, most suitable for cultivation. 49,945 hectares or 17.6% is suitable for cultivation with major limitations, while the remainder is marginal or not suitable for cultivation. St. Elizabeth is the parish with the highest absolute and relative areas of land suitable for agriculture in the project area. 4.2 Existing Production - Project Area As a background to the analysis of existing production in the project area, Tables 2 and 3 below present an overview of agricultural production in the island. As shown in Table 2a, total crop area reaped in Jamaica has declined by 23% over the ten (10) years from 1991-2000, with the greatest fall in legumes and cereals. However crop production in tonnes has actually increased by 8.5% over the same period (see Table 2b). This results from an 11.9% increase in average productivity per hectare over the period (see Table 2c). As shown in Table 3, St. Elizabeth is the largest agricultural parish in the island, both in crop production and area reaped, while Westmoreland is the third largest. The proposed R2Rw plant nursery therefore will be located within the largest agricultural region in the island, despite the fact that St. James and Hanover are relatively small agricultural parishes. Table 4 shows the breakdown of area reaped by crop in the four parishes in the year 2000. The table indicates that vegetables, yams and other tubers are the most important short -term crops in each of the parishes in the project area, with the exception of St. Elizabeth where legumes represent the largest area reaped. Table 5 presents a summary of the number and size of agricultural holdings in the four (4) parishes of the project area, while Table 6 shows the farm holdings by land use, based on the Census of Agriculture in 1996. Table 5 confirms the importance of the project area as an agricultural region, as the four parishes account for over a third of the total number of farm holdings representing over a quarter of the total area of holdings in the island. As indicated in Table 6, crop cultivation in pure and mixed stands represent the dominant productive use of farm land throughout the four parishes of the project area. Tables 7a-7d contain a more detailed breakdown of the area of holdings under crop cultivation in the four (4) parishes of the project area, including total hectares in permanent crops, legumes, vegetables and condiments fruits, cereals and tubers, based on the Census of Agriculture in 1996. As shown in Table 7a, the traditional permanent crops – sugar cane, bananas, coconut and citrus – continue to dominate farm holdings in the project area, with yams and other tubers, legumes and vegetables as the next most important crops. Table 7b indicates that the other important permanent crops include significant holdings in mango, pimento and plantain, while Table 7c shows pumpkin and tomato as the most widely grown vegetables, with significant areas of carrot, sweet pepper, cabbage, hot pepper and other condiments. As Table 7d indicates, the project area also contains significant holdings in watermelon and pineapple. Table 8 presents estimates of the area reaped by parish and crop detail in the project area in the year 2000 for relevant crops. Table 9 presents estimates of the area reaped for the same crops in the extension areas which correspond most closely to the boundaries of the GRW (see Section 2.1 above).
Feasibility Study for R2RW Nursery – Mont Pellier, St. James
13
As Table 8 shows, yams, tomatoes and cabbage are the most important of the selected crops within the project area, in terms of both area reaped and crop production. Plantain and sweet pepper are the next most important based on the figures for 2000. When the focus is narrowed to the extension areas which are within or contiguous with the GRW, the pattern of production of the selected crops is somewhat different – while yams still represent the largest area reaped, plantains become the next largest crop, while the area reaped in tomato is only slightly larger than the area reaped in cabbage or in hot and sweet pepper combined. Noticeable also is the relatively large area of pak choi cultivation in the Cambridge and Maroon Town extension areas of St. James. It is also important to note that despite the existence of the Sandals/RADA/Mafoota vegetable farming group within the GRW, almost all of the exotic crops including cauliflower, zucchini and broccoli, are mainly grown in St. Elizabeth. 4.3 Planned Production - Project Area Table 10 below presents a summary of planned expansion of agricultural production in the project area based on a number of specific projects. 4.3.1 Domestic Food Crop Production & Marketing Project The Domestic Food Crop Production & Marketing Project implemented by MINAG involves the provision of planting material and other support to farmers in eleven (11) parishes including St. James, Westmoreland and St. Elizabeth, to establish targeted hectares of selected domestic food crops, including vegetables, condiments, plantains and tubers. Table 10 shows the targeted levels of hectares for relevant crops which the Domestic Food Crop Project plans to have established in St. James, Westmoreland and St. Elizabeth in the year 2001/2002. While it is planned to establish 33 hectares of plantain, the suckers will be obtained primarily from the 12 hectare (30 acre) plantain nursery operated by MINAG at the Orange River Research Station in St. Mary. However, some possibility may exist for the proposed R2RW plant nursery to provide plantain suckers to the Domestic Food Crop Project should the production of plantain suckers from Orange River be inadequate to meet the requirements to establish the targeted hectares. A purchase price of J$8-10 per sucker was quoted by the project. Similarly the opportunity may exist for the proposed R2RW plant nursery to provi de seedlings for some of the targeted hectares of tomato, sweet pepper and scotch bonnet pepper. No hectares of exotic vegetables are targeted for the western parishes. However, the implementation of the Domestic Food Crop Project depends on the annual budget provided by MINAG, and no firm targets for planting areas by crop have been set for the years after 2001/2002. 4.3.2 Fruit Tree Crop Project The objectives of the Fruit Tree Crop Project implemented by MINAG include the establishment of 1,700 hectares of 13 designated fruit tree crops islandwide over the three years from 2000-2002, and establishment of a new seedling nursery at Bodles Agricultural Research Station and upgrading of the nursery at Orange River Agricultural Research Station to provide a combined production capacity of 450,000-660,000 seedlings per annum. The total targeted area by fruit tree crop over the 3-year project period is shown in Table 10. However the location by parish is not included and will depend on the geographic distribution of participating farmers. The most important crop targeted is ackee, accounting for over 50% of the total targeted area to be established under the Fruit Tree Crop Project. The other main crops include mango, breadfruit, guava, soursop and avocado. The Fruit Tree Crop Project did purchase up to 50,000 seedlings from private nurseries in the first year of the project, primarily ackee seedlings, at prices ranging from J$30-80 per seedling. However, with the coming on-stream of the nursery production at Bodles and Orange River, the project will be able to meet its requirements for planting material from its own nurseries. The seedlings will be provided free to
Feasibility Study for R2RW Nursery – Mont Pellier, St. James
14
farmers during the duration of the project, and it is projected that seedlings will be sold at commercial rates thereafter. 4.3.3 Forestry Department Table 10a shows a summary of the requests for timber and forestry seedlings received by the Forestry Department from farmers and land holders in the western parishes since 1997. The species requested include cedar, mahoe, mahogany, Spanish elm, teak, broadleaf, pine, Santa Maria, bitterwood, neem, lignum vitae, willow and cupressus, as well as fuel wood, fruit trees and ornamental species. As the table shows, farmers in the four parishes with total farm holdings of 5,554 hectares are presently seeking to establish some 840 hectares in timber and forestry, with the greatest interest from farmers in Hanover and St. James. At an average of 1,000 seedlings per hectare, this would indicate a current demand of 840,000 seedlings from the western parishes alone. The Forestry Department currently operates four (4) seedling nurseries located at Moneague, Williamsfield, Mount Airy and Clydesdale. The 2001/2 production target for the nursery at Williamsfield which is closest to the western parishes is 100,000 seedlings per annum, while the total production target of all 4 nurseries for 2001/2 is some 315,000 seedlings per annum. It is planned that total nursery production capacity of the Forestry Department will reach some 1.48 million seedlings per annum by the year 2005. While the Forestry Department plans to expand its nursery capacity over the medium term, its present production is insufficient to meet the current demand for seedlings by farmers, with its total annual island-wide production target for 2001/2 representing only 38% of the demand from the western parishes alone. Indeed a backlog in requests has developed, and the unsatisfied demand may offer an opportunity for the R2RW plant nursery project to supply timber and forestry seedlings to farmers and land holders who are willing to pay for seedlings rather than wait for an uncertain length of time to receive seedlings from the Forestry Department. The Forestry Department itself has purchased seedlings from private nurseries in the past to meet its requirements, and plans to privatize seedling production over the long term. The Trees for Tomorrow project currently being implemented by the Forestry Department with funding from CIDA has a budget for contracting up to 50,000 seedlings from the private sector based on competitive tender. Another forestry project which may involve the western parishes is the proposed Spinal Forest Project which will aim to restore forest cover to the entire central spine of the island. This long-term reforestation project will commence in 2002 with the establishment of a 250 hectare demonstration plot in central Jamaica to be funded by the Environmental Foundation of Jamaica (EFJ). While this project may generate long-term demand for timber and forestry seedlings, the project is still in the preliminary stages of formulation and no precise projections are presently available.
Feasibility Study for R2RW Nursery – Mont Pellier, St. James
15
55..00 MMAARRKKEETT AANNAALL YYSSIISS 5.1 Target Market Segments - By Crop The market analysis commences with the selection of the crops which the project will target for production of planting material. Table 11 presents a summary of the process by which the major categories of crops to be targeted for the proposed R2RW plant nursery were selected. 5.1.1 Elimination of Unsuitable Crops Starting from the full range of crops being grown in the project area (see Section 4.2 above), a number of crops can be eliminated based on a range of criteria. In the first place, several major crops can be eliminated as their typical methods of cultivation are not suitable for the use of planting material supplied by a commercial nursery (see also Table 11a). The crops eliminated on this basis include sugar cane which is propagated in the field by regeneration of ratoons; legumes, cereals, pumpkin, melons, squashes and zucchini (propagated by direct planting of robust seeds into the field); and pineapple (vegetative propagation). Other crops such as carrots, onions, escallion, turnip, celery, and beetroot are grown at such high planting densities that the cost of seedlings would be prohibitive, and these crops are grown from seeds. It should be noted that while typical methods of cultivation of yams and other tubers do not use commercial planting materials, yams have been included based on the proposed introduction of the mini-sett technology of propagation. Also plantains & bananas have been included based on the proposal to propagate suckers from superior imported genetic stock. Secondly, a number of crops may be eliminated because there are existing sources of seedlings and planting materials which are adequate to meet their requirements (see also Section 5.4 and Table 15 below). The main crop to be eliminated on this basis is citrus, including oranges, grapefruit, ortaniques, tangerines, ugli and limes. While citrus is a major crop in the project area which was initially seen as a potential target market for the R2RW plant nursery, the Montpelier Citrus Company (MCC) already operates a citrus nursery at Montpelier, St. James, which will have the capacity to produce citrus seedlings to meet the needs of their own farm and to supply planting materials for over 1,060 hectares (2,600 acres) of existing and planned citrus holdings by farmers in the project area. As the MCC nursery is certified by the Jamaica Citrus Protection Agency as a supplier of citrus seedlings which are free from and resistant to the Citrus Tristeza Virus, it is not considered that the R2RW plant nursery can or should attempt to compete with the MCC nursery in the production of citrus seedlings. Other crops which may be eliminated on the same basis include cocoa and coconuts, where the Cocoa Industry Board and the Coconut Industry Board provide seedlings to farmers, either at subsidized rates or on other favourable terms. In addition coffee is eliminated on the same basis, as the Coffee Industry Board operates a seedling nursery at its farm at Seven Rivers within the GRW, which has significant excess capacity. Grafted pimento seedlings are also available from MINAG. Finally, other crops such as mustard and eggplant are eliminated on the basis that the market for the final crops and the crop areas reaped are too limited to be targeted by the proposed plant nursery.
Feasibility Study for R2RW Nursery – Mont Pellier, St. James
16
5.1.2 Selection of Targeted Crops The crops which remain after this process of elimination represent the target market segments for the proposed R2RW plant nursery. The crops targeted for the plant nursery include the following (see Table 11): Targeted Crops Vegetables & Condiments Cabbage Cauliflower Lettuce Pak Choi Tomato Broccoli Hot Pepper Sweet Pepper Other Crops Plantains & Bananas Yams Fruit Tree Crops Ornamentals Timber & Non-Timber Forest Species In the following section the market situation for each of the selected crops is analysed. 5.2 Market Analysis - Overview The analysis of the market for agricultural crops in Jamaica is conditioned by the range and content of the available sources of relevant data. There are several recent studies carried out by the Ministry of Agriculture on usage of various crops in a number of sectors and industries including hotels, agro-processors and fast food restaurants, as well as annual data on crop production, areas reaped and average farmgate and retail prices. In addition, data on the import and export of agricultural items are contained in the statistics on external trade, and additional data on the export of non-traditional fresh produce is available from the JEA. However, there are very few market studies of particular crops or crop groups which are comprehensive enough to provide an accurate estimate of the demand from all segments of the market. Typically the studies on consumption in various sectors only capture a fraction of the total production of the relevant crops as recorded in the annual crop production data. The main component of aggregate demand which is not captured by the market studies is domestic household consumption where, unlike exports, distribution is carried out by a wide number of intermediaries, many operating in the informal sector of the economy, and through local markets where data collection mechanisms are absent. For example, the Charles Gordon Market in Montego Bay reports average sales of food crops valuing approximately J$16 million (US$0.35 million) per month passing through the market, but is unable to provide any details by crop or volume.
Feasibility Study for R2RW Nursery – Mont Pellier, St. James
17
Consequently the approach to the market analysis has been as follows: i. A wide number of data sources have been researched, and data from these sources on
market segments and crops has been attached as appendices. These data sources also are referred to as relevant in the market analysis of individual crops in Section 5.3 below.
ii. The total aggregate demand for relevant crops has been approximated by the sum of total
annual domestic production (including production for export) and total annual imports for each crop, where imports would represent the portion of total demand not satisfied by domestic production. The estimates of total aggregate demand for the relevant crops as approximated on this basis are presented in Table 12.
iii. The estimates of total aggregate demand for the relevant crops are converted to hectares of
production based on the average yield per hectare for each crop as derived from the all-island production and crop area reaped. The results as presented in Table 12a represent the total potential hectares of each crop required to meet the total estimated demand.
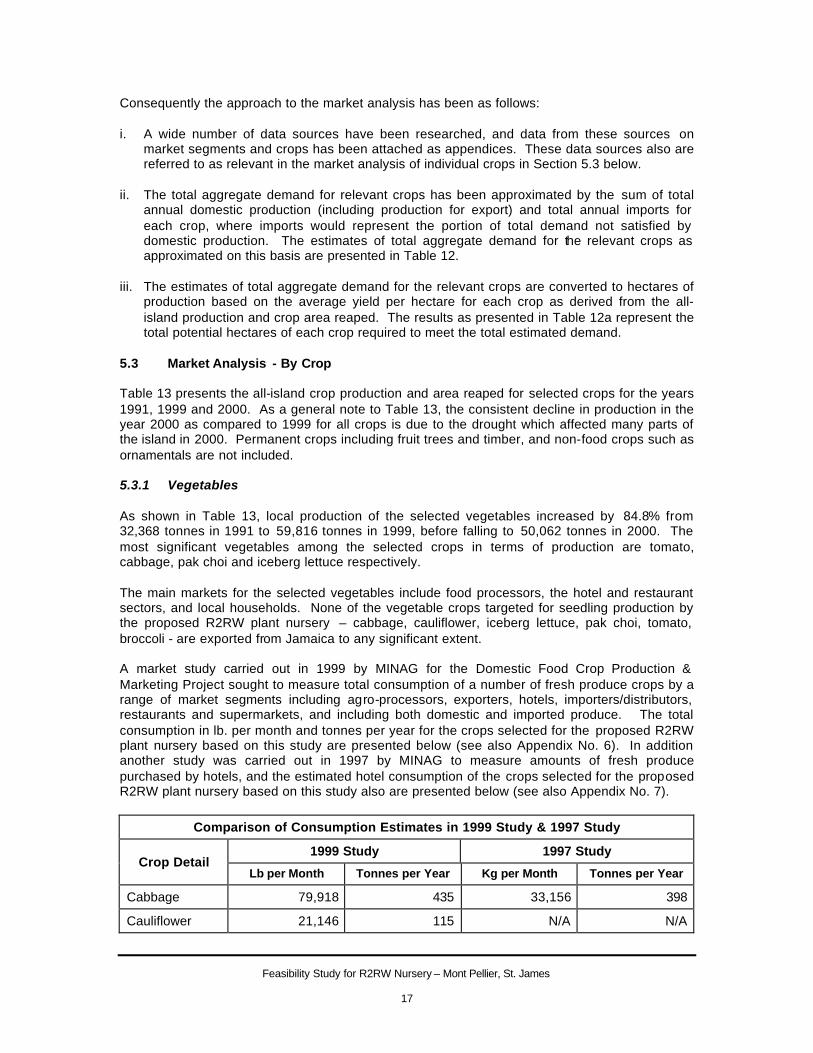
5.3 Market Analysis - By Crop Table 13 presents the all-island crop production and area reaped for selected crops for the years 1991, 1999 and 2000. As a general note to Table 13, the consistent decline in production in the year 2000 as compared to 1999 for all crops is due to the drought which affected many parts of the island in 2000. Permanent crops including fruit trees and timber, and non-food crops such as ornamentals are not included. 5.3.1 Vegetables As shown in Table 13, local production of the selected vegetables increased by 84.8% from 32,368 tonnes in 1991 to 59,816 tonnes in 1999, before falling to 50,062 tonnes in 2000. The most significant vegetables among the selected crops in terms of production are tomato, cabbage, pak choi and iceberg lettuce respectively. The main markets for the selected vegetables include food processors, the hotel and restaurant sectors, and local households. None of the vegetable crops targeted for seedling production by the proposed R2RW plant nursery – cabbage, cauliflower, iceberg lettuce, pak choi, tomato, broccoli - are exported from Jamaica to any significant extent. A market study carried out in 1999 by MINAG for the Domestic Food Crop Production & Marketing Project sought to measure total consumption of a number of fresh produce crops by a range of market segments including agro-processors, exporters, hotels, importers/distributors, restaurants and supermarkets, and including both domestic and imported produce. The total consumption in lb. per month and tonnes per year for the crops selected for the proposed R2RW plant nursery based on this study are presented below (see also Appendix No. 6). In addition another study was carried out in 1997 by MINAG to measure amounts of fresh produce purchased by hotels, and the estimated hotel consumption of the crops selected for the proposed R2RW plant nursery based on this study also are presented below (see also Appendix No. 7).
Comparison of Consumption Estimates in 1999 Study & 1997 Study
1999 Study 1997 Study Crop Detail
Lb per Month Tonnes per Year Kg per Month Tonnes per Year
Cabbage 79,918 435 33,156 398
Cauliflower 21,146 115 N/A N/A
Feasibility Study for R2RW Nursery – Mont Pellier, St. James
18
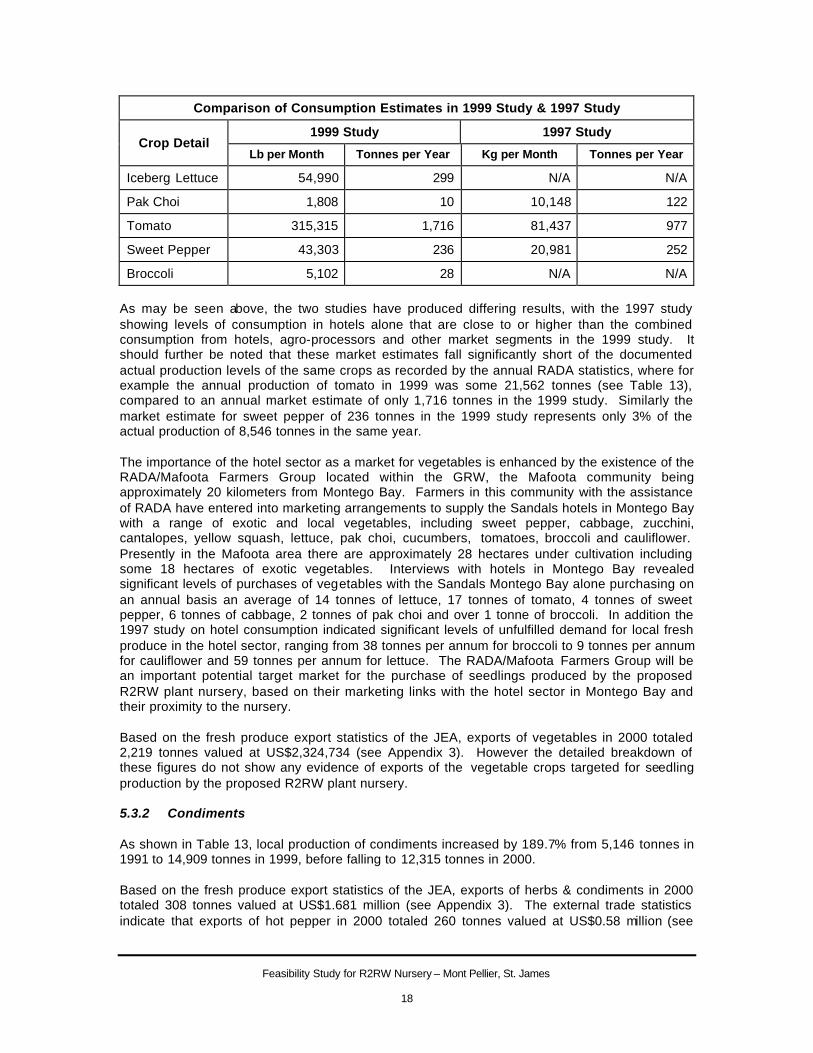
Comparison of Consumption Estimates in 1999 Study & 1997 Study
1999 Study 1997 Study Crop Detail
Lb per Month Tonnes per Year Kg per Month Tonnes per Year
Iceberg Lettuce 54,990 299 N/A N/A
Pak Choi 1,808 10 10,148 122
Tomato 315,315 1,716 81,437 977
Sweet Pepper 43,303 236 20,981 252
Broccoli 5,102 28 N/A N/A As may be seen above, the two studies have produced differing results, with the 1997 study showing levels of consumption in hotels alone that are close to or higher than the combined consumption from hotels, agro-processors and other market segments in the 1999 study. It should further be noted that these market estimates fall significantly short of the documented actual production levels of the same crops as recorded by the annual RADA statistics, where for example the annual production of tomato in 1999 was some 21,562 tonnes (see Table 13), compared to an annual market estimate of only 1,716 tonnes in the 1999 study. Similarly the market estimate for sweet pepper of 236 tonnes in the 1999 study represents only 3% of the actual production of 8,546 tonnes in the same year. The importance of the hotel sector as a market for vegetables is enhanced by the existence of the RADA/Mafoota Farmers Group located within the GRW, the Mafoota community being approximately 20 kilometers from Montego Bay. Farmers in this community with the assistance of RADA have entered into marketing arrangements to supply the Sandals hotels in Montego Bay with a range of exotic and local vegetables, including sweet pepper, cabbage, zucchini, cantalopes, yellow squash, lettuce, pak choi, cucumbers, tomatoes, broccoli and cauliflower. Presently in the Mafoota area there are approximately 28 hectares under cultivation including some 18 hectares of exotic vegetables. Interviews with hotels in Montego Bay revealed significant levels of purchases of vegetables with the Sandals Montego Bay alone purchasing on an annual basis an average of 14 tonnes of lettuce, 17 tonnes of tomato, 4 tonnes of sweet pepper, 6 tonnes of cabbage, 2 tonnes of pak choi and over 1 tonne of broccoli. In addition the 1997 study on hotel consumption indicated significant levels of unfulfilled demand for local fresh produce in the hotel sector, ranging from 38 tonnes per annum for broccoli to 9 tonnes per annum for cauliflower and 59 tonnes per annum for lettuce. The RADA/Mafoota Farmers Group will be an important potential target market for the purchase of seedlings produced by the proposed R2RW plant nursery, based on their marketing links with the hotel sector in Montego Bay and their proximity to the nursery. Based on the fresh produce export statistics of the JEA, exports of vegetables in 2000 totaled 2,219 tonnes valued at US$2,324,734 (see Appendix 3). However the detailed breakdown of these figures do not show any evidence of exports of the vegetable crops targeted for seedling production by the proposed R2RW plant nursery. 5.3.2 Condiments As shown in Table 13, local production of condiments increased by 189.7% from 5,146 tonnes in 1991 to 14,909 tonnes in 1999, before falling to 12,315 tonnes in 2000. Based on the fresh produce export statistics of the JEA, exports of herbs & condiments in 2000 totaled 308 tonnes valued at US$1.681 million (see Appendix 3). The external trade statistics indicate that exports of hot pepper in 2000 totaled 260 tonnes valued at US$0.58 million (see
Feasibility Study for R2RW Nursery – Mont Pellier, St. James
19
Appendix 8). The overseas market for hot pepper is mainly based on demand from ethnic communities in the United States, Canada and Europe, where Jamaican peppers command a premium price including scotch bonnet which is recognised for its distinctive flavour. Improved strains of scotch bonnet pepper for export are being developed at the Montpelier Research Station under a project funded by the Food and Agriculture Organization (FAO). The local agro-processing industry is an important market for hot pepper in Jamaica, with some seven (7) main processors using varieties of capsicum including Habanero, West Indies Red and Scotch Bonnet to produce hot pepper sauces, jerk sauces, pickles and other products. Based on a survey carried out by MINAG in 1999, the volume of hot pepper used by local agro-processors increased from 323 tonnes in 1995 to 643 tonnes in 1998 (see Appendix 4). An estimated 42.8 hectares of crop production would be required to meet the annual demand for hot pepper by agro-processors in 1998. The market study carried out in 1999 for the Domestic Food Crop Production & Marketing Project estimated the total consumption of hot pepper by agro-processors, exporters, hotels, importers/distributors, restaurants and supermarkets at 66,595 lb. per month or 362 tonnes per year (see also Appendix No. 6), while the 1997 study estimated the hotel consumption of hot pepper at 1,971 kg. per month or 24 tonnes per year (see also Appendix No. 7). The production and sale of scotch bonnet pepper seedlings will be an important component of the proposed R2RW plant nursery, based on the increasing local and export market for scotch bonnet pepper, and based on the linkage with the Montpelier Research Station to obtain improved strains of scotch bonnet pepper seeds. Farmers in suitable areas in and adjacent to the GRW including Mafoota, Garland and New Market will be targeted as potential purchasers of scotch bonnet pepper seedlings. 5.3.3 Plantains As shown in Table 13, local production of plantains increased by 3.1% from 26,692 tonnes in 1991 to 27,524 tonnes in 1999, before falling to 22,332 tonnes in 2000. The main markets for plantain include food processors who purchase up to 225 tonnes per annum for the manufacturing of chips, and local households for domestic consumption. Exports of plantain have declined rapidly over the past decade to negligible levels, due to competition from other countries including Colombia, Ecuador and Venezuela. Plantain also finds only limited use in the local hotel sector. The market study carried out in 1999 for the Domestic Food Crop Production & Marketing Project estimated the total consumption of plantain by agro-processors, exporters, hotels, importers/distributors, restaurants and supermarkets at 37,318 lb. per month or 203 tonnes per year (see also Appendix No. 6). Again this only represents a small fraction of annual production of plantain, with the largest volumes of sales passing unrecorded through the town markets and other informal distribution channels. The proposed R2RW plant nursery will develop a market for plantain and banana suckers based on the introduction of superior varieties which are higher-yielding and more resistant to disease including varieties resistant to the Black Sigatoka disease. The primary market will be existing farmers with areas in banana and plantain cultivation within or in proximity to the GRW. 5.3.4 Yams As shown in Table 13, local production of yams increased by 5.1% from 186,104 tonnes in 1991 to 195,688 tonnes in 1999, before falling to 147,709 tonnes in 2000.
Feasibility Study for R2RW Nursery – Mont Pellier, St. James
20
Yams are one of the most important export crops for Jamaica, principally to ethnic communities in the United States, Canada and Europe. Based on the fresh produce export statistics of the JEA, exports of root crops in 2000 totaled 9,924 tonnes valued at US$14,504,944 (see Appendix 3). The external trade statistics indicate that exports of yams in 2000 totaled 8,182 tonnes valued at US$10.95 million (see Appendix 8). The market study carried out in 1999 for the Domestic Food Crop Production & Marketing Project estimated the total consumption of yams by agro-processors, exporters, hotels, importers/distributors, restaurants and supermarkets at 1,583,089 lb. per month or 8,617 tonnes per year (see also Appendix No. 6), while the 1997 study estimated the hotel consumption of yams at 27,492 kg. per month or 330 tonnes per year (see also Appendix No. 7). The proposed R2RW plant nursery will develop a market for mini-setts and seed yams to permit yam farmers to grow smaller yams which are more suited to the export market. The impetus for introduction of the mini-setts and seed yams will be driven by the new imperatives of the export market, where the U.S. market will be restricting entry of yams which are cut and treated with fungicides. The plant nursery will target farmers in the yam-producing areas of the GRW including Cambridge and Great River, and in Hanover which is one of the largest yam-producing parishes in the island. 5.3.5 Fruit Tree Crops Tree crops grown in Jamaica fall into two (2) categories: i. Traditional orchard crops – citrus, coffee, cocoa and coconut ii. Non-traditional orchard crops – ackee, breadfruit, nutmeg, mango, soursop, guava, june
plum, cashew, avocado, naseberry, tamarind, otaheite apple, guinep, paw paw, pimento, rose apple, star apple
The traditional orchard crops have been eliminated from the market for the R2RW plant nursery project based on the fact that there are adequate existing suppliers of seedlings for these crops (see Section 5.1 above). Consequently the market analysis will focus on the non-traditional orchard crops. There is an increasing demand for non-traditional orchard fruits. The international market is growing based on the trends toward health foods and demand for tropical and off-season fresh fruits in metropolitan markets. In particular the recent decision by the U.S. Food and Drug Administration to open the United States market to imports of ackee has provided a new impetus to the fruit tree crop sub-sector, with the demand for ackee projected to increase by 500% to satisfy the ethnic market in the U.S. Local markets for non-traditional fruit tree crops include food processors and the tourist sector, as well as domestic household consumption. Based on the fresh produce export statistics of the JEA, exports of fruits in 2000 totaled 11,762 tonnes valued at US$9,218,230 (see Appendix 3). The external trade statistics provide further evidence of the importance of the export market for fruit tree crops with exports of mangoes in 2000 totalling 434 tonnes valued at US$0.74 million, soursop totalling 19 tonnes valued at US$0.03 million, avocado totalling 151 tonnes valued at US$0.24 million, and breadfruit totalling 640 tonnes valued at US$0.62 million (see Appendix 8). Th e tremendous potential of ackee is underscored by the levels of exports of processed (canned) ackee which totalled 1,075 tonnes valued at US$4.80 million in the year 2000. The market study carried out in 1999 for the Domestic Food Crop Production & Marketing Project estimated the total consumption of guava by agro-processors, exporters, hotels, importers/distributors, restaurants and supermarkets at 20,833 lb. per month or 113 tonnes per
Feasibility Study for R2RW Nursery – Mont Pellier, St. James
21
year, with the consumption of mango estimated at 197,081 lb. per month or 1,073 tonnes per year and soursop at 53,583 lb. per month or 292 tonnes per year (see also Appendix No. 6). A single hotel in Montego Bay reports its average consumption of mango at over 7 tonnes per annum. The proposed R2RW plant nursery will produce fruit tree crop seedlings for farmers within or in proximity to the GRW who are seeking to establish orchards as well as some limited sales to householders seeking individual plants. Ackee will be the primary fruit tree crop to be targeted by the project, based on the emerging export market and the existence of a major certified ackee processing plant, West Best Foods Limited, in Darliston, Westmoreland, which estimates its potential annual demand for ackees at approximately 3,000 tonnes. The market for fruit tree crop seedlings will be limited by a number of factors, including the relatively low planting density of fruit tree orchards compared to other crops such as vegetables, the fact that as permanent crops seedlings for fruit trees are only required for one-time establishment of hectares, and by the existing Fruit Tree Crop Project (see Section 4.3.2 above) which will provide free seedlings to farmers during the remaining 2 year duration of the project. Howe`ver the market for fruit tree crop seedlings should strengthen after the next two years based on the demand stimulated by the opening of the U.S. market for ackees and the demand stimulated by the Fruit Tree Crop Project which by then will no longer be distributing free seedlings. 5.3.6 Ornamentals The markets for ornamental foliage and flowers produced by the local horticulture and floriculture industry include hotels, the local landscaping industry, households, and the export market. Based on the fresh produce export statistics of the JEA, exports of flowers & foliage in 2000 totaled 1,612 tonnes valued at US$1,553,624 (see Appendix 3). The local hotel industry spends up to US$20,000 per hotel on annual landscaping maintenance and up to US$500,000 on landscaping for construction of new projects. However no current data is available on the levels of total production and sales of ornamentals. The market for ornamental seedlings is limited by a number of factors. Firstly, the hotels which are among the largest single purchasers of ornamentals, prefer to purchase finished plants to achieve immediate landscaping effects. In addition, many hotels operate their own plant propagation nurseries to obtain planting material from the stock of ornamentals on their own properties. Although hotels and horticulture producers purchase seedlings in trays to meet requirements which they cannot produce themselves, they prefer to import tissue-cultured seedlings from Miami to obtain the benefits of uniformity of genetic stock and quality. The external trade statistics indicate that Jamaica imported over US$250,000 of live plants with roots, including cuttings, slips and seedlings in 2000. Consequently the proposed R2RW plant nursery will only produce limited quantities of ornamental seedlings, primarily for sales to hotels in the Montego Bay area and to householders seeking individual plants. 5.3.7 Timber and Forest The market for timber and forest seedlings is driven by the desire of private land holders to invest in long-term income-generating timber projects, particularly on lands which are unsuitable for more intensive cultivation, and by conservation programmes initiated by a number of public sector agencies and environmental NGOs. The total annual demand for lumber in Jamaica is estimated at 200,769 cubic metres, including hardwood and softwood. When the demand for fuelwood, charcoal and yam sticks is included, the Forestry Department estimates the total area of plantation needed to sustain the annual demand for wood in Jamaica as 94,540 hectares. As the total area now in forest plantations in
Feasibility Study for R2RW Nursery – Mont Pellier, St. James
22
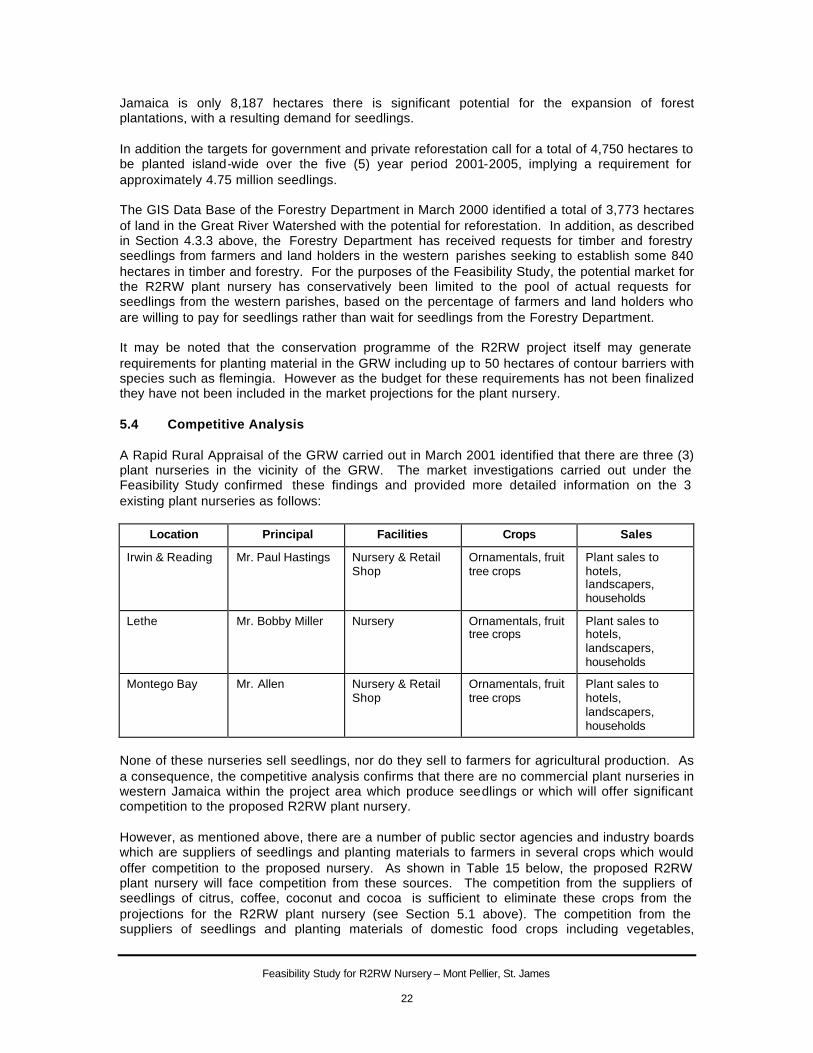
Jamaica is only 8,187 hectares there is significant potential for the expansion of forest plantations, with a resulting demand for seedlings. In addition the targets for government and private reforestation call for a total of 4,750 hectares to be planted island-wide over the five (5) year period 2001-2005, implying a requirement for approximately 4.75 million seedlings. The GIS Data Base of the Forestry Department in March 2000 identified a total of 3,773 hectares of land in the Great River Watershed with the potential for reforestation. In addition, as described in Section 4.3.3 above, the Forestry Department has received requests for timber and forestry seedlings from farmers and land holders in the western parishes seeking to establish some 840 hectares in timber and forestry. For the purposes of the Feasibility Study, the potential market for the R2RW plant nursery has conservatively been limited to the pool of actual requests for seedlings from the western parishes, based on the percentage of farmers and land holders who are willing to pay for seedlings rather than wait for seedlings from the Forestry Department. It may be noted that the conservation programme of the R2RW project itself may generate requirements for planting material in the GRW including up to 50 hectares of contour barriers with species such as flemingia. However as the budget for these requirements has not been finalized they have not been included in the market projections for the plant nursery. 5.4 Competitive Analysis A Rapid Rural Appraisal of the GRW carried out in March 2001 identified that there are three (3) plant nurseries in the vicinity of the GRW. The market investigations carried out under the Feasibility Study confirmed these findings and provided more detailed information on the 3 existing plant nurseries as follows:
Location Principal Facilities Crops Sales
Irwin & Reading Mr. Paul Hastings Nursery & Retail Shop
Ornamentals, fruit tree crops
Plant sales to hotels, landscapers, households
Lethe Mr. Bobby Miller Nursery Ornamentals, fruit tree crops
Plant sales to hotels, landscapers, households
Montego Bay Mr. Allen Nursery & Retail Shop
Ornamentals, fruit tree crops
Plant sales to hotels, landscapers, households
None of these nurseries sell seedlings, nor do they sell to farmers for agricultural production. As a consequence, the competitive analysis confirms that there are no commercial plant nurseries in western Jamaica within the project area which produce seedlings or which will offer significant competition to the proposed R2RW plant nursery. However, as mentioned above, there are a number of public sector agencies and industry boards which are suppliers of seedlings and planting materials to farmers in several crops which would offer competition to the proposed nursery. As shown in Table 15 below, the proposed R2RW plant nursery will face competition from these sources. The competition from the suppliers of seedlings of citrus, coffee, coconut and cocoa is sufficient to eliminate these crops from the projections for the R2RW plant nursery (see Section 5.1 above). The competition from the suppliers of seedlings and planting materials of domestic food crops including vegetables,

Feasibility Study for R2RW Nursery – Mont Pellier, St. James
23
condiments and tubers is only moderate within the four western parishes, and will not seriously affect the projections for the R2RW plant nursery (see Section 5.5 below). The level of competition from the suppliers of seedlings and planting materials of fruit tree crops, timber & forestry will be significantly high for as long as the free distribution of seedlings to farmers continues, and will seriously limit the projections for the R2RW plant nursery for these crops (see Section 5.5 below). 5.5 Seedling Market Projections - Propose d R2RW Plant Nursery The seedling market projections for the proposed R2RW plant nursery are developed on the basis of the estimates of the area reaped by parish & crop detail in the year 2000 for selected crops in the project area and in the GRW as presented in Tables 8 and 9 above. It is projected that the sale of seedlings to farmers will increase gradually over time, with a percentage of the areas reaped converting to production by seedlings as farmers accept the change in propagation of planting material from self-propagation to purchase of commercially produced seedlings. 5.5.1 Market Acceptance Rates The market acceptance rates represent the percentage of the annual crop areas reaped which purchase seedlings and planting material from the proposed R2RW plant nursery. Table 16 shows the targeted rates of acceptance by crop within the GRW and the four western parishes over the first 10 years of the nursery project. The acceptance rates among farmers in the extension areas within or bordering the GRW are targeted to be ten times as high as the acceptance rate in the more remote extension areas in the western parishes, as these farmers will be more accessible to the marketing efforts of the plant nursery and the overall R2RW project. As shown in Tables 16a and 16 b, the targeted market acceptance rates are highest for hot pepper, where seedlings grown from improved scotch bonnet seeds obtained from the Montpelier Agricultural Research Station should prove particularly attractive to farmers, and for broccoli as an exotic crop with high returns to farmers based on the lucrative hotel market. Cauliflower and iceberg lettuce also have relatively high acceptance rates for similar reasons as broccoli. The lowest rates are projected for crops such as cabbage and tomato which are widely grown primarily for local markets. Nevertheless, even for hot pepper it is only projected that 5.00% of farmers in the GRW will purchase seedlings from the R2RW plant nursery in year 1, rising to only 7.75% by the end of year 10. By comparison the projections for cauliflower and iceberg lettuce are for 1.00% of farmers in the GRW to purchase seedlings in year 1, rising to 1.55% by the end of year 10. The projections for cabbage and tomato are for 0.20% of farmers to purchase seedlings in year 1, rising to 0.31% by the end of year 10. For plantain and bananas the market acceptance rates would include farmers establishing new crop areas as well farmers replanting existing areas with suckers of superior varieties from the nursery. 5.5.2 Market by Crop Areas Reaped Based on the estimated total crop areas reaped annually in the GRW and the four western parishes and the projected rates of acceptance of commercially produced seedlings, Table 17 presents the projected areas reaped annually by crop which will be grown from seedlings sold by the proposed R2RW plant nursery over the first ten (10) years of the project. As Table 17c shows, the project will depend on relatively small areas of crop areas to purchase seedlings from the nursery each year. For hot pepper the crop area to be planted with seedlings from the nursery is projected at 4.14 hectares in year 1 rising to 6.42 hectares in year 10, while
Feasibility Study for R2RW Nursery – Mont Pellier, St. James
24
the crop areas for broccoli and cauliflower are projected at 0.08 hectares and 0.09 hectares respectively in year 1, rising to 0.13 hectares and 0.14 hectares respectively in year 10. For plantain and bananas the crop areas would imply crop areas which are progressively planted with suckers from the nursery each year as, unlike vegetables and condiments, the same areas typically would not require fresh suckers in subsequent years once they have been planted out. Based on Table 17c the cumulative crop area to be planted out with suckers from the nursery after 10 years would total 23.09 hectares for plantain and 26.88 hectares for banana. By comparison the total area in plantain in the four western parishes is currently 288.5 hectares, while the area in banana in the four western parishes totaled 2,860 hectares in 1996 (see Table 7b). Similarly the projected crop areas of yam acquiring planting material through the nursery each year represent a tiny fraction of the total crop area in yam in the four western parishes which stood at 2,405.9 hectares in 2000 (see Table 8). 5.5.3 Market Projections by Crop Based on the planting material requirements by crop (see Table 14), the market by crop areas reaped as shown in Tables 17a-17c are converted into the projected market for quantities of seedlings and planting material which could be sold by the proposed R2RW plant nursery over the first ten (10) years of the project, as presented in Table 18. Table 18 also includes the projections for sales of seedlings of fruit tree crops, ornamentals and timber and forestry species for the project. Vegetables and Condiments As shown in Table 18, the seedling market for scotch bonnet peppers is projected to increase from 74,287 seedlings in year 1 to 115,145 seedlings by year 10, while the seedling market for sweet peppers including yellow and red sweet pepper is projected to increase from 32,417 seedlings in year 1 to 50,246 seedlings by year 10. The seedling market projections for cabbage increase from 27,572 in year 1 to 42,737 in year 10; for tomato from 20,036 in year 1 to 31,055 in year 10; and for broccoli from 13,495 in year 1 to 20,918 in year 10. Plantain and Banana Based on Table 18, the market for the sale of plantain and banana suckers is projected to increase from a total of 6,504 suckers in year 1 to 10,080 suckers in year 10. Yams The market for the sale of yam mini-setts is projected to increase from 35,575 setts in year 1 to 55,141 setts in year 10. It should be noted that sale of yam mini-setts will be to contract farmers in the GRW growing seed yams for planting material. Fruit Tree Crops The market for fruit tree crop seedlings has been projected conservatively at only 1% of the annual island-wide planting targets under the Fruit Tree Crop Project of the Ministry of Agriculture (see Section 4.3.2 above) in years 1-2 while the Fruit Tree Crop Project is still providing free seedlings to farmers. This would represent only 5.7 hectares of fruit trees annually in years 1-2. It is projected that this market would double to 11.3 hectares of fruit trees annually in years 3-10 after the Fruit Tree Crop Project has ended. At an average planting density of approximately 312 seedlings per hectare, this would imply an annual market of 1,770 fruit tree crop seedlings for the
Feasibility Study for R2RW Nursery – Mont Pellier, St. James
25
R2RW plant nursery in years 1-2, rising to 3,541 seedlings per year in years 3-10 as shown in Table 18. Ornamentals As described in Section 5.3.6 above, the market for ornamental seedlings for the R2RW plant nursery will be very limited, and has been projected conservatively at only 936 seedlings per annum or 10 seedlings per week. Moreover these sales will not be to farmers but directly to end-markets including hotels and householders and would typically be produced based on requests made to the nursey. Timber and Forestry For timber and forestry seedlings, the potential market for the R2RW plant nursery has been limited conservatively to the pool of actual requests for seedlings from the western parishes, who are seeking to establish some 840 hectares in timber and forestry (see Sections 4.3.3 and 5.3.7 above). A recent socio-economic study carried out by the Forestry Department in the Rio Minho Watershed indicated that while 91% of participating farmers would be willing to plant trees if provided with free seedlings, only 66% would be willing to pay for seedlings (at the prevailing price of J$10-15 per seedling charged by the Forestry Department). However as sufficient data is not available to construct a full demand curve for timber and forestry seedlings, and based on the feedback from the market received during the feasibility study, it is conservatively projected that only 1% of the farmers and land holders requesting seedlings will be willing to pay for timber and forestry seedlings at commercial prices. At an average planting density of 1,000 seedlings per hectare, this would translate to a market of 8,398 timber and forestry seedlings per annum for the nursery. 5.5.4 Achievement of Market Projections It should be noted that for vegetable crops and condiments the market acceptance rate (i.e. that percentage of crop area reaped by farmers who purchase seedlings rather than produce their own seedlings in nursery beds) represent very small fractions of the total crop areas for each crop within the project area of marketing influence (the four western parishes of St. James, Hanover, Westmoreland and St. Elizabeth). The achievement of these minimal acceptance rates among farmers will depend on collaboration with other agencies such as RADA (see below) in disseminating the benefits of the R2RW plant nursery to farmers in the GRW and western parishes. It is likely that a gradual approach will see farmers establishing limited plots with commercial seedlings on individual farms to evaluate for themselves the costs and benefits versus self-propagation. It should also be emphasized again that the various market estimates for the selected crops as detailed in Section 5.3 above are all far lower than either the actual annual production figures (see Table 13) or the estimated total aggregate demand for the selected crops based on domestic production and imports (see Table 12). This means that neither the market for the final crops nor the production capacity of the project area are constraints on the ability of the proposed R2RW plant nursery to sell seedlings and other planting materials for vegetable crops, condiments, plantain, banana and yam. The only effective constraint on the market for seedlings and planting materials for these crops produced by the nursery is the acceptance rate by farmers in the GRW and western parishes.
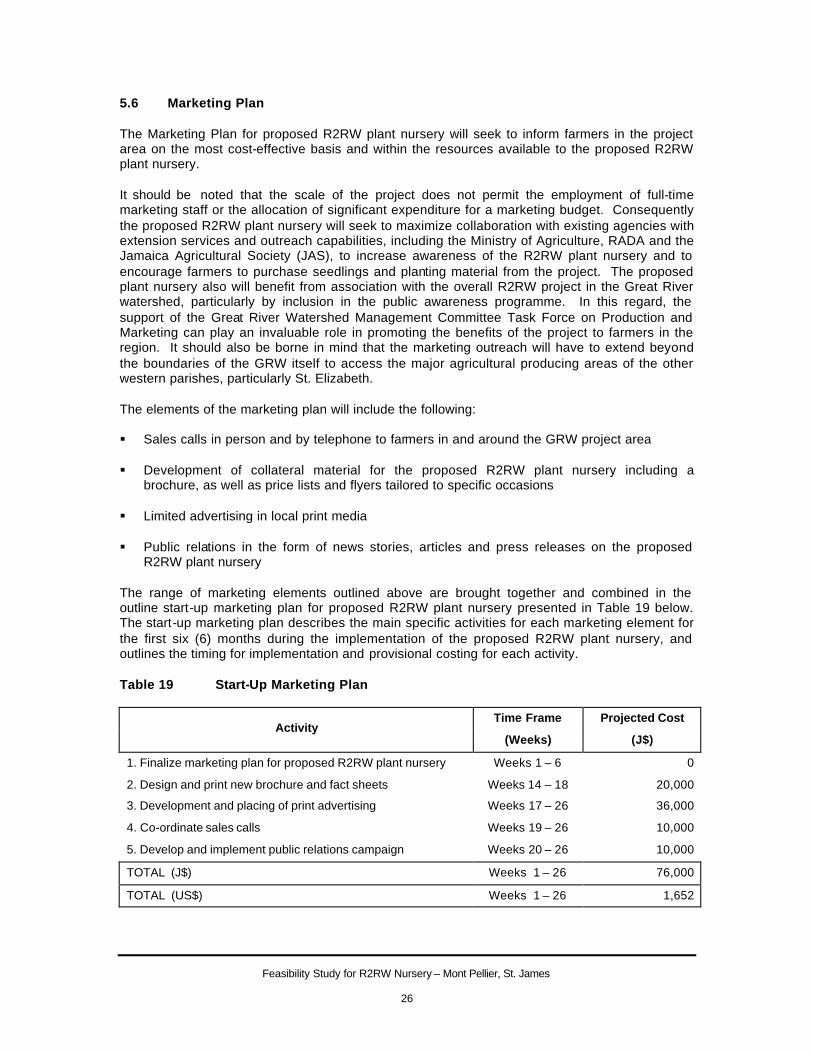
Feasibility Study for R2RW Nursery – Mont Pellier, St. James
26
5.6 Marketing Plan The Marketing Plan for proposed R2RW plant nursery will seek to inform farmers in the project area on the most cost-effective basis and within the resources available to the proposed R2RW plant nursery. It should be noted that the scale of the project does not permit the employment of full-time marketing staff or the allocation of significant expenditure for a marketing budget. Consequently the proposed R2RW plant nursery will seek to maximize collaboration with existing agencies with extension services and outreach capabilities, including the Ministry of Agriculture, RADA and the Jamaica Agricultural Society (JAS), to increase awareness of the R2RW plant nursery and to encourage farmers to purchase seedlings and planting material from the project. The proposed plant nursery also will benefit from association with the overall R2RW project in the Great River watershed, particularly by inclusion in the public awareness programme. In this regard, the support of the Great River Watershed Management Committee Task Force on Production and Marketing can play an invaluable role in promoting the benefits of the project to farmers in the region. It should also be borne in mind that the marketing outreach will have to extend beyond the boundaries of the GRW itself to access the major agricultural producing areas of the other western parishes, particularly St. Elizabeth. The elements of the marketing plan will include the following: § Sales calls in person and by telephone to farmers in and around the GRW project area § Development of collateral material for the proposed R2RW plant nursery including a
brochure, as well as price lists and flyers tailored to specific occasions § Limited advertising in local print media § Public relations in the form of news stories, articles and press releases on the proposed
R2RW plant nursery The range of marketing elements outlined above are brought together and combined in the outline start-up marketing plan for proposed R2RW plant nursery presented in Table 19 below. The start-up marketing plan describes the main specific activities for each marketing element for the first six (6) months during the implementation of the proposed R2RW plant nursery, and outlines the timing for implementation and provisional costing for each activity. Table 19 Start-Up Marketing Plan
Time Frame Projected Cost Activity
(Weeks) (J$)
1. Finalize marketing plan for proposed R2RW plant nursery Weeks 1 – 6 0
2. Design and print new brochure and fact sheets Weeks 14 – 18 20,000
3. Development and placing of print advertising Weeks 17 – 26 36,000
4. Co-ordinate sales calls Weeks 19 – 26 10,000
5. Develop and implement public relations campaign Weeks 20 – 26 10,000
TOTAL (J$) Weeks 1 – 26 76,000
TOTAL (US$) Weeks 1 – 26 1,652

Feasibility Study for R2RW Nursery – Mont Pellier, St. James
27
66..00 OORRGGAANNIIZZAATTIIOONN AANNDD MMAANNAAGGEEMMEENNTT The organizational structure and management aspects of proposed R2RW plant nursery are analysed in this Section 6.0 of the Feasibility Study. 6.1 Management Objectives The main management objectives during the implementation and operating stages of the project are as follows: i. The first management objective is to complete implementation of the project within the
minimum budgeted time. The time planned for the completion of implementation of the project is six (6) months from the preparation of the Feasibility Study.
ii. Completion of implementation of the plan within the targeted investment budget (see Section
7.1 below). iii. Design and implementation of marketing plan as contained in Section 5.6 above. iv. Operation of the nursery within technical plan. v. Achievement and maintenance of targeted income and expenditure levels (see Section 7.3). 6.2 Organizational Structure - Options 6.2.1 Analysis of Options The following are the main forms of legal organization for productive enterprises and other entities in Jamaica: 1. Sole Proprietorship 2. Partnership 3. Company Limited by Share Capital 4. Company Limited by Guarantee 5. Industrial and Provident Society 6. Friendly Society 7. Co-operative Society However several of these legal forms would not be suitable as options for the proposed R2RW plant nursery project for the following reasons:
Legal Form of Organization Reasons for Unsuitability
Sole Proprietorship § Only one person as owner
§ Unlimited liability
Partnership § Unlimited liability
Company Limited by Guarantee § Net Income may not be transferred to the benefit of directors or members
Friendly Society § Objectives are to provide financial assistance to members from contributions
It should be noted that other forms of legal identity such as those established by specific legislation (e.g. for statutory companies) have not been included, as it is unlikely that the small
Feasibility Study for R2RW Nursery – Mont Pellier, St. James
28
scale and limited time frame for implementation of the R2RW plant nursery project will permit such options to be feasible. Of the remaining forms, it is recommended that the proposed R2RW plant nursery project should be established as a company limited by share capital for the following reasons: 1. Flexibility of Establishment and Operation A company limited by share capital offers advantages in flexibility of establishment and operation over provident societies and cooperatives. The degree of ownership participation may be more precisely defined in discrete units and may be attached to an organization or individual (see below). The minimum number of shareholders is two (2), as opposed to a minimum of seven (7) members for provident societies and ten (10) members for cooperatives. A company limited by share capital is also a more conventional vehicle for sourcing funding from financial institutions, should this be required by the R2RW nursery project. 2. Eligibility for Income Tax Exemption A company engaged in agriculture is eligible for exemption from the payment of income tax (see Section 6.4.1 below). This benefit is also available to provident societies and cooperatives. A company limited by share capital therefore is on equal footing with these options in this regard, while providing other advantages which provident societies and cooperatives do not provide. 3. Congruence of Form and Objectives A company limited by share capital provides a greater congruence between the organizational form and the objectives of the R2RW plant nursery than the other options. Provident societies and cooperatives are established to provide various types of benefits to their members and typically involve regular contributions or dues from members. As it is proposed that the R2RW plant nursery will be a long-term sustainable enterprise which will depend on the generation of financial surpluses for its survival, it is more appropriate for the nursery to be structured as a profit-making company. 4. Ownership by Organizations Provident societies and cooperatives are typically formed by an association of individual members, who have a single vote in the direction of the organization regardless of their individual inputs. However it is proposed that the ownership of the R2RW plant nursery may involve participation by other organizations (see below) as opposed to individual persons. A company limited by share capital allows for ownership of shares by organizations or by individuals and is thus more appropriate for the project. 6.2.2 Potential Participants in Ownership It is proposed that the R2RW plant nursery will be established with participation by stakeholders who may be potential partners in its ownership. A number of potential partners are analysed below with respect to their potential participation in the ownership of the proposed R2RW plant nursery. Social Development Commission The Social Development Commission (SDC) has a precedent in assuming an ownership role in community-based projects, particularly projects funded through the SDC. However the SDC is presently in the process of relinquishing the role of ownership in favour of direct ownership of community-based projects by CBOs. In addition the responsibility for ownership in community
Feasibility Study for R2RW Nursery – Mont Pellier, St. James
29
economic enterprises has been devolved from the SDC to the Ministry of Industry, Investment and Commerce. At this time therefore the SDC is not considered to be an appropriate candidate for participation in the ownership of the proposed R2RW plant nursery. Jamaica Agricultural Society The Jamaica Agricultural Society (JAS) is a membership association of farmers island-wide, with branches in every parish. The JAS is involved in commercial activities including operating a number of farm stores and farmers markets including a farmers market at Montpelier, St. James. The JAS also engages in extension services to farmers and stages seminars and farm shows. However the JAS has not engaged in direct farming or nursery projects in the past, and its track record in operating commercial ventures efficiently is not strong. The JAS is nevertheless recommended as a candidate for participation in the ownership of the proposed R2RW plant nursery for the following reasons: § The members of the JAS will be important potential purchasers of seedlings and planting
material from the R2RW plant nursery, particularly for vegetables and condiments, plantain, bananas and yam (see Section 5.3 above)
§ The members of the JAS are farmers possessing knowledge of agricultural production and
markets § The JAS is already a legal entity of long standing capable of taking ownership of shares in
the nursery company § Under the proposed management structure (see Section 6.4.1 below) the JAS will not be
required to play a role in the day-to-day management of the nursery Sandals/RADA/Mafoota Farmers Group The Sandals/RADA/Mafoota Farmers Group comprises a number of farmers in the Mafoota community who have entered into marketing arrangements with the assistance of RADA to supply the Sandals hotels in Montego Bay with a range of exotic and local vegetables. Presently in the Mafoota area there are approximately 28 hectares under cultivation including some 18 hectares of exotic vegetables, with some 10-14 farmers active in the group. The farmers have commenced the process of registering as a cooperative society, but do not yet exist as a separate legal entity. The Sandals/RADA/Mafoota Farmers Group is recommended as a candidate for participation in the ownership of the proposed R2RW plant nursery for the following reasons: § The Sandals/RADA/Mafoota Farmers Group will be an important potential purchaser of
seedlings from the R2RW plant nursery, particularly for vegetables and condiments (see Section 5.3.1 above)
§ The members of the group are farmers possessing knowledge of agricultural production and
markets § The group has already commenced the process of forming a legal entity capable of taking
ownership of shares in the nursery company § Participation in the ownership in the nursery will contribute to building the capacity of the
group and have a demonstration effect as a model to other potential farmers groups and CBOs in the GRW and project area
Feasibility Study for R2RW Nursery – Mont Pellier, St. James
30
Montpelier Citrus Company The Montpelier Citrus Company (MCC) is a private company which owns and operates the citrus nursery at Monteplier, St. James, as well as operating the 1,700 acre citrus farm formerly of the Jamaica Orange Company. The MCC has the technical and administrative capacity to manage a seedling nursery, even for crops other than citrus. However, it is unlikely that the MCC would consider an equity investment in a project such as the proposed R2RW plant nursery which is outside its core business of citrus farming and processing. At this time therefore the MCC is not considered to be an appropriate candidate for participation in ownership of the proposed R2RW plant nursery. However it is proposed that the MCC will provide professional nursery management under a cost-sharing arrangement with the R2RW plant nursery (see Section 6.4.1 below). ESOP An Employee Share Ownership Plan (ESOP) is an employee benefit programme governed and regulated by the ESOP Act 1994, under which a trust holds company shares on behalf of the employees who are participants in the ESOP. An ESOP may include full-time and part-time employees. An ESOP is recommended as a candidate for participation in the ownership of the proposed R2RW plant nursery for the following reasons: § Participation in an ESOP provides an incentive to employees and increases long-term
commitment to the project § Shares in an ESOP may be redeemed by the company upon termination of employment of a
participating staff member Other Community-Based Organizations In addition to the Sandals/RADA/Mafoota Farmers Group, other CBOs or farmers groups in the GRW and project area should be considered for participation in the ownership of the proposed R2RW plant nursery once they satisfy the following criteria: § Organized as legal entities § Purchase seedlings and planting material from the R2RW plant nursery The degree of ownership participation of such CBOs or farmers groups may be linked to the volume of purchases which they make from the R2RW plant nursery. Great River Watershed Management Committee The Great River Watershed Management Committee (GRWMC) will play an important role in the implementation of the overall R2RW project and in the long-term management of the GRW. However the GRWMC is not a legal entity which can own shares in the R2RW plant nursery. Consequently although the Committee can play an important role in increasing public awareness and support for the project, the GRWMC is not considered to be a potential candidate for participation in ownership of the proposed R2RW plant nursery. 6.3 Review of Community Nurseries The data collection and interviews carried out during the preparation of the Feasibility Study revealed several references to community nurseries in Jamaica. During interviews with industry sources, references also were made to previous attempts to establish collaborative approaches to seedling production.
Feasibility Study for R2RW Nursery – Mont Pellier, St. James
31
6.3.1 Examples of Community Nurseries: 1994-2001 A summary of the main references to examples of various types of community nurseries implemented in Jamaica over the period 1994-2001 is presented in Table 20 below. It may be noted that the majority of the projects listed (6 out of 10) were actually implemented by organizations such as NGOs, a donor agency and a tertiary agricultural institution, and only four (4) projects (those implemented in St. Thomas, Bluefields, Maggotty and Buff Bay) were implemented by community-based organizations (CBOs). Under the Agricultural Export Services Project funded by USAID in the 1990s, a component of the project included the propagation of seedlings for peppers and callaloo by selected farmers on a scale large enough to meet the requirements of other farmers participating in the project. However, this did not involve a truly co-operative structure, as the farmers selected for seedling propagation carried out seedling production on individual plots with funding provided by the project. Nor did this approach continue after the funding for the project came to an end. Another reference is to the seedling nursery established at Brook Lodge by the Jamaica Conservation and Development Trust (JCDT) under the Reforestation Project in the Blue and John Crow Mountains National Park with funding by the European Union. This involves a small seedling nursery of approximately 390 sq. m. (4,200 sq. ft.), producing primarily hardwood and fruit tree crop seedlings such as mahogany, cedar and peach, as well as a smaller quantity of ornamentals. This particular project is presently in transition as the donor funding by the EU comes to an end, and a viable long-term structure is being sought which would involve the participation of the Local Advisory Committee of the Blue and John Crow Mountains National Park (BJCMNP) and the Community Development Committee established under the Social Development Commission (SDC). It may be noted that in most plant nurseries in Jamaica there is typically a differentiation of tasks by gender, with the field operations being carried out by male laborers and the tasks of potting being carried out by females. 6.3.2 Lessons From Experiences of Community Nurseries As the table shows, most of the community nursery projects have not been successful, and the nurseries have not survi ved. In fact, it may be noted that of the three (3) projects which may be judged to have been successful to date, one was implemented by an NGO, another by CASE, and only one successful project was implemented by a CBO (BUBADAC). The main problems cited in respect of community nurseries which have contributed to their failure include the following: § Inadequate technical and managerial capabilities of the organizations responsible for the
operation of the nurseries § The lack of a co-operative tradition among farmers in Jamaica § Lack of long-term commitment by community members to nurseries established under donor-
funded projects § Self-interest among participating community members overriding collaboration § Dishonesty in management (one project)
Feasibility Study for R2RW Nursery – Mont Pellier, St. James
32
§ Praedial larceny (one project) It is also instructive to look at the examples of those nursery projects which have succeeded, and the factors which may have contributed to their success. The most important factor which is common to all these projects is that they each had linkage to the technical and managerial capabilities required for nursery operations. In the case of the projects implemented at Hope Gardens and Passley Gardens by the National Arboretum Foundation and the College of Agriculture, Science and Education (CASE) respectively, the implementing agencies are themselves repositories of technical knowledge which would benefit the nurseries directly. In the case of the project in Buff Bay, the seedling nursery was established at the Gideon Education Centre, a religious school in Buff Bay, on the property of the Chairman of the school. The Chairman has agricultural training and provides direct supervision to the project. The project also has established a linkage to CASE which further strengthens its access to technical support. The seedling nursery established by the JCDT with funding by the EU is also relevant to the proposed R2RW plant nursery, as an example of a nursery project making a transition from donor funding to long-term sustainability. The role played by the JCDT as an established NGO has included technical and managerial supervision, as well as providing an organizational structure with the legal status and capacity to take ownership of the capital assets provided by the donor in the implementation of the project, including motor vehicles. 6.4 Implementation and Management 6.4.1 Recommended Organizational Structure Legal Status As noted under Section 6.2.1 above, it is recommended that the R2RW plant nursery will be organized as a Company Limited by Share Capital. Under the provisions of the Income Tax Act, companies which derive their income from agriculture are eligible for exemption from the payment of income tax for a period of ten (10) years, with the exemption being renewable. It is proposed therefore that the R2RW plant nursery will apply for income tax exemption after company formation. The nursery may be established with an authorized share capital allowing for long-term expansion of share ownership. Capital contributions by USAID/R2RW in excess of authorized share capital will be entered to the capital reserve of the company. Initially a minimum of two (2) shares must be issued, e.g. to USAID and Associates in Rural Development, Inc., as nominal shareholders Thereafter additional shares may be issued to appropriate participants in ownership (see Section 6.2.2 above) over the remaining two (2) years of implementation of the overall R2RW project (which will be the first 2 years of the nursery project). At the end of the R2RW project, the shares held by the initial nominal shareholders may be assigned to appropriate participants in ownership. This structure will enable expansion of ownership and issuance of shares without incurring any transfer tax or other costs other than the initial company formation costs and stamp duty on the authorized share capital. However transfer tax would be applicable on any subsequent transfer of shares from an existing shareholder to another participant in ownership of the plant nursery company. Board of Directors It is proposed that the Board of Directors of the plant nursery company will include the following: § Representatives of the NGOs, CBOs and farmers groups which are participants in ownership
in the R2RW plant nursery company

Feasibility Study for R2RW Nursery – Mont Pellier, St. James
33
§ A representative of an ESOP (if applicable) § Other suitable persons nominated by the shareholders and the Production and Marketing
Task Force of the GRWMC, and elected by the shareholders The following statutory officers of the Board of Directors will be elected by the members of the Board from their numbers: § Chairman § Secretary § Treasurer The responsibilities of the Board of Directors will include the following: § Overall supervision of nursery project § Supervision of farm manager § Selection of crops and production targets § Recruitment and termination of staff § Auditing and statutory compliance § Securing financial resources § Dividend and investment policy Management and Staffing It is proposed that the day-to-day management of the R2RW plant nursery will be carried out by a trained and experienced plant nursery manager, under a cost-sharing agreement with the Montpelier Citrus Company which presently employs a full-time plant nursery manager for their citrus seedling nursery located adjacent to the proposed site of the R2RW plant nursery. The required staffing for the R2RW plant nursery is outlined below:
Position Number
Nursery Manager * 1
Security Guards 2
Workers: Nursery/Potting/Other 8
Propagation Specialist 1
Total (Year 1) 12
* Nursery Manager salary shared with MCC The responsibilities of the farm manager will include the following: § Supervision of nursery staff § Implementation of production plan § Adherence to technical requirements § Marketing and sales The proposed organizational structure of the R2RW plant nursery is set out below in Figure 5.
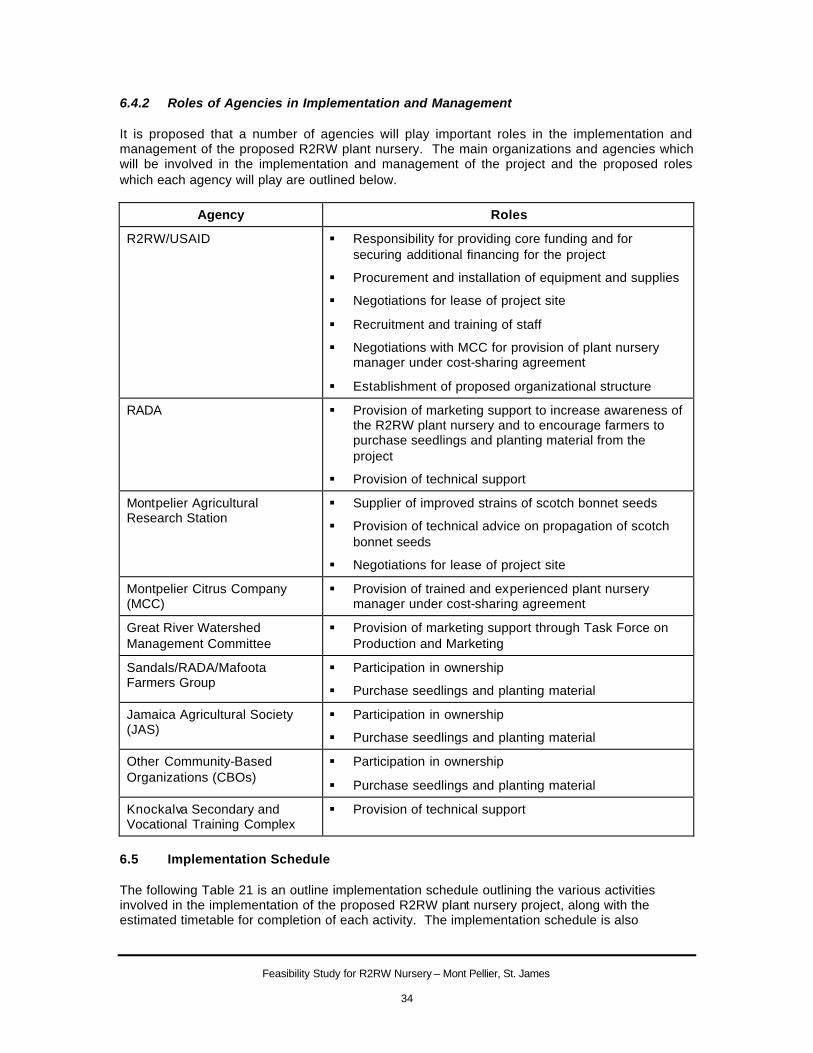
Feasibility Study for R2RW Nursery – Mont Pellier, St. James
34
6.4.2 Roles of Agencies in Implementation and Management It is proposed that a number of agencies will play important roles in the implementation and management of the proposed R2RW plant nursery. The main organizations and agencies which will be involved in the implementation and management of the project and the proposed roles which each agency will play are outlined below.
Agency Roles
R2RW/USAID § Responsibility for providing core funding and for securing additional financing for the project
§ Procurement and installation of equipment and supplies
§ Negotiations for lease of project site
§ Recruitment and training of staff
§ Negotiations with MCC for provision of plant nursery manager under cost-sharing agreement
§ Establishment of proposed organizational structure
RADA
§ Provision of marketing support to increase awareness of the R2RW plant nursery and to encourage farmers to purchase seedlings and planting material from the project
§ Provision of technical support
Montpelier Agricultural Research Station
§ Supplier of improved strains of scotch bonnet seeds
§ Provision of technical advice on propagation of scotch bonnet seeds
§ Negotiations for lease of project site
Montpelier Citrus Company (MCC)
§ Provision of trained and experienced plant nursery manager under cost-sharing agreement
Great River Watershed Management Committee
§ Provision of marketing support through Task Force on Production and Marketing
Sandals/RADA/Mafoota Farmers Group
§ Participation in ownership
§ Purchase seedlings and planting material
Jamaica Agricultural Society (JAS)
§ Participation in ownership
§ Purchase seedlings and planting material
Other Community-Based Organizations (CBOs)
§ Participation in ownership
§ Purchase seedlings and planting material
Knockalva Secondary and Vocational Training Complex
§ Provision of technical support
6.5 Implementation Schedule The following Table 21 is an outline implementation schedule outlining the various activities involved in the implementation of the proposed R2RW plant nursery project, along with the estimated timetable for completion of each activity. The implementation schedule is also
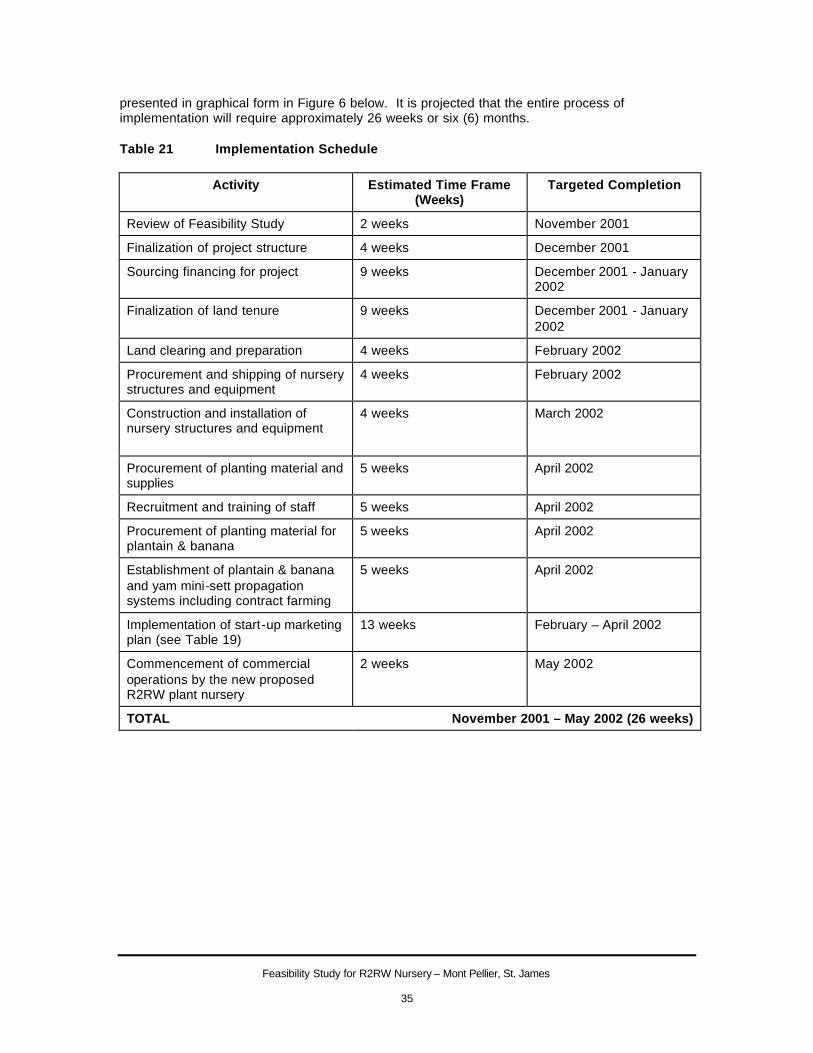
Feasibility Study for R2RW Nursery – Mont Pellier, St. James
35
presented in graphical form in Figure 6 below. It is projected that the entire process of implementation will require approximately 26 weeks or six (6) months. Table 21 Implementation Schedule
Activity Estimated Time Frame (Weeks)
Targeted Completion
Review of Feasibility Study 2 weeks November 2001
Finalization of project structure 4 weeks December 2001
Sourcing financing for project 9 weeks December 2001 - January 2002
Finalization of land tenure 9 weeks December 2001 - January 2002
Land clearing and preparation 4 weeks February 2002
Procurement and shipping of nursery structures and equipment
4 weeks February 2002
Construction and installation of nursery structures and equipment
4 weeks March 2002
Procurement of planting material and supplies
5 weeks April 2002
Recruitment and training of staff 5 weeks April 2002
Procurement of planting material for plantain & banana
5 weeks April 2002
Establishment of plantain & banana and yam mini-sett propagation systems including contract farming
5 weeks April 2002
Implementation of start-up marketing plan (see Table 19)
13 weeks February – April 2002
Commencement of commercial operations by the new proposed R2RW plant nursery
2 weeks May 2002
TOTAL November 2001 – May 2002 (26 weeks)
Feasibility Study for R2RW Nursery – Mont Pellier, St. James
36
77..00 FFII NNAANNCCII AALL AANNAALLYYSSII SS The Feasibility Study seeks to make projections for the proposed R2RW plant nursery and carry out an analysis of the financial viability of the project over the next ten (10) years from 2002-2011 on the basis of the project as defined in the previous Sections of the Study. The financial analysis includes a budget of the estimated capital expenditure for the proposed R2RW plant nursery, and includes 10-year Financial Projections for Income and Expenditure Statements; Cash Flow; Sources and Uses of Funds; and Balance Sheet, as well as Ratio Analysis and Sensitivity Analysis. All figures are in United States dollars unless otherwise indicated. No provision has been made for inflation of revenues or costs (i.e. all financial values are in constant dollars). A fixed exchange rate of J$47.00:US$1.00 has been assumed over the period of the financial projections. 7.1 Project Investment Cost and Financing Financial Table 1 details the components of the total capital expenditure for the proposed R2RW plant nursery, which is estimated at US$100,055 (J$4,702,589). The main expenditure is for nursery construction which is estimated at US$43,293 (J$2,034,788), including the cost of a shade house at US$18,191 (J$854,988) and the proposed screen house at US$10,838 (J$509,400). The cost of irrigation equipment is estimated at US$4,427 (J$208,057), including the cost of a misting propagator. The cost of nursery materials and equipment is estimated at US$13,680 (J$642,955), including the cost of miscellaneous small tools and equipment. The budget for perimeter fencing is estimated at US$17,547 (J$824,691) and at US$5,106 (J$240,000) for internal roadway works. Land preparation costs for the nursery are estimated at US$1,277 (J$60,000). Provision is made for start-up marketing costs at US$1,617 (J$76,000), and for start-up development costs at US$1,064 (J$50,000). Working capital requirement is projected at US$7,644 (J$359,274). A contingency of US$4,401 (J$206,825) is included representing 5% of the capital cost items. The main items of capital expenditure are presented in detail in Financial Tables 1a-1c. As shown in Financial Table 1, it is proposed that the total capital expenditure costs will be financed by funding of US$56,078 (J$2,635,670) or 56.05% of the total project cost from the USAID R2RW budget committed to the proposed R2RW plant nursery, and by new funding of US$43,977 (J$2,066,920) or 43.95% of the total project cost to be solicited from other sources such as the Jamaica Agricultural Development Foundation (JADF), over the period of implementation of the project. For the purposes of this study no financial costs have been included for the additional funding to be solicited. The foreign exchange component of the total capital expenditure is projected at US$42,238, or 42.21% of the total capital cost (see Financial Table 2). 7.2 Projected Production and Annual Income Total annual production by the proposed R2RW plant nursery as shown in Financial Table 4 is projected to rise from 295,651 units in year 1, to 323,983 units in year 2 and to 453,441 units in year10, where units include seedlings, suckers and mini-setts. The total annual production of seedlings for vegetables and condiments and suckers for plantain and banana are based on the estimated acceptance rates in annual crop area reaped in the GRW and the project area as set out in Tables 16a and 16b (see Section 5.5 above). The total annual production of yam mini-setts is based on the maximum production capacity of the nursery as an upper bound on its output, as the potential market for yam mini-setts is greater than the potential production of the nursery. It should be noted that the projections in the study for yam

Feasibility Study for R2RW Nursery – Mont Pellier, St. James
37
mini-setts are for sales to contract farmers who will grow out the setts into seed yams as planting material for yam farmers in the GRW and project area. The projections for total annual production of seedlings for fruit tree crops, ornamentals, timber and forestry species are based on the market assumptions set out in Table 18 (see Section 5.5 above). Financial Table 4b presents a Production Capacity Analysis, which shows that the annual production is projected at 36.4% of the total maximum production capacity of the nursery in year 1, rising to 39.9% production capacity utilization in year 2, and to 55.79% production capacity utilization in year 10. Total Annual Income for the proposed R2RW plant nursery is shown in Financial Table 5, based on the annual production projections. A mortality rate of 10% is assumed for seedlings/suckers/setts produced by the nursery. Consequently the number of seedlings/suckers/setts sold is equal to the number of seedlings/suckers/setts produced annually less the 10% mortality rate. The projected sales prices per unit for seedlings, suckers and mini-setts are also presented in Financial Table 5, based on prevailing market prices for seedlings, suckers and mini-setts by crop. On the basis of the annual production projections and the projected unit sales prices, the Total Annual Income for proposed R2RW plant nursery is estimated at US$86,853 (J$4,082,109) in year 1, rising to US$95,060 (J$4,467,835) in year 2 and at US$133,498 (J$6,274,412) in year 10. 7.3 Annual Expenditure 7.3.1 Direct Costs The projected direct costs for the operation of the plant nursery are presented in Financial Table 4a, based on the annual production projections. The total direct costs including potting mix, seedling bags, soil, sand, manure, fertilizer, fungicide, pesticide, sawdust, and planting material are projected at US$15,698 (J$737,818) in year 1, rising to US$17,025 (J$800,157) in year 2 and at US$24,341 (J$1,144,036) in year 10. The detailed assumptions for each item of direct cost are included in the notes to Financial Table 4a. 7.3.2 Planting Material The cost of planting material for the proposed plant nursery is detailed in the notes to Financial Table 4a. Seeds for the selected vegetables and condiments are readily available from local commercial suppliers such as Agro Grace Limited, or directly from major suppliers in the United States. Plantain and banana suckers will be obtained by vegetative propagation from initially imported stock. Yam mini-setts will be prepared from yams purchased at farmgate prices from yam farmers within the GRW and project area. Seeds for scotch bonnet pepper will be obtained from the Montpelier Research Station where improved strains are being developed under a project funded by the Food and Agriculture Organization (FAO). The sourcing of planting material for seedling production of fruit tree crops is more complex, as these crops are propagated either from collection of seeds in the field, by grafting, or by a combination of these methods. For the proposed R2RW plant nursery, it is assumed for the purposes of the Feasibility Study that the techniques of grafting and transposing plant propagules will be carried out by a plant propagation specialist to be trained and employed by the project. Consequently the sources of planting material for fruit tree crops will be by collection of seeds from farmers and food processors (particularly ackee and mango) and grafting from mother wood fruit trees to be identified and accessed within the GRW and project area.
Feasibility Study for R2RW Nursery – Mont Pellier, St. James
38
Planting material for seedling production of ornamentals will be sourced from other ornamental nurseries, from grafting from mother plants, and even from tissue-cultured material from the genetic bank of the Scientific Research Council (SRC). Planting material for production of timber and forestry seedlings will be by collection of seeds from the field and from land holders within the GRW. 7.3.3 Total Annual Expenditure Total Annual Expenditure for the project is estimated at US$91,730 (J$4,311,289) in year 1, rising to US$93,930 (J$4,414,732) in year 2 and US$118,576 (J$5,573,087) in year 10 (see Financial Table 6). Total annual expenditure including direct costs and overheads is estimated at 105.61% of total sales revenue in year 1, 98.81% in year 2 and 88.82% in year 10. The detailed assumptions for each item of overhead cost are included in the notes to Financial Table 6. Financial Table 3 shows the projected depreciation and amortization schedule on a straight -line basis over the first ten (10) years of the project. 7.4 Projected Financial Statements The pro forma ten (10) year financial statements for the project as presented in this section are based on the financing and operating assumptions set out above. 7.4.1 Pro Forma Ten (10) year Income Statement Financial Tables 6 and 7 present a projected ten (10) year income statement and vertical analysis for the project. The Annual Net Income for the project is estimated at a deficit of -US$4,876 (-J$229,180) in year 1 of the project, moving to a positive US$1,130 (J$53,103) in year 2 and to an estimated annual net income of US$14,922 (J$701,325) in year 10 of the project. The project is estimated to generate a cumulative positive net balance of US$99,314 (J$4,667,764) by the end of year 10. No provision has been made for payment of taxes on company profit, based on the proposed application for tax exemption for proposed R2RW plant nursery. 7.4.2 Pro Forma Ten (10) year Cash Flow Financial Table 8 presents a projected ten (10) year cash flow for the project. The operating net cash flow is projected at US$4,028 (J$189,303) in year 1, moving to US$10,034 (J$471,586) in year 2, and an estimated annual net cash flow of US$23,826 (J$1,119,808) by year 10 of the project. The project is estimated to generate a cumulative cash balance of US$195,997 (J$9,211,869) by the end of year 10. 7.4.3 Pro Forma Ten (10) year Balance Sheet Financial Table 9 presents a projected ten (10) year balance sheet for the project. The net worth of proposed R2RW plant nursery is estimated to rise from US$91,807 (J$4,314,925) in year 1, to US$92,937 (J$4,368,028) in year 2 and to a total estimated net worth of US$195,997 (J$9,211,869) by year 10. The main assets of proposed R2RW plant nursery are the current assets, including cash and short-term investments. No distribution of dividends is assumed over the period of the projections. 7.4.4 Pro Forma Ten (10) year Sources and Uses of Funds Financial Table 10 presents a projected ten (10) year sources and uses of funds statement for the project. As shown in this table, the total source of funds including net income plus depreciation, is projected at US$10,034 (J$471,586) in years 1-2 and at US$23,826 (J$1,119,808) in years 9-10. The main use of funds will be to increase the cash component of current assets.
Feasibility Study for R2RW Nursery – Mont Pellier, St. James
39
7.5 Ratio and Sensitivity Analysis 7.5.1 Ratio Analysis Financial Table 11 presents a ratio analysis of proposed R2RW plant nursery over the 10-year period covered by the Feasibility Study. The Net Present Value (NPV) of the project over 10 years is estimated at US$2,974 (J$139,756) at a real discount rate of 12.00%, while the Internal Rate of Return (IRR) is estimated at 12.71%. Th e total Return on Assets (ROA) is projected at an annual average of 6.71% over years 1-10. The total Return on Investment (ROI) is projected at an annual average of 18.82% over years 1-10. The total Return on Income projected at an annual average of 8.15% over years 1-10. These ratios reflect the viable levels attained by the financial projections for the project over the first ten (10) years. 7.5.2 Sensitivity Analysis As shown in Financial Table 12, the project will be relatively sensitive to increases in its operating costs, with a 10% increase in total operating expenses producing a -93% decline in estimated net income in year 4, all other factors being constant. The project is even more sensitive to fluctuations in its projected income levels, with a 10% decline in estimated income producing a -103% decline in estimated net income in year 4.
Feasibility Study for R2RW Nursery – Mont Pellier, St. James
40
88..00 CCOONNCCLLUUSSIIOONN The Feasibility Study as structured in this proposal will generate adequate income to fund the operating costs of proposed R2RW plant nursery over the 10-year period covered by the plan. However the projections are conservative and the proposed R2RW plant nursery will have to adopt a sustained marketing plan to maintain targeted income levels.

Feasibility Study for R2RW Nursery – Mont Pellier, St. James
41
TTAABBLLEESS Table 1 Land Capability: Project Area Parish CLASS I CLASS II CLASS III CLASS IV CLASS V CLASS VI CLASS VII TOTAL
St. James 688 5,119 5,504 7,548 6,313 30,089 182 55,443
Hanover 352 6,208 6,556 7,649 7,293 17,655 2,367 48,080
Westmoreland 2,182 19,024 10,001 9,281 7,902 26,802 1 75,193
St. Elizabeth 2,223 20,160 27,884 1,349 11,868 39,722 2,023 105,229
Total: Project Area 5,445 50,512 49,945 25,826 33,377 114,267 4,574 283,945
Total: % 1.92% 17.79% 17.59% 9.10% 11.75% 40.24% 1.61% 100.00%
Unit: Hectares Source: University of the West Indies Legend CLASS I level land with no factors limiting agricultural cultivation CLASS II Suitable for cultivation with slight limitations CLASS III Suitable for cultivation with major limitations CLASS V Non-arable land CLASS VI Non-Arable land which should never be cleared of natural vegetation CLASS VII Land of no productive agricultural use Parish (Acres) CLASS I CLASS II CLASS III CLASS IV CLASS V CLASS VI CLASS VII TOTAL
St. James 1,700 12,650 13,600 18,650 15,600 74,350 450 137,000
Hanover 870 15,340 16,200 18,900 18,020 43,625 5,850 118,805
Westmoreland 5,392 47,009 24,712 22,934 19,527 66,227 2 185,803
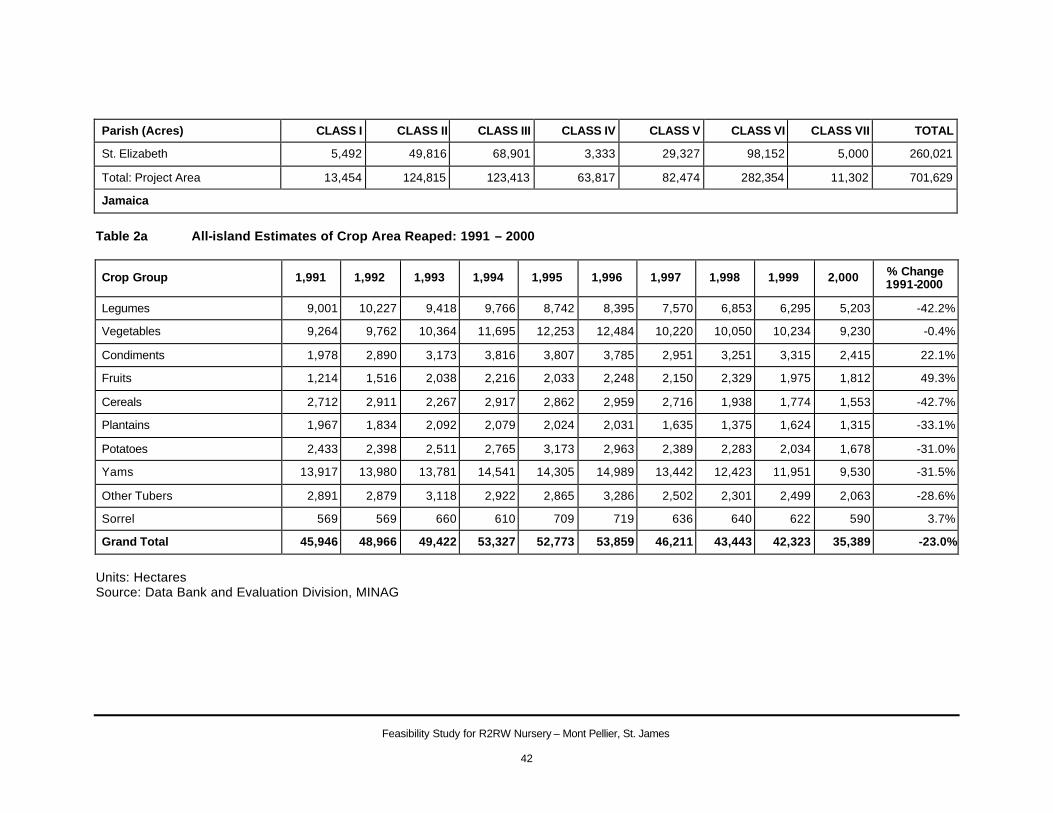
Feasibility Study for R2RW Nursery – Mont Pellier, St. James
42
Parish (Acres) CLASS I CLASS II CLASS III CLASS IV CLASS V CLASS VI CLASS VII TOTAL
St. Elizabeth 5,492 49,816 68,901 3,333 29,327 98,152 5,000 260,021
Total: Project Area 13,454 124,815 123,413 63,817 82,474 282,354 11,302 701,629
Jamaica
Table 2a All-island Estimates of Crop Area Reaped: 1991 – 2000
Crop Group 1,991 1,992 1,993 1,994 1,995 1,996 1,997 1,998 1,999 2,000 % Change 1991-2000
Legumes 9,001 10,227 9,418 9,766 8,742 8,395 7,570 6,853 6,295 5,203 -42.2%
Vegetables 9,264 9,762 10,364 11,695 12,253 12,484 10,220 10,050 10,234 9,230 -0.4%
Condiments 1,978 2,890 3,173 3,816 3,807 3,785 2,951 3,251 3,315 2,415 22.1%
Fruits 1,214 1,516 2,038 2,216 2,033 2,248 2,150 2,329 1,975 1,812 49.3%
Cereals 2,712 2,911 2,267 2,917 2,862 2,959 2,716 1,938 1,774 1,553 -42.7%
Plantains 1,967 1,834 2,092 2,079 2,024 2,031 1,635 1,375 1,624 1,315 -33.1%
Potatoes 2,433 2,398 2,511 2,765 3,173 2,963 2,389 2,283 2,034 1,678 -31.0%
Yams 13,917 13,980 13,781 14,541 14,305 14,989 13,442 12,423 11,951 9,530 -31.5%
Other Tubers 2,891 2,879 3,118 2,922 2,865 3,286 2,502 2,301 2,499 2,063 -28.6%
Sorrel 569 569 660 610 709 719 636 640 622 590 3.7%
Grand Total 45,946 48,966 49,422 53,327 52,773 53,859 46,211 43,443 42,323 35,389 -23.0%
Units: Hectares Source: Data Bank and Evaluation Division, MINAG

Feasibility Study for R2RW Nursery – Mont Pellier, St. James
43
Table 2b All-island Estimates of Crop Production: 1991 – 2000
Crop Group 1,991 1,992 1,993 1,994 1,995 1,996 1,997 1,998 1,999 2,000 % Change 1991-2000
Legumes 8,422 11,278 11,144 11,515 10,463 10,060 8,614 7,400 7,303 5,586 -33.7%
Vegetables 101,199 124,198 147,418 171,955 183,873 192,449 145,923 148,289 161,934 141,102 39.4%
Condiments 10,224 21,274 26,442 38,414 37,439 36,624 25,475 29,037 34,425 30,606 199.4%
Fruits 19,320 29,360 45,178 49,159 45,226 50,542 46,070 51,534 42,807 37,765 95.5%
Cereals 3,491 4,357 3,568 4,078 3,898 4,074 3,150 2,228 2,165 1,781 -49.0%
Plantains 26,692 28,469 35,811 35,374 34,769 33,831 26,340 22,489 27,524 22,332 -16.3%
Potatoes 25,007 30,727 35,897 41,011 47,596 46,993 35,975 35,784 32,666 26,555 6.2%
Yams 186,104 214,387 221,928 233,921 240,371 253,371 212,567 198,402 195,688 147,709 -20.6%
Other Tubers 34,336 42,029 55,353 55,391 58,216 65,980 45,876 42,390 47,626 36,299 5.7%
Sorrel 624 838 978 880 1,101 1,127 938 1,032 1,019 795 27.4%
Grand Total 415,419 506,917 583,717 641,698 662,952 695,051 550,928 538,585 553,157 450,530 8.5%
Units: Hectares Source: Data Bank and Evaluation Division, MINAG Table 2c All-island Estimates of Crop Production per Hectare: 1991 – 2000
Crop Group 1,991 1,992 1,993 1,994 1,995 1,996 1,997 1,998 1,999 2,000 Average 1991-2000
Legumes 0.94 1.10 1.18 1.18 1.20 1.20 1.14 1.08 1.16 1.07 1.12
Vegetables 10.92 12.72 14.22 14.70 15.01 15.42 14.28 14.76 15.82 15.29 14.31
Condiments 5.17 7.36 8.33 10.07 9.83 9.68 8.63 8.93 10.38 12.67 9.11
Fruits 15.91 19.37 22.17 22.18 22.25 22.48 21.43 22.13 21.67 20.84 21.04
Cereals 1.29 1.50 1.57 1.40 1.36 1.38 1.16 1.15 1.22 1.15 1.32
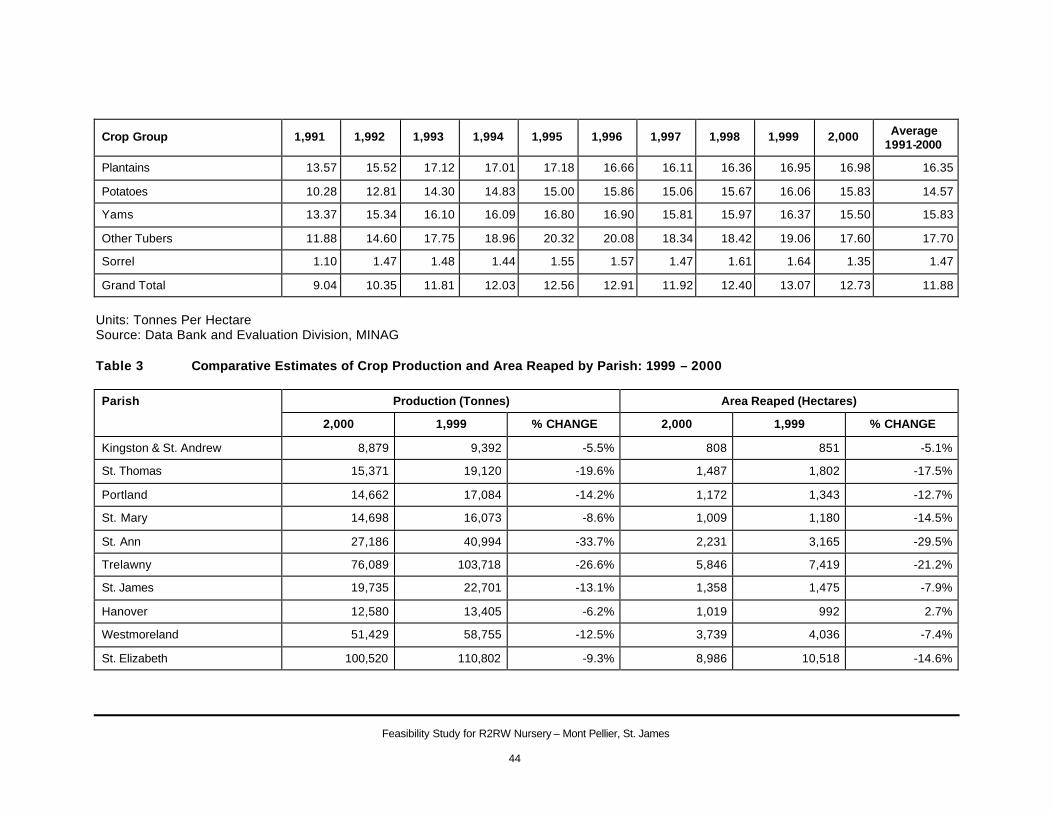
Feasibility Study for R2RW Nursery – Mont Pellier, St. James
44
Crop Group 1,991 1,992 1,993 1,994 1,995 1,996 1,997 1,998 1,999 2,000 Average 1991-2000
Plantains 13.57 15.52 17.12 17.01 17.18 16.66 16.11 16.36 16.95 16.98 16.35
Potatoes 10.28 12.81 14.30 14.83 15.00 15.86 15.06 15.67 16.06 15.83 14.57
Yams 13.37 15.34 16.10 16.09 16.80 16.90 15.81 15.97 16.37 15.50 15.83
Other Tubers 11.88 14.60 17.75 18.96 20.32 20.08 18.34 18.42 19.06 17.60 17.70
Sorrel 1.10 1.47 1.48 1.44 1.55 1.57 1.47 1.61 1.64 1.35 1.47
Grand Total 9.04 10.35 11.81 12.03 12.56 12.91 11.92 12.40 13.07 12.73 11.88
Units: Tonnes Per Hectare Source: Data Bank and Evaluation Division, MINAG Table 3 Comparative Estimates of Crop Production and Area Reaped by Parish: 1999 – 2000
Production (Tonnes) Area Reaped (Hectares) Parish
2,000 1,999 % CHANGE 2,000 1,999 % CHANGE
Kingston & St. Andrew 8,879 9,392 -5.5% 808 851 -5.1%
St. Thomas 15,371 19,120 -19.6% 1,487 1,802 -17.5%
Portland 14,662 17,084 -14.2% 1,172 1,343 -12.7%
St. Mary 14,698 16,073 -8.6% 1,009 1,180 -14.5%
St. Ann 27,186 40,994 -33.7% 2,231 3,165 -29.5%
Trelawny 76,089 103,718 -26.6% 5,846 7,419 -21.2%
St. James 19,735 22,701 -13.1% 1,358 1,475 -7.9%
Hanover 12,580 13,405 -6.2% 1,019 992 2.7%
Westmoreland 51,429 58,755 -12.5% 3,739 4,036 -7.4%
St. Elizabeth 100,520 110,802 -9.3% 8,986 10,518 -14.6%
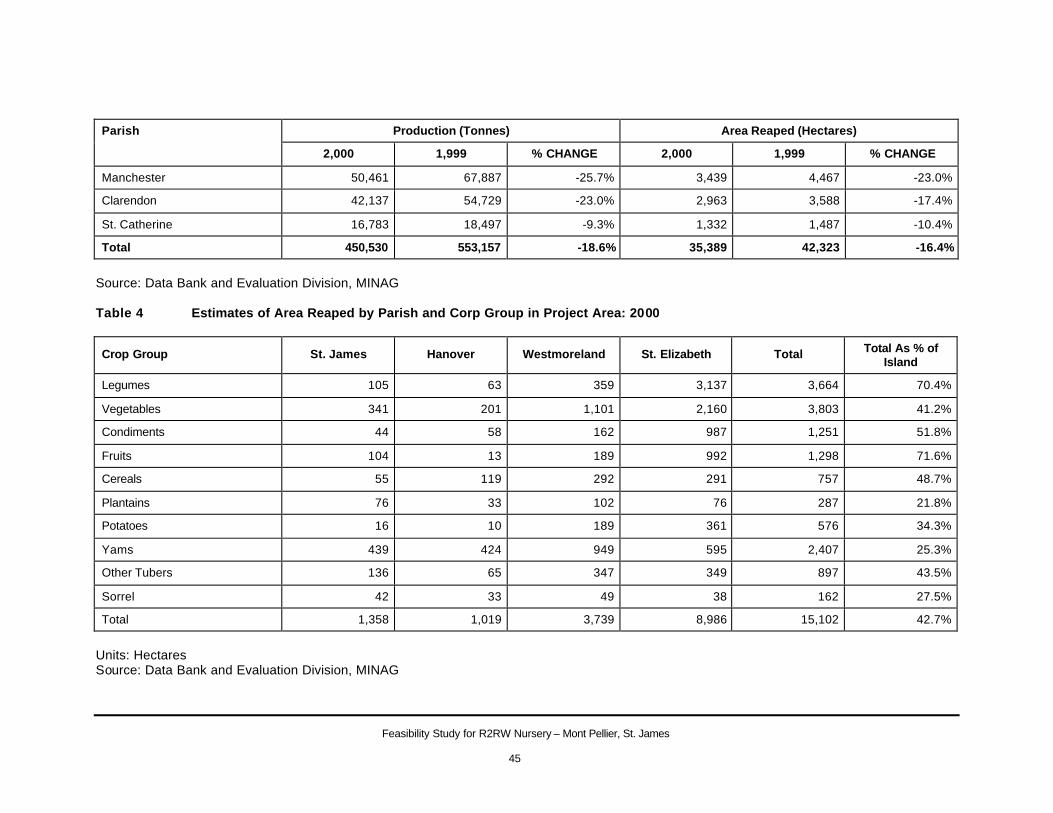
Feasibility Study for R2RW Nursery – Mont Pellier, St. James
45
Production (Tonnes) Area Reaped (Hectares) Parish
2,000 1,999 % CHANGE 2,000 1,999 % CHANGE
Manchester 50,461 67,887 -25.7% 3,439 4,467 -23.0%
Clarendon 42,137 54,729 -23.0% 2,963 3,588 -17.4%
St. Catherine 16,783 18,497 -9.3% 1,332 1,487 -10.4%
Total 450,530 553,157 -18.6% 35,389 42,323 -16.4%
Source: Data Bank and Evaluation Division, MINAG Table 4 Estimates of Area Reaped by Parish and Corp Group in Project Area: 2000
Crop Group St. James Hanover Westmoreland St. Elizabeth Total Total As % of Island
Legumes 105 63 359 3,137 3,664 70.4%
Vegetables 341 201 1,101 2,160 3,803 41.2%
Condiments 44 58 162 987 1,251 51.8%
Fruits 104 13 189 992 1,298 71.6%
Cereals 55 119 292 291 757 48.7%
Plantains 76 33 102 76 287 21.8%
Potatoes 16 10 189 361 576 34.3%
Yams 439 424 949 595 2,407 25.3%
Other Tubers 136 65 347 349 897 43.5%
Sorrel 42 33 49 38 162 27.5%
Total 1,358 1,019 3,739 8,986 15,102 42.7%
Units: Hectares Source: Data Bank and Evaluation Division, MINAG
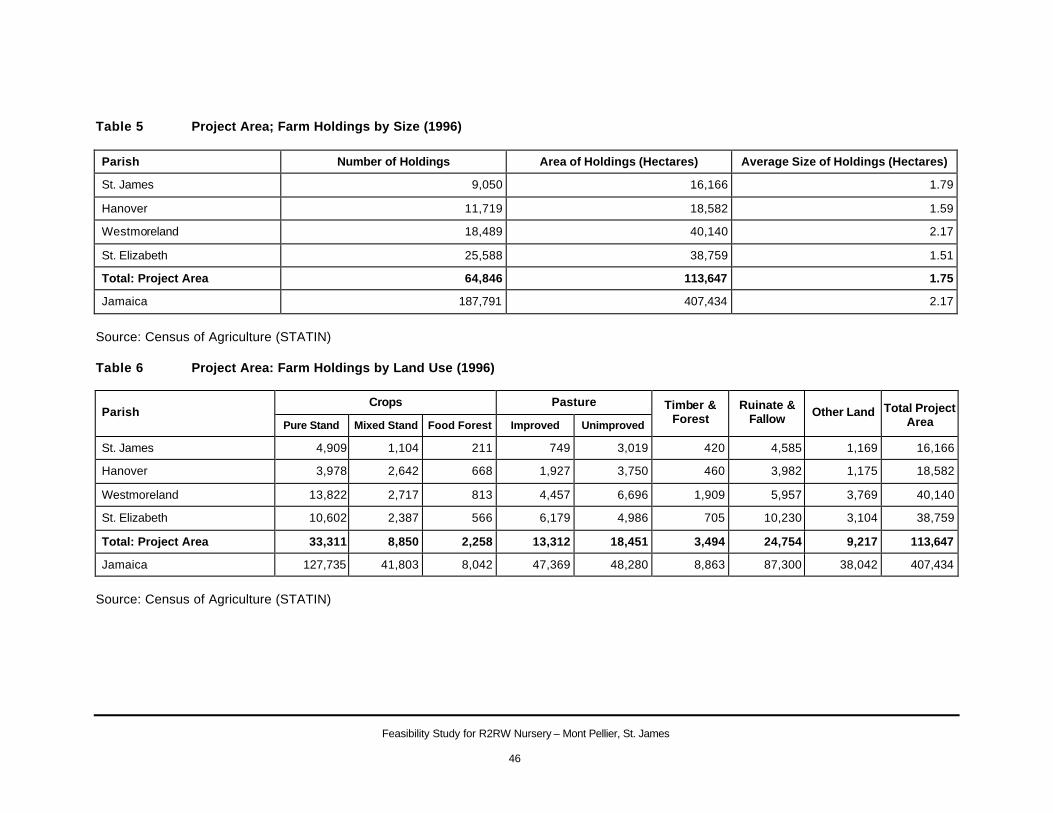
Feasibility Study for R2RW Nursery – Mont Pellier, St. James
46
Table 5 Project Area; Farm Holdings by Size (1996)
Parish Number of Holdings Area of Holdings (Hectares) Average Size of Holdings (Hectares)
St. James 9,050 16,166 1.79
Hanover 11,719 18,582 1.59
Westmoreland 18,489 40,140 2.17
St. Elizabeth 25,588 38,759 1.51
Total: Project Area 64,846 113,647 1.75
Jamaica 187,791 407,434 2.17
Source: Census of Agriculture (STATIN) Table 6 Project Area: Farm Holdings by Land Use (1996)
Crops Pasture Parish
Pure Stand Mixed Stand Food Forest Improved Unimproved
Timber & Forest
Ruinate & Fallow Other Land Total Project
Area
St. James 4,909 1,104 211 749 3,019 420 4,585 1,169 16,166
Hanover 3,978 2,642 668 1,927 3,750 460 3,982 1,175 18,582
Westmoreland 13,822 2,717 813 4,457 6,696 1,909 5,957 3,769 40,140
St. Elizabeth 10,602 2,387 566 6,179 4,986 705 10,230 3,104 38,759
Total: Project Area 33,311 8,850 2,258 13,312 18,451 3,494 24,754 9,217 113,647
Jamaica 127,735 41,803 8,042 47,369 48,280 8,863 87,300 38,042 407,434
Source: Census of Agriculture (STATIN)
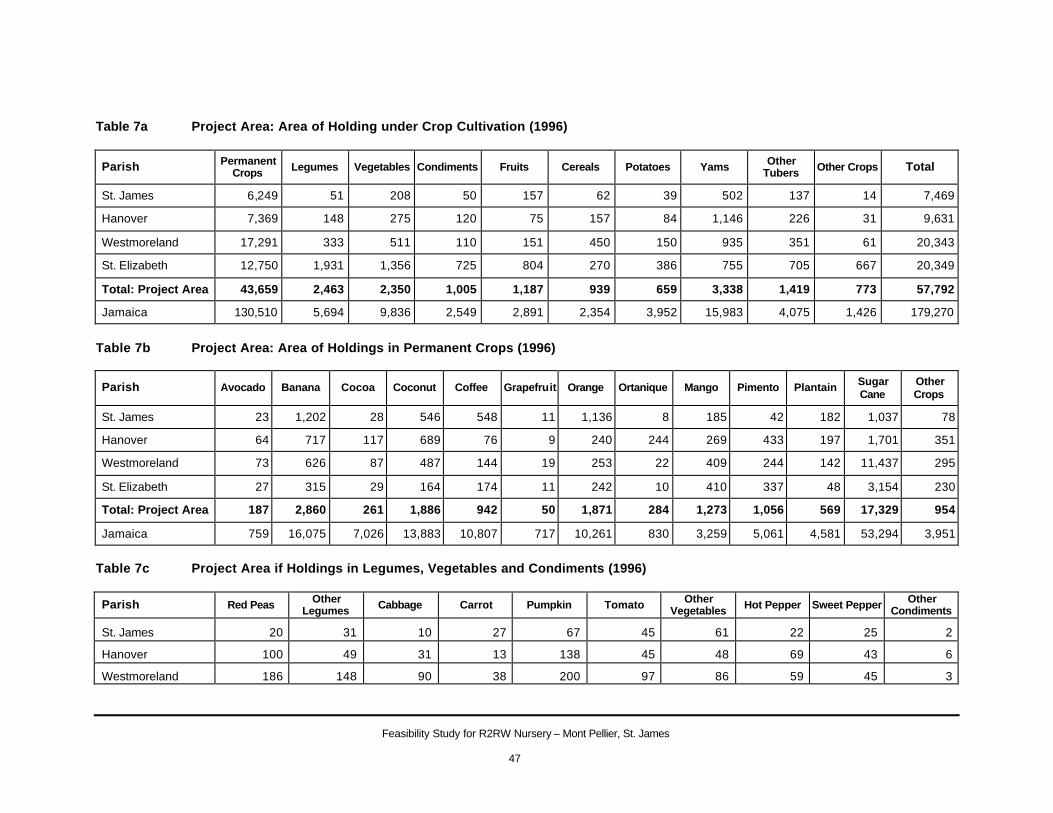
Feasibility Study for R2RW Nursery – Mont Pellier, St. James
47
Table 7a Project Area: Area of Holding under Crop Cultivation (1996)
Parish Permanent Crops Legumes Vegetables Condiments Fruits Cereals Potatoes Yams Other
Tubers Other Crops Total
St. James 6,249 51 208 50 157 62 39 502 137 14 7,469
Hanover 7,369 148 275 120 75 157 84 1,146 226 31 9,631
Westmoreland 17,291 333 511 110 151 450 150 935 351 61 20,343
St. Elizabeth 12,750 1,931 1,356 725 804 270 386 755 705 667 20,349
Total: Project Area 43,659 2,463 2,350 1,005 1,187 939 659 3,338 1,419 773 57,792
Jamaica 130,510 5,694 9,836 2,549 2,891 2,354 3,952 15,983 4,075 1,426 179,270
Table 7b Project Area: Area of Holdings in Permanent Crops (1996)
Parish Avocado Banana Cocoa Coconut Coffee Grapefruit Orange Ortanique Mango Pimento Plantain Sugar Cane
Other Crops
St. James 23 1,202 28 546 548 11 1,136 8 185 42 182 1,037 78
Hanover 64 717 117 689 76 9 240 244 269 433 197 1,701 351
Westmoreland 73 626 87 487 144 19 253 22 409 244 142 11,437 295
St. Elizabeth 27 315 29 164 174 11 242 10 410 337 48 3,154 230
Total: Project Area 187 2,860 261 1,886 942 50 1,871 284 1,273 1,056 569 17,329 954
Jamaica 759 16,075 7,026 13,883 10,807 717 10,261 830 3,259 5,061 4,581 53,294 3,951
Table 7c Project Area if Holdings in Legumes, Vegetables and Condiments (1996)
Parish Red Peas Other Legumes Cabbage Carrot Pumpkin Tomato Other
Vegetables Hot Pepper Sweet Pepper Other Condiments
St. James 20 31 10 27 67 45 61 22 25 2
Hanover 100 49 31 13 138 45 48 69 43 6
Westmoreland 186 148 90 38 200 97 86 59 45 3
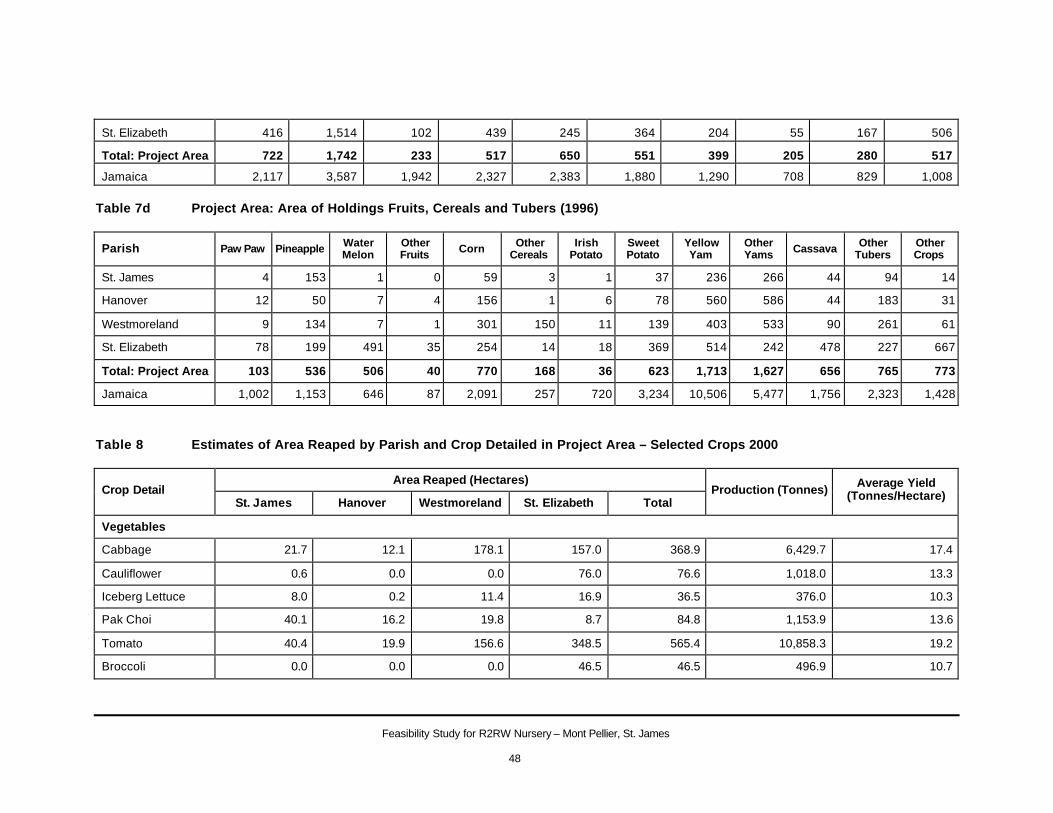
Feasibility Study for R2RW Nursery – Mont Pellier, St. James
48
St. Elizabeth 416 1,514 102 439 245 364 204 55 167 506
Total: Project Area 722 1,742 233 517 650 551 399 205 280 517
Jamaica 2,117 3,587 1,942 2,327 2,383 1,880 1,290 708 829 1,008 Table 7d Project Area: Area of Holdings Fruits, Cereals and Tubers (1996)
Parish Paw Paw Pineapple Water Melon
Other Fruits Corn Other
Cereals Irish
Potato Sweet Potato
Yellow Yam
Other Yams Cassava Other
Tubers Other Crops
St. James 4 153 1 0 59 3 1 37 236 266 44 94 14
Hanover 12 50 7 4 156 1 6 78 560 586 44 183 31
Westmoreland 9 134 7 1 301 150 11 139 403 533 90 261 61
St. Elizabeth 78 199 491 35 254 14 18 369 514 242 478 227 667
Total: Project Area 103 536 506 40 770 168 36 623 1,713 1,627 656 765 773
Jamaica 1,002 1,153 646 87 2,091 257 720 3,234 10,506 5,477 1,756 2,323 1,428
Table 8 Estimates of Area Reaped by Parish and Crop Detailed in Project Area – Selected Crops 2000
Area Reaped (Hectares) Crop Detail
St. James Hanover Westmoreland St. Elizabeth Total Production (Tonnes) Average Yield
(Tonnes/Hectare)
Vegetables
Cabbage 21.7 12.1 178.1 157.0 368.9 6,429.7 17.4
Cauliflower 0.6 0.0 0.0 76.0 76.6 1,018.0 13.3
Iceberg Lettuce 8.0 0.2 11.4 16.9 36.5 376.0 10.3
Pak Choi 40.1 16.2 19.8 8.7 84.8 1,153.9 13.6
Tomato 40.4 19.9 156.6 348.5 565.4 10,858.3 19.2
Broccoli 0.0 0.0 0.0 46.5 46.5 496.9 10.7
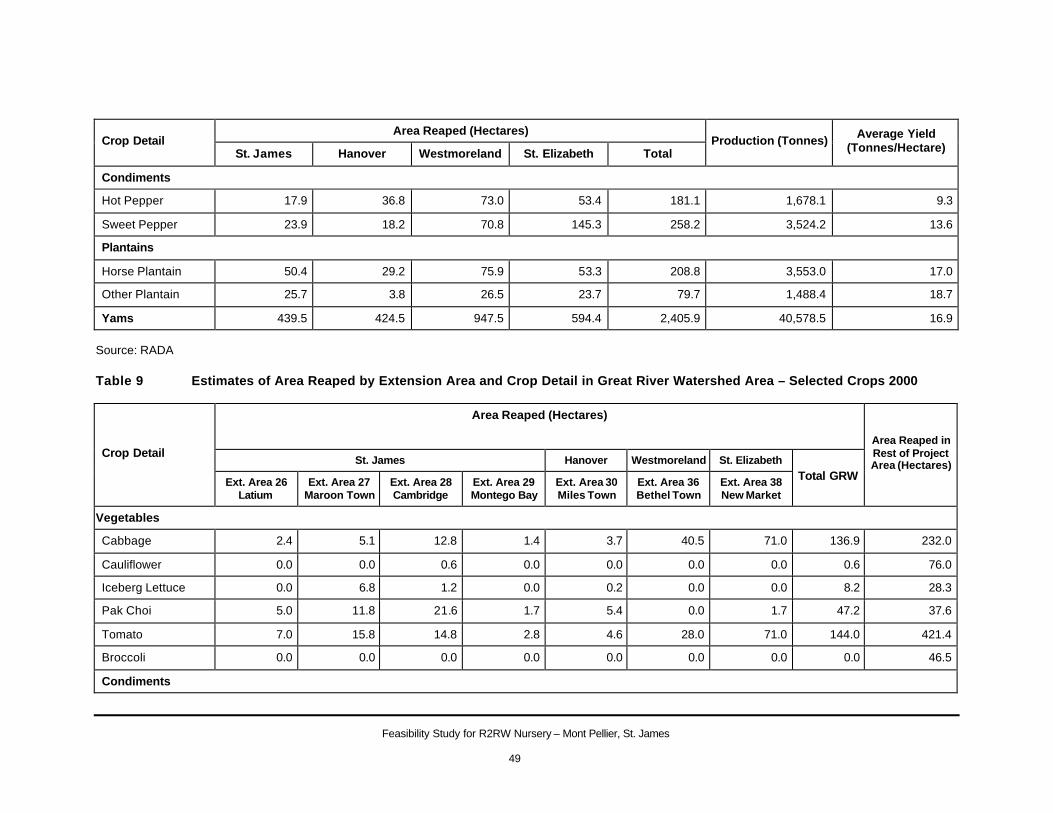
Feasibility Study for R2RW Nursery – Mont Pellier, St. James
49
Area Reaped (Hectares) Crop Detail
St. James Hanover Westmoreland St. Elizabeth Total Production (Tonnes) Average Yield
(Tonnes/Hectare)
Condiments
Hot Pepper 17.9 36.8 73.0 53.4 181.1 1,678.1 9.3
Sweet Pepper 23.9 18.2 70.8 145.3 258.2 3,524.2 13.6
Plantains
Horse Plantain 50.4 29.2 75.9 53.3 208.8 3,553.0 17.0
Other Plantain 25.7 3.8 26.5 23.7 79.7 1,488.4 18.7
Yams 439.5 424.5 947.5 594.4 2,405.9 40,578.5 16.9 Source: RADA Table 9 Estimates of Area Reaped by Extension Area and Crop Detail in Great River Watershed Area – Selected Crops 2000
Area Reaped (Hectares)
St. James Hanover Westmoreland St. Elizabeth Crop Detail
Ext. Area 26 Latium
Ext. Area 27 Maroon Town
Ext. Area 28 Cambridge
Ext. Area 29 Montego Bay
Ext. Area 30 Miles Town
Ext. Area 36 Bethel Town
Ext. Area 38 New Market
Total GRW
Area Reaped in Rest of Project Area (Hectares)
Vegetables
Cabbage 2.4 5.1 12.8 1.4 3.7 40.5 71.0 136.9 232.0
Cauliflower 0.0 0.0 0.6 0.0 0.0 0.0 0.0 0.6 76.0
Iceberg Lettuce 0.0 6.8 1.2 0.0 0.2 0.0 0.0 8.2 28.3
Pak Choi 5.0 11.8 21.6 1.7 5.4 0.0 1.7 47.2 37.6
Tomato 7.0 15.8 14.8 2.8 4.6 28.0 71.0 144.0 421.4
Broccoli 0.0 0.0 0.0 0.0 0.0 0.0 0.0 0.0 46.5
Condiments
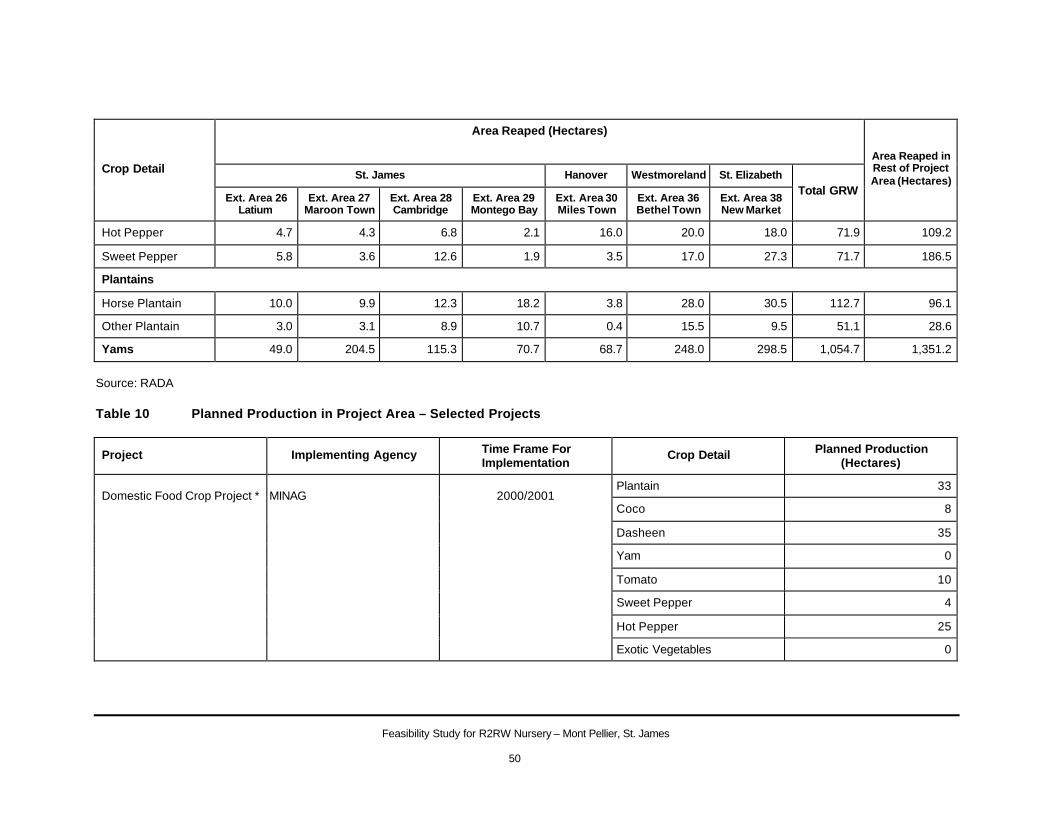
Feasibility Study for R2RW Nursery – Mont Pellier, St. James
50
Area Reaped (Hectares)
St. James Hanover Westmoreland St. Elizabeth Crop Detail
Ext. Area 26 Latium
Ext. Area 27 Maroon Town
Ext. Area 28 Cambridge
Ext. Area 29 Montego Bay
Ext. Area 30 Miles Town
Ext. Area 36 Bethel Town
Ext. Area 38 New Market
Total GRW
Area Reaped in Rest of Project Area (Hectares)
Hot Pepper 4.7 4.3 6.8 2.1 16.0 20.0 18.0 71.9 109.2
Sweet Pepper 5.8 3.6 12.6 1.9 3.5 17.0 27.3 71.7 186.5
Plantains
Horse Plantain 10.0 9.9 12.3 18.2 3.8 28.0 30.5 112.7 96.1
Other Plantain 3.0 3.1 8.9 10.7 0.4 15.5 9.5 51.1 28.6
Yams 49.0 204.5 115.3 70.7 68.7 248.0 298.5 1,054.7 1,351.2
Source: RADA Table 10 Planned Production in Project Area – Selected Projects
Project Implementing Agency Time Frame For Implementation
Crop Detail Planned Production (Hectares)
Plantain 33
Coco 8
Dasheen 35
Yam 0
Tomato 10
Sweet Pepper 4
Hot Pepper 25
Domestic Food Crop Project *
MINAG
2000/2001
Exotic Vegetables 0

Feasibility Study for R2RW Nursery – Mont Pellier, St. James
51
Project Implementing Agency Time Frame For Implementation Crop Detail Planned Production
(Hectares)
Ackee 880
Breadfruit 130
Nutmeg 50
Mango 140
Soursop 80
Guava 100
June Plum 60
Cashew 75
Avocado 80
Naseberry 50
Tamarind 15
Otaheite Apple 20
Fruit Tree Crop Project ** MINAG 2000 - 2002
Guinep 20
Reforestation Programme *** Forestry Department Ongoing Timber & Forestry 840
* Domestic Food Crop Production & Marketing Project Targets for St. James, Westmoreland & St. Elizabeth ** Planned Production for Fruit Tree Crop Project Represent Island-Wide Targets *** Planned Production for Reforestation Programme Represents Requests for Seedlings in Project Area

Feasibility Study for R2RW Nursery – Mont Pellier, St. James
52
Table 11 Target Crops: Selection Criteria
Criteria Which Eliminate Crops Crop Crops which do not use
Commercial Seedlings Crops which have Existing Supply of Planting Material
Crops which have Limited Potential in Project Area
Crops which have Limited or Declining Markets
Selected Crops
Permanent Crops
Banana Banana *
Cocoa Cocoa
Coconut Coconut
Coffee Coffee
Grapefruit Grapefruit
Orange Orange
Ortanique Ortanique
Pimento Pimento
Plantain Plantain *
Sugar Cane Sugar Cane
Other Crops Other Crops
Legumes Legumes
Vegetables
Beetroot Beetroot
Cabbage
Calaloo Calaloo
Carrot Carrot
Cauliflower Cauliflower
Celery Celery
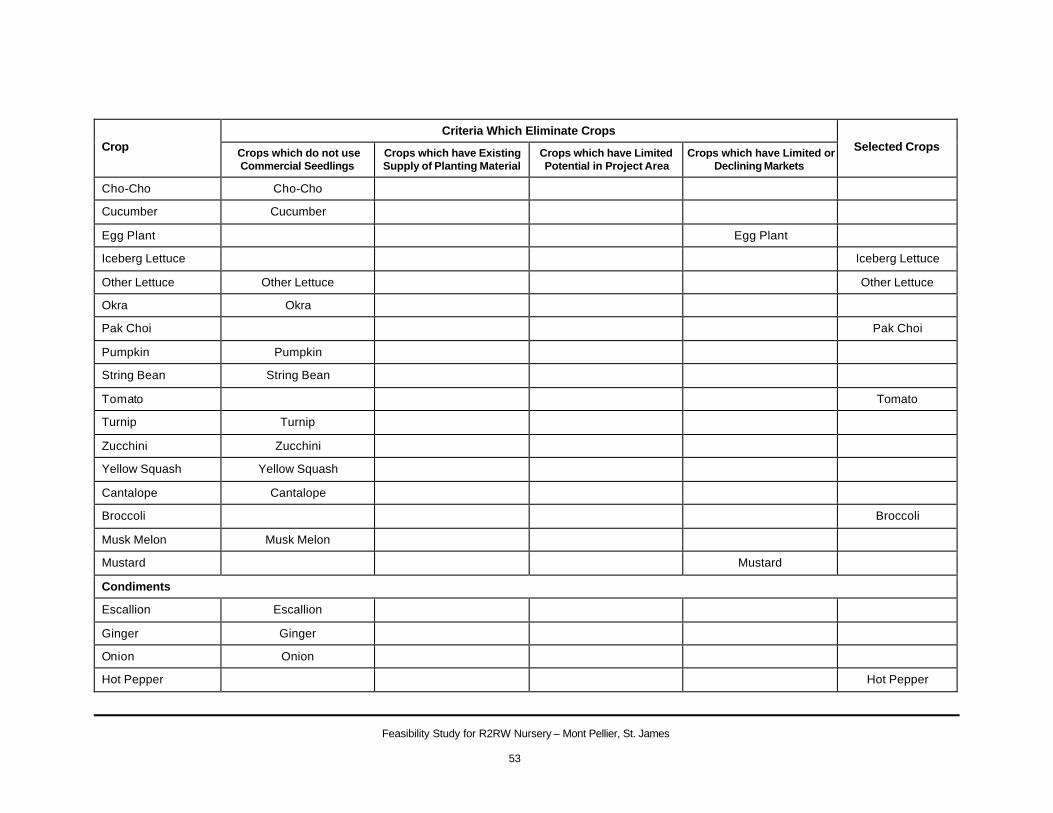
Feasibility Study for R2RW Nursery – Mont Pellier, St. James
53
Criteria Which Eliminate Crops Crop Crops which do not use
Commercial Seedlings Crops which have Existing Supply of Planting Material
Crops which have Limited Potential in Project Area
Crops which have Limited or Declining Markets
Selected Crops
Cho-Cho Cho-Cho
Cucumber Cucumber
Egg Plant Egg Plant
Iceberg Lettuce Iceberg Lettuce
Other Lettuce Other Lettuce Other Lettuce
Okra Okra
Pak Choi Pak Choi
Pumpkin Pumpkin
String Bean String Bean
Tomato Tomato
Turnip Turnip
Zucchini Zucchini
Yellow Squash Yellow Squash
Cantalope Cantalope
Broccoli Broccoli
Musk Melon Musk Melon
Mustard Mustard
Condiments
Escallion Escallion
Ginger Ginger
Onion Onion
Hot Pepper Hot Pepper

Feasibility Study for R2RW Nursery – Mont Pellier, St. James
54
Criteria Which Eliminate Crops Crop Crops which do not use
Commercial Seedlings Crops which have Existing Supply of Planting Material
Crops which have Limited Potential in Project Area
Crops which have Limited or Declining Markets
Selected Crops
Sweet Pepper Sweet Pepper
Fruits
Paw Paw Paw Paw
Pineapple Pineapple
Watermelon Watermelon
Other Fruits Other Fruits
Cereals Cereals
Potatoes Potatoes
Yams Yams
Other Tubers Other Tubers Other Tubers
Sorrel Sorrel
Fruit Tree Crops Fruit Tree Crops
Ornamentals Ornamentals
Timber & Forest Timber & Forest
Table 11a Selection Criteria – Details of Crops which do not use Commercial Seedlings
Crops Which Do Not Use Commercial Seedlings Reason
Sugar Cane Vegetative Propagation
Other Crops Direct Planting of Robust Seed Into Field/Grafting
Legumes Direct Planting of Robust Seed Into Field
Beetroot Very High Planting Density
Calaloo Self-Propagation
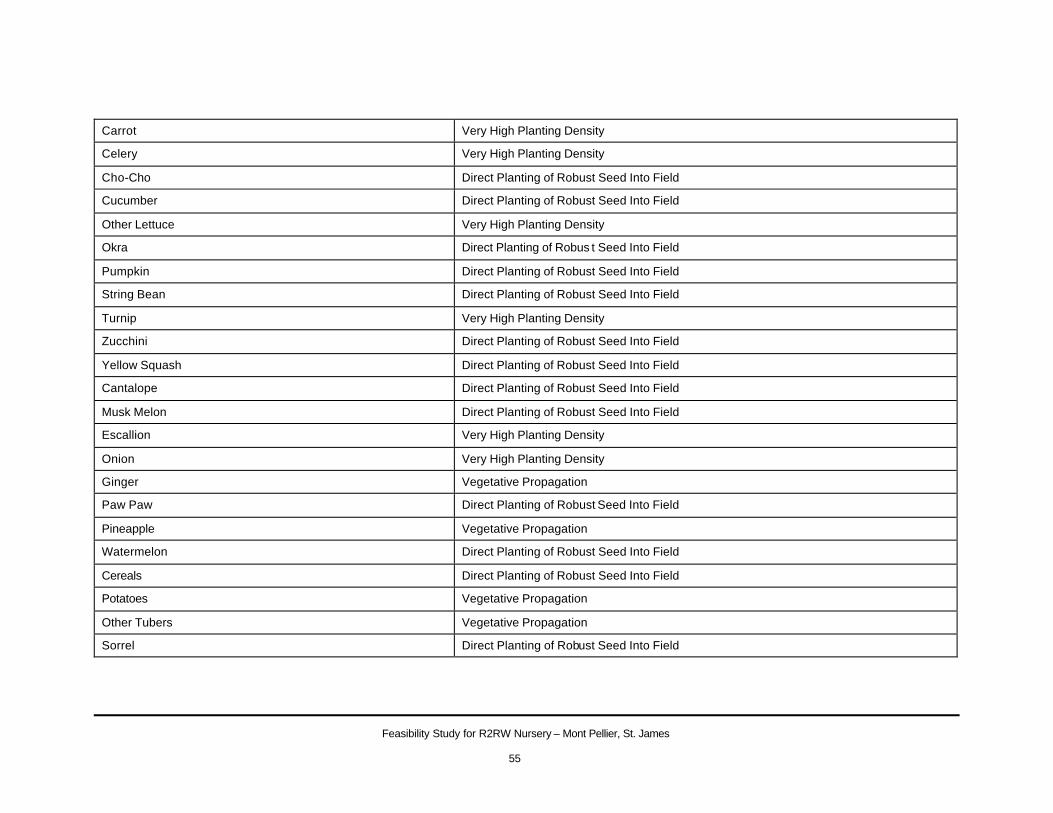
Feasibility Study for R2RW Nursery – Mont Pellier, St. James
55
Carrot Very High Planting Density
Celery Very High Planting Density
Cho-Cho Direct Planting of Robust Seed Into Field
Cucumber Direct Planting of Robust Seed Into Field
Other Lettuce Very High Planting Density
Okra Direct Planting of Robus t Seed Into Field
Pumpkin Direct Planting of Robust Seed Into Field
String Bean Direct Planting of Robust Seed Into Field
Turnip Very High Planting Density
Zucchini Direct Planting of Robust Seed Into Field
Yellow Squash Direct Planting of Robust Seed Into Field
Cantalope Direct Planting of Robust Seed Into Field
Musk Melon Direct Planting of Robust Seed Into Field
Escallion Very High Planting Density
Onion Very High Planting Density
Ginger Vegetative Propagation
Paw Paw Direct Planting of Robust Seed Into Field
Pineapple Vegetative Propagation
Watermelon Direct Planting of Robust Seed Into Field
Cereals Direct Planting of Robust Seed Into Field
Potatoes Vegetative Propagation
Other Tubers Vegetative Propagation
Sorrel Direct Planting of Robust Seed Into Field
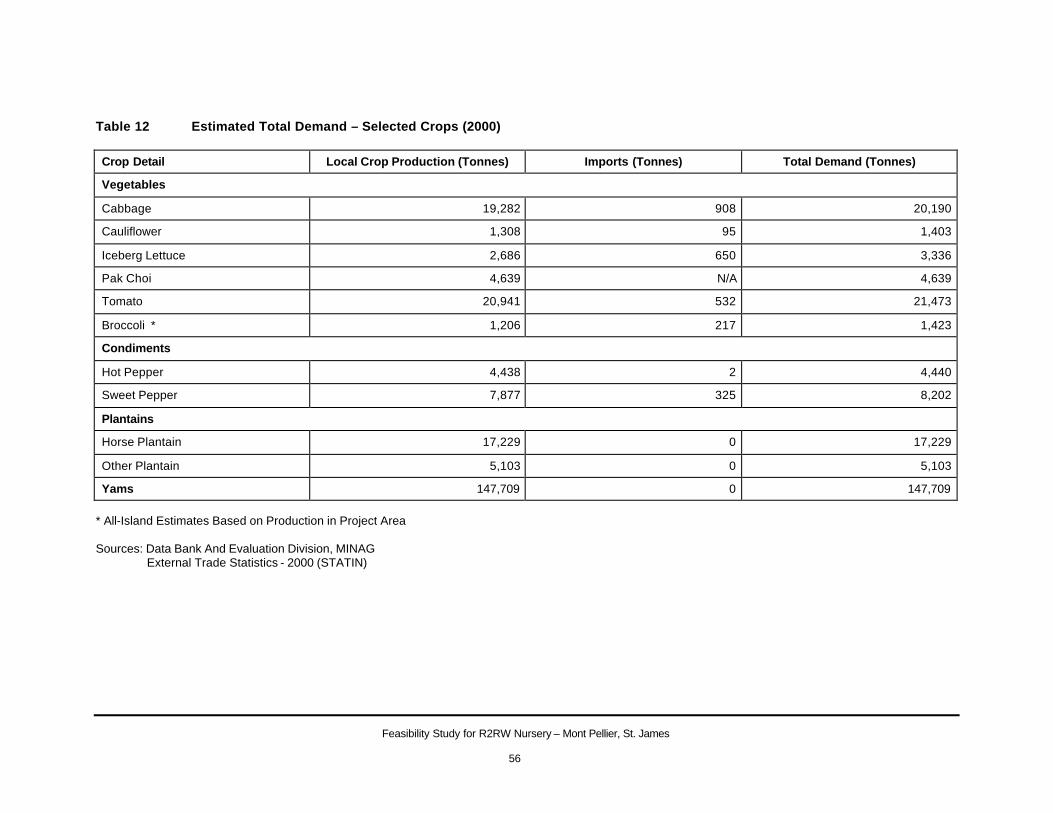
Feasibility Study for R2RW Nursery – Mont Pellier, St. James
56
Table 12 Estimated Total Demand – Selected Crops (2000)
Crop Detail Local Crop Production (Tonnes) Imports (Tonnes) Total Demand (Tonnes)
Vegetables
Cabbage 19,282 908 20,190
Cauliflower 1,308 95 1,403
Iceberg Lettuce 2,686 650 3,336
Pak Choi 4,639 N/A 4,639
Tomato 20,941 532 21,473
Broccoli * 1,206 217 1,423
Condiments
Hot Pepper 4,438 2 4,440
Sweet Pepper 7,877 325 8,202
Plantains
Horse Plantain 17,229 0 17,229
Other Plantain 5,103 0 5,103
Yams 147,709 0 147,709 * All-Island Estimates Based on Production in Project Area Sources: Data Bank And Evaluation Division, MINAG
External Trade Statistics - 2000 (STATIN)
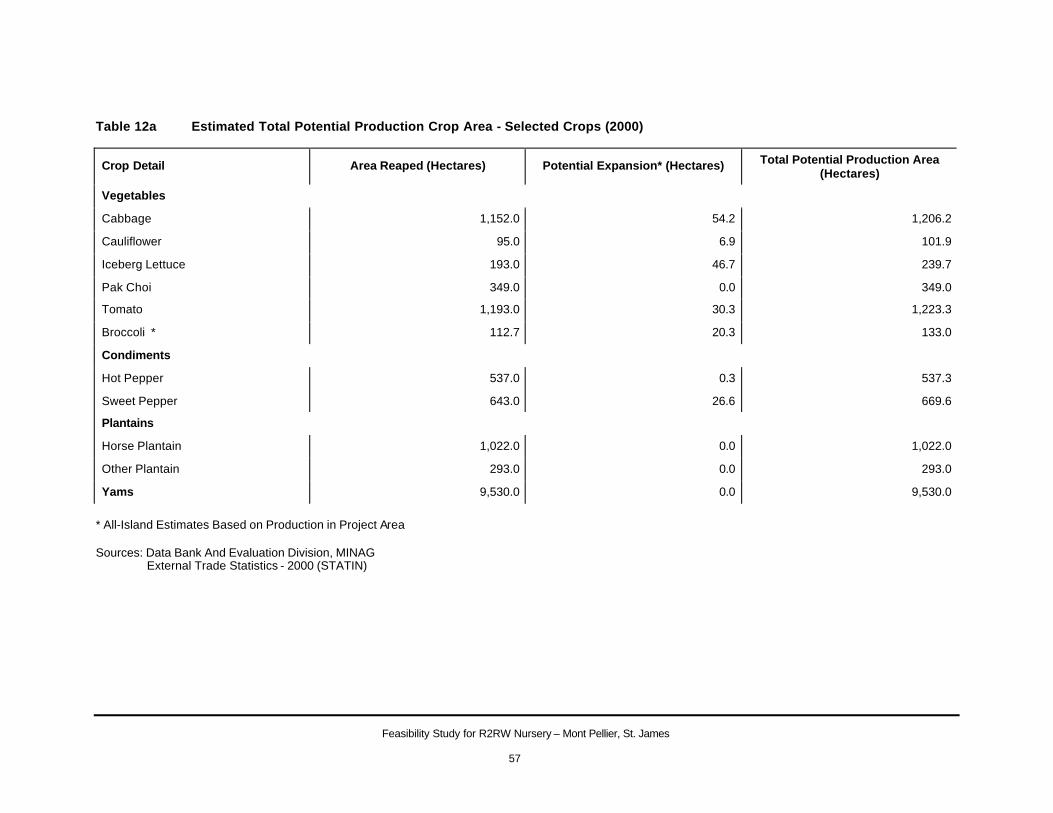
Feasibility Study for R2RW Nursery – Mont Pellier, St. James
57
Table 12a Estimated Total Potential Production Crop Area - Selected Crops (2000)
Crop Detail Area Reaped (Hectares) Potential Expansion* (Hectares) Total Potential Production Area (Hectares)
Vegetables
Cabbage 1,152.0 54.2 1,206.2
Cauliflower 95.0 6.9 101.9
Iceberg Lettuce 193.0 46.7 239.7
Pak Choi 349.0 0.0 349.0
Tomato 1,193.0 30.3 1,223.3
Broccoli * 112.7 20.3 133.0
Condiments
Hot Pepper 537.0 0.3 537.3
Sweet Pepper 643.0 26.6 669.6
Plantains
Horse Plantain 1,022.0 0.0 1,022.0
Other Plantain 293.0 0.0 293.0
Yams 9,530.0 0.0 9,530.0
* All-Island Estimates Based on Production in Project Area Sources: Data Bank And Evaluation Division, MINAG
External Trade Statistics - 2000 (STATIN)

Feasibility Study for R2RW Nursery – Mont Pellier, St. James
58
Table 13 Crop Production and Area Reaped – Selected Crops (1991, 1999 and 2000)
Production (Tonnes) Area Reaped (Hectares) Crop Detail
1,991 1,999 2,000 % Change 1991-1999
% Change 1999-2000
1,991 1,999 2,000 % Change 1991-1999
% Change 1999-2000
Vegetables
Cabbage 14,999 27,156 19,282 81.1% -29.0% 1,185 1,467 1,152 23.8% -21.5%
Cauliflower 399 1,128 1,308 182.7% 16.0% 49 93 95 89.8% 2.2%
Iceberg Lettuce 3,025 5,041 2,686 66.6% -46.7% 241 339 193 40.7% -43.1%
Pak Choi 3,009 4,929 4,639 63.8% -5.9% 297 356 349 19.9% -2.0%
Tomato 10,936 21,562 20,941 97.2% -2.9% 1,057 1,208 1,193 14.3% -1.2%
Broccoli * N/A N/A 1,206 N/A N/A N/A N/A 113 N/A N/A
Sub-Total: Vegetables 32,368 59,816 50,062 84.8% -16.3% 2,829 3,463 3,095 22.4% -10.6%
Condiments
Hot Pepper 2,595 6,363 4,438 145.2% -30.3% 541 730 537 34.9% -26.4%
Sweet Pepper 2,551 8,546 7,877 235.0% -7.8% 331 719 643 117.2% -10.6%
Sub-Total: Condiments 5,146 14,909 12,315 189.7% -17.4% 872 1,449 1,180 66.2% -18.6%
Plantains
Horse Plantain 21,223 21,032 17,229 -0.9% -18.1% 1,608 1,259 1,022 -21.7% -18.8%
Other Plantain 5,469 6,492 5,103 18.7% -21.4% 359 365 293 1.7% -19.7%
Sub-Total: Plantains 26,692 27,524 22,332 3.1% -18.9% 1,967 1,624 1,315 -17.4% -19.0%
Yams 186,104 195,688 147,709 5.1% -24.5% 13,917 11,951 9,530 -14.1% -20.3%
* All-Island Estimates Based on Production in Project Area
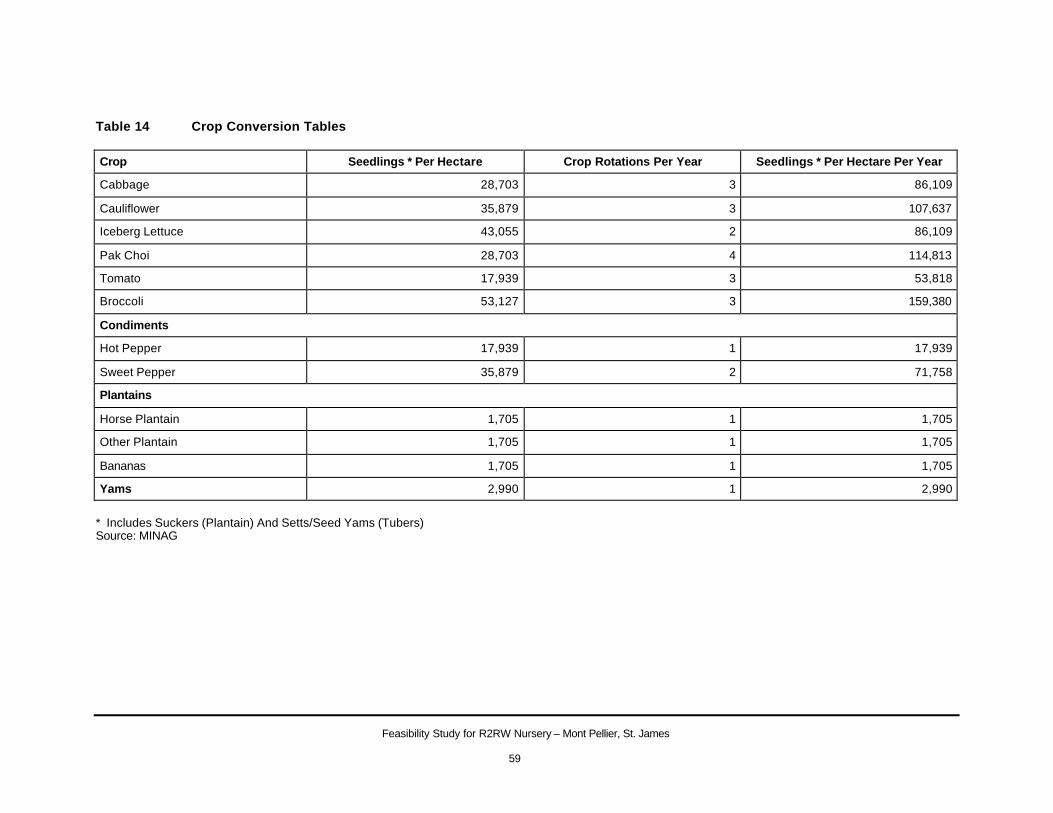
Feasibility Study for R2RW Nursery – Mont Pellier, St. James
59
Table 14 Crop Conversion Tables
Crop Seedlings * Per Hectare Crop Rotations Per Year Seedlings * Per Hectare Per Year
Cabbage 28,703 3 86,109
Cauliflower 35,879 3 107,637
Iceberg Lettuce 43,055 2 86,109
Pak Choi 28,703 4 114,813
Tomato 17,939 3 53,818
Broccoli 53,127 3 159,380
Condiments
Hot Pepper 17,939 1 17,939
Sweet Pepper 35,879 2 71,758
Plantains
Horse Plantain 1,705 1 1,705
Other Plantain 1,705 1 1,705
Bananas 1,705 1 1,705
Yams 2,990 1 2,990
* Includes Suckers (Plantain) And Setts/Seed Yams (Tubers) Source: MINAG
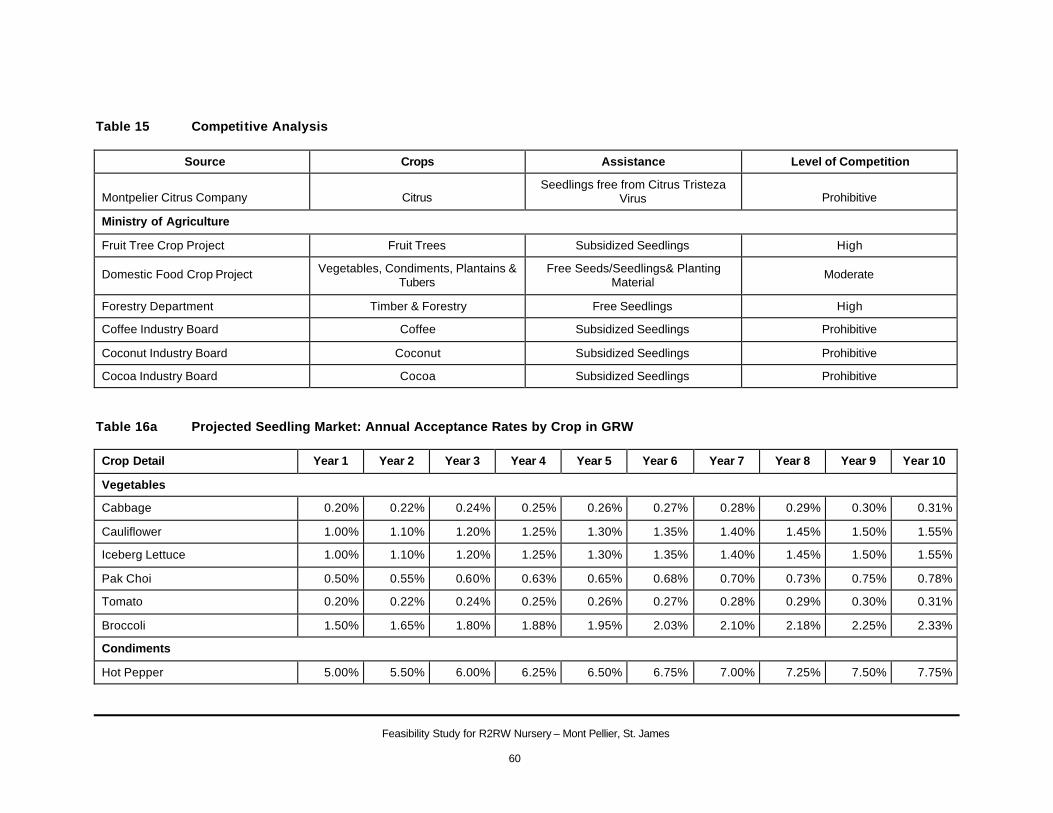
Feasibility Study for R2RW Nursery – Mont Pellier, St. James
60
Table 15 Competitive Analysis
Source Crops Assistance Level of Competition
Montpelier Citrus Company Citrus Seedlings free from Citrus Tristeza
Virus Prohibitive
Ministry of Agriculture
Fruit Tree Crop Project Fruit Trees Subsidized Seedlings High
Domestic Food Crop Project Vegetables, Condiments, Plantains & Tubers
Free Seeds/Seedlings& Planting Material
Moderate
Forestry Department Timber & Forestry Free Seedlings High
Coffee Industry Board Coffee Subsidized Seedlings Prohibitive
Coconut Industry Board Coconut Subsidized Seedlings Prohibitive
Cocoa Industry Board Cocoa Subsidized Seedlings Prohibitive
Table 16a Projected Seedling Market: Annual Acceptance Rates by Crop in GRW Crop Detail Year 1 Year 2 Year 3 Year 4 Year 5 Year 6 Year 7 Year 8 Year 9 Year 10
Vegetables
Cabbage 0.20% 0.22% 0.24% 0.25% 0.26% 0.27% 0.28% 0.29% 0.30% 0.31%
Cauliflower 1.00% 1.10% 1.20% 1.25% 1.30% 1.35% 1.40% 1.45% 1.50% 1.55%
Iceberg Lettuce 1.00% 1.10% 1.20% 1.25% 1.30% 1.35% 1.40% 1.45% 1.50% 1.55%
Pak Choi 0.50% 0.55% 0.60% 0.63% 0.65% 0.68% 0.70% 0.73% 0.75% 0.78%
Tomato 0.20% 0.22% 0.24% 0.25% 0.26% 0.27% 0.28% 0.29% 0.30% 0.31%
Broccoli 1.50% 1.65% 1.80% 1.88% 1.95% 2.03% 2.10% 2.18% 2.25% 2.33%
Condiments
Hot Pepper 5.00% 5.50% 6.00% 6.25% 6.50% 6.75% 7.00% 7.25% 7.50% 7.75%

Feasibility Study for R2RW Nursery – Mont Pellier, St. James
61
Crop Detail Year 1 Year 2 Year 3 Year 4 Year 5 Year 6 Year 7 Year 8 Year 9 Year 10
Sweet Pepper 0.50% 0.55% 0.60% 0.63% 0.65% 0.68% 0.70% 0.73% 0.75% 0.78%
Plantains
Horse Plantain 1.00% 1.10% 1.20% 1.25% 1.30% 1.35% 1.40% 1.45% 1.50% 1.55%
Other Plantain 1.00% 1.10% 1.20% 1.25% 1.30% 1.35% 1.40% 1.45% 1.50% 1.55%
Bananas 0.15% 0.17% 0.18% 0.19% 0.20% 0.20% 0.21% 0.22% 0.23% 0.23%
Yams 1.00% 1.10% 1.20% 1.25% 1.30% 1.35% 1.40% 1.45% 1.50% 1.55%
Notes Annual Acceptance Rate Represents Projected Percentage of Total Area Reaped by Crop which Purchases Seedlings from R2RW Plant Nursery Table 16b Projected Seedling Market: Annual Acceptance Rated by Crop in Rest of Project Area Crop Detail Year 1 Year 2 Year 3 Year 4 Year 5 Year 6 Year 7 Year 8 Year 9 Year 10
Vegetables
Cabbage 0.02% 0.02% 0.02% 0.03% 0.03% 0.03% 0.03% 0.03% 0.03% 0.03%
Cauliflower 0.10% 0.11% 0.12% 0.13% 0.13% 0.14% 0.14% 0.15% 0.15% 0.16%
Iceberg Lettuce 0.10% 0.11% 0.12% 0.13% 0.13% 0.14% 0.14% 0.15% 0.15% 0.16%
Pak Choi 0.05% 0.06% 0.06% 0.06% 0.07% 0.07% 0.07% 0.07% 0.08% 0.08%
Tomato 0.02% 0.02% 0.02% 0.03% 0.03% 0.03% 0.03% 0.03% 0.03% 0.03%
Broccoli 0.15% 0.17% 0.18% 0.19% 0.20% 0.20% 0.21% 0.22% 0.23% 0.23%
Condiments
Hot Pepper 0.50% 0.55% 0.60% 0.63% 0.65% 0.68% 0.70% 0.73% 0.75% 0.78%
Sweet Pepper 0.05% 0.06% 0.06% 0.06% 0.07% 0.07% 0.07% 0.07% 0.08% 0.08%
Plantains
Horse Plantain 0.10% 0.11% 0.12% 0.13% 0.13% 0.14% 0.14% 0.15% 0.15% 0.16%
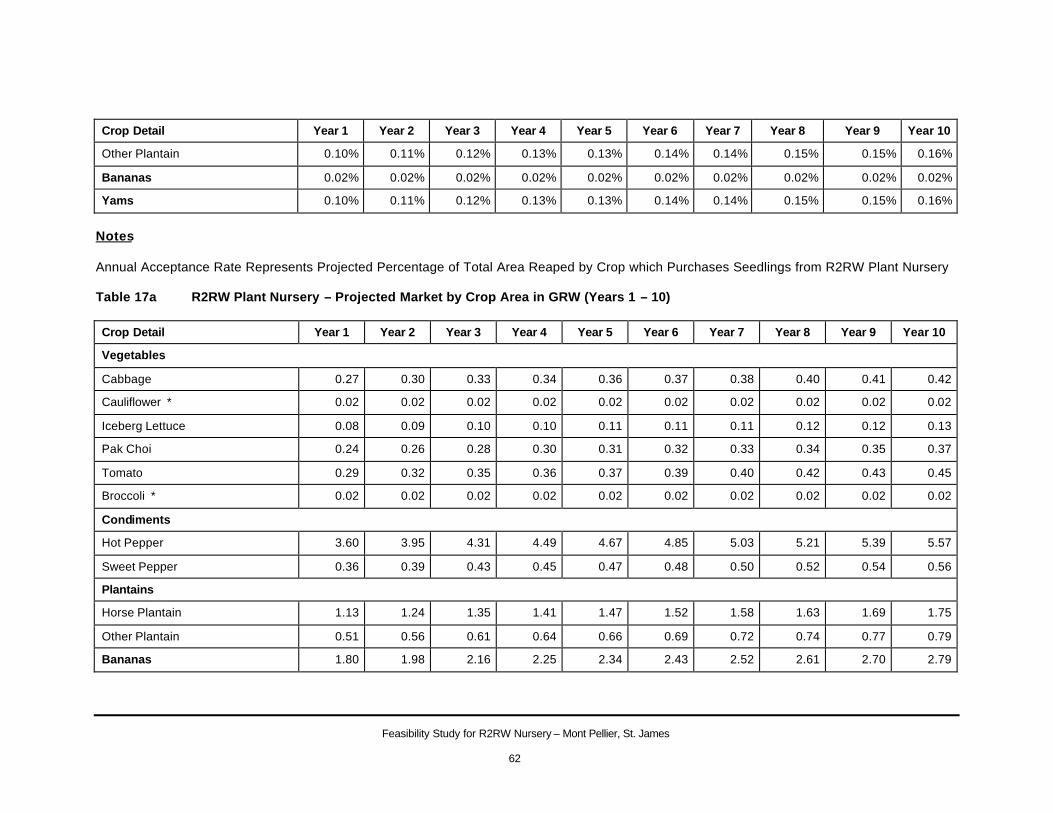
Feasibility Study for R2RW Nursery – Mont Pellier, St. James
62
Crop Detail Year 1 Year 2 Year 3 Year 4 Year 5 Year 6 Year 7 Year 8 Year 9 Year 10
Other Plantain 0.10% 0.11% 0.12% 0.13% 0.13% 0.14% 0.14% 0.15% 0.15% 0.16%
Bananas 0.02% 0.02% 0.02% 0.02% 0.02% 0.02% 0.02% 0.02% 0.02% 0.02%
Yams 0.10% 0.11% 0.12% 0.13% 0.13% 0.14% 0.14% 0.15% 0.15% 0.16%
Notes Annual Acceptance Rate Represents Projected Percentage of Total Area Reaped by Crop which Purchases Seedlings from R2RW Plant Nursery Table 17a R2RW Plant Nursery – Projected Market by Crop Area in GRW (Years 1 – 10) Crop Detail Year 1 Year 2 Year 3 Year 4 Year 5 Year 6 Year 7 Year 8 Year 9 Year 10
Vegetables
Cabbage 0.27 0.30 0.33 0.34 0.36 0.37 0.38 0.40 0.41 0.42
Cauliflower * 0.02 0.02 0.02 0.02 0.02 0.02 0.02 0.02 0.02 0.02
Iceberg Lettuce 0.08 0.09 0.10 0.10 0.11 0.11 0.11 0.12 0.12 0.13
Pak Choi 0.24 0.26 0.28 0.30 0.31 0.32 0.33 0.34 0.35 0.37
Tomato 0.29 0.32 0.35 0.36 0.37 0.39 0.40 0.42 0.43 0.45
Broccoli * 0.02 0.02 0.02 0.02 0.02 0.02 0.02 0.02 0.02 0.02
Condiments
Hot Pepper 3.60 3.95 4.31 4.49 4.67 4.85 5.03 5.21 5.39 5.57
Sweet Pepper 0.36 0.39 0.43 0.45 0.47 0.48 0.50 0.52 0.54 0.56
Plantains
Horse Plantain 1.13 1.24 1.35 1.41 1.47 1.52 1.58 1.63 1.69 1.75
Other Plantain 0.51 0.56 0.61 0.64 0.66 0.69 0.72 0.74 0.77 0.79
Bananas 1.80 1.98 2.16 2.25 2.34 2.43 2.52 2.61 2.70 2.79
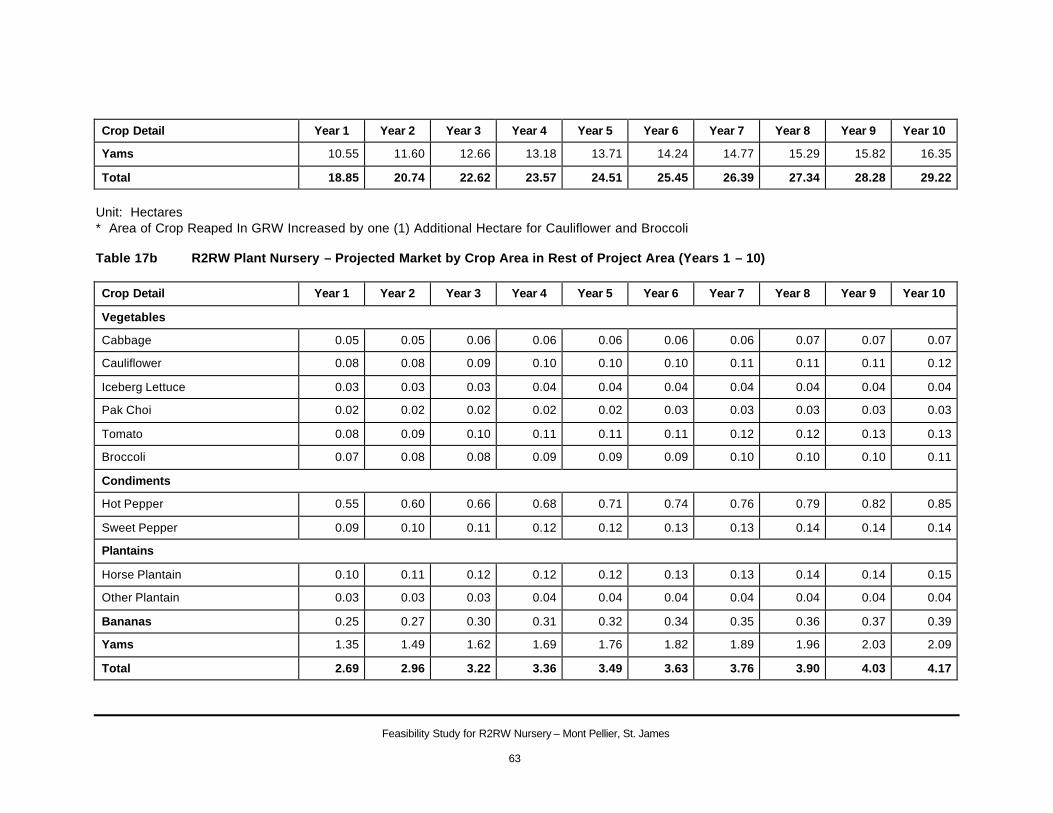
Feasibility Study for R2RW Nursery – Mont Pellier, St. James
63
Crop Detail Year 1 Year 2 Year 3 Year 4 Year 5 Year 6 Year 7 Year 8 Year 9 Year 10
Yams 10.55 11.60 12.66 13.18 13.71 14.24 14.77 15.29 15.82 16.35
Total 18.85 20.74 22.62 23.57 24.51 25.45 26.39 27.34 28.28 29.22
Unit: Hectares * Area of Crop Reaped In GRW Increased by one (1) Additional Hectare for Cauliflower and Broccoli Table 17b R2RW Plant Nursery – Projected Market by Crop Area in Rest of Project Area (Years 1 – 10) Crop Detail Year 1 Year 2 Year 3 Year 4 Year 5 Year 6 Year 7 Year 8 Year 9 Year 10
Vegetables
Cabbage 0.05 0.05 0.06 0.06 0.06 0.06 0.06 0.07 0.07 0.07
Cauliflower 0.08 0.08 0.09 0.10 0.10 0.10 0.11 0.11 0.11 0.12
Iceberg Lettuce 0.03 0.03 0.03 0.04 0.04 0.04 0.04 0.04 0.04 0.04
Pak Choi 0.02 0.02 0.02 0.02 0.02 0.03 0.03 0.03 0.03 0.03
Tomato 0.08 0.09 0.10 0.11 0.11 0.11 0.12 0.12 0.13 0.13
Broccoli 0.07 0.08 0.08 0.09 0.09 0.09 0.10 0.10 0.10 0.11
Condiments
Hot Pepper 0.55 0.60 0.66 0.68 0.71 0.74 0.76 0.79 0.82 0.85
Sweet Pepper 0.09 0.10 0.11 0.12 0.12 0.13 0.13 0.14 0.14 0.14
Plantains
Horse Plantain 0.10 0.11 0.12 0.12 0.12 0.13 0.13 0.14 0.14 0.15
Other Plantain 0.03 0.03 0.03 0.04 0.04 0.04 0.04 0.04 0.04 0.04
Bananas 0.25 0.27 0.30 0.31 0.32 0.34 0.35 0.36 0.37 0.39
Yams 1.35 1.49 1.62 1.69 1.76 1.82 1.89 1.96 2.03 2.09
Total 2.69 2.96 3.22 3.36 3.49 3.63 3.76 3.90 4.03 4.17
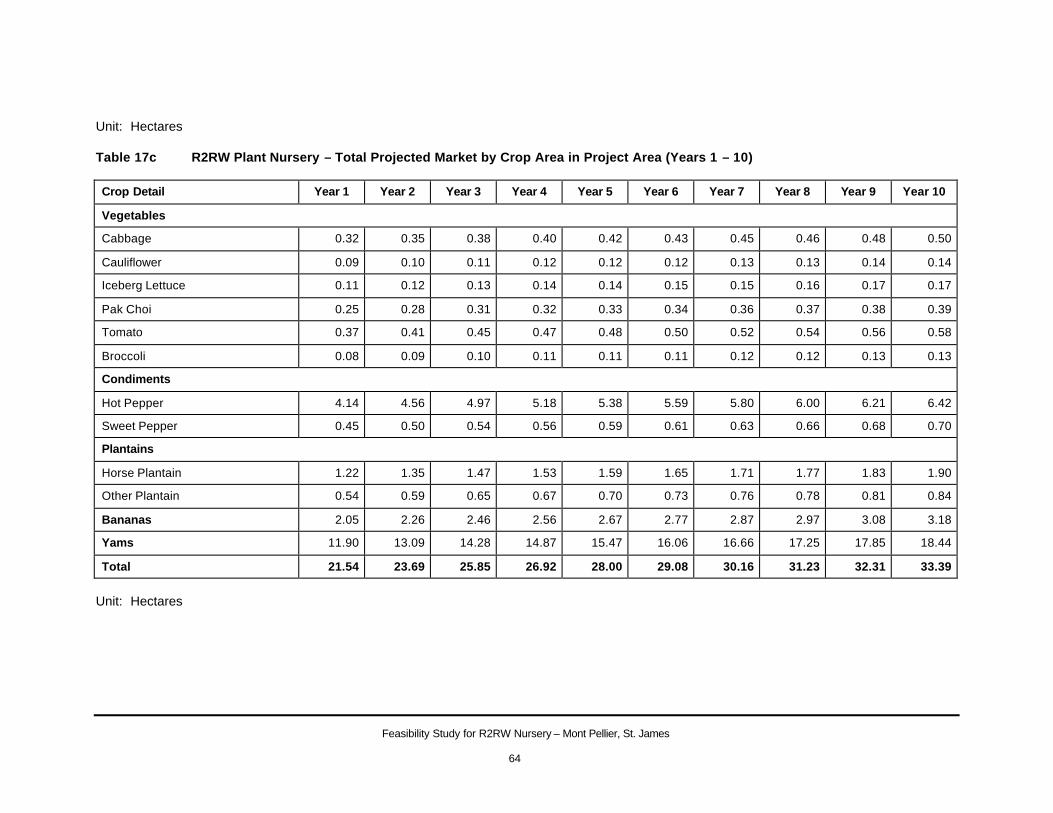
Feasibility Study for R2RW Nursery – Mont Pellier, St. James
64
Unit: Hectares Table 17c R2RW Plant Nursery – Total Projected Market by Crop Area in Project Area (Years 1 – 10) Crop Detail Year 1 Year 2 Year 3 Year 4 Year 5 Year 6 Year 7 Year 8 Year 9 Year 10
Vegetables
Cabbage 0.32 0.35 0.38 0.40 0.42 0.43 0.45 0.46 0.48 0.50
Cauliflower 0.09 0.10 0.11 0.12 0.12 0.12 0.13 0.13 0.14 0.14
Iceberg Lettuce 0.11 0.12 0.13 0.14 0.14 0.15 0.15 0.16 0.17 0.17
Pak Choi 0.25 0.28 0.31 0.32 0.33 0.34 0.36 0.37 0.38 0.39
Tomato 0.37 0.41 0.45 0.47 0.48 0.50 0.52 0.54 0.56 0.58
Broccoli 0.08 0.09 0.10 0.11 0.11 0.11 0.12 0.12 0.13 0.13
Condiments
Hot Pepper 4.14 4.56 4.97 5.18 5.38 5.59 5.80 6.00 6.21 6.42
Sweet Pepper 0.45 0.50 0.54 0.56 0.59 0.61 0.63 0.66 0.68 0.70
Plantains
Horse Plantain 1.22 1.35 1.47 1.53 1.59 1.65 1.71 1.77 1.83 1.90
Other Plantain 0.54 0.59 0.65 0.67 0.70 0.73 0.76 0.78 0.81 0.84
Bananas 2.05 2.26 2.46 2.56 2.67 2.77 2.87 2.97 3.08 3.18
Yams 11.90 13.09 14.28 14.87 15.47 16.06 16.66 17.25 17.85 18.44
Total 21.54 23.69 25.85 26.92 28.00 29.08 30.16 31.23 32.31 33.39
Unit: Hectares
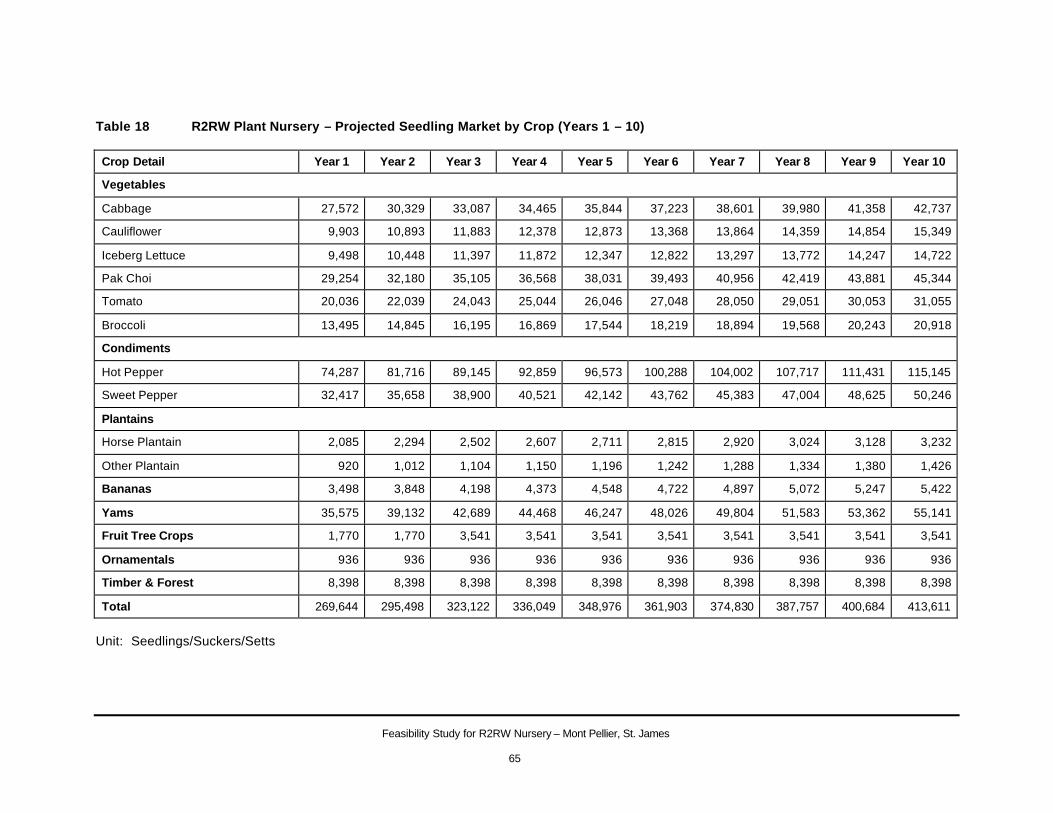
Feasibility Study for R2RW Nursery – Mont Pellier, St. James
65
Table 18 R2RW Plant Nursery – Projected Seedling Market by Crop (Years 1 – 10)
Crop Detail Year 1 Year 2 Year 3 Year 4 Year 5 Year 6 Year 7 Year 8 Year 9 Year 10
Vegetables
Cabbage 27,572 30,329 33,087 34,465 35,844 37,223 38,601 39,980 41,358 42,737
Cauliflower 9,903 10,893 11,883 12,378 12,873 13,368 13,864 14,359 14,854 15,349
Iceberg Lettuce 9,498 10,448 11,397 11,872 12,347 12,822 13,297 13,772 14,247 14,722
Pak Choi 29,254 32,180 35,105 36,568 38,031 39,493 40,956 42,419 43,881 45,344
Tomato 20,036 22,039 24,043 25,044 26,046 27,048 28,050 29,051 30,053 31,055
Broccoli 13,495 14,845 16,195 16,869 17,544 18,219 18,894 19,568 20,243 20,918
Condiments
Hot Pepper 74,287 81,716 89,145 92,859 96,573 100,288 104,002 107,717 111,431 115,145
Sweet Pepper 32,417 35,658 38,900 40,521 42,142 43,762 45,383 47,004 48,625 50,246
Plantains
Horse Plantain 2,085 2,294 2,502 2,607 2,711 2,815 2,920 3,024 3,128 3,232
Other Plantain 920 1,012 1,104 1,150 1,196 1,242 1,288 1,334 1,380 1,426
Bananas 3,498 3,848 4,198 4,373 4,548 4,722 4,897 5,072 5,247 5,422
Yams 35,575 39,132 42,689 44,468 46,247 48,026 49,804 51,583 53,362 55,141
Fruit Tree Crops 1,770 1,770 3,541 3,541 3,541 3,541 3,541 3,541 3,541 3,541
Ornamentals 936 936 936 936 936 936 936 936 936 936
Timber & Forest 8,398 8,398 8,398 8,398 8,398 8,398 8,398 8,398 8,398 8,398
Total 269,644 295,498 323,122 336,049 348,976 361,903 374,830 387,757 400,684 413,611
Unit: Seedlings/Suckers/Setts
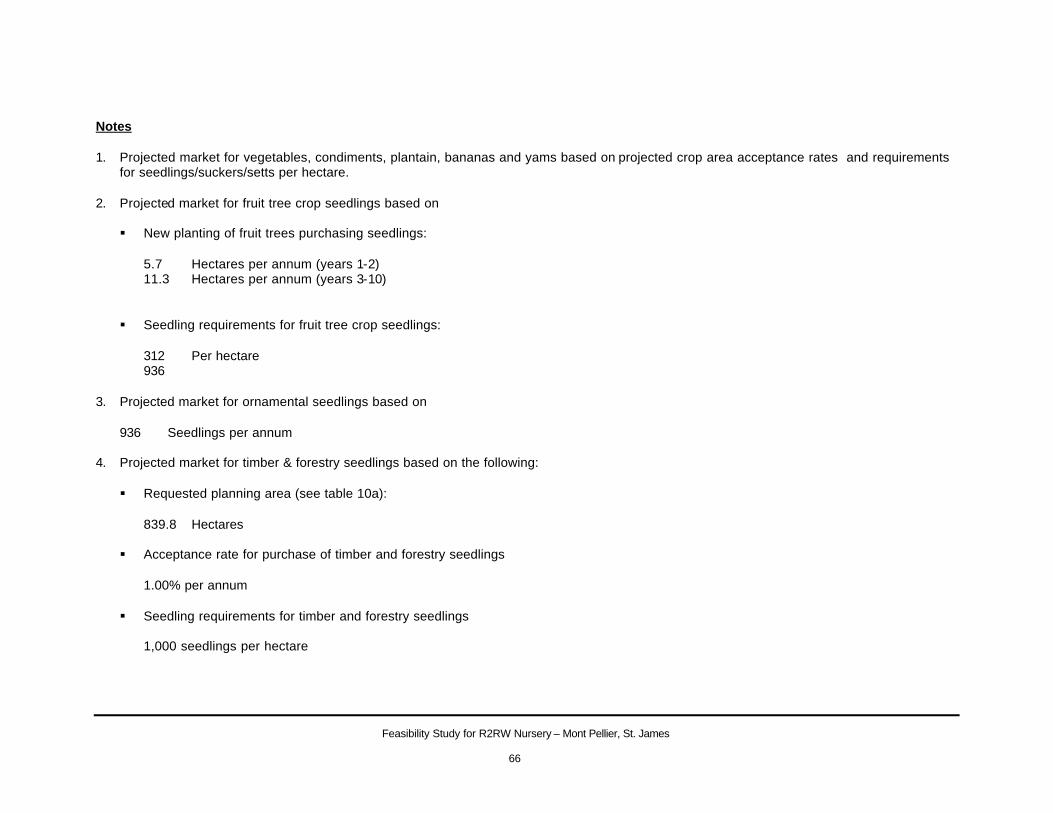
Feasibility Study for R2RW Nursery – Mont Pellier, St. James
66
Notes 1. Projected market for vegetables, condiments, plantain, bananas and yams based on projected crop area acceptance rates and requirements
for seedlings/suckers/setts per hectare. 2. Projected market for fruit tree crop seedlings based on § New planting of fruit trees purchasing seedlings:
5.7 Hectares per annum (years 1-2) 11.3 Hectares per annum (years 3-10)
§ Seedling requirements for fruit tree crop seedlings:
312 Per hectare 936
3. Projected market for ornamental seedlings based on
936 Seedlings per annum
4. Projected market for timber & forestry seedlings based on the following: § Requested planning area (see table 10a):
839.8 Hectares
§ Acceptance rate for purchase of timber and forestry seedlings
1.00% per annum
§ Seedling requirements for timber and forestry seedlings
1,000 seedlings per hectare
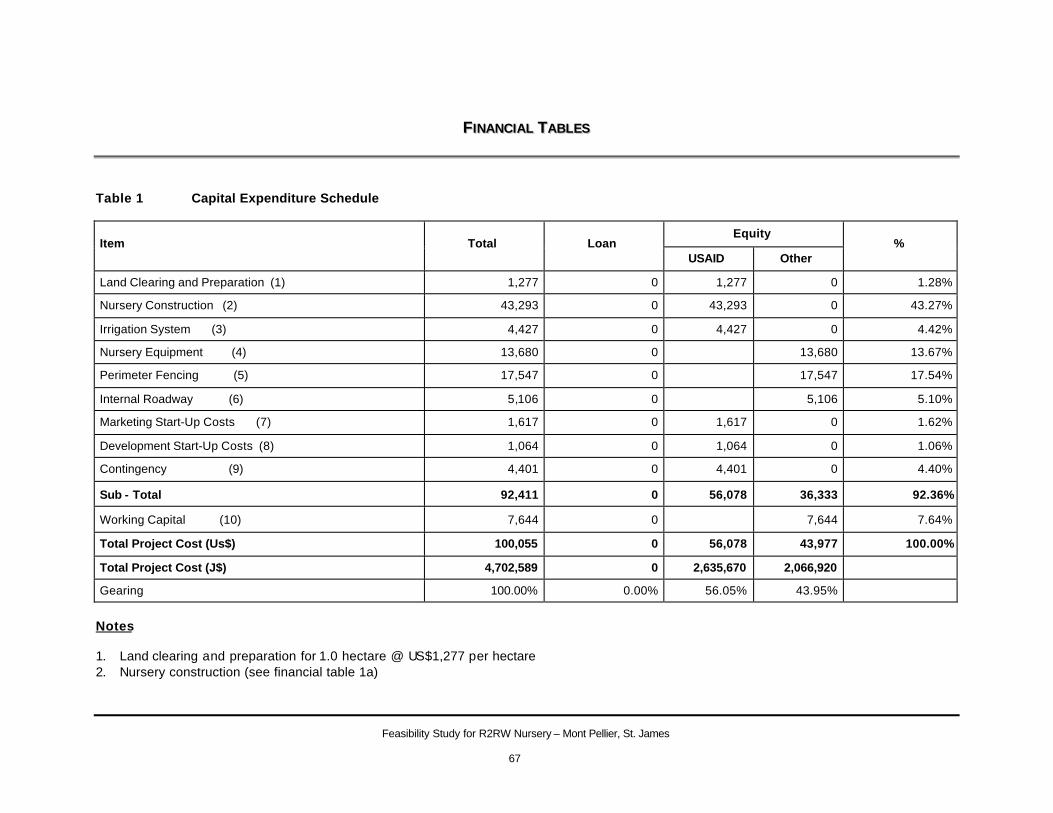
Feasibility Study for R2RW Nursery – Mont Pellier, St. James
67
FF IINNAANNCCIIAALL TTAABBLLEESS Table 1 Capital Expenditure Schedule
Equity Item Total Loan
USAID Other %
Land Clearing and Preparation (1) 1,277 0 1,277 0 1.28%
Nursery Construction (2) 43,293 0 43,293 0 43.27%
Irrigation System (3) 4,427 0 4,427 0 4.42%
Nursery Equipment (4) 13,680 0 13,680 13.67%
Perimeter Fencing (5) 17,547 0 17,547 17.54%
Internal Roadway (6) 5,106 0 5,106 5.10%
Marketing Start-Up Costs (7) 1,617 0 1,617 0 1.62%
Development Start-Up Costs (8) 1,064 0 1,064 0 1.06%
Contingency (9) 4,401 0 4,401 0 4.40%
Sub - Total 92,411 0 56,078 36,333 92.36%
Working Capital (10) 7,644 0 7,644 7.64%
Total Project Cost (Us$) 100,055 0 56,078 43,977 100.00%
Total Project Cost (J$) 4,702,589 0 2,635,670 2,066,920
Gearing 100.00% 0.00% 56.05% 43.95%
Notes 1. Land clearing and preparation for 1.0 hectare @ US$1,277 per hectare 2. Nursery construction (see financial table 1a)
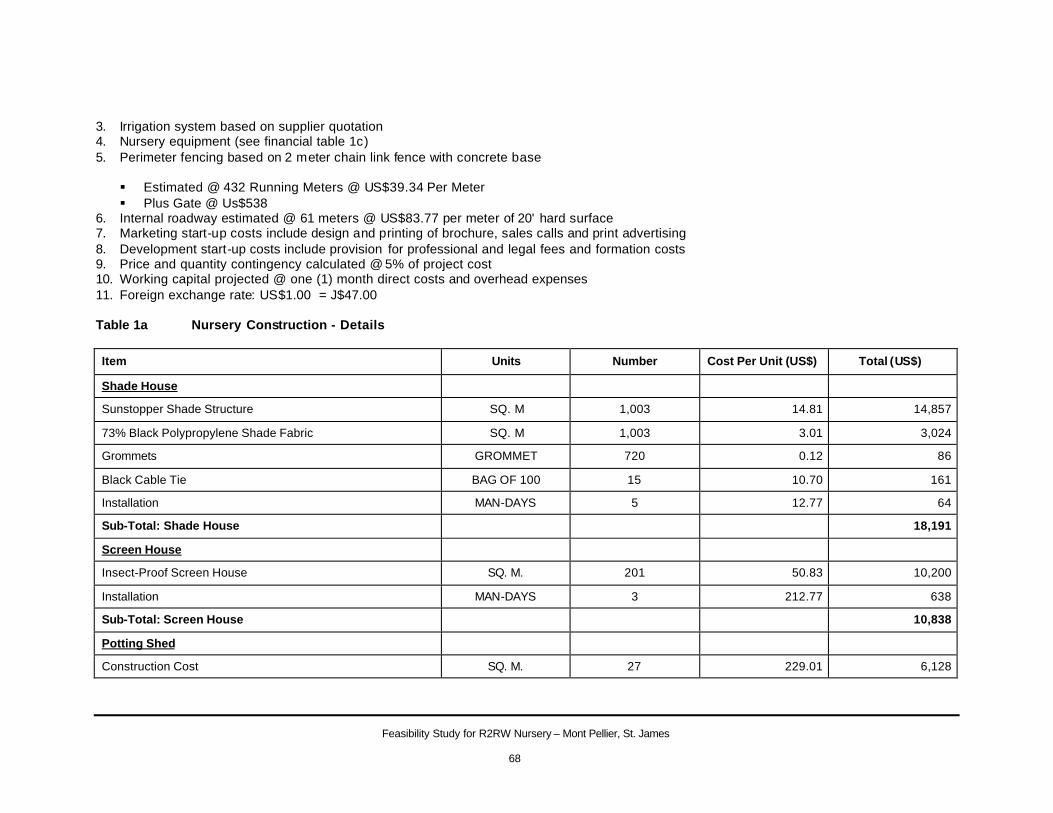
Feasibility Study for R2RW Nursery – Mont Pellier, St. James
68
3. Irrigation system based on supplier quotation 4. Nursery equipment (see financial table 1c) 5. Perimeter fencing based on 2 meter chain link fence with concrete base § Estimated @ 432 Running Meters @ US$39.34 Per Meter § Plus Gate @ Us$538
6. Internal roadway estimated @ 61 meters @ US$83.77 per meter of 20' hard surface 7. Marketing start-up costs include design and printing of brochure, sales calls and print advertising 8. Development start-up costs include provision for professional and legal fees and formation costs 9. Price and quantity contingency calculated @ 5% of project cost 10. Working capital projected @ one (1) month direct costs and overhead expenses 11. Foreign exchange rate: US$1.00 = J$47.00 Table 1a Nursery Construction - Details Item Units Number Cost Per Unit (US$) Total (US$)
Shade House
Sunstopper Shade Structure SQ. M 1,003 14.81 14,857
73% Black Polypropylene Shade Fabric SQ. M 1,003 3.01 3,024
Grommets GROMMET 720 0.12 86
Black Cable Tie BAG OF 100 15 10.70 161
Installation MAN-DAYS 5 12.77 64
Sub-Total: Shade House 18,191
Screen House
Insect-Proof Screen House SQ. M. 201 50.83 10,200
Installation MAN-DAYS 3 212.77 638
Sub-Total: Screen House 10,838
Potting Shed
Construction Cost SQ. M. 27 229.01 6,128
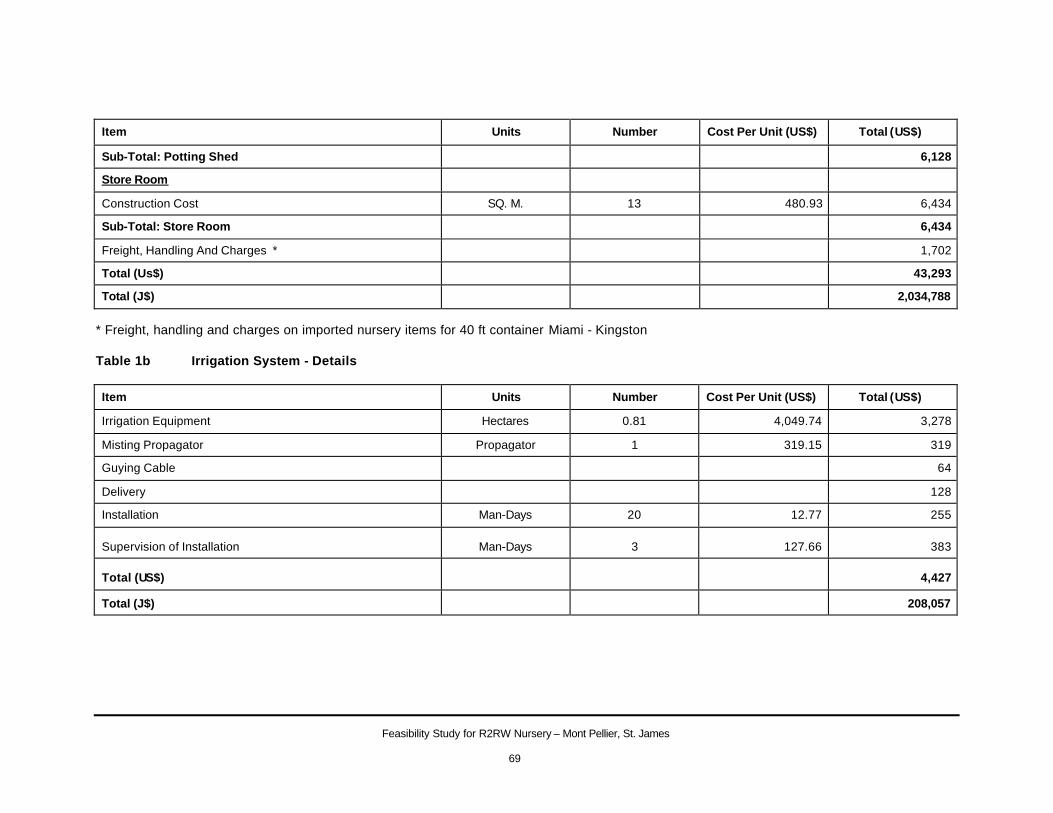
Feasibility Study for R2RW Nursery – Mont Pellier, St. James
69
Item Units Number Cost Per Unit (US$) Total (US$)
Sub-Total: Potting Shed 6,128
Store Room
Construction Cost SQ. M. 13 480.93 6,434
Sub-Total: Store Room 6,434
Freight, Handling And Charges * 1,702
Total (Us$) 43,293
Total (J$) 2,034,788
* Freight, handling and charges on imported nursery items for 40 ft container Miami - Kingston Table 1b Irrigation System - Details
Item Units Number Cost Per Unit (US$) Total (US$)
Irrigation Equipment Hectares 0.81 4,049.74 3,278
Misting Propagator Propagator 1 319.15 319
Guying Cable 64
Delivery 128
Installation Man-Days 20 12.77 255
Supervision of Installation Man-Days 3 127.66 383
Total (US$) 4,427
Total (J$) 208,057
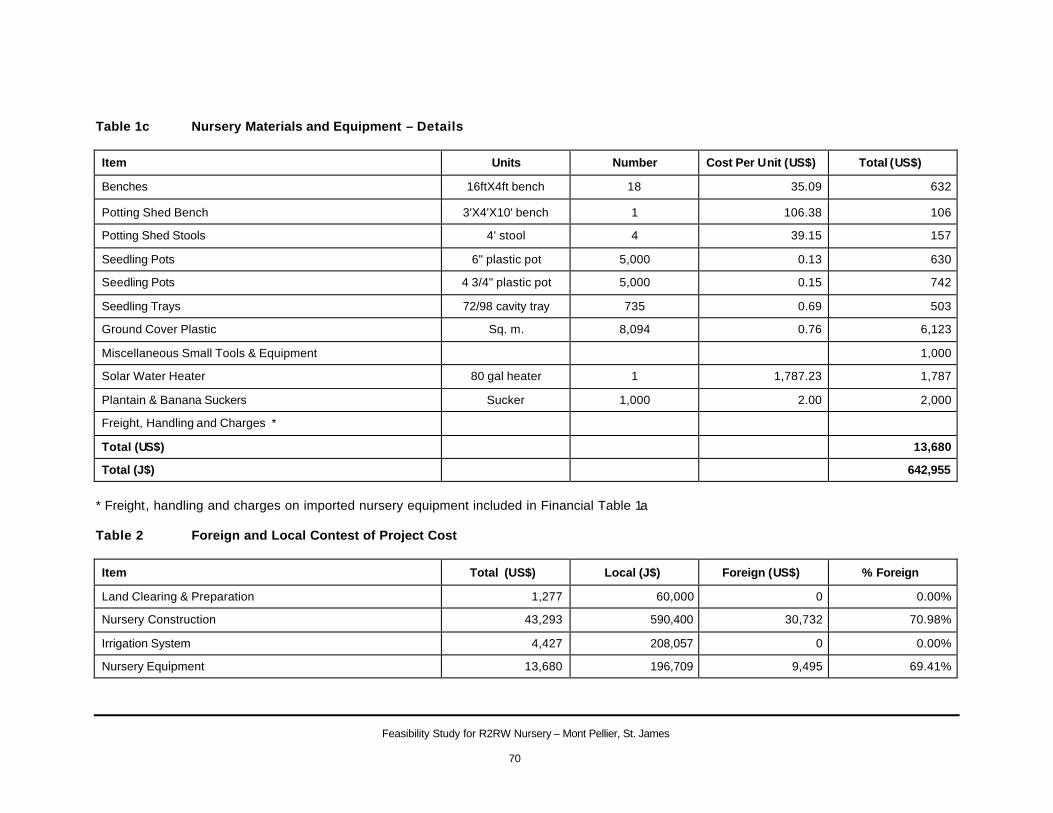
Feasibility Study for R2RW Nursery – Mont Pellier, St. James
70
Table 1c Nursery Materials and Equipment – Details
Item Units Number Cost Per Unit (US$) Total (US$)
Benches 16ftX4ft bench 18 35.09 632
Potting Shed Bench 3'X4'X10' bench 1 106.38 106
Potting Shed Stools 4' stool 4 39.15 157
Seedling Pots 6" plastic pot 5,000 0.13 630
Seedling Pots 4 3/4" plastic pot 5,000 0.15 742
Seedling Trays 72/98 cavity tray 735 0.69 503
Ground Cover Plastic Sq. m. 8,094 0.76 6,123
Miscellaneous Small Tools & Equipment 1,000
Solar Water Heater 80 gal heater 1 1,787.23 1,787
Plantain & Banana Suckers Sucker 1,000 2.00 2,000
Freight, Handling and Charges *
Total (US$) 13,680
Total (J$) 642,955
* Freight, handling and charges on imported nursery equipment included in Financial Table 1a Table 2 Foreign and Local Contest of Project Cost
Item Total (US$) Local (J$) Foreign (US$) % Foreign
Land Clearing & Preparation 1,277 60,000 0 0.00%
Nursery Construction 43,293 590,400 30,732 70.98%
Irrigation System 4,427 208,057 0 0.00%
Nursery Equipment 13,680 196,709 9,495 69.41%
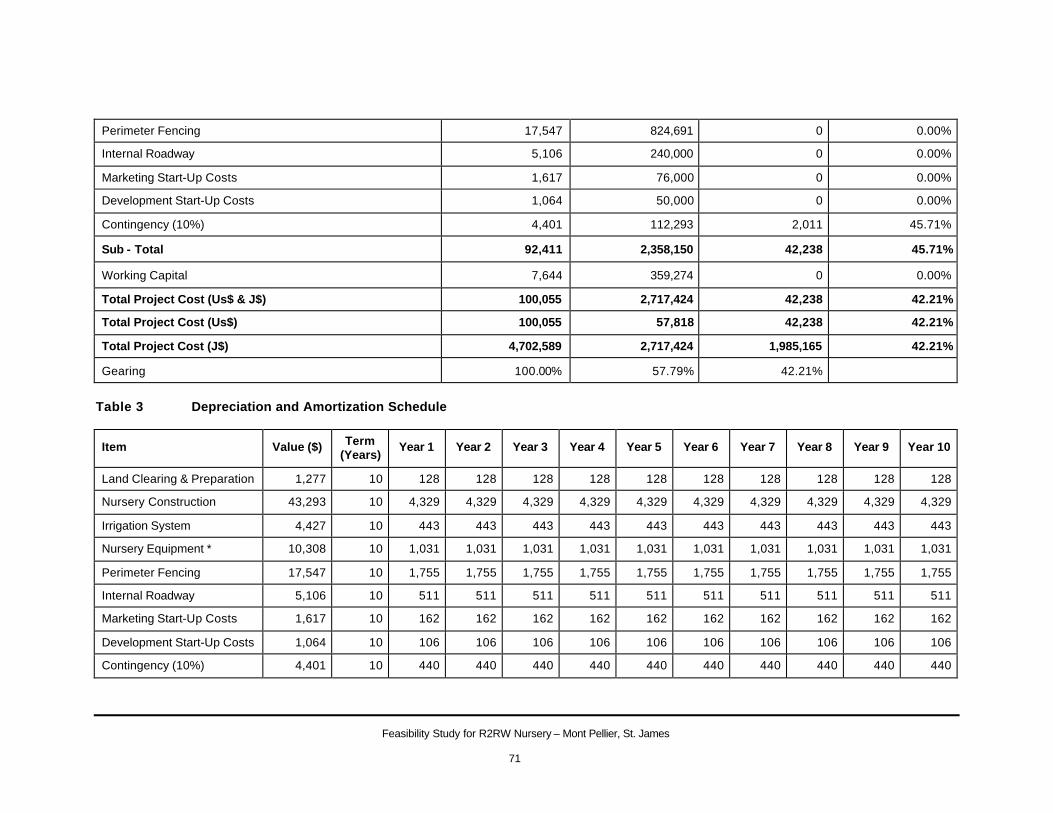
Feasibility Study for R2RW Nursery – Mont Pellier, St. James
71
Perimeter Fencing 17,547 824,691 0 0.00%
Internal Roadway 5,106 240,000 0 0.00%
Marketing Start-Up Costs 1,617 76,000 0 0.00%
Development Start-Up Costs 1,064 50,000 0 0.00%
Contingency (10%) 4,401 112,293 2,011 45.71%
Sub - Total 92,411 2,358,150 42,238 45.71%
Working Capital 7,644 359,274 0 0.00%
Total Project Cost (Us$ & J$) 100,055 2,717,424 42,238 42.21%
Total Project Cost (Us$) 100,055 57,818 42,238 42.21%
Total Project Cost (J$) 4,702,589 2,717,424 1,985,165 42.21%
Gearing 100.00% 57.79% 42.21%
Table 3 Depreciation and Amortization Schedule
Item Value ($) Term (Years)
Year 1 Year 2 Year 3 Year 4 Year 5 Year 6 Year 7 Year 8 Year 9 Year 10
Land Clearing & Preparation 1,277 10 128 128 128 128 128 128 128 128 128 128
Nursery Construction 43,293 10 4,329 4,329 4,329 4,329 4,329 4,329 4,329 4,329 4,329 4,329
Irrigation System 4,427 10 443 443 443 443 443 443 443 443 443 443
Nursery Equipment * 10,308 10 1,031 1,031 1,031 1,031 1,031 1,031 1,031 1,031 1,031 1,031
Perimeter Fencing 17,547 10 1,755 1,755 1,755 1,755 1,755 1,755 1,755 1,755 1,755 1,755
Internal Roadway 5,106 10 511 511 511 511 511 511 511 511 511 511
Marketing Start-Up Costs 1,617 10 162 162 162 162 162 162 162 162 162 162
Development Start-Up Costs 1,064 10 106 106 106 106 106 106 106 106 106 106
Contingency (10%) 4,401 10 440 440 440 440 440 440 440 440 440 440
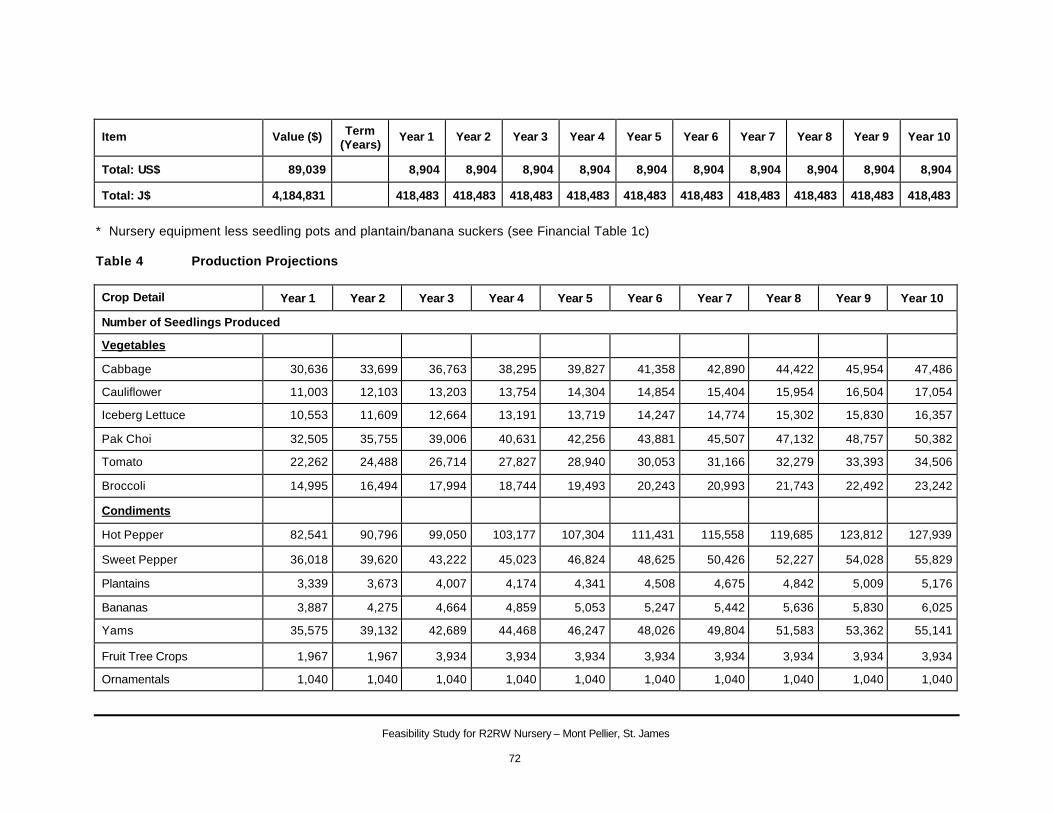
Feasibility Study for R2RW Nursery – Mont Pellier, St. James
72
Item Value ($) Term (Years)
Year 1 Year 2 Year 3 Year 4 Year 5 Year 6 Year 7 Year 8 Year 9 Year 10
Total: US$ 89,039 8,904 8,904 8,904 8,904 8,904 8,904 8,904 8,904 8,904 8,904
Total: J$ 4,184,831 418,483 418,483 418,483 418,483 418,483 418,483 418,483 418,483 418,483 418,483
* Nursery equipment less seedling pots and plantain/banana suckers (see Financial Table 1c) Table 4 Production Projections
Crop Detail Year 1 Year 2 Year 3 Year 4 Year 5 Year 6 Year 7 Year 8 Year 9 Year 10
Number of Seedlings Produced
Vegetables
Cabbage 30,636 33,699 36,763 38,295 39,827 41,358 42,890 44,422 45,954 47,486
Cauliflower 11,003 12,103 13,203 13,754 14,304 14,854 15,404 15,954 16,504 17,054
Iceberg Lettuce 10,553 11,609 12,664 13,191 13,719 14,247 14,774 15,302 15,830 16,357
Pak Choi 32,505 35,755 39,006 40,631 42,256 43,881 45,507 47,132 48,757 50,382
Tomato 22,262 24,488 26,714 27,827 28,940 30,053 31,166 32,279 33,393 34,506
Broccoli 14,995 16,494 17,994 18,744 19,493 20,243 20,993 21,743 22,492 23,242
Condiments
Hot Pepper 82,541 90,796 99,050 103,177 107,304 111,431 115,558 119,685 123,812 127,939
Sweet Pepper 36,018 39,620 43,222 45,023 46,824 48,625 50,426 52,227 54,028 55,829
Plantains 3,339 3,673 4,007 4,174 4,341 4,508 4,675 4,842 5,009 5,176
Bananas 3,887 4,275 4,664 4,859 5,053 5,247 5,442 5,636 5,830 6,025
Yams 35,575 39,132 42,689 44,468 46,247 48,026 49,804 51,583 53,362 55,141
Fruit Tree Crops 1,967 1,967 3,934 3,934 3,934 3,934 3,934 3,934 3,934 3,934
Ornamentals 1,040 1,040 1,040 1,040 1,040 1,040 1,040 1,040 1,040 1,040
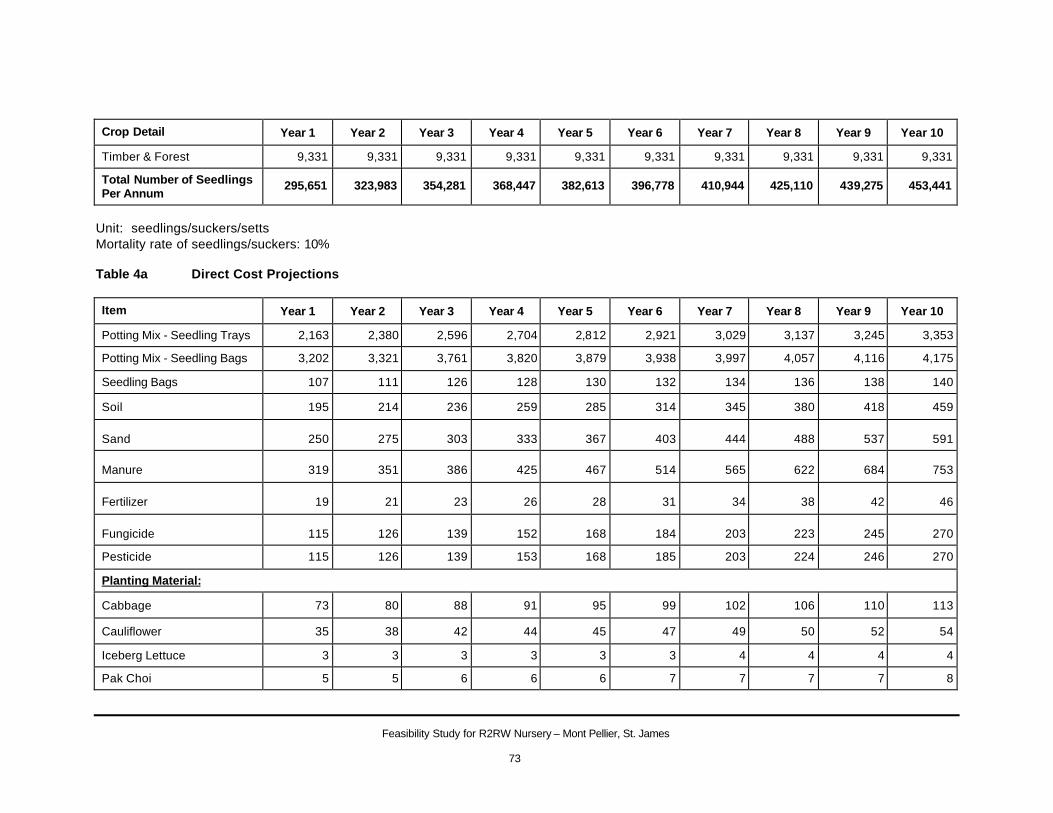
Feasibility Study for R2RW Nursery – Mont Pellier, St. James
73
Crop Detail Year 1 Year 2 Year 3 Year 4 Year 5 Year 6 Year 7 Year 8 Year 9 Year 10
Timber & Forest 9,331 9,331 9,331 9,331 9,331 9,331 9,331 9,331 9,331 9,331
Total Number of Seedlings Per Annum
295,651 323,983 354,281 368,447 382,613 396,778 410,944 425,110 439,275 453,441
Unit: seedlings/suckers/setts Mortality rate of seedlings/suckers: 10% Table 4a Direct Cost Projections
Item Year 1 Year 2 Year 3 Year 4 Year 5 Year 6 Year 7 Year 8 Year 9 Year 10
Potting Mix - Seedling Trays 2,163 2,380 2,596 2,704 2,812 2,921 3,029 3,137 3,245 3,353
Potting Mix - Seedling Bags 3,202 3,321 3,761 3,820 3,879 3,938 3,997 4,057 4,116 4,175
Seedling Bags 107 111 126 128 130 132 134 136 138 140
Soil 195 214 236 259 285 314 345 380 418 459
Sand 250 275 303 333 367 403 444 488 537 591
Manure 319 351 386 425 467 514 565 622 684 753
Fertilizer 19 21 23 26 28 31 34 38 42 46
Fungicide 115 126 139 152 168 184 203 223 245 270
Pesticide 115 126 139 153 168 185 203 224 246 270
Planting Material:
Cabbage 73 80 88 91 95 99 102 106 110 113
Cauliflower 35 38 42 44 45 47 49 50 52 54
Iceberg Lettuce 3 3 3 3 3 3 4 4 4 4
Pak Choi 5 5 6 6 6 7 7 7 7 8
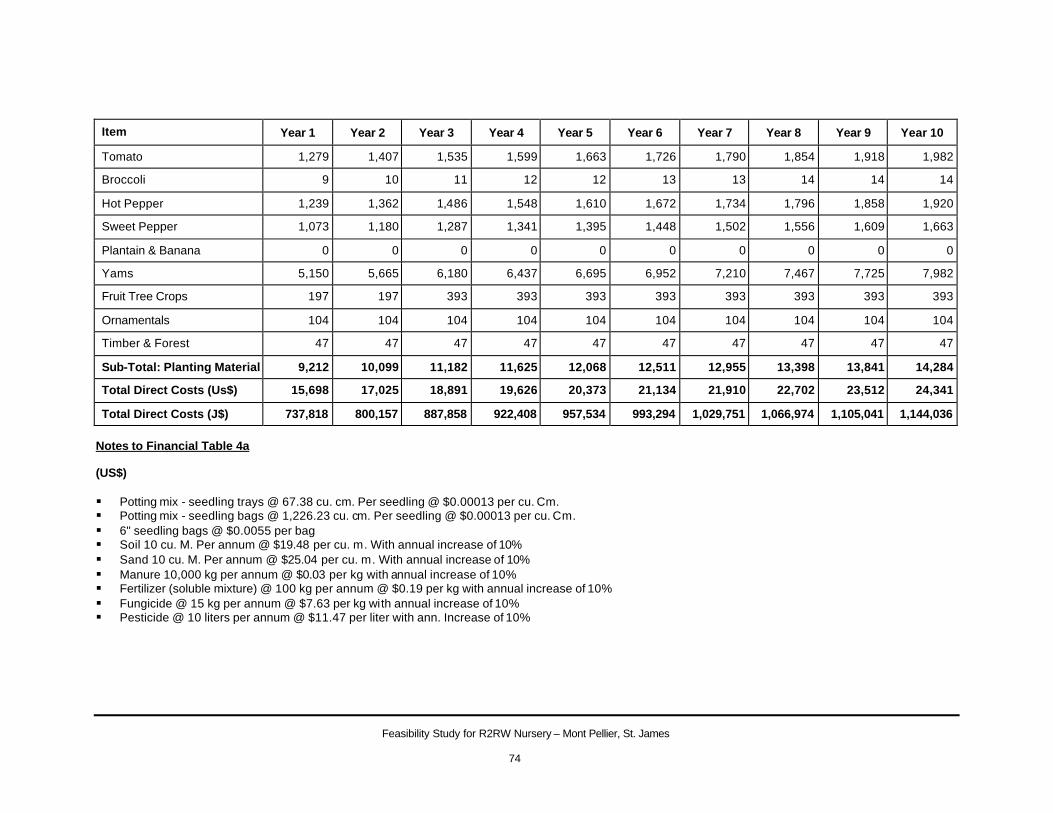
Feasibility Study for R2RW Nursery – Mont Pellier, St. James
74
Item Year 1 Year 2 Year 3 Year 4 Year 5 Year 6 Year 7 Year 8 Year 9 Year 10
Tomato 1,279 1,407 1,535 1,599 1,663 1,726 1,790 1,854 1,918 1,982
Broccoli 9 10 11 12 12 13 13 14 14 14
Hot Pepper 1,239 1,362 1,486 1,548 1,610 1,672 1,734 1,796 1,858 1,920
Sweet Pepper 1,073 1,180 1,287 1,341 1,395 1,448 1,502 1,556 1,609 1,663
Plantain & Banana 0 0 0 0 0 0 0 0 0 0
Yams 5,150 5,665 6,180 6,437 6,695 6,952 7,210 7,467 7,725 7,982
Fruit Tree Crops 197 197 393 393 393 393 393 393 393 393
Ornamentals 104 104 104 104 104 104 104 104 104 104
Timber & Forest 47 47 47 47 47 47 47 47 47 47
Sub-Total: Planting Material 9,212 10,099 11,182 11,625 12,068 12,511 12,955 13,398 13,841 14,284
Total Direct Costs (Us$) 15,698 17,025 18,891 19,626 20,373 21,134 21,910 22,702 23,512 24,341
Total Direct Costs (J$) 737,818 800,157 887,858 922,408 957,534 993,294 1,029,751 1,066,974 1,105,041 1,144,036
Notes to Financial Table 4a (US$) § Potting mix - seedling trays @ 67.38 cu. cm. Per seedling @ $0.00013 per cu. Cm. § Potting mix - seedling bags @ 1,226.23 cu. cm. Per seedling @ $0.00013 per cu. Cm. § 6" seedling bags @ $0.0055 per bag § Soil 10 cu. M. Per annum @ $19.48 per cu. m. With annual increase of 10% § Sand 10 cu. M. Per annum @ $25.04 per cu. m. With annual increase of 10% § Manure 10,000 kg per annum @ $0.03 per kg with annual increase of 10% § Fertilizer (soluble mixture) @ 100 kg per annum @ $0.19 per kg with annual increase of 10% § Fungicide @ 15 kg per annum @ $7.63 per kg with annual increase of 10% § Pesticide @ 10 liters per annum @ $11.47 per liter with ann. Increase of 10%
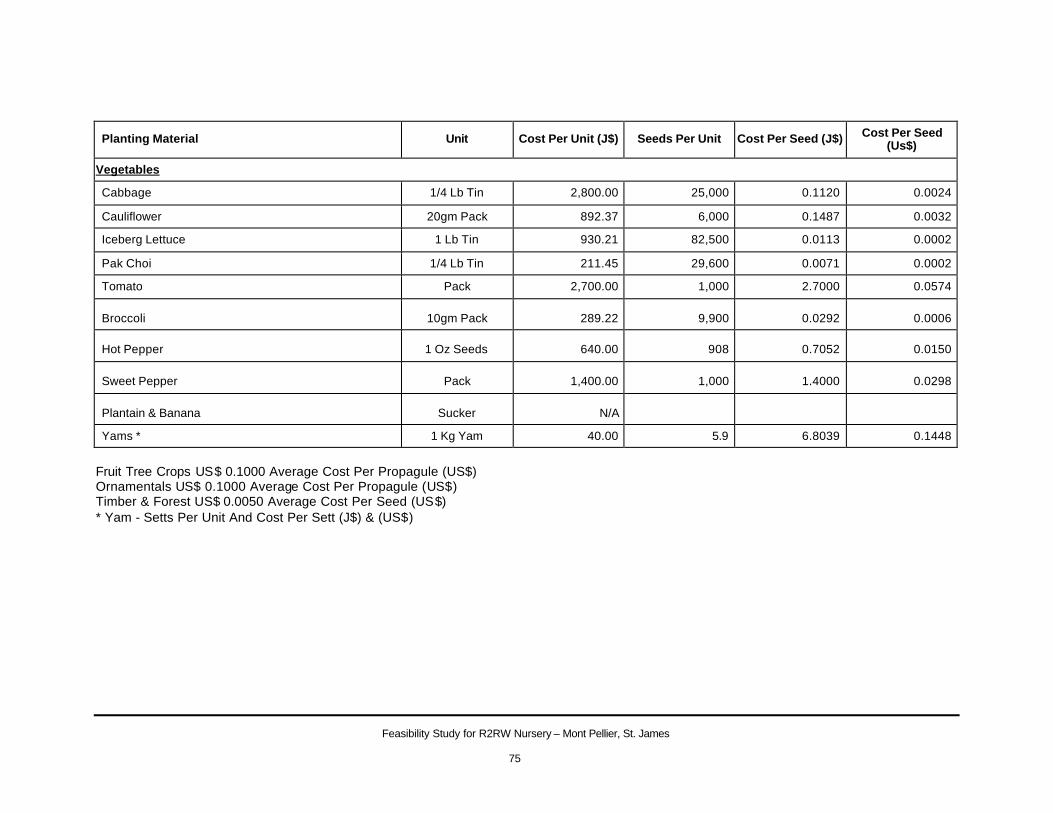
Feasibility Study for R2RW Nursery – Mont Pellier, St. James
75
Planting Material Unit Cost Per Unit (J$) Seeds Per Unit Cost Per Seed (J$) Cost Per Seed (Us$)
Vegetables
Cabbage 1/4 Lb Tin 2,800.00 25,000 0.1120 0.0024
Cauliflower 20gm Pack 892.37 6,000 0.1487 0.0032
Iceberg Lettuce 1 Lb Tin 930.21 82,500 0.0113 0.0002
Pak Choi 1/4 Lb Tin 211.45 29,600 0.0071 0.0002
Tomato Pack 2,700.00 1,000 2.7000 0.0574
Broccoli 10gm Pack 289.22 9,900 0.0292 0.0006
Hot Pepper 1 Oz Seeds 640.00 908 0.7052 0.0150
Sweet Pepper Pack 1,400.00 1,000 1.4000 0.0298
Plantain & Banana Sucker N/A
Yams * 1 Kg Yam 40.00 5.9 6.8039 0.1448
Fruit Tree Crops US$ 0.1000 Average Cost Per Propagule (US$) Ornamentals US$ 0.1000 Average Cost Per Propagule (US$) Timber & Forest US$ 0.0050 Average Cost Per Seed (US$) * Yam - Setts Per Unit And Cost Per Sett (J$) & (US$)
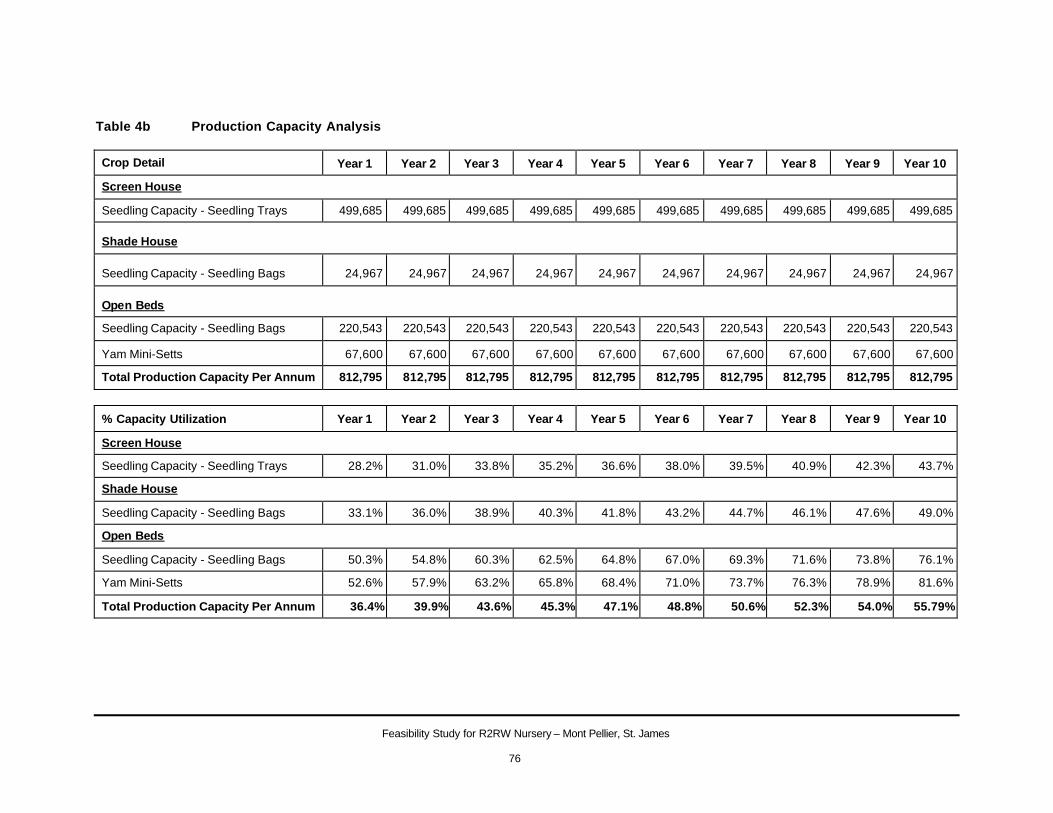
Feasibility Study for R2RW Nursery – Mont Pellier, St. James
76
Table 4b Production Capacity Analysis
Crop Detail Year 1 Year 2 Year 3 Year 4 Year 5 Year 6 Year 7 Year 8 Year 9 Year 10
Screen House
Seedling Capacity - Seedling Trays 499,685 499,685 499,685 499,685 499,685 499,685 499,685 499,685 499,685 499,685
Shade House
Seedling Capacity - Seedling Bags 24,967 24,967 24,967 24,967 24,967 24,967 24,967 24,967 24,967 24,967
Open Beds
Seedling Capacity - Seedling Bags 220,543 220,543 220,543 220,543 220,543 220,543 220,543 220,543 220,543 220,543
Yam Mini-Setts 67,600 67,600 67,600 67,600 67,600 67,600 67,600 67,600 67,600 67,600
Total Production Capacity Per Annum 812,795 812,795 812,795 812,795 812,795 812,795 812,795 812,795 812,795 812,795
% Capacity Utilization Year 1 Year 2 Year 3 Year 4 Year 5 Year 6 Year 7 Year 8 Year 9 Year 10
Screen House
Seedling Capacity - Seedling Trays 28.2% 31.0% 33.8% 35.2% 36.6% 38.0% 39.5% 40.9% 42.3% 43.7%
Shade House
Seedling Capacity - Seedling Bags 33.1% 36.0% 38.9% 40.3% 41.8% 43.2% 44.7% 46.1% 47.6% 49.0%
Open Beds
Seedling Capacity - Seedling Bags 50.3% 54.8% 60.3% 62.5% 64.8% 67.0% 69.3% 71.6% 73.8% 76.1%
Yam Mini-Setts 52.6% 57.9% 63.2% 65.8% 68.4% 71.0% 73.7% 76.3% 78.9% 81.6%
Total Production Capacity Per Annum 36.4% 39.9% 43.6% 45.3% 47.1% 48.8% 50.6% 52.3% 54.0% 55.79%
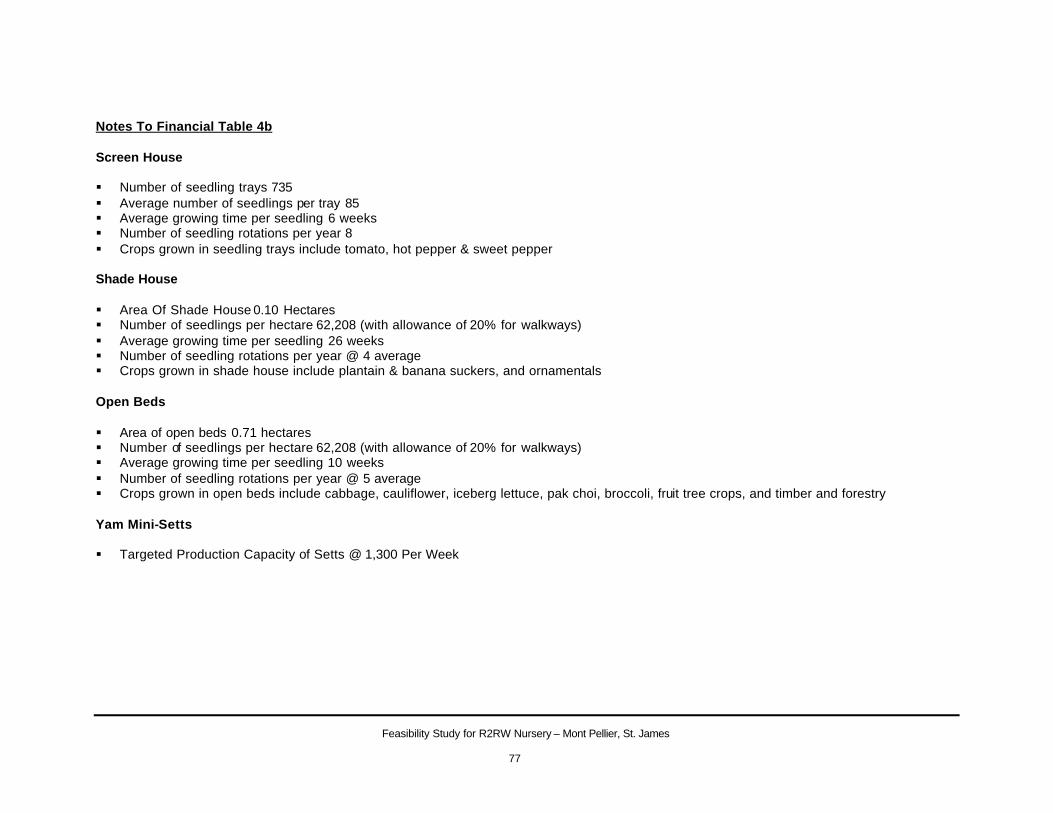
Feasibility Study for R2RW Nursery – Mont Pellier, St. James
77
Notes To Financial Table 4b Screen House § Number of seedling trays 735 § Average number of seedlings per tray 85 § Average growing time per seedling 6 weeks § Number of seedling rotations per year 8 § Crops grown in seedling trays include tomato, hot pepper & sweet pepper Shade House § Area Of Shade House 0.10 Hectares § Number of seedlings per hectare 62,208 (with allowance of 20% for walkways) § Average growing time per seedling 26 weeks § Number of seedling rotations per year @ 4 average § Crops grown in shade house include plantain & banana suckers, and ornamentals Open Beds § Area of open beds 0.71 hectares § Number of seedlings per hectare 62,208 (with allowance of 20% for walkways) § Average growing time per seedling 10 weeks § Number of seedling rotations per year @ 5 average § Crops grown in open beds include cabbage, cauliflower, iceberg lettuce, pak choi, broccoli, fruit tree crops, and timber and forestry Yam Mini-Setts § Targeted Production Capacity of Setts @ 1,300 Per Week
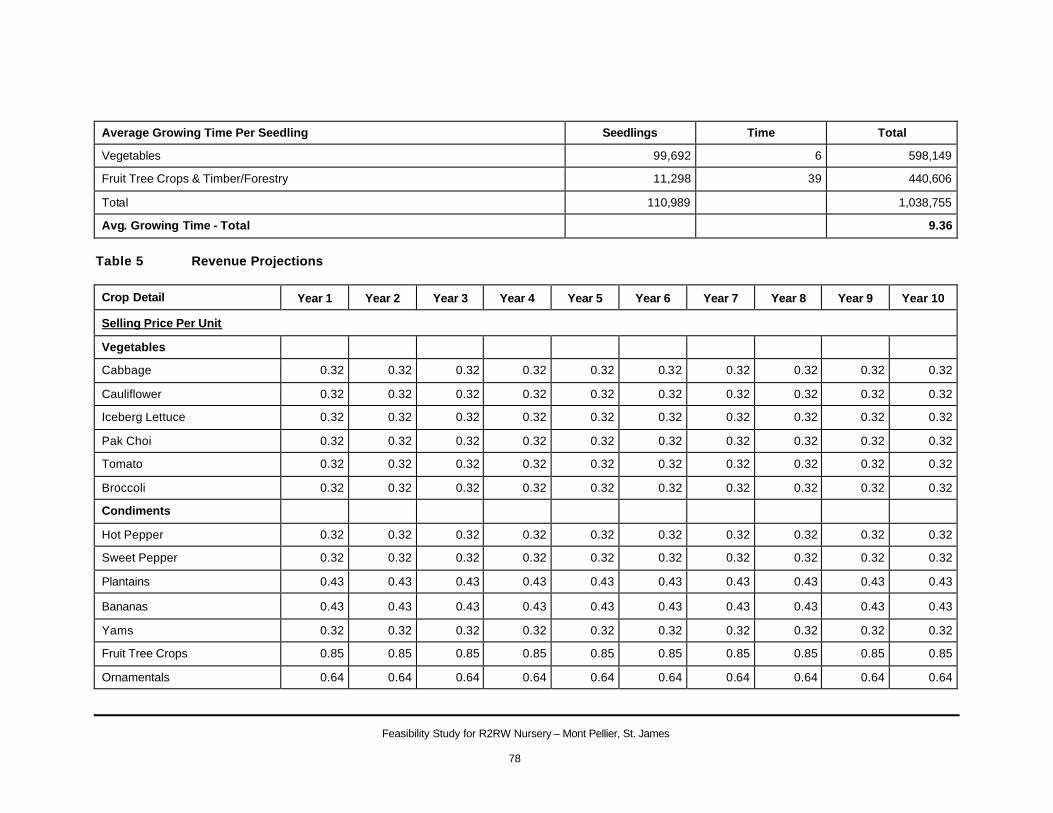
Feasibility Study for R2RW Nursery – Mont Pellier, St. James
78
Average Growing Time Per Seedling Seedlings Time Total
Vegetables 99,692 6 598,149
Fruit Tree Crops & Timber/Forestry 11,298 39 440,606
Total 110,989 1,038,755
Avg. Growing Time - Total 9.36
Table 5 Revenue Projections
Crop Detail Year 1 Year 2 Year 3 Year 4 Year 5 Year 6 Year 7 Year 8 Year 9 Year 10
Selling Price Per Unit
Vegetables
Cabbage 0.32 0.32 0.32 0.32 0.32 0.32 0.32 0.32 0.32 0.32
Cauliflower 0.32 0.32 0.32 0.32 0.32 0.32 0.32 0.32 0.32 0.32
Iceberg Lettuce 0.32 0.32 0.32 0.32 0.32 0.32 0.32 0.32 0.32 0.32
Pak Choi 0.32 0.32 0.32 0.32 0.32 0.32 0.32 0.32 0.32 0.32
Tomato 0.32 0.32 0.32 0.32 0.32 0.32 0.32 0.32 0.32 0.32
Broccoli 0.32 0.32 0.32 0.32 0.32 0.32 0.32 0.32 0.32 0.32
Condiments
Hot Pepper 0.32 0.32 0.32 0.32 0.32 0.32 0.32 0.32 0.32 0.32
Sweet Pepper 0.32 0.32 0.32 0.32 0.32 0.32 0.32 0.32 0.32 0.32
Plantains 0.43 0.43 0.43 0.43 0.43 0.43 0.43 0.43 0.43 0.43
Bananas 0.43 0.43 0.43 0.43 0.43 0.43 0.43 0.43 0.43 0.43
Yams 0.32 0.32 0.32 0.32 0.32 0.32 0.32 0.32 0.32 0.32
Fruit Tree Crops 0.85 0.85 0.85 0.85 0.85 0.85 0.85 0.85 0.85 0.85
Ornamentals 0.64 0.64 0.64 0.64 0.64 0.64 0.64 0.64 0.64 0.64
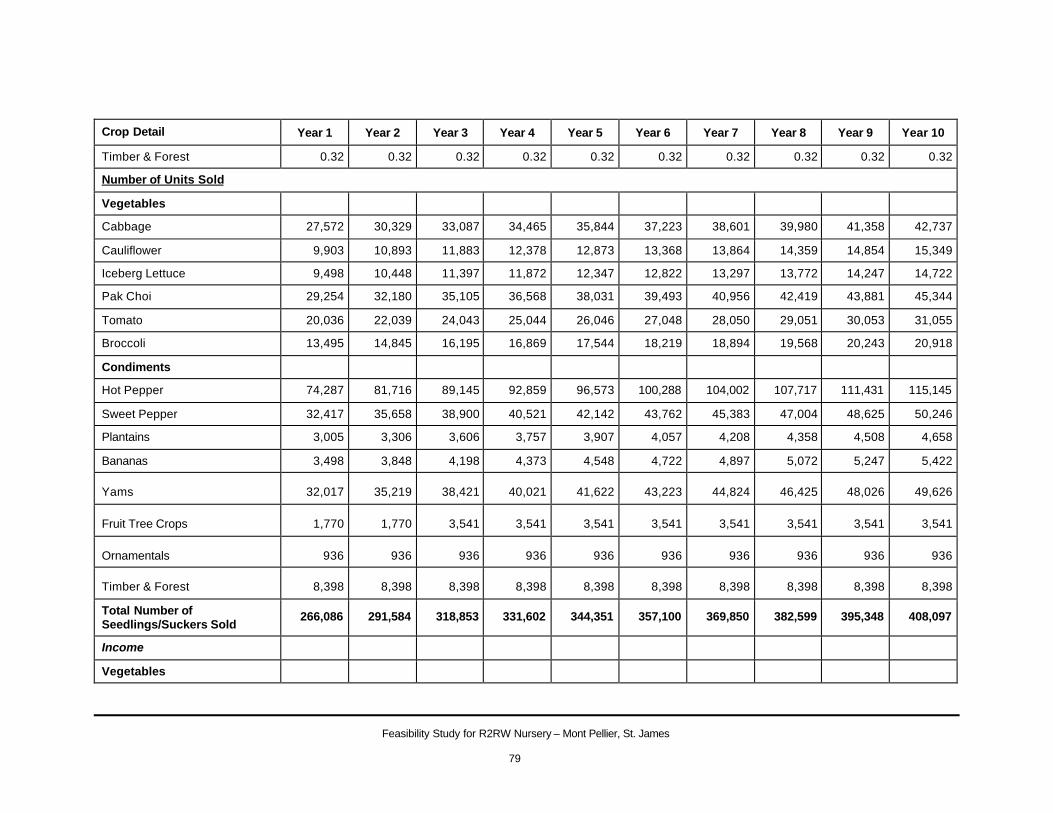
Feasibility Study for R2RW Nursery – Mont Pellier, St. James
79
Crop Detail Year 1 Year 2 Year 3 Year 4 Year 5 Year 6 Year 7 Year 8 Year 9 Year 10
Timber & Forest 0.32 0.32 0.32 0.32 0.32 0.32 0.32 0.32 0.32 0.32
Number of Units Sold
Vegetables
Cabbage 27,572 30,329 33,087 34,465 35,844 37,223 38,601 39,980 41,358 42,737
Cauliflower 9,903 10,893 11,883 12,378 12,873 13,368 13,864 14,359 14,854 15,349
Iceberg Lettuce 9,498 10,448 11,397 11,872 12,347 12,822 13,297 13,772 14,247 14,722
Pak Choi 29,254 32,180 35,105 36,568 38,031 39,493 40,956 42,419 43,881 45,344
Tomato 20,036 22,039 24,043 25,044 26,046 27,048 28,050 29,051 30,053 31,055
Broccoli 13,495 14,845 16,195 16,869 17,544 18,219 18,894 19,568 20,243 20,918
Condiments
Hot Pepper 74,287 81,716 89,145 92,859 96,573 100,288 104,002 107,717 111,431 115,145
Sweet Pepper 32,417 35,658 38,900 40,521 42,142 43,762 45,383 47,004 48,625 50,246
Plantains 3,005 3,306 3,606 3,757 3,907 4,057 4,208 4,358 4,508 4,658
Bananas 3,498 3,848 4,198 4,373 4,548 4,722 4,897 5,072 5,247 5,422
Yams 32,017 35,219 38,421 40,021 41,622 43,223 44,824 46,425 48,026 49,626
Fruit Tree Crops 1,770 1,770 3,541 3,541 3,541 3,541 3,541 3,541 3,541 3,541
Ornamentals 936 936 936 936 936 936 936 936 936 936
Timber & Forest 8,398 8,398 8,398 8,398 8,398 8,398 8,398 8,398 8,398 8,398
Total Number of Seedlings/Suckers Sold
266,086 291,584 318,853 331,602 344,351 357,100 369,850 382,599 395,348 408,097
Income
Vegetables
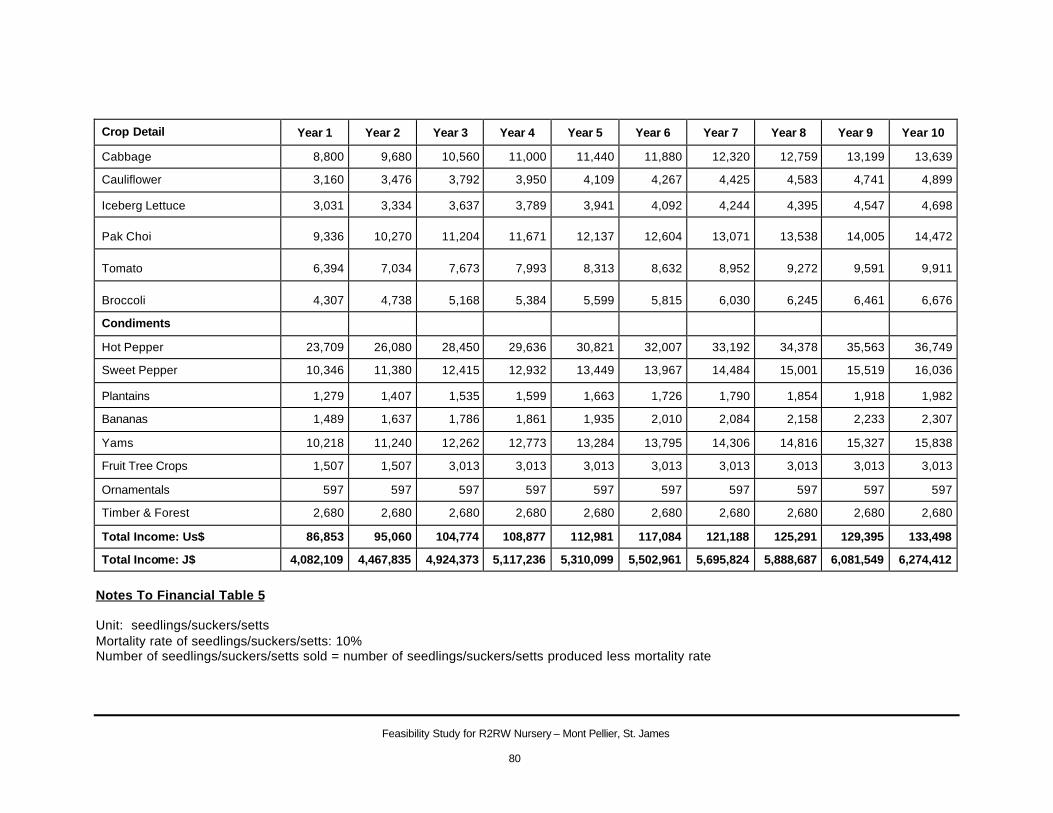
Feasibility Study for R2RW Nursery – Mont Pellier, St. James
80
Crop Detail Year 1 Year 2 Year 3 Year 4 Year 5 Year 6 Year 7 Year 8 Year 9 Year 10
Cabbage 8,800 9,680 10,560 11,000 11,440 11,880 12,320 12,759 13,199 13,639
Cauliflower 3,160 3,476 3,792 3,950 4,109 4,267 4,425 4,583 4,741 4,899
Iceberg Lettuce 3,031 3,334 3,637 3,789 3,941 4,092 4,244 4,395 4,547 4,698
Pak Choi 9,336 10,270 11,204 11,671 12,137 12,604 13,071 13,538 14,005 14,472
Tomato 6,394 7,034 7,673 7,993 8,313 8,632 8,952 9,272 9,591 9,911
Broccoli 4,307 4,738 5,168 5,384 5,599 5,815 6,030 6,245 6,461 6,676
Condiments
Hot Pepper 23,709 26,080 28,450 29,636 30,821 32,007 33,192 34,378 35,563 36,749
Sweet Pepper 10,346 11,380 12,415 12,932 13,449 13,967 14,484 15,001 15,519 16,036
Plantains 1,279 1,407 1,535 1,599 1,663 1,726 1,790 1,854 1,918 1,982
Bananas 1,489 1,637 1,786 1,861 1,935 2,010 2,084 2,158 2,233 2,307
Yams 10,218 11,240 12,262 12,773 13,284 13,795 14,306 14,816 15,327 15,838
Fruit Tree Crops 1,507 1,507 3,013 3,013 3,013 3,013 3,013 3,013 3,013 3,013
Ornamentals 597 597 597 597 597 597 597 597 597 597
Timber & Forest 2,680 2,680 2,680 2,680 2,680 2,680 2,680 2,680 2,680 2,680
Total Income: Us$ 86,853 95,060 104,774 108,877 112,981 117,084 121,188 125,291 129,395 133,498
Total Income: J$ 4,082,109 4,467,835 4,924,373 5,117,236 5,310,099 5,502,961 5,695,824 5,888,687 6,081,549 6,274,412
Notes To Financial Table 5 Unit: seedlings/suckers/setts Mortality rate of seedlings/suckers/setts: 10% Number of seedlings/suckers/setts sold = number of seedlings/suckers/setts produced less mortality rate
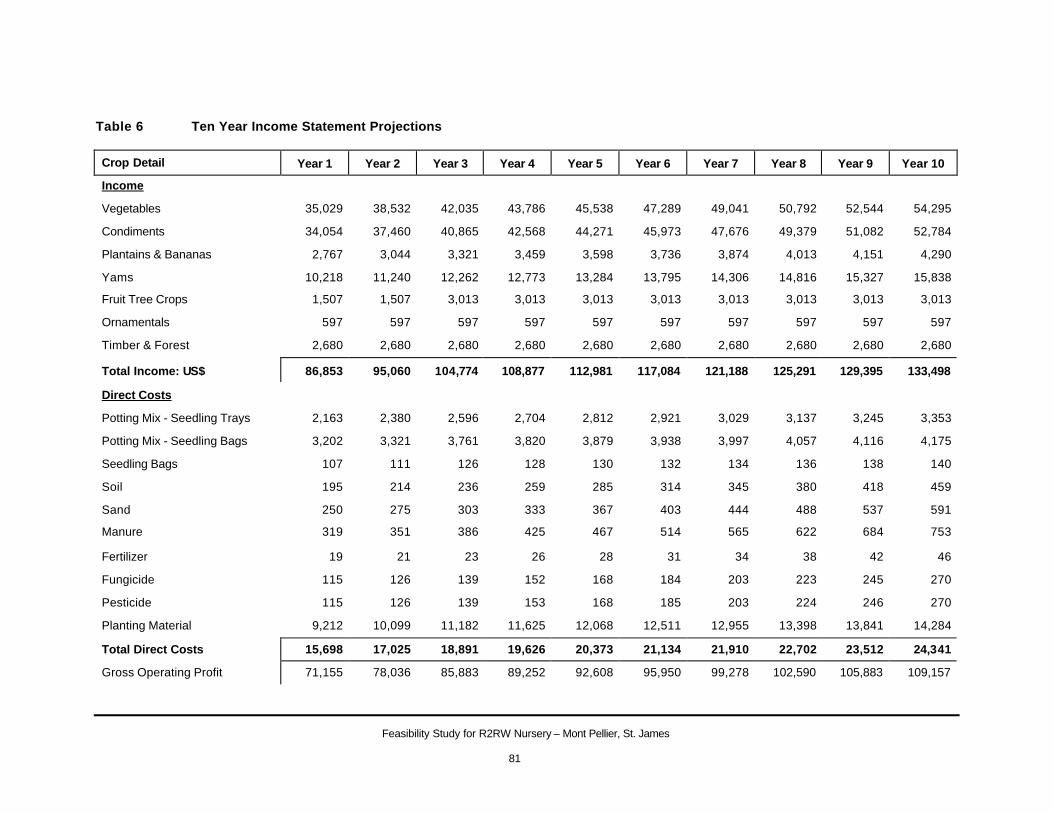
Feasibility Study for R2RW Nursery – Mont Pellier, St. James
81
Table 6 Ten Year Income Statement Projections
Crop Detail Year 1 Year 2 Year 3 Year 4 Year 5 Year 6 Year 7 Year 8 Year 9 Year 10
Income
Vegetables 35,029 38,532 42,035 43,786 45,538 47,289 49,041 50,792 52,544 54,295
Condiments 34,054 37,460 40,865 42,568 44,271 45,973 47,676 49,379 51,082 52,784
Plantains & Bananas 2,767 3,044 3,321 3,459 3,598 3,736 3,874 4,013 4,151 4,290
Yams 10,218 11,240 12,262 12,773 13,284 13,795 14,306 14,816 15,327 15,838
Fruit Tree Crops 1,507 1,507 3,013 3,013 3,013 3,013 3,013 3,013 3,013 3,013
Ornamentals 597 597 597 597 597 597 597 597 597 597
Timber & Forest 2,680 2,680 2,680 2,680 2,680 2,680 2,680 2,680 2,680 2,680
Total Income: US$ 86,853 95,060 104,774 108,877 112,981 117,084 121,188 125,291 129,395 133,498
Direct Costs
Potting Mix - Seedling Trays 2,163 2,380 2,596 2,704 2,812 2,921 3,029 3,137 3,245 3,353
Potting Mix - Seedling Bags 3,202 3,321 3,761 3,820 3,879 3,938 3,997 4,057 4,116 4,175
Seedling Bags 107 111 126 128 130 132 134 136 138 140
Soil 195 214 236 259 285 314 345 380 418 459
Sand 250 275 303 333 367 403 444 488 537 591
Manure 319 351 386 425 467 514 565 622 684 753
Fertilizer 19 21 23 26 28 31 34 38 42 46
Fungicide 115 126 139 152 168 184 203 223 245 270
Pesticide 115 126 139 153 168 185 203 224 246 270
Planting Material 9,212 10,099 11,182 11,625 12,068 12,511 12,955 13,398 13,841 14,284
Total Direct Costs 15,698 17,025 18,891 19,626 20,373 21,134 21,910 22,702 23,512 24,341
Gross Operating Profit 71,155 78,036 85,883 89,252 92,608 95,950 99,278 102,590 105,883 109,157
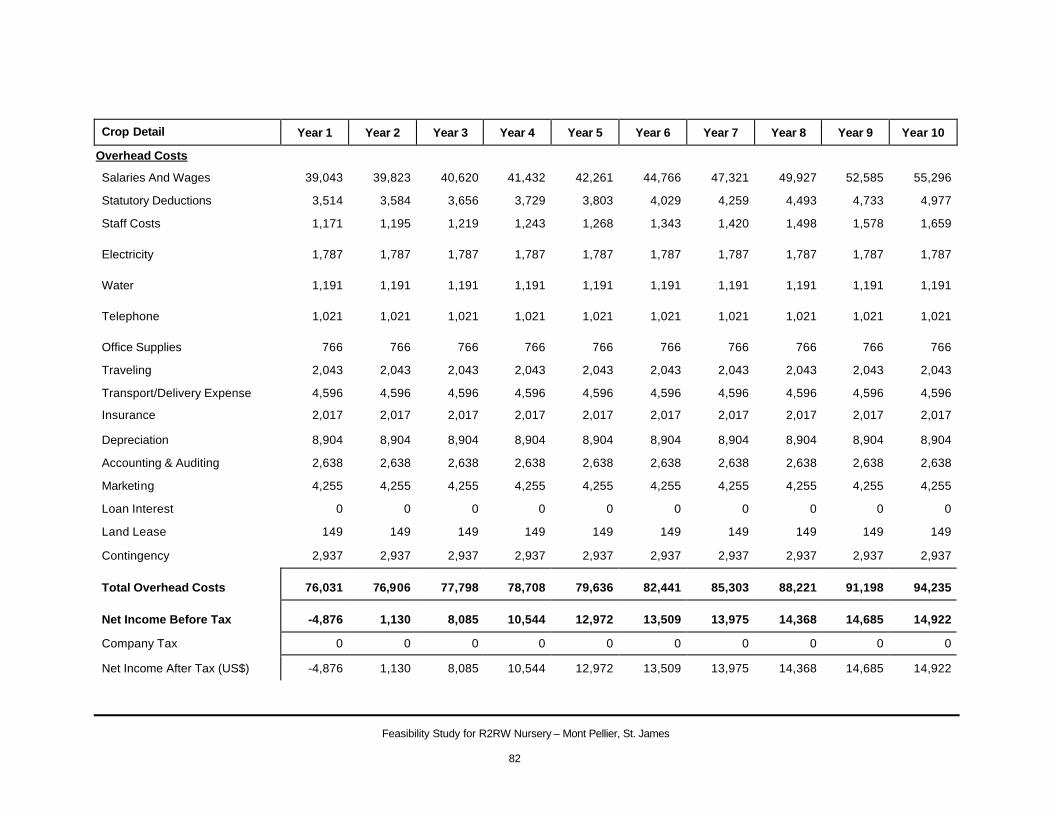
Feasibility Study for R2RW Nursery – Mont Pellier, St. James
82
Crop Detail Year 1 Year 2 Year 3 Year 4 Year 5 Year 6 Year 7 Year 8 Year 9 Year 10
Overhead Costs
Salaries And Wages 39,043 39,823 40,620 41,432 42,261 44,766 47,321 49,927 52,585 55,296
Statutory Deductions 3,514 3,584 3,656 3,729 3,803 4,029 4,259 4,493 4,733 4,977
Staff Costs 1,171 1,195 1,219 1,243 1,268 1,343 1,420 1,498 1,578 1,659
Electricity 1,787 1,787 1,787 1,787 1,787 1,787 1,787 1,787 1,787 1,787
Water 1,191 1,191 1,191 1,191 1,191 1,191 1,191 1,191 1,191 1,191
Telephone 1,021 1,021 1,021 1,021 1,021 1,021 1,021 1,021 1,021 1,021
Office Supplies 766 766 766 766 766 766 766 766 766 766
Traveling 2,043 2,043 2,043 2,043 2,043 2,043 2,043 2,043 2,043 2,043
Transport/Delivery Expense 4,596 4,596 4,596 4,596 4,596 4,596 4,596 4,596 4,596 4,596
Insurance 2,017 2,017 2,017 2,017 2,017 2,017 2,017 2,017 2,017 2,017
Depreciation 8,904 8,904 8,904 8,904 8,904 8,904 8,904 8,904 8,904 8,904
Accounting & Auditing 2,638 2,638 2,638 2,638 2,638 2,638 2,638 2,638 2,638 2,638
Marketing 4,255 4,255 4,255 4,255 4,255 4,255 4,255 4,255 4,255 4,255
Loan Interest 0 0 0 0 0 0 0 0 0 0
Land Lease 149 149 149 149 149 149 149 149 149 149
Contingency 2,937 2,937 2,937 2,937 2,937 2,937 2,937 2,937 2,937 2,937
Total Overhead Costs 76,031 76,906 77,798 78,708 79,636 82,441 85,303 88,221 91,198 94,235
Net Income Before Tax -4,876 1,130 8,085 10,544 12,972 13,509 13,975 14,368 14,685 14,922
Company Tax 0 0 0 0 0 0 0 0 0 0
Net Income After Tax (US$) -4,876 1,130 8,085 10,544 12,972 13,509 13,975 14,368 14,685 14,922
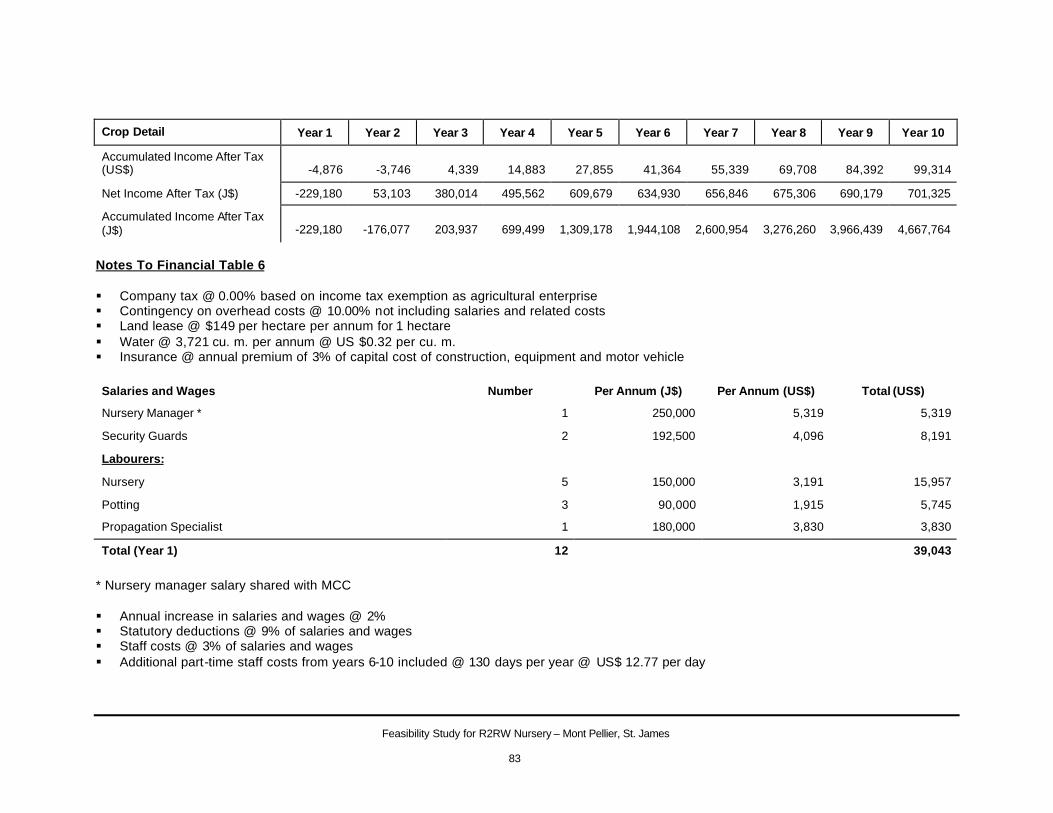
Feasibility Study for R2RW Nursery – Mont Pellier, St. James
83
Crop Detail Year 1 Year 2 Year 3 Year 4 Year 5 Year 6 Year 7 Year 8 Year 9 Year 10
Accumulated Income After Tax (US$) -4,876 -3,746 4,339 14,883 27,855 41,364 55,339 69,708 84,392 99,314
Net Income After Tax (J$) -229,180 53,103 380,014 495,562 609,679 634,930 656,846 675,306 690,179 701,325
Accumulated Income After Tax (J$) -229,180 -176,077 203,937 699,499 1,309,178 1,944,108 2,600,954 3,276,260 3,966,439 4,667,764
Notes To Financial Table 6 § Company tax @ 0.00% based on income tax exemption as agricultural enterprise § Contingency on overhead costs @ 10.00% not including salaries and related costs § Land lease @ $149 per hectare per annum for 1 hectare § Water @ 3,721 cu. m. per annum @ US $0.32 per cu. m. § Insurance @ annual premium of 3% of capital cost of construction, equipment and motor vehicle Salaries and Wages Number Per Annum (J$) Per Annum (US$) Total (US$)
Nursery Manager * 1 250,000 5,319 5,319
Security Guards 2 192,500 4,096 8,191
Labourers:
Nursery 5 150,000 3,191 15,957
Potting 3 90,000 1,915 5,745
Propagation Specialist 1 180,000 3,830 3,830
Total (Year 1) 12 39,043
* Nursery manager salary shared with MCC § Annual increase in salaries and wages @ 2% § Statutory deductions @ 9% of salaries and wages § Staff costs @ 3% of salaries and wages § Additional part-time staff costs from years 6-10 included @ 130 days per year @ US$ 12.77 per day
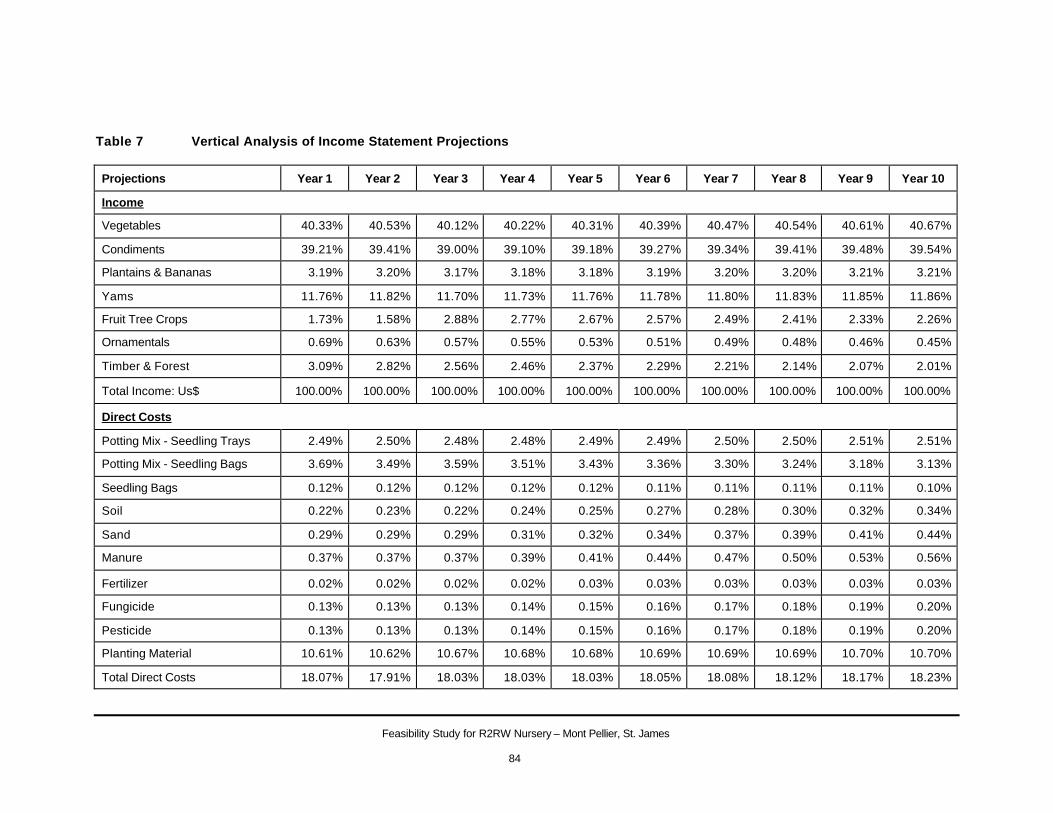
Feasibility Study for R2RW Nursery – Mont Pellier, St. James
84
Table 7 Vertical Analysis of Income Statement Projections
Projections Year 1 Year 2 Year 3 Year 4 Year 5 Year 6 Year 7 Year 8 Year 9 Year 10
Income
Vegetables 40.33% 40.53% 40.12% 40.22% 40.31% 40.39% 40.47% 40.54% 40.61% 40.67%
Condiments 39.21% 39.41% 39.00% 39.10% 39.18% 39.27% 39.34% 39.41% 39.48% 39.54%
Plantains & Bananas 3.19% 3.20% 3.17% 3.18% 3.18% 3.19% 3.20% 3.20% 3.21% 3.21%
Yams 11.76% 11.82% 11.70% 11.73% 11.76% 11.78% 11.80% 11.83% 11.85% 11.86%
Fruit Tree Crops 1.73% 1.58% 2.88% 2.77% 2.67% 2.57% 2.49% 2.41% 2.33% 2.26%
Ornamentals 0.69% 0.63% 0.57% 0.55% 0.53% 0.51% 0.49% 0.48% 0.46% 0.45%
Timber & Forest 3.09% 2.82% 2.56% 2.46% 2.37% 2.29% 2.21% 2.14% 2.07% 2.01%
Total Income: Us$ 100.00% 100.00% 100.00% 100.00% 100.00% 100.00% 100.00% 100.00% 100.00% 100.00%
Direct Costs
Potting Mix - Seedling Trays 2.49% 2.50% 2.48% 2.48% 2.49% 2.49% 2.50% 2.50% 2.51% 2.51%
Potting Mix - Seedling Bags 3.69% 3.49% 3.59% 3.51% 3.43% 3.36% 3.30% 3.24% 3.18% 3.13%
Seedling Bags 0.12% 0.12% 0.12% 0.12% 0.12% 0.11% 0.11% 0.11% 0.11% 0.10%
Soil 0.22% 0.23% 0.22% 0.24% 0.25% 0.27% 0.28% 0.30% 0.32% 0.34%
Sand 0.29% 0.29% 0.29% 0.31% 0.32% 0.34% 0.37% 0.39% 0.41% 0.44%
Manure 0.37% 0.37% 0.37% 0.39% 0.41% 0.44% 0.47% 0.50% 0.53% 0.56%
Fertilizer 0.02% 0.02% 0.02% 0.02% 0.03% 0.03% 0.03% 0.03% 0.03% 0.03%
Fungicide 0.13% 0.13% 0.13% 0.14% 0.15% 0.16% 0.17% 0.18% 0.19% 0.20%
Pesticide 0.13% 0.13% 0.13% 0.14% 0.15% 0.16% 0.17% 0.18% 0.19% 0.20%
Planting Material 10.61% 10.62% 10.67% 10.68% 10.68% 10.69% 10.69% 10.69% 10.70% 10.70%
Total Direct Costs 18.07% 17.91% 18.03% 18.03% 18.03% 18.05% 18.08% 18.12% 18.17% 18.23%
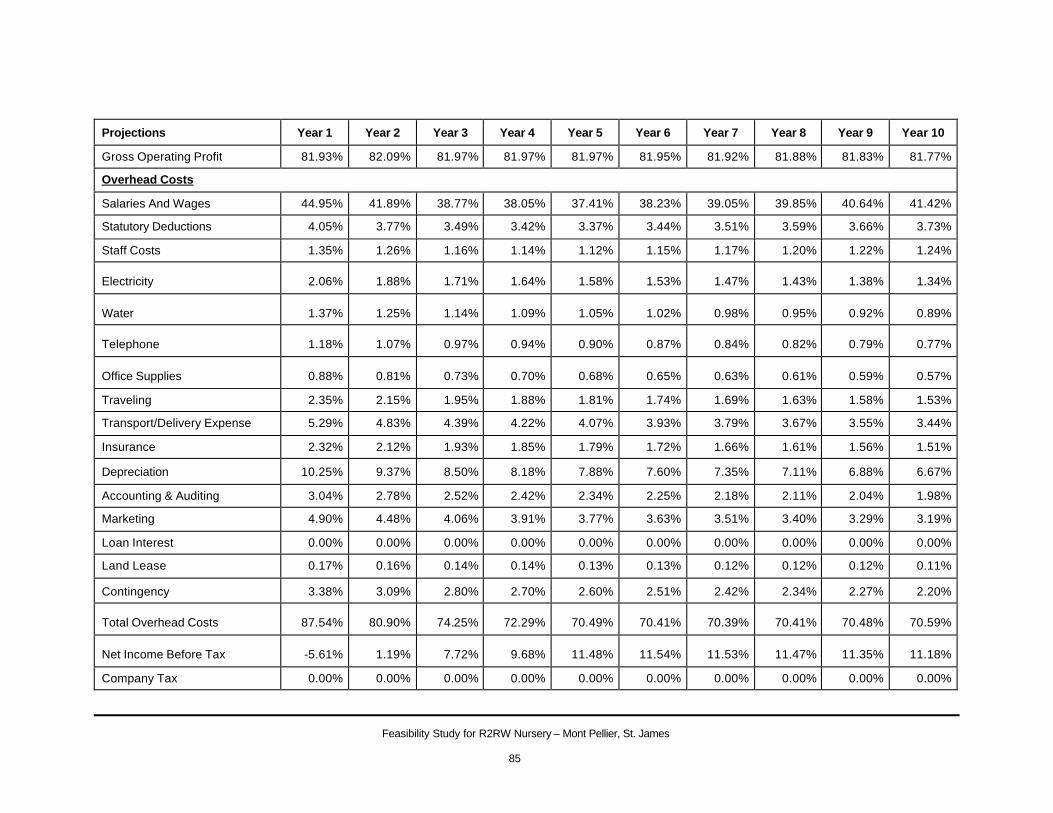
Feasibility Study for R2RW Nursery – Mont Pellier, St. James
85
Projections Year 1 Year 2 Year 3 Year 4 Year 5 Year 6 Year 7 Year 8 Year 9 Year 10
Gross Operating Profit 81.93% 82.09% 81.97% 81.97% 81.97% 81.95% 81.92% 81.88% 81.83% 81.77%
Overhead Costs
Salaries And Wages 44.95% 41.89% 38.77% 38.05% 37.41% 38.23% 39.05% 39.85% 40.64% 41.42%
Statutory Deductions 4.05% 3.77% 3.49% 3.42% 3.37% 3.44% 3.51% 3.59% 3.66% 3.73%
Staff Costs 1.35% 1.26% 1.16% 1.14% 1.12% 1.15% 1.17% 1.20% 1.22% 1.24%
Electricity 2.06% 1.88% 1.71% 1.64% 1.58% 1.53% 1.47% 1.43% 1.38% 1.34%
Water 1.37% 1.25% 1.14% 1.09% 1.05% 1.02% 0.98% 0.95% 0.92% 0.89%
Telephone 1.18% 1.07% 0.97% 0.94% 0.90% 0.87% 0.84% 0.82% 0.79% 0.77%
Office Supplies 0.88% 0.81% 0.73% 0.70% 0.68% 0.65% 0.63% 0.61% 0.59% 0.57%
Traveling 2.35% 2.15% 1.95% 1.88% 1.81% 1.74% 1.69% 1.63% 1.58% 1.53%
Transport/Delivery Expense 5.29% 4.83% 4.39% 4.22% 4.07% 3.93% 3.79% 3.67% 3.55% 3.44%
Insurance 2.32% 2.12% 1.93% 1.85% 1.79% 1.72% 1.66% 1.61% 1.56% 1.51%
Depreciation 10.25% 9.37% 8.50% 8.18% 7.88% 7.60% 7.35% 7.11% 6.88% 6.67%
Accounting & Auditing 3.04% 2.78% 2.52% 2.42% 2.34% 2.25% 2.18% 2.11% 2.04% 1.98%
Marketing 4.90% 4.48% 4.06% 3.91% 3.77% 3.63% 3.51% 3.40% 3.29% 3.19%
Loan Interest 0.00% 0.00% 0.00% 0.00% 0.00% 0.00% 0.00% 0.00% 0.00% 0.00%
Land Lease 0.17% 0.16% 0.14% 0.14% 0.13% 0.13% 0.12% 0.12% 0.12% 0.11%
Contingency 3.38% 3.09% 2.80% 2.70% 2.60% 2.51% 2.42% 2.34% 2.27% 2.20%
Total Overhead Costs 87.54% 80.90% 74.25% 72.29% 70.49% 70.41% 70.39% 70.41% 70.48% 70.59%
Net Income Before Tax -5.61% 1.19% 7.72% 9.68% 11.48% 11.54% 11.53% 11.47% 11.35% 11.18%
Company Tax 0.00% 0.00% 0.00% 0.00% 0.00% 0.00% 0.00% 0.00% 0.00% 0.00%
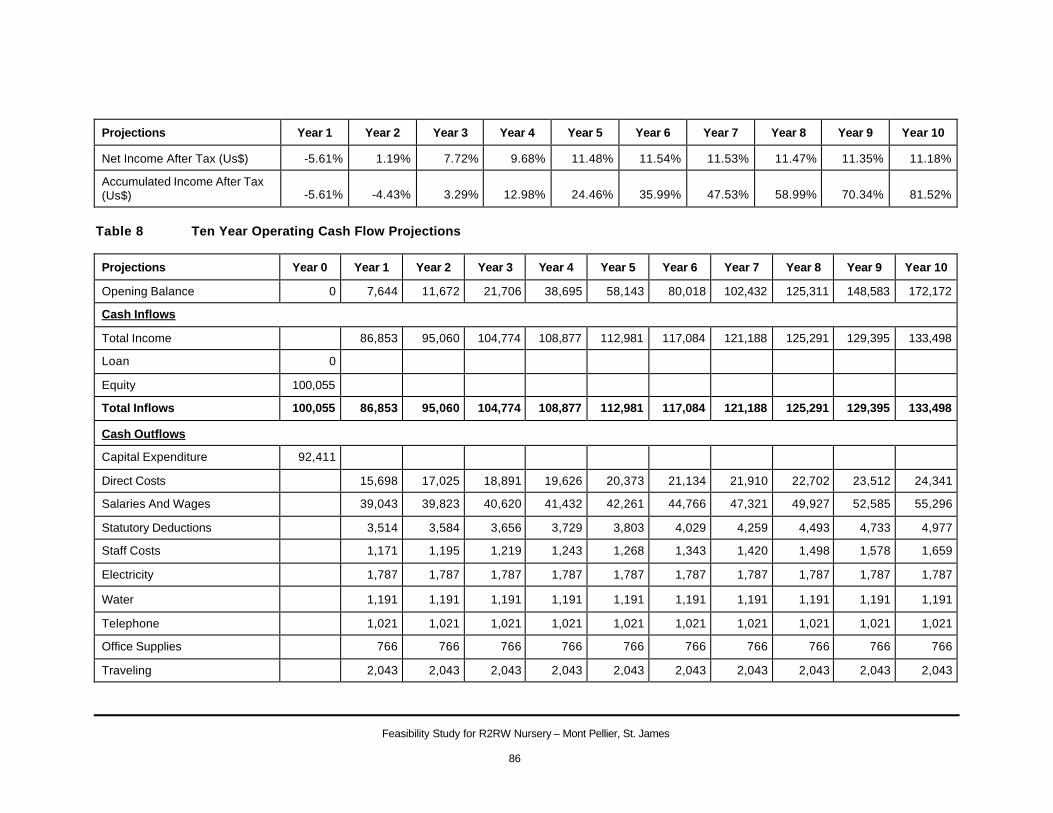
Feasibility Study for R2RW Nursery – Mont Pellier, St. James
86
Projections Year 1 Year 2 Year 3 Year 4 Year 5 Year 6 Year 7 Year 8 Year 9 Year 10
Net Income After Tax (Us$) -5.61% 1.19% 7.72% 9.68% 11.48% 11.54% 11.53% 11.47% 11.35% 11.18%
Accumulated Income After Tax (Us$) -5.61% -4.43% 3.29% 12.98% 24.46% 35.99% 47.53% 58.99% 70.34% 81.52%
Table 8 Ten Year Operating Cash Flow Projections
Projections Year 0 Year 1 Year 2 Year 3 Year 4 Year 5 Year 6 Year 7 Year 8 Year 9 Year 10
Opening Balance 0 7,644 11,672 21,706 38,695 58,143 80,018 102,432 125,311 148,583 172,172
Cash Inflows
Total Income 86,853 95,060 104,774 108,877 112,981 117,084 121,188 125,291 129,395 133,498
Loan 0
Equity 100,055
Total Inflows 100,055 86,853 95,060 104,774 108,877 112,981 117,084 121,188 125,291 129,395 133,498
Cash Outflows
Capital Expenditure 92,411
Direct Costs 15,698 17,025 18,891 19,626 20,373 21,134 21,910 22,702 23,512 24,341
Salaries And Wages 39,043 39,823 40,620 41,432 42,261 44,766 47,321 49,927 52,585 55,296
Statutory Deductions 3,514 3,584 3,656 3,729 3,803 4,029 4,259 4,493 4,733 4,977
Staff Costs 1,171 1,195 1,219 1,243 1,268 1,343 1,420 1,498 1,578 1,659
Electricity 1,787 1,787 1,787 1,787 1,787 1,787 1,787 1,787 1,787 1,787
Water 1,191 1,191 1,191 1,191 1,191 1,191 1,191 1,191 1,191 1,191
Telephone 1,021 1,021 1,021 1,021 1,021 1,021 1,021 1,021 1,021 1,021
Office Supplies 766 766 766 766 766 766 766 766 766 766
Traveling 2,043 2,043 2,043 2,043 2,043 2,043 2,043 2,043 2,043 2,043
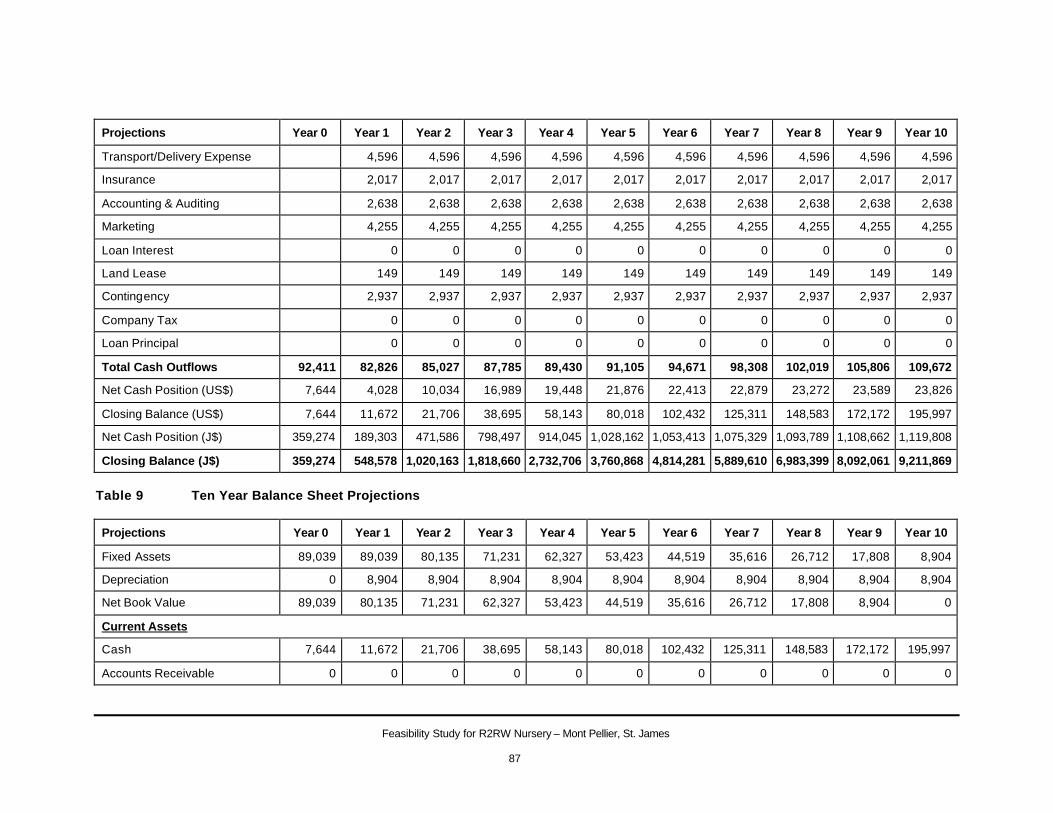
Feasibility Study for R2RW Nursery – Mont Pellier, St. James
87
Projections Year 0 Year 1 Year 2 Year 3 Year 4 Year 5 Year 6 Year 7 Year 8 Year 9 Year 10
Transport/Delivery Expense 4,596 4,596 4,596 4,596 4,596 4,596 4,596 4,596 4,596 4,596
Insurance 2,017 2,017 2,017 2,017 2,017 2,017 2,017 2,017 2,017 2,017
Accounting & Auditing 2,638 2,638 2,638 2,638 2,638 2,638 2,638 2,638 2,638 2,638
Marketing 4,255 4,255 4,255 4,255 4,255 4,255 4,255 4,255 4,255 4,255
Loan Interest 0 0 0 0 0 0 0 0 0 0
Land Lease 149 149 149 149 149 149 149 149 149 149
Contingency 2,937 2,937 2,937 2,937 2,937 2,937 2,937 2,937 2,937 2,937
Company Tax 0 0 0 0 0 0 0 0 0 0
Loan Principal 0 0 0 0 0 0 0 0 0 0
Total Cash Outflows 92,411 82,826 85,027 87,785 89,430 91,105 94,671 98,308 102,019 105,806 109,672
Net Cash Position (US$) 7,644 4,028 10,034 16,989 19,448 21,876 22,413 22,879 23,272 23,589 23,826
Closing Balance (US$) 7,644 11,672 21,706 38,695 58,143 80,018 102,432 125,311 148,583 172,172 195,997
Net Cash Position (J$) 359,274 189,303 471,586 798,497 914,045 1,028,162 1,053,413 1,075,329 1,093,789 1,108,662 1,119,808
Closing Balance (J$) 359,274 548,578 1,020,163 1,818,660 2,732,706 3,760,868 4,814,281 5,889,610 6,983,399 8,092,061 9,211,869
Table 9 Ten Year Balance Sheet Projections
Projections Year 0 Year 1 Year 2 Year 3 Year 4 Year 5 Year 6 Year 7 Year 8 Year 9 Year 10
Fixed Assets 89,039 89,039 80,135 71,231 62,327 53,423 44,519 35,616 26,712 17,808 8,904
Depreciation 0 8,904 8,904 8,904 8,904 8,904 8,904 8,904 8,904 8,904 8,904
Net Book Value 89,039 80,135 71,231 62,327 53,423 44,519 35,616 26,712 17,808 8,904 0
Current Assets
Cash 7,644 11,672 21,706 38,695 58,143 80,018 102,432 125,311 148,583 172,172 195,997
Accounts Receivable 0 0 0 0 0 0 0 0 0 0 0
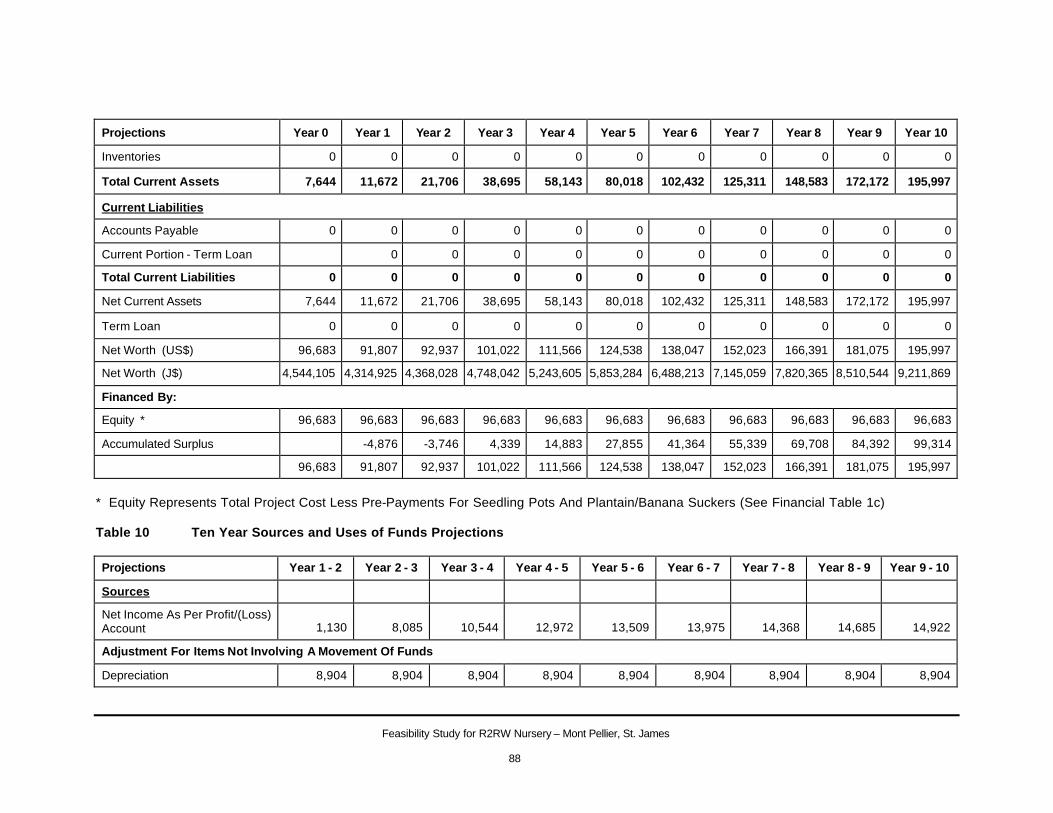
Feasibility Study for R2RW Nursery – Mont Pellier, St. James
88
Projections Year 0 Year 1 Year 2 Year 3 Year 4 Year 5 Year 6 Year 7 Year 8 Year 9 Year 10
Inventories 0 0 0 0 0 0 0 0 0 0 0
Total Current Assets 7,644 11,672 21,706 38,695 58,143 80,018 102,432 125,311 148,583 172,172 195,997
Current Liabilities
Accounts Payable 0 0 0 0 0 0 0 0 0 0 0
Current Portion - Term Loan 0 0 0 0 0 0 0 0 0 0
Total Current Liabilities 0 0 0 0 0 0 0 0 0 0 0
Net Current Assets 7,644 11,672 21,706 38,695 58,143 80,018 102,432 125,311 148,583 172,172 195,997
Term Loan 0 0 0 0 0 0 0 0 0 0 0
Net Worth (US$) 96,683 91,807 92,937 101,022 111,566 124,538 138,047 152,023 166,391 181,075 195,997
Net Worth (J$) 4,544,105 4,314,925 4,368,028 4,748,042 5,243,605 5,853,284 6,488,213 7,145,059 7,820,365 8,510,544 9,211,869
Financed By:
Equity * 96,683 96,683 96,683 96,683 96,683 96,683 96,683 96,683 96,683 96,683 96,683
Accumulated Surplus -4,876 -3,746 4,339 14,883 27,855 41,364 55,339 69,708 84,392 99,314
96,683 91,807 92,937 101,022 111,566 124,538 138,047 152,023 166,391 181,075 195,997
* Equity Represents Total Project Cost Less Pre-Payments For Seedling Pots And Plantain/Banana Suckers (See Financial Table 1c) Table 10 Ten Year Sources and Uses of Funds Projections Projections Year 1 - 2 Year 2 - 3 Year 3 - 4 Year 4 - 5 Year 5 - 6 Year 6 - 7 Year 7 - 8 Year 8 - 9 Year 9 - 10
Sources
Net Income As Per Profit/(Loss) Account 1,130 8,085 10,544 12,972 13,509 13,975 14,368 14,685 14,922
Adjustment For Items Not Involving A Movement Of Funds
Depreciation 8,904 8,904 8,904 8,904 8,904 8,904 8,904 8,904 8,904
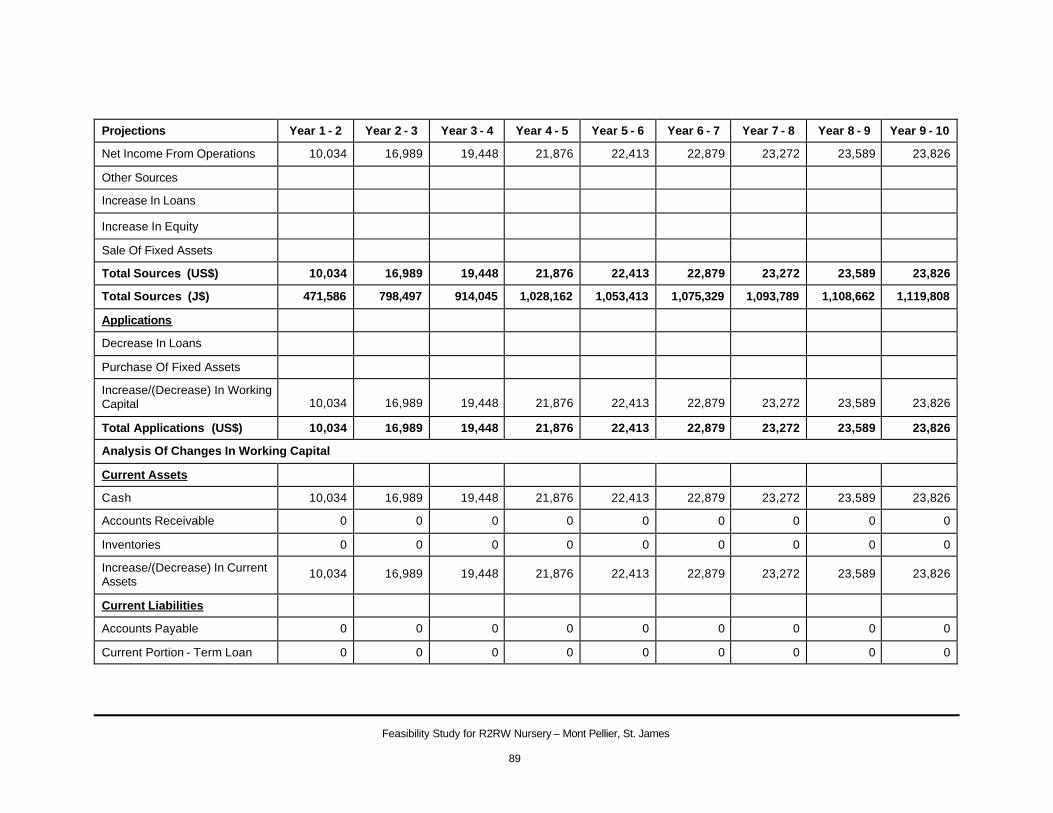
Feasibility Study for R2RW Nursery – Mont Pellier, St. James
89
Projections Year 1 - 2 Year 2 - 3 Year 3 - 4 Year 4 - 5 Year 5 - 6 Year 6 - 7 Year 7 - 8 Year 8 - 9 Year 9 - 10
Net Income From Operations 10,034 16,989 19,448 21,876 22,413 22,879 23,272 23,589 23,826
Other Sources
Increase In Loans
Increase In Equity
Sale Of Fixed Assets
Total Sources (US$) 10,034 16,989 19,448 21,876 22,413 22,879 23,272 23,589 23,826
Total Sources (J$) 471,586 798,497 914,045 1,028,162 1,053,413 1,075,329 1,093,789 1,108,662 1,119,808
Applications
Decrease In Loans
Purchase Of Fixed Assets
Increase/(Decrease) In Working Capital 10,034 16,989 19,448 21,876 22,413 22,879 23,272 23,589 23,826
Total Applications (US$) 10,034 16,989 19,448 21,876 22,413 22,879 23,272 23,589 23,826
Analysis Of Changes In Working Capital
Current Assets
Cash 10,034 16,989 19,448 21,876 22,413 22,879 23,272 23,589 23,826
Accounts Receivable 0 0 0 0 0 0 0 0 0
Inventories 0 0 0 0 0 0 0 0 0
Increase/(Decrease) In Current Assets
10,034 16,989 19,448 21,876 22,413 22,879 23,272 23,589 23,826
Current Liabilities
Accounts Payable 0 0 0 0 0 0 0 0 0
Current Portion - Term Loan 0 0 0 0 0 0 0 0 0
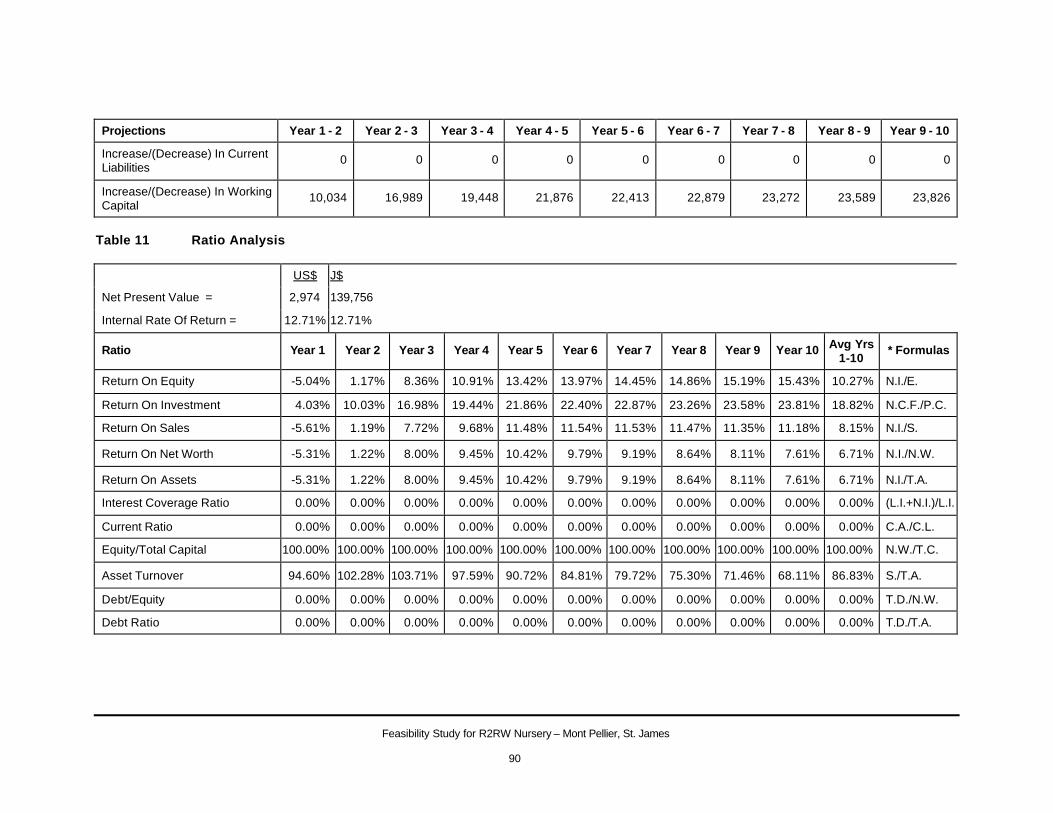
Feasibility Study for R2RW Nursery – Mont Pellier, St. James
90
Projections Year 1 - 2 Year 2 - 3 Year 3 - 4 Year 4 - 5 Year 5 - 6 Year 6 - 7 Year 7 - 8 Year 8 - 9 Year 9 - 10
Increase/(Decrease) In Current Liabilities
0 0 0 0 0 0 0 0 0
Increase/(Decrease) In Working Capital
10,034 16,989 19,448 21,876 22,413 22,879 23,272 23,589 23,826
Table 11 Ratio Analysis
US$ J$
Net Present Value = 2,974 139,756
Internal Rate Of Return = 12.71% 12.71%
Ratio Year 1 Year 2 Year 3 Year 4 Year 5 Year 6 Year 7 Year 8 Year 9 Year 10 Avg Yrs 1-10
* Formulas
Return On Equity -5.04% 1.17% 8.36% 10.91% 13.42% 13.97% 14.45% 14.86% 15.19% 15.43% 10.27% N.I./E.
Return On Investment 4.03% 10.03% 16.98% 19.44% 21.86% 22.40% 22.87% 23.26% 23.58% 23.81% 18.82% N.C.F./P.C.
Return On Sales -5.61% 1.19% 7.72% 9.68% 11.48% 11.54% 11.53% 11.47% 11.35% 11.18% 8.15% N.I./S.
Return On Net Worth -5.31% 1.22% 8.00% 9.45% 10.42% 9.79% 9.19% 8.64% 8.11% 7.61% 6.71% N.I./N.W.
Return On Assets -5.31% 1.22% 8.00% 9.45% 10.42% 9.79% 9.19% 8.64% 8.11% 7.61% 6.71% N.I./T.A.
Interest Coverage Ratio 0.00% 0.00% 0.00% 0.00% 0.00% 0.00% 0.00% 0.00% 0.00% 0.00% 0.00% (L.I.+N.I.)/L.I.
Current Ratio 0.00% 0.00% 0.00% 0.00% 0.00% 0.00% 0.00% 0.00% 0.00% 0.00% 0.00% C.A./C.L.
Equity/Total Capital 100.00% 100.00% 100.00% 100.00% 100.00% 100.00% 100.00% 100.00% 100.00% 100.00% 100.00% N.W./T.C.
Asset Turnover 94.60% 102.28% 103.71% 97.59% 90.72% 84.81% 79.72% 75.30% 71.46% 68.11% 86.83% S./T.A.
Debt/Equity 0.00% 0.00% 0.00% 0.00% 0.00% 0.00% 0.00% 0.00% 0.00% 0.00% 0.00% T.D./N.W.
Debt Ratio 0.00% 0.00% 0.00% 0.00% 0.00% 0.00% 0.00% 0.00% 0.00% 0.00% 0.00% T.D./T.A.
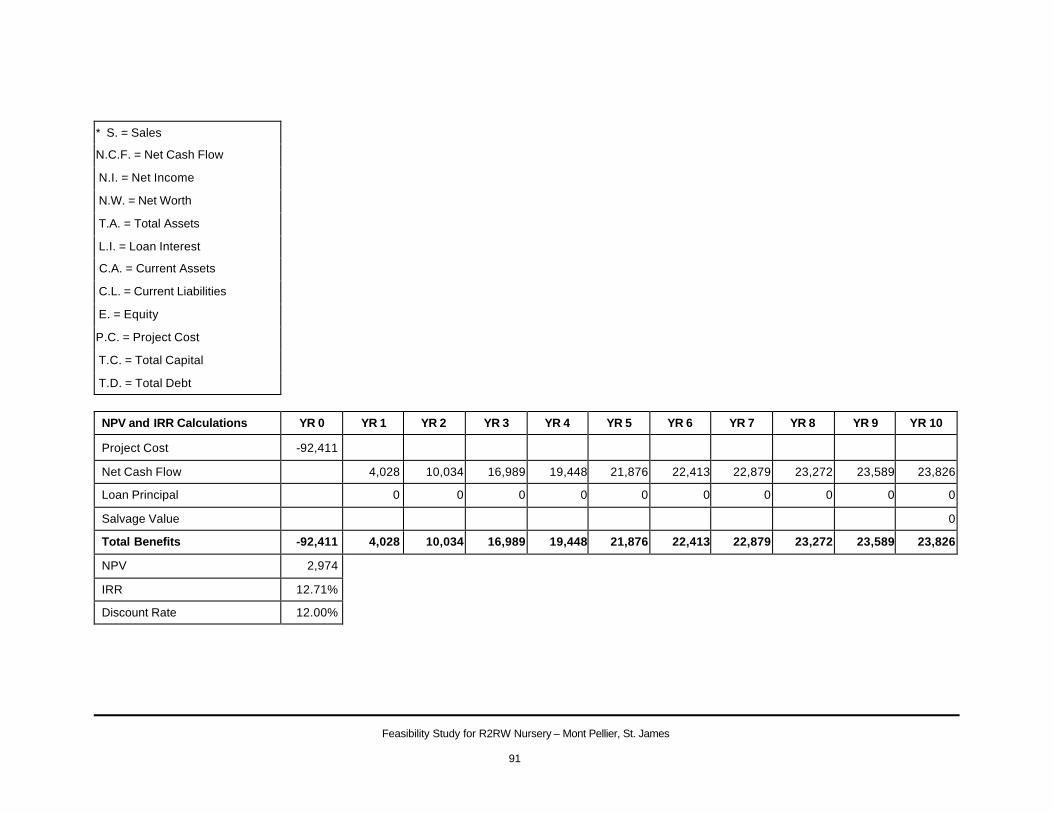
Feasibility Study for R2RW Nursery – Mont Pellier, St. James
91
* S. = Sales
N.C.F. = Net Cash Flow
N.I. = Net Income
N.W. = Net Worth
T.A. = Total Assets
L.I. = Loan Interest
C.A. = Current Assets
C.L. = Current Liabilities
E. = Equity
P.C. = Project Cost
T.C. = Total Capital
T.D. = Total Debt
NPV and IRR Calculations YR 0 YR 1 YR 2 YR 3 YR 4 YR 5 YR 6 YR 7 YR 8 YR 9 YR 10
Project Cost -92,411
Net Cash Flow 4,028 10,034 16,989 19,448 21,876 22,413 22,879 23,272 23,589 23,826
Loan Principal 0 0 0 0 0 0 0 0 0 0
Salvage Value 0
Total Benefits -92,411 4,028 10,034 16,989 19,448 21,876 22,413 22,879 23,272 23,589 23,826
NPV 2,974
IRR 12.71%
Discount Rate 12.00%
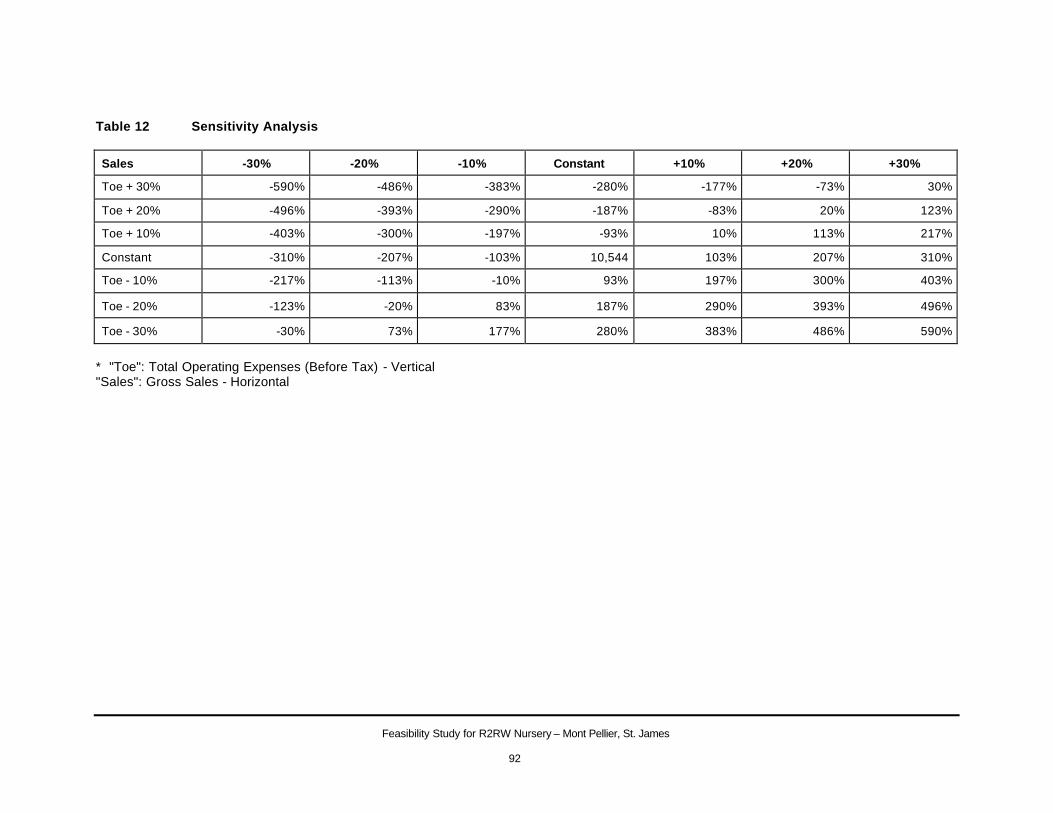
Feasibility Study for R2RW Nursery – Mont Pellier, St. James
92
Table 12 Sensitivity Analysis
Sales -30% -20% -10% Constant +10% +20% +30%
Toe + 30% -590% -486% -383% -280% -177% -73% 30%
Toe + 20% -496% -393% -290% -187% -83% 20% 123%
Toe + 10% -403% -300% -197% -93% 10% 113% 217%
Constant -310% -207% -103% 10,544 103% 207% 310%
Toe - 10% -217% -113% -10% 93% 197% 300% 403%
Toe - 20% -123% -20% 83% 187% 290% 393% 496%
Toe - 30% -30% 73% 177% 280% 383% 486% 590%
* "Toe": Total Operating Expenses (Before Tax) - Vertical "Sales": Gross Sales - Horizontal
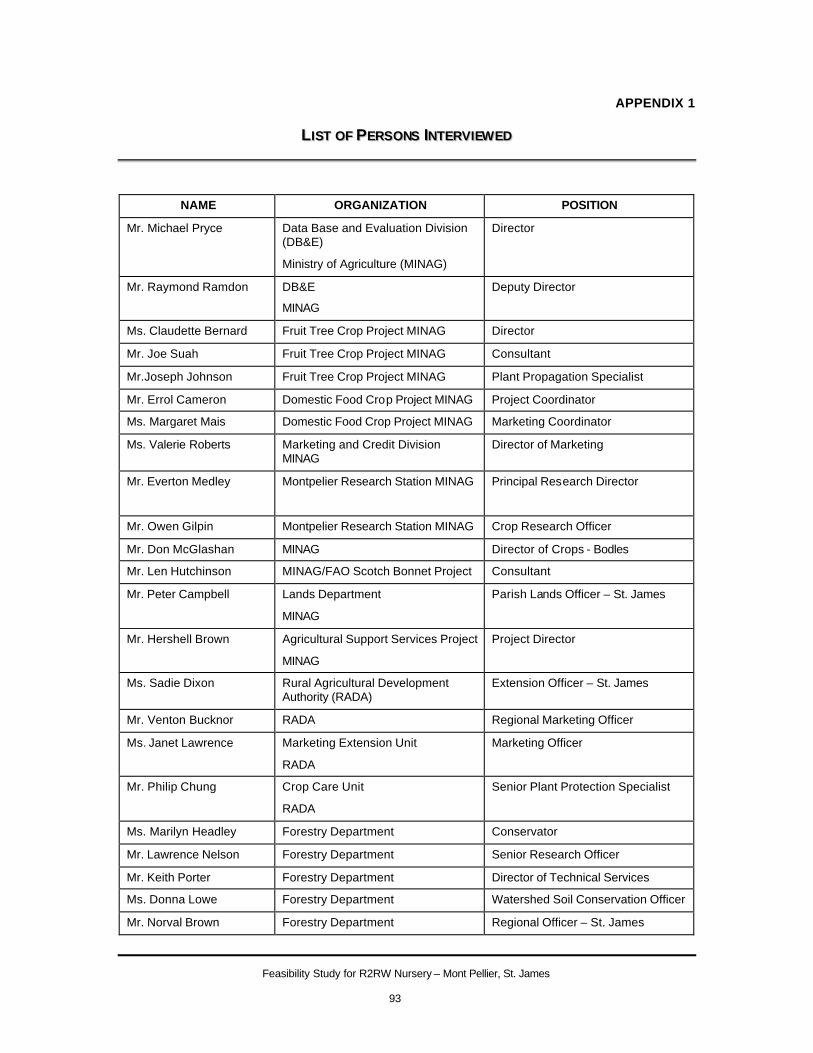
Feasibility Study for R2RW Nursery – Mont Pellier, St. James
93
APPENDIX 1
LL IISSTT OOFF PPEERRSSOONNSS IINNTTEERRVVIIEEWWEEDD
NAME ORGANIZATION POSITION
Mr. Michael Pryce Data Base and Evaluation Division (DB&E)
Ministry of Agriculture (MINAG)
Director
Mr. Raymond Ramdon DB&E
MINAG
Deputy Director
Ms. Claudette Bernard Fruit Tree Crop Project MINAG Director
Mr. Joe Suah Fruit Tree Crop Project MINAG Consultant
Mr.Joseph Johnson Fruit Tree Crop Project MINAG Plant Propagation Specialist
Mr. Errol Cameron Domestic Food Crop Project MINAG Project Coordinator
Ms. Margaret Mais Domestic Food Crop Project MINAG Marketing Coordinator
Ms. Valerie Roberts Marketing and Credit Division MINAG
Director of Marketing
Mr. Everton Medley Montpelier Research Station MINAG Principal Research Director
Mr. Owen Gilpin Montpelier Research Station MINAG Crop Research Officer
Mr. Don McGlashan MINAG Director of Crops - Bodles
Mr. Len Hutchinson MINAG/FAO Scotch Bonnet Project Consultant
Mr. Peter Campbell Lands Department
MINAG
Parish Lands Officer – St. James
Mr. Hershell Brown Agricultural Support Services Project
MINAG
Project Director
Ms. Sadie Dixon Rural Agricultural Development Authority (RADA)
Extension Officer – St. James
Mr. Venton Bucknor RADA Regional Marketing Officer
Ms. Janet Lawrence Marketing Extension Unit
RADA
Marketing Officer
Mr. Philip Chung Crop Care Unit
RADA
Senior Plant Protection Specialist
Ms. Marilyn Headley Forestry Department Conservator
Mr. Lawrence Nelson Forestry Department Senior Research Officer
Mr. Keith Porter Forestry Department Director of Technical Services
Ms. Donna Lowe Forestry Department Watershed Soil Conservation Officer
Mr. Norval Brown Forestry Department Regional Officer – St. James

Feasibility Study for R2RW Nursery – Mont Pellier, St. James
94
NAME ORGANIZATION POSITION
Mr. Ian Gage Environmental Foundation of Jamaica (EFJ)
Special Projects Manager
Ms. Marlene Lewis EFJ Membership and Community Relations Officer
Dr. Helen Asemota Biotechnology Centre
University of the West Indies (UWI)
Senior Lecturer
Dr. Andrew Wheatley Biotechnology Centre , UWI Research Fellow
Ms. Charlene Richards Scientific Research Council (SRC) Senior Scientific Officer
Mr. Aston Clarke Coffee Industry Board Regional Manager – Western Region
Ms. Edmondson STATIN
Ms. Eileen Chung JEA Export Data/Pre-Clearance Research Officer
Mr. Eric Allen-Pierce Charles Gordon Market Acting Assistant Manager
Ms. Whyaline Jarrett Charles Gordon Market Supervisor
Mr. Nicholas Jones Montpelier Citrus Company (MCC) Managing Director
Ms. Ann Lewis MCC General Manager
Mr. Basil Woodburn Jamaica Agricultural Society (JAS) Member – St. James Executive
Ms. Tracey Clarke Social Development Commission (SDC)
Regional Manager
Ms. Ruth Reynolds Registrar of Companies Customer Service Supervisor
Mr. Clarence Franklyn Vauxhall Farms and Plant Nursery Managing Director
Mr. Glen Brooks Fort George Botanicals Limited Manager
Mr. Shalom Hodara Jamaica Drip Irrigation Limited Managing Director
Mr. Dudley Bennett RADA/Mafoota Farmers Group President
Ms. Grace Smith RADA/Mafoota Farmers Group Marketing Officer
Ms. Linette Wilks JCDT/EU Plant Nursery – Brook Lodge
Community Conservation Officer
Mr. Andrew Morales West Best Foods Limited Managing Director
Ms. Murray Gray’s Pepper Products Limited
Mr. Ian Allen Sandals Montego Bay Hotel Purchasing Manager
Mr. Lennisford Cornwall Sandals Resorts International Group Landscaper
Mr. Michael Andries Half Moon Hotel Purchasing Manager
Mr. Bertram Smith Shoppers Fair Supermarket, Montego Bay
Assistant Store Manager
Ms. Hyacinth Chin-Sue Pesticide Control Authority Registrar of Pesticides
(Former Nursery Operator – Mini-Sett Yam)
Mr. Byron McDonald Development Bank of Jamaica (DBJ)
General Manager – Credit and Administration
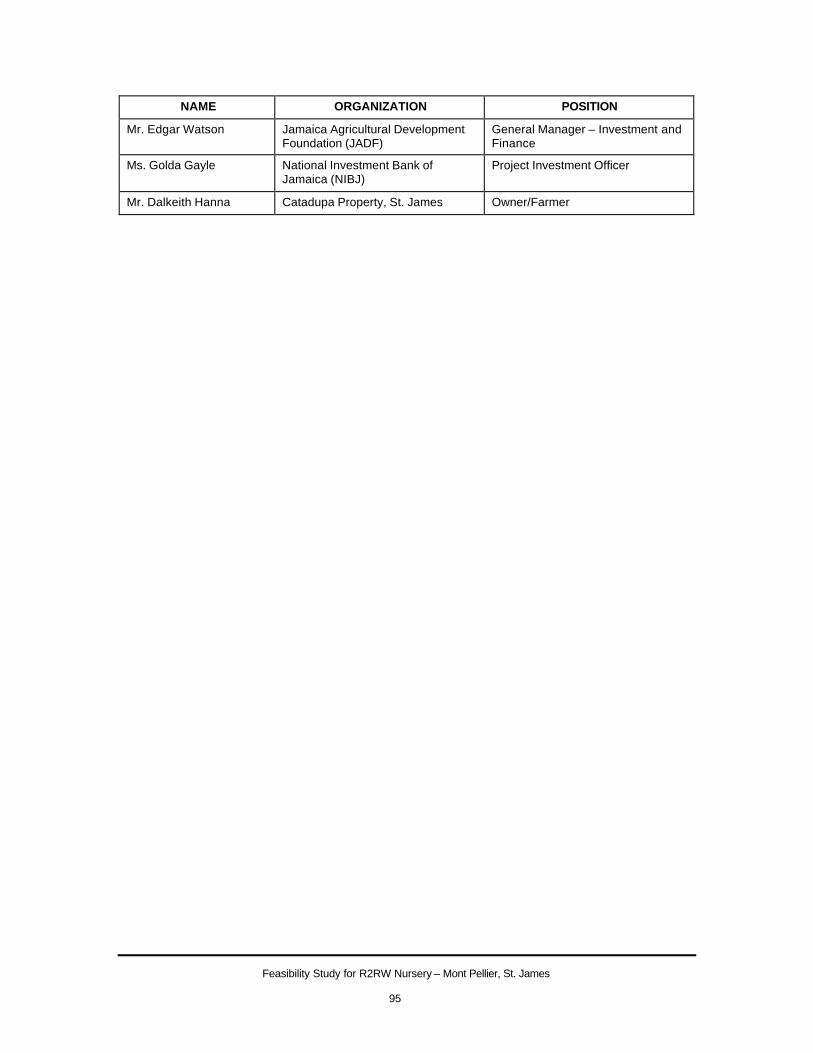
Feasibility Study for R2RW Nursery – Mont Pellier, St. James
95
NAME ORGANIZATION POSITION
Mr. Edgar Watson Jamaica Agricultural Development Foundation (JADF)
General Manager – Investment and Finance
Ms. Golda Gayle National Investment Bank of Jamaica (NIBJ)
Project Investment Officer
Mr. Dalkeith Hanna Catadupa Property, St. James Owner/Farmer
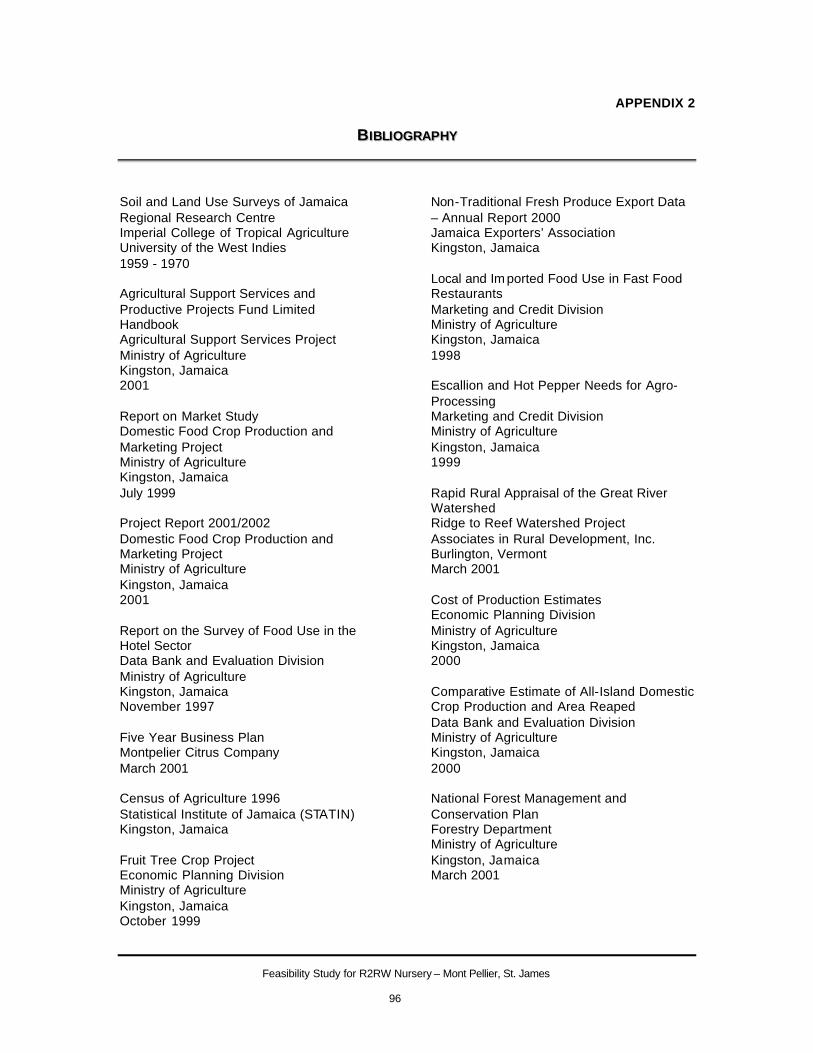
Feasibility Study for R2RW Nursery – Mont Pellier, St. James
96
APPENDIX 2
BB IIBBLLIIOOGGRRAAPPHHYY Soil and Land Use Surveys of Jamaica Regional Research Centre Imperial College of Tropical Agriculture University of the West Indies 1959 - 1970 Agricultural Support Services and Productive Projects Fund Limited Handbook Agricultural Support Services Project Ministry of Agriculture Kingston, Jamaica 2001 Report on Market Study Domestic Food Crop Production and Marketing Project Ministry of Agriculture Kingston, Jamaica July 1999 Project Report 2001/2002 Domestic Food Crop Production and Marketing Project Ministry of Agriculture Kingston, Jamaica 2001 Report on the Survey of Food Use in the Hotel Sector Data Bank and Evaluation Division Ministry of Agriculture Kingston, Jamaica November 1997 Five Year Business Plan Montpelier Citrus Company March 2001 Census of Agriculture 1996 Statistical Institute of Jamaica (STATIN) Kingston, Jamaica Fruit Tree Crop Project Economic Planning Division Ministry of Agriculture Kingston, Jamaica October 1999
Non-Traditional Fresh Produce Export Data – Annual Report 2000 Jamaica Exporters’ Association Kingston, Jamaica Local and Im ported Food Use in Fast Food Restaurants Marketing and Credit Division Ministry of Agriculture Kingston, Jamaica 1998 Escallion and Hot Pepper Needs for Agro-Processing Marketing and Credit Division Ministry of Agriculture Kingston, Jamaica 1999 Rapid Rural Appraisal of the Great River Watershed Ridge to Reef Watershed Project Associates in Rural Development, Inc. Burlington, Vermont March 2001 Cost of Production Estimates Economic Planning Division Ministry of Agriculture Kingston, Jamaica 2000 Comparative Estimate of All-Island Domestic Crop Production and Area Reaped Data Bank and Evaluation Division Ministry of Agriculture Kingston, Jamaica 2000 National Forest Management and Conservation Plan Forestry Department Ministry of Agriculture Kingston, Jamaica March 2001

Feasibility Study for R2RW Nursery – Mont Pellier, St. James
97
Five Year Business Plan Mafoota Agro-Coop April 2001 Economic and Social Survey 1995 - 2000 Planning Institute of Jamaica (PIOJ)
Kingston, Jamaica External Trade Statistics 2000 Statistical Institute of Jamaica (STATIN) Kingston, Jamaica
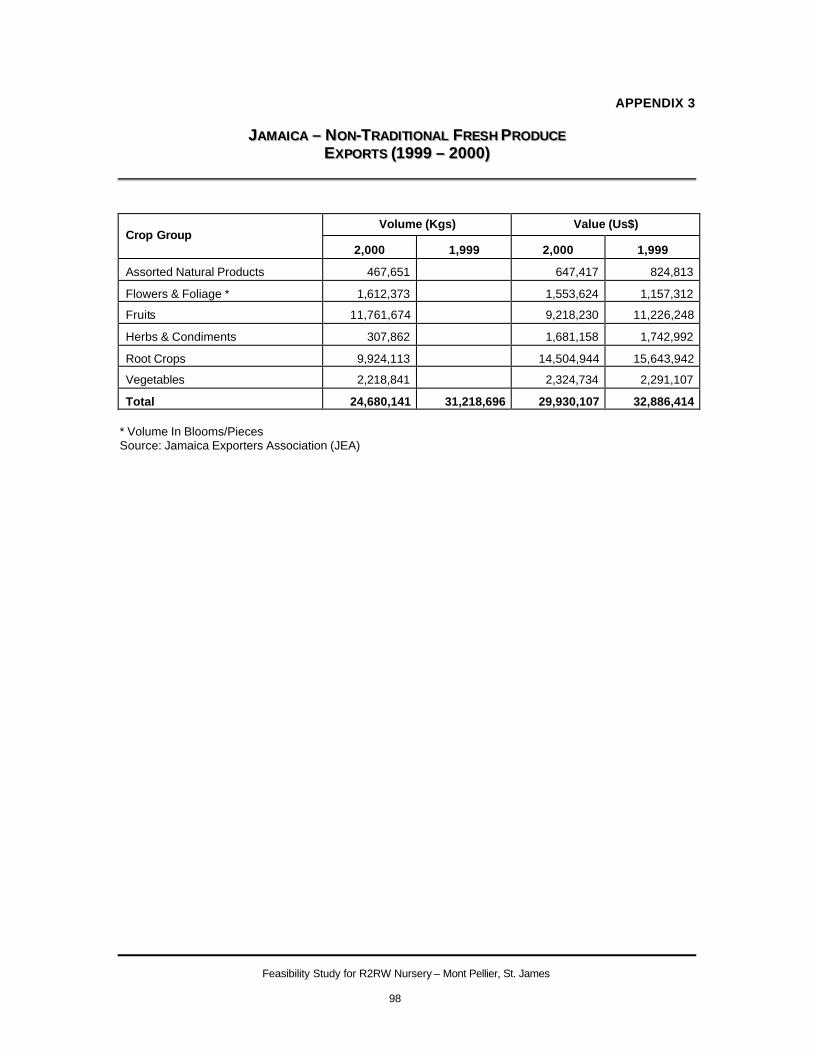
Feasibility Study for R2RW Nursery – Mont Pellier, St. James
98
APPENDIX 3
JJAAMMAAIICCAA –– NNOONN--TTRRAADDIITTIIOONNAALL FFRREESSHH PPRROODDUUCCEE EEXXPPOORRTTSS ((11999999 –– 22000000))
Volume (Kgs) Value (Us$) Crop Group
2,000 1,999 2,000 1,999
Assorted Natural Products 467,651 647,417 824,813
Flowers & Foliage * 1,612,373 1,553,624 1,157,312
Fruits 11,761,674 9,218,230 11,226,248
Herbs & Condiments 307,862 1,681,158 1,742,992
Root Crops 9,924,113 14,504,944 15,643,942
Vegetables 2,218,841 2,324,734 2,291,107
Total 24,680,141 31,218,696 29,930,107 32,886,414 * Volume In Blooms/Pieces Source: Jamaica Exporters Association (JEA)
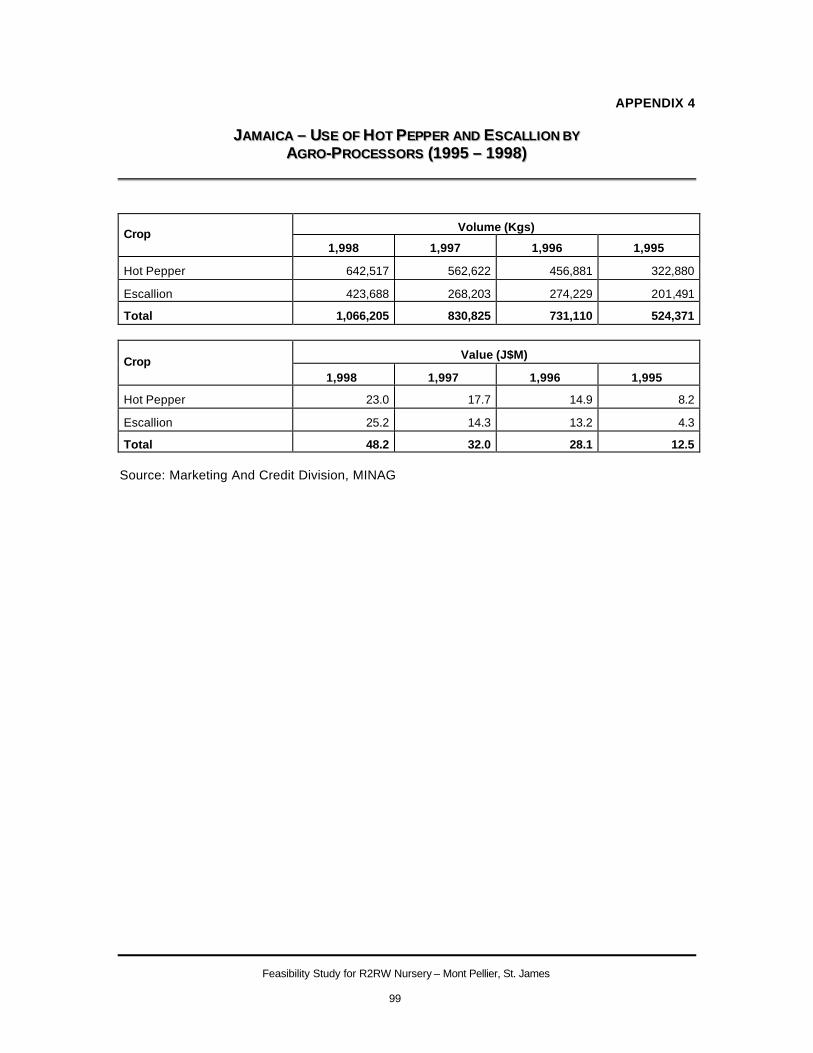
Feasibility Study for R2RW Nursery – Mont Pellier, St. James
99
APPENDIX 4
JJAAMMAAIICCAA –– UUSSEE OOFF HHOOTT PPEEPPPPEERR AANNDD EESSCCAALLLLIIOONN BBYY AAGGRROO--PPRROOCCEESSSSOORRSS ((11999955 –– 11999988))
Volume (Kgs) Crop 1,998 1,997 1,996 1,995
Hot Pepper 642,517 562,622 456,881 322,880
Escallion 423,688 268,203 274,229 201,491
Total 1,066,205 830,825 731,110 524,371
Value (J$M) Crop 1,998 1,997 1,996 1,995
Hot Pepper 23.0 17.7 14.9 8.2
Escallion 25.2 14.3 13.2 4.3
Total 48.2 32.0 28.1 12.5 Source: Marketing And Credit Division, MINAG
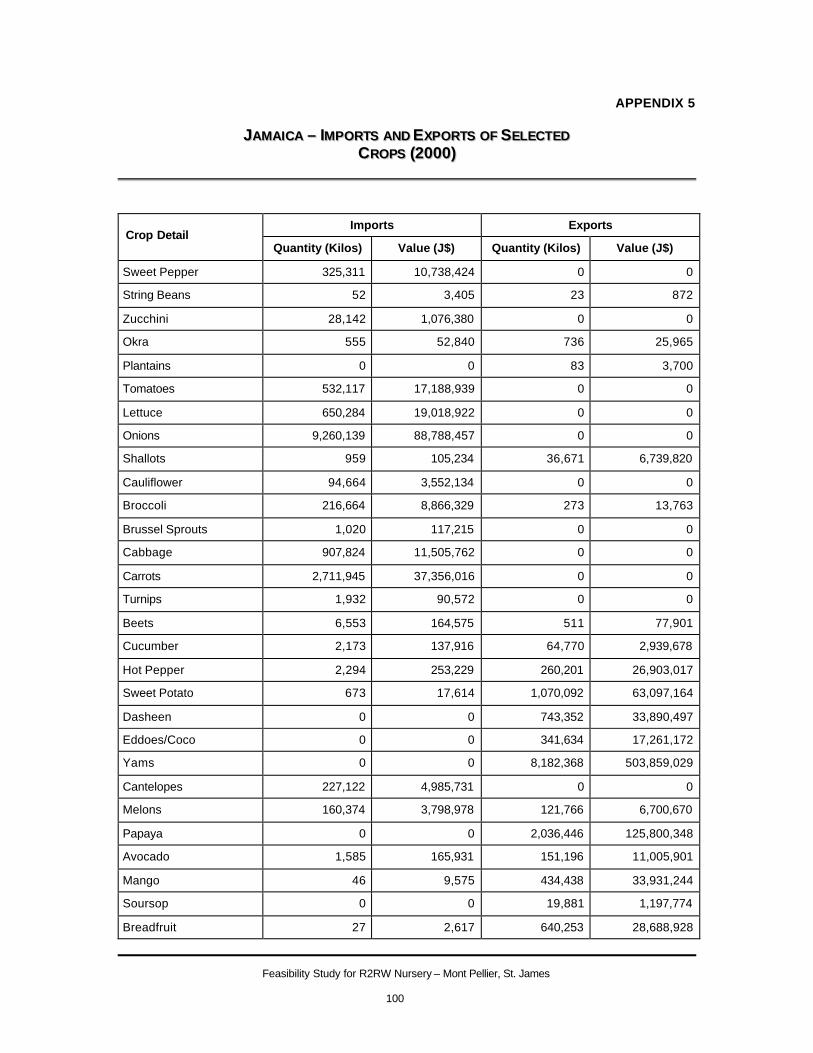
Feasibility Study for R2RW Nursery – Mont Pellier, St. James
100
APPENDIX 5
JJAAMMAAIICCAA –– IIMMPPOORRTTSS AANNDD EEXXPPOORRTTSS OOFF SSEELLEECCTTEEDD CCRROOPPSS ((22000000))
Imports Exports Crop Detail
Quantity (Kilos) Value (J$) Quantity (Kilos) Value (J$)
Sweet Pepper 325,311 10,738,424 0 0
String Beans 52 3,405 23 872
Zucchini 28,142 1,076,380 0 0
Okra 555 52,840 736 25,965
Plantains 0 0 83 3,700
Tomatoes 532,117 17,188,939 0 0
Lettuce 650,284 19,018,922 0 0
Onions 9,260,139 88,788,457 0 0
Shallots 959 105,234 36,671 6,739,820
Cauliflower 94,664 3,552,134 0 0
Broccoli 216,664 8,866,329 273 13,763
Brussel Sprouts 1,020 117,215 0 0
Cabbage 907,824 11,505,762 0 0
Carrots 2,711,945 37,356,016 0 0
Turnips 1,932 90,572 0 0
Beets 6,553 164,575 511 77,901
Cucumber 2,173 137,916 64,770 2,939,678
Hot Pepper 2,294 253,229 260,201 26,903,017
Sweet Potato 673 17,614 1,070,092 63,097,164
Dasheen 0 0 743,352 33,890,497
Eddoes/Coco 0 0 341,634 17,261,172
Yams 0 0 8,182,368 503,859,029
Cantelopes 227,122 4,985,731 0 0
Melons 160,374 3,798,978 121,766 6,700,670
Papaya 0 0 2,036,446 125,800,348
Avocado 1,585 165,931 151,196 11,005,901
Mango 46 9,575 434,438 33,931,244
Soursop 0 0 19,881 1,197,774
Breadfruit 27 2,617 640,253 28,688,928
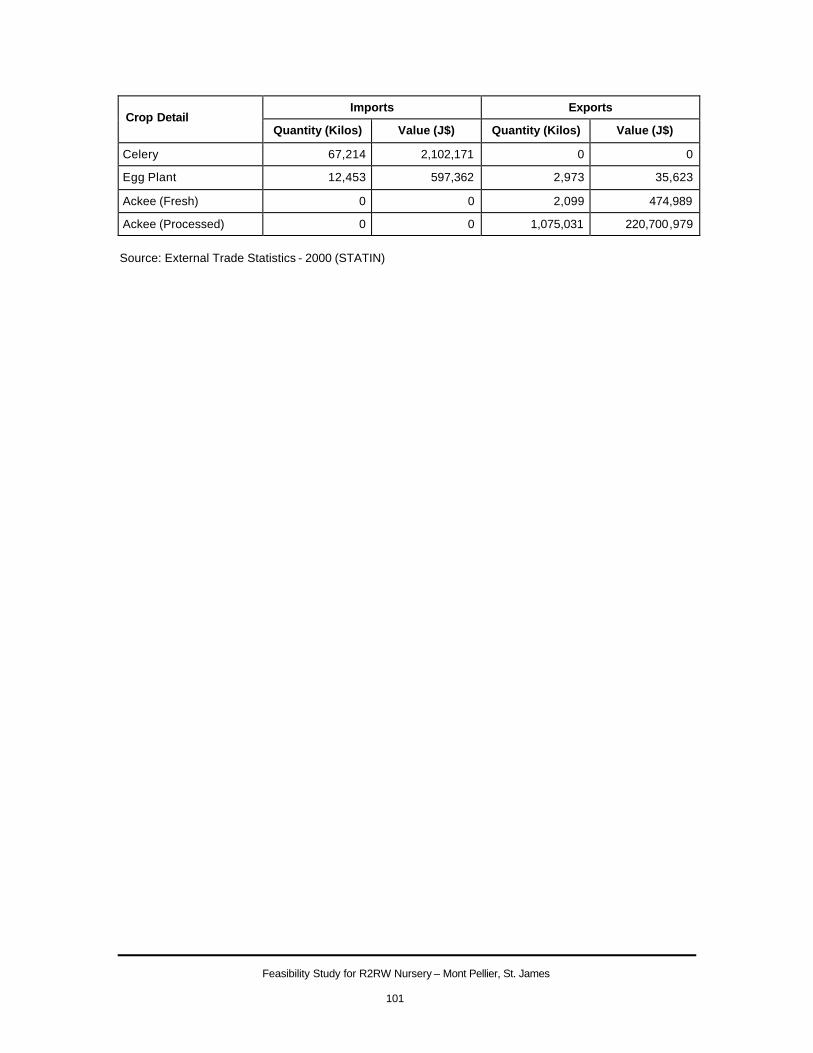
Feasibility Study for R2RW Nursery – Mont Pellier, St. James
101
Imports Exports Crop Detail
Quantity (Kilos) Value (J$) Quantity (Kilos) Value (J$)
Celery 67,214 2,102,171 0 0
Egg Plant 12,453 597,362 2,973 35,623
Ackee (Fresh) 0 0 2,099 474,989
Ackee (Processed) 0 0 1,075,031 220,700,979
Source: External Trade Statistics - 2000 (STATIN)
Feasibility Study for R2RW Nursery – Mont Pellier, St. James
102
APPENDIX 5
LL IISSTT OOFF PPRROOJJEECCTT MMEEEETTIINNGGSS 1. Date: 2001 August 20 Attendees: § Dr. Mark Nolan – Chief of Party, R2RW Project § Dr. George Wilson – Watershed Management Specialist, R2RW Project § Mr. Richard Lumsden - Consultant
2. Date: 2001 August 29 Attendees: § Great River Watershed Management Committee Task Force on Production and
Marketing § Mr. Richard Lumsden - Consultant
3. Date: 2001 September 11 Attendees: § Dr. George Wilson § Mr. Richard Lumsden
4. Date: 2001 September 24 Attendees: § Dr. Mark Nolan § Dr. George Wilson § Mr. Richard Lumsden


Ridge to Reef Watershed Project