Embed Size (px)
Citation preview

Feasibility Study
Highway 260 and Johnson Lane
WQARF Registry Site
PINETOP‐LAKESIDE, ARIZONA
Arizona Superfund Response Action Contract
Contract Number: ADEQ14‐077538
Prepared for:
Arizona Department of Environmental Quality
1110 W Washington St
Phoenix, AZ 85007
Prepared by:
June 30, 2019

Feasibility Study Report Highway 260 and Johnson Lane WQARF Site
Hwy 260 and Johnson FS 06‐30‐2019 rev1 i Matrix‐CALIBRE Team
Table of Contents
1.0 INTRODUCTION ............................................................................................................................. 1
1.1 Objectives and Scope of the Feasibility Study Report ....................................................................... 1
1.2 Report Organization ........................................................................................................................... 2
2.0 SITE HISTORY AND BACKGROUND ................................................................................................. 2
2.1 Site History ......................................................................................................................................... 3
2.2 Site Background ................................................................................................................................. 3
2.3 Conceptual Site Model ....................................................................................................................... 4
2.4 Problem Statement ............................................................................................................................ 5
3.0 FEASIBILITY STUDY SCOPING ......................................................................................................... 5
3.1 Regulatory Requirements .................................................................................................................. 5
3.2 Delineation of Remediation Areas ..................................................................................................... 6
3.3 Remedial Objectives ........................................................................................................................... 6
3.3.1 Remedial Objectives for Land Use .............................................................................................. 6
3.3.2 Remedial Objectives for Surface Water ...................................................................................... 7
3.3.3 Remedial Objectives for Groundwater Use ................................................................................ 7
4.0 IDENTIFICATION AND SCREENING OF REMEDIAL MEASURES AND REMEDIAL STRATEGIES ............. 8
4.1 Remedial Technologies Screening Criteria ......................................................................................... 8
4.2 Screening of Technologies Applicable to Soil ..................................................................................... 9
4.2.1 Excavation and Disposal of Contaminated Soil ........................................................................... 9
4.2.2 Soil Vapor Extraction ................................................................................................................... 9
4.3 Screening of Groundwater Technologies ........................................................................................... 9
4.3.1 Monitored Natural Attenuation .................................................................................................. 9
4.3.2 Enhanced Reductive Dechlorination ......................................................................................... 10
4.3.3 In‐Situ Chemical Oxidation ........................................................................................................ 10
4.3.4 In‐Situ Chemical Reduction ....................................................................................................... 11
4.3.5 Groundwater Extraction and Treatment .................................................................................. 11
4.3.6 Summary of Screening and Technologies Retained .................................................................. 11
5.0 DEVELOPMENT OF REFERENCE REMEDY AND ALTERNATIVE REMEDIES ....................................... 13
5.1 Reference Remedy ........................................................................................................................... 13
5.2 Less Aggressive Remedy ................................................................................................................... 14
5.3 More Aggressive Remedy................................................................................................................. 15
5.4 Discussion of Specific Remedial Measures ...................................................................................... 15
Feasibility Study Report Highway 260 and Johnson Lane WQARF Site
Hwy 260 and Johnson FS 06‐30‐2019 rev1 ii Matrix‐CALIBRE Team
6.0 DETAILED COMPARISON OF THE REFERENCE REMEDY AND THE ALTERNATIVE REMEDIES ............ 16
6.1 Evaluation of the Reference Remedy ............................................................................................... 17
6.1.1 Achieving Remedial Objectives ................................................................................................. 17
6.1.2 Impacts on Water Management Plans or Land Use Plans ........................................................ 18
6.1.3 Practicability Evaluation ............................................................................................................ 18
6.1.4 Risk Evaluation .......................................................................................................................... 18
6.1.5 Cost Evaluation .......................................................................................................................... 19
6.1.6 Benefit Evaluation ..................................................................................................................... 19
6.2 Evaluation of the Less Aggressive Remedy ....................................................................................... 20
6.3 Evaluation of the More Aggressive Remedy ..................................................................................... 20
6.4 Comparison of the Remedial Alternatives ....................................................................................... 20
7.0 PROPOSED REMEDY .................................................................................................................... 22
7.1 Achieving Remedial Objectives ........................................................................................................ 22
7.2 Impacts on Water Management Plans or Land Use Plans ............................................................... 22
7.3 Practicability Evaluation ................................................................................................................... 23
7.4 Risk Evaluation ................................................................................................................................. 23
7.5 Cost Evaluation ................................................................................................................................. 23
7.6 Benefit Evaluation ............................................................................................................................ 24
8.0 COMMUNITY INVOLVEMENT ....................................................................................................... 24
9.0 REFERENCES ................................................................................................................................ 24
List of Tables
Table 4‐1 Summary of Technology Screening
Table 6‐1 Summary of Costs for Remedial Alternatives
Table 6‐2 Summary of Comparison of Reference Remedy and Alternative Remedies
List of Figures
Figure 1‐1 Site Location Map
Figure 1‐2 Site Boundary and Groundwater Well Locations
Figure 2‐1 PCE Soil Vapor Monitoring Results (2017)
Figure 2‐2 PCE Groundwater Monitoring Results (April 2019)
Appendices
Appendix A Detailed Cost Estimates
Feasibility Study Report Highway 260 and Johnson Lane WQARF Site
Hwy 260 and Johnson FS 06‐30‐2019 rev1 iii Matrix‐CALIBRE Team
List of Acronyms
A.A.C. Arizona Administrative Code
ADEQ Arizona Department of Environmental Quality
ADWR Arizona Department of Water Resources
A.R.S. Arizona Revised Statutes
ASRAC Arizona Superfund Remedial Action Contract
AWQS Aquifer Water Quality Standard
Bgs Below Ground Surface
CAB Community Advisory Board
CI Community Involvement
CIP Community Involvement Plan
CSM Conceptual Site Model
COC Contaminant of Concern
ERD Enhanced Reductive Dechlorination
FS Feasibility Study
Ft feet
GPLs Groundwater Protection Limits
ISCO In‐situ chemical oxidation
ISCR In‐situ chemical reduction
LWUS Land and Water Use Study
MNA Monitored Natural Attenuation
µg/m3 micrograms per cubic meter
μg/L micrograms per liter
TCE Trichloroethene
PCE Tetrachloroethene
PRB Permeable reactive barrier
RO Remedial Objectives
RI Remedial Investigation
SGSL Soil Gas Screening Level
SRLs Soil Remediation Levels Groundwater Protection Limits (GPLs)
RSL Regional Screening Level
VOCs Volatile organic compounds
WQARF Water Quality Assurance Revolving Fund
ZVI Zero valent Iron

Feasibility Study Report Highway 260 and Johnson Lane WQARF Site
Hwy 260 and Johnson FS 06‐30‐2019 rev1 1 Matrix‐CALIBRE Team
1.0 INTRODUCTION
The purpose of this Feasibility Study (FS) report is to evaluate remedial alternatives and provide a
recommendation for a preferred alternative for the Highway 260 and Johnson Lane Water Quality
Assurance Revolving Fund (WQARF) site (Site). The Site is located in Pinetop‐Lakeside, Arizona (see
Figure 1‐1) and covers an area of mixed commercial and residential land use. The Matrix‐CALIBRE Team
completed the work described in this report under Arizona Superfund Remedial Action Contract (ASRAC)
Number ADEQ14‐077538 with the Arizona Department of Environmental Quality (ADEQ).
1.1 Objectives and Scope of the Feasibility Study Report The FS is a process used to:
Identify remedial options and alternatives that will achieve the Site Remedial Objectives (ROs); and
Evaluate the identified remedies and recommend alternatives that comply with the requirements of
Arizona Revised Statutes1 (A.R.S.) §49‐282.06.
Based on the purpose and process noted above, this FS presents recommendations for a preferred
remedy that:
Assures the protection of public health, welfare, and the environment;
To the extent practicable, provides for the control, management, or cleanup of hazardous
substances so as to allow for the maximum beneficial use of waters of the state;
Implements remedial actions which are reasonable, necessary, cost‐effective, and technically
feasible; and
Addresses any well (used for municipal, domestic, industrial, irrigation or agricultural purposes) that
could produce water that would not be fit for its current or reasonably foreseeable end use without
treatment.
This FS report was developed based on data and information from the Remedial Investigation (RI,
Pinyon Environmental 2019). The FS develops and presents a reference remedy and two alternative
remedies, and evaluates the remedies to ensure that the remedies meet the following in accordance
with Arizona Administrative Code2 (A.A.C.) R18‐16‐ 407(H):
Achieves the ROs;
Is consistent with water management plans and general land use plans; and
Is evaluated with comparison criteria including practicability, risk, cost, and benefit.
One of the alternative remedies is less aggressive than the reference remedy and one is more aggressive
as required by A.A.C. R18‐16‐407(E).
1 Arizona Revised Statutes §49: The Environment, 282: Water Quality Assurance Revolving Fund, 06: Remedial action criteria; rules 2 Arizona Administrative Code Title 18: Environmental Quality, Chapter 16: Department of Environmental Quality WQARF Program, Article 4, 407: Feasibility Study
Feasibility Study Report Highway 260 and Johnson Lane WQARF Site
Hwy 260 and Johnson FS 06‐30‐2019 rev1 2 Matrix‐CALIBRE Team
In accordance with A.A.C. R18‐16‐407(I), based on the evaluation of the reference remedy and the
alternative remedies, the proposed remedy is developed and described in this FS report. Additionally,
this report describes the rationale for selecting the proposed remedy including the following:
How the proposed remedy will achieve the ROs;
How the comparison criteria were considered; and
How the proposed remedy meets the requirements of A.R.S. §49‐282.06.
1.2 Report Organization
This FS report has been prepared in accordance with the FS Work Plan (ADEQ 2019) and is organized as follows:
Section 2: Site Background includes Site description, Conceptual Site Model (CSM) and problem
statement defining the site conditions and media requiring remedial actions;
Section 3: Feasibility Study Scoping presents the regulatory requirements of Arizona statutes and
rules, delineation of the remediation areas, and the ROs established for the Site.
Section 4: Identification and Screening of Remediation Technologies presents an evaluation and
screening of remedial technologies applicable to contamination in soil and groundwater, and lists
the specific technologies retained for developing the reference and alternative remedies;
Section 5: Development of reference remedy and alternative remedies presents the evaluation
process and development of a reference remedy, a more aggressive remedy, and a less aggressive
remedy;
Section 6: Comparison of reference remedy and alternative remedies presents a summary of the
three remedial alternatives compared to each other based on practicability, risk, cost, and benefit,
and includes a discussion of uncertainties associated with each remedy;
Section 7: Proposed Remedy presents the proposed remedy and discusses how the remedy will
meet the requirements of A.R.S. §49‐282.06 and A.A.C. R18‐16‐407(I);
Section 8: Community Involvement presents public participation opportunities; and
Section 9: References provides a list of references cited in this FS report.
2.0 SITE HISTORY AND BACKGROUND
This section presents a summary of the Site history and description of physiographic setting, nature and
extent of contamination and a risk evaluation. This summary is taken in large part from the RI report
(Pinyon, 2019). This section also includes a description of the CSM for the Site and a problem statement
based on the CSM.
Feasibility Study Report Highway 260 and Johnson Lane WQARF Site
Hwy 260 and Johnson FS 06‐30‐2019 rev1 3 Matrix‐CALIBRE Team
2.1 Site History Groundwater sampling in 2015 identified tetrachloroethene (PCE) and trichloroethene (TCE) in private
wells on properties near the intersection of Highway 260 and Johnson Lane. PCE was detected at
concentrations ranging from 47 to 59 micrograms per liter (μg/L) in private wells used for potable supply
and irrigation. The Arizona Aquifer Water Quality Standard (AWQS) for PCE is 5.0 μg/L. TCE was
detected below the AWQS of 5 μg/L. ADEQ recommended use of alternate bottled water for the
impacted wells and initiated an Early Response Action in June 2018 that included providing treated
drinking water to residents affected by contaminated wells.
On June 24, 2016 the Highway 260 and Johnson Lane site was placed on the WQARF Registry with an
eligibility and evaluation score of 40 out of 120. ADEQ initiated a Remedial Investigation of the Site to
determine the source and extent of contamination.
2.2 Site Background The Site is located in Pinetop‐Lakeside, Arizona. The Site is generally bounded by Rhoton Lane to the
north, the western boundary of the Blue Ridge High School to the east, Burke Lane to the south, and
Rainbow View Drive to the west (Figure 1‐2).
The RI report was prepared in part to determine the nature and extent of contamination at the Site. The
RI also identified present and reasonably foreseeable uses of land and waters of the state that have
been impacted, or are threatened to be impacted, by the contamination. Based upon the data
collected, the following represents the interpretations and conclusions presented in the RI.
Based on sampling conducted over several years, PCE has been identified as the contaminant of concern
(COC) for the Site. The identified source of contamination is a former dry cleaner located on the Earl
properties at the southeast corner of Highway 260 and Johnson Lane.
The extent of elevated PCE concentrations in soil vapor is limited to the source area and nearby
properties located on the west side of Highway 260. The RI indicates that PCE concentrations in soil
vapor to the west of the Earl properties appear to be the result of lateral migration of PCE through
shallow, predominantly gravelly sand of the road base beneath and adjacent to Highway 260 (Figure 2‐
1). Another explanation for PCE concentrations in soil vapor on the west side of Highway 260 is
migration of PCE either as pure product or at relatively high concentrations in groundwater, along a
layer of basalt in the subsurface which is between 8 ft and 13 ft below ground surface (bgs) in the
vicinity of the Earl property.
The extent of PCE impacts in groundwater above the AWQS is generally limited to the area northwest of
the Earl properties, approximately 1,650 feet long and having a width of approximately 650 feet at its
widest (Figure 2‐2). PCE has been detected in groundwater from as deep as 310 feet within the plume.
In general, groundwater appears to be the primary mode of transport for PCE at the Site. The current
extent of impacts appears consistent with a general groundwater flow to the northwest.
The Site is located in a mixed commercial and residential area. Based on the land and water use study
(LWUS), the Site spans across three zoning districts: light commercial, single family residential, and
multiple family residential. The closest surface water bodies to the Site are Rainbow Lake, located
approximately 1,200 feet from the down‐gradient edge of the plume, and Billy Creek, a perennial stream
Feasibility Study Report Highway 260 and Johnson Lane WQARF Site
Hwy 260 and Johnson FS 06‐30‐2019 rev1 4 Matrix‐CALIBRE Team
located approximately 800 feet to the northeast. Surface water at Pinetop‐Lakeside is used primarily for
irrigation, livestock, domestic, tourism, and recreational purposes.
Nineteen private wells are located within potentially impacted areas in the vicinity of the Site. These
wells are drilled into the Pinetop‐Lakeside Aquifer. Private groundwater uses include irrigation,
domestic household applications, and commercial production. The potential receptors most likely to be
influenced by further down‐gradient progress of releases from the facility are private well owners and
users of Rainbow Lake.
2.3 Conceptual Site Model
The CSM for the Site includes the source (a release from a former dry cleaner on the Earl property),
migration pathways in soil, soil vapor and groundwater, and potential routes of exposure to the relevant
media. Groundwater at the Site contains PCE exceeding AWQS for potable use. The PCE plume is
defined as the groundwater zone impacted by PCE at concentrations exceeding the AWQS. From the
source area, the PCE plume migrates with groundwater flow to the northwest towards Rainbow Lake.
The Site is underlain by a layer of vesicular basalt which may slow the vertical migration of PCE but
empirical data demonstrates migration though it to groundwater. The local groundwater gradient is to
the west/northwest and irrigation wells used by a plant nursery business are located about 500 feet
down gradient from the source area. Surface water sampling from Rainbow Lake did not detect PCE in
any samples.
PCE in soil vapor extends off of the Earl property across Highway 260 to the west with the highest soil
vapor levels detected about 200 feet from the source (on the west side of Highway 260). The existing
soil vapor sampling data indicate an area of approximately 2 acres [about 400 feet (ft) long with a width
of 270 ft] with soil vapor levels exceeding the worker soil gas screening level [(SGSL)3, i.e., PCE above
1,567 micrograms per cubic meter, µg/m3, for commercial/industrial building use]. Near the former dry
cleaners, the highest soil vapor concentrations are from monitoring points SV‐9 and SV‐10 with PCE
concentrations in the range of 10,000 to 35,000 µg/m3. On the west side of Highway 260, about 200 ft
west of the former dry cleaners, the highest soil vapor concentrations are from points SV‐11, SV‐18, DP‐
11, and SV‐19C with PCE concentrations in the range of 19,000 to 44,000 µg/m3. Indoor air samples
were collected from the LLP property on the west side of Highway 260 and PCE was detected in each of
the indoor air samples at concentrations ranging from 4.86 to 10.2 µg/m3; all below EPA’s indoor air
regional screening levels4 (RSLs) for workers (47 µg/m3). Indoor air sampling was not completed at the
former dry cleaners because the dry cleaning equipment remains in the structure and any indoor air
concentrations would likely represent the prior PCE use in the building, not vapor intrusion.
3 The SGSLs are derived using an attenuation factor (α) applied to EPA’s regional screening levels (RSL) to represent the attenuation/dilution as vapors migrate into a building and mix with indoor air; SGSLs are not regulatory criteria but are intended to be used for screening. The PCE SGSL for residential use is 367 micrograms per cubic meter (µg/m3) and the worker SGSL (commercial/industrial building use) for PCE is 1,567 µg/m3. 4 EPA has developed RSLs to evaluate the potential for chronic exposure to cause cancer; the screening levels are an estimated PCE concentration that would be expected to cause no more than one in a million excess cancer risk to persons exposed during their lifetime (a 10‐6 risk).
Feasibility Study Report Highway 260 and Johnson Lane WQARF Site
Hwy 260 and Johnson FS 06‐30‐2019 rev1 5 Matrix‐CALIBRE Team
2.4 Problem Statement
The Site contains PCE residues in soil vapor and groundwater. Groundwater at the Site contains PCE
exceeding the AWQS (5.0 μg/L) covering approximately 20 acres (about 1,650 feet long with a width of
650 feet) and PCE has been detected at a depth of 310 ft bgs in a single well. The peak historical PCE
concentrations detected in the groundwater plume have been in the range of 45-60 µg/L, more recently
the highest PCE concentrations have been in the range of 10‐15 µg/L. The existing soil vapor sampling
data indicate an area of approximately 2 acres (about 400 ft long with a width of 270 ft) with soil vapor
levels exceeding the worker SGSL, i.e., PCE above 1,567 µg/m3, for commercial/ industrial building use.
The SGSL’s are screening levels and are not an enforceable standard.
Near the former dry cleaners, the highest soil vapor PCE concentrations are in the range of 10,000 to
35,000 µg/m3. On the west side of Highway 260, about 200 ft west of the former dry cleaners, the
highest soil vapor concentrations are PCE concentrations in the range of 19,000 to 44,000 µg/m3. All
measured indoor‐air values were below the indoor air PCE RSL for workers (47 µg/m3 and the RSL is a
screening level). The PCE residues in soil vapor may represent a continuing source that prolongs the
required duration of the groundwater remedy.
3.0 FEASIBILITY STUDY SCOPING
This section summarizes the regulatory requirements presented in Arizona statute and rule, delineates
the remediation areas and presents the ROs identified by ADEQ (ADEQ, 2018).
3.1 Regulatory Requirements The A.R.S. §49‐282.06 requires that remedial actions shall:
1. Assure the protection of public health and welfare and the environment.
2. To the extent practicable, provide for the control, management or cleanup of the hazardous
substances in order to allow the maximum beneficial use of the waters of the state.
3. Be reasonable, necessary, cost‐effective and technically feasible.
Under A.R.S. § 49‐282‐06 B, the selected remedial action “shall address, at a minimum, any well that at
the time of selection of the remedial action either supplies water for municipal, domestic, industrial,
irrigation or agricultural uses or is part of a public water system if the well would now or in the
reasonably foreseeable future produce water that would not be fit for its current or reasonably
foreseeable end uses without treatment due to the release of hazardous substances. The specific
measures to address any such well shall not reduce the supply of water available to the owner of the
well.”
Under A.R.S. Section 49‐282‐06 C, while selecting remedial actions, ADEQ shall consider:
1. Population, environmental and welfare concerns at risk.
2. Routes of exposure.

Feasibility Study Report Highway 260 and Johnson Lane WQARF Site
Hwy 260 and Johnson FS 06‐30‐2019 rev1 6 Matrix‐CALIBRE Team
3. Amount, concentration, hazardous properties, environmental fate, such as the ability to
bioaccumulate, persistence and probability of reaching the waters of the state, and the form of
the substance present.
4. Physical factors affecting human and environmental exposure such as hydrogeology, climate
and the extent of previous and expected migration.
5. The extent to which the amount of water available for beneficial use will be preserved by a
particular type of remedial action.
6. The technical practicality and cost‐effectiveness of alternative remedial actions applicable to a
site.
7. The availability of other appropriate federal or state remedial action and enforcement
mechanisms, including, to the extent consistent with this article, funding sources established
under CERCLA, to respond to the release.
3.2 Delineation of Remediation Areas The RI report collected samples from soil, soil vapor, groundwater, surface water, and indoor air and
compared the sample results to applicable regulatory standard to identify which media have been
impacted by COCs.
The RI Report concluded that the groundwater was the only media with COC concentrations that
exceeded a regulatory standard. PCE was detected in several monitoring wells at concentrations
exceeding the AWQS of 5 µg/L. As indicated in Section 2, the extent of groundwater that exceeds the
AWQS is an area of approximately 1,650 feet long by 650 feet wide covering an area of 20 acres. PCE
has been detected from the water table, which is encountered at approximately 30 feet bgs, to a depth
of 310 feet bgs in one well. This deepest well (ADEQ ID # 81400, see Figure 2‐2) is used for irrigation
supply and the PCE concentration is in a similar range to other shallower wells at depths of
approximately 100 to 200 ft bgs. The PCE detected in this deepest well (# 81400) may potentially be the
result of migration down the well bore hole.
PCE concentrations in groundwater, as monitored in November 2018, ranged from non‐detect to 23.3
µg/L. PCE was detected in 12 of the 15 wells that were sampled during the November 2018 event. The
wells were sampled most recently in April 2019 and PCE was detected in 10 of the 14 wells sampled.
Concentrations of PCE in the plume have generally been steady or decreasing across most of the Site
since monitoring began in 2015.
3.3 Remedial Objectives ROs have been developed for the Site as part of the RI process. Pursuant to A.A.C. R18‐16‐406 (I), the
ROs were based on field investigation results, the LWUS, the screening level risk evaluation, ADEQ input,
and input from the community during the public comment period on the draft RO Report. ROs are used
in this FS to identify appropriate remedial technologies in developing the remedial alternatives.
3.3.1 Remedial Objectives for Land Use The Site is located in a mixed commercial and residential area. Based on the LWUS, the Site spans
across three zoning districts: light commercial, single family residential, and multiple family residential.
According to the LWUS, there are no immediate plans to change the land use or zoning for properties
within the Site. Generally, commercial properties are concentrated near the southeastern portion of the
Site while residential properties are concentrated near the northwestern portion of the Site.

Feasibility Study Report Highway 260 and Johnson Lane WQARF Site
Hwy 260 and Johnson FS 06‐30‐2019 rev1 7 Matrix‐CALIBRE Team
In the RI, concentrations of PCE in soil vapor were converted to soil equivalents as per A.A.C. R18‐7‐
203(C) to determine the concentration reasonably expected in the soil. The calculated concentrations
were below the applicable Soil Remediation Levels (SRLs) or Groundwater Protection Limits (GPLs) and
impacts in soil are not expected to have a direct impact to human health or the environment.
Based on these conditions an RO for soil is not required because impacts in soil are not expected to have
a direct impact to human health or the environment.
3.3.2 Remedial Objectives for Surface Water The Site is located near Rainbow Lake and the RI included surface water samples collected from
Rainbow Lake. The surface water sampling in the RI did not identify any VOCs present above the
analytical method detection limits (i.e., all samples were non‐detect).
Based on these conditions an RO for surface water is not required because impacts in nearby surface
water bodies are not expected to have a direct impact to human health or the environment.
3.3.3 Remedial Objectives for Groundwater Use The groundwater use portion of the RI summarizes information gathered from the Arizona Department
of Water Resources (ADWR), local water providers, and well owners. No municipal production wells are
located within the Site.
According to the responses to the ADEQ questionnaires, Pinetop‐Lakeside receives 100% of its water
from wells that tap into the Pinetop‐Lakeside and Coconino aquifers. Until the time of the Pinetop‐
Lakeside/Navaho County Water Resources Element of the Regional Plan, most wells tapped into the
shallower Pinetop‐Lakeside aquifer. The two main water providers for the area, Pinetop Water
Community Facilities (which does not currently serve the Site) and Arizona Water Company, have wells
drilled into the deeper Coconino aquifer, the primary source of groundwater for the area, which is not
hydraulically connected to the Pinetop‐Lakeside Aquifer. There are currently no municipal wells in the
Site vicinity and no plans to install wells within the Site vicinity.
Nineteen private wells are located within potentially impacted areas in the vicinity of the Site. These
wells are drilled into the shallower Pinetop‐Lakeside Aquifer. Private groundwater uses include
irrigation, domestic household applications, and commercial production. There are no plans to install
additional wells or to change the use of wells within the Site vicinity.
During the most recent groundwater sampling event in April 2019, PCE was detected at or above the
AWQS in five private wells and two monitoring wells. The private wells provide water for commercial
irrigation and private domestic use. There are no plans to change the use of the impacted wells.
The ROs for groundwater at the Site are:
To restore, replace or otherwise provide for water for the designated use, lost or impaired by
contamination associated with the Highway 260 and Johnson Lane WQARF site. This action will
be needed as long as the need for the water exists, the resource remains available and the
contamination associated with the Highway 260 and Johnson Lane WQARF site prohibits or
limits the use of groundwater.
Feasibility Study Report Highway 260 and Johnson Lane WQARF Site
Hwy 260 and Johnson FS 06‐30‐2019 rev1 8 Matrix‐CALIBRE Team
4.0 IDENTIFICATION AND SCREENING OF REMEDIAL MEASURES AND REMEDIAL STRATEGIES
This section presents the evaluation and screening of various remedial measures and strategies related
to Site contamination and lists the applicable technologies retained for evaluation as part of the
reference and alternative remedies pursuant to A.A.C. R18‐16‐407 (E) and (F).
Remedial measures are remediation technologies or methodologies that are screened based on
anticipated removal or reduction of contaminants at the Site and the ability to achieve the ROs.
Remedial strategies incorporate one or more remediation measures/technologies to achieve the RO.
The basic remedial strategies summarized in A.A.C. R18‐16‐407 (F) are:
1. Plume remediation as a strategy to achieve AWQS for contaminants of concern throughout the site.
2. Physical containment as a strategy to contain contaminants within definite boundaries.
3. Controlled migration as a strategy to control the direction or rate of migration of contaminants.
4. Source control as a strategy to eliminate or mitigate a continuing source of contamination.
5. Monitoring as a strategy to observe and evaluate the contamination at the site through the
collection of data.
6. No action as a strategy that consists of no action at a site.
For the basic remedial strategies listed above, listed items 2 and 6 (physical containment and no action)
are unlikely to be applicable at this Site. The depth of contamination and existing development in the
immediate area make physical containment too costly and/or infeasible. The no action strategy will
not meet the ROs. The remaining remedial strategies (plume remediation, controlled migration, source
control, and monitoring) are applicable and will be retained for development of the reference remedy
and alternate remedies.
4.1 Remedial Technologies Screening Criteria Typically, appropriate remediation alternatives and technologies are screened using the following
criteria:
• compatibility with current and reasonably foreseeable land use,
• treatment effectiveness for removal of the site COCs,
• regulatory requirements,
• constructability,
• operation and maintenance requirements,
• health and safety considerations,
• generation and management of waste products,
• flexibility/expandability, and
• cost.
The screening presented below does not explicitly evaluate each technology against each of these
criteria, rather the intent is to identify fatal flaws or conversely, proven characteristics of technologies in
order to develop and assemble the remedial alternatives that are described in Section 5. The screening
of technologies is separated below into those that address vadose zone soil and those that address
groundwater.

Feasibility Study Report Highway 260 and Johnson Lane WQARF Site
Hwy 260 and Johnson FS 06‐30‐2019 rev1 9 Matrix‐CALIBRE Team
4.2 Screening of Technologies Applicable to Soil The technologies that are described in this section are routinely used for sites with chlorinated solvents
in vadose zone soil. The general approach, limitations and applicability to this Site are considered. Soil
technologies are presented even though a soil RO has not been developed because reducing PCE
concentrations in soil or soil vapor may decrease the timeframe required for groundwater remedies
thereby decreasing lifecycle costs.
4.2.1 Excavation and Disposal of Contaminated Soil This technology involves excavation and disposal of contaminated soil from the Site to eliminate
material that is leading to ongoing groundwater contamination or acting as a source to soil vapor and
potentially degrading indoor air quality. This technology is best suited where the area and depth of
contaminated soil is relatively limited such that the volume of soil can be cost‐effectively managed.
Additionally, the soil to be removed must be readily accessible—not blocked by utilities, buildings, or
transportation corridors. Finally, sites where excavation is typically selected are those where the
concentrations are high and represent a significant ongoing source that is causing impacts to associated
media such as groundwater, surface water, or indoor air. It is unclear whether any of these factors
apply at the Site. The cost to excavate impacted soil is anticipated to be high relative to the benefit, and
constructability issues associated with existing buildings and infrastructure that would make it difficult
to access impacted soil make this technology unsuitable and it is therefore not retained for alternative
development.
4.2.2 Soil Vapor Extraction Soil Vapor Extraction or SVE is a proven technology for removing volatile organic compounds (VOCs)
from the vadose zone. SVE involves installation of vertical, inclined, or horizontal wells above the water
table in areas with elevated VOC concentrations and applying a vacuum to the wells using a blower.
Flow through the subsurface draws contaminants into the wells and to the ground surface where the
VOCs are removed from the vapor stream using a treatment system that typically consists of a water
drop‐out tank, a granular activated carbon unit, and various controls to operate the SVE system. SVE
systems typically remove a relatively high quantity of VOCs early in system operation and the rate of
mass removal declines rapidly based on the mass initially present in the vadose zone and the
accessibility of the mass for removal by the SVE system. The latter is a function of the soil porosity,
layering, presence of fractures; and spacing of the extraction wells relative to the location of the VOC
mass. Additionally, if the integrity of the surface seal is poor, short‐circuit flow paths can reduce system
efficiency. This technology is generally cost‐effective, straightforward to construct, operate and
maintain. It is retained for alternative development.
4.3 Screening of Groundwater Technologies The technologies that are described in this section are routinely used for sites with chlorinated solvents
dissolved in groundwater. The general approach, limitations and applicability to the Site are considered.
4.3.1 Monitored Natural Attenuation Monitored Natural Attenuation or MNA is an approach that involves monitoring VOCs and other
parameters in groundwater to identify and track the reduction of contaminant concentrations over
time. Processes that can reduce concentrations include dilution, dispersion, volatilization, and biological
degradation. Documenting MNA typically includes measurement of various chemical and

Feasibility Study Report Highway 260 and Johnson Lane WQARF Site
Hwy 260 and Johnson FS 06‐30‐2019 rev1 10 Matrix‐CALIBRE Team
hydrogeological parameters to provide evidence that MNA is a protective remedy. MNA is usually
combined with source control, or selected at sites where the source is substantially depleted. MNA is
typically applicable to sites where the contaminant plume is stable or shrinking. MNA as a technology is
retained for alternative development.
4.3.2 Enhanced Reductive Dechlorination Enhanced Reductive Dechlorination or ERD is a remedial technology based on injecting substrate and/or
nutrients and appropriate bacteria into groundwater to promote anaerobic biodegradation of VOCs.
Anaerobic reductive dechlorination is a naturally occurring biodegradation process whereby microbes
can degrade chlorinated VOCs in groundwater. The microbes use a primary substrate as a carbon and
energy source, producing enzymes and other compounds that degrade the target chlorinated
compounds present in groundwater. Most applications use a bio‐stimulation substrate to provide a
carbon source for driving the aquifer redox conditions lower and at the same time provide a
fermentation substrate that releases hydrogen to serve as an electron donor (required for the
dechlorination reactions). A variety of compounds have been used as bio‐stimulation amendments for
ERD applications. Bio‐augmentation is a subsequent step, required for some but not all sites, during
which a microbial mixture is injected into groundwater to initiate or accelerate key dechlorination steps.
Depending on the contaminants present and the subsurface conditions, a variety of microbial cultures
have been developed and are marketed by specialty vendors.
As with any in‐situ technology, success depends on the ability to deliver the reagent to the impacted
areas. ERD is only applicable to the saturated zone, and typically it must be combined with source zone
treatment of any VOC residues in the vadose zone. However, with an effective ERD treatment zone in
groundwater, the extent and duration of the vadose zone treatment may potentially be reduced
because the rapid degradation of VOCs in groundwater is less sensitive to continuing contributions from
the vadose zone.
ERD wells can be located at source areas or hotspots within a groundwater plume. In these
configurations, ERD is implemented to maximize mass removal of COCs. An alternate configuration is to
install ERD wells in a line perpendicular to the groundwater flow direction near the leading edge of the
plume. In this configuration, the wells are sometimes called “bio‐barrier wells” and the goal is to reduce
COC concentrations to acceptable levels as groundwater is transported through the line of wells.
Biological treatment via ERD has been retained as a viable technology for plume treatment because it
has been proven to be effective for enhancing and accelerating the reduction of PCE concentrations in
groundwater at similar sites.
4.3.3 In‐Situ Chemical Oxidation This remedial technology, in‐situ chemical oxidation or ISCO, involves chemical reactions that convert
contaminants into less toxic or inert compounds. ISCO is implemented by injecting a chemical oxidant
into groundwater via a series of injection wells (or other injection methods) to destroy or degrade
organic compounds. Several different types of oxidants have been used successfully at chlorinated
solvent sites including permanganate, persulfate, hydrogen peroxide and iron, and ozone. Site‐specific
aquifer oxidation‐reduction (redox) conditions and parameters, hydraulic conductivity, along with
oxidant‐specific characteristics, need to be evaluated to determine the oxidant dosing and other critical
design parameters. Pilot testing and/or bench testing is typically necessary to establish the injection

Feasibility Study Report Highway 260 and Johnson Lane WQARF Site
Hwy 260 and Johnson FS 06‐30‐2019 rev1 11 Matrix‐CALIBRE Team
spacing, rates, and oxidant dosing. Although targeted for destruction of dissolved VOCs in water, the
oxidizing agent will also react with the soil matrix; therefore, the radius of influence from the injection
points may be limited.
ISCO it is not considered a cost‐effective or feasible technology for plume‐wide treatment due to the
depth and size of the plume, the relatively low concentrations detected, and the costs associated with
overcoming the oxidant demand from the soil. However, there may be more limited areas where ISCO
would be applicable and ISCO has been retained as a viable technology for hot‐spot treatment in
groundwater.
4.3.4 In‐Situ Chemical Reduction In situ chemical reduction (ISCR) is intended to reduce VOC concentrations by using materials such as
zero‐valent iron (ZVI) to degrade the VOCs. This technology is usually implemented in a permeable
reactive barrier (PRB) or funnel‐and‐gate configuration where the ZVI can be installed perpendicular to
the groundwater flow direction and the base of the barrier can be tied into a low permeability layer.
Due to the apparent thickness of the plume and the logistical complications associated with excavation
at the Site, this technology would be infeasible to implement at this Site. As such, this technology was
not retained for further consideration.
4.3.5 Groundwater Extraction and Treatment This remedial technology involves pumping contaminated groundwater from the plume and treating the
groundwater ex‐situ before discharge. Groundwater extraction and treatment removes and reduces
contaminant mass from the aquifer but it is generally more effective in controlling or containing the
down‐gradient migration of the VOC plume. Contaminated groundwater can be treated by activated
carbon, air stripping, oxidation, or by other means prior to discharge. Discharge options that may be
considered include discharge to a sanitary sewer or a storm drain, a beneficial re‐use such as irrigation
supply, or reinjection into the aquifer at some location away from the plume. Discharge options with a
beneficial re‐use are strongly preferred due to the importance of water as a resource.
Groundwater extraction and treatment is typically inefficient at reducing contaminant mass because the
concentrations in groundwater are low and it is expensive to operate. It is unlikely to meet the Site ROs
within a reasonable restoration time frame by itself. However, it can be an effective plume containment
approach. This FS includes groundwater extraction and treatment as one element of the long‐term
remedy considered for the Site, and this remedial technology has been retained for further evaluation.
4.3.6 Summary of Screening and Technologies Retained Table 4‐1 presents a summary of screening and specific technologies retained for developing the
remedial alternatives.
Feasibility Study Report Highway 260 and Johnson Lane WQARF Site
Hwy 260 and Johnson FS 06‐30‐2019 rev1 12 Matrix‐CALIBRE Team
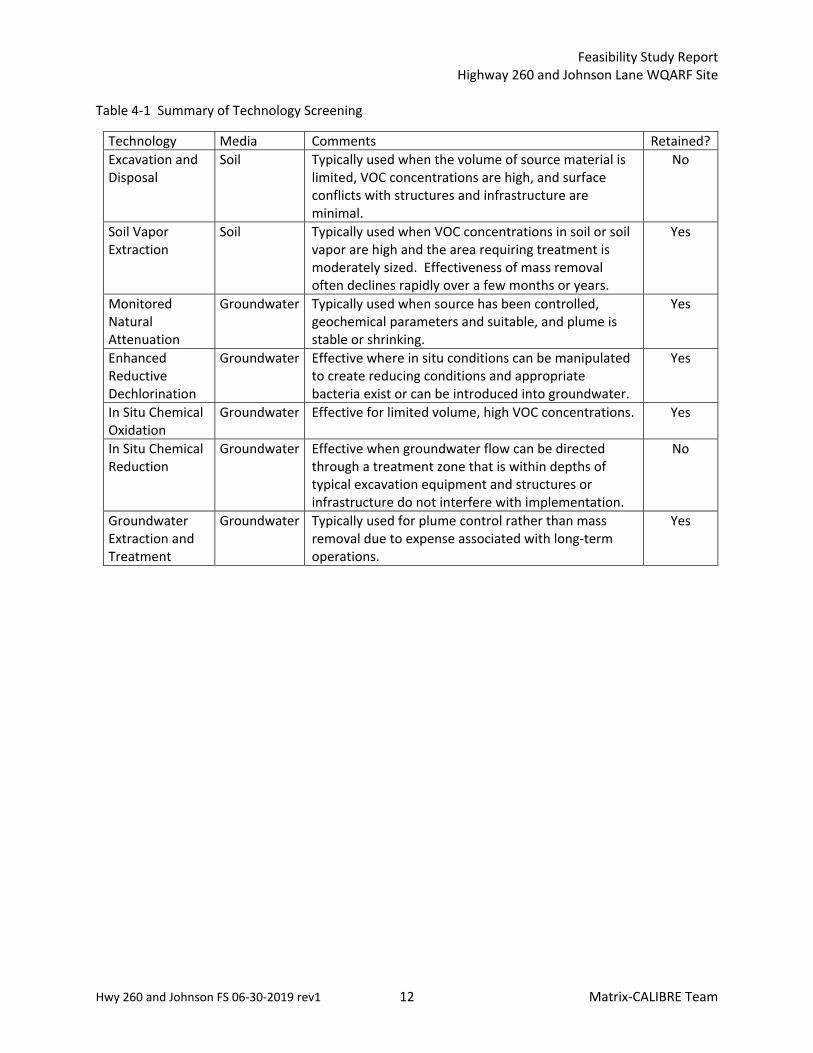
Table 4‐1 Summary of Technology Screening
Technology Media Comments Retained?
Excavation and Disposal
Soil Typically used when the volume of source material is limited, VOC concentrations are high, and surface conflicts with structures and infrastructure are minimal.
No
Soil Vapor Extraction
Soil Typically used when VOC concentrations in soil or soil vapor are high and the area requiring treatment is moderately sized. Effectiveness of mass removal often declines rapidly over a few months or years.
Yes
Monitored Natural Attenuation
Groundwater Typically used when source has been controlled, geochemical parameters and suitable, and plume is stable or shrinking.
Yes
Enhanced Reductive Dechlorination
Groundwater Effective where in situ conditions can be manipulated to create reducing conditions and appropriate bacteria exist or can be introduced into groundwater.
Yes
In Situ Chemical Oxidation
Groundwater Effective for limited volume, high VOC concentrations. Yes
In Situ Chemical Reduction
Groundwater Effective when groundwater flow can be directed through a treatment zone that is within depths of typical excavation equipment and structures or infrastructure do not interfere with implementation.
No
Groundwater Extraction and Treatment
Groundwater Typically used for plume control rather than mass removal due to expense associated with long‐term operations.
Yes

Feasibility Study Report Highway 260 and Johnson Lane WQARF Site
Hwy 260 and Johnson FS 06‐30‐2019 rev1 13 Matrix‐CALIBRE Team
5.0 DEVELOPMENT OF REFERENCE REMEDY AND ALTERNATIVE REMEDIES
Based on the retained remedial technologies presented in Section 4, this section develops and presents
the recommended Site remedies including a reference remedy along with alternative remedies (less
aggressive and more aggressive remedies). The reference remedy and alternate remedies consist of
remedial strategies and actions (remedial measures) to achieve ROs for the Site. The ROs established
the in RI are presented in Section 3 and the range of remedial strategies considered, from A.A.C. R18‐16‐
407(F), are summarized in Section 4.
As noted in Section 4, physical containment and no action are unlikely to be applicable at this Site and
the other remedial strategies from A.A.C. R18‐16‐407(F) ( i.e., plume remediation, controlled
migration, source control, and monitoring) are used to develop the reference remedy and alternate
remedies. For the vadose zone, potential remedies consider current and future land use and/or impacts
to groundwater. For groundwater, each remedy has been identified with consideration of the needs of
the local water provider (Arizona Water Company) and existing private water supply wells used by local
businesses and residents.
Selected remedial measures are combined with the applicable strategies to develop the reference
remedy and alternative remedies. For this Site, the reference remedy and each alternative remedy
include contingent remedial measures. The contingent remedial measures are included to address the
existing uncertainties regarding certain Site conditions, the achievement of ROs, or uncertain
timeframes in which ROs will be achieved. Where remedial measures are necessary to achieve ROs, the
remedial measures will be required as long as necessary to ensure the continued achievement of those
objectives. The areas where remedial alternatives need to address environmental impacts include the
plume area which is above the PCE AWQS of 5 µg/L (from the source to suitable down gradient
boundaries) and may also consider areas where elevated levels of PCE in soil vapor are reported in the
RI. The down gradient area with elevated levels of PCE in soil vapor is primarily on the west side of
Highway 260. This down gradient area is not the initial source for the plume (i.e., it is not the point of
release from the dry cleaner operations) but it currently represents the area with the highest PCE
concentrations detected in soil vapor. The PCE inventory in this zone may be sufficiently high that it
warrants remedial measures for control; this is a remaining data gap from the RI and the remedial
alternatives listed below have been developed to address it.
The reference remedy and the alternative remedies are presented in the following sections. Discussion
of the remedies includes a discussion of the associated remedial measures and remedial strategies
pursuant to A.A.C. R18‐16‐ 407(E). The remedial alternatives presented include a group of similar and
related remedial measures; therefore, the discussion of individual remedial measures is presented after
the discussion of the remedial alternatives.
5.1 Reference Remedy This section describes the reference remedy. The remedial strategies from A.A.C. R18‐16‐407(F)
included are monitoring, controlled migration, plume remediation, and source control. The remedial
measures/technologies include in the reference remedy are:
Feasibility Study Report Highway 260 and Johnson Lane WQARF Site
Hwy 260 and Johnson FS 06‐30‐2019 rev1 14 Matrix‐CALIBRE Team
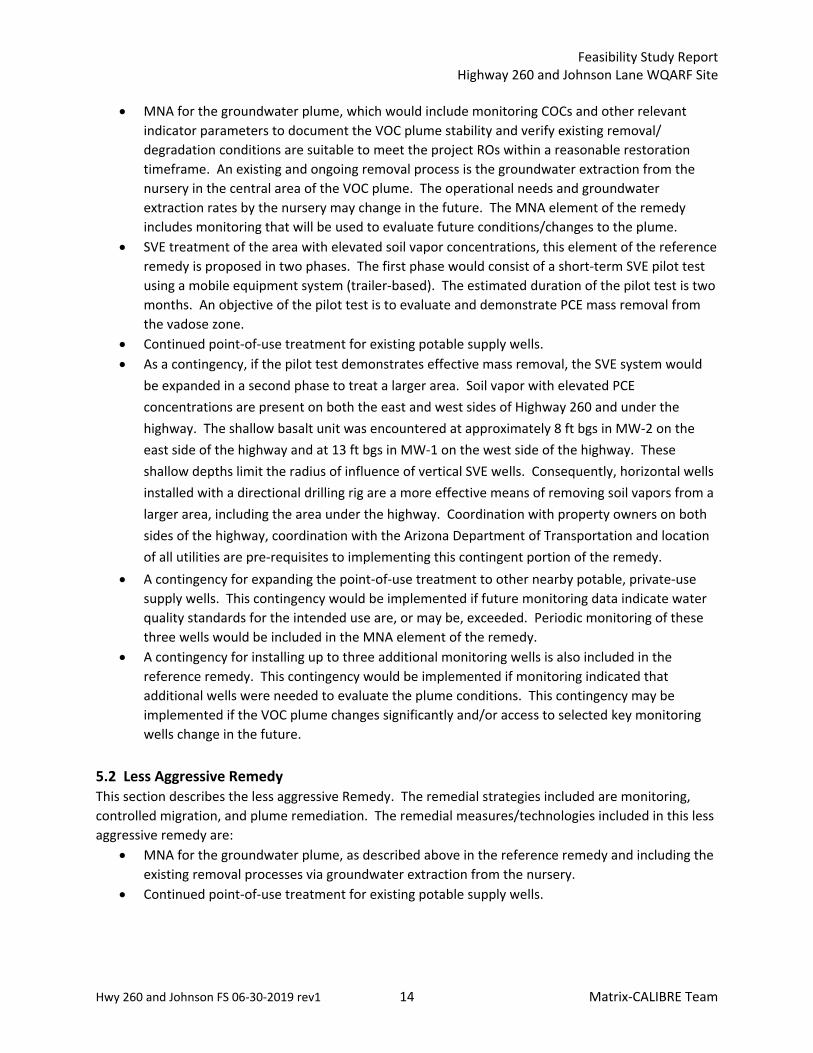
MNA for the groundwater plume, which would include monitoring COCs and other relevant
indicator parameters to document the VOC plume stability and verify existing removal/
degradation conditions are suitable to meet the project ROs within a reasonable restoration
timeframe. An existing and ongoing removal process is the groundwater extraction from the
nursery in the central area of the VOC plume. The operational needs and groundwater
extraction rates by the nursery may change in the future. The MNA element of the remedy
includes monitoring that will be used to evaluate future conditions/changes to the plume.
SVE treatment of the area with elevated soil vapor concentrations, this element of the reference
remedy is proposed in two phases. The first phase would consist of a short‐term SVE pilot test
using a mobile equipment system (trailer‐based). The estimated duration of the pilot test is two
months. An objective of the pilot test is to evaluate and demonstrate PCE mass removal from
the vadose zone.
Continued point‐of‐use treatment for existing potable supply wells.
As a contingency, if the pilot test demonstrates effective mass removal, the SVE system would
be expanded in a second phase to treat a larger area. Soil vapor with elevated PCE
concentrations are present on both the east and west sides of Highway 260 and under the
highway. The shallow basalt unit was encountered at approximately 8 ft bgs in MW‐2 on the
east side of the highway and at 13 ft bgs in MW‐1 on the west side of the highway. These
shallow depths limit the radius of influence of vertical SVE wells. Consequently, horizontal wells
installed with a directional drilling rig are a more effective means of removing soil vapors from a
larger area, including the area under the highway. Coordination with property owners on both
sides of the highway, coordination with the Arizona Department of Transportation and location
of all utilities are pre‐requisites to implementing this contingent portion of the remedy.
A contingency for expanding the point‐of‐use treatment to other nearby potable, private‐use
supply wells. This contingency would be implemented if future monitoring data indicate water
quality standards for the intended use are, or may be, exceeded. Periodic monitoring of these
three wells would be included in the MNA element of the remedy.
A contingency for installing up to three additional monitoring wells is also included in the
reference remedy. This contingency would be implemented if monitoring indicated that
additional wells were needed to evaluate the plume conditions. This contingency may be
implemented if the VOC plume changes significantly and/or access to selected key monitoring
wells change in the future.
5.2 Less Aggressive Remedy This section describes the less aggressive Remedy. The remedial strategies included are monitoring,
controlled migration, and plume remediation. The remedial measures/technologies included in this less
aggressive remedy are:
MNA for the groundwater plume, as described above in the reference remedy and including the
existing removal processes via groundwater extraction from the nursery.
Continued point‐of‐use treatment for existing potable supply wells.

Feasibility Study Report Highway 260 and Johnson Lane WQARF Site
Hwy 260 and Johnson FS 06‐30‐2019 rev1 15 Matrix‐CALIBRE Team
Contingency for expanding the point‐of‐use treatment at up to three other nearby potable,
private‐use supply wells if future monitoring data indicate water quality standards for the
intended use are, or may be, exceeded.
Contingency for installing up to three additional monitoring wells. This contingency would be
implemented if monitoring indicated that additional wells were needed to evaluate the plume
conditions.
5.3 More Aggressive Remedy This section describes the more aggressive remedy. The remedial strategies included are monitoring,
controlled migration, plume remediation, and source control. The remedial measures/technologies
included in this more aggressive remedy are:
MNA for the groundwater plume, as described above in the reference remedy and including the
existing removal processes via groundwater extraction from the nursery.
Continued point‐of‐use treatment for existing potable supply wells.
SVE treatment of the area with elevated concentrations of PCE in soil vapor, as described in the
reference remedy, including the contingency to expand the SVE operations to a Phase 2
treatment area.
This more aggressive remedy includes in‐situ treatment of groundwater. At present, there is no
location where in‐situ treatment is necessary or appropriate because the PCE concentrations are
relatively low. If, however, the PCE concentrations increased over time, after the SVE system
had been operation and allowed to provide source control, an in‐situ remedy might be
appropriate. The most likely technology for this contingent in‐situ treatment would be
enhanced reductive dechlorination (ERD), which would include injecting substrate and bacteria
into one or more wells at or up gradient of the groundwater area with the highest PCE
concentrations. This element of the remedy would not be implemented for approximately two
years after the SVE remedy was terminated to give that element of the remedy time to show
improvements in groundwater via source control. For costing purposes, it is assumed that three
injection wells would be installed and substrate would be injected in the wells three times per
year for three years. Groundwater samples would be collected from those wells and other
nearby wells to evaluate the performance of the remedy.
Contingency for expanding the point‐of‐use treatment to other nearby potable, private‐use
supply wells if future monitoring data indicate water quality standards for the intended use are,
or may be, exceeded.
Contingency for installing up to three additional monitoring wells. This contingency would be
implemented if monitoring indicated that additional wells were needed to evaluate the plume
conditions.
5.4 Discussion of Specific Remedial Measures Concentrations of PCE have generally been steady or decreasing across most of the Site since
monitoring began in 2015. Based on these conditions, plus the relatively low PCE concentrations
observed in groundwater, a combination of MNA and other measures/technologies are proposed as the
reference remedy and the alternate remedies. The MNA element of the remedy includes monitoring of
selected Site wells on a periodic basis for the duration of the remedial action. The expected life‐cycle of

Feasibility Study Report Highway 260 and Johnson Lane WQARF Site
Hwy 260 and Johnson FS 06‐30‐2019 rev1 16 Matrix‐CALIBRE Team
MNA operation is uncertain because the duration of existing data is too short to make a projection
regarding attenuation rates and the estimated timeframe to meet the AWQS. The operating duration of
MNA as the sole remedy is assumed to be 25 years for purpose of developing the FS cost estimate. The
FS cost estimate for the less aggressive remedy includes 25 year of monitoring; the reference remedy,
including additional remedial measures (as a contingency), is based on 20 years of monitoring; and the
more aggressive remedy is based on 15 years of monitoring. The timeframe for restoration is an
estimate and the actual timeframe may be longer and is unlikely to be much shorter.
The continued point‐of‐use treatment for existing potable supply wells is an important element of the
remedy. Existing private water supply wells are impacted, or near the VOC plume, and this treatment
element is required to meet the ROs. This treatment element will be required as long as the existing
wells are used for potable use and impacts exceed the AWQS. A contingency is included for expanding
the point‐of‐use treatment recognizing the plume boundaries may change and/or use of existing wells
within the existing boundary may change.
SVE is proposed for PCE mass removal from vadose zone soil which would be implemented in the hot‐
spot area on the both sides of Highway 260 where the PCE concentrations in soil vapor are highest. SVE
is a presumptive remedy for removal of VOCs from moderately permeable soils. As presently conceived
a short‐term SVE pilot test would be implemented to evaluate the need and relative benefits of SVE
operations. The SVE operations described herein may not be required to meet and fulfill the ROs but it
is anticipated that SVE operations could reduce the project lifecycle costs.
Source area treatment of groundwater is included as an element of the more aggressive remedy. The
most likely option if this action was deemed necessary or warranted would be ERD treatment including
injecting substrate and dechlorinating bacteria into one or more wells in the area(s) with the highest
COC concentrations. It would also include monitoring COCs and other indicator parameters. This type
of a contingency would be considered to assist, or accelerate the timeframe to closure, with MNA as the
primary groundwater remedy.
6.0 DETAILED COMPARISON OF THE REFERENCE REMEDY AND THE ALTERNATIVE REMEDIES
This section compares the three alternatives described in the previous section using the evaluation
criteria listed in the A.A.C. 18‐16 407(H). That section provides the comparative evaluation criteria
required in the FS including:
1) A demonstration that the remedial alternative will achieve the remedial objectives.
2) An evaluation of consistency with the water management plans of affected water providers and
the general land use plans of local governments with land use jurisdiction.
3) An evaluation of the comparison criteria including:
a. An evaluation of the practicability of the alternative, including its feasibility, short and long‐
term effectiveness, and reliability, considering site‐specific conditions, characteristics of the
contamination resulting from the release, performance capabilities of available technologies,
and institutional considerations.

Feasibility Study Report Highway 260 and Johnson Lane WQARF Site
Hwy 260 and Johnson FS 06‐30‐2019 rev1 17 Matrix‐CALIBRE Team
b. An evaluation of risk, including the overall protectiveness of public health and aquatic and
terrestrial biota under reasonably foreseeable use scenarios and end uses of water. This
evaluation shall address:
i. Fate and transport of contaminants and concentrations and toxicity over the life of the
remediation;
ii. Current and future land and resource use;
iii. Exposure pathways, duration of exposure, and changes in risk over the life of the
remediation;
iv. Protection of public health and aquatic and terrestrial biota while implementing the
remedial action and after the remedial action; and
v. Residual risk in the aquifer at the end of remediation.
c. An evaluation of the cost of the remedial alternative, including the expenses and losses
including capital, operating, maintenance, and life cycle costs. The cost analysis may include
the analysis of uncertainties that may impact the cost of a remedial alternative, analysis of
projected water uses and costs associated with use‐based treatment, other use impairment
costs of water not remediated to water quality standards, and the cost of measures such as
alternative water supply or treatment. Transactional costs necessary to implement the
remedial alternative, including the transactional costs of establishing long‐term financial
mechanisms, such as trust funds, for funding of an alternative remedy, shall be included in the
cost estimate.
d. An evaluation of the benefit, or value, of the remediation. This analysis includes factors such
as:
i. Lowered risk to human and aquatic and terrestrial biota;
ii. Reduced concentration and reduced volume of contaminated water;
iii. Decreased liability; acceptance by the public;
iv. Aesthetics; preservation of existing uses;
v. Enhancement of future uses; and
vi. Improvements to local economies.
e. A discussion of the comparison criteria, as evaluated in relation to each other.
6.1 Evaluation of the Reference Remedy
6.1.1 Achieving Remedial Objectives
The reference remedy is anticipated to achieve remedial objectives for groundwater, which are “to
restore, replace or otherwise provide for water for the designated use….” in the following ways. First,
existing actions have been implemented to restore water for residents with water supply wells by
providing point‐of‐use treatment within the plume footprint and the reference remedy will continue this
action until other elements of the remedy have had time to work. The MNA portion of the remedy will
restore groundwater over a period of several years. The required duration for MNA is not predictable
because the existing sampling has not been conducted long enough to establish trends. Implementing

Feasibility Study Report Highway 260 and Johnson Lane WQARF Site
Hwy 260 and Johnson FS 06‐30‐2019 rev1 18 Matrix‐CALIBRE Team
SVE in and near the former source area will reduce additional inputs of PCE to groundwater, which
would likely decrease the duration of the groundwater remedy.
6.1.2 Impacts on Water Management Plans or Land Use Plans
The reference remedy is not anticipated to have any adverse impact on local water management plans
or land use planning. Neither the Pinetop‐Lakeside General Plan nor the Pinetop‐Lakeside Navajo
County Regional Plan have land use considerations that seem to conflict with the reference remedy
(Pinetop‐Lakeside 2015, BRW, 2004). Any new water supply wells are expected to be drilled into the
Coconio aquifer, which underlies the Pinetop‐Lakeside surficial aquifer in the area. Once PCE
concentrations are below AWQS, groundwater will be suitable to use for any purpose, which would have
a positive effect on water management, because there would be no restrictions.
6.1.3 Practicability Evaluation
The reference remedy is anticipated to be practicable to implement at the Site in the short‐term and
straightforward to operate and maintain in the long term. Short‐term considerations are related to
logistics and property access associated with installing an SVE system to treat soil vapors near the
former source area. Specific requirements would be obtaining property access agreements, utility
clearance and coordinating with any utility services required. The SVE system would require periodic
inspections, sampling, and maintenance. SVE systems are generally reliable and a telemetry system
would be included to notify operators if a maintenance visit was required. PCE, the contaminant of
concern at the Site is a common chemical in groundwater at many sites and does not pose any unusual
challenges for remedial actions.
6.1.4 Risk Evaluation
The reference remedy is anticipated to provide a positive effect on the overall protectiveness of public
health, aquatic and terrestrial biota during and after implementation. Currently, the public is protected
by providing point‐of‐use treatment to the nearby landowners who rely on shallow groundwater wells
that are impacted by the Site. That protection will continue as long as necessary. Additional risk
reduction will be achieved over several years when the MNA remedy is in place and the SVE system is
intended to shorten the duration of the time required for MNA. There are no known or anticipated risks
to aquatic or terrestrial biota because the PCE impacts are confined to groundwater, which is
inaccessible to biota. There are no currently planned changes to land use that would amplify the
existing risks at the Site. One possible change could be a different land use on the Earl Property.
The public can be protected while implementing the SVE portion of the remedy using standard
construction safety practices including signage and fencing. While the SVE system is operating, public
safety would be maintained by storing the equipment in a locked trailer or within a locked fence. There
are no specific impacts to biota envisioned with the type of remedial actions in the reference remedy.

Feasibility Study Report Highway 260 and Johnson Lane WQARF Site
Hwy 260 and Johnson FS 06‐30‐2019 rev1 19 Matrix‐CALIBRE Team
After the remedy is completed, it is anticipated that PCE concentrations will be less than the AWQS of 5
µg/L, such that the residual risk associated with the site will have been effectively minimized.
6.1.5 Cost Evaluation
The cost of the reference remedy including short‐term capital costs, ongoing operation and
maintenance costs is estimated to be $895,000. The reference remedy also includes contingencies to
provide an expanded SVE system, additional point‐of‐use treatment for up to three residences, and
installation of up to three wells for plume monitoring, at a cost of approximately $627,000 for the three
contingent elements. The total cost of the reference remedy, including the contingent elements is
$1,522,000. Table 6‐1 summarizes the relative cost comparison for the three alternatives considered.
Other transactional costs such as funding mechanisms as described in A.A.C. 18‐16 407 are not
anticipated to impact the cost of the reference remedy. A detailed cost breakdown for the reference
remedy is presented in Appendix A, Table A‐1.
Table 6‐1. Summary of Costs for Remedial Alternatives
6.1.6 Benefit Evaluation
The reference remedy is anticipated to provide benefits to the community as it is implemented by
reducing risk associated with consumption of contaminated groundwater. Although this risk is
effectively managed by point‐of‐use treatment, the need for such treatment will be eliminated after the
MNA remedy is complete. At that point in time, PCE concentrations will be below AWQS and the
volume of contaminated water will be essentially eliminated.
Alternative Base Cost Contingent Elements Total Cost
Restoration Timeframe2
Reference Remedy (MNA, SVE, point‐of‐use treatment)
$895,000 $626,000 $1,522,000 20 Years
Less Aggressive Remedial Alternative (MNA, point‐of‐use treatment)
$936,000 $264,000 $1,200,000 25 Years
More Aggressive Remedial Alternative (MNA, SVE, point‐of‐use treatment, in situ groundwater treatment)
$1,026,000 $601,000 $1,627,000 15 years
Notes: 1. All costs are estimates and should not be interpreted as final construction, or project bid costs. Costs are in present dollars (2019) and do not include inflation. All costs include a 15% markup for project indirect costs (reporting/design/project oversight) and a 20% contingency 2. The timeframe for restoration is an estimate based on limited data, actual timeframes may be longer and are unlikely to be shorter.
Feasibility Study Report Highway 260 and Johnson Lane WQARF Site
Hwy 260 and Johnson FS 06‐30‐2019 rev1 20 Matrix‐CALIBRE Team
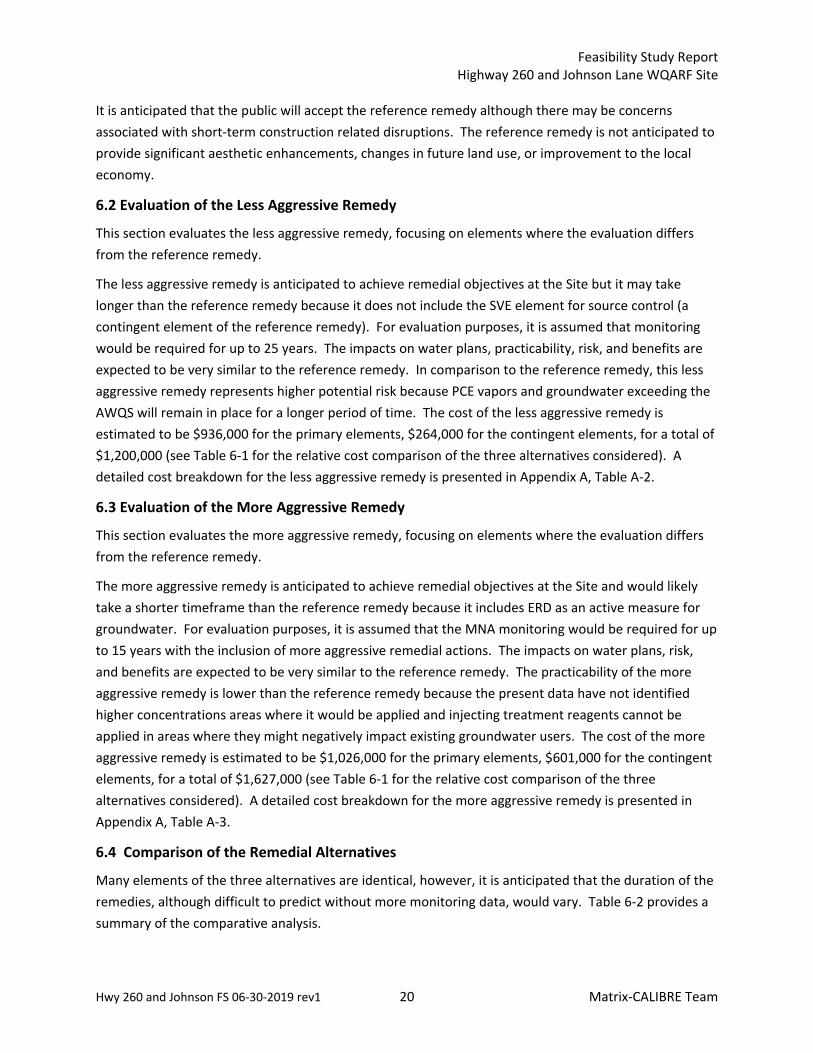
It is anticipated that the public will accept the reference remedy although there may be concerns
associated with short‐term construction related disruptions. The reference remedy is not anticipated to
provide significant aesthetic enhancements, changes in future land use, or improvement to the local
economy.
6.2 Evaluation of the Less Aggressive Remedy
This section evaluates the less aggressive remedy, focusing on elements where the evaluation differs
from the reference remedy.
The less aggressive remedy is anticipated to achieve remedial objectives at the Site but it may take
longer than the reference remedy because it does not include the SVE element for source control (a
contingent element of the reference remedy). For evaluation purposes, it is assumed that monitoring
would be required for up to 25 years. The impacts on water plans, practicability, risk, and benefits are
expected to be very similar to the reference remedy. In comparison to the reference remedy, this less
aggressive remedy represents higher potential risk because PCE vapors and groundwater exceeding the
AWQS will remain in place for a longer period of time. The cost of the less aggressive remedy is
estimated to be $936,000 for the primary elements, $264,000 for the contingent elements, for a total of
$1,200,000 (see Table 6‐1 for the relative cost comparison of the three alternatives considered). A
detailed cost breakdown for the less aggressive remedy is presented in Appendix A, Table A‐2.
6.3 Evaluation of the More Aggressive Remedy
This section evaluates the more aggressive remedy, focusing on elements where the evaluation differs
from the reference remedy.
The more aggressive remedy is anticipated to achieve remedial objectives at the Site and would likely
take a shorter timeframe than the reference remedy because it includes ERD as an active measure for
groundwater. For evaluation purposes, it is assumed that the MNA monitoring would be required for up
to 15 years with the inclusion of more aggressive remedial actions. The impacts on water plans, risk,
and benefits are expected to be very similar to the reference remedy. The practicability of the more
aggressive remedy is lower than the reference remedy because the present data have not identified
higher concentrations areas where it would be applied and injecting treatment reagents cannot be
applied in areas where they might negatively impact existing groundwater users. The cost of the more
aggressive remedy is estimated to be $1,026,000 for the primary elements, $601,000 for the contingent
elements, for a total of $1,627,000 (see Table 6‐1 for the relative cost comparison of the three
alternatives considered). A detailed cost breakdown for the more aggressive remedy is presented in
Appendix A, Table A‐3.
6.4 Comparison of the Remedial Alternatives
Many elements of the three alternatives are identical, however, it is anticipated that the duration of the
remedies, although difficult to predict without more monitoring data, would vary. Table 6‐2 provides a
summary of the comparative analysis.

Feasibility Study Report Highway 260 and Johnson Lane WQARF Site
Hwy 260 and Johnson Lane FS 07‐31‐2019 rev 1 21 Matrix‐CALIBRE Team
Table 6‐2 Summary of Comparison of Reference Remedy and Alternative Remedies
Remedial Alternative Will
Achieve Site ROs?
Consistent with Water Management
Plans?
Practicability Risk/ Overall protectiveness
Cost (includes
contingencies) Benefit Public Acceptance
Reference Remedy MNA, Point‐of‐use treatment , contingency for SVE pilot/implementation, contingency for expanding the Point‐of‐use treatment
Yes Yes
High, conventional proven
technologies,
need property access
Protective $1,522,000
High with targeted mass removal from source, lowered risk
Yes
(Anticipated)
Less Aggressive Remedy MNA, Point‐of‐use treatment, contingency for expanding the Point‐of‐use Treatment
Yes Yes High, conventional proven
technology
Protective, but duration is expected to be longer
than reference remedy
$1,200,000 Medium, lowered risk
Yes (Anticipated)
More Aggressive Remedy MNA, Point‐of‐use treatment , SVE pilot/implementation, plus in‐situ ERD treatment of groundwater
Yes Yes
Medium, conventional proven
technologies,
need property access
Protective, anticipated shorter
duration than reference remedy
$1,627,000
High with targeted mass removal from source, lowered risk
Yes (Anticipated)
All the alternatives are considered practicable, but the More Aggressive Remedy is ranked lower in terms of practicability because it is less
certain how or where the in situ treatment would be applied.
Feasibility Study Report Highway 260 and Johnson Lane WQARF Site
Hwy 260 and Johnson Lane FS 07‐31‐2019 rev 1 22 Matrix‐CALIBRE Team
7.0 PROPOSED REMEDY
The proposed remedy is recommended as a modification of the reference remedy (one element, the
SVE pilot test is moved to a contingency). The proposed remedy meets the requirements of A.R.S. §49‐
282.06 and A.A.C. R18‐16‐407(I) as summarized below. The remedial measures/technologies included in
the proposed remedy are:
MNA for the groundwater plume, which would include monitoring COCs and other relevant
indicator parameters to document the VOC plume stability and verify existing removal/
degradation conditions. The MNA element of the remedy includes monitoring that will be used
to evaluate future conditions/changes to the plume.
Continued point‐of‐use treatment for existing potable supply wells.
As a contingency, SVE treatment of the area with elevated soil vapor concentrations. This
contingent element of the recommended remedy is proposed in two phases. The first phase
would consist of a short‐term SVE pilot test using a mobile equipment system (trailer‐based). If
the SVE pilot test demonstrates effective mass removal, the SVE system would be expanded in a
second phase to treat a larger area. This contingency would be implemented if deemed
necessary based on future monitoring results. Soil vapor with elevated PCE concentrations is
present on both the east and west sides of Highway 260.
A contingency for expanding the point‐of‐use treatment to other nearby potable, private‐use
supply wells. This contingency would be implemented if future monitoring data indicate water
quality standards for the intended use are, or may be, exceeded.
A contingency for installing up to three additional monitoring wells. This contingency may be
implemented if the VOC plume changes significantly and/or access to selected key monitoring
wells change in the future.
7.1 Achieving Remedial Objectives
The proposed remedy is anticipated to achieve remedial objectives for groundwater, which are to “to
restore, replace or otherwise provide for water for the designated use….” by providing affected
residents with point‐of‐use treatment; the MNA portion of the remedy will restore groundwater over a
period of several years; if the SVE contingency is implemented in and near the former source area, it
will reduce additional inputs of PCE to groundwater, which will decrease the duration of the
groundwater remedy.
7.2 Impacts on Water Management Plans or Land Use Plans
The proposed remedy is not anticipated to have adverse impact on local water management plans or
land use planning. Once PCE concentrations are below AWQS, groundwater will be suitable to use for
any purpose, which would have a positive effect on water management, because there would be no
restrictions.
Feasibility Study Report Highway 260 and Johnson Lane WQARF Site
Hwy 260 and Johnson Lane FS 07‐31‐2019 rev 1 23 Matrix‐CALIBRE Team
7.3 Practicability Evaluation
The proposed remedy is anticipated to be practicable to implement at the Site in the short‐term and
straightforward to operate and maintain in the long term. Short‐term considerations are related to
logistics and property access associated with installing an SVE system to treat soil vapors near the
former source area. In the long term, the SVE system would require periodic inspections, sampling, and
maintenance.
7.4 Risk Evaluation
The proposed remedy is anticipated to provide a positive effect on the overall protectiveness of public
health, aquatic and terrestrial biota during and after implementation. Currently, the public is protected
by providing point‐of‐use treatment to the nearby landowners who rely on shallow groundwater wells
that are impacted by the Site. Additional risk reduction will be achieved over several years when the
MNA remedy is in place and if the SVE contingency is implemented, the SVE system will the duration of
the time required for MNA.
If the SVE contingency is implemented, the public can be protected while implementing this portion of
the remedy using standard construction safety practices including signage and fencing. If implemented,
public safety would be maintained by storing the equipment in a locked trailer or within a locked fence.
There are no specific impacts to biota envisioned with the type of remedial actions in the proposed
remedy.
After the remedy is completed, it is anticipated that PCE concentrations will be less than the AWQS of 5
µg/L, such that the residual risk associated with the site will have been effectively minimized.
7.5 Cost Evaluation
The cost of the proposed remedy including short‐term capital costs, ongoing operation and maintenance
costs is estimated to be $748,000. The SVE contingency is included to reduce uncertainty in the
estimated restoration timeframe; as noted in Sections 5 and 6, the number of years of MNA required is
an estimate and the actual number of years may be longer. This contingency is included to address the
requirements under A.A.C. R18‐16‐407(H)3(c) to consider uncertainties in the cost analysis that may
impact life‐cycle cost of remedial alternatives. The decision to implement this SVE contingency will be
based on analysis of future groundwater monitoring results. The SVE contingency would be
implemented to reduce uncertainty in the clean‐up time and corresponding costs. The proposed remedy
also includes contingencies to provide additional point‐of‐use treatment for up to three residences, and
installation of up to three wells for plume monitoring, at a cost of approximately $774,000 for the
contingent elements. The total cost of the proposed remedy is $1,522,000. Other transactional costs
such as funding mechanisms as described in A.A.C. 18‐16 407 are not anticipated to impact the cost of
the proposed remedy. A detailed cost breakdown for the proposed remedy is presented in Appendix A,
Table A‐4.

Feasibility Study Report Highway 260 and Johnson Lane WQARF Site
Hwy 260 and Johnson Lane FS 07‐31‐2019 rev 1 24 Matrix‐CALIBRE Team
7.6 Benefit Evaluation
The proposed remedy is anticipated to provide benefits to the community as it is implemented by
reducing risk associated with consumption of contaminated groundwater. Although this risk is
effectively managed by point‐of‐use treatment, the need for such treatment will be eliminated after the
MNA remedy is complete. At that point in time, PCE concentrations will be below AWQS and the
volume of contaminated water essentially eliminated. The SVE contingency is included to reduce
uncertainty in the estimated restoration timeframe and to provide an added benefit by accelerating Site
restoration.
The public acceptance of the proposed remedy will be addressed through community involvement. The
proposed remedy is not anticipated to provide significant aesthetic enhancements, changes in future
land use, or improvement to the local economy. There may be potential concerns associated with short‐
term construction related disruptions for contingent elements (i.e., construction related to a SVE pilot
test and expanded SVE operations).
8.0 COMMUNITY INVOLVEMENT
ADEQ has implemented multiple community involvement (CI) steps to date and will continue to do so in
the future. Existing CI steps have included:
Public notice regarding availability of the WQARF Registry listing for the Site
Developing a Community Involvement Plan (CIP)
Establishing a Community Advisory Board (CAB)
Public notice and comments on the Draft RI Report
Public notice regarding availability of the RO Report
Public notice regarding availability of the FS Work Plan
Public notice regarding availability of the Final RI Report
ADEQ will issue a Notice to the Public announcing availability of FS Report on ADEQ’s website at
www.azdeq.gov. The notice may be mailed to the Public Mailing List for the site, water providers, the
CAB, and any other interested parties.
9.0 REFERENCES
ADEQ, 2018. Proposed Remedial Objectives Report. Highway 260 and Johnson Lane WQARF Registry
Site. Pinetop‐Lakeside, Arizona
ADEQ, 2019. Feasibility Study Work Plan. Highway 260 and Johnson Lane WQARF Registry Site.
Pinetop‐Lakeside, Arizona
ADWR, 2010. Arizona Water Atlas Volume 2: Eastern Plateau Planning Area
http://www.azwater.gov/azdwr/StatewidePlanning/WaterAtlas/EasternPlateau/default.htm

Feasibility Study Report Highway 260 and Johnson Lane WQARF Site
Hwy 260 and Johnson Lane FS 07‐31‐2019 rev 1 25 Matrix‐CALIBRE Team
BRW, 2004, Pinetop‐Lakeside & Navajo County Regional Plan: Water Resources Element (Section 4.10)
https://www.pinetoplakesideaz.gov/ArchiveCenter/ViewFile/Item/147
Pinetop‐Lakeside, 2015, General Plan.
https://www.pinetoplakesideaz.gov/DocumentCenter/View/855/2015‐General‐Plan‐‐‐
Pinyon Environmental Inc., 2019 Remedial Investigation Report, Highway 260 and Johnson Lane Pinetop‐
Lakeside, Arizona. January 25, 2019.

Feasibility Study Report Highway 260 and Johnson Lane WQARF Site
Hwy 260 and Johnson Lane FS 07‐31‐2019 rev 1 Matrix‐CALIBRE Team
Figures

¹Figure 1-1 Site Location
Highway 260 and Johnson Lane WQARF Site
LEGEND
Service Layer Credits: Esri, HERE, Garmin, (c) OpenStreetMap contributorsSources: Esri, HERE, Garmin, USGS, Intermap, INCREMENT P, NRCan, Esri Japan, METI, Esri China (Hong Kong), Esri Korea, Esri (Thailand), NGCC, © OpenStreetMap contributors, and theGIS User CommunityEsri, HERE, Garmin, © OpenStreetMap contributors, and the GIS user community
_̂SITE LOCATION
0 25 5012.5 Miles
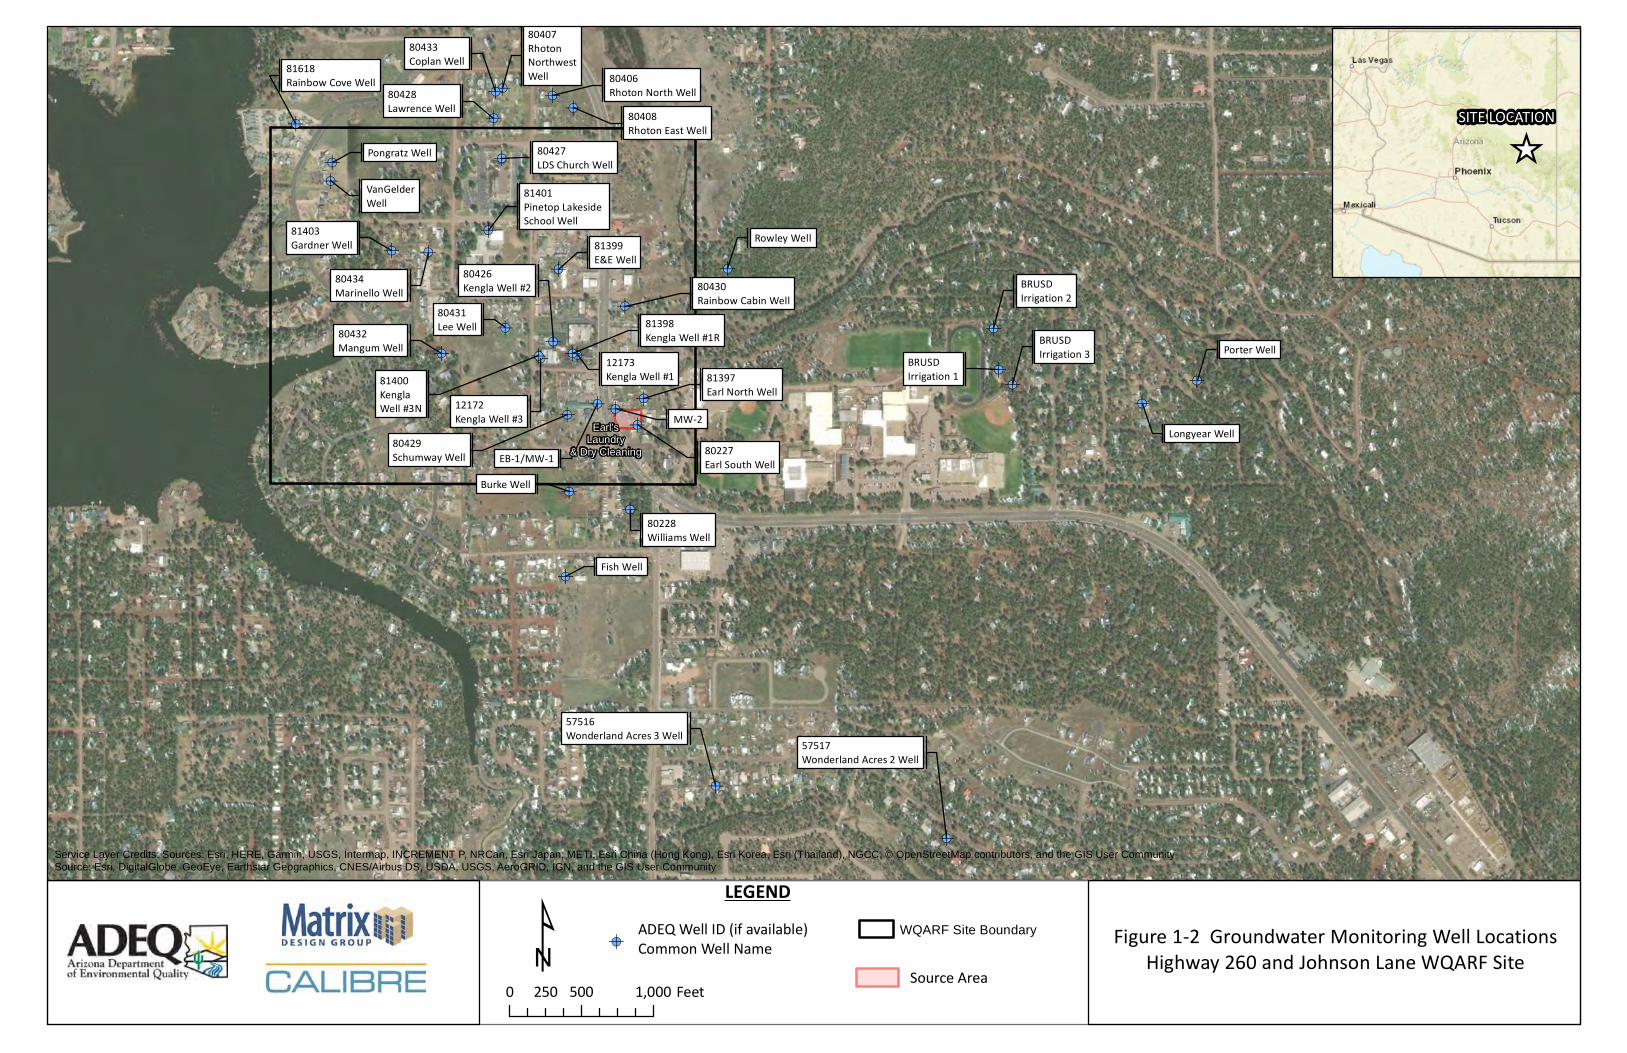
!A
!A!A
!A!A
!A
!A
!A
!A!A
!A !A
!A
!A !A!A!A
!A
!A!A
!A
!A
!A
!A
!A
!A!A
!A
!A
!A
!A
!A
!A!A
!A!A !A
80407RhotonNorthwestWell
12173Kengla Well #1
80426Kengla Well #2
81400KenglaWell #3N MW-2
81618Rainbow Cove Well
Pongratz Well
VanGelderWell
80433Coplan Well
80428Lawrence Well
80427LDS Church Well
81401Pinetop Lakeside School Well
80406Rhoton North Well
80408Rhoton East Well
81403Gardner Well
80434Marinello Well
80431Lee Well80432
Mangum Well81398Kengla Well #1R
80429Schumway Well
12172Kengla Well #3
81399E&E Well
80430Rainbow Cabin Well
Rowley Well
81397Earl North Well
80227Earl South Well
Burke Well
80228Williams Well
Fish Well
57516Wonderland Acres 3 Well 57517
Wonderland Acres 2 Well
BRUSDIrrigation 1
BRUSDIrrigation 2
BRUSDIrrigation 3
Longyear Well
Porter Well
EB-1/MW-1
Earl'sLaundry
& Dry Cleaning
0 500 1,000250 Feet¹
_̂SITE LOCATION
Figure 1-2 Groundwater Monitoring Well LocationsHighway 260 and Johnson Lane WQARF Site
!A
Source Area
LEGENDService Layer Credits: Sources: Esri, HERE, Garmin, USGS, Intermap, INCREMENT P, NRCan, Esri Japan, METI, Esri China (Hong Kong), Esri Korea, Esri (Thailand), NGCC, © OpenStreetMap contributors, and the GIS User CommunitySource: Esri, DigitalGlobe, GeoEye, Earthstar Geographics, CNES/Airbus DS, USDA, USGS, AeroGRID, IGN, and the GIS User Community
ADEQ Well ID (if available)Common Well Name
WQARF Site Boundary
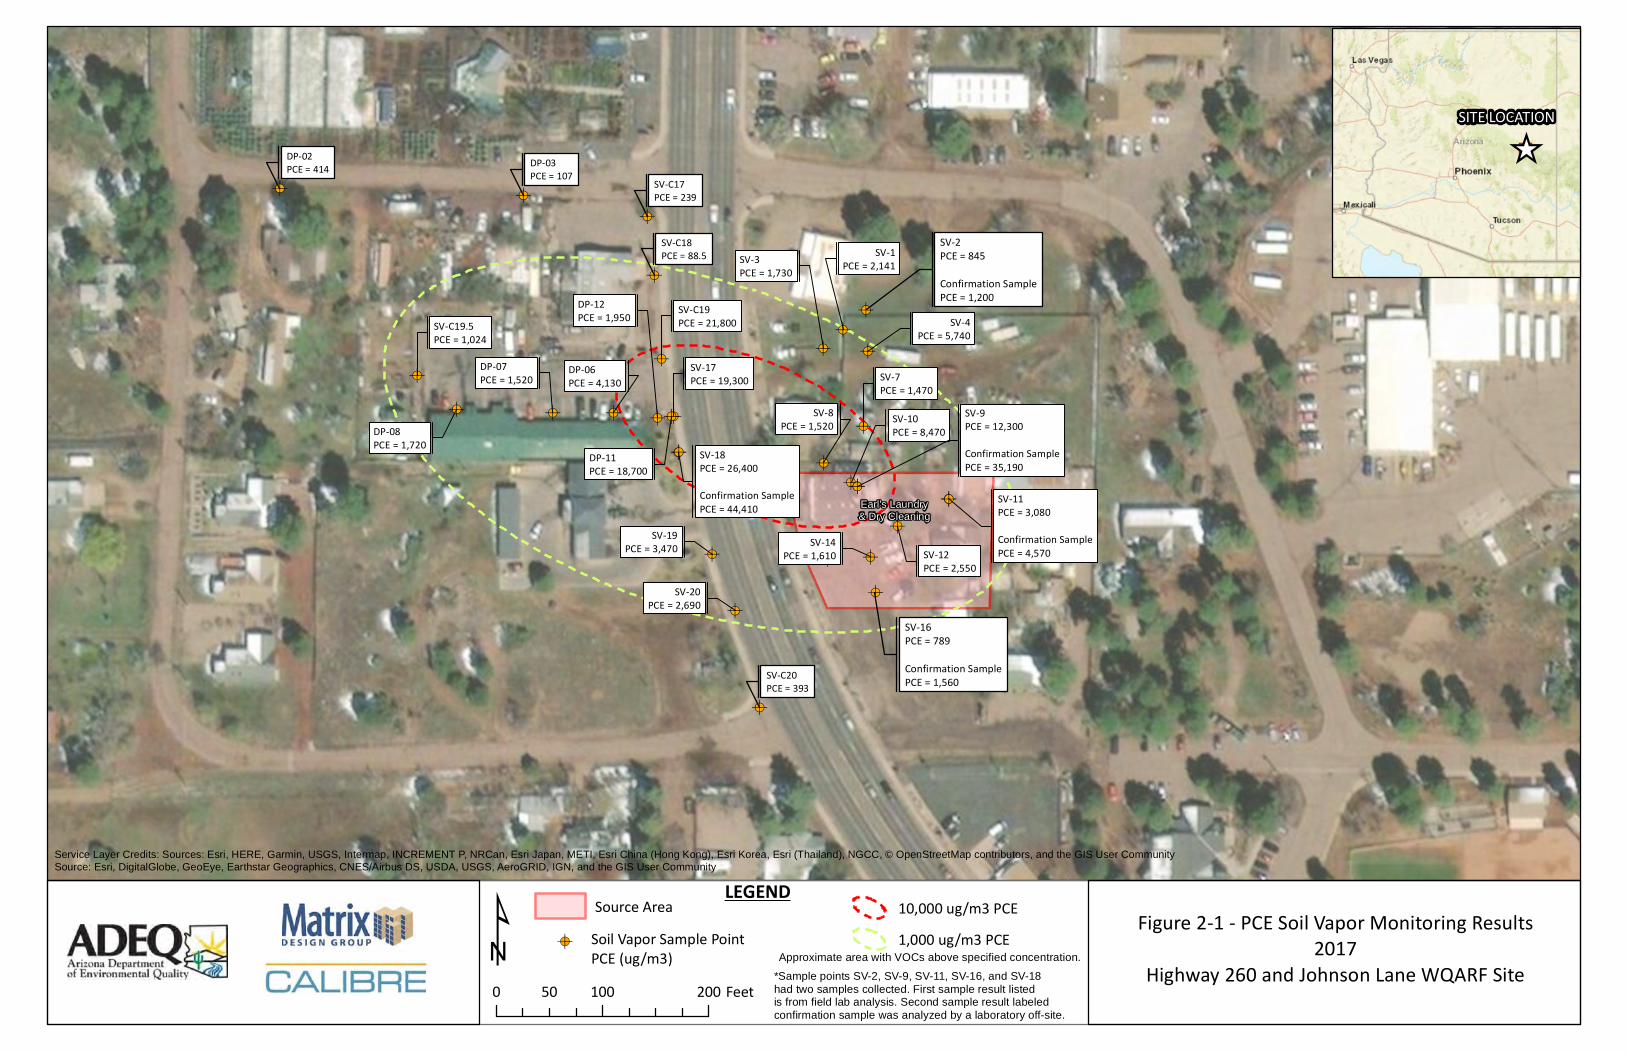
!A !A
!A
!A
!A
!A
!A
!A
!A!A
!A
!A!A
!A
!A
!A
!A
!A
!A
!A
!A
!A
!A
!A
!A
!A
!A !A !A !A!A
!A
SV-16PCE = 789Confirmation SamplePCE = 1,560
SV-2PCE = 845Confirmation SamplePCE = 1,200
DP-08PCE = 1,720
DP-07PCE = 1,520 DP-06
PCE = 4,130
DP-12PCE = 1,950
DP-11PCE = 18,700
SV-18PCE = 26,400Confirmation SamplePCE = 44,410
SV-C19PCE = 21,800
SV-17PCE = 19,300
SV-10PCE = 8,470
SV-9PCE = 12,300Confirmation SamplePCE = 35,190
SV-7PCE = 1,470
SV-4PCE = 5,740
SV-3PCE = 1,730
SV-8PCE = 1,520
SV-19PCE = 3,470
SV-C19.5PCE = 1,024
SV-20PCE = 2,690
SV-14PCE = 1,610 SV-12
PCE = 2,550
SV-11PCE = 3,080Confirmation SamplePCE = 4,570
SV-1PCE = 2,141
Earl's Laundry& Dry Cleaning
SV-C20PCE = 393
SV-C18PCE = 88.5
SV-C17PCE = 239
DP-02PCE = 414 DP-03
PCE = 107
0 100 20050 Feet¹
_̂SITE LOCATION
Figure 2-1 - PCE Soil Vapor Monitoring Results2017
Highway 260 and Johnson Lane WQARF Site
Source Area LEGENDService Layer Credits: Sources: Esri, HERE, Garmin, USGS, Intermap, INCREMENT P, NRCan, Esri Japan, METI, Esri China (Hong Kong), Esri Korea, Esri (Thailand), NGCC, © OpenStreetMap contributors, and the GIS User CommunitySource: Esri, DigitalGlobe, GeoEye, Earthstar Geographics, CNES/Airbus DS, USDA, USGS, AeroGRID, IGN, and the GIS User Community
!A Soil Vapor Sample PointPCE (ug/m3)
*Sample points SV-2, SV-9, SV-11, SV-16, and SV-18 had two samples collected. First sample result listed is from field lab analysis. Second sample result labeledconfirmation sample was analyzed by a laboratory off-site.
10,000 ug/m3 PCE1,000 ug/m3 PCE
Approximate area with VOCs above specified concentration.

!A
!A
!A
!A!A
!A
!A
!A
!A
!A
!A !A
!A
!A !A!A
!A
!A
!A!A
!A
!A
!A
!A
!A
!A!A
81399 (E&E Well)Sampled Previouslyand historically non-detect
EB-1/MW-1PCE = 13.7
MW-2PCE = 15.1
81618PCE = <1.0
80427PCE = <1.0
81403PCE = 0.797
80434PCE = 3.34
80431PCE = 15.7
80432PCE = 2.25
12173PCE = 14.3
81398PCE = 15.1
80426PCE = 14.9
81400PCE = 10.8
80430PCE = <1.0
81397PCE = <1.0
80227PCE = 1.05
Earl's Laundry& Dry Cleaning
0 250 500125 Feet¹
_̂SITE LOCATION
Figure 2-2 - PCE Groundwater Monitoring ResultsApril 2019
Highway 260 and Johnson Lane WQARF Site
PCE Contours!A
Source Area
LEGENDService Layer Credits: Sources: Esri, HERE, Garmin, USGS, Intermap, INCREMENT P, NRCan, Esri Japan, METI, Esri China (Hong Kong), Esri Korea, Esri (Thailand), NGCC, © OpenStreetMap contributors, and the GIS User CommunitySource: Esri, DigitalGlobe, GeoEye, Earthstar Geographics, CNES/Airbus DS, USDA, USGS, AeroGRID, IGN, and the GIS User Community
5 ug/L10 ug/L
15 ug/LWell IDPCE (ug/L)

Feasibility Study Report Highway 260 and Johnson Lane WQARF Site
Hwy 260 and Johnson FS 06‐30‐2019 rev1 no edits Matrix‐CALIBRE Team
Appendix A Detailed Cost Estimates
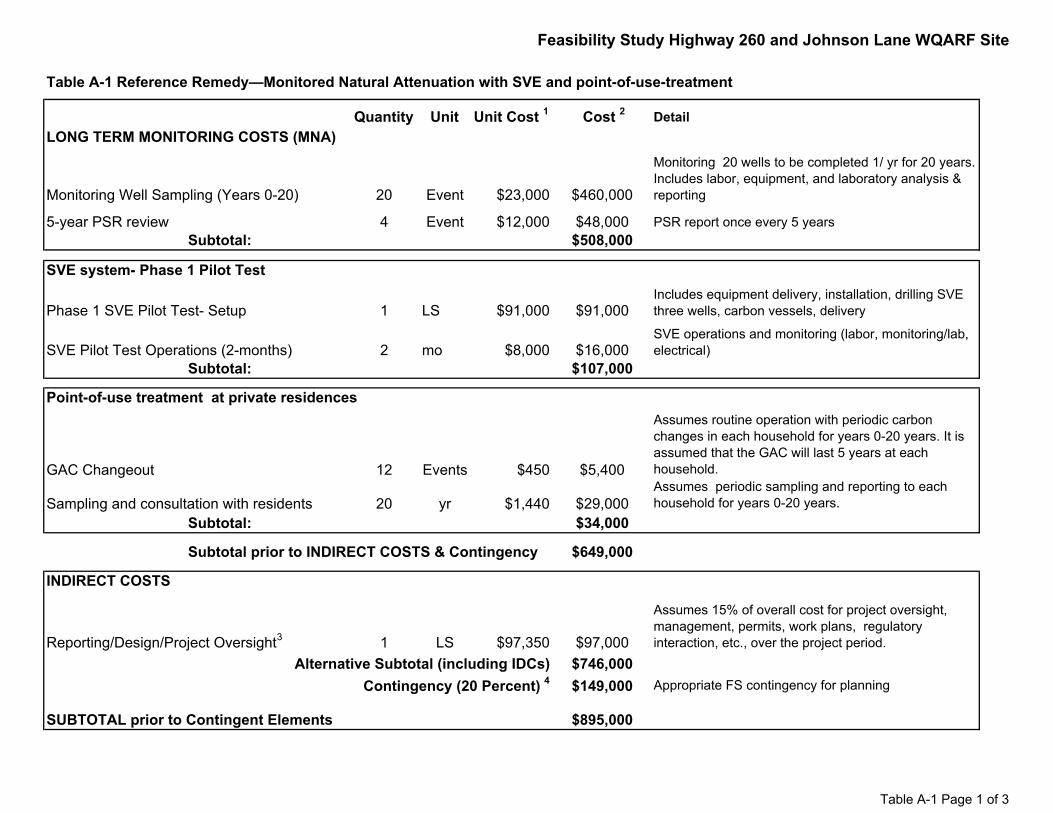
Feasibility Study Highway 260 and Johnson Lane WQARF Site
Table A-1 Reference Remedy—Monitored Natural Attenuation with SVE and point-of-use-treatment
Quantity Unit Unit Cost 1 Cost 2 DetailLONG TERM MONITORING COSTS (MNA)
Monitoring Well Sampling (Years 0-20) 20 Event $23,000 $460,000
Monitoring 20 wells to be completed 1/ yr for 20 years. Includes labor, equipment, and laboratory analysis & reporting
5-year PSR review 4 Event $12,000 $48,000 PSR report once every 5 years
Subtotal: $508,000
SVE system- Phase 1 Pilot Test
1 LS $91,000 $91,000Includes equipment delivery, installation, drilling SVE three wells, carbon vessels, delivery
SVE Pilot Test Operations (2-months) 2 mo $8,000 $16,000SVE operations and monitoring (labor, monitoring/lab, electrical)
Subtotal: $107,000
Point-of-use treatment at private residences
GAC Changeout 12 Events $450 $5,400
Assumes routine operation with periodic carbon changes in each household for years 0-20 years. It is assumed that the GAC will last 5 years at each household.
Sampling and consultation with residents 20 yr $1,440 $29,000Assumes periodic sampling and reporting to each household for years 0-20 years.
Subtotal: $34,000
Subtotal prior to INDIRECT COSTS & Contingency $649,000
INDIRECT COSTS
Reporting/Design/Project Oversight3 1 LS $97,350 $97,000
Assumes 15% of overall cost for project oversight, management, permits, work plans, regulatory interaction, etc., over the project period.
$746,000
$149,000 Appropriate FS contingency for planning
SUBTOTAL prior to Contingent Elements $895,000
Phase 1 SVE Pilot Test- Setup
Alternative Subtotal (including IDCs) Contingency (20 Percent) 4
Table A-1 Page 1 of 3
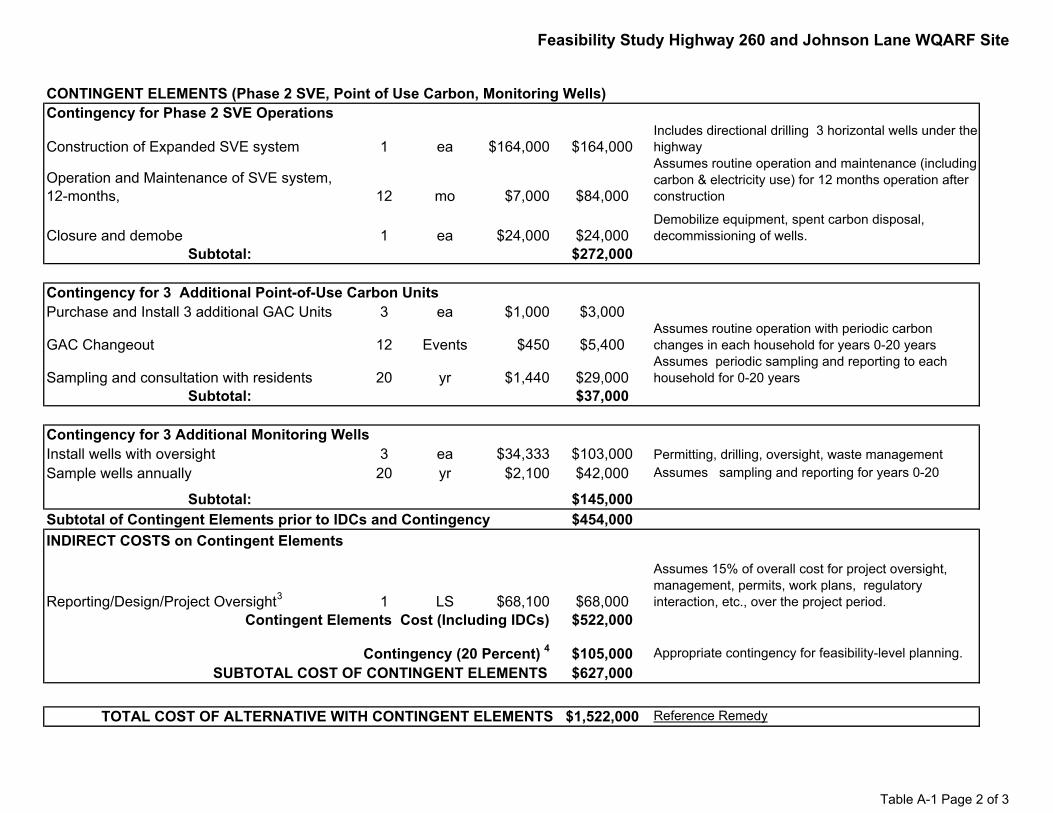
Feasibility Study Highway 260 and Johnson Lane WQARF Site
CONTINGENT ELEMENTS (Phase 2 SVE, Point of Use Carbon, Monitoring Wells)
1 ea $164,000 $164,000Includes directional drilling 3 horizontal wells under the highway
12 mo $7,000 $84,000
Assumes routine operation and maintenance (including carbon & electricity use) for 12 months operation after construction
1 ea $24,000 $24,000Demobilize equipment, spent carbon disposal, decommissioning of wells.
Subtotal: $272,000
Contingency for 3 Additional Point-of-Use Carbon UnitsPurchase and Install 3 additional GAC Units 3 ea $1,000 $3,000
GAC Changeout 12 Events $450 $5,400Assumes routine operation with periodic carbon changes in each household for years 0-20 years
Sampling and consultation with residents 20 yr $1,440 $29,000Assumes periodic sampling and reporting to each household for 0-20 years
Subtotal: $37,000
Contingency for 3 Additional Monitoring WellsInstall wells with oversight 3 ea $34,333 $103,000 Permitting, drilling, oversight, waste management
Sample wells annually 20 yr $2,100 $42,000 Assumes sampling and reporting for years 0-20
Subtotal: $145,000Subtotal of Contingent Elements prior to IDCs and Contingency $454,000INDIRECT COSTS on Contingent Elements
Reporting/Design/Project Oversight3 1 LS $68,100 $68,000
Assumes 15% of overall cost for project oversight, management, permits, work plans, regulatory interaction, etc., over the project period.
$522,000
$105,000 Appropriate contingency for feasibility-level planning.
$627,000
$1,522,000 Reference RemedyTOTAL COST OF ALTERNATIVE WITH CONTINGENT ELEMENTS
SUBTOTAL COST OF CONTINGENT ELEMENTS
Contingent Elements Cost (Including IDCs)
Contingency (20 Percent) 4
Contingency for Phase 2 SVE Operations
Operation and Maintenance of SVE system, 12-months,
Construction of Expanded SVE system
Closure and demobe
Table A-1 Page 2 of 3
Feasibility Study Highway 260 and Johnson Lane WQARF Site
Notes:1 All cost values are estimates and should not be interpreted as final project costs. Costs are in present dollar and do not include inflation costs.
2 Total values are rounded up to the nearest $1,000.
3 Anticipated indirect costs are assumed as 15% of the estimated remediation cost.4 A 20% Contingency is appropriate for feasibility-level planning and will be reduced during the remedial design phase of the project.
Abbreviations:
IDC Indirect CostLS Lump SumYR Year
Table A-1 Page 3 of 3

Feasibility Study Highway 260 and Johnson Lane WQARF Site
Table A-2 Less Aggressive Remedy—Monitored Natural Attenuation and point-of-use-treatment
Quantity Unit Unit Cost 1 Cost 2 DetailLONG TERM MONITORING COSTS (MNA)
Monitoring Well Sampling (Years 0-25) 25 Event $23,000 $575,000
Monitoring 20 wells to be completed 1/ yr for 25 years. Includes labor, equipment, and laboratory analysis & reporting
5-year PSR review 5 Event $12,000 $60,000 PSR report once every 5 years
Subtotal: $635,000
Point-of-use treatment at private residences
GAC Changeout 15 Events $450 $6,750
Assumes routine operation with periodic carbon changes in each household for years 0-25 years. It is assumed that the GAC will last 5 years at each household.
Sampling and consultation with residents 25 yr $1,440 $36,000Assumes periodic sampling and reporting to each household for years 0-25 years.
Subtotal: $43,000
Subtotal prior to INDIRECT COSTS and Contingency $678,000
INDIRECT COSTS
Reporting/Design/Project Oversight3 1 LS $101,700 $102,000
Assumes 15% of overall cost for project oversight, management, permits, work plans, regulatory interaction, etc., over the 25-year project period.
$780,000
$156,000 Appropriate FS contingency for planning
SUBTOTAL prior to Contingent Elements $936,000
Alternative Subtotal (including IDCs) Contingency (20 Percent) 4
Table A-2 Page 1 of 2

Feasibility Study Highway 260 and Johnson Lane WQARF Site
CONTINGENT ELEMENTS (Point of Use Carbon, Monitoring Wells)Contingency for 3 Additional Point-of-Use Carbon UnitsPurchase and Install 3 additional GAC Units 3 ea $1,000 $3,000
GAC Changeout 15 Events $450 $6,750Assumes routine operation with periodic carbon changes in each household for years 0-25 years
Sampling and consultation with residents 25 yr $1,440 $36,000Assumes periodic sampling and reporting to each household for years 0-25
Subtotal: $46,000
Contingency for 3 Additional Monitoring WellsInstall wells with oversight 3 ea $34,333 $103,000Sample wells annually 20 yr $2,100 $42,000
Subtotal: $145,000Subtotal of Contingent Elements prior to IDCs and Contingency $191,000INDIRECT COSTS on Contingent Elements
Reporting/Design/Project Oversight3 1 LS $28,650 $29,000
Assumes 15% of overall cost for project oversight, management, permits, work plans, regulatory interaction, etc., over theproject period.
$220,000
$44,000 Appropriate contingency for feasibility-level planning.
$264,000
$1,200,000 Less Aggressive Remedy
Notes:1 All cost values are estimates and should not be interpreted as final project costs. Costs are in present dollar and do not include inflation costs.
2 Total values are rounded up to the nearest $1,000.
3 Anticipated indirect costs are assumed as 15% of the estimated remediation cost.4 A 20% Contingency is appropriate for feasibility-level planning and will be reduced during the remedial design phase of the project.
Abbreviations:
IDC Indirect CostLS Lump SumYR Year
Contingent Elements Cost (Incluuding IDCs)
Contingency (20 Percent) 4
SUBTOTAL COST OF CONTINGENT ELEMENTS
TOTAL COST OF ALTERNATIVE WITH CONTINGENT ELEMENTS
Table A-2 Page 2 of 2

Feasibility Study Highway 260 and Johnson Lane WQARF Site
Table A-3 More Aggressive Remedy—Monitored Natural Attenuation, SVE, ERD, and Point-of-Use-TreatmentQuantity Unit Unit Cost 1 Cost 2 Detail
LONG TERM MONITORING COSTS (MNA)
Monitoring Well Sampling (Years 0-15) 15 Event $23,000 $345,000
Monitoring 20 wells to be completed 1/ yr for 15 years. Includes labor, equipment, and laboratory analysis & reporting
5-year PSR review 3 Event $12,000 $36,000 PSR report once every 5 yearsSubtotal: $381,000
SVE system- Phase 1 Pilot Test
1 LS $91,000 $91,000Includes equipment delivery, installation, drilling SVE three wells, carbon vessels, delivery
SVE Pilot Test Operations (2-months) 2 mo $8,000 $16,000SVE operations and monitoring (labor, monitoring/lab, electrical)
Subtotal: $107,000
ERD TreatmentInstall wells with oversight 3 ea $34,333 $103,000Census testing and microbe Injection 1 ea $2,700 $2,700 One time at each wellERD Injections 9 Events $13,685 $123,161 3 events per year for 3 years
Subtotal: $229,000
Point-of-use treatment at private residences
GAC Changeout 9 Events $450 $4,050
Assumes routine operation with periodic carbon changes in each household for years 0-15 years. It is assumed that the GAC will last 5 years at each household.
Sampling and consultation with residents 15 yr $1,440 $22,000Assumes periodic sampling and reporting to each household for years 0-15 years.
Subtotal: $26,000Subtotal prior to INDIRECT COSTS and Contingency $743,000
INDIRECT COSTS
Reporting/Design/Project Oversight3 1 LS $111,450 $112,000
Assumes 15% of overall cost for project oversight, management, permits, work plans, regulatory interaction, etc., over the 15-year project period.
$855,000
$171,000 Appropriate FS contingency for planning
SUBTOTAL prior to Contingent Elements $1,026,000
Phase 1 SVE Pilot Test- Setup
Alternative Subtotal (including IDCs) Contingency (20 Percent) 4
Table A-3 Page 1 of 3
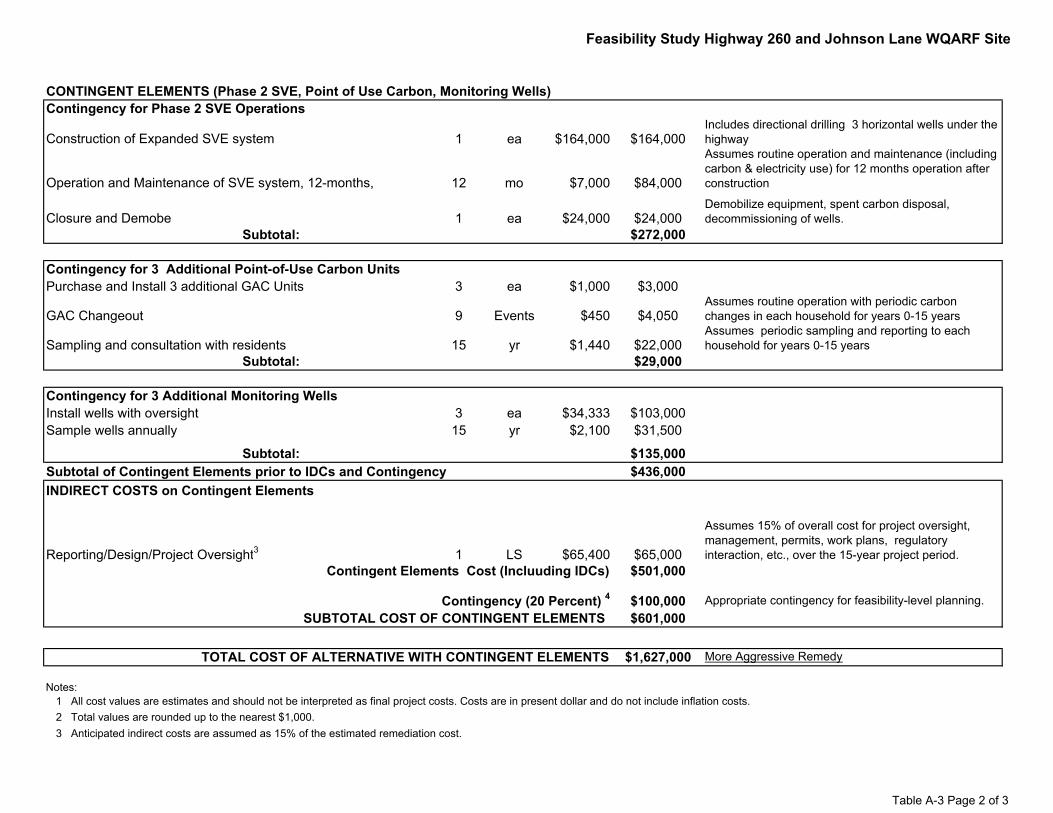
Feasibility Study Highway 260 and Johnson Lane WQARF Site
CONTINGENT ELEMENTS (Phase 2 SVE, Point of Use Carbon, Monitoring Wells)
1 ea $164,000 $164,000Includes directional drilling 3 horizontal wells under the highway
12 mo $7,000 $84,000
Assumes routine operation and maintenance (including carbon & electricity use) for 12 months operation after construction
1 ea $24,000 $24,000Demobilize equipment, spent carbon disposal, decommissioning of wells.
Subtotal: $272,000
Contingency for 3 Additional Point-of-Use Carbon UnitsPurchase and Install 3 additional GAC Units 3 ea $1,000 $3,000
GAC Changeout 9 Events $450 $4,050Assumes routine operation with periodic carbon changes in each household for years 0-15 years
Sampling and consultation with residents 15 yr $1,440 $22,000Assumes periodic sampling and reporting to each household for years 0-15 years
Subtotal: $29,000
Contingency for 3 Additional Monitoring WellsInstall wells with oversight 3 ea $34,333 $103,000Sample wells annually 15 yr $2,100 $31,500
Subtotal: $135,000Subtotal of Contingent Elements prior to IDCs and Contingency $436,000INDIRECT COSTS on Contingent Elements
Reporting/Design/Project Oversight3 1 LS $65,400 $65,000
Assumes 15% of overall cost for project oversight, management, permits, work plans, regulatory interaction, etc., over the 15-year project period.
$501,000
$100,000 Appropriate contingency for feasibility-level planning.
$601,000
$1,627,000 More Aggressive Remedy
Notes:1 All cost values are estimates and should not be interpreted as final project costs. Costs are in present dollar and do not include inflation costs.
2 Total values are rounded up to the nearest $1,000.
3 Anticipated indirect costs are assumed as 15% of the estimated remediation cost.
Closure and Demobe
Contingent Elements Cost (Incluuding IDCs)
Contingency (20 Percent) 4
SUBTOTAL COST OF CONTINGENT ELEMENTS
TOTAL COST OF ALTERNATIVE WITH CONTINGENT ELEMENTS
Operation and Maintenance of SVE system, 12-months,
Contingency for Phase 2 SVE Operations
Construction of Expanded SVE system
Table A-3 Page 2 of 3
Feasibility Study Highway 260 and Johnson Lane WQARF Site
4 A 20% Contingency is appropriate for feasibility-level planning and will be reduced during the remedial design phase of the project.Abbreviations:
IDC Indirect CostLS Lump SumYR Year
Table A-3 Page 3 of 3
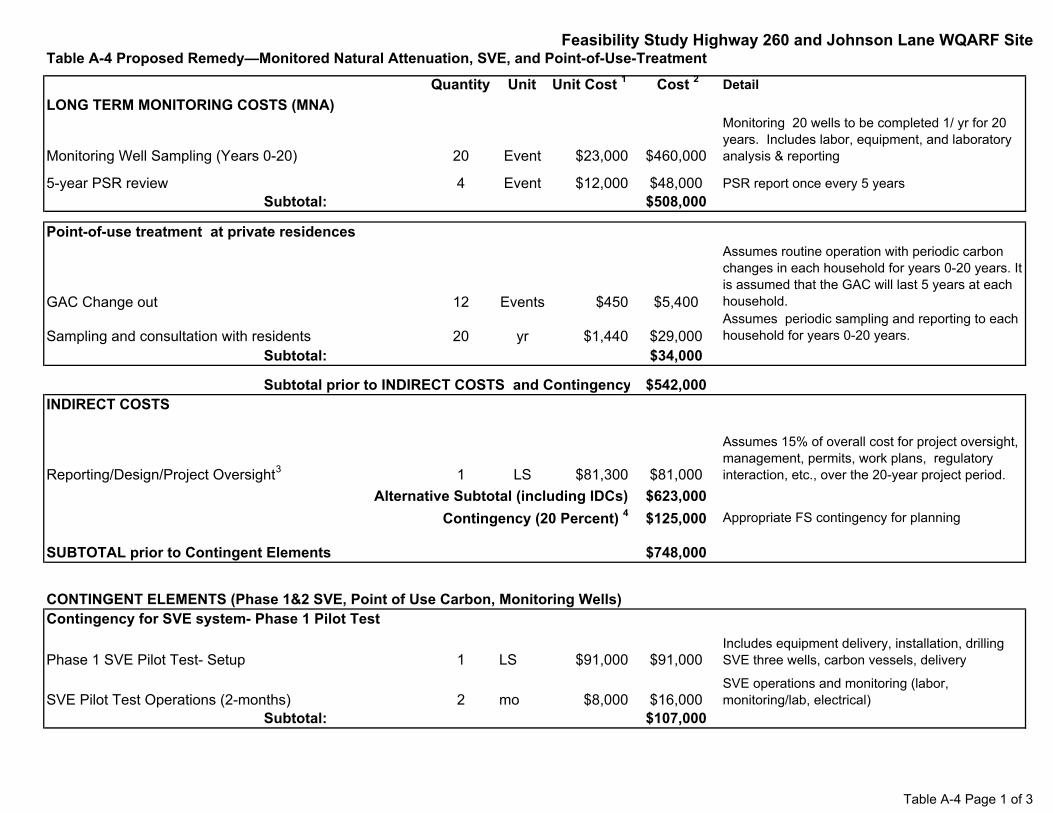
Feasibility Study Highway 260 and Johnson Lane WQARF SiteTable A-4 Proposed Remedy—Monitored Natural Attenuation, SVE, and Point-of-Use-Treatment
Quantity Unit Unit Cost 1 Cost 2 DetailLONG TERM MONITORING COSTS (MNA)
Monitoring Well Sampling (Years 0-20) 20 Event $23,000 $460,000
Monitoring 20 wells to be completed 1/ yr for 20 years. Includes labor, equipment, and laboratory analysis & reporting
5-year PSR review 4 Event $12,000 $48,000 PSR report once every 5 years
Subtotal: $508,000
Point-of-use treatment at private residences
GAC Change out 12 Events $450 $5,400
Assumes routine operation with periodic carbon changes in each household for years 0-20 years. It is assumed that the GAC will last 5 years at each household.
Sampling and consultation with residents 20 yr $1,440 $29,000Assumes periodic sampling and reporting to each household for years 0-20 years.
Subtotal: $34,000
Subtotal prior to INDIRECT COSTS and Contingency $542,000INDIRECT COSTS
Reporting/Design/Project Oversight3 1 LS $81,300 $81,000
Assumes 15% of overall cost for project oversight, management, permits, work plans, regulatory interaction, etc., over the 20-year project period.
$623,000
$125,000 Appropriate FS contingency for planning
SUBTOTAL prior to Contingent Elements $748,000
CONTINGENT ELEMENTS (Phase 1&2 SVE, Point of Use Carbon, Monitoring Wells)Contingency for SVE system- Phase 1 Pilot Test
1 LS $91,000 $91,000Includes equipment delivery, installation, drilling SVE three wells, carbon vessels, delivery
SVE Pilot Test Operations (2-months) 2 mo $8,000 $16,000SVE operations and monitoring (labor, monitoring/lab, electrical)
Subtotal: $107,000
Phase 1 SVE Pilot Test- Setup
Alternative Subtotal (including IDCs) Contingency (20 Percent) 4
Table A-4 Page 1 of 3
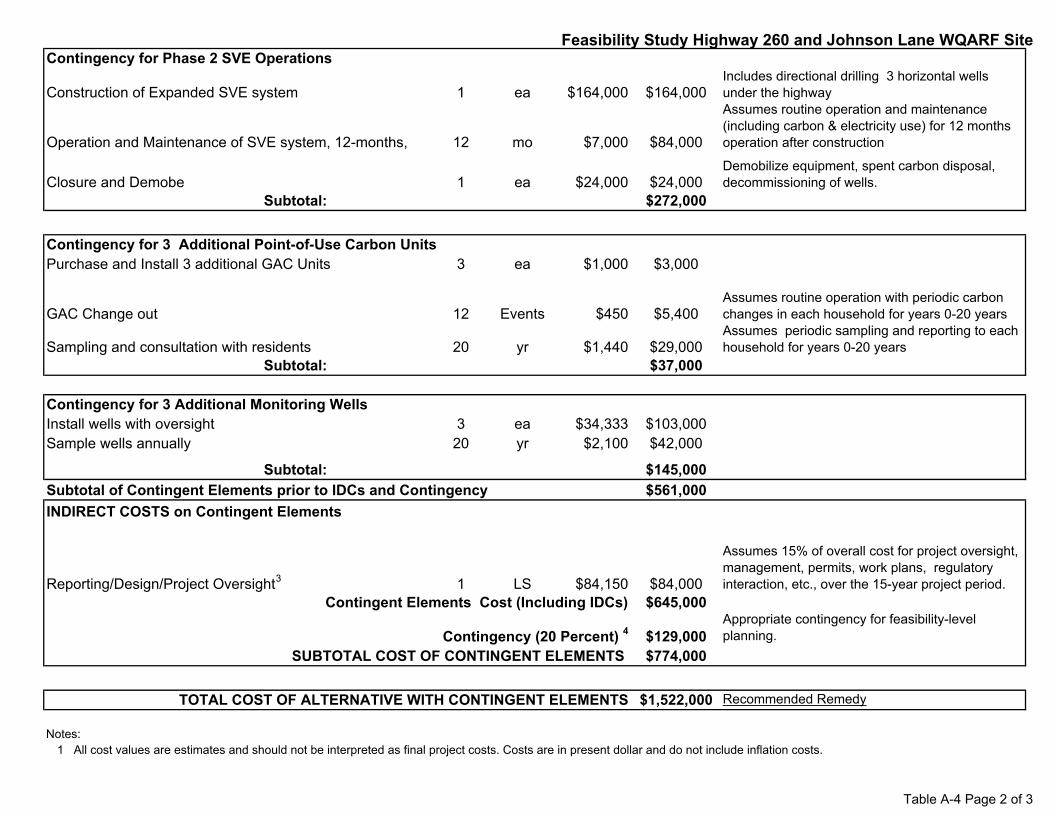
Feasibility Study Highway 260 and Johnson Lane WQARF Site
1 ea $164,000 $164,000Includes directional drilling 3 horizontal wells under the highway
12 mo $7,000 $84,000
Assumes routine operation and maintenance (including carbon & electricity use) for 12 months operation after construction
1 ea $24,000 $24,000Demobilize equipment, spent carbon disposal, decommissioning of wells.
Subtotal: $272,000
Contingency for 3 Additional Point-of-Use Carbon UnitsPurchase and Install 3 additional GAC Units 3 ea $1,000 $3,000
GAC Change out 12 Events $450 $5,400Assumes routine operation with periodic carbon changes in each household for years 0-20 years
Sampling and consultation with residents 20 yr $1,440 $29,000Assumes periodic sampling and reporting to each household for years 0-20 years
Subtotal: $37,000
Contingency for 3 Additional Monitoring WellsInstall wells with oversight 3 ea $34,333 $103,000Sample wells annually 20 yr $2,100 $42,000
Subtotal: $145,000Subtotal of Contingent Elements prior to IDCs and Contingency $561,000INDIRECT COSTS on Contingent Elements
Reporting/Design/Project Oversight3 1 LS $84,150 $84,000
Assumes 15% of overall cost for project oversight, management, permits, work plans, regulatory interaction, etc., over the 15-year project period.
$645,000
$129,000Appropriate contingency for feasibility-level planning.
$774,000
$1,522,000 Recommended Remedy
Notes:1 All cost values are estimates and should not be interpreted as final project costs. Costs are in present dollar and do not include inflation costs.
Operation and Maintenance of SVE system, 12-months,
Contingency for Phase 2 SVE Operations
Construction of Expanded SVE system
Closure and Demobe
Contingent Elements Cost (Including IDCs)
Contingency (20 Percent) 4
SUBTOTAL COST OF CONTINGENT ELEMENTS
TOTAL COST OF ALTERNATIVE WITH CONTINGENT ELEMENTS
Table A-4 Page 2 of 3
Feasibility Study Highway 260 and Johnson Lane WQARF Site2 Total values are rounded up to the nearest $1,000.
3 Anticipated indirect costs are assumed as 15% of the estimated remediation cost.4 A 20% Contingency is appropriate for feasibility-level planning and will be reduced during the remedial design phase of the project.
Abbreviations:
IDC Indirect CostLS Lump SumYR Year
Table A-4 Page 3 of 3