Embed Size (px)
Citation preview

Feasibility Study in Development of a Wearable Device to Enable Emotion Regulation in
Children with Autism Spectrum Disorder
Manpreet Kaur Hora
Thesis submitted to the faculty of the Virginia Polytechnic Institute and State University
in partial fulfillment of the requirements for the degree of
Master of Science
In
Computer Science and Applications
R. Benjamin Knapp
Angela Scarpa-Friedman
Manuel A. Pérez-Quiñones
July 28, 2014
Blacksburg, VA
Keywords: Autism, Physiology, Psychology, Emotion Regulation, Fuzzy Inference
System
Feasibility Study in Development of a Wearable Device to Enable Emotion Regulation in
Children with Autism Spectrum Disorder
Manpreet Kaur Hora
ABSTRACT
Autism spectrum disorder (ASD) is a group of developmental disabilities characterized
by impairments in social interaction and communication and by difficulties in emotion
recognition and regulation. There is currently no cure for autism but psychosocial
interventions and medical treatments exist. However, very few of them have been trialed
on young children and others pose limitations. Strengthening young children’s capacity to
manage their emotions is important for academic success. Thus it becomes important to
design and test the feasibility of an appropriate methodology that can teach emotion
regulation to young children (age 3-6 years) with ASD. This thesis addresses the problem
by proposing a novel framework that integrates physiology with Cognitive Behavior
Theory to enable emotion regulation in the target population by exposing them to real-
time stressful situations. The framework uses a feedback loop that measures the
participant’s physiology, estimates the level of stress being experienced and provides an
audio feedback. The feasibility of the individual building blocks of the framework was
tested by conducting pilot studies on nine typically developing children (age 3-6 years).
The attention capturing capacity of different audio representations was tested, and a stress
profile generating system was designed and developed to map the measured physiology
of the participant on to a relative stress level. 33 out of 43 instances of audio
representations proved to be successful in capturing the participants’ attention and the
stress profiles were found to be capable of distinguishing between stressed and relaxed
state of the participants with an average accuracy of 83%.

iii
Acknowledgements
I believe that this work was essentially a team effort and I want to extend my heartfelt
thanks to all those who were a part of it. First, I would like to express my sincere
gratitude to my advisor Dr. Benjamin Knapp for introducing me to the topic and for his
immensely helpful suggestions, remarks and encouragement throughout the process of
this work. I would also like to thank Dr. Angela Scarpa-Friedman for her invaluable
guidance and comments which helped me shape this work. Furthermore, I would like to
thank Dr. Manuel A. Pérez-Quiñones for his continued support and advice throughout the
course of my Master’s program.
I would like to extend my earnest thanks to Dr. Isabel Bradburn for her excellent
assistance and help with the recruitment of participants for the studies, and to the Child
Development Center for Learning and Research (CDCLR) at Virginia Tech for being
very cooperative and generous with providing the space to conduct all the studies. I also
thank Dr. Martha Ann Bell for her insightful advice and knowledge. I want to express my
thanks and appreciation to Brennon Bortz for making me familiar with the unknown
processes, code and equipment, and for creating important elements of this work. I
appreciate the assistance of Deanna Swain, Becky Neeley and Catherine Kilday in
helping conduct the studies. I am grateful to the entire research group for providing a
friendly and stimulating environment which always welcomed new thoughts.
I thank the Institute for Creativity, Arts and Technology (ICAT) at Virginia Tech for
funding my studies and for being extremely cooperative and inspirational. Particularly, I
would like to extend my thanks to Adam Soccolich for being an incredible and
encouraging mentor at work, and to Tanner Upthegrove for his ever present technical
help and guidance.
Thanking family and friends is an understatement. But I would still like to acknowledge
the encouragement I have received from cousins, friends and lab mates, namely Jayvir
Chadha, Jasmeet Singh, Shuchi Pandit, Deba Pratim Saha, Sriram Chivukula, Jaideep
Pandit, Aarathi Raghuraman and Jose Cadena. Thank you for being patient listeners, for
supporting me in tough times and for ultimately making my graduate life a wonderful
experience.
I cannot thank enough my parents, Dr. Trilochan Singh Hora and Mrs. Ashish Hora, for
giving me everything that I have. I am extremely lucky to have you as the ultimate source
of intelligence, inspiration, guidance and support in every walk of my life. I am very
blessed to have the best gift of my life, my brother Simran Hora, who is a constant source
of motivation. I am indebted to my great-grandparents and grandparents for their never-
ending love and for teaching me the skill of perseverance. Last but not least, I’d like to
thank my best friend and philosopher, Dhananjay Palshikar, for being my lodestar.
Manpreet Kaur Hora
Blacksburg, Virginia, USA.
July 28, 2014.

iv
Table of Contents
Chapter 1 - Introduction ...................................................................................................... 1
1.1 Motivation ..................................................................................................................... 1
1.2 Problem Statement ........................................................................................................ 2
1.3 Methodology ................................................................................................................. 3
1.4 Contributions................................................................................................................. 4
1.5 Thesis Organization ...................................................................................................... 4
Chapter 2: Literature Review .............................................................................................. 6
2.1 Autism and Autism Spectrum Disorders ...................................................................... 6
2.1.1 Characteristics of ASD and Problems with Emotion Regulation .......................... 6
2.2 Strategies for Emotion Regulation ................................................................................ 7
2.2.1 Conventional Approaches – Story Telling, etc. ..................................................... 8
2.2.2 Use of Medication to Cure ASD related Problems ................................................ 9
2.2.3 Stress Detection Monitors ...................................................................................... 9
2.3 Conclusions ................................................................................................................. 10
Chapter 3: System Overview and Design ......................................................................... 12
3.1 Proposed Approach to Emotion Regulation in Children with ASD ........................... 12
3.1.1 Description of Proposed Methodology ................................................................ 13
3.1.2 Framework of Proposed Methodology ................................................................ 13
3.1.3 Goals of the Pilot Study ....................................................................................... 14
3.2 Conclusion .................................................................................................................. 15
Chapter 4: Physiological Indicators and Affect Classification ......................................... 16
4.1 Introduction to Physiological Signals ......................................................................... 16
4.1.1 Electrocardiogram and Heart Rate Variability .................................................... 16
4.1.2 Electrodermal Activity ......................................................................................... 17
4.2 Tools Used to Process Physiological Signals ............................................................. 18
4.3 Common Physiological Features Extracted from ECG and EDA signals .................. 20
4.4 Lists of Physiological Features Used for the Studies.................................................. 21
4.5 Affect Classification ................................................................................................... 22
4.6 Conclusion .................................................................................................................. 23
Chapter 5: User Study Design and Results ....................................................................... 24
5.1 Method ........................................................................................................................ 24
5.1.1 Challenges and Considerations ............................................................................ 24
5.1.2 Experimental Design ............................................................................................ 25
5.1.3 Subject Pool ......................................................................................................... 29
5.1.4 Experiment Location ............................................................................................ 29
5.2 Equipment and Technological Implementation .......................................................... 29
5.2.1 Physiological Sensors .......................................................................................... 30
5.2.2 Audio-Video Recording of Sessions, Data Acquisition and Storage .................. 32
5.2.3 Synchronization of the Recorded Data ................................................................ 33
5.3 Results from Iterations ................................................................................................ 34
5.3.1 Results from First Iteration of the Study.............................................................. 34
5.3.2 Results from Second Iteration of the Study ......................................................... 37
5.3.3 Results from Study on Audio Representations .................................................... 61
5.5 Findings and Insights Gained...................................................................................... 68

v
5.6 Conclusion .................................................................................................................. 69
Chapter 6: Stress Profile Generation ................................................................................. 70
6.1 Requirements for Stress Profile Generation System ................................................... 70
6.1.1 Introduction to Fuzzy logic and Inference Systems ............................................. 72
6.1.2 Comparison of Mamdani-type and Sugeno-type Fuzzy Inference System ......... 74
6.1.3 Reasons for Selecting Mamdani-type over Sugeno-type System ........................ 76
6.1.4 Conclusion ........................................................................................................... 77
6.2 Design of Fuzzy Inference System for Stress Profile Generation .............................. 77
6.2.1 Selected Features as Input Variables ................................................................... 77
6.2.2 Membership Functions for Input Variables ......................................................... 78
6.2.3 Fuzzy Rule Base .................................................................................................. 80
6.2.4 Conclusion ........................................................................................................... 82
6.3 Results ......................................................................................................................... 82
6.4 Conclusion .................................................................................................................. 88
Chapter 7: Conclusion and Future Work .......................................................................... 90
7.1 Conclusion .................................................................................................................. 90
7.2 Future Work ................................................................................................................ 91
References ......................................................................................................................... 95
vi
List of Figures
Figure 1 Block Diagram of the Proposed Framework ........................................................ 3
Figure 2 Block Diagram of the Proposed Framework ...................................................... 14
Figure 3 Diagram Showing a Typical PQRS Waveform (Reproduced from
http://en.wikipedia.org/wiki/QRS_complex (Public Domain)) ........................................ 17
Figure 4 ECG Sensor (photo by author, 2014) ................................................................. 30
Figure 5 Snapshot of Kubios GUI for HRV Analysis of a 100Hz Sampling Rate ECG
Recording .......................................................................................................................... 31
Figure 6 Snapshot of Kubios GUI for HRV Analysis of a 200Hz Sampling Rate ECG
Recording .......................................................................................................................... 31
Figure 7 EDA Sensor (photo by author, 2014) ................................................................. 32
Figure 8 Wi-microDig (photo by author, 2014) ................................................................ 32
Figure 9 Snapshot of the Kubios Graphical User Interface (GUI) ................................... 39
Figure 10 Temporal Point-to-Point Analysis – ECG – Subject 102 – Activity Set-1 ...... 44
Figure 11 Temporal Point-to-Point Analysis – EDA – Subject 102 – Activity Set-1 ...... 45
Figure 12 Temporal Point-to-Point Analysis – ECG – Subject 102 – Activity Set-2 ...... 46
Figure 13 Temporal Point-to-Point Analysis – EDA – Subject 102 – Activity Set-2 ...... 47
Figure 14 Temporal Point-to-Point Analysis – HR – Subject 102 – Activity Set-2 ......... 48
Figure 15 Temporal Point-to-Point Analysis – Tonic EDA – Subject 102 – Activity Set-2
........................................................................................................................................... 48
Figure 16 Temporal Point-to-Point Analysis – ECG – Subject 102 – Activity Set-3 ...... 49
Figure 17 Temporal Point-to-Point Analysis – EDA – Subject 102 – Activity Set-3 ...... 50
Figure 18 Temporal Point-to-Point Analysis – EDA – Subject 107 ................................. 51
Figure 19 Temporal Point-to-Point Analysis – ECG – Subject 108 – Activity Set-1 ...... 52
Figure 20 Temporal Point-to-Point Analysis – EDA – Subject 108 – Activity Set-1 ...... 53
Figure 21 Temporal Point-to-Point Analysis – ECG – Subject 108 – IAI ....................... 54
Figure 22 Temporal Point-to-Point Analysis – EDA – Subject 102 – IAI ....................... 55
Figure 23 Temporal Point-to-Point Analysis – ECG – Subject 108 – Activity Set-2 ...... 56
Figure 24 Temporal Point-to-Point Analysis – EDA – Subject 108 – Activity Set-2 ...... 57
Figure 25 Temporal Point-to-Point Analysis – ECG – Subject 108 – Activity Set-3 ...... 58
Figure 26 Temporal Point-to-Point Analysis – EDA – Subject 108 – Activity Set-3 ...... 59
Figure 27 Temporal Point-to-Point Analysis – ECG – Subject 108 – Sneezing .............. 60
Figure 28 Temporal Point-to-Point Analysis – EDA – Subject 110 ................................. 61
Figure 29 EDA Features of Subject 102 during Visit-2 ................................................... 63
Figure 30 EDA Features of Subject 103 during Visit-2 ................................................... 64
Figure 31 EDA Features of Subject 104 during Visit-2 ................................................... 65
Figure 32 EDA Features of Subject 109 during Visit-2 ................................................... 66
Figure 33 Many-valued Fuzzy Logic Dealing with the Concept of “Partial Truth” ........ 72
Figure 34 Structure of a Fuzzy Inference System ............................................................. 73
Figure 35 A Two Input, Two Rule Mamdani FIS with Crisp Inputs, Knapp, R. B. (1996).
A two input, two rule Mamdani FIS with crisp inputs [Online image]. Retrieved March 5,
2014 from
http://www.cs.princeton.edu/courses/archive/fall07/cos436/HIDDEN/Knapp/fuzzy004.ht
m, Used with permission of R. Benjamin Knapp, 2014. .................................................. 75

vii
Figure 36 A Two-input, Two-rule Sugeno FIS, Knapp, R. B. (1996). A two input, two
rule Sugeno FIS (pn, qn, and rn are user-defined constants) [Online image]. Retrieved
March 5, 2014 from
http://www.cs.princeton.edu/courses/archive/fall07/cos436/HIDDEN/Knapp/fuzzy004.ht
m, Used with permission of R. Benjamin Knapp, 2014. .................................................. 75
Figure 37 Membership Function Plot for FIS Input Variables Containing 3 Membership
Functions ........................................................................................................................... 79
Figure 38 Membership Function Plot for FIS Input Variables Containing 2 Membership
Functions ........................................................................................................................... 79
Figure 39 Resulting FIS Built using the Fuzzy Toolbox GUI .......................................... 82
Figure 40 Stress Profile Generated using FIS Based on Features Derived from ECG ..... 85
Figure 41 Accuracy of Stress Prediction by FIS (EDA Features) with respect to Different
Thresholds for Subject 108 (left) ...................................................................................... 86
Figure 42 Accuracy of Stress Prediction by FIS (ECG Features) with respect to Different
Thresholds for Subject 108 (right) .................................................................................... 86
Figure 43 Accuracy of Stress Prediction by FIS (ECG Features) with respect to Different
Thresholds for Subject 102 (left) ...................................................................................... 87
Figure 44 Accuracy of Stress Prediction by FIS (EDA Features) with respect to Different
Thresholds for Subject 107 (right) .................................................................................... 87
Figure 45 Accuracy of Stress Prediction by FIS (ECG Features) with respect to Different
Thresholds for Subject 110 ............................................................................................... 88

viii
List of Tables
Table 1 Features Derived from EDA ................................................................................ 20
Table 2 Features Derived from ECG ................................................................................ 21
Table 3 Features Extracted from ECG of Subject 102 during Visit-1 of Second Iteration
........................................................................................................................................... 40
Table 4 Features Extracted from ECG of Subject 107 during Visit-1 of Second Iteration
........................................................................................................................................... 40
Table 5 Features Extracted from ECG of Subject 108 during Visit-1 of Second Iteration
........................................................................................................................................... 41
Table 6 Features Extracted from ECG of Subject 110 during Visit-1 of Second Iteration
........................................................................................................................................... 41
Table 7 Audio Representations Attended to by the Participants ...................................... 62
1
Chapter 1 - Introduction
The American Psychiatric Association (APA) describes autism as a neurodevelopmental
syndrome that is defined by deficits in social reciprocity and communication, and by
unusual restricted, repetitive behaviors [56]. It is a lifelong pervasive developmental
disorder that appears during the first three years of life [10]. No two children with autism
possess the exact same profile and each child has a unique case [86]. However, the
difficulties these children face fall into core domains [86] and are generally characterized
as impairments in social communication and interaction and repetitive behaviors [14, 87,
4]. Children with autism also show deficits in recognizing emotion and expressing it [58],
when compared to Typically Developing (TD) children of the same age.
Several psychosocial and medical treatments have been adopted in the past in an attempt
to treat anxiety and to teach emotion regulation to this set of population. However, very
few interventions have been trialed with young children (age 3-6 years) [3]. While the
psychosocial treatment continues to be primarily theoretical, the medical treatment is
only able to address the associated features of anxiety in individuals with autism, instead
of targeting the primary difficulties [15, 16, 17, 18, 19]. The driving force in the universe
of wearable technology to assist individuals with autism is mostly confined to the design
of GPS monitoring devices to track wandering and lost individuals [59, 60]. A recent
innovation outside the world of GPS monitors is the development of T.Jacket by a
company named T.Ware, based in Singapore [61, 62]. T.Jacket is a wearable touch
technology vest that uses deep pressure therapy to simulate the feeling of a hug. It is
expected to benefit individuals with autism, sensory processing difficulties, Alzheimer’s
dementia, etc. by improving the user’s attention and ability to regulate arousal [62]. So
far, no wearable technological device has addressed the issue of emotion regulation by
studying the user’s emotional state in real-time, thus providing a more customized
solution to the heterogeneous population diagnosed with autism.
1.1 Motivation
The autistic population is highly heterogeneous with highly varied behavioral responses
and ability to regulate emotions. Thus, a special and personalized solution is needed to
2
assist each unique individual diagnosed with ASD. Since the effects of medication last
only as long as medication is consumed, with relapse occurring once the medication
regime is ceased [19], this approach appears to be constrained. One of the widely used
psychosocial interventions used for individuals with Autism Spectrum Disorder (ASD) is
the Cognitive Behavior Theory (CBT). It is a psychotherapeutic intervention that targets
the underlying cognitions and behaviors that maintain the individual’s anxiety. Its post-
treatment effects have been observed to last as long as six years [21]. Music therapy
appears to be another intervention that has been proved to have positive benefits [63].
However, the approach used by CBT can be turned into a more personal experience when
integrated with a universal yet personal possession. This possession is the physiology of
an individual which reflects his/her personal affective state, and can be used to study the
anxiety level of the individual [27]. The knowledge gained from CBT and physiology can
be integrated to realize the development of a wearable device which would monitor the
stress and anxiety level of the user in real-time and provide him a feedback about it.
Moreover, the use of music in the form of feedback or a soothing agent can improve the
capabilities and usability of this device. The user can be explicitly taught to use emotion-
regulation techniques whenever a feedback about high stress level is received. The
design of such a wearable device became the impetus for developing and testing the
feasibility of an appropriate framework that would serve as the intelligence in the
wearable device.
1.2 Problem Statement
The approaches to enable emotion regulation in children with ASD suffer from
methodological and theoretical limitations. These approaches either do not include trials
on young children (3-6 years of age) with ASD or lack the efficiency with which emotion
regulation is taught to this population. An early intervention can help lay a stronger
foundation for affect awareness and regulation since children as young as three years of
age have shown to respond to emotional stimuli [7]. Thus, the problem statement for this
thesis is to design and test the feasibility of an appropriate methodology that can teach
emotion awareness and regulation to young children (age 3-6 years) with ASD by
exposing them to real-time stressful situations, with the use of physiological signals. It is
3
believed that this framework can later be used to design a wearable device capable of
monitoring the user’s stress level and giving him constant feedback to use emotion
regulation techniques accordingly.
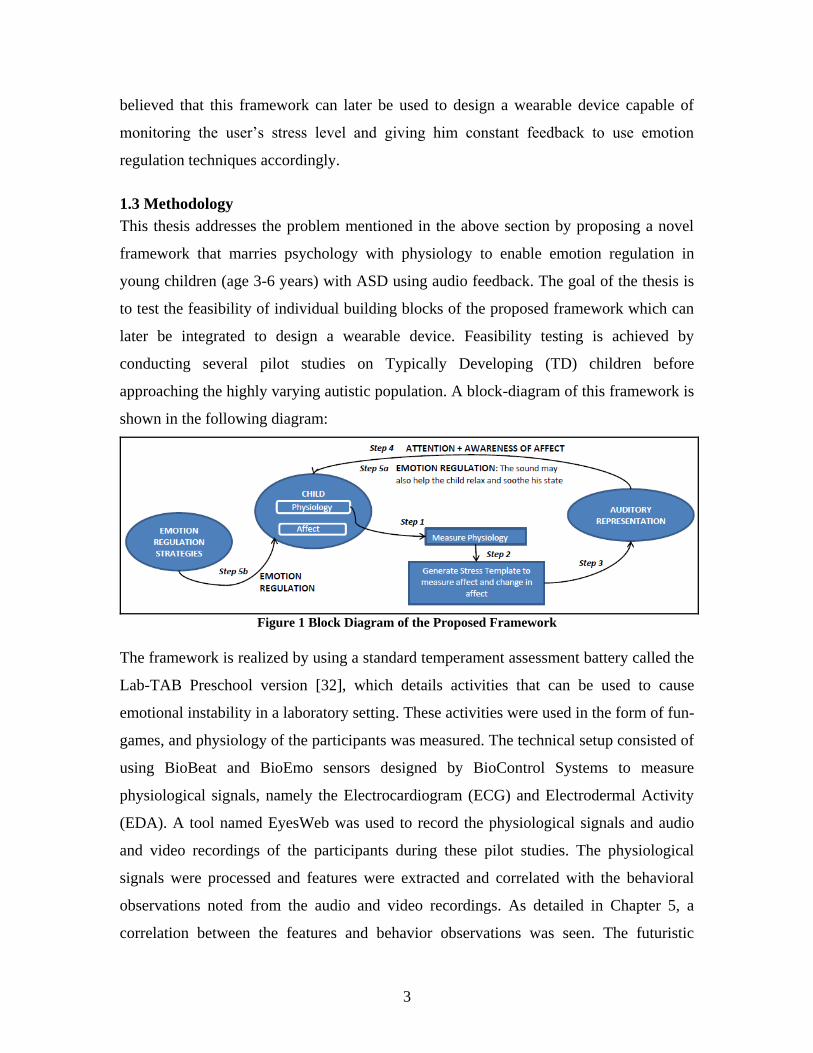
1.3 Methodology
This thesis addresses the problem mentioned in the above section by proposing a novel
framework that marries psychology with physiology to enable emotion regulation in
young children (age 3-6 years) with ASD using audio feedback. The goal of the thesis is
to test the feasibility of individual building blocks of the proposed framework which can
later be integrated to design a wearable device. Feasibility testing is achieved by
conducting several pilot studies on Typically Developing (TD) children before
approaching the highly varying autistic population. A block-diagram of this framework is
shown in the following diagram:
Figure 1 Block Diagram of the Proposed Framework
The framework is realized by using a standard temperament assessment battery called the
Lab-TAB Preschool version [32], which details activities that can be used to cause
emotional instability in a laboratory setting. These activities were used in the form of fun-
games, and physiology of the participants was measured. The technical setup consisted of
using BioBeat and BioEmo sensors designed by BioControl Systems to measure
physiological signals, namely the Electrocardiogram (ECG) and Electrodermal Activity
(EDA). A tool named EyesWeb was used to record the physiological signals and audio
and video recordings of the participants during these pilot studies. The physiological
signals were processed and features were extracted and correlated with the behavioral
observations noted from the audio and video recordings. As detailed in Chapter 5, a
correlation between the features and behavior observations was seen. The futuristic
4
wearable device is believed to present a constant feedback about the user’s emotional
state in the form of appropriate audio representations. This feedback needs to be
captivating (so as to be noticed while the user is busy with other routine activities).
Hence, various audio representations were presented to the participants while they were
engaged in some other activity. The goal of this procedure was to check the attention-
capturing capability of the audio representations. Finally, to allow the real-time
modulation of the audio feedback according to the user’s current affective state, a Fuzzy
Inference System (FIS) was designed and developed which created a stress profile of the
participant based on the recorded physiological indicators of stress (see Chapter 6).
1.4 Contributions
The work proposes a novel and validated framework that uses physiology of the
participants to measure the change in affect. The advantages of this framework are
described in detail in Chapter 2. The feasibility of the core blocks of this framework was
tested by conducting pilot studies on nine TD Children (age 3-6 years). An important part
of the work and the framework is the design of a Stress Profile generating system which
has been achieved with the use of fuzzy logic (Chapter 6). This system builds a stress
curve of the participant when the physiological indicators of stress are fed as input to it.
1.5 Thesis Organization
This thesis explores a multidisciplinary world existing at the intersection of
developmental psychology, physiology, affect recognition, stress awareness and stress
measurement. Owing to this interdisciplinary nature of work, the theories of different
areas are presented in their corresponding chapters. Chapter 2 provides the existing
literature and background work that has been done to enable emotion regulation in
individuals with ASD. Chapter 3 presents the proposed solution in detail. Chapter 4
introduces the physiological signals (ECG and EDA) and the tools and algorithms used to
extract features from these signals for data analysis. An overview of theories and
classification of emotions is also presented in Chapter 4. Chapter 5 describes the
methodology, contributing factors and technological implementation for the designed
user studies and the results obtained and insights gained from different iterations of those
studies. Chapter 6 explains the requirements for designing a stress profile generating

5
system, along with an introduction to fuzzy logic and how it is used to develop the
required system. Finally, Chapter 7 concludes the work with a discussion on the future
work.
6
Chapter 2: Literature Review
This chapter presents an overview of Autism and Autism Spectrum Disorder (ASD). It
specifically highlights the problems that children with ASD face, and the solutions
presented in the literature to help them with emotion regulation.
2.1 Autism and Autism Spectrum Disorders
During a child’s typical development, speech and communication skills appear to unfold
effortlessly. But for some populations, basic communication skills, empathy, social
function, expression and the ability to relate to others remain a lifelong challenge. One
such demographic is formed by children who are diagnosed with Autism Spectrum
Disorder (ASD) [1]. Autism spectrum disorders (ASDs) are a group of developmental
disabilities characterized by impairments in social interaction and communication and by
restricted, repetitive, and stereotyped patterns of behavior [11]. According to Bogdashina
(2006), Autistic Disorder is defined as a lifelong pervasive developmental disorder that
appears during the first three years of life and interferes with the way children
communicate and relate to others [10]. A recent study conducted by the Centers for
Disease Control and Prevention (CDC) reported that in the year 2008, one in 88 children
aged 8 years was identified as having ASDs [85]. Comparison of the 2008 findings with
the data for the years 2006 and 2002 indicated an increase in estimated ASD prevalence
of 23% and 78% respectively [11, 85]. Since then, the prevalence of autism has continued
to increase at a rapid rate. According to the latest CDC report, one in 68 children is
identified to have ASD in the year 2014 [74]. As described by Williams, Gray and Tonge
(2012), children with autism face difficulties in emotion recognition [3]. As Myers and
Johnson (2007) describe, like other neurodevelopmental disabilities, ASDs are generally
not “curable,” and chronic management is required [2].
2.1.1 Characteristics of ASD and Problems with Emotion Regulation
The literature frequently notes that children with a High Functioning Autism Spectrum
Disorder (HFA) experience anxiety, where HFA refers collectively to those children who
have ASD, without intellectual delay, what was formerly known as Asperger’s Disorder
[75]. DSM-V provides measures to describe the severity of impairments using two main
7
diagnostic criteria of ASD: social communication and interaction (Criterion A) and
restricted, repetitive behaviors (Criterion B). These measures exist in the form of severity
levels, namely “Level 1”, “Level 2” and “Level 3”, which signify the requirement of
“support”, “substantial support” and “very substantial support” respectively, by the
individual with ASD. Some of the severity specifiers listed under these levels are:
“extreme difficulty coping with change”, “inflexibility of behavior”, “limited initiation of
social interactions”, “minimal response to social overtures from others” and “problems of
organization and planning” [75]. According to DSM-V, children with ASD clearly show
deficits in social-emotional reciprocity and exhibit no emotion sharing and little or no
initiation of social interaction [75]. Anxiety is another problem generally faced by this
population. In fact, anxiety related difficulties are so frequently exhibited in children with
Autism Spectrum Disorders (ASDs) that DSM-IV highlights anxiety-like responses as a
common, ‘‘associated feature’’ of autism stating that, ‘‘there may be excessive
fearfulness in response to harmless objects’’ [13, 56]. DSM-V also states that individuals
with ASD are prone to anxiety and disorder and considers these to be associated features
of ASD [75]. Irritability, aggression, impulsivity and self-injury are other common
associated problems [76]. Employment of emotion regulation strategies is weak in
individuals with ASD, and they may react to emotional stimuli with aggression, self-
injury or tantrums. The intense reactions to stress are the outcome of impaired emotion
regulation and are colloquially referred to as “meltdowns” [77].
2.2 Strategies for Emotion Regulation
The two forms of interventions used in the psychological and medical literature to
address anxiety in children with ASD are: psycho-analytic therapy and pharmacotherapy
[14]. Another kind of intervention, the psychosocial intervention, has been empirically-
tested and developed to improve emotion regulation in children with ASD [78]. Several
methodological and theoretical limitations exist within the psychosocial treatments of
anxious ASD individuals including small sample sizes and a lack of quantitative outcome
information. In particular, it might be important to consider other psychotherapeutic
interventions that target the underlying cognitions and behaviors that maintain the ASD
individual’s anxiety, for example, Cognitive Behavior Therapy (CBT).

8
2.2.1 Conventional Approaches – Story Telling, etc.
It has been suggested recently that evidence for the efficacy of CBT in treating childhood
anxiety disorders is now strong enough to warrant CBT being considered as a ‘‘Probably
Efficacious’’ treatment in accordance with the criteria for ‘‘Empirically Supported
Treatment’’ set out by the American Psychological Association’s ‘‘Committee on
Science and Practice’’ [20]. Research has indicated that the post-treatment reductions
attained from CBT programs have been maintained over long, post-treatment follow-up
periods [21, 22, 23]. Specifically, several recent long-term follow-up studies revealed that
CBT treatment gains were maintained as long as 6 years after treatment [21] or 7 years
after treatment [23].
Psychosocial interventions have proven to be effective in decreasing outbursts and
negativity in young children with ASD based on preliminary evidence [78]. However,
much more work is needed in this area. A number of CBT interventions have been
designed in the past, to target ASDs related problems [3] but most of the previous studies
using these intervention methods have targeted children with autism age nine to
seventeen years [4, 5] and very few emotion-training interventions have been trialed with
young children with autism [3]. The literature quotes only one pilot study which tested
the efficacy of a developmentally modified CBT for children as young as five years of
age, who have been diagnosed with ASD [79].
It is argued that children with ASD, as young as three years of age are capable of
recognizing an emotional stimuli and show a disordered pattern of neural responses to
such stimuli [7]. The literature states that the ability of young children to manage their
emotions and behaviors and to make meaningful friendships is an important prerequisite
for school readiness and academic success. It has been observed that socially competent
children are also more academically successful and poor social skills are a strong
predictor of academic failure [12]. Also, evidence suggests that without early
intervention, emotional, social, and behavioral problems (particularly, aggression and
oppositional behavior) in young children are key risk factors or “red flags” that mark the
beginning of escalating academic problems, grade retention, school dropout, and
antisocial behavior [8, 88]. Moreover, strengthening young children’s capacity to manage
9
their emotions and behavior, and to make meaningful friendships, particularly if they are
exposed to multiple life-stressors, may serve an important protective function for school
success. Research has indicated that children’s emotional, social, and behavioral
adjustment is as important for school success as cognitive and academic preparedness
[89]. Children, who have difficulty paying attention, following teacher directions, getting
along with others, and controlling negative emotions, do less well in school [90]. They
are more likely to be rejected by classmates and to get less positive feedback from
teachers, which in turn, contribute to off task behavior and less instruction time [91].
Hence, it may be beneficial to investigate the impact of CBT intervention techniques at
younger ages (3 to 5 years) for children diagnosed with ASDs and test the significance of
those techniques in the growth and social development of the individuals.
The previous studies utilized conventional methods like storytelling and role-playing to
enable emotion recognition and regulation [4]. However, there exist shortcomings of the
previous studies using intervention techniques which are described in detail in section
3.1.
2.2.2 Use of Medication to Cure ASD related Problems
Evidence for the use of medication in the treatment of anxiety in children with an ASD,
also seems to be limited. Studies have explored medication regimes for their ability to
address the associated features of anxious ASD individuals rather than to specifically
target primary anxiety difficulties [15, 16, 17, 18, 19]. A further limitation is that most
pharmacological investigations have only involved adult participants with Autistic
Disorder. Moreover, the effects of medication only appear to last as long as the
medication is being consumed with relapse occurring once the medication regime is
ceased [19].
2.2.3 Stress Detection Monitors
Children with Autism Spectrum Disorders (ASDs) are known to have unique behavioral
responses to social stimuli [24]. However, identifying subjective, internal states in
children with ASDs is difficult due to deficits in language and communication and
difficulties processing and identifying emotions [25, 26]. A typical approach to gather
information about the self would have been self-reports, but with autistic children, these

10
reports may not be a viable solution for the investigator to understand their emotions
correctly and to help them acknowledge those emotions as well. Thus, behavioral
treatments to improve social and emotional functioning in children with ASDs are often
challenged by lack of such important information. Measurements of psychophysiology
have been used in prior studies to better elucidate how social stimuli are perceived
differently in children with ASDs. Previous work has demonstrated the feasibility of
detecting stress from physiological measurements. Such measurements can be acquired
with minimal discomfort for the subject, and are useful in reflecting emotions [9]. So,
collecting physiological data of young children with ASD and analyzing it to interpret the
stress level can be seen as a replacement for self-reports and a starting point to conduct a
CBT intervention program for young children age three to five years, with autism. The
study by Levine [24] explored potential differences in level of physiological measures of
arousal (EDA i.e. Electro dermal Activity and VT i.e. Vagal Tone, also known as Heart
Rate Variability or HRV) at baseline and in reaction to a standardized social stressor in
children with High Functioning Autism (HFA) [24]. EDA and HRV are the most
commonly used physiological inputs to interpret stress and anxiety levels [24]. In the
study by Shi et al. [27], 26 types of features were extracted after the collection of
physiological data through sensors, which were suggested to be relevant in related
literature [27, 28, 29, 30]. Shi’s approach to incorporate person-specific information, and
build personalized stress detection model by using a State Vector Machine (SVM) helped
him detect stress from physiological measurements at high precision and recall values
(0.9 each) [27].
2.3 Conclusions
As aptly described by Chalfant et al. (2007) [14], the limitations of the abovementioned
interventions for ASD children indicate that researchers need to explore whether other
forms of anxiety treatment might be more appropriate for the anxious, ASD population
[14]. As suggested, it might be important to consider psychotherapeutic interventions
such as CBT that target the underlying cognitions and behaviors that maintain the ASD
individual’s anxiety. So, a more effective CBT intervention program can be designed that
targets young children (age 3-6 years) diagnosed with autism and physiological
parameters such as EDA and HRV can be used to gain insight about the internal state of

11
the individual’s stress levels. A feedback mechanism with a computerized audio control
can be used to reflect the stress levels, and presented to the subjects. The intervention can
be used to assist the children to acknowledge their stress level and bring it down using
physical or mental exercises. This kind of an intervention program will be helpful in
testing the impact of intervention at an age as young as three years old, and will try to
check any continued effect as the child develops socially and emotionally.

12
Chapter 3: System Overview and Design
This chapter describes the proposed approach, design methodology and framework for
enabling emotion regulation in children with ASD.
3.1 Proposed Approach to Emotion Regulation in Children with ASD
The story-telling approach for teaching emotion regulation relies on asking the subject to
suggest coping mechanisms for the protagonist of the story during situations of emotional
instability [4]. But we hypothesize that the coping measures suggested for someone else
(the protagonist of the story) and the ones applied by the subject for his personal defense
against stress can be very different. For example, it might be easy to suggest measures for
someone else, but it might be more difficult to apply it on self, especially when the
situations in real life are unpredictable. Furthermore, DSM-V states that young children
with ASD particularly lack shared social play and imagination (for e.g. pretend play)
[75]. This can be another critical limitation of the story-telling approach which highly
depends on the imagining power of the participant. Hence, the method of teaching
emotion regulation can be made more effective if the participant is exposed to real-time
scenarios where he/she can sense a change in his/her affect and then use measures to
regulate it.
Another major limitation of the conventional approaches to teach emotion regulation is
that very few emotion-training interventions have been trialed with young children (age
below five years) with autism (see sections 2.2.1 and 2.2.2). But we hypothesize that if
the intervention is presented to the people with ASD at a much younger age (3-6 years), it
can then help them lay a foundation for affect consciousness and regulation at a stage
when they are just beginning to learn and practice these skills.
Owing to these shortcomings of the studies described in Chapter 2, a novel approach is
proposed which can enable emotion recognition, awareness and regulation in children
right at the time when they begin to experience difficulties due to anxiety and frustration
(see sections 3.1.1 and 3.1.2).
13
3.1.1 Description of Proposed Methodology
Using physiology, this study intends to inform the child of his emotional state, thus
raising emotion awareness, and then suggest him ways to combat anxiety, frustration and
stress, thus teaching emotion regulation. A feedback loop will be used that would
measure the physiology (Electrodermal Activity and Electrocardiogram) of the
participant (age 3-6 years), correlate the information derived from it with his/her affect,
and finally present this information back to him/her in the form of an audio
representation. The purpose of the audio representation will be to make the participant
aware of any change in his/her affect, the underlying mechanism for the measurement of
which will be a change in physiology that correlates to a change in affect. Lastly, the
participant would be suggested ways to readjust his/her emotions, thus enabling emotion
regulation.
3.1.2 Framework of Proposed Methodology
Based on multiple studies showing increased sympathetic and decreased parasympathetic
activity in children with ASD, several recent theories have been advanced that suggest an
underlying autonomic dysfunction in ASD that can explain their lack of social
engagement such as the Polyvagal Theory [94], repetitive inflexible behaviors and
anxiety as described by the Autonomic Dysregulation Theory [95], and emotional
outbursts and hyper-sensory reactions as per the Sub-clinical Temporal Lobe Epilepsy
Theory [96]. Taken together, all three suggest that limbic and brainstem regulation of
autonomic activity is compromised, leading to some aspects of ASD symptomatology
and associated co-morbidities.
Thus, the development of a novel innovative framework that will allow young children
(3-6 years old) with ASD to become aware of and harness their hyper-aroused state in
order to improve symptoms and reduce stress-related reactions is proposed. The
following block-diagram is a representation of the proposed framework:
14
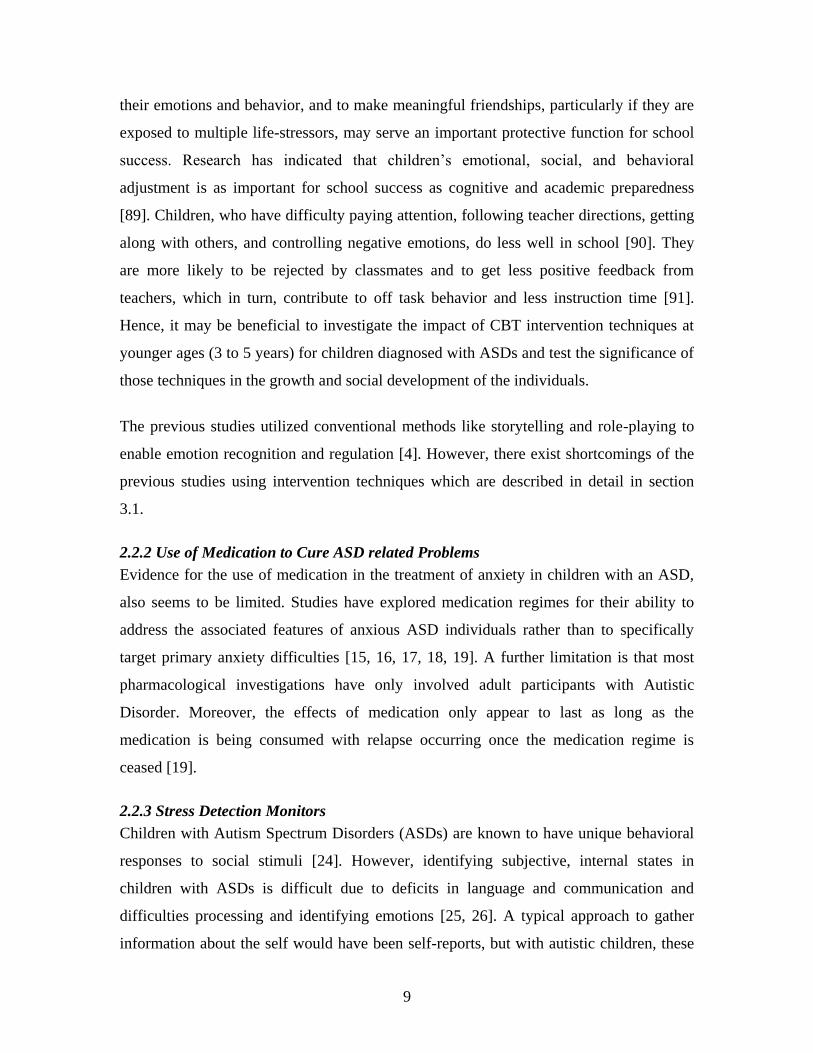
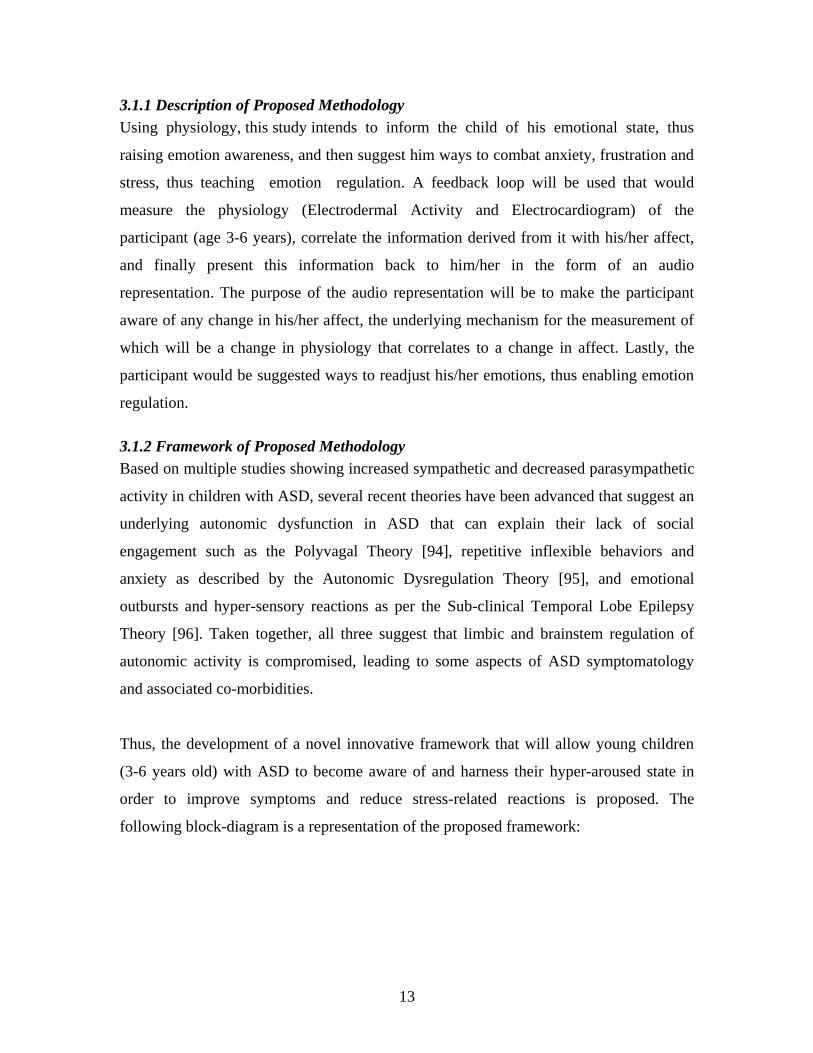
Figure 2 Block Diagram of the Proposed Framework
The proposed method uses a feedback loop that, in Step 1, measures autonomic responses
during frustration, including skin conductance (EDA), heart rate (HR), and heart rate
variability (HRV). Step 2 correlates the information derived from these responses with
the child’s affective state. Step 3 creates an auditory representation of the child’s
affective state and Step 4 presents it back to the child. The purpose of this auditory
feedback is to present the level of the child’s emotional arousal explicitly, so that the
child can be aware of his/her physiological state and associated affect. In Steps 5a and/or
5b, the child can then use emotion regulation strategies to modulate this state.
3.1.3 Goals of the Pilot Study
It is known that children with autism show unique behaviors and the universe of
behavioral responses and developmental levels for these children is huge and diverse
[31]. Also, with the goal of designing studies to help children with difficulties in emotion
regulation, it was required to first measure functional emotion recognition and regulation
in children without difficulties in recognizing emotion. Hence before proceeding with the
studies on children with ASD, it was important to validate the proposed methodology by
piloting studies on TD children (age 3-6 years). This thesis is an exploration of the
proposed framework and focuses on the pilot studies that were conducted on TD children.
The thesis describes the study design considerations, challenges, implementation details,
and findings and insights gained from the pilot studies which can be applied to the future
studies with autistic children (see Chapter 5).
The specific aims and research tasks of the pilot study were designed in a way such that
they can be used to test the feasibility of the individual steps of the proposed framework.

15
This in turn would help to validate the hypotheses that intervention at a younger age (3-6
years) is feasible and can be beneficial. The integration of these steps would further lead
to a wearable device employing the framework. The device would enable the testing of
the framework and its usefulness in teaching emotion regulation to children with ASD.
The goals of the pilot study are listed as follows:
1. Testing the feasibility of using extant equipment and technology to successfully
measure physiology of young TD children (3-6 years). This is used to validate
Step 1 of the framework.
2. Extraction of important features from measured physiology in order to find
a correlation between physiological indicators and change in affect of the child.
This aim caters to the need of proving Step 2 of the framework feasible.
3. Designing a stress profile for each participant, based on the derived correlation
between measured physiology and observed behavior. This profile will validate
Step 3 of the framework and will be used in creating appropriate audio
representations in real time, in future studies for children with autism.
4. Presenting different audio representations to the participant to check if these
representations are capable of capturing the participant’s attention, thereby
checking the feasibility of Step 4 in the proposed framework.
5. Evaluation of the audio representations using measured physiology.
6. Gaining insights from the study to point out areas that need re-design or
improvement (technical and/or methodological).
3.2 Conclusion
This chapter presented a description on the system design and the contributing factors.
The proposed framework justifies the design choices based on the challenges and
considerations. Finally, it will be shown that the experimental design is supported by an
appropriate technical implementation (Chapter 5).

16
Chapter 4: Physiological Indicators and Affect Classification
This chapter describes the physiological signals used in the studies, their physiological
origin and measurement techniques. A list of the features extracted from these signals is
also presented. Finally, an overview of various theories on affect classification is given.
4.1 Introduction to Physiological Signals
As described in section 2.2.3, physiological signals have been widely used in the past to
study the perception of social stimuli by children with ASD. Previous work has also
demonstrated the feasibility of detecting stress from physiological measurements. Since
EDA and HRV are the most commonly used physiological inputs to interpret stress and
anxiety levels, and can be measured with minimal discomfort for the participant (see
section 2.2.3), these have been chosen to measure the changes in affect for the studies.
The following subsections describe the Electrocardiogram (ECG), Heart Rate Variability
(HRV) and Electrodermal Activity (EDA) in detail.
4.1.1 Electrocardiogram and Heart Rate Variability
The sympathetic and parasympathetic branches of the autonomic nervous system
modulate the sinoatrial node, which controls the rhythm of the heart [49, 50]. This
rhythmic cardiac cycle consists of periods of contraction and relaxation of the heart,
which are achieved through electrical waves. The electrical activity of the heart can be
recorded in an Electrocardiogram (ECG) [33]. By placing electrodes on the skin surface,
an instrument named the electrocardiograph can sense this electrical activity. The
location of these electrodes is important and can be known using Einthoven’s triangle
[40]. Although these electrical signals are the largest biosignals amongst all other body
signals [41], their absolute value is small and its measurement can be affected by main
power line interference (50-60 Hz noise). The processing of ECG signals should employ
notch filter to remove this noise [33].
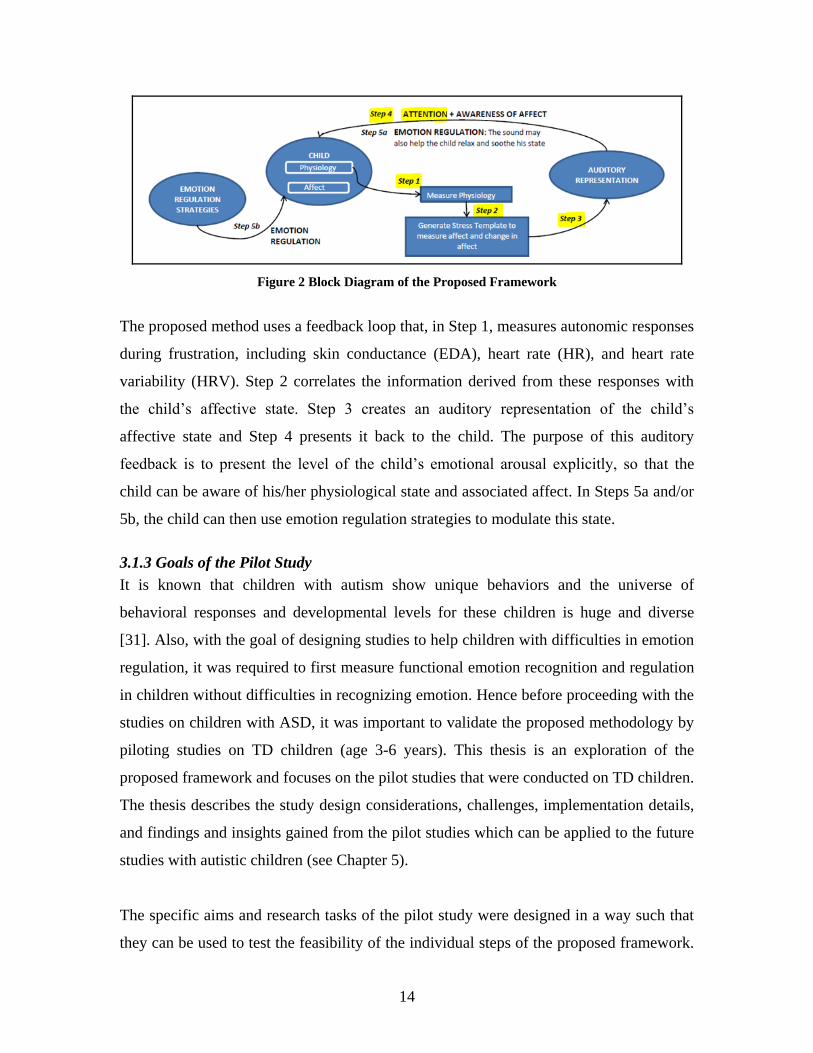
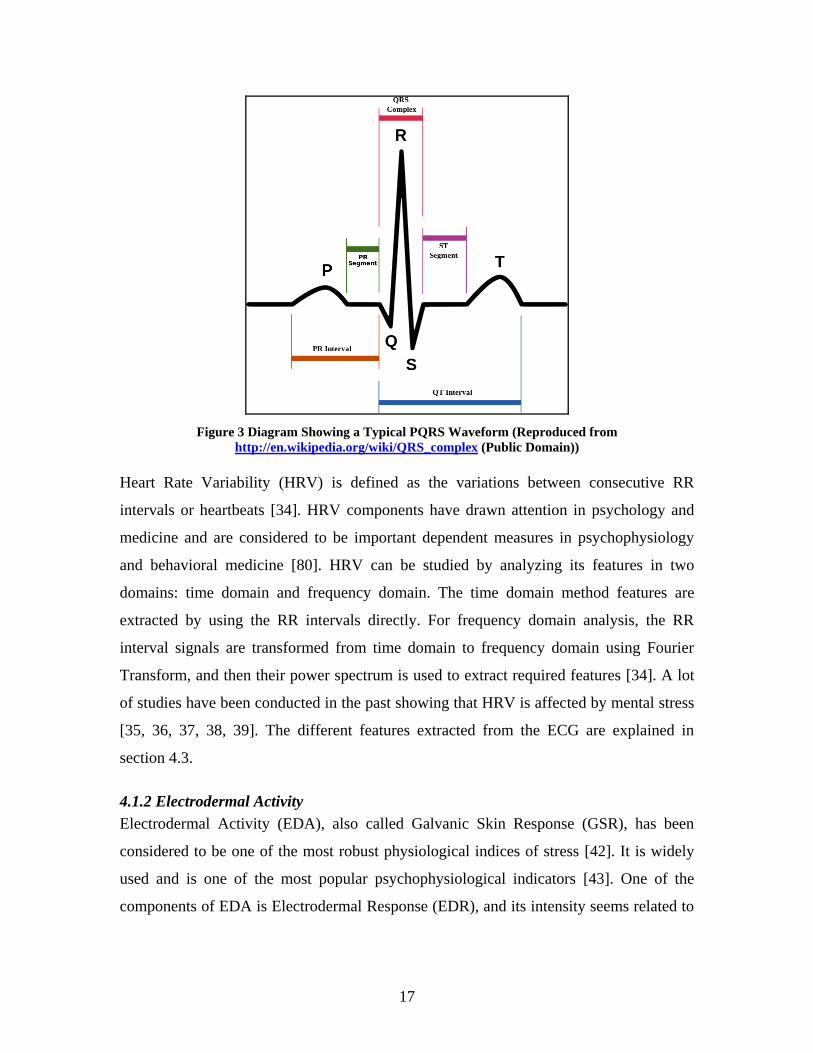
The ECG is composed of five waves, namely the P, Q, R, S and T waves. However, for
most applications, a configuration capable of distinctly detecting the R peak is sufficient
[33]. The interval between two R peaks, also called the RR interval, is used to compute
heart rate [33]. An example of a typical PQRS wave, taken from [101] is shown below:
17
Figure 3 Diagram Showing a Typical PQRS Waveform (Reproduced from
http://en.wikipedia.org/wiki/QRS_complex (Public Domain))
Heart Rate Variability (HRV) is defined as the variations between consecutive RR
intervals or heartbeats [34]. HRV components have drawn attention in psychology and
medicine and are considered to be important dependent measures in psychophysiology
and behavioral medicine [80]. HRV can be studied by analyzing its features in two
domains: time domain and frequency domain. The time domain method features are
extracted by using the RR intervals directly. For frequency domain analysis, the RR
interval signals are transformed from time domain to frequency domain using Fourier
Transform, and then their power spectrum is used to extract required features [34]. A lot
of studies have been conducted in the past showing that HRV is affected by mental stress
[35, 36, 37, 38, 39]. The different features extracted from the ECG are explained in
section 4.3.
4.1.2 Electrodermal Activity
Electrodermal Activity (EDA), also called Galvanic Skin Response (GSR), has been
considered to be one of the most robust physiological indices of stress [42]. It is widely
used and is one of the most popular psychophysiological indicators [43]. One of the
components of EDA is Electrodermal Response (EDR), and its intensity seems related to

18
stimulus intensity and/or its psychological significance. The ease of obtaining a distinct
EDR for different stimuli is one of the major reasons for the wide use of EDA [81].
The human nervous system consists of two main parts: the Central Nervous System
(CNS) and the Peripheral Nervous System (PNS) [33]. While CNS includes the brain and
the spinal cord, the PNS is subdivided into the Somatic Nervous System (SNS) and the
Autonomic Nervous System (ANS). The role of CNS is to receive information from the
PNS via sensory neurons and send instructions to other body parts via motor neurons.
The PNS majorly serves to connect the CNS with the rest of the body. The SNS controls
volitional movements of the skeletal muscles. The ANS is responsible for controlling
involuntary changes in body organs. These include operations such as heartbeats,
sweating [33]. The electrodermal activity is a result of the involvement and response of
the eccrine sweat glands to psychological stimuli [44]. The Autonomic Nervous System
(ANS) controls these sweat glands, which are also responsible for thermoregulation. The
amount of sweat present in these glands is inversely proportional to the resistance
measured across the skin surface [44]. The higher density of these glands on the palm and
feet makes the measurement of EDA possible by placing electrodes in an endosomatic
and unobtrusive exosomatic way [33]. By applying constant voltage or current, the
variation in skin resistance can be calculated. The different features of EDA are explained
in section 4.3.
4.2 Tools Used to Process Physiological Signals
As described later in section 5.3.2, two kinds of analysis were performed on the
physiological data gathered during the pilot studies. These analyses mainly varied on
grounds of granularity. One of the analyses was the “Average Calculations” which used a
freely available HRV analyzing tool named Kubios [45, 49]. The other analysis, named
the “Temporal Point-to-Point Analysis” used two separate tools named the EDAtool and
the HRtool which were developed by Javier Jaimovich using MATLAB [33]. These
tools took the respective raw physiological signals as inputs, pre-processed them,
removed artifacts and abnormalities and gave as output the processed features such as the
Phasic and Tonic EDA and HR. However, some extra features were required for
designing the stress profile generation system, such as RMSSD, Coefficient of Variance,

19
Standard Deviations of HR and RR intervals, pRR50, pRR20, etc. and additional
functionality was programmed into the HRtool for getting these features as output.
EDAtool
As per the description given in [33], the EDAtool was developed to process the raw EDA
signal and to extract the Phasic and Tonic EDA from it. The processing included removal
of noise and detection of artifacts in the signal. The raw EDA signal is input in to the tool
which is then resampled at 50Hz using interpolation. This allows using all the filter
coefficients of the tool in the same way, even if the sampling rate of the raw EDA signal
is different. The DC offset is removed and the signal is filtered and normalized. Any
electrical noise present in the signal is removed by using a low-pass filter of order 224,
with a cutoff frequency of 0.5Hz. The latency caused by the filter is compensated by
shifting the filtered signal. One of the important features of the EDAtool is that it can
detect and remove artifacts (for e.g. motion artifacts) based on user specifications. The
tool employs a sliding window with a threshold value (which can be specified by the
user) and computes the slope between the edges of the window. Since the changes in
EDA are slower than changes caused by artifacts, distinguishing between the signal and
artifact changes becomes possible. If an artifact is detected, it is replaced by a non-valid
value spanning across a window of 1.5 seconds with the artifact location as its central
point. Another interesting feature provided by the tool is the calculation of “Confidence
Index” which is the ratio between the valid EDA values and the non-valid EDA values.
This is also a representation of the amount of artifact present in the signal. The tool also
allows interpolation of between the detected artifacts. It is achieved by interpolating the
values before and after the non-valid samples. Finally, in order to separate the Tonic and
Phasic EDA, an Infinite Impulse Response (IIR) Butterworth low-pass filter with a cutoff
frequency of 0.001Hz was used. The output obtained after applying this filter gives the
Tonic EDA. The Phasic EDA is obtained after subtracting the Tonic EDA from the signal
given as input to the IIR filter.

20
HRtool
As per the description of the HRtool given in [33], the tool accepts the raw ECG signal as
input and outputs the instantaneous HR values (calculated at every heartbeat). The raw
signal is first de-trended and then filtered using an FIR high-pass Kaiser Window with a
cutoff frequency of 3Hz. The filter coefficients are not constant like in the EDAtool, and
instead depend of the sampling rate of the input raw ECG signal. The latency introduced
by the filter is compensated for by shifting the signal in time domain. Since the peak
amplitude may vary for different beats, the HRtool computes a dynamic threshold by
using a moving window of 2 seconds. The signal present in the window is z-normalized
and the product of standard deviation and the threshold specified by the user is added to
the mean value of the ECG signal, in order to find the peak threshold value. The initial
value of HR is calculated as the average HR for the first 10 seconds of the signal. For
other values, the tool uses a sliding window with its size set to the minimum RR interval
specified by the user. This window slides to detect the R-peaks and saves its timestamp.
After measuring all the R peaks, any values outside the range of minimum and maximum
HR are replaced with either the previous valid HR value or they are interpolated. The tool
also outputs a “Confidence Index” which is the ratio of the number of replaced beats and
the number of valid beats. For all studies, the minimum HR was set to be 50 beats per
minute (bpm) and the maximum HR was 130 bpm.
4.3 Common Physiological Features Extracted from ECG and EDA signals
This section presents the important physiological features that can be extracted from ECG
and EDA.
List of Features derived from EDA [33, 48, 81]:
Feature Name (Abbreviation) Description
SCL Skin Conductance Level (Tonic EDA)
Mean SCL Average Skin Conductance Level over a
time-period
SCR Skin Conductance Response (SCR)
Amplitude SCR Amplitude of SCR
Latency SCR Latency of SCR (between stimuli
introduction and SCR) Table 1 Features Derived from EDA
21
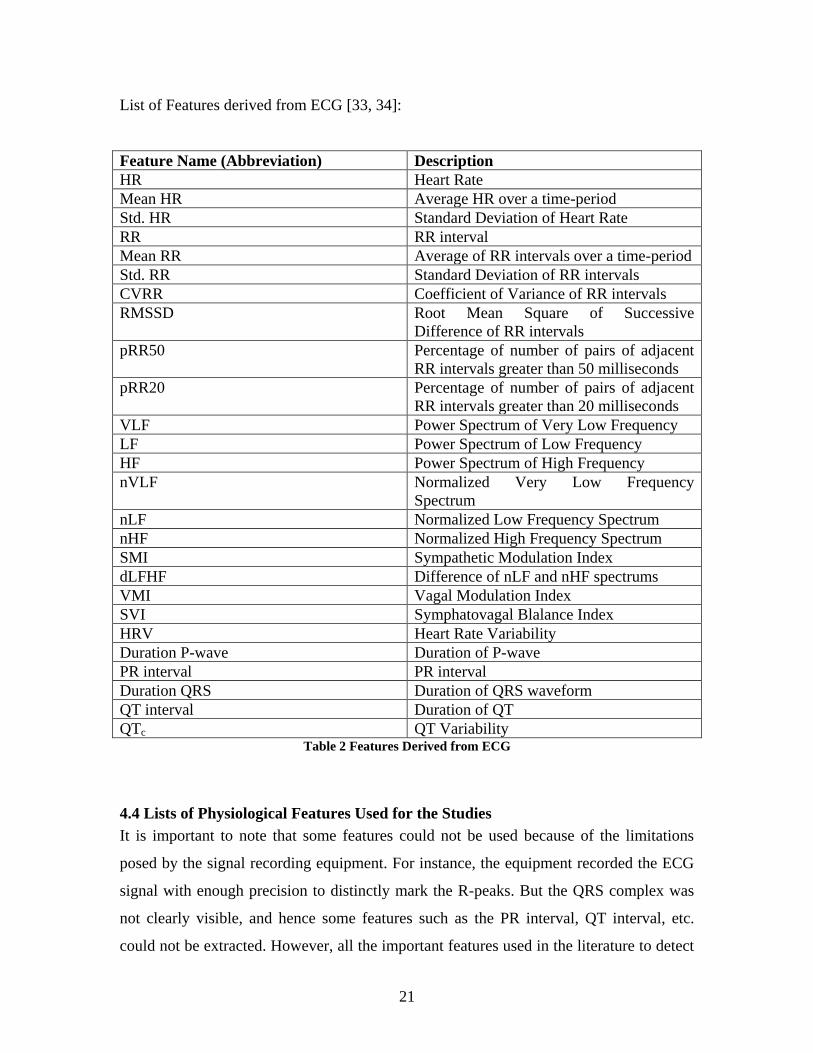
List of Features derived from ECG [33, 34]:
Feature Name (Abbreviation) Description
HR Heart Rate
Mean HR Average HR over a time-period
Std. HR Standard Deviation of Heart Rate
RR RR interval
Mean RR Average of RR intervals over a time-period
Std. RR Standard Deviation of RR intervals
CVRR Coefficient of Variance of RR intervals
RMSSD Root Mean Square of Successive
Difference of RR intervals
pRR50 Percentage of number of pairs of adjacent
RR intervals greater than 50 milliseconds
pRR20 Percentage of number of pairs of adjacent
RR intervals greater than 20 milliseconds
VLF Power Spectrum of Very Low Frequency
LF Power Spectrum of Low Frequency
HF Power Spectrum of High Frequency
nVLF Normalized Very Low Frequency
Spectrum
nLF Normalized Low Frequency Spectrum
nHF Normalized High Frequency Spectrum
SMI Sympathetic Modulation Index
dLFHF Difference of nLF and nHF spectrums
VMI Vagal Modulation Index
SVI Symphatovagal Blalance Index
HRV Heart Rate Variability
Duration P-wave Duration of P-wave
PR interval PR interval
Duration QRS Duration of QRS waveform
QT interval Duration of QT
QTc QT Variability Table 2 Features Derived from ECG
4.4 Lists of Physiological Features Used for the Studies
It is important to note that some features could not be used because of the limitations
posed by the signal recording equipment. For instance, the equipment recorded the ECG
signal with enough precision to distinctly mark the R-peaks. But the QRS complex was
not clearly visible, and hence some features such as the PR interval, QT interval, etc.
could not be extracted. However, all the important features used in the literature to detect

22
stress, such as HR, Mean HR, Std. HR, RR, Mean RR, Std. RR, RMSSD, pRR50, HF,
SCL, SCR, Amplitude SCR [33] could be successfully extracted and were used for stress
profile generation (see Chapter 6).
4.5 Affect Classification
Two main theories on emotion exist: the Central/Mental approach and the
Peripheral/Organic approach [33]. According to the peripheral/organic theory, each
individual first has a visceral manifestation about an emotion which is later recognized by
the brain. This theory contradicts the fact that the mind is responsible to determine and
evoke an emotional response corresponding to any change in the environment [64]. The
peripheral/organic theory has been challenged on grounds of differentiating emotions, but
it sparked the concept that different emotions cause different physiological effects which
can be measured using instruments such as the Lie Detector Test [65].
On the other hand, the central/mental approach believes that emotion is directed from the
Central Nervous System (CNS) to the rest of the body. It is contradictory to the first
theory because it promotes the notion that the brain first assesses and interprets any
change in the environment which is later evoked as an emotion [33].
However, there exists a different model proposed by Paul Ekman which lists eleven
characteristics to distinguish basic emotions from one another. According to Ekman, no
“non-basic” emotions exist [66]. Another approach to model emotions was proposed by
James Russel [67, 68]. According to him, emotions can be classified according to their
valence and activation levels based on a circumplex model of affect. This is a two-
dimensional model with levels of valence on the X-axis and levels of activation on the Y-
axis [67, 68].
However, since this thesis focuses on testing the feasibility of the framework proposed to
enable emotion regulation in young children (age 3-6 years), considering the entire set of
emotions classified by the above mentioned theories was beyond the scope of this work.
Also, as already explained in section 2.1.1, anxiety related difficulties are so frequently
exhibited in children with Autism Spectrum Disorders (ASDs) that DSM-IV and DSV-V

23
highlight anxiety-like responses as a common, ‘‘associated feature’’ of autism [56].
Moreover, the Lab-TAB activities chosen for the studies induce emotionally unstable
states such as frustration, anxiety, anger, disappointment and sadness (see section 5.1.2).
So, setting out as an exploratory work, the work targets a simpler world of emotions,
which is classified only into two parts: “Stress” and “Non-Stress”. This classification is
also supported by the fact that all emotionally unstable states caused by the Lab-TAB
activities can be roughly considered to fall under the state of “Stress”. Hence, the baseline
condition and emotional state of the participant during the non-frustrating Lab-TAB
activities can be easily grouped under the state of “Non-Stress” (see section 5.1.2).
Exploration of all other emotional states such as happiness, delightedness, boredom, fear,
etc. would require additional contextual cues such as accelerometers, EMG
(Electromyogram) and real-time behavior observation of facial expressions and gestures
by an expert, and remains an area for future work (see Chapter 7).
4.6 Conclusion
This chapter began with an introduction to the commonly used biosignals for affect (and
more specifically, stress) detection. It was shown that ECG and EDA are considered to be
the most commonly used signals for studies at the intersection of physiology and
psychology. Later, the subsections described the ECG and EDA signals in detail by
presenting their physiological origin, effect on affect, and important features required to
derive the correlation between stress and physiology, along with a description of the tools
used for feature extraction.

24
Chapter 5: User Study Design and Results
This chapter presents the design methodology, contributing factors, and details of the user
studies performed in order to test the feasibility of individual building blocks of the
proposed framework. The results, plausible mitigating factors and insights gained from
the studies are also described.
5.1 Method
The pilot studies followed an experimental design through an iterative process of design,
testing, re-design and re-testing. The following subsections outline the challenges faced
in designing the study and the experimental approach employed. Details on the technical
implementation of the study are also presented.
5.1.1 Challenges and Considerations
There were several considerations and challenges that were observed while designing the
study. These are listed below:
1. Duration of the Study
The two main blocks of the proposed methodology are physiological measurement during
situations of emotional instability, and testing the attention capturing ability of different
audio representations. In order to test both the blocks without causing fatigue to the
participant, the study was divided into two visits (namely Visit-1 and Visit-2), each being
around thirty minutes long. The first visit presented an implementation of the first block
of the framework and captured the physiology of the participant while stress was being
induced to him/her. The second visit only focused on the second block of the framework
and presented different audio representations to test their attention-capturing capability.
2. Stress induction
In order to expose the child to real-time situations of experiencing stress, the study
needed to contain some activities that could cause mild frustration/anger. In order to be
able to compare the physiology during stressful situations against the non-stressful
situations, a counterpart of the same activities was required by the study, with
physiological measurements being recorded in parallel.

25
3. ‘Return to baseline’ condition
The emotional state of the child while performing any activity can be affected by the
preceding emotional state (if an emotion is carried forward from the previous activities
performed). To remove this precedence effect, and to bring back the child to the baseline
condition after each activity, an Inter-Activity Interval (IAI) was required. The IAI was a
minute long interval during which a quiet conversation with the child was arranged, so
that the activity would require minimal physical effort (and hence minimal artifacts
would be introduced into the measurements).
4. Comfortable and unobtrusive equipment to measure physiology
Care needed to be taken that the equipment used to record physiological data would not
distract the participant or make him/her feel uncomfortable, as that could affect his
emotional state.
5. Minimal motion artifacts during the study
Artifacts caused by the activities can disturb the physiological measurements and
recording. So, the activities used in the study should demand minimal physical effort, or
should at least be such that they can be performed while the participant is sitting in a
relaxed position.
6. Ease of post-hoc analysis of recorded data
The data should capture the physiology and behavior of the participant in an audio and
visual setting. Recorded data should also be available in a suitable format for post-hoc
analysis.
5.1.2 Experimental Design
The study was designed while taking care of the considerations listed in section 5.1.1.
The methodology and apparatus used in the studies was approved by Virginia
Polytechnic Institute and State University’s Institution Review Board protocol (Serial
number: IRB#13-894).
As already discussed, one of the hypotheses of the study was that the method of teaching
emotion regulation can be made more effective if the participant is exposed to real-time
scenarios where he/she can sense a change in his/her affect and then use measures to
regulate it. So, the study design incorporated a set of activities that caused emotional

26
instability in the child by inducing mild frustration/anger (described in detail below).
These activities were chosen from the Preschool version of a standard battery with minor
modifications. This battery, called Lab-TAB, stands for Laboratory Temperament
Assessment Battery [32]. It is widely-used and serves as an instrument to measure early
temperament in laboratory settings. Parental consent and child assent was obtained prior
to participation.
Visit-1 of the Study:
The visit consisted of an introductory session and 3 subsequent phases for each
participant. In the introductory session, the participant was told that he/she will be asked
to play some fun games. Upon receiving his/her agreement, the child was asked to
participate in the subsequent phases (described in detail below). During each activity, the
participant’s physiology was measured.
4 sets (namely S1, S2, S3 and S4) of activities in the form of developmentally appropriate
games were presented. Each activity was performed for approximately three minutes. In
between each activity, there was a minute long break, termed as “Inter-activity Interval
(IAI)”, to bring the child back to the baseline condition. All participants were made to
perform the activities in the same order, to observe patterns in their physiology and
response. Thus the order of participating in the activities was: (S1-a) (IAI) (S1-b) (IAI)
(S2-a) (IAI) (S2-b) (IAI) (S3-a) (IAI) (S3-b) (IAI) (S4-a) (IAI) (S4-b) (IAI).
The activities in these sets and their sub-parts are explained in detail below.
1. Activity Set-1 (S1):
Activity S1(a): “Attractive Toy in a Transparent Box”
This task was designed to evoke frustration or anger. Before beginning, the experimenter
showed the participant how to stick a key into the lock to open it. Next, the participant
was shown two sets of toys and asked his/her preference. The desired toy was placed in a
locked transparent box, and the padlock without the right key was given to the participant
to open the lock. The participant was left alone in the room facing the camera for three
27
minutes. Later, the experimenter returned the correct key to the participant explaining
that he/she mistakenly gave wrong keys to the participant. Finally, the box was opened
and the toy was given to the participant.
Activity S1(b): “Free Playing”
This task was a positive version of the previous task and was therefore designed to
prevent evoking anger or frustration in the participant while he/she was made to perform
the activity. Hence, this activity was used to measure the participant’s physiology during
relaxed state. During this activity, the participant was allowed to play with the toy for
three minutes.
2. Activity Set-2 (S2):
Activity S2(a): “I’m not sharing”
This task targeted the child’s feelings of being treated unjustly. The experimenter told the
participant facing the camera, that a friend of his/her would be bringing a surprise in for
them. Another experimenter gave a box of colored goldfish and asked the other
experimenter to share those equally with the participant. However, the experimenter did
not share the goldfish equally, and also took away some specific colored goldfish from
the participant’s share, saying that he/she likes them a lot. Finally, the experimenter took
away all the goldfish from the participant’s share and asked the participant how he/she
felt about it.
Activity S2(b): “Free Eating”
This task was the positive version of the previous task and so, did not cause any feeling
of being treated unjustly, and thus did not evoke any anger or frustration in the
participant. During this activity, the experimenter simply gave some goldfish to the
participant to eat for three minutes.
28
3. Activity Set-3 (S3):
Activity S3(a): “Impossibly Perfect Green Circles”
After the completion of this activity several times, the participant is expected to become
bored and angry. The experimenter first gave the participant a piece of paper and a green
pen and asked him/her to draw a perfect green circle. Every time the participant drew the
circle, his/her drawing was critiqued by the experimenter in a neutral voice and he/she
was asked to draw another circle, without turning the paper. This was carried on for three
minutes. To bring the child back to the baseline, the experimenter complimented the last
drawn circle.
Activity S3(b): “Free Drawing”
This task was a positive version of the previous task and was therefore designed to avoid
arousing any anger, frustration or boredom in the participant. The participant was given a
piece of paper and different colored pens and asked to draw whatever he/she liked, for
three minutes.
Visit-2 of the Study:
During this visit, the participant was asked to watch a video on animals without any
associated audio, and the participant’s physiology was measured. In fact, the participant
was explicitly told that the audio system was not working. This was done to isolate the
reactions received from the participant, based on the audio representations (without
including reactions based on the audio associated with the video). Three variations each
of three audio representations were presented to the participant in a sequential manner
while he/she was still engaged in watching the video, without explicitly informing the
participant about it. These audio representations were created by Brennon Bortz. To
achieve three different kinds of variations in the representations, the first representation
was modulated in amplitude, the second one was divided into three segments and the
third one was developed and modified synthetically. These audio representations were
chosen to be ambient sounds which are commonly heard. The order of presenting the
audio representations was:

29
1. Cat Meow (Low Amplitude)
2. Cat Meow (Medium Amplitude)
3. Cat Meow (High Amplitude)
4. Instrumental Piece – First segment
5. Instrumental Piece – Second segment
6. Instrumental Piece – Third segment
7. Synthetic Sound – Form 1
8. Synthetic Sound – Form 2
9. Synthetic Sound – Form 3
5.1.3 Subject Pool
The population chosen for the studies allowed checking for the feasibility of the
equipment and procedures to be tested. The participants belonged to the age group of 3-6
years (pre-K to Grade 1; or the home-school equivalent). The study required them to be
verbal (i.e. at least single words) and to be able to understand verbal instructions. There
were no additional exclusionary criteria for the participants recruited. All participants
were given code numbers to keep their personal information confidential, as per the
Virginia Tech IRB guidelines.
After five participants completed the first iteration of the study, data were analyzed and
adjustments were made to the data recording procedure for conducting the second
iteration of the study. The second iteration also consisted of five participants, but one of
them refused to participate. So, only 4 participants were tested for the second iteration.
5.1.4 Experiment Location
The studies were conducted at the Child Development Center for Learning and Research
(CDCLR) at Virginia Tech.
5.2 Equipment and Technological Implementation
This section describes the equipment and apparatus used to implement and validate the
goals of the pilot study. Based on the requirements of the study as outlined in section 5.1,
sensors were chosen to record the participant’s physiology in an unobtrusive and
comfortable way.
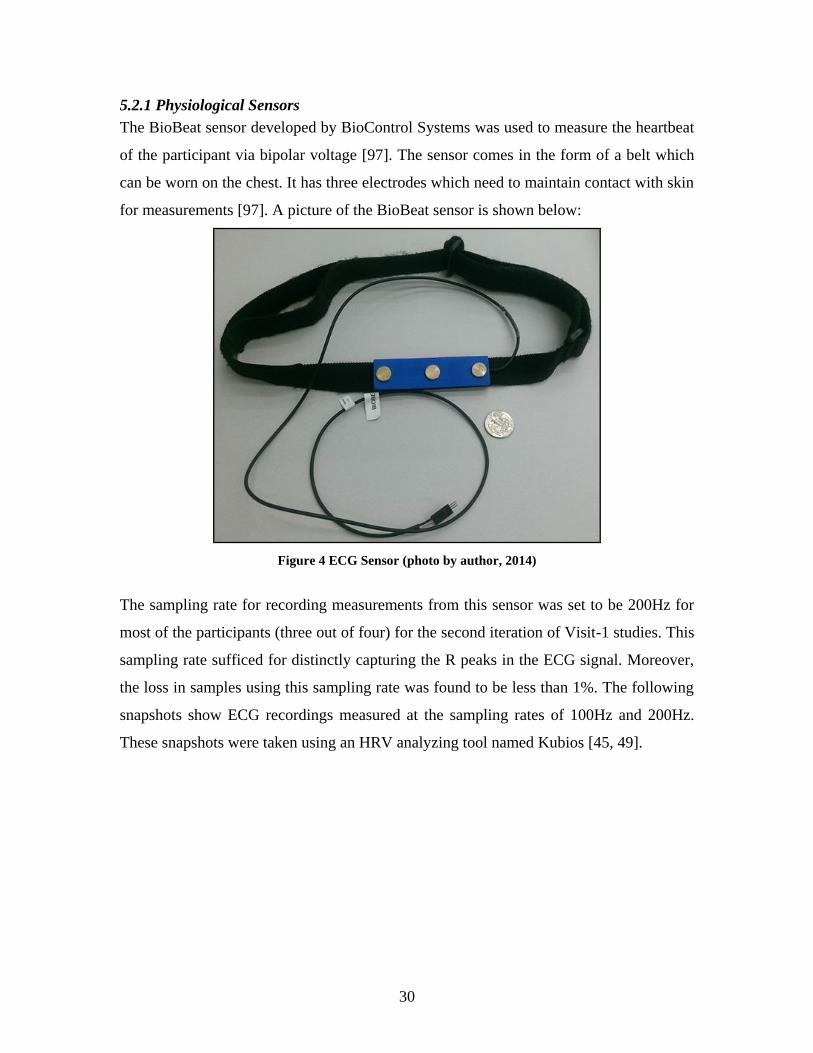
30
5.2.1 Physiological Sensors
The BioBeat sensor developed by BioControl Systems was used to measure the heartbeat
of the participant via bipolar voltage [97]. The sensor comes in the form of a belt which
can be worn on the chest. It has three electrodes which need to maintain contact with skin
for measurements [97]. A picture of the BioBeat sensor is shown below:
Figure 4 ECG Sensor (photo by author, 2014)
The sampling rate for recording measurements from this sensor was set to be 200Hz for
most of the participants (three out of four) for the second iteration of Visit-1 studies. This
sampling rate sufficed for distinctly capturing the R peaks in the ECG signal. Moreover,
the loss in samples using this sampling rate was found to be less than 1%. The following
snapshots show ECG recordings measured at the sampling rates of 100Hz and 200Hz.
These snapshots were taken using an HRV analyzing tool named Kubios [45, 49].
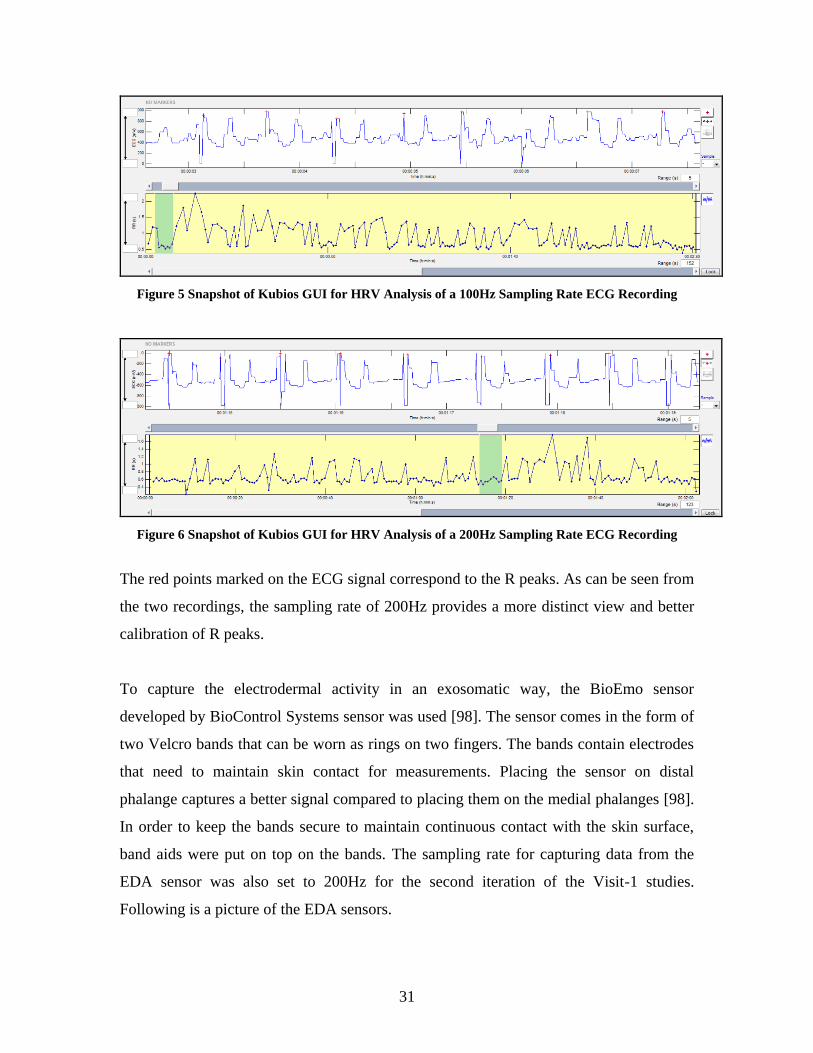
31
Figure 5 Snapshot of Kubios GUI for HRV Analysis of a 100Hz Sampling Rate ECG Recording
Figure 6 Snapshot of Kubios GUI for HRV Analysis of a 200Hz Sampling Rate ECG Recording
The red points marked on the ECG signal correspond to the R peaks. As can be seen from
the two recordings, the sampling rate of 200Hz provides a more distinct view and better
calibration of R peaks.
To capture the electrodermal activity in an exosomatic way, the BioEmo sensor
developed by BioControl Systems sensor was used [98]. The sensor comes in the form of
two Velcro bands that can be worn as rings on two fingers. The bands contain electrodes
that need to maintain skin contact for measurements. Placing the sensor on distal
phalange captures a better signal compared to placing them on the medial phalanges [98].
In order to keep the bands secure to maintain continuous contact with the skin surface,
band aids were put on top on the bands. The sampling rate for capturing data from the
EDA sensor was also set to 200Hz for the second iteration of the Visit-1 studies.
Following is a picture of the EDA sensors.
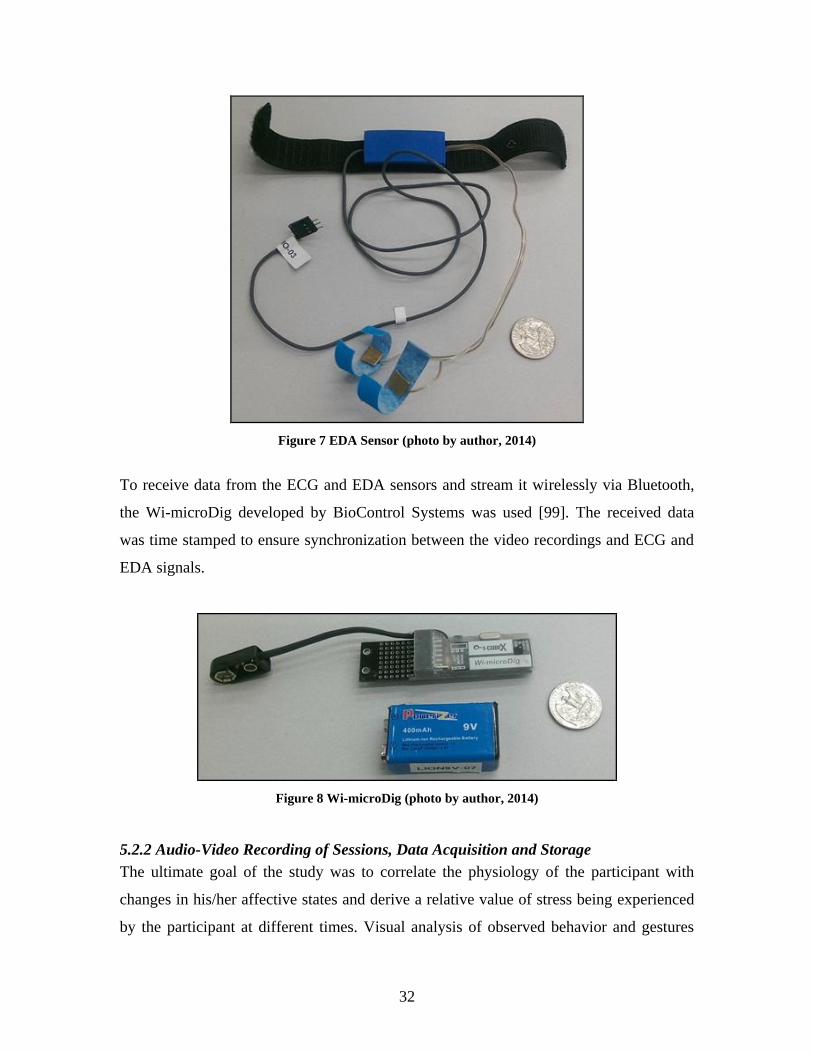
32
Figure 7 EDA Sensor (photo by author, 2014)
To receive data from the ECG and EDA sensors and stream it wirelessly via Bluetooth,
the Wi-microDig developed by BioControl Systems was used [99]. The received data
was time stamped to ensure synchronization between the video recordings and ECG and
EDA signals.
Figure 8 Wi-microDig (photo by author, 2014)
5.2.2 Audio-Video Recording of Sessions, Data Acquisition and Storage
The ultimate goal of the study was to correlate the physiology of the participant with
changes in his/her affective states and derive a relative value of stress being experienced
by the participant at different times. Visual analysis of observed behavior and gestures

33
and measured physiology are equally important to derive this correlation. Hence, a
multimodal approach was used to record data during these studies. Along with recording
physiological measurements, audio and video recording of the sessions was also done.
These recordings were manually annotated by the author. However, for future studies, it
is advised to have multiple experts coding and annotating the audio and video recordings
and ultimately reaching a consensus about the findings. The recordings served as
evidence to support or contradict the derived physiological correlation and other findings.
It will also allow the experimenters to review at a later date and code the participant’s
behavior, which can increase confidence in post-hoc evaluation of the findings.
5.2.3 Synchronization of the Recorded Data
A Microsoft Windows based tool named EyesWeb was used to receive physiological
signals captured by the ECG and EDA sensors. EyesWeb is open software designed and
developed by Casa Paganini – InfoMus at Università degli Studi di Genova that provides
a platform for designing interactive real-time multimodal systems and interfaces [51]. It
can accept inputs ranging from motion capture systems to audio and video recording
devices, game interfaces (such as Kinect, Wii) to analog inputs (which capture
physiological signals) [51].
The network of connected inputs and outputs that defines the dataflow in an Eyesweb
project is called a ‘Patch’. The patch contains blocks of inputs and outputs and controls
the dataflow between them either automatically or based on real-time interaction. The
EyesWeb patch used for all the studies was designed by Brennon Bortz and had the
following inputs and outputs:
Inputs:
1. Physiological Signals being received from the ECG and EDA sensors (via
Bluetooth)
2. Audio and Video recordings captured by the webcam
3. Input for entering the participant code number
4. Audio and video files used for Visit-2 of the studies
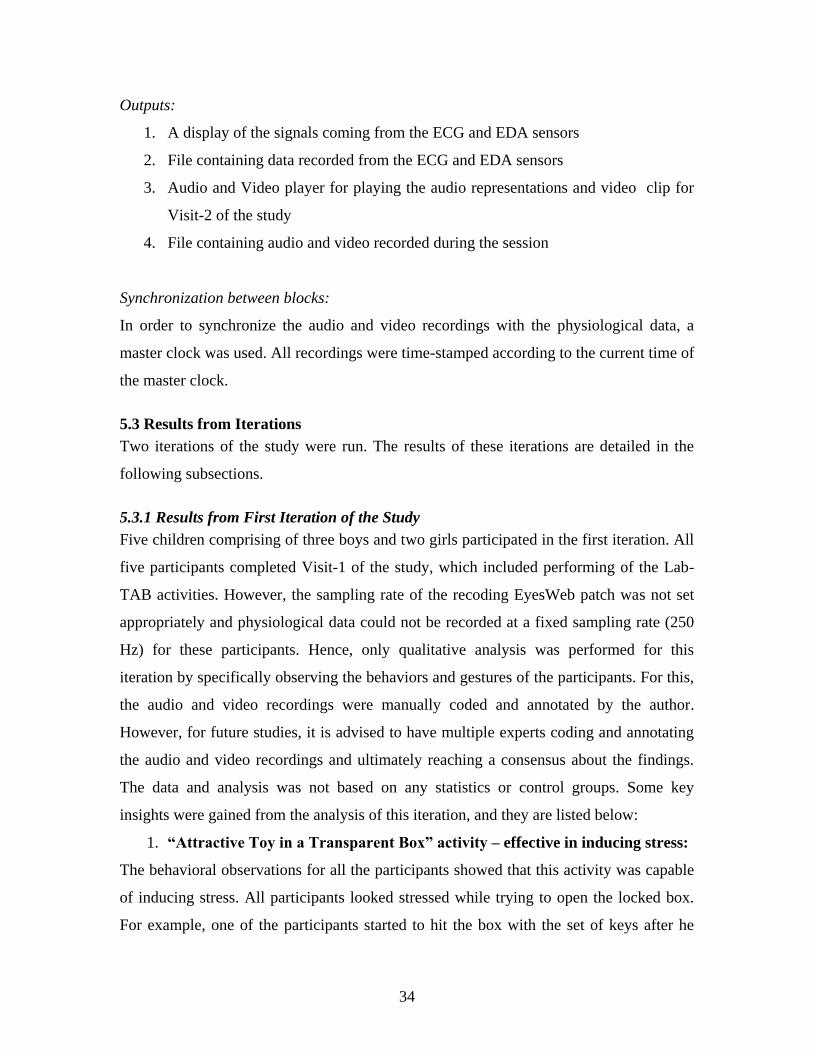
34
Outputs:
1. A display of the signals coming from the ECG and EDA sensors
2. File containing data recorded from the ECG and EDA sensors
3. Audio and Video player for playing the audio representations and video clip for
Visit-2 of the study
4. File containing audio and video recorded during the session
Synchronization between blocks:
In order to synchronize the audio and video recordings with the physiological data, a
master clock was used. All recordings were time-stamped according to the current time of
the master clock.
5.3 Results from Iterations
Two iterations of the study were run. The results of these iterations are detailed in the
following subsections.
5.3.1 Results from First Iteration of the Study
Five children comprising of three boys and two girls participated in the first iteration. All
five participants completed Visit-1 of the study, which included performing of the Lab-
TAB activities. However, the sampling rate of the recoding EyesWeb patch was not set
appropriately and physiological data could not be recorded at a fixed sampling rate (250
Hz) for these participants. Hence, only qualitative analysis was performed for this
iteration by specifically observing the behaviors and gestures of the participants. For this,
the audio and video recordings were manually coded and annotated by the author.
However, for future studies, it is advised to have multiple experts coding and annotating
the audio and video recordings and ultimately reaching a consensus about the findings.
The data and analysis was not based on any statistics or control groups. Some key
insights were gained from the analysis of this iteration, and they are listed below:
1. “Attractive Toy in a Transparent Box” activity – effective in inducing stress:
The behavioral observations for all the participants showed that this activity was capable
of inducing stress. All participants looked stressed while trying to open the locked box.
For example, one of the participants started to hit the box with the set of keys after he
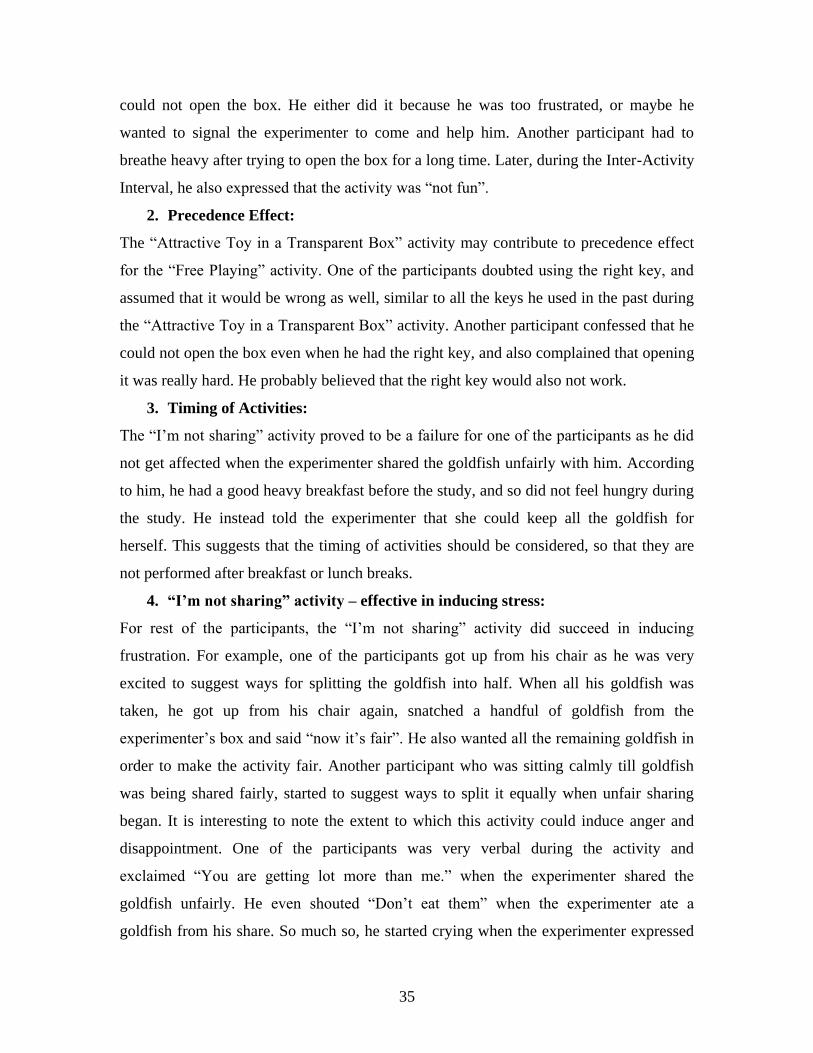
35
could not open the box. He either did it because he was too frustrated, or maybe he
wanted to signal the experimenter to come and help him. Another participant had to
breathe heavy after trying to open the box for a long time. Later, during the Inter-Activity
Interval, he also expressed that the activity was “not fun”.
2. Precedence Effect:
The “Attractive Toy in a Transparent Box” activity may contribute to precedence effect
for the “Free Playing” activity. One of the participants doubted using the right key, and
assumed that it would be wrong as well, similar to all the keys he used in the past during
the “Attractive Toy in a Transparent Box” activity. Another participant confessed that he
could not open the box even when he had the right key, and also complained that opening
it was really hard. He probably believed that the right key would also not work.
3. Timing of Activities:
The “I’m not sharing” activity proved to be a failure for one of the participants as he did
not get affected when the experimenter shared the goldfish unfairly with him. According
to him, he had a good heavy breakfast before the study, and so did not feel hungry during
the study. He instead told the experimenter that she could keep all the goldfish for
herself. This suggests that the timing of activities should be considered, so that they are
not performed after breakfast or lunch breaks.
4. “I’m not sharing” activity – effective in inducing stress:
For rest of the participants, the “I’m not sharing” activity did succeed in inducing
frustration. For example, one of the participants got up from his chair as he was very
excited to suggest ways for splitting the goldfish into half. When all his goldfish was
taken, he got up from his chair again, snatched a handful of goldfish from the
experimenter’s box and said “now it’s fair”. He also wanted all the remaining goldfish in
order to make the activity fair. Another participant who was sitting calmly till goldfish
was being shared fairly, started to suggest ways to split it equally when unfair sharing
began. It is interesting to note the extent to which this activity could induce anger and
disappointment. One of the participants was very verbal during the activity and
exclaimed “You are getting lot more than me.” when the experimenter shared the
goldfish unfairly. He even shouted “Don’t eat them” when the experimenter ate a
goldfish from his share. So much so, he started crying when the experimenter expressed
36
that she did not care being unfair. He was so disappointed that he wanted to stop playing
and wanted to go back to classroom immediately. The experimenters could calm him
down after giving him some goldfish to eat, and after a long quiet talk.
5. Ambiguity in interpreting the gestures:
One of the participants kept smiling even when her physiology reflected that she may be
feeling frustrated (during the “I’m not sharing” activity). Analyzing such a behavioral
gesture is complex as the gesture doesn’t explicitly state if the activity appeared to be
funny to the participant or if smiling was a mechanism employed by her to cope with the
stress she experienced. Such ambiguity needs supporting results from the physiological
data analysis.
6. “Impossibly Perfect Green Circles” activity:
The last activity, “Impossibly Perfect Green Circles” also brought out some interesting
reactions from the participants. However, the reactions were not as strong as they were
during the other two activities. One participant tried to flip the page after drawing circles
on the sheet. But as per the Lab-TAB guidelines, they were not allowed to do so, in order
to make the activity more frustrating. Another participant, after being criticized for each
circle he drew, said that he could make a triangle and started making a triangle instead of
the circle. Another participant first questioned the experimenter’s criticism for his circles,
but later used the same comments for self-criticism.
7. Time Boundaries for Future Analyses:
Another key insight gained from these studies helped decide the time boundaries for
measuring the physiology during each activity. These boundaries (Start and End of
physiological measurements) were chosen to capture peaks and periods that according to
the experimenters would reflect definite “stress” and definite “non-stress”.
Activity S1(a): “Attractive Toy in a Transparent Box”
Start: After the child has tried all wrong keys
End: Just a couple of seconds before the 3 minutes of trying to open the lock end
Activity S1(b): “Free Playing”
Start: A couple of seconds after the child starts playing with the toy
End: A couple of seconds before the 3 minutes of playing end

37
Activity S2(a): “I’m not sharing”
Start: When unfair sharing starts
End: When the child responds to how he felt about unfair sharing (after 30 second
response time given)
Activity S2(b): “Free Eating”
Start: A couple of seconds after the child starts eating
End: A couple of seconds before the child finishes eating
Activity S3(a): “Impossibly Perfect Green Circles”
Start: After the experimenter critiques the child’s circle for the first time
End: A couple of seconds before the experimenter chooses one of his circles and
appreciates it
Activity S3(b): “Free Drawing”
Start: A couple of seconds after the child starts to draw freely (as per his wish)
End: A couple of seconds before the 3 minutes of free-drawing end
5.3.2 Results from Second Iteration of the Study
The first iteration helped in debugging the technical issues and finding the measurement
guidelines which were conducive in making the second iteration successful. The second
iteration was performed after fixing the sampling rate issue which was discovered during
the first iteration. Studies were conducted to find a sampling rate which could capture the
ECG and EDA feature details with minimal loss in samples. The results showed that a
sampling frequency of 200Hz was sufficient to record all the physiological features (see
section 5.2.1). Also, there was less than 1% loss of samples while using this sampling
rate. No other changes were made in the methodological procedure, and the order and
timing of activities was kept the same as in the first iteration. The details about the
participants and activities performed are explained below:
Participants:
The participants were given code numbers to keep their personal information
confidential, as per the Virginia Tech IRB guidelines. This iteration also consisted of five
participants, but one of them refused to participate. So, only 4 participants were tested for

38
this iteration. The subject pool for this iteration consisted of 2 boys (Subject No.102 and
Subject No.110) and 2 girls (Subject No.107 and Subject No.108).
Activity Names:
o S1(a): “Attractive Toy in a Transparent Box”
o S1(b): “Free Playing”
o S2(a): “I’m not sharing”
o S2(b): “Free Eating”
o S3(a): “Impossibly Perfect Green Circles”
o S3(b): “Free Drawing”
Two kinds of analyses were performed on the data. These included:
1. Average Calculations: The time boundaries suggested in section 5.3.1 were
used for measuring average values of different physiological features during each
activity.
2. Temporal Point-to-Point Analysis: For this, the ECG and EDA signals were
processed and their feature values were calculated at a finer granularity (every
few seconds) to see the effect of events on physiological changes.
The results from these analyses are explained below.
Average Calculations:
Color Coding of the Feature Values:
For the following tables (table 3, table 4, table 5 and table 6), all right-hand columns (Part
(b) of all activities) should ideally be highlighted in green as it would imply lesser stress
(higher HRV) and all left-hand columns (Part (a) of all activities) should be ideally
highlighted in red, implying higher stress (lower HRV) experienced during that time.
Data Analysis:
Data was analyzed using a tool named Kubios which is developed by researchers at the
University of Eastern Finland [45, 49]. Kubios presents a Graphical User Interface (GUI)
to study Heart Rate Variability. ECG data was loaded as input and the R peaks were
manually adjusted wherever required. Later, time and frequency domain features of HRV
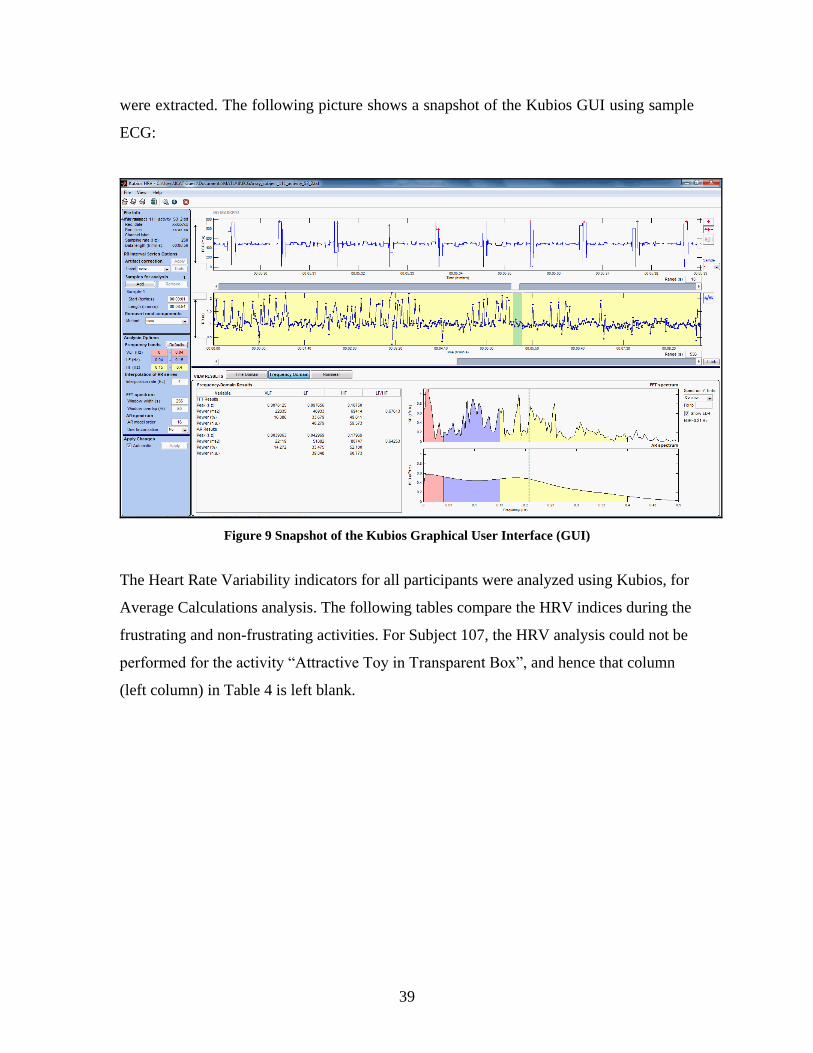
39
were extracted. The following picture shows a snapshot of the Kubios GUI using sample
ECG:
Figure 9 Snapshot of the Kubios Graphical User Interface (GUI)
The Heart Rate Variability indicators for all participants were analyzed using Kubios, for
Average Calculations analysis. The following tables compare the HRV indices during the
frustrating and non-frustrating activities. For Subject 107, the HRV analysis could not be
performed for the activity “Attractive Toy in Transparent Box”, and hence that column
(left column) in Table 4 is left blank.
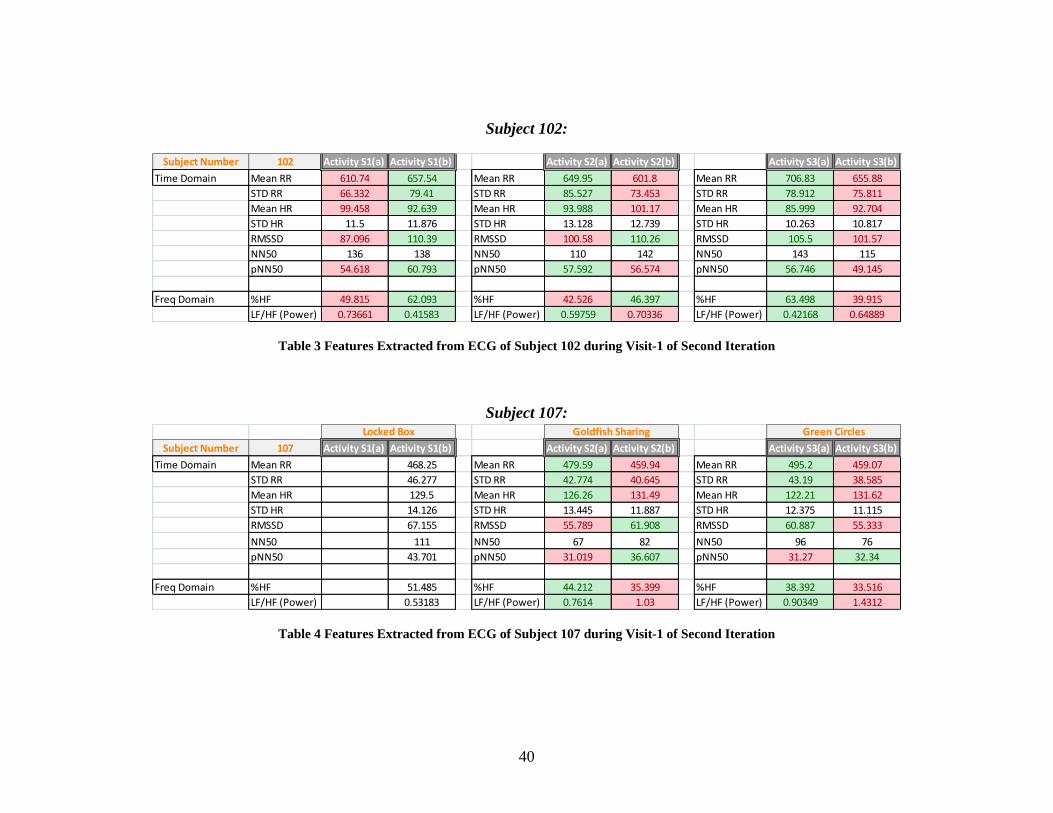
40
Subject 102:
Subject Number 102 Activity S1(a) Activity S1(b) Activity S2(a) Activity S2(b) Activity S3(a) Activity S3(b)
Time Domain Mean RR 610.74 657.54 Mean RR 649.95 601.8 Mean RR 706.83 655.88
STD RR 66.332 79.41 STD RR 85.527 73.453 STD RR 78.912 75.811
Mean HR 99.458 92.639 Mean HR 93.988 101.17 Mean HR 85.999 92.704
STD HR 11.5 11.876 STD HR 13.128 12.739 STD HR 10.263 10.817
RMSSD 87.096 110.39 RMSSD 100.58 110.26 RMSSD 105.5 101.57
NN50 136 138 NN50 110 142 NN50 143 115
pNN50 54.618 60.793 pNN50 57.592 56.574 pNN50 56.746 49.145
Freq Domain %HF 49.815 62.093 %HF 42.526 46.397 %HF 63.498 39.915
LF/HF (Power) 0.73661 0.41583 LF/HF (Power) 0.59759 0.70336 LF/HF (Power) 0.42168 0.64889
Table 3 Features Extracted from ECG of Subject 102 during Visit-1 of Second Iteration
Subject 107:
Subject Number 107 Activity S1(a) Activity S1(b) Activity S2(a) Activity S2(b) Activity S3(a) Activity S3(b)
Time Domain Mean RR 468.25 Mean RR 479.59 459.94 Mean RR 495.2 459.07
STD RR 46.277 STD RR 42.774 40.645 STD RR 43.19 38.585
Mean HR 129.5 Mean HR 126.26 131.49 Mean HR 122.21 131.62
STD HR 14.126 STD HR 13.445 11.887 STD HR 12.375 11.115
RMSSD 67.155 RMSSD 55.789 61.908 RMSSD 60.887 55.333
NN50 111 NN50 67 82 NN50 96 76
pNN50 43.701 pNN50 31.019 36.607 pNN50 31.27 32.34
Freq Domain %HF 51.485 %HF 44.212 35.399 %HF 38.392 33.516
LF/HF (Power) 0.53183 LF/HF (Power) 0.7614 1.03 LF/HF (Power) 0.90349 1.4312
Locked Box Goldfish Sharing Green Circles
Table 4 Features Extracted from ECG of Subject 107 during Visit-1 of Second Iteration
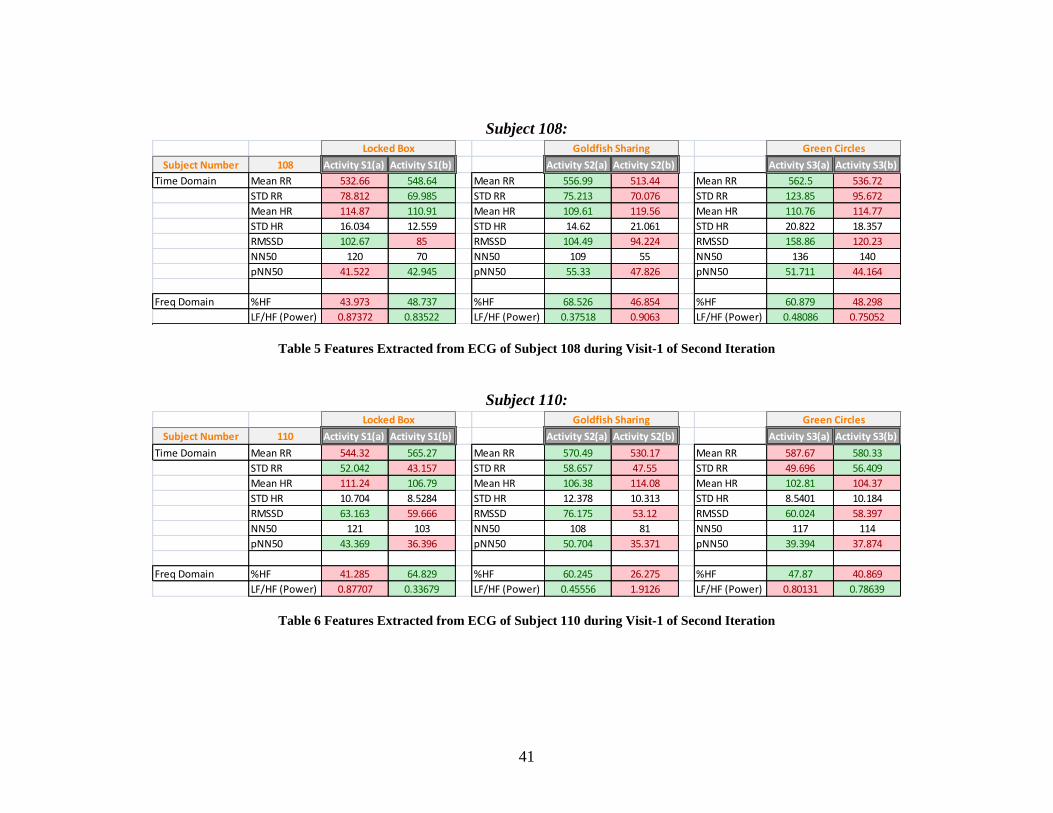
41
Subject 108:
Subject Number 108 Activity S1(a) Activity S1(b) Activity S2(a) Activity S2(b) Activity S3(a) Activity S3(b)
Time Domain Mean RR 532.66 548.64 Mean RR 556.99 513.44 Mean RR 562.5 536.72
STD RR 78.812 69.985 STD RR 75.213 70.076 STD RR 123.85 95.672
Mean HR 114.87 110.91 Mean HR 109.61 119.56 Mean HR 110.76 114.77
STD HR 16.034 12.559 STD HR 14.62 21.061 STD HR 20.822 18.357
RMSSD 102.67 85 RMSSD 104.49 94.224 RMSSD 158.86 120.23
NN50 120 70 NN50 109 55 NN50 136 140
pNN50 41.522 42.945 pNN50 55.33 47.826 pNN50 51.711 44.164
Freq Domain %HF 43.973 48.737 %HF 68.526 46.854 %HF 60.879 48.298
LF/HF (Power) 0.87372 0.83522 LF/HF (Power) 0.37518 0.9063 LF/HF (Power) 0.48086 0.75052
Locked Box Goldfish Sharing Green Circles
Table 5 Features Extracted from ECG of Subject 108 during Visit-1 of Second Iteration
Subject 110:
Subject Number 110 Activity S1(a) Activity S1(b) Activity S2(a) Activity S2(b) Activity S3(a) Activity S3(b)
Time Domain Mean RR 544.32 565.27 Mean RR 570.49 530.17 Mean RR 587.67 580.33
STD RR 52.042 43.157 STD RR 58.657 47.55 STD RR 49.696 56.409
Mean HR 111.24 106.79 Mean HR 106.38 114.08 Mean HR 102.81 104.37
STD HR 10.704 8.5284 STD HR 12.378 10.313 STD HR 8.5401 10.184
RMSSD 63.163 59.666 RMSSD 76.175 53.12 RMSSD 60.024 58.397
NN50 121 103 NN50 108 81 NN50 117 114
pNN50 43.369 36.396 pNN50 50.704 35.371 pNN50 39.394 37.874
Freq Domain %HF 41.285 64.829 %HF 60.245 26.275 %HF 47.87 40.869
LF/HF (Power) 0.87707 0.33679 LF/HF (Power) 0.45556 1.9126 LF/HF (Power) 0.80131 0.78639
Locked Box Goldfish Sharing Green Circles
Table 6 Features Extracted from ECG of Subject 110 during Visit-1 of Second Iteration
42
Discussion on Results of Average Calculations:
It can be observed that not all right-hand columns are highlighted in green which would
have signified higher HRV during the non-frustrating tasks. The Average Calculations
compute the average of all feature values over a time-period spanning across three
minutes roughly. During this period, several events may occur which can either cause a
spike or fall in features such as HR. Such sudden spikes and falls can affect the average
calculations by a high degree. These events and their impacts are not visible in the
Average Calculations, and need a finer granularity of observation. This is achieved by
performing a Temporal Point-to-Point Analysis.
As will be observed in the temporal analysis, some artifacts cause the HR to drop because
the HR during an artifact window is set to be the previous computed HR, or is linearly
interpolated, depending on the window size. If the window size is too large, the new HR
value is copied to be the same as the previous HR. In cases when the HR drops or rises a
lot above the threshold, a large artifact window contributes a higher or lower value of HR
for a long time, respectively, thereby affecting the average calculations.
Other interesting events are observed during the temporal analysis which account for
some deviation from expected HRV trend during the frustrating and non-frustrating
events. For instance, during the “Attractive Toy in a Transparent Box” activity, one of the
participants simply stopped trying to open the lock (see figure 9). This was accompanied
by a drop in his HR. Another participant, during the “Impossibly Perfect Green Circles”
activity, stopped drawing after a couple of trials and critiques. This event also marked a
drop in his HR. So, some events which occurred during the frustrating activity were
conducive in lowering the HR, and also affected other related features.
On the other hand, the non-frustrating versions of activities also witnessed some events
that caused a spike in the HR and related features. For example, during the “Free Eating”
activity, some participants got visibly excited to receive the goldfish. This excitement
witnessed a spike in their HR. It might also be possible that the feeling of getting the
goldfish after losing their share was appreciated more than normal. Another activity,
43
“Free Drawing”, made the participants visibly excited about getting to draw something
they liked and enjoyed drawing. A rise in their HR was seen during this event. It is also
important to note that during this activity, the participant often interacted with the
experimenter and described what he/she was drawing. Although neutral, the
experimenter’s appreciation of his/her drawing might have provided him/her some
encouragement, thereby raising his interest and excitement about drawing, and indirectly
raising the HR above baseline. However, the analysis is highly subjective and these
factors may not exist for each participant. Also, the effect of these factors on the
physiology of the participant can vary by a high degree.
Temporal Point-to-Point Analysis:
It is important to note that the results of the study are subjective because the behavior of
each participant is unique. Each participant exhibited different patterns of responding to
stressful events and the ability to cope up with these situations. The activities in Lab-
TAB are designed to assess these individual differences. In the Developmental
Psychology literature, great variability has been seen in the reacting patterns of the
participants. Some activities appear to be highly frustrating for some children while other
children find it very lowly frustrating [32]. Hence, it is not surprising to observe
differences in the stress levels of different participants. The results obtained from each
participant are studied and specific events that were expected to cause frustration or stress
are marked.
Subject 102:
Activities S1(a) and S1(b): ECG
The following picture shows the different features extracted from the ECG signal of
Subject 102. The important events that cause or are expected to cause a change in the
affect or stress level of the subject are marked. It can be seen that there is a rise in the HR
when the participant tries to open the lock (red arrow in Figure 10). The video recording
showed that the participant gave up trying to open the lock after repeated attempts, and as
can be seen in the following figure, the HR falls when the participant stops trying (black
arrow). Unfortunately, the participant leant over the table during the activity which
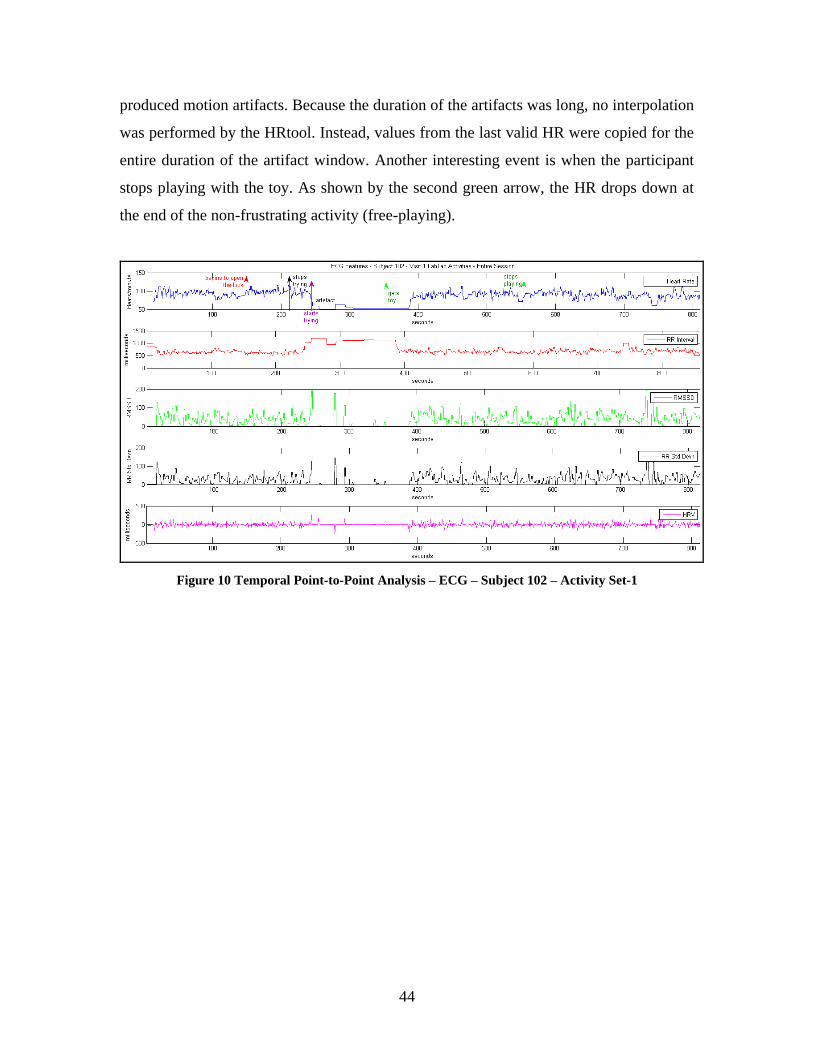
44
produced motion artifacts. Because the duration of the artifacts was long, no interpolation
was performed by the HRtool. Instead, values from the last valid HR were copied for the
entire duration of the artifact window. Another interesting event is when the participant
stops playing with the toy. As shown by the second green arrow, the HR drops down at
the end of the non-frustrating activity (free-playing).
Figure 10 Temporal Point-to-Point Analysis – ECG – Subject 102 – Activity Set-1
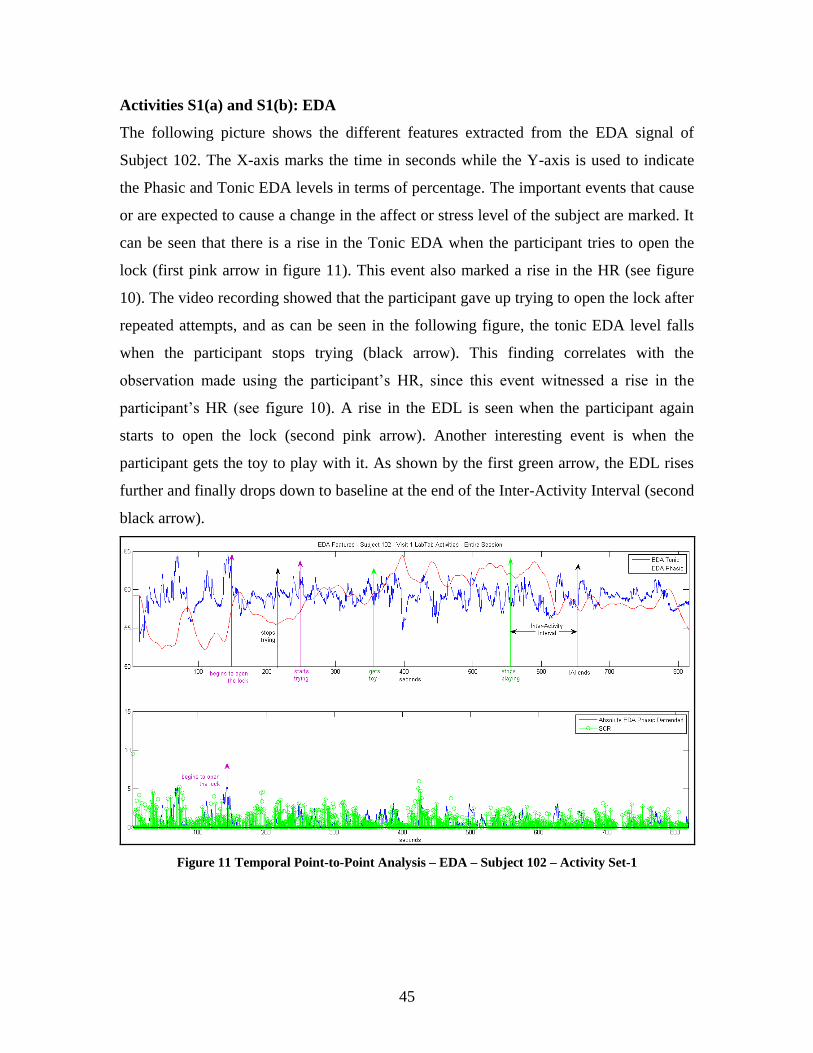
45
Activities S1(a) and S1(b): EDA
The following picture shows the different features extracted from the EDA signal of
Subject 102. The X-axis marks the time in seconds while the Y-axis is used to indicate
the Phasic and Tonic EDA levels in terms of percentage. The important events that cause
or are expected to cause a change in the affect or stress level of the subject are marked. It
can be seen that there is a rise in the Tonic EDA when the participant tries to open the
lock (first pink arrow in figure 11). This event also marked a rise in the HR (see figure
10). The video recording showed that the participant gave up trying to open the lock after
repeated attempts, and as can be seen in the following figure, the tonic EDA level falls
when the participant stops trying (black arrow). This finding correlates with the
observation made using the participant’s HR, since this event witnessed a rise in the
participant’s HR (see figure 10). A rise in the EDL is seen when the participant again
starts to open the lock (second pink arrow). Another interesting event is when the
participant gets the toy to play with it. As shown by the first green arrow, the EDL rises
further and finally drops down to baseline at the end of the Inter-Activity Interval (second
black arrow).
Figure 11 Temporal Point-to-Point Analysis – EDA – Subject 102 – Activity Set-1
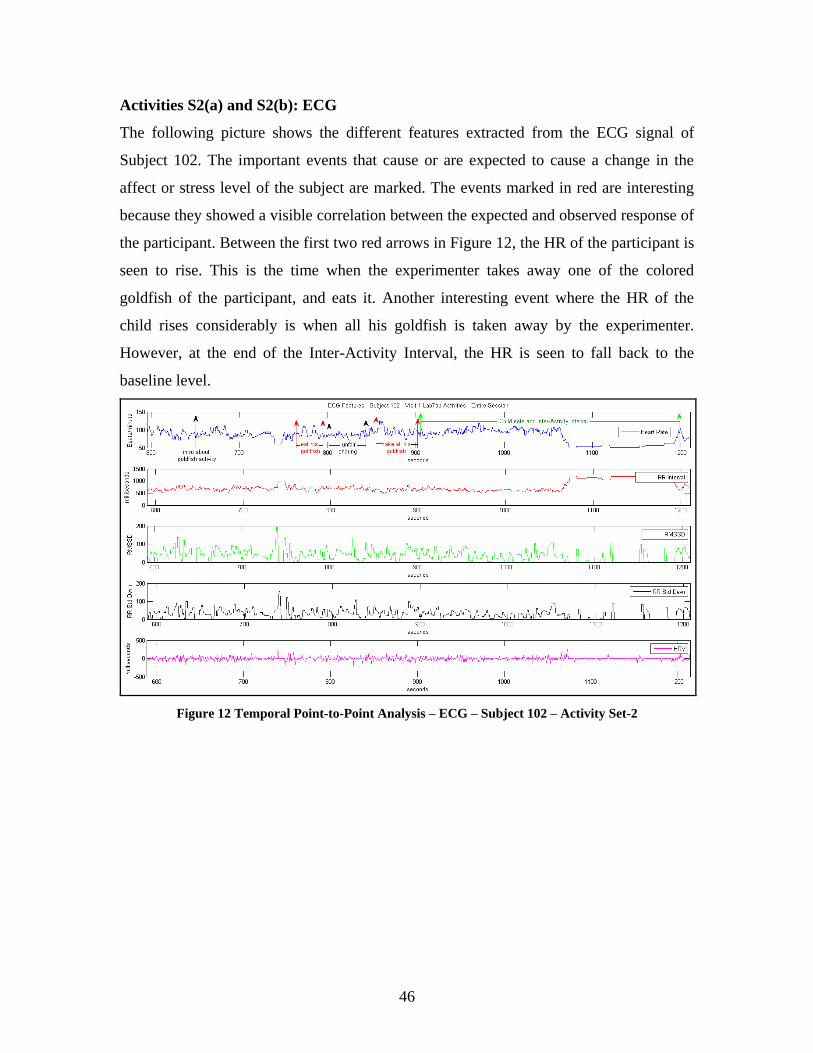
46
Activities S2(a) and S2(b): ECG
The following picture shows the different features extracted from the ECG signal of
Subject 102. The important events that cause or are expected to cause a change in the
affect or stress level of the subject are marked. The events marked in red are interesting
because they showed a visible correlation between the expected and observed response of
the participant. Between the first two red arrows in Figure 12, the HR of the participant is
seen to rise. This is the time when the experimenter takes away one of the colored
goldfish of the participant, and eats it. Another interesting event where the HR of the
child rises considerably is when all his goldfish is taken away by the experimenter.
However, at the end of the Inter-Activity Interval, the HR is seen to fall back to the
baseline level.
Figure 12 Temporal Point-to-Point Analysis – ECG – Subject 102 – Activity Set-2
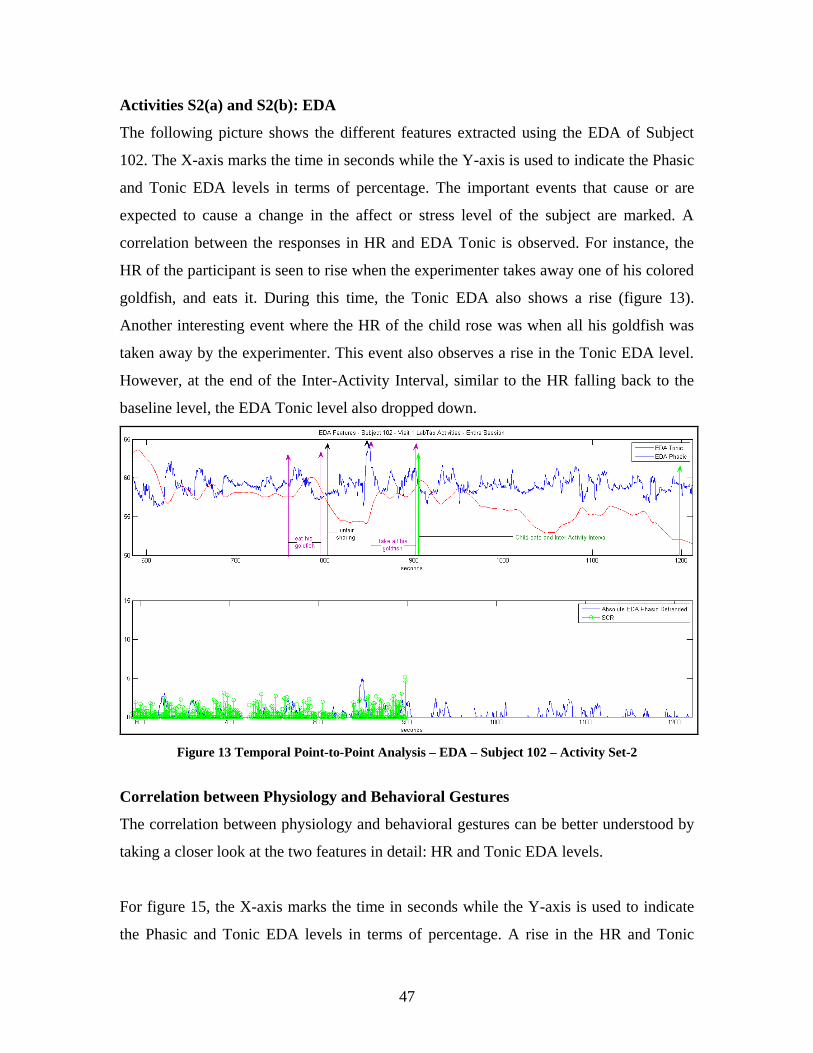
47
Activities S2(a) and S2(b): EDA
The following picture shows the different features extracted using the EDA of Subject
102. The X-axis marks the time in seconds while the Y-axis is used to indicate the Phasic
and Tonic EDA levels in terms of percentage. The important events that cause or are
expected to cause a change in the affect or stress level of the subject are marked. A
correlation between the responses in HR and EDA Tonic is observed. For instance, the
HR of the participant is seen to rise when the experimenter takes away one of his colored
goldfish, and eats it. During this time, the Tonic EDA also shows a rise (figure 13).
Another interesting event where the HR of the child rose was when all his goldfish was
taken away by the experimenter. This event also observes a rise in the Tonic EDA level.
However, at the end of the Inter-Activity Interval, similar to the HR falling back to the
baseline level, the EDA Tonic level also dropped down.
Figure 13 Temporal Point-to-Point Analysis – EDA – Subject 102 – Activity Set-2
Correlation between Physiology and Behavioral Gestures
The correlation between physiology and behavioral gestures can be better understood by
taking a closer look at the two features in detail: HR and Tonic EDA levels.
For figure 15, the X-axis marks the time in seconds while the Y-axis is used to indicate
the Phasic and Tonic EDA levels in terms of percentage. A rise in the HR and Tonic
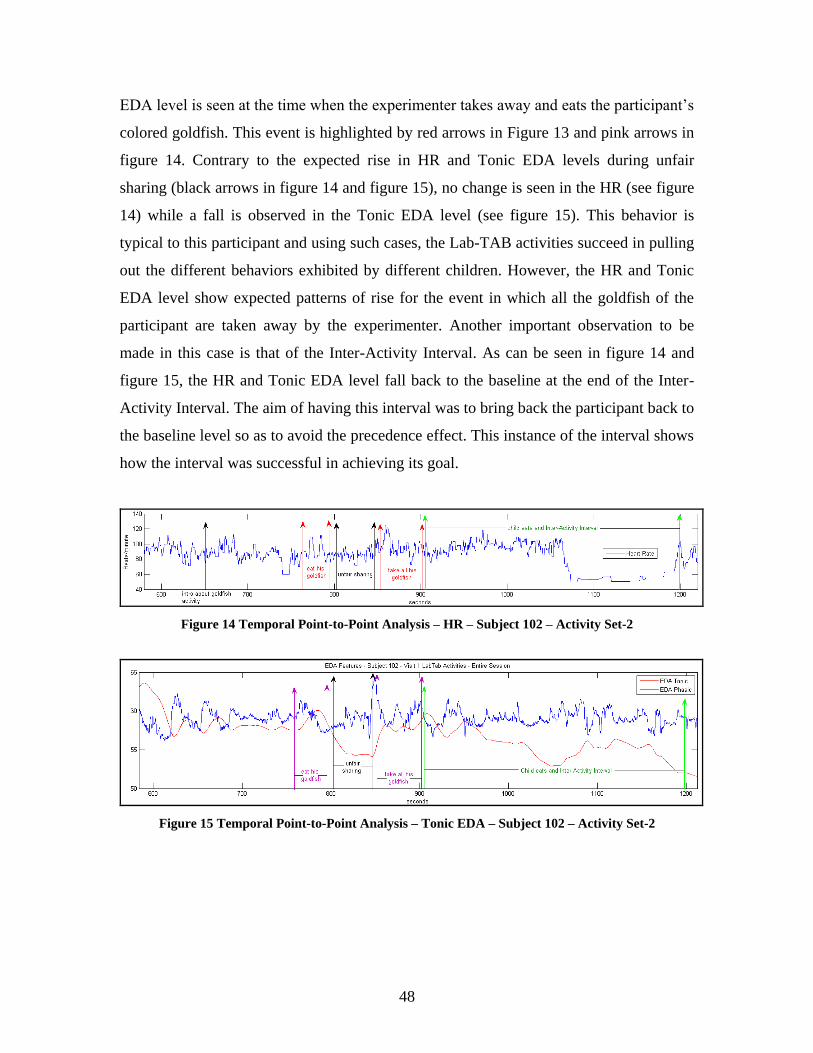
48
EDA level is seen at the time when the experimenter takes away and eats the participant’s
colored goldfish. This event is highlighted by red arrows in Figure 13 and pink arrows in
figure 14. Contrary to the expected rise in HR and Tonic EDA levels during unfair
sharing (black arrows in figure 14 and figure 15), no change is seen in the HR (see figure
14) while a fall is observed in the Tonic EDA level (see figure 15). This behavior is
typical to this participant and using such cases, the Lab-TAB activities succeed in pulling
out the different behaviors exhibited by different children. However, the HR and Tonic
EDA level show expected patterns of rise for the event in which all the goldfish of the
participant are taken away by the experimenter. Another important observation to be
made in this case is that of the Inter-Activity Interval. As can be seen in figure 14 and
figure 15, the HR and Tonic EDA level fall back to the baseline at the end of the Inter-
Activity Interval. The aim of having this interval was to bring back the participant back to
the baseline level so as to avoid the precedence effect. This instance of the interval shows
how the interval was successful in achieving its goal.
Figure 14 Temporal Point-to-Point Analysis – HR – Subject 102 – Activity Set-2
Figure 15 Temporal Point-to-Point Analysis – Tonic EDA – Subject 102 – Activity Set-2
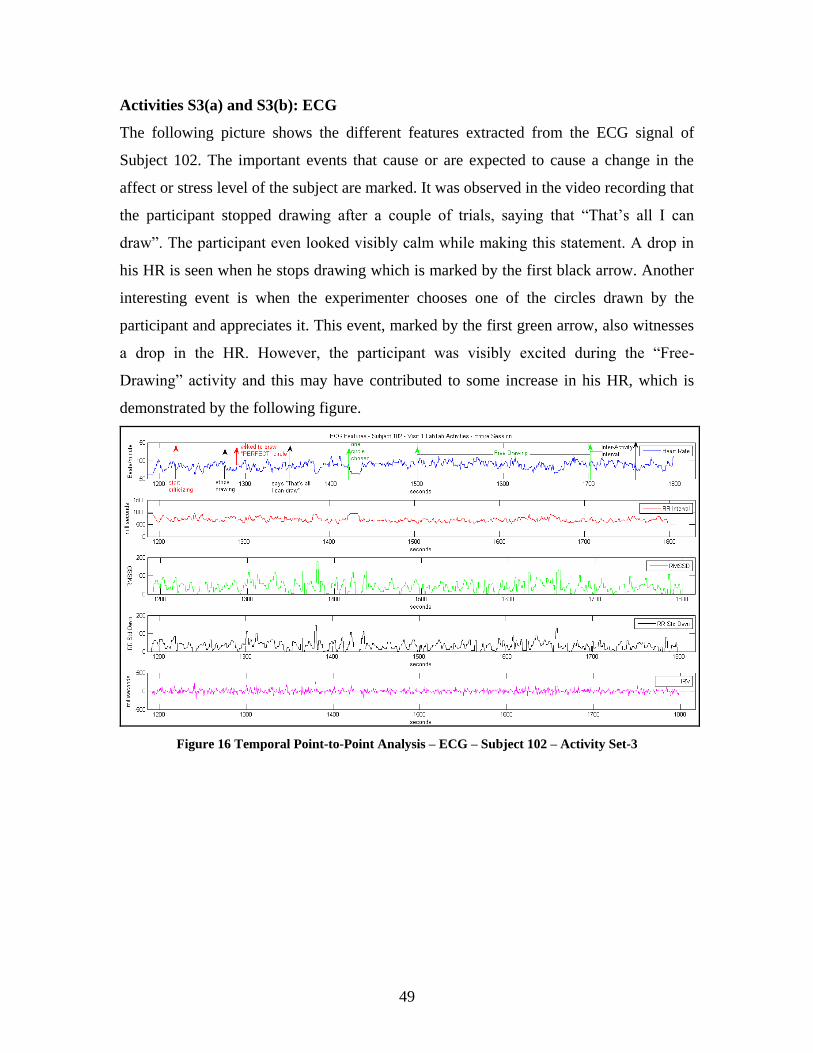
49
Activities S3(a) and S3(b): ECG
The following picture shows the different features extracted from the ECG signal of
Subject 102. The important events that cause or are expected to cause a change in the
affect or stress level of the subject are marked. It was observed in the video recording that
the participant stopped drawing after a couple of trials, saying that “That’s all I can
draw”. The participant even looked visibly calm while making this statement. A drop in
his HR is seen when he stops drawing which is marked by the first black arrow. Another
interesting event is when the experimenter chooses one of the circles drawn by the
participant and appreciates it. This event, marked by the first green arrow, also witnesses
a drop in the HR. However, the participant was visibly excited during the “Free-
Drawing” activity and this may have contributed to some increase in his HR, which is
demonstrated by the following figure.
Figure 16 Temporal Point-to-Point Analysis – ECG – Subject 102 – Activity Set-3
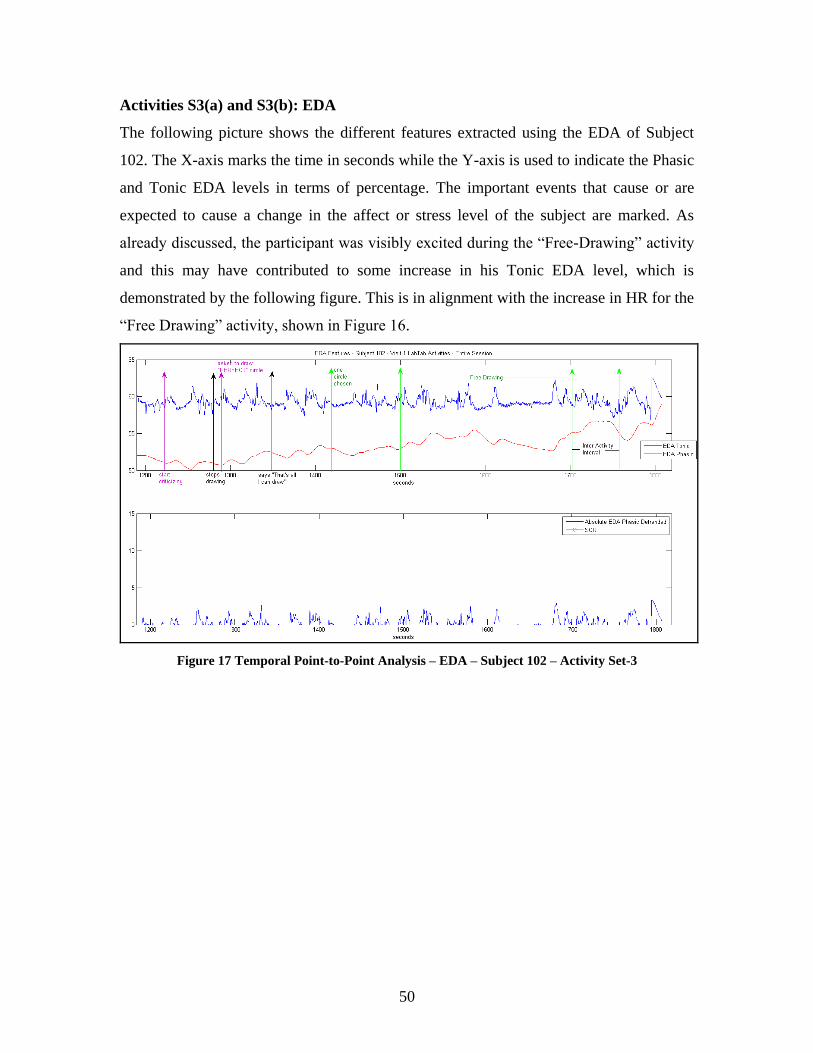
50
Activities S3(a) and S3(b): EDA
The following picture shows the different features extracted using the EDA of Subject
102. The X-axis marks the time in seconds while the Y-axis is used to indicate the Phasic
and Tonic EDA levels in terms of percentage. The important events that cause or are
expected to cause a change in the affect or stress level of the subject are marked. As
already discussed, the participant was visibly excited during the “Free-Drawing” activity
and this may have contributed to some increase in his Tonic EDA level, which is
demonstrated by the following figure. This is in alignment with the increase in HR for the
“Free Drawing” activity, shown in Figure 16.
Figure 17 Temporal Point-to-Point Analysis – EDA – Subject 102 – Activity Set-3
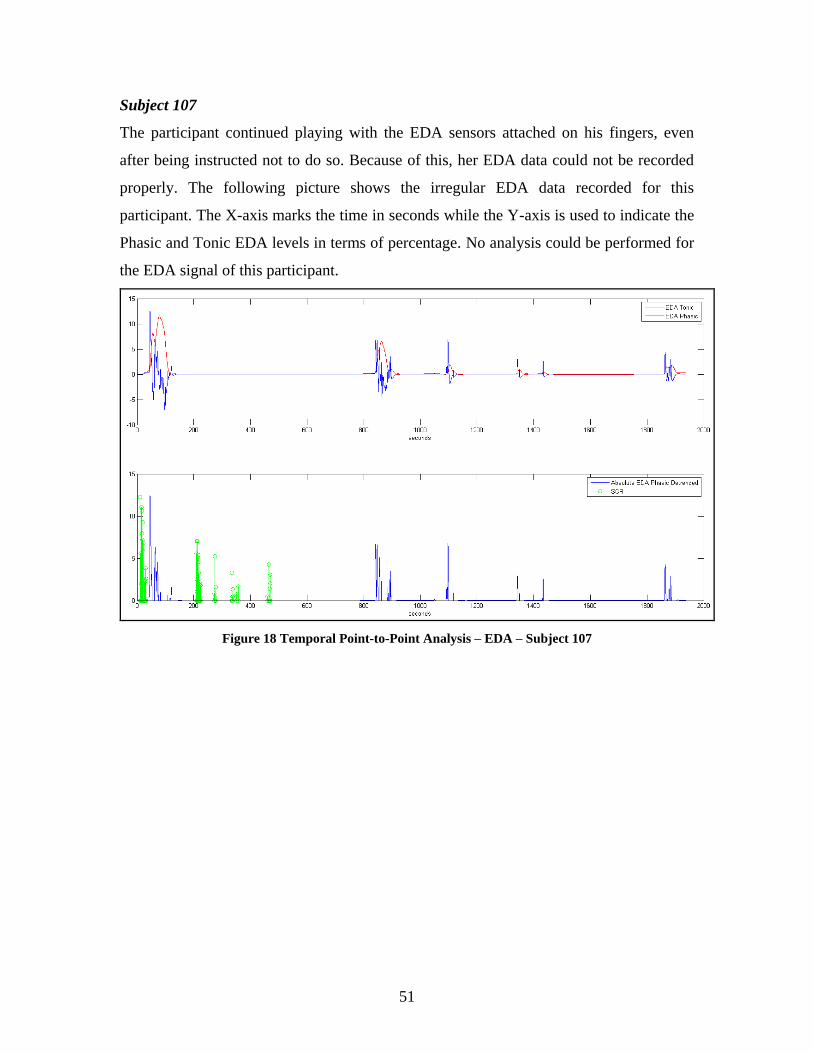
51
Subject 107
The participant continued playing with the EDA sensors attached on his fingers, even
after being instructed not to do so. Because of this, her EDA data could not be recorded
properly. The following picture shows the irregular EDA data recorded for this
participant. The X-axis marks the time in seconds while the Y-axis is used to indicate the
Phasic and Tonic EDA levels in terms of percentage. No analysis could be performed for
the EDA signal of this participant.
Figure 18 Temporal Point-to-Point Analysis – EDA – Subject 107
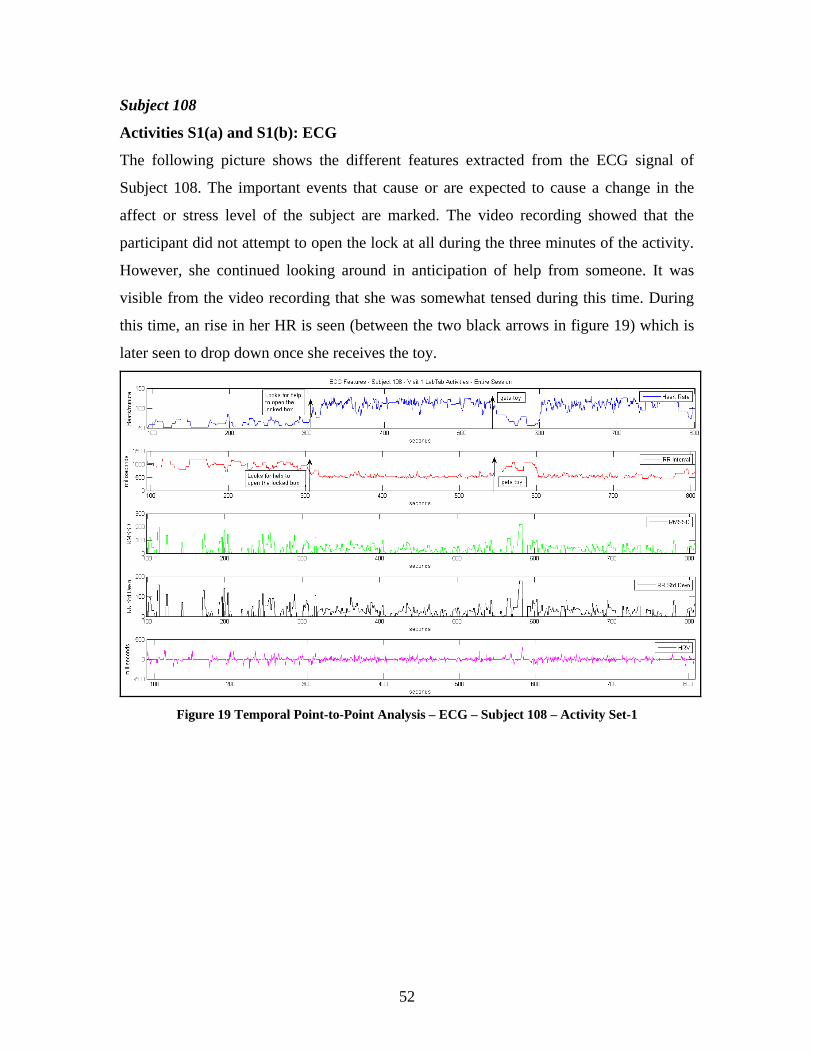
52
Subject 108
Activities S1(a) and S1(b): ECG
The following picture shows the different features extracted from the ECG signal of
Subject 108. The important events that cause or are expected to cause a change in the
affect or stress level of the subject are marked. The video recording showed that the
participant did not attempt to open the lock at all during the three minutes of the activity.
However, she continued looking around in anticipation of help from someone. It was
visible from the video recording that she was somewhat tensed during this time. During
this time, an rise in her HR is seen (between the two black arrows in figure 19) which is
later seen to drop down once she receives the toy.
Figure 19 Temporal Point-to-Point Analysis – ECG – Subject 108 – Activity Set-1
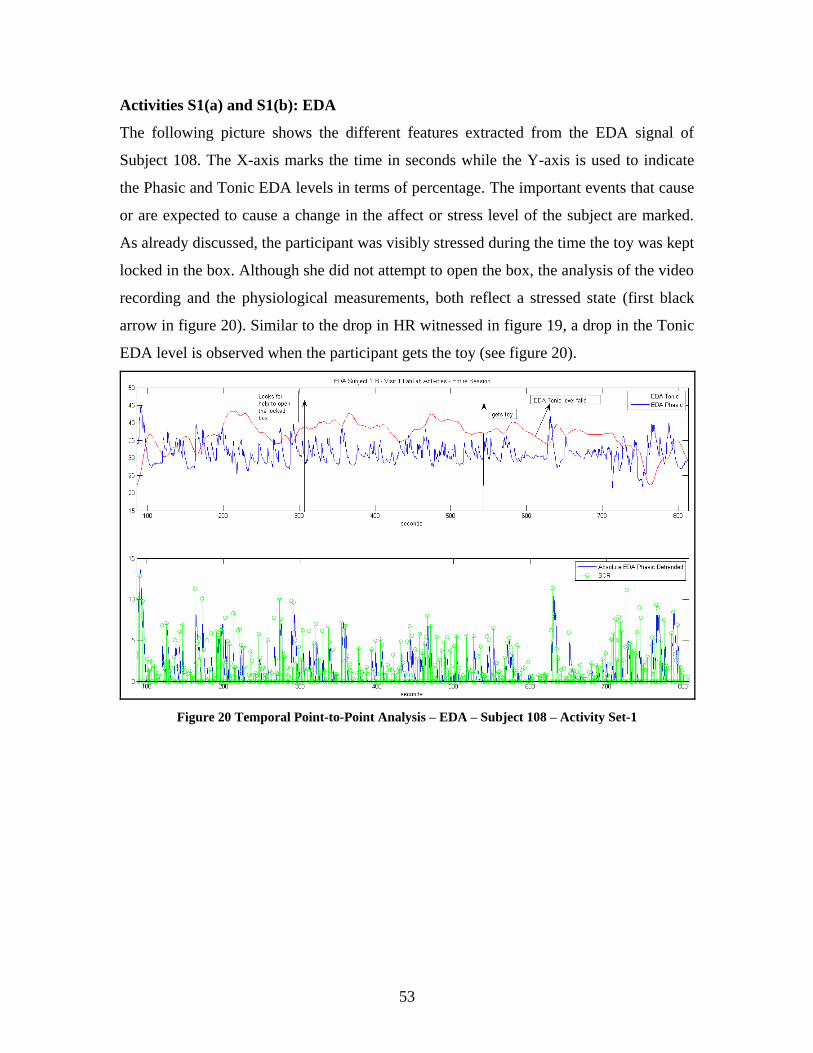
53
Activities S1(a) and S1(b): EDA
The following picture shows the different features extracted from the EDA signal of
Subject 108. The X-axis marks the time in seconds while the Y-axis is used to indicate
the Phasic and Tonic EDA levels in terms of percentage. The important events that cause
or are expected to cause a change in the affect or stress level of the subject are marked.
As already discussed, the participant was visibly stressed during the time the toy was kept
locked in the box. Although she did not attempt to open the box, the analysis of the video
recording and the physiological measurements, both reflect a stressed state (first black
arrow in figure 20). Similar to the drop in HR witnessed in figure 19, a drop in the Tonic
EDA level is observed when the participant gets the toy (see figure 20).
Figure 20 Temporal Point-to-Point Analysis – EDA – Subject 108 – Activity Set-1
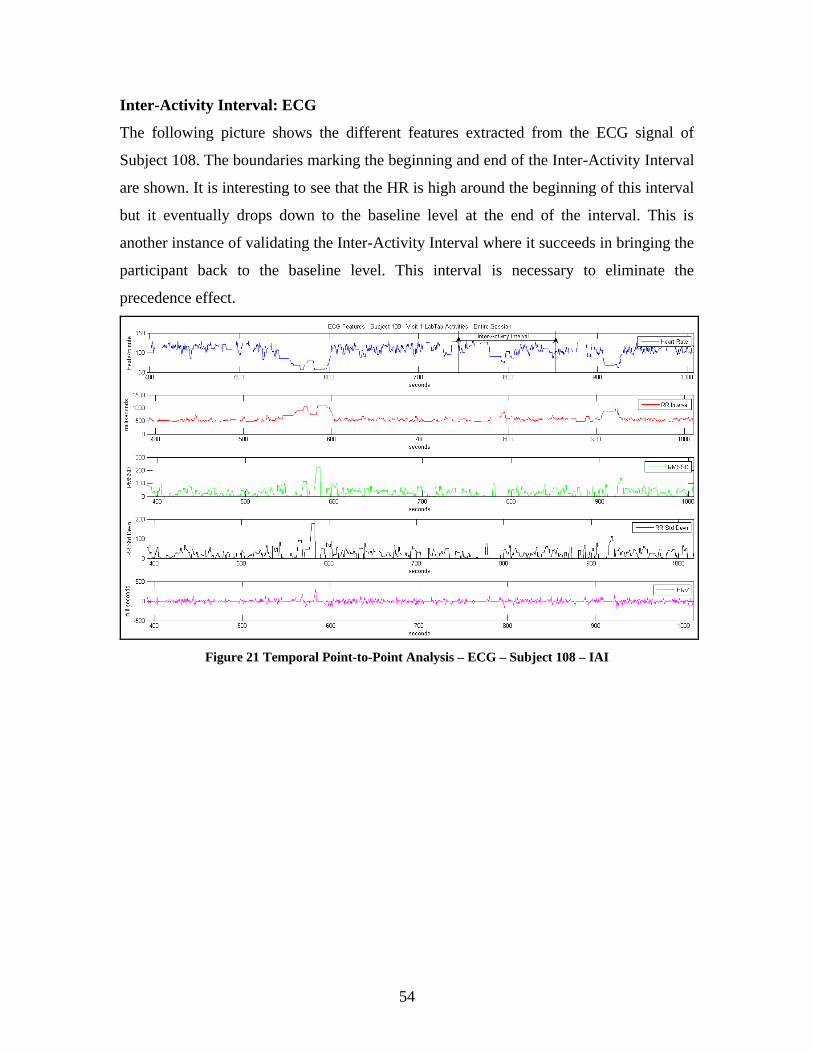
54
Inter-Activity Interval: ECG
The following picture shows the different features extracted from the ECG signal of
Subject 108. The boundaries marking the beginning and end of the Inter-Activity Interval
are shown. It is interesting to see that the HR is high around the beginning of this interval
but it eventually drops down to the baseline level at the end of the interval. This is
another instance of validating the Inter-Activity Interval where it succeeds in bringing the
participant back to the baseline level. This interval is necessary to eliminate the
precedence effect.
Figure 21 Temporal Point-to-Point Analysis – ECG – Subject 108 – IAI
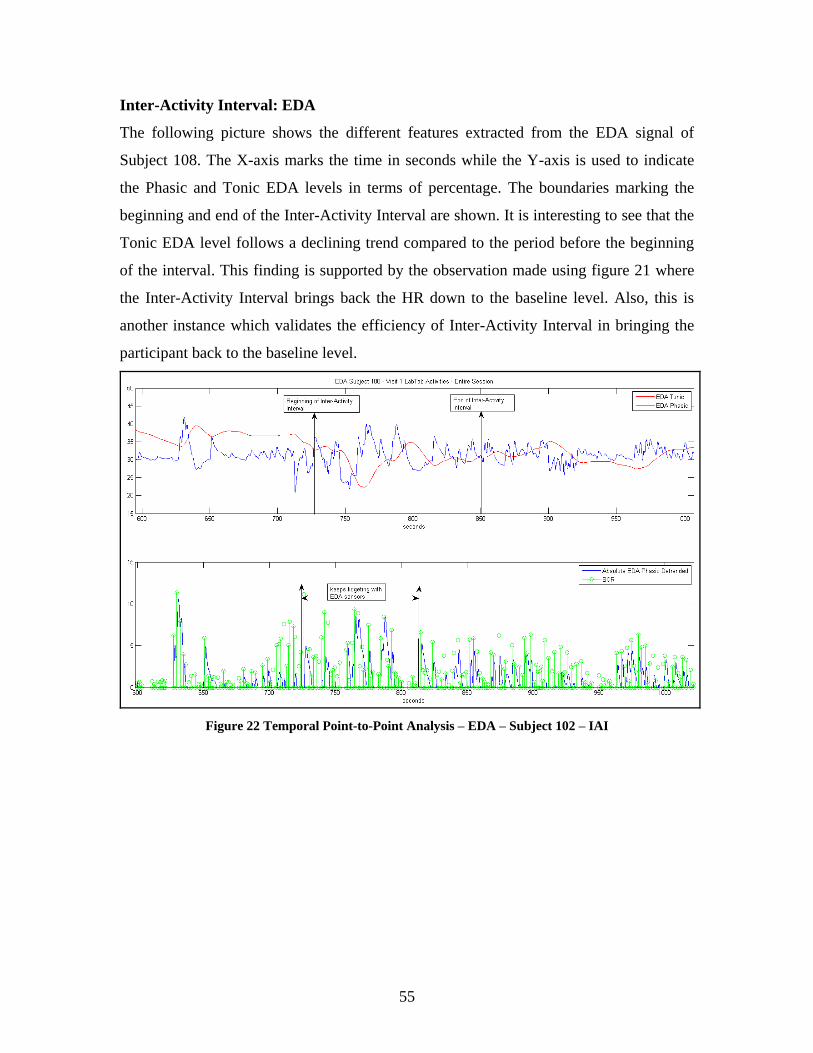
55
Inter-Activity Interval: EDA
The following picture shows the different features extracted from the EDA signal of
Subject 108. The X-axis marks the time in seconds while the Y-axis is used to indicate
the Phasic and Tonic EDA levels in terms of percentage. The boundaries marking the
beginning and end of the Inter-Activity Interval are shown. It is interesting to see that the
Tonic EDA level follows a declining trend compared to the period before the beginning
of the interval. This finding is supported by the observation made using figure 21 where
the Inter-Activity Interval brings back the HR down to the baseline level. Also, this is
another instance which validates the efficiency of Inter-Activity Interval in bringing the
participant back to the baseline level.
Figure 22 Temporal Point-to-Point Analysis – EDA – Subject 102 – IAI
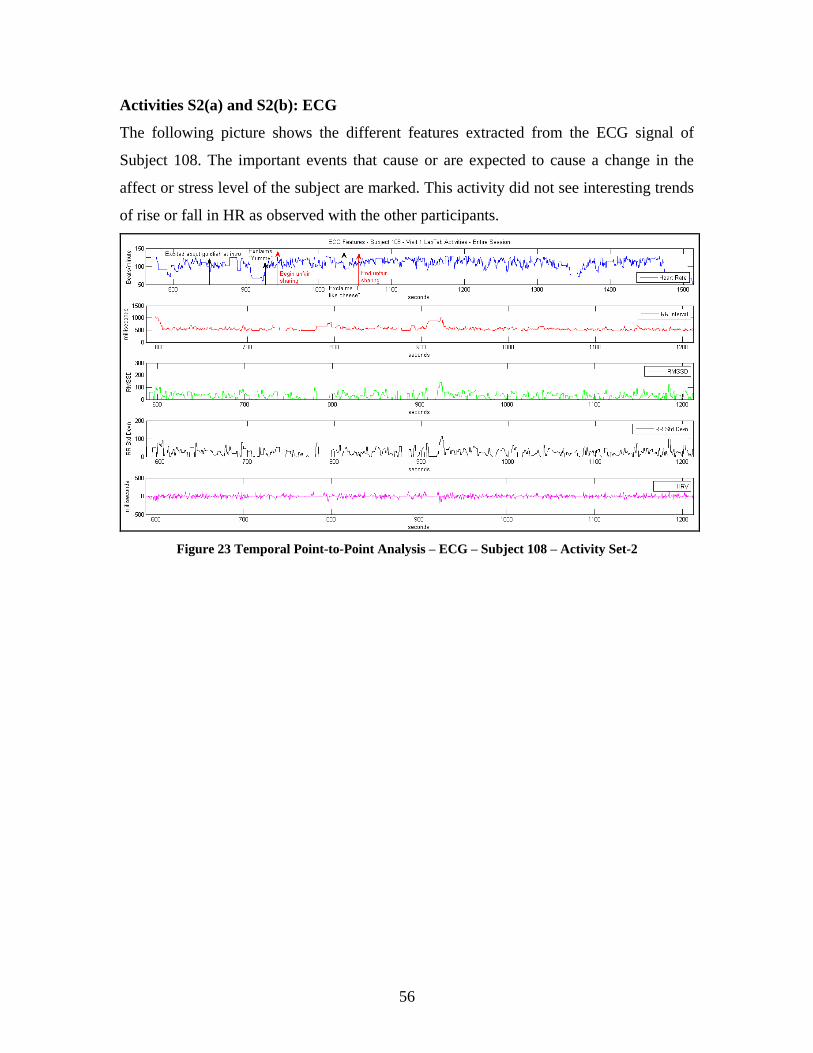
56
Activities S2(a) and S2(b): ECG
The following picture shows the different features extracted from the ECG signal of
Subject 108. The important events that cause or are expected to cause a change in the
affect or stress level of the subject are marked. This activity did not see interesting trends
of rise or fall in HR as observed with the other participants.
Figure 23 Temporal Point-to-Point Analysis – ECG – Subject 108 – Activity Set-2
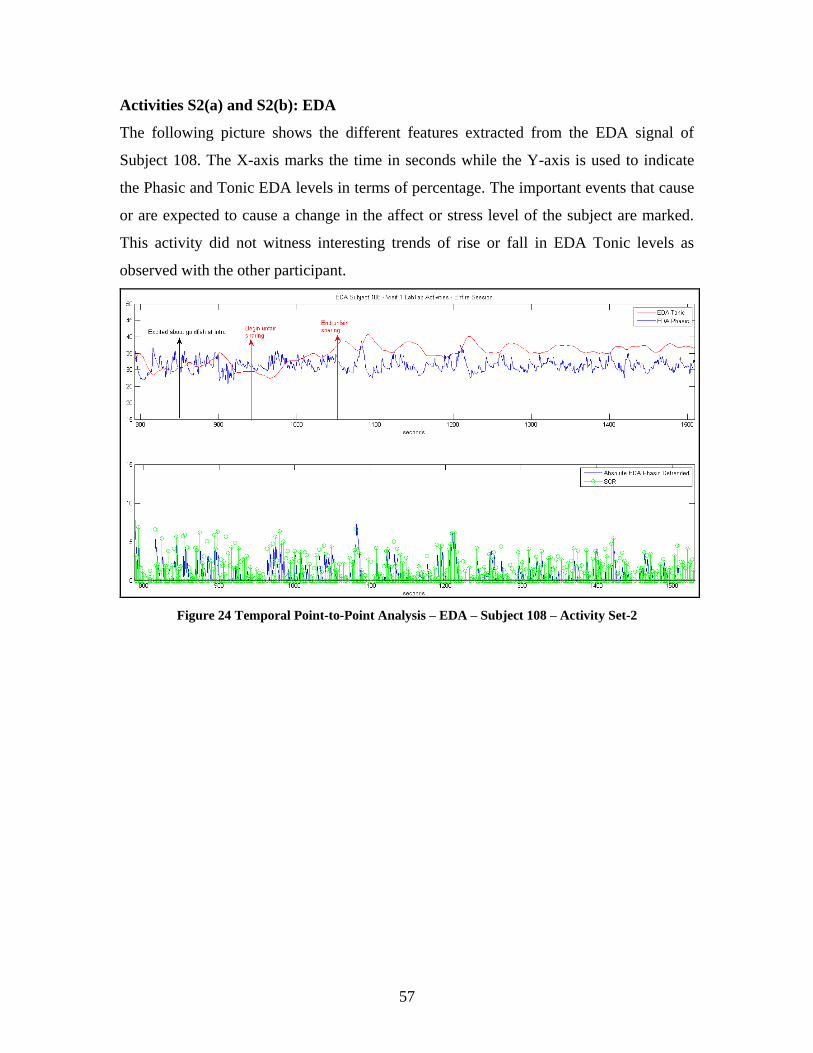
57
Activities S2(a) and S2(b): EDA
The following picture shows the different features extracted from the EDA signal of
Subject 108. The X-axis marks the time in seconds while the Y-axis is used to indicate
the Phasic and Tonic EDA levels in terms of percentage. The important events that cause
or are expected to cause a change in the affect or stress level of the subject are marked.
This activity did not witness interesting trends of rise or fall in EDA Tonic levels as
observed with the other participant.
Figure 24 Temporal Point-to-Point Analysis – EDA – Subject 108 – Activity Set-2
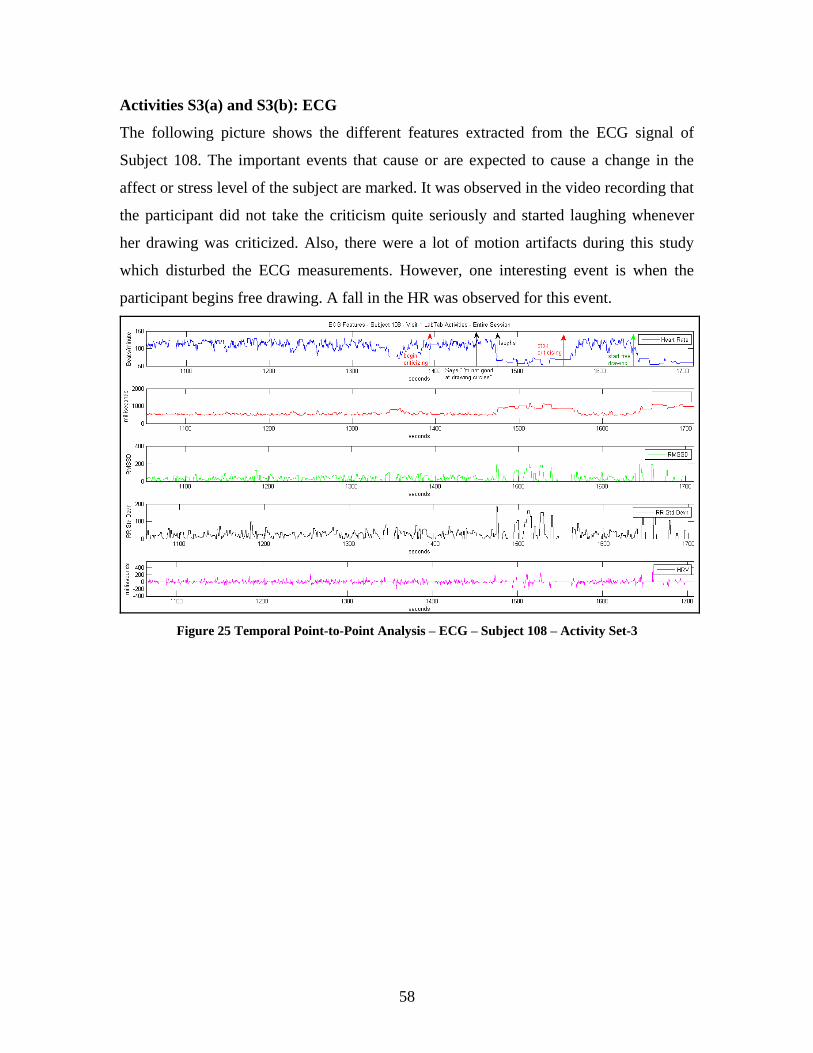
58
Activities S3(a) and S3(b): ECG
The following picture shows the different features extracted from the ECG signal of
Subject 108. The important events that cause or are expected to cause a change in the
affect or stress level of the subject are marked. It was observed in the video recording that
the participant did not take the criticism quite seriously and started laughing whenever
her drawing was criticized. Also, there were a lot of motion artifacts during this study
which disturbed the ECG measurements. However, one interesting event is when the
participant begins free drawing. A fall in the HR was observed for this event.
Figure 25 Temporal Point-to-Point Analysis – ECG – Subject 108 – Activity Set-3
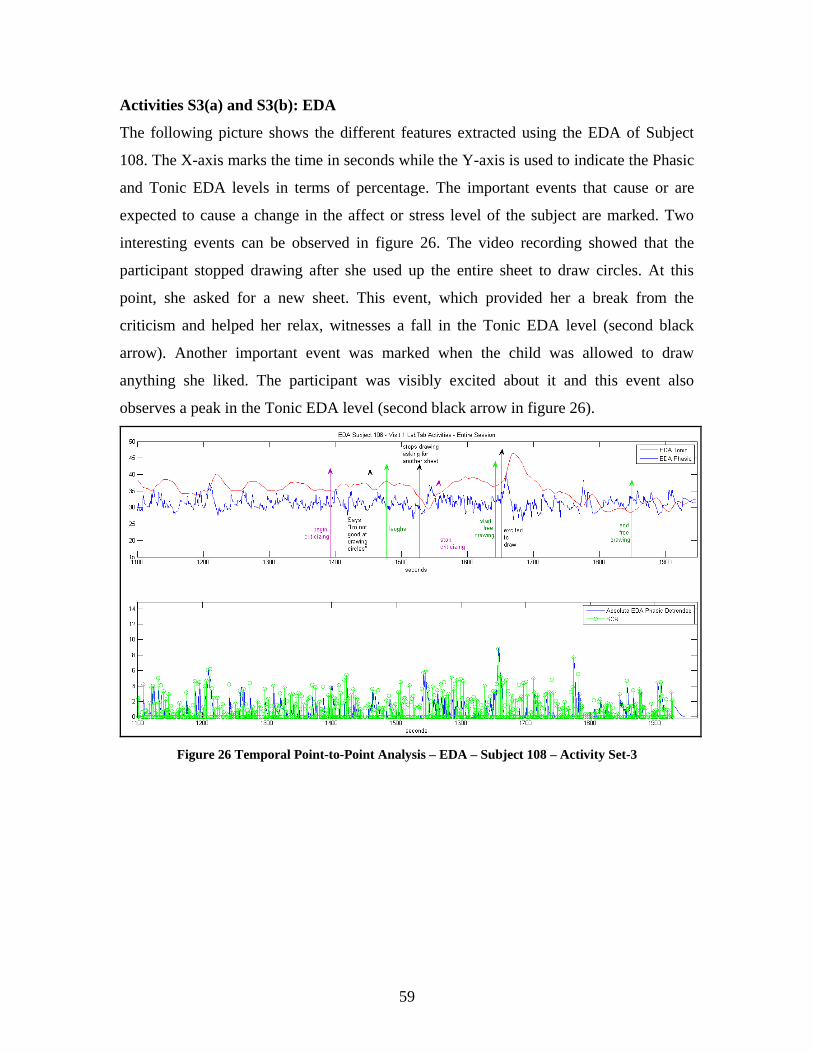
59
Activities S3(a) and S3(b): EDA
The following picture shows the different features extracted using the EDA of Subject
108. The X-axis marks the time in seconds while the Y-axis is used to indicate the Phasic
and Tonic EDA levels in terms of percentage. The important events that cause or are
expected to cause a change in the affect or stress level of the subject are marked. Two
interesting events can be observed in figure 26. The video recording showed that the
participant stopped drawing after she used up the entire sheet to draw circles. At this
point, she asked for a new sheet. This event, which provided her a break from the
criticism and helped her relax, witnesses a fall in the Tonic EDA level (second black
arrow). Another important event was marked when the child was allowed to draw
anything she liked. The participant was visibly excited about it and this event also
observes a peak in the Tonic EDA level (second black arrow in figure 26).
Figure 26 Temporal Point-to-Point Analysis – EDA – Subject 108 – Activity Set-3
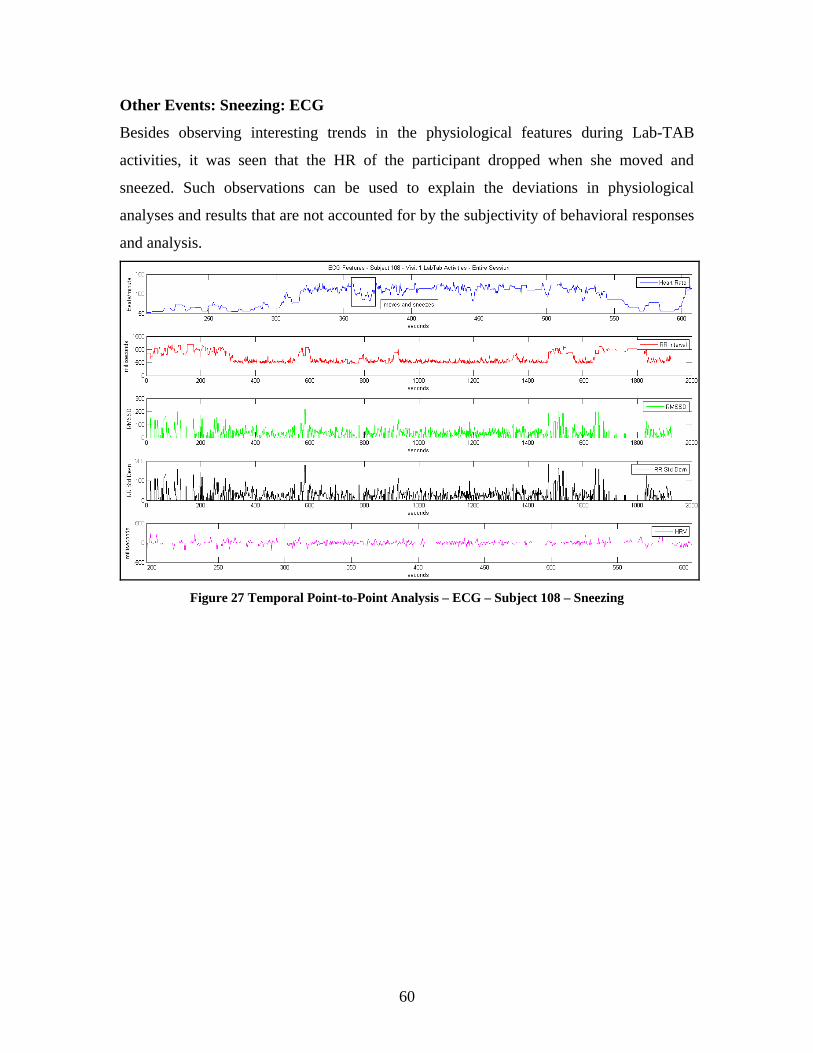
60
Other Events: Sneezing: ECG
Besides observing interesting trends in the physiological features during Lab-TAB
activities, it was seen that the HR of the participant dropped when she moved and
sneezed. Such observations can be used to explain the deviations in physiological
analyses and results that are not accounted for by the subjectivity of behavioral responses
and analysis.
Figure 27 Temporal Point-to-Point Analysis – ECG – Subject 108 – Sneezing
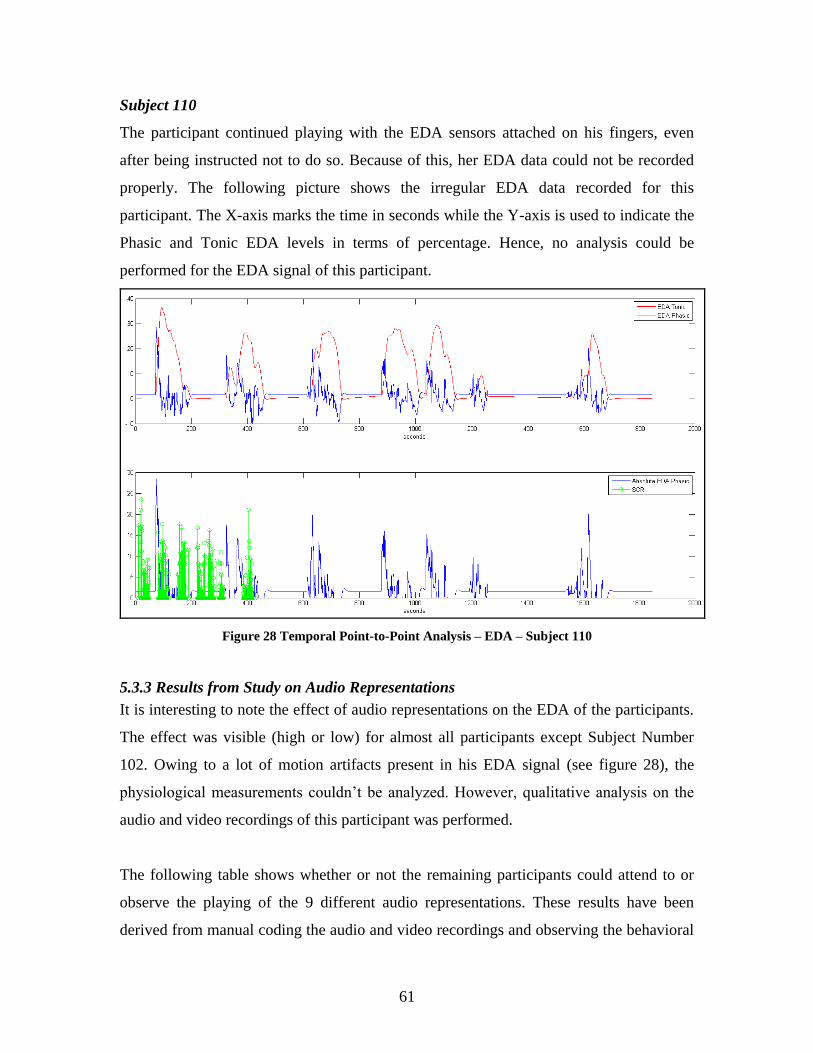
61
Subject 110
The participant continued playing with the EDA sensors attached on his fingers, even
after being instructed not to do so. Because of this, her EDA data could not be recorded
properly. The following picture shows the irregular EDA data recorded for this
participant. The X-axis marks the time in seconds while the Y-axis is used to indicate the
Phasic and Tonic EDA levels in terms of percentage. Hence, no analysis could be
performed for the EDA signal of this participant.
Figure 28 Temporal Point-to-Point Analysis – EDA – Subject 110
5.3.3 Results from Study on Audio Representations
It is interesting to note the effect of audio representations on the EDA of the participants.
The effect was visible (high or low) for almost all participants except Subject Number
102. Owing to a lot of motion artifacts present in his EDA signal (see figure 28), the
physiological measurements couldn’t be analyzed. However, qualitative analysis on the
audio and video recordings of this participant was performed.
The following table shows whether or not the remaining participants could attend to or
observe the playing of the 9 different audio representations. These results have been
derived from manual coding the audio and video recordings and observing the behavioral
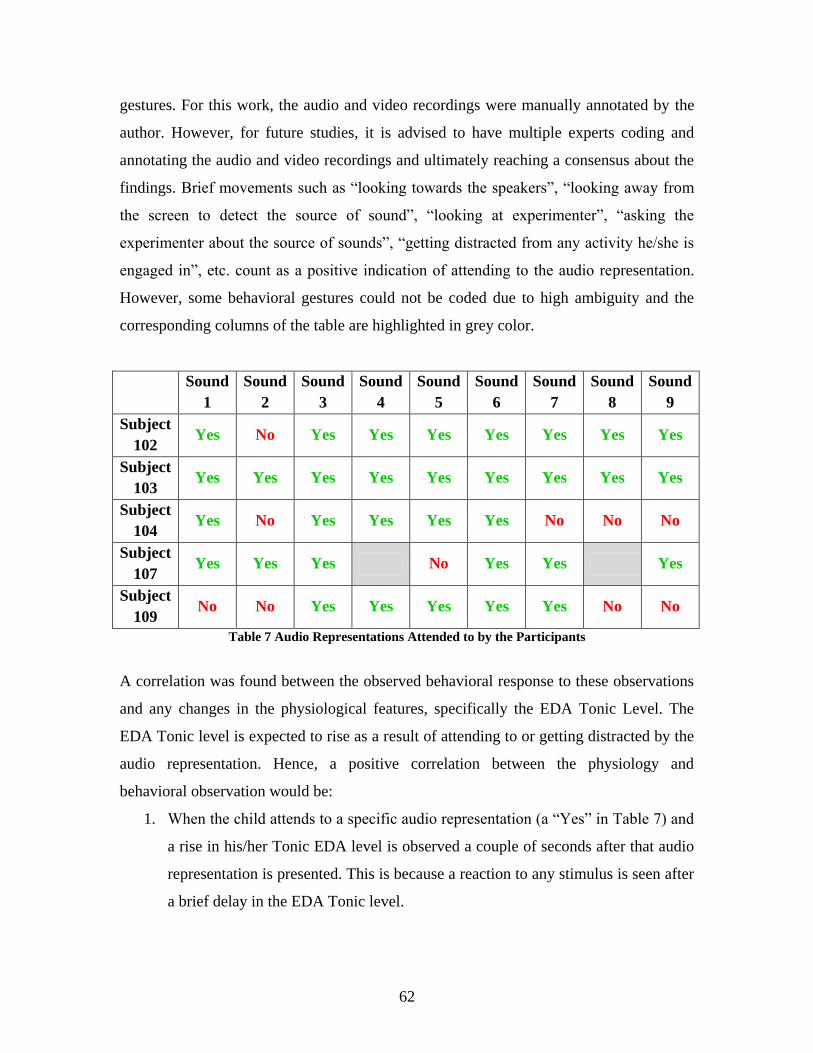
62
gestures. For this work, the audio and video recordings were manually annotated by the
author. However, for future studies, it is advised to have multiple experts coding and
annotating the audio and video recordings and ultimately reaching a consensus about the
findings. Brief movements such as “looking towards the speakers”, “looking away from
the screen to detect the source of sound”, “looking at experimenter”, “asking the
experimenter about the source of sounds”, “getting distracted from any activity he/she is
engaged in”, etc. count as a positive indication of attending to the audio representation.
However, some behavioral gestures could not be coded due to high ambiguity and the
corresponding columns of the table are highlighted in grey color.
Sound
1
Sound
2
Sound
3
Sound
4
Sound
5
Sound
6
Sound
7
Sound
8
Sound
9
Subject
102 Yes No Yes Yes Yes Yes Yes Yes Yes
Subject
103 Yes Yes Yes Yes Yes Yes Yes Yes Yes
Subject
104 Yes No Yes Yes Yes Yes No No No
Subject
107 Yes Yes Yes No Yes Yes Yes
Subject
109 No No Yes Yes Yes Yes Yes No No
Table 7 Audio Representations Attended to by the Participants
A correlation was found between the observed behavioral response to these observations
and any changes in the physiological features, specifically the EDA Tonic Level. The
EDA Tonic level is expected to rise as a result of attending to or getting distracted by the
audio representation. Hence, a positive correlation between the physiology and
behavioral observation would be:
1. When the child attends to a specific audio representation (a “Yes” in Table 7) and
a rise in his/her Tonic EDA level is observed a couple of seconds after that audio
representation is presented. This is because a reaction to any stimulus is seen after
a brief delay in the EDA Tonic level.
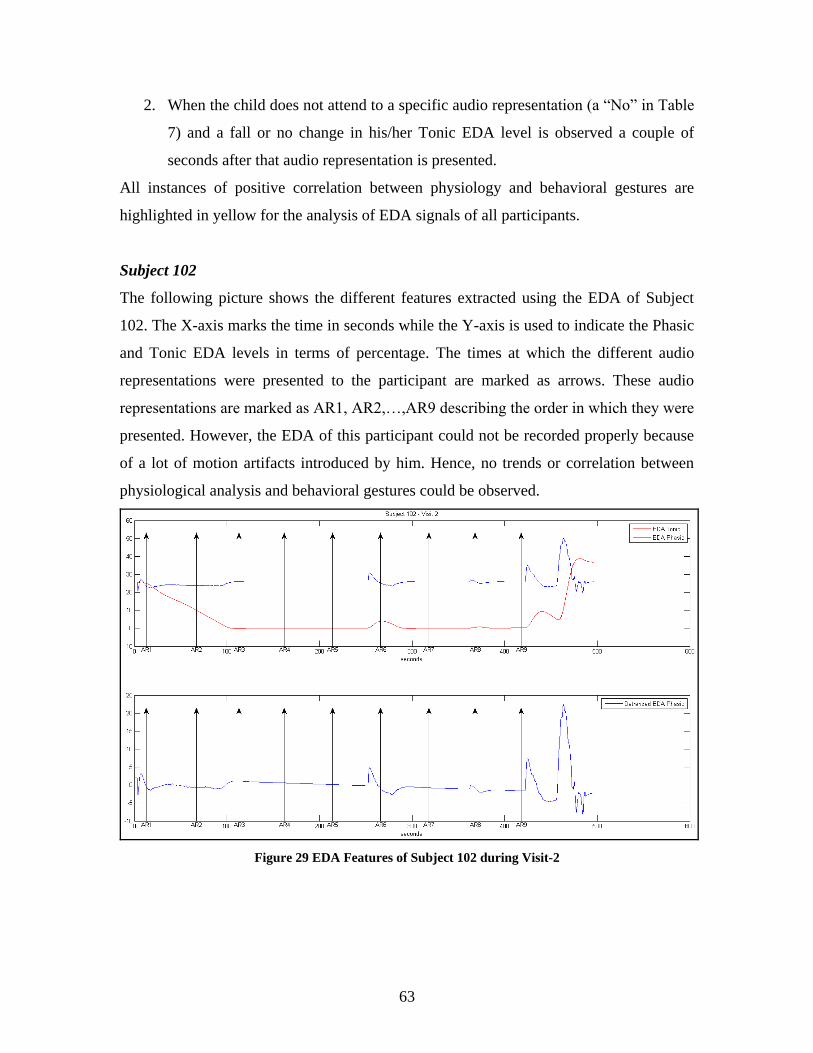
63
2. When the child does not attend to a specific audio representation (a “No” in Table
7) and a fall or no change in his/her Tonic EDA level is observed a couple of
seconds after that audio representation is presented.
All instances of positive correlation between physiology and behavioral gestures are
highlighted in yellow for the analysis of EDA signals of all participants.
Subject 102
The following picture shows the different features extracted using the EDA of Subject
102. The X-axis marks the time in seconds while the Y-axis is used to indicate the Phasic
and Tonic EDA levels in terms of percentage. The times at which the different audio
representations were presented to the participant are marked as arrows. These audio
representations are marked as AR1, AR2,…,AR9 describing the order in which they were
presented. However, the EDA of this participant could not be recorded properly because
of a lot of motion artifacts introduced by him. Hence, no trends or correlation between
physiological analysis and behavioral gestures could be observed.
Figure 29 EDA Features of Subject 102 during Visit-2
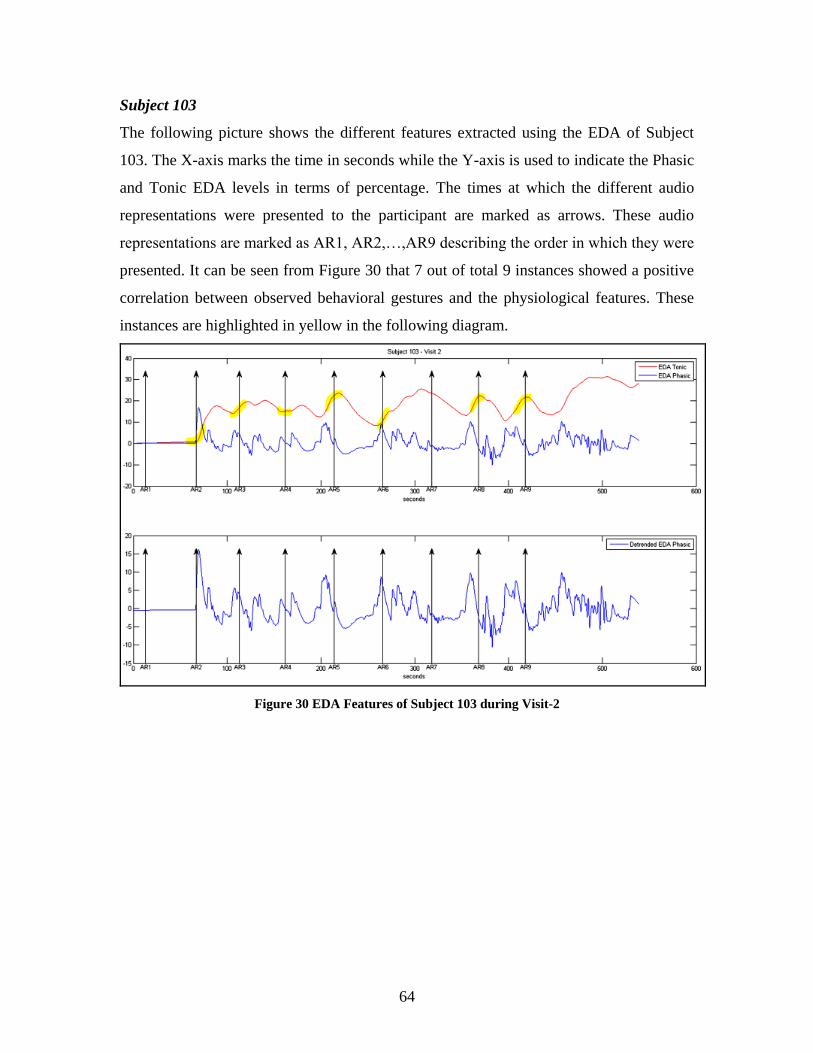
64
Subject 103
The following picture shows the different features extracted using the EDA of Subject
103. The X-axis marks the time in seconds while the Y-axis is used to indicate the Phasic
and Tonic EDA levels in terms of percentage. The times at which the different audio
representations were presented to the participant are marked as arrows. These audio
representations are marked as AR1, AR2,…,AR9 describing the order in which they were
presented. It can be seen from Figure 30 that 7 out of total 9 instances showed a positive
correlation between observed behavioral gestures and the physiological features. These
instances are highlighted in yellow in the following diagram.
Figure 30 EDA Features of Subject 103 during Visit-2
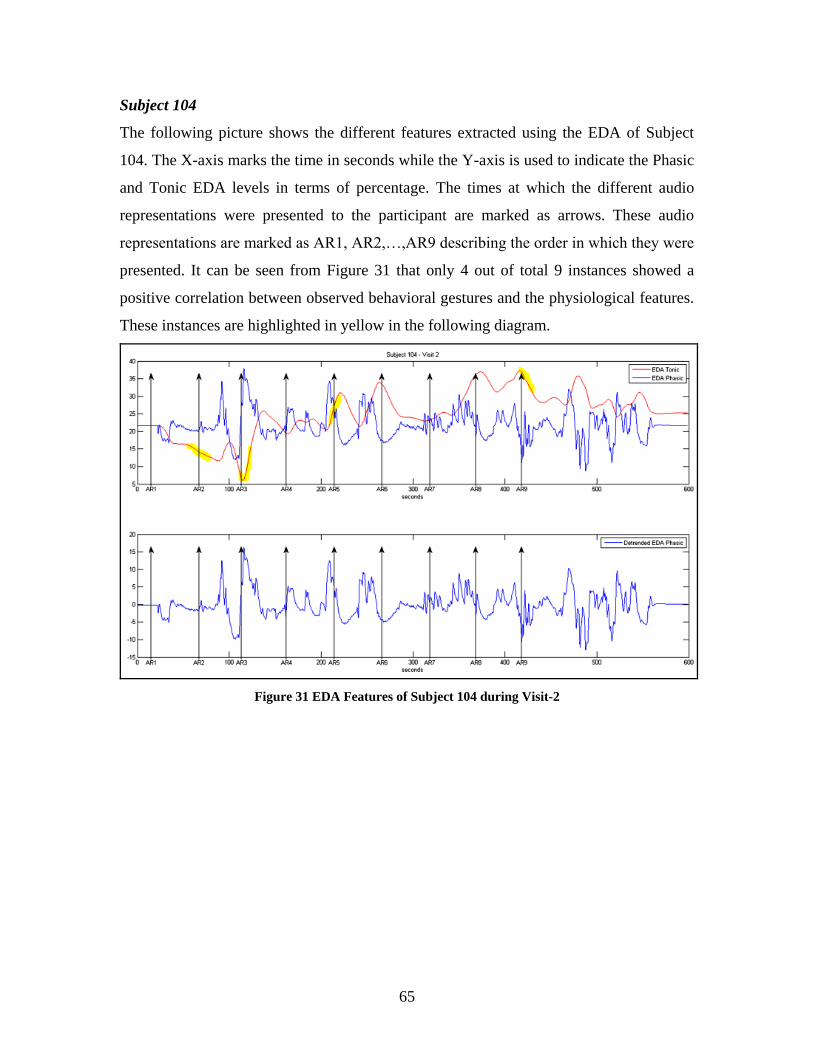
65
Subject 104
The following picture shows the different features extracted using the EDA of Subject
104. The X-axis marks the time in seconds while the Y-axis is used to indicate the Phasic
and Tonic EDA levels in terms of percentage. The times at which the different audio
representations were presented to the participant are marked as arrows. These audio
representations are marked as AR1, AR2,…,AR9 describing the order in which they were
presented. It can be seen from Figure 31 that only 4 out of total 9 instances showed a
positive correlation between observed behavioral gestures and the physiological features.
These instances are highlighted in yellow in the following diagram.
Figure 31 EDA Features of Subject 104 during Visit-2
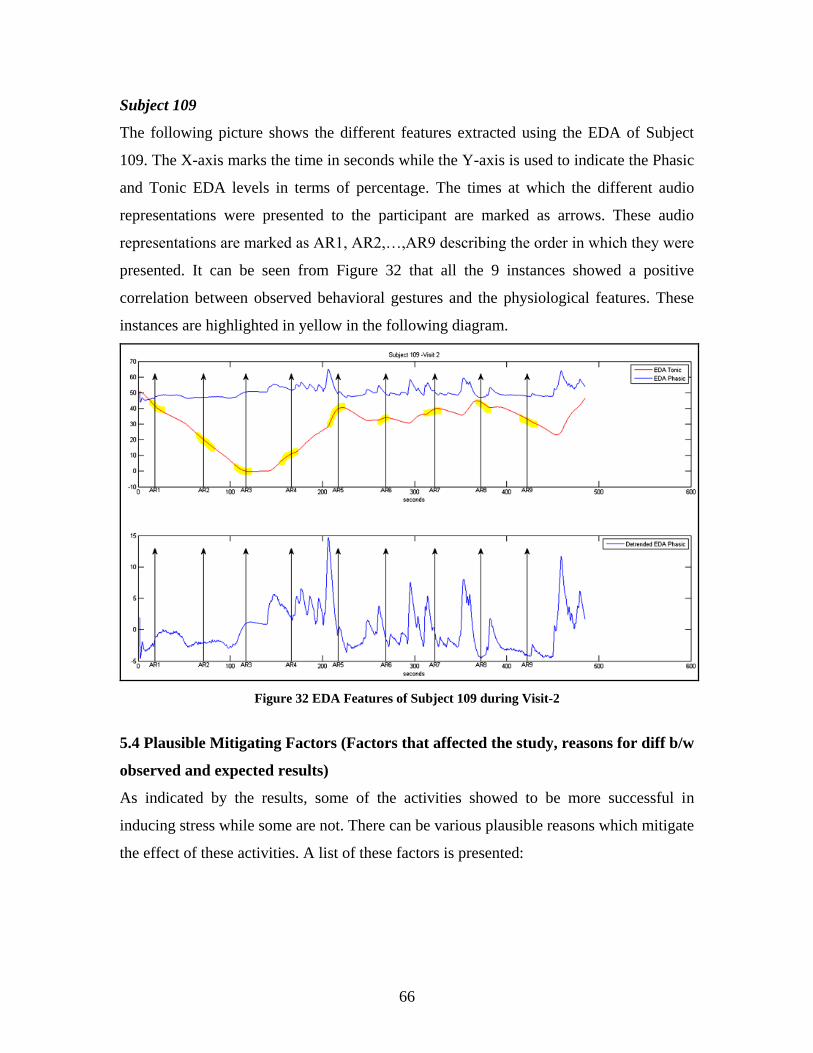
66
Subject 109
The following picture shows the different features extracted using the EDA of Subject
109. The X-axis marks the time in seconds while the Y-axis is used to indicate the Phasic
and Tonic EDA levels in terms of percentage. The times at which the different audio
representations were presented to the participant are marked as arrows. These audio
representations are marked as AR1, AR2,…,AR9 describing the order in which they were
presented. It can be seen from Figure 32 that all the 9 instances showed a positive
correlation between observed behavioral gestures and the physiological features. These
instances are highlighted in yellow in the following diagram.
Figure 32 EDA Features of Subject 109 during Visit-2
5.4 Plausible Mitigating Factors (Factors that affected the study, reasons for diff b/w
observed and expected results)
As indicated by the results, some of the activities showed to be more successful in
inducing stress while some are not. There can be various plausible reasons which mitigate
the effect of these activities. A list of these factors is presented:
67
1. Order of Activities
In all the studies, the order of in which the activities were performed was the
same. It may happen that after some time, the participant already knows the
pattern that the experimenter would first frustrate him, and later make him feel
better. So, by the time the participant reaches the third activity, he may expect the
pattern to get repeated, and is prepared to “feel stressed”.
2. Order of Audio Representations
The order of presenting the audio representations was also the same for all
studies. It was observed that this order induced boredom in the participants, and
many of them could not distinguish between the variants of some audio
representations. For instance, some participants failed to notice the change in
amplitudes of the three cat meow sounds.
3. Timing of Audio Representations
It was observed that one of the participants showed an expectancy bias. The
participant understood the timing and frequency of presenting the audio
representations (stimuli) by the time AR 7 was presented to him. Before AR8 was
presented, he was already staring at the speakers, expecting to hear some audio
from them. Presenting the audio representations in a more randomized order can
eliminate this expectancy bias.
4. Video clip used in Visit-2
Some of the participants even found the video clip used for the Visit-2 study very
boring. This could have affected their attending capability and felt emotions for
each audio representation.
5. Subjective Nature of the Studies
It is important to note that the study and its results are subjective, and hence
deriving a concrete universal pattern from such a small population size is not
possible.

68
5.5 Findings and Insights Gained
The following insights gained from these studies may be helpful for designing future
studies for children with ASD:
1. The mitigating factors listed in section 5.4 need to be controlled, because an effect
of these factors was seen in the results of first and second iterations of the study.
2. It is important to know the temperament envelope for each activity used. This
temperament envelope would enable marking the important events which are
expected to induce stress/anger/frustration, and thus would be helpful in defining
the time boundaries for physiological measurements.
3. The order of presenting audio representations can be randomized to offer variety.
4. The video clip used in Visit-2 of the study can be replaced with a more
interesting, but neutral (not inducing any extra emotion) clip.
5. The equipment, apparatus setup and methodology of the study should consider the
following points in order to be more robust:
a. A lot of cases were marked where the participants tried to lean over the
table in order to either open the box or snatch goldfish, or draw circles.
This introduced artifacts in the physiological recordings. Care must be
taken that artifacts should be minimal. For this, either the current set of
activities can be replaced with another set which guarantees minimal
physical effort, or the current activities can be modified to require even
lesser physical movement. However, it is important to note that complete
elimination of motion artifacts may not be may practical. For instance, it
may be impossible to expect the participant to stay stationary throughout
each activity, especially in cases when he is excited (for e.g. while
drawing) or when he is aroused (for e.g. while trying to snatch the
goldfish).
b. Some participants found wearing the equipment uncomfortable. The
current equipment can be replaced with a different sensor which can
record both the ECG, and EDA data. The new sensor should also be more
comfortable to wear.
69
c. Before beginning the study, it should be learned from the participants if
they recently had a heavy breakfast/lunch, and what they had for it.
Accordingly, the experimenter should be able to re-design the activity so
as to cause maximal frustration.
6. In order to derive a clearer pattern in the response to the activities, the subject
pool needs to be widened. A higher number of participants would help in finding
the commonalities in behavior. The Developmental Psychology literature uses a
subject pool ranging from 50-100 participants in order to find the responding
pattern. Still, these studies observe groups of responses instead of a standard
responding profile.
7. No special difference in the behavioral patterns was observed which could be
accounted for by the gender of the participants.
8. However, it was noticed that the older participants (around 5 years of age)
followed the instructions more seriously than the younger participants (around 3
years of age). The younger participants were comparatively more distracted
during the sessions. Another important point to be noted is that the older
participants were more capable of regulating their emotional state. For instance,
the older participants showed a larger variation in their behavioral responses.
Also, the extent to which the activities could induce stress in the older participants
was comparatively more varied.
5.6 Conclusion
This chapter detailed the design of the user study and the results and insights obtained
from the two iterations for Visit-1 and Visit-2. As noted, the differences in participant
behaviors make the study and its analysis highly subjective. With a small number of
participants, it is difficult to observe a common response to the Lab-TAB activities used.
High variation was seen in the way each activity induced stress to the participants.
Knowing that the Lab-TAB activities already designed to pull out these differences and
variations, the results were not surprising. The insights gained from these studies can
prove to be helpful in designing the next iterations of the study, especially for children
with ASD.

70
Chapter 6: Stress Profile Generation
This chapter describes how a stress profile is generated for each participant, using Fuzzy
Logic.
6.1 Requirements for Stress Profile Generation System
One of the building blocks of the proposed framework is the creation of a stress profile
for each participant. For this, the derived physiological features would be taken as inputs
and a curve of the stress being experienced by the participant at any time would be
produced as the output. The subjective nature of the study and the differences in the
behavior of the participants result in different patterns of change in physiological
indicators’ values. Therefore, common or fixed calculations cannot be employed to
derive a stress profile for all the participants. The generation of the stress profile for each
participant needs a set of basic requirements to be met. These are outlined as follows:
1. A customized and unique stress profile or curve should be derived for each
participant based on their unique behavior patterns.
2. The stress curve should be adaptable to the future behavior patterns. This means
that the design logic should be flexible and should be able to acclimatize itself to
any new behavior patterns exhibited by the participant in the future.
3. The profile designing logic should be able to take as input any expert knowledge
and use it appropriately (aligned well with the physiological findings).
Different adaptive approaches such as genetic algorithms and neural networks can be
used to achieve a design that can produce a stress profile. However these approaches
suffer from some limitations and do not meet all the above listed criteria.
One of the basic limitations in using these conventional approaches is the difficulty in
clearly defining the initial parameters. For instance, subjective parameters such as stress,
HRV, etc. cannot be quantified. Other parameters such as the heart rate, EDL, RMSSD,
etc. also exist within a wide range of values. Simple boundaries for these values cannot
be defined in order to correlate them with stress or no stress. For e.g., an HR of 50bpm
71
and a HR of 120bpm would both imply unstable states. Moreover the normal range of HR
can vary from time-to-time and hence this range cannot be fixed. So, it becomes evident
that simple rules such as “If heart rate is x BPM, then stress is y units” won’t suffice.
Another limitation is introduced by the complication in using expert knowledge in the
system design. Experts can look at the physiological signals and interpret their influence
on the stress level of the participant. However, this expert knowledge would exist in
terms that human operators can understand. For example, the expert knowledge would
describe that ‘when the HR becomes too high and if there is a rise in the EDL, the
participant may be experiencing stress.’ Such knowledge can be difficult to convert it in a
form usable by the machine.
These limitations call for a system design that is adaptive and can handle the fuzzy
language of expert knowledge (and not requiring quantified inputs and outputs). The
solution to the problem thus emerges in the form of Fuzzy logic (see section 6.1.1) which
is widely used to deal with concepts that are ‘partially true’ instead of being ‘completely
true’ or ‘completely false’ [46]. For instance, the fuzzy language of expert knowledge
may describe input parameters as “somewhat true” but “mostly false”. Fuzzy logic not
only allows the use and representation of values like “somewhat” and “mostly”, but also
lets such multiple values coexist. Figure 33 shows the concept of “partial truth” being
handled by multi-valued fuzzy logic where the input variable “input1” belongs to three
different categories simultaneously, namely “low”, “normal” and “high”. The
membership of “input1” can be seen as “mostly normal”, “somewhat low” and “slightly
high”.
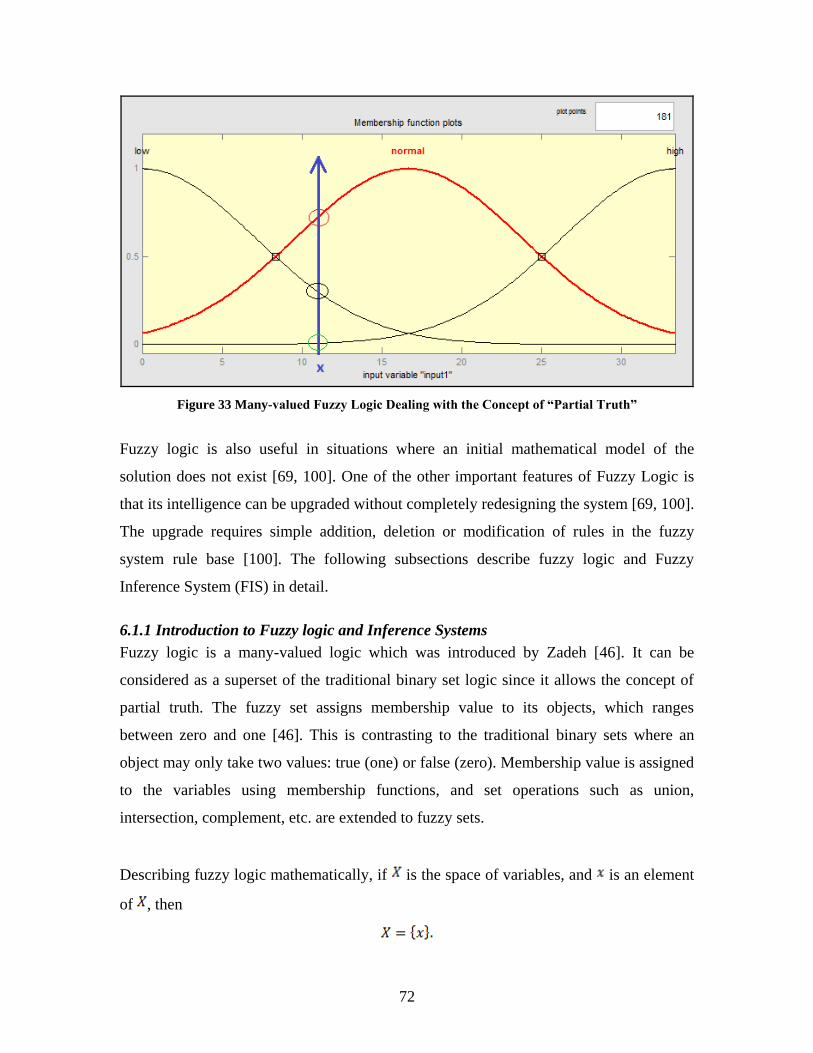
72
Figure 33 Many-valued Fuzzy Logic Dealing with the Concept of “Partial Truth”
Fuzzy logic is also useful in situations where an initial mathematical model of the
solution does not exist [69, 100]. One of the other important features of Fuzzy Logic is
that its intelligence can be upgraded without completely redesigning the system [69, 100].
The upgrade requires simple addition, deletion or modification of rules in the fuzzy
system rule base [100]. The following subsections describe fuzzy logic and Fuzzy
Inference System (FIS) in detail.
6.1.1 Introduction to Fuzzy logic and Inference Systems
Fuzzy logic is a many-valued logic which was introduced by Zadeh [46]. It can be
considered as a superset of the traditional binary set logic since it allows the concept of
partial truth. The fuzzy set assigns membership value to its objects, which ranges
between zero and one [46]. This is contrasting to the traditional binary sets where an
object may only take two values: true (one) or false (zero). Membership value is assigned
to the variables using membership functions, and set operations such as union,
intersection, complement, etc. are extended to fuzzy sets.
Describing fuzzy logic mathematically, if is the space of variables, and is an element
of , then
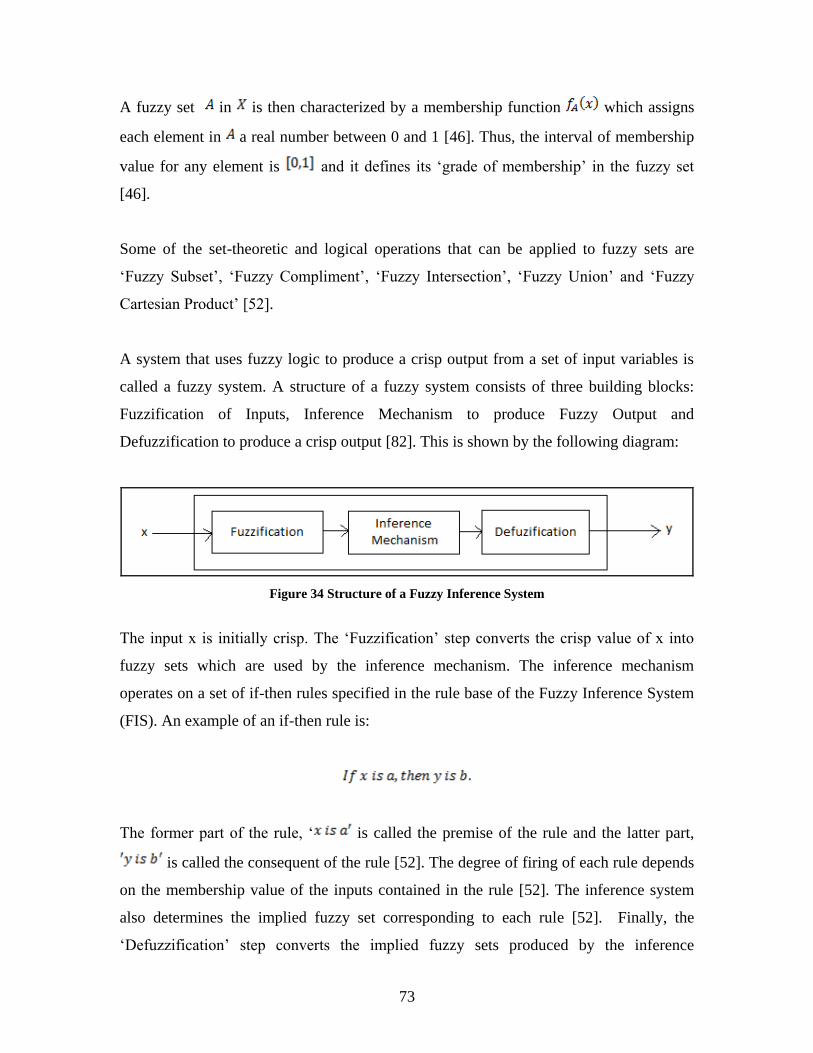
73
A fuzzy set in is then characterized by a membership function which assigns
each element in a real number between 0 and 1 [46]. Thus, the interval of membership
value for any element is and it defines its ‘grade of membership’ in the fuzzy set
[46].
Some of the set-theoretic and logical operations that can be applied to fuzzy sets are
‘Fuzzy Subset’, ‘Fuzzy Compliment’, ‘Fuzzy Intersection’, ‘Fuzzy Union’ and ‘Fuzzy
Cartesian Product’ [52].
A system that uses fuzzy logic to produce a crisp output from a set of input variables is
called a fuzzy system. A structure of a fuzzy system consists of three building blocks:
Fuzzification of Inputs, Inference Mechanism to produce Fuzzy Output and
Defuzzification to produce a crisp output [82]. This is shown by the following diagram:
Figure 34 Structure of a Fuzzy Inference System
The input x is initially crisp. The ‘Fuzzification’ step converts the crisp value of x into
fuzzy sets which are used by the inference mechanism. The inference mechanism
operates on a set of if-then rules specified in the rule base of the Fuzzy Inference System
(FIS). An example of an if-then rule is:
The former part of the rule, ‘ is called the premise of the rule and the latter part,
is called the consequent of the rule [52]. The degree of firing of each rule depends
on the membership value of the inputs contained in the rule [52]. The inference system
also determines the implied fuzzy set corresponding to each rule [52]. Finally, the
‘Defuzzification’ step converts the implied fuzzy sets produced by the inference

74
mechanism into a crisp output. Different approaches to defuzzification exist, such as the
‘Center of Gravity’ and ‘Center Average’ defuzzification [102].
6.1.2 Comparison of Mamdani-type and Sugeno-type Fuzzy Inference System
Two basic types of Fuzzy Inference Systems that are commonly used are: Mamdani-type
and Sugeno-type [52]. Mamdani’s system which was proposed by Ebrahim Mamdani in
1975 is the most commonly used FIS. The FIS properties described in the previous
subsection characterize the Mamdani-type FIS. The other type is the Sugeno-type system
which is also known as Takagi-Sugeno-Kang FIS. It is similar to the the Mamdani FIS
except that their outputs are computed differently. Mamdani systems compute the output
by clipping the output membership function (distribution) at the rule strength. Unlike the
Mamdani system, the Sugeno FIS does not use an output membership function to derive a
crisp output. Instead, each input is multiplied by a constant and the products are added
up. Their average value makes up the resulting crisp output [54, 73]. Another minor
difference between the two systems exists in the terminology. The term "Rule strength"
of Mamdani systems is referred to as "degree of applicability" and the output is referred
to as the "action" [54].
The working of Mamdani and Sugeno FIS’ can be better understood with the help of the
following diagrams [54].
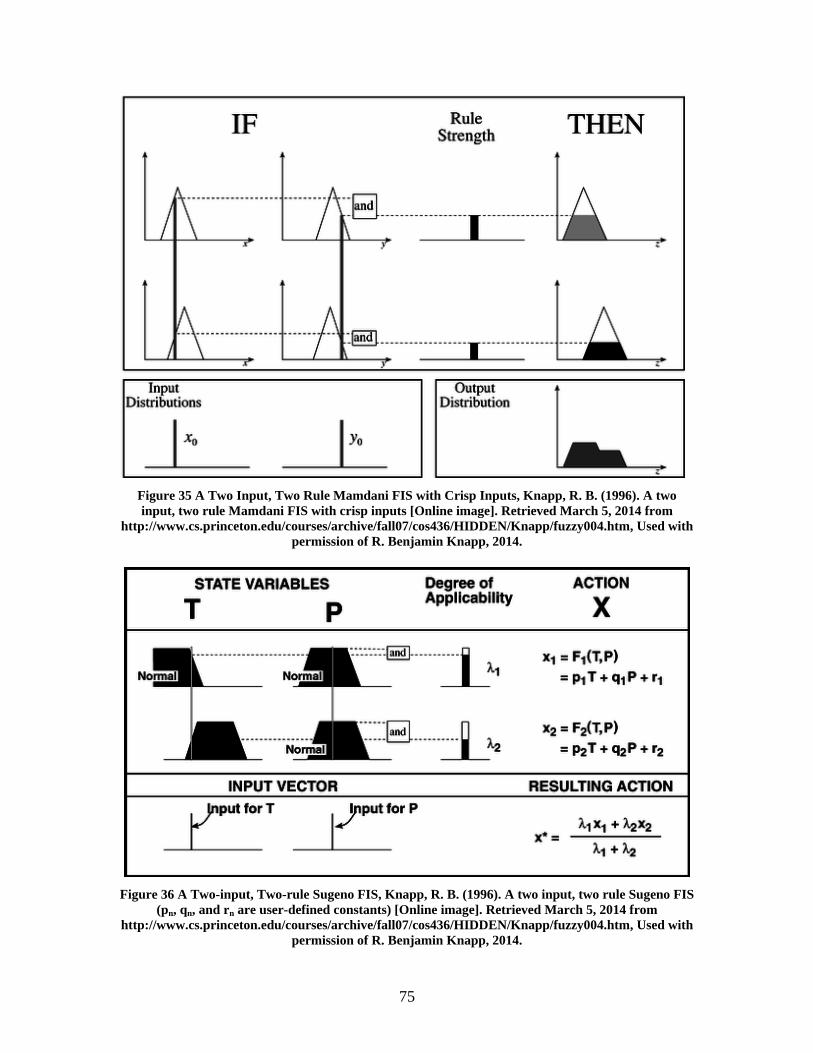
75
Figure 35 A Two Input, Two Rule Mamdani FIS with Crisp Inputs, Knapp, R. B. (1996). A two
input, two rule Mamdani FIS with crisp inputs [Online image]. Retrieved March 5, 2014 from
http://www.cs.princeton.edu/courses/archive/fall07/cos436/HIDDEN/Knapp/fuzzy004.htm, Used with
permission of R. Benjamin Knapp, 2014.
Figure 36 A Two-input, Two-rule Sugeno FIS, Knapp, R. B. (1996). A two input, two rule Sugeno FIS
(pn, qn, and rn are user-defined constants) [Online image]. Retrieved March 5, 2014 from
http://www.cs.princeton.edu/courses/archive/fall07/cos436/HIDDEN/Knapp/fuzzy004.htm, Used with
permission of R. Benjamin Knapp, 2014.
76
6.1.3 Reasons for Selecting Mamdani-type over Sugeno-type System
After selecting fuzzy logic for stress profile generation, it was important to select one of
the two fuzzy inference systems. As described in the previous section and shown in
figure 36, the output membership function of Sugeno is essentially linear or constant
[73]. One of the biggest problems with using Sugeno-type FIS is the selection of the user-
defined constants (coefficients) (for e.g. pn, qn and rn in figure 36). There is no intuitive
way to determine these coefficients [54] especially when the number of input variables is
large. It becomes all the more difficult when different rules use a varying combination of
these input variables. Another problem associated with Sugeno-type FIS is that the output
is always crisp, which may not be desirable for some HCI applications [54]. This is also
considered counterintuitive since the fuzziness is not propagated from the input to the
output [72]. Although there exists a neural-network based algorithm known as ANFIS,
that can automatically optimize the FIS parameters [70], it has stringent requirements.
ANFIS stands for Adaptive Neuro-Fuzzy Inference System and needs a training dataset
as input, in order to tune the membership parameters of the Sugeno-type FIS [70].
Another major limitation related to ANFIS is that the number of rules in the rule-base of
the FIS should be equal to number of output membership functions [73]. This limitation
can be very tricky to handle. This is explained with the help of following rules:
1. If (hr is high) and (hr_stdDev is low) then (stress is high)
2. If (hr is low) and (hr_stdDev is low) then (stress is high)
3. If (rr is low) and (rr_stdDev is low) and (rmssd is low) then (stress is high)
4. If (rr is high) and (rr_stdDev is low) and (rmssd is low) then (stress is high)
Supposing that only these four rules made up the logic for any FIS, Sugeno based ANFIS
would not have accepted this rule-base. This is because the output variable only contains
one membership function (with the value “high”) which is being used by four rules
simultaneously. ANFIS does not permit this kind of rule sharing. Hence, it becomes very
difficult to program an ANFIS especially when all crisp values of the output variable are
not known (for e.g. very low stress, low stress, normal stress, high stress, etc.). On the
other hand, Mamdani-type FIS allows rule sharing and is more intuitive and better suited

77
to human input [73]. Hence, owing to the limitations posed by ANFIS, a Mamdani-type
Fuzzy Inference System was designed for the current application.
6.1.4 Conclusion
This section explained the requirements for developing logic for stress profile generation.
The design challenges led to the selection of fuzzy logic as the solution, and specifically
the Mamdani-type FIS was selected for implementation.
6.2 Design of Fuzzy Inference System for Stress Profile Generation
This section describes the design of the Fuzzy Inference System in terms of the input
variables, their membership functions, the output variable, and the rules used to map
inputs to output. The Mamdani-type FIS used for these studies was developed using the
Fuzzy Logic Toolbox in MATLAB. The Fuzzy Logic Toolbox provides functions to
design and simulate fuzzy logic systems which can be used in a program or via its
Graphical User Interface (GUI) [69, 100].
6.2.1 Selected Features as Input Variables
Several features were extracted from the ECG and EDA signals processed using the
HRtool and the EDAtool respectively. Additional features were extracted by modifying
these tools. Some features which cannot be computed instantly for every heartbeat need
to be computed over a time window of around 5 seconds. Examples of such features
include Standard Deviation of Heart Rate and RR-intervals, RMSSD, Coefficient of
Variance, pRR50, etc. For this, extra functionality was added to the HRtool to compute
values of these features using a technique suggested by Khandpur (2003) [40]. According
to Khandpur, a combination of beat-to-beat calculation and averaging values can be
created which calculates the average measure of four or six RR intervals [40]. Hence, a
moving window of 4 RR-intervals was used in order to maximize the effect of each
contributing sample (compared to using 6 RR-intervals). The moving window was used
to extract all the required features which needed to be computed across some timeframe.
These included Mean of Heart Rate, Standard Deviation of Heart Rate, Mean of RR
Interval, Standard Deviation of RR Interval, Coefficient of Variance, RMSSD, pRR50
and pRR20.
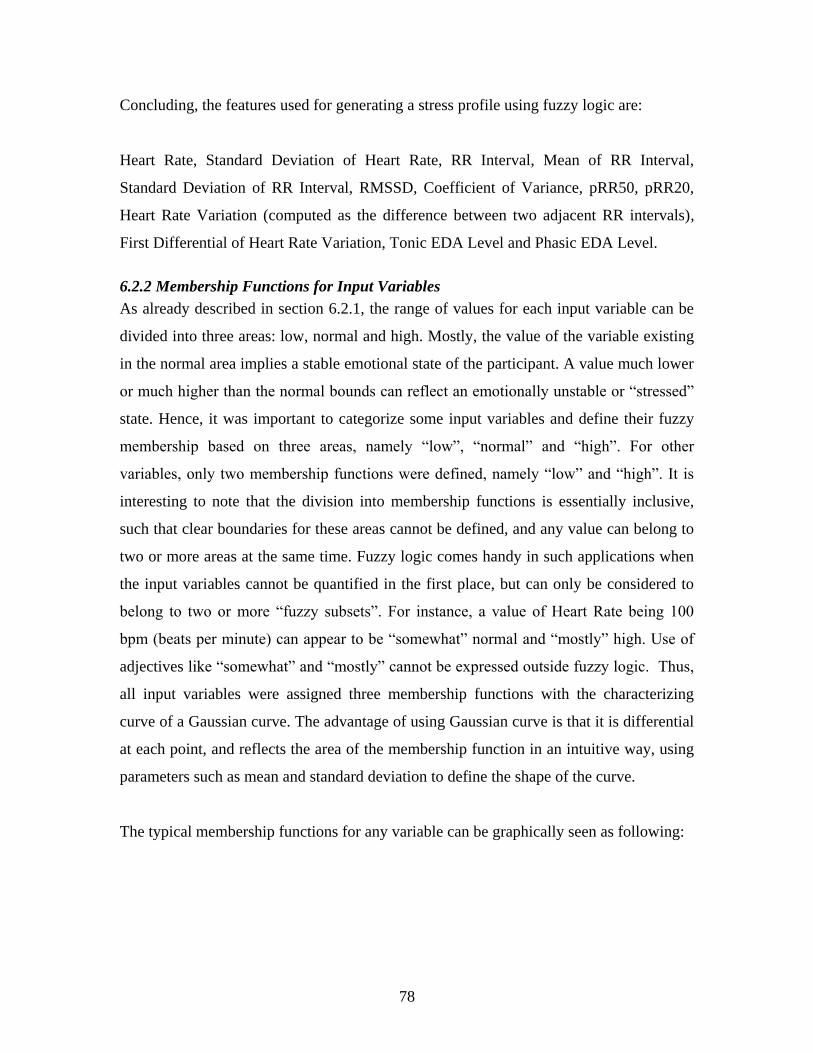
78
Concluding, the features used for generating a stress profile using fuzzy logic are:
Heart Rate, Standard Deviation of Heart Rate, RR Interval, Mean of RR Interval,
Standard Deviation of RR Interval, RMSSD, Coefficient of Variance, pRR50, pRR20,
Heart Rate Variation (computed as the difference between two adjacent RR intervals),
First Differential of Heart Rate Variation, Tonic EDA Level and Phasic EDA Level.
6.2.2 Membership Functions for Input Variables
As already described in section 6.2.1, the range of values for each input variable can be
divided into three areas: low, normal and high. Mostly, the value of the variable existing
in the normal area implies a stable emotional state of the participant. A value much lower
or much higher than the normal bounds can reflect an emotionally unstable or “stressed”
state. Hence, it was important to categorize some input variables and define their fuzzy
membership based on three areas, namely “low”, “normal” and “high”. For other
variables, only two membership functions were defined, namely “low” and “high”. It is
interesting to note that the division into membership functions is essentially inclusive,
such that clear boundaries for these areas cannot be defined, and any value can belong to
two or more areas at the same time. Fuzzy logic comes handy in such applications when
the input variables cannot be quantified in the first place, but can only be considered to
belong to two or more “fuzzy subsets”. For instance, a value of Heart Rate being 100
bpm (beats per minute) can appear to be “somewhat” normal and “mostly” high. Use of
adjectives like “somewhat” and “mostly” cannot be expressed outside fuzzy logic. Thus,
all input variables were assigned three membership functions with the characterizing
curve of a Gaussian curve. The advantage of using Gaussian curve is that it is differential
at each point, and reflects the area of the membership function in an intuitive way, using
parameters such as mean and standard deviation to define the shape of the curve.
The typical membership functions for any variable can be graphically seen as following:
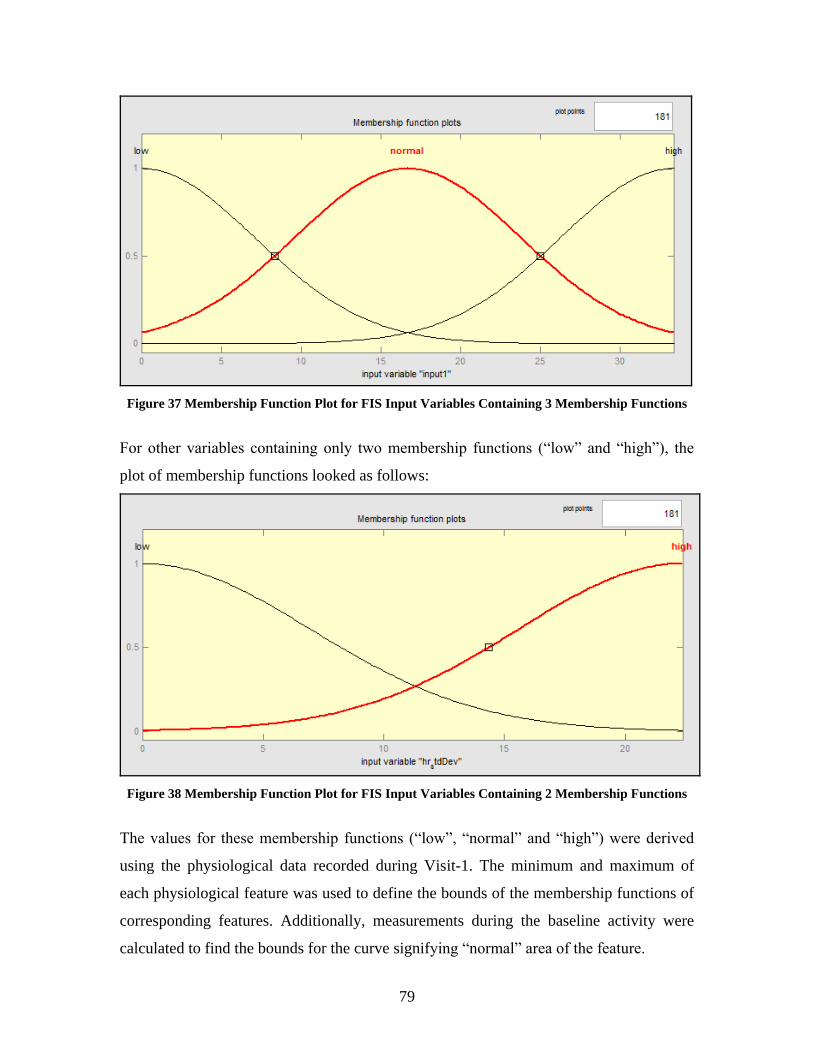
79
Figure 37 Membership Function Plot for FIS Input Variables Containing 3 Membership Functions
For other variables containing only two membership functions (“low” and “high”), the
plot of membership functions looked as follows:
Figure 38 Membership Function Plot for FIS Input Variables Containing 2 Membership Functions
The values for these membership functions (“low”, “normal” and “high”) were derived
using the physiological data recorded during Visit-1. The minimum and maximum of
each physiological feature was used to define the bounds of the membership functions of
corresponding features. Additionally, measurements during the baseline activity were
calculated to find the bounds for the curve signifying “normal” area of the feature.

80
6.2.3 Fuzzy Rule Base
It was observed that the system performed better in estimating the output stress value
when rules were defined for both conditions: when stress is high and when stress is low.
The rules used for modeling the input/output datasets collectively form the rule base of
the FIS. The numbers in brackets at the end of each rule statement define the weight of
that rule. Because the rule base elaborately covers every feature in different rules based
on its absolute and relative importance, the weights of all the rules have been assigned to
be the same, and hence carry the value 1.
One FIS each was developed for features derived from the ECG and EDA signals
respectively. The integration of the rules for ECG and EDA features was not trivial
because of the presence of artifacts in both signals. The artifacts were present at different
times in the signals, and the parts of signals during these artifacts needed to be avoided
for calculating the fuzzy system’s performance. Moreover, the difference in the way
features are derived from the ECG and EDA signals was another factor that made the
integration difficult. The HRtool derives features from the ECG based on the position of
R peaks which can be spaced unevenly in time. The EDAtool on the other hand is nnot
time-dependent to compute the Phasic and Tonic EDA levels. Simple interpolation of the
features derived from the ECG and EDA does not solve this problem either, and more
complex processing is needed to synchronize the features from ECG and EDA to develop
a common rule base for an integrated fuzzy system. Thus, for this work, two separate
fuzzy systems with their corresponding rule bases were developed for the ECG and EDA
features.
The rule base for the FIS based on features derived from the EDA is as follows:
1. If (edaTonic is high) and (edaPhasic is high) then (stress is high) (1)
2. If (edaTonic is high) then (stress is high) (1)
3. If (edaTonic is low) then (stress is low) (1)
4. If (edaTonic is low) or (edaPhasic is low) then (stress is low) (1)
5. If (edaPhasic is low) then (stress is low) (1)
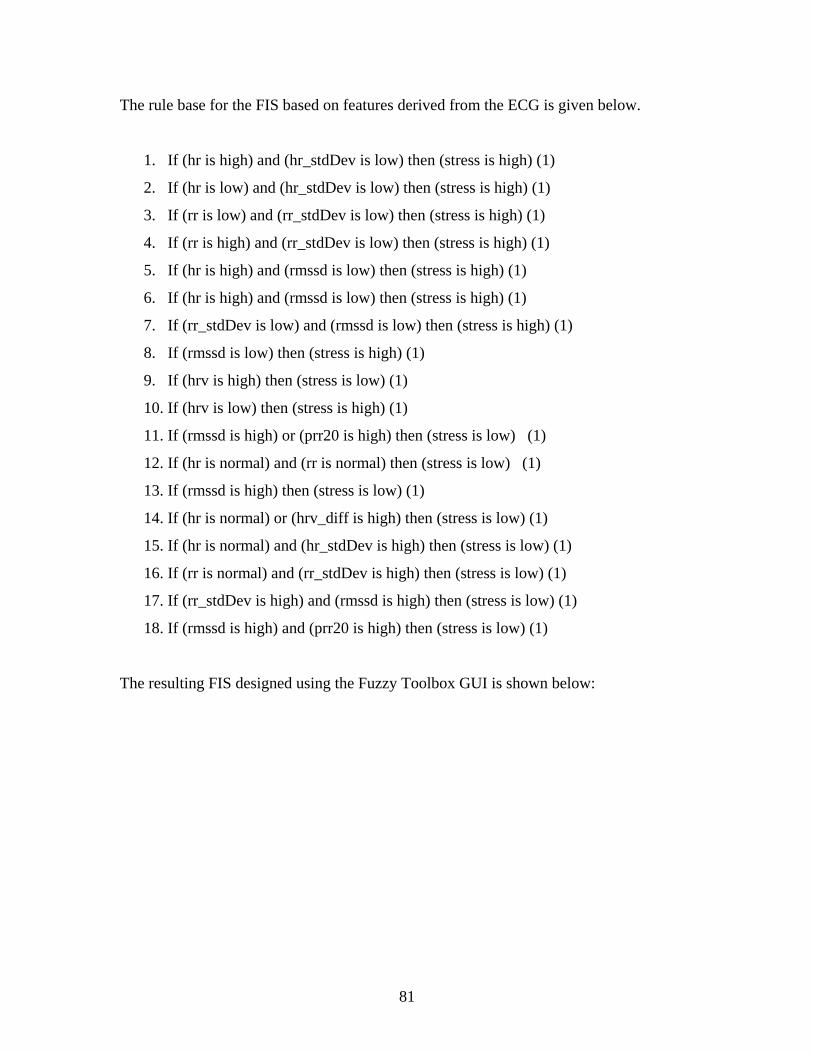
81
The rule base for the FIS based on features derived from the ECG is given below.
1. If (hr is high) and (hr_stdDev is low) then (stress is high) (1)
2. If (hr is low) and (hr_stdDev is low) then (stress is high) (1)
3. If (rr is low) and (rr_stdDev is low) then (stress is high) (1)
4. If (rr is high) and (rr_stdDev is low) then (stress is high) (1)
5. If (hr is high) and (rmssd is low) then (stress is high) (1)
6. If (hr is high) and (rmssd is low) then (stress is high) (1)
7. If (rr_stdDev is low) and (rmssd is low) then (stress is high) (1)
8. If (rmssd is low) then (stress is high) (1)
9. If (hrv is high) then (stress is low) (1)
10. If (hrv is low) then (stress is high) (1)
11. If (rmssd is high) or (prr20 is high) then (stress is low) (1)
12. If (hr is normal) and (rr is normal) then (stress is low) (1)
13. If (rmssd is high) then (stress is low) (1)
14. If (hr is normal) or (hrv_diff is high) then (stress is low) (1)
15. If (hr is normal) and (hr_stdDev is high) then (stress is low) (1)
16. If (rr is normal) and (rr_stdDev is high) then (stress is low) (1)
17. If (rr_stdDev is high) and (rmssd is high) then (stress is low) (1)
18. If (rmssd is high) and (prr20 is high) then (stress is low) (1)
The resulting FIS designed using the Fuzzy Toolbox GUI is shown below:
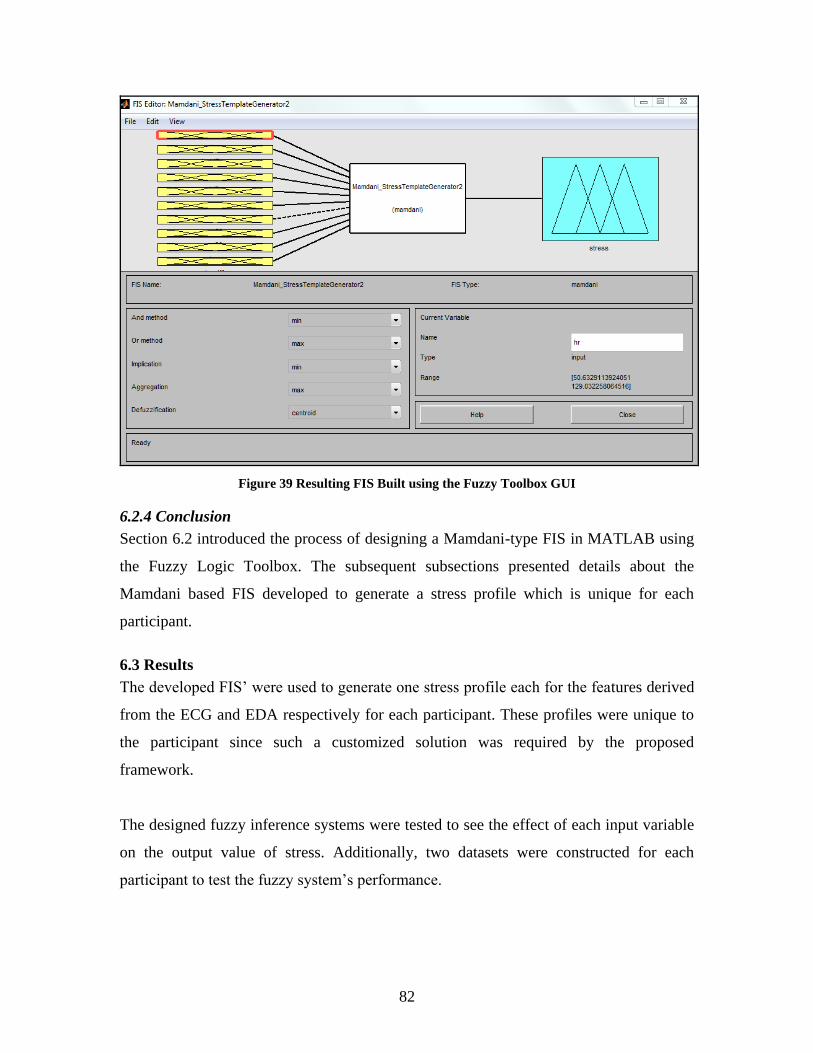
82
Figure 39 Resulting FIS Built using the Fuzzy Toolbox GUI
6.2.4 Conclusion
Section 6.2 introduced the process of designing a Mamdani-type FIS in MATLAB using
the Fuzzy Logic Toolbox. The subsequent subsections presented details about the
Mamdani based FIS developed to generate a stress profile which is unique for each
participant.
6.3 Results
The developed FIS’ were used to generate one stress profile each for the features derived
from the ECG and EDA respectively for each participant. These profiles were unique to
the participant since such a customized solution was required by the proposed
framework.
The designed fuzzy inference systems were tested to see the effect of each input variable
on the output value of stress. Additionally, two datasets were constructed for each
participant to test the fuzzy system’s performance.
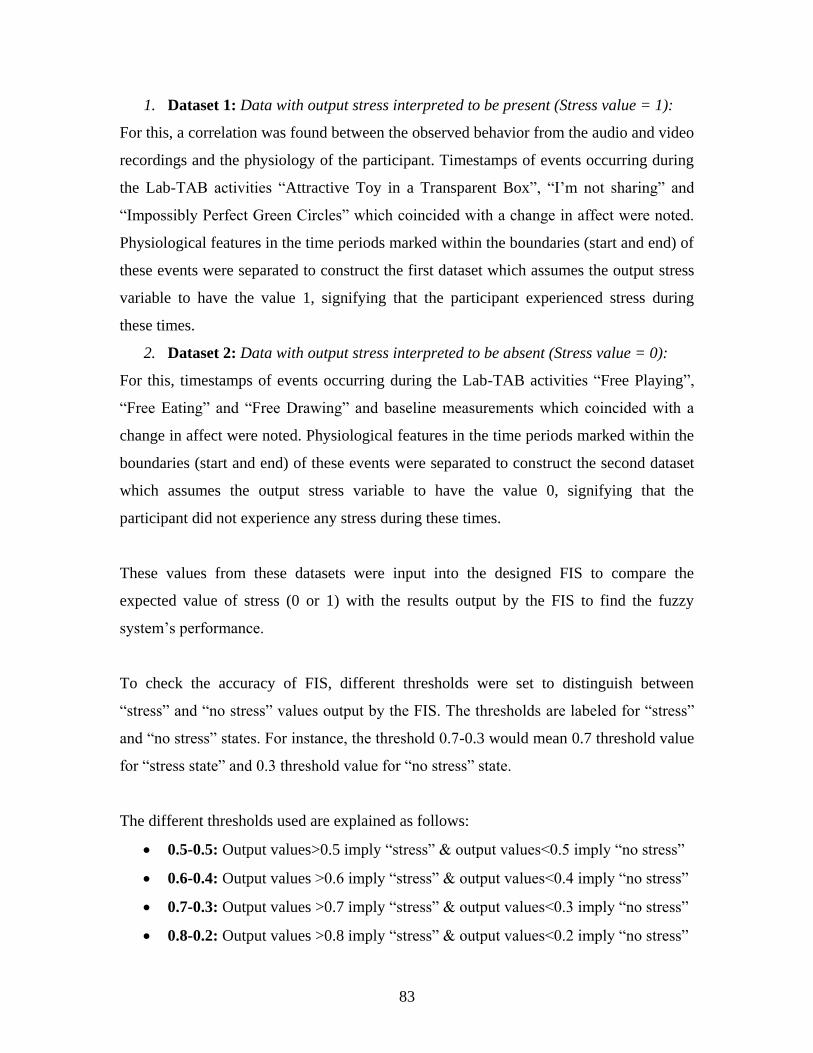
83
1. Dataset 1: Data with output stress interpreted to be present (Stress value = 1):
For this, a correlation was found between the observed behavior from the audio and video
recordings and the physiology of the participant. Timestamps of events occurring during
the Lab-TAB activities “Attractive Toy in a Transparent Box”, “I’m not sharing” and
“Impossibly Perfect Green Circles” which coincided with a change in affect were noted.
Physiological features in the time periods marked within the boundaries (start and end) of
these events were separated to construct the first dataset which assumes the output stress
variable to have the value 1, signifying that the participant experienced stress during
these times.
2. Dataset 2: Data with output stress interpreted to be absent (Stress value = 0):
For this, timestamps of events occurring during the Lab-TAB activities “Free Playing”,
“Free Eating” and “Free Drawing” and baseline measurements which coincided with a
change in affect were noted. Physiological features in the time periods marked within the
boundaries (start and end) of these events were separated to construct the second dataset
which assumes the output stress variable to have the value 0, signifying that the
participant did not experience any stress during these times.
These values from these datasets were input into the designed FIS to compare the
expected value of stress (0 or 1) with the results output by the FIS to find the fuzzy
system’s performance.
To check the accuracy of FIS, different thresholds were set to distinguish between
“stress” and “no stress” values output by the FIS. The thresholds are labeled for “stress”
and “no stress” states. For instance, the threshold 0.7-0.3 would mean 0.7 threshold value
for “stress state” and 0.3 threshold value for “no stress” state.
The different thresholds used are explained as follows:
0.5-0.5: Output values>0.5 imply “stress” & output values<0.5 imply “no stress”
0.6-0.4: Output values >0.6 imply “stress” & output values<0.4 imply “no stress”
0.7-0.3: Output values >0.7 imply “stress” & output values<0.3 imply “no stress”
0.8-0.2: Output values >0.8 imply “stress” & output values<0.2 imply “no stress”

84
The thresholds 0.6-0.4, 0.7-0.3 and 0.8-0.2 make the error margins for distinguishing
between “stress” and “no stress” states tighter, since an ideal system would compute the
output value of stress as close to 1 as possible, when the user interpreted value is 1. Also,
the ideal system would compute the value of “no stress” very close to 0 when the user
interpreted value of stress is 0.
However, it is important to note that the actual value of stress may not be absolutely 0 or
1 even when its user interpreted value defines it as 0 or 1. This is because human
knowledge cannot quantify stress and the interpreted value is a rough estimate or
rounded-off value of stress which is assumed to be 0 or 1.
Furthermore, the rule base of the FIS is dependent on several features derived from the
ECG and EDA. Deriving values of stress as absolute 0 or 1 may not be possible, since
that will require an optimized set of values for all the features, which can force all the
rules to output the value of stress as absolute 0 or 1. Hence, achieving an ideal fuzzy
system that outputs the value of stress as absolute 0 or 1 is impractical.
The accuracy of the system is calculated in percentage as the ratio of number of samples
with a positive correlation between the user interpreted and system computed values of
stress to the total number of samples.
A positive correlation is defined as a case when the user interpreted value of stress is 1
and the system computed output is above the “stress” state threshold, or when the user
interpreted value of stress is 0 and the system computed output is below the “no stress”
state threshold.
The results and system performance for each participant is explained in detail below.
Subject 108:
Input in the form of features derived from the ECG and EDA signals was provided to the
corresponding FIS’. The input feature values were a combination of values from Dataset
1 and Dataset 2, and were arranged in the order of their occurrence. The FIS used its rule

85
base to compute the value of stress against the given feature values at any instant. The
output stress value was compared against the interpreted stress value (0 or 1).
Stress Profiles generated using FIS’ based on features derived from the ECG and
EDA signals
The following plot is an example of the stress profile generated by the FIS based on
features derived from the ECG signals. The plot shows the samples arranged in time on
the X-axis and the value of stress (ranging between 0 and 1) on the Y-axis. The
interpreted values are marked in blue and they toggle between 0 and 1, since human
expertise cannot quantify stress as 0.3 or 0.6, etc. The values of stress computed by the
FIS based on features derived from ECG are drawn in red. It is interesting to note how
the value of stress computed by the FIS rises up for the time when the expert interpreted
value of stress is 1. On the other hand, the fall in the FIS output value of stress also
coincides with the expert interpreted value of stress being 0.
Figure 40 Stress Profile Generated using FIS Based on Features Derived from ECG
If different thresholds are considered to evaluate the FIS’ accuracy in predicting stress, it
can be seen that both the FIS (based on ECG and EDA features respectively) perform
well when the threshold is set to 0.5-0.5. The performance of the FIS based on ECG
features for 0.5-0.5 threshold is 88.76% while the accuracy of the other FIS based on
EDA features for this threshold is 92.89%. This trend is also observed in figure 40 where
the stress values computed by the FIS are mostly concentrated between the value range
0.4 and 0.6. The accuracy of the FIS keeps dropping as the boundaries for distinguishing
between the “stress” and “no stress” states are made tighter in thresholds 0.6-0.4, 0.7-0.3,
0.8-0.2.
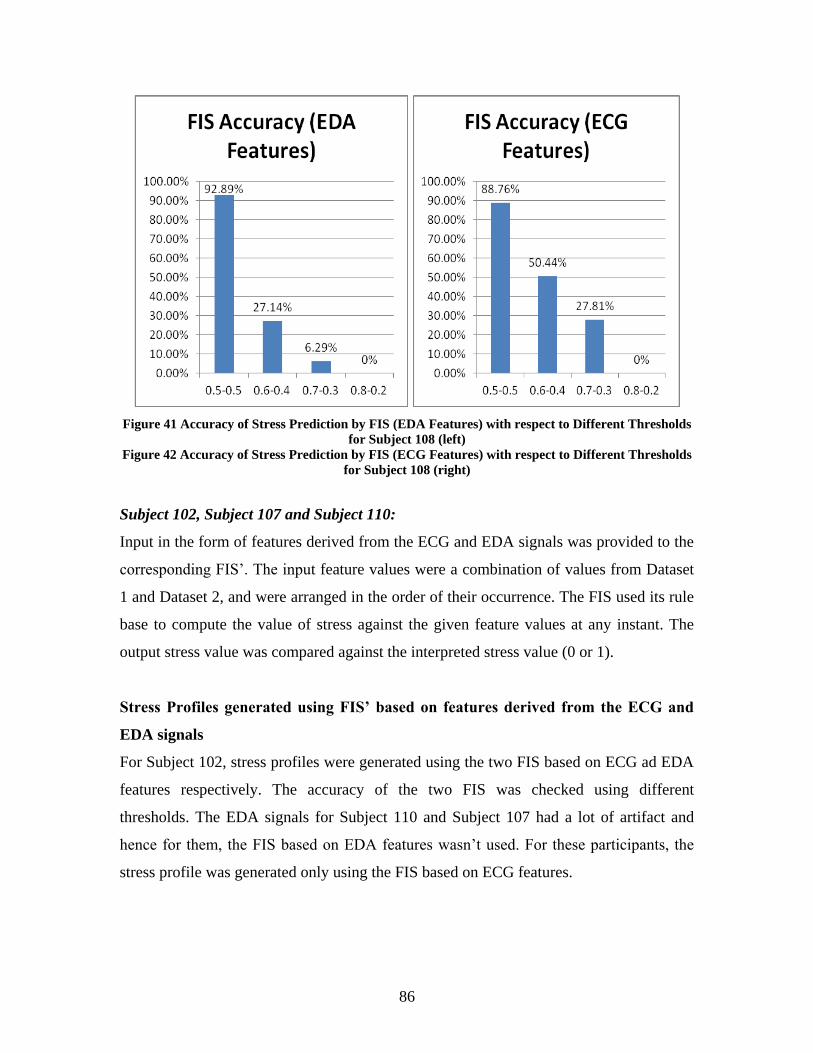
86
Figure 41 Accuracy of Stress Prediction by FIS (EDA Features) with respect to Different Thresholds
for Subject 108 (left)
Figure 42 Accuracy of Stress Prediction by FIS (ECG Features) with respect to Different Thresholds
for Subject 108 (right)
Subject 102, Subject 107 and Subject 110:
Input in the form of features derived from the ECG and EDA signals was provided to the
corresponding FIS’. The input feature values were a combination of values from Dataset
1 and Dataset 2, and were arranged in the order of their occurrence. The FIS used its rule
base to compute the value of stress against the given feature values at any instant. The
output stress value was compared against the interpreted stress value (0 or 1).
Stress Profiles generated using FIS’ based on features derived from the ECG and
EDA signals
For Subject 102, stress profiles were generated using the two FIS based on ECG ad EDA
features respectively. The accuracy of the two FIS was checked using different
thresholds. The EDA signals for Subject 110 and Subject 107 had a lot of artifact and
hence for them, the FIS based on EDA features wasn’t used. For these participants, the
stress profile was generated only using the FIS based on ECG features.
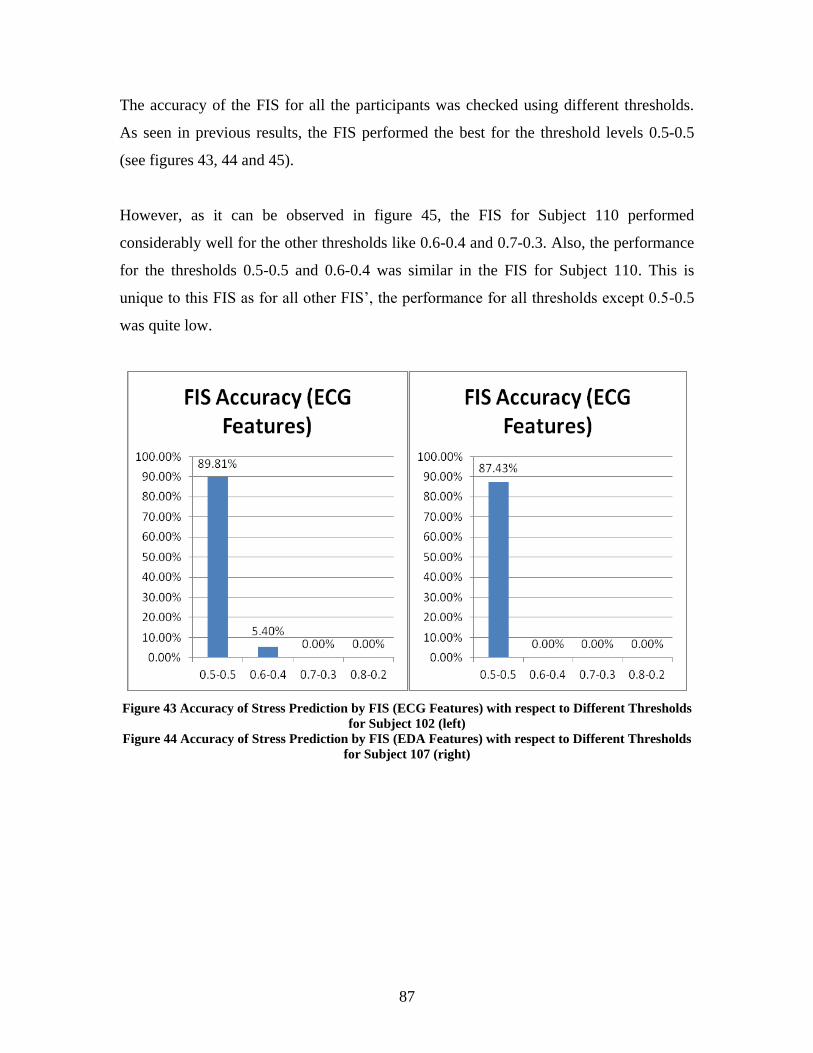
87
The accuracy of the FIS for all the participants was checked using different thresholds.
As seen in previous results, the FIS performed the best for the threshold levels 0.5-0.5
(see figures 43, 44 and 45).
However, as it can be observed in figure 45, the FIS for Subject 110 performed
considerably well for the other thresholds like 0.6-0.4 and 0.7-0.3. Also, the performance
for the thresholds 0.5-0.5 and 0.6-0.4 was similar in the FIS for Subject 110. This is
unique to this FIS as for all other FIS’, the performance for all thresholds except 0.5-0.5
was quite low.
Figure 43 Accuracy of Stress Prediction by FIS (ECG Features) with respect to Different Thresholds
for Subject 102 (left)
Figure 44 Accuracy of Stress Prediction by FIS (EDA Features) with respect to Different Thresholds
for Subject 107 (right)
88
Figure 45 Accuracy of Stress Prediction by FIS (ECG Features) with respect to Different Thresholds
for Subject 110
Thus, the FIS based on features derived from the ECG could distinguish between “stress”
and “no stress” states with varying accuracies for different thresholds, and these are
described as follows:
0.5-0.5: Accuracy (Average) = 83.365%
0.6-0.4: Accuracy (Average) = 30.305%
0.7-0.3: Accuracy (Average) = 18.86%
0.8-0.2: Accuracy (Average) = 0%
It is believed that the performance of the FIS’ can be improved by incorporating more
features derived from the ECG and EDA signals as input, and by integrating the two FIS
into one.
6.4 Conclusion
This chapter presented the details of fuzzy logic and fuzzy inference systems (Mamdani-
type and Sugeno-type). A Mamdani-type FIS was designed to estimate the value of stress
based on the input physiological features. Two FIS each were developed for creating the
stress profiles of each participant. These FIS were based on the features derived from the
ECG and EDA signals of the participants, which were captured during Visit-1 of the

89
studies. The FIS based on features derived from the ECG signal could distinguish
between the “stress” and “no stress” states with an average accuracy of 83.365% when
the threshold was set to be 0.5-0.5.
90
Chapter 7: Conclusion and Future Work
7.1 Conclusion
A framework to enable emotion regulation in children with ASD is proposed. The
feasibility of the building blocks of the framework has been tested by conducting pilot
studies on nine young TD children (age 3-6 years). Nine participants voluntarily agreed
to participate in the user studies designed to verify the each building block of the study.
The goals of the study were set to test the feasibility of these building blocks, and are
described as:
1. Testing the feasibility of using extant biotechnological methodology to
successfully measure physiology of young TD children (3-6 years).
2. Designing a stress profile for each participant, based on the correlation derived
between measured physiology and observed behavior.
3. Presenting different audio representations to the participant to check if these
representations are capable of capturing the participant’s attention.
The results of the studies were analyzed temporally point-to-point and for average
calculations to gain insights. The goals of the studies were achieved as each step of the
framework being tested was found to be feasible.
The extant biotechnological equipment could be successfully used with this young
population. 90% of the participants could participate in the sessions without experiencing
any discomfort. However, the equipment was found to be distracting for the other
participants. The different audio representations were also successful in capturing the
participants’ attention. This is supported by the fact that 33 out of 43 instances of playing
audio representations captured the participants’ attention. It was found that the Lab-TAB
activities were effective in inducing stress, although the level of stress experienced by the
participants was variable. However, the overall study design was found to be successful
in inducing stress and measuring the corresponding changes in affect by measuring the
changes in physiology.
91
7.2 Future Work
The first step would be to conduct these studies with a larger set of participants to
observe similarities in the response patterns of participants under stressful situations
(Lab-TAB activities). The next step would be to integrate the individual steps validated in
the pilot study, to verify the functioning and effectiveness of the proposed framework.
The future studies would test both the populations: Typically Developing children and
children with ASD. However, some suggestions for individual pieces of the framework
are presented, which would make the design more robust.
Audio Representations
Since it is difficult to predict which sounds will work best with autistic children,
and considering the fact that different children may have different preferences and
hence attend to different sounds, we need to explore all the shortlisted audio
representations with the autistic population, to see if there exist any differences in the
choices and attention capturing capability for this new population. The architecture will
ensure the modification and playing back of these representations such that they
fire (with corresponding change in pitch, frequency or structure) when a change in affect
is detected.
Data Analysis
Besides analyzing the results obtained from the Average Calculations and Temporal
Point-to-Point Analysis, it might be important to study if there was a change in affect at
specific events during the activities for all participants. Also, measurement of this change
can be useful in determining the effect of each activity in inducing stress/frustration.
Finally, this can be useful in observing a pattern of change in affect across all
participants. This third type of measurement can be done for future studies which would
compare the values of different HRV indices before and after the important events for
each activity.
Owing to the subjective nature of this study, and with differences in the behavior and
response of each participant, it is difficult to cover all events that may occur during the
92
studies. So, the events for this analysis have been chosen so that they are prominent
(believed to cause a change in affect) and standard (occur during all studies). The
standard events chosen for this analysis are categorized according to the activities during
which they occur.
Activities S1(a) and S1(b)
Important Events:
Event 1: When the child has tried all wrong keys to open the locked box
Event 2: When the three minutes of trying are over
Event 3: When the toy is handed over to the child
Event 4: A couple of seconds after the child starts to play with the toy
Event 5: When the three minutes of playing with the toy get over
Activities S2(a) and S2(b)
Important Events:
Event 6: When the experimenter introduces the activity (tells about goldfish and
equal sharing, and hands over the box to another experimenter)
Event 7: When goldfish is equally shared for the first time
Event 8: When goldfish is unequally shared for the first time
Event 9: When the experimenter eats the participant’s colored goldfish
Event 10: When the experimenter takes all the goldfish from the participant’s
share
Event 11: When the experimenter accepts that she was not being very fair
Event 12: When the experimenter tells about giving some goldfish to the
participant
Event 13: When the participant gets some goldfish to eat
Event 14: When the participant has finished eating
93
Activities S3(a) and S3(b)
Important Events:
Event 15: When the experimenter critiques the participant’s drawing (circle) for
the first time
Event 16: When the experimenter critiques the participant’s drawing for the third
time
Event 17: When the experimenter critiques the participant’s drawing for the fifth
time
Event 18: When the experimenter critiques the participant’s drawing for the last
time
Event 19: When the experimenter chooses one of the drawn circles and
appreciates it
Event 20: When the participant receives colored markers to draw
Event 21: When the participant starts drawing anything of his/her choice
Event 22: When the participant has finished his drawing
Inter-Activity Intervals (IAI) – I, II, III
Important Events:
Event 23: Beginning of IAI – I
Event 24: End of IAI – II
Event 25: Beginning of IAI – II
Event 26: End of IAI – II
Event 27: Beginning of IAI – III
Event 28: End of IAI – III
In order to study the change in physiology and expected behavior before and after these
events, only those features could be used which can be extracted for any time instant (for
e.g. Heart Rate (HR), Tonic EDA (EDL)). All other HRV and EDA indices are related to
these features, but need to be computed over a time window ranging from 5 seconds to 5
minutes. Hence these features have not been studied and compared for this analysis.
94
Emotion Regulation Strategies
After performing each activity, the child should be taught to use emotion
regulation strategies such as deep breathing, smiling, engaging in an activity of
their liking (such as drawing, singing, etc.) to return to baseline. The effect of
each strategy should be measured in terms of how soon it brings the child back to
a relaxed state and for how long does it help the child stay relaxed. This is one of the
unique points of the study as it teaches emotion regulation to the child during
moments of self-experienced stress, contrary to conventional approaches of storytelling
and role-playing.
Use of Audio Representations
The audio representations carry a lot of potential to influence the affect of the participant.
The literature quotes wide use of Music Therapy to solve emotion regulation difficulties
experienced by children with ASD. The audio representations in that case could not just
enable emotion regulation by capturing the child’s attention, but would also possess
soothing properties that could help the child return to the baseline condition. In this way,
the audio representations would support emotion recognition and regulation, both.
Affect Classification
The current studies only target two emotional states: “Stress” and “Non-Stress”. It would
be interesting to see if the future work can target other affects described in section 4.1
and provide a feedback based on a wider range of affective states.
Design and Development of a Wearable Device
Finally, the most fascinating and seemingly promising area for future work would be to
design and develop a wearable device that employs the proposed framework. This device
would enable emotion regulation in young children (age 3-6 years) ASD by studying the
user’s affective state in real-time, thus providing a more customized solution to this
heterogeneous population.

95
References
[1] Hailpern, J., Karahalios. K, Halle, J., DeThorne, L., Coletto, M-K. A3: A Coding
Guideline for HCI+Autism Research using Video Annotation. 2008. ASSETS.
[2] Myers, Scott M., Johnson C. P. Management of Children with Autism Spectrum
Disorders. American Academy of Pediatrics. 2007
[3] Williams, B. T., Gray K. M. & Tonge B. J. Teaching emotion recognition skills to
young children with autism: a randomised controlled trial of an emotion training
programme. (2012) Journal of Child Psychology and Psychiatry, 53, 1268–1276.
[4] Sofronoff, K., Attwood, T., & Hinton, S. (2005). A randomized controlled trial of
a cognitive behavioural intervention for anxiety in children with Asperger
Syndrome. Journal of Child Psychology and Psychiatry, 46(11), 1152-1160.
[5] Sofronoff, K., Attwood, T., Hinton, S., & Levin, I. (2007). A randomized
controlled trial of a cognitive behavioural intervention for anger management in
children diagnosed with Asperger Syndrome. Journal of Autism and Development
Disorders, 37(7), 1203-1214.
[6] Ryers, N. M. Facilitating Emotion Regulation Strategies for Anger and Anxiety
Related Emotions in Young Children with High Functioning Autism Spectrum
Disorders (HFASD). 2009. Virginia Tech.
[7] Dawson, G., Webb, S. J., Carver, L., Panagiotides, H., McPartland, J. Young
Children with autism show atypical brain responses to fearful versus neutral facial
expressions of emotion. 2004. Developmental Science.
[8] Snyder, H. (2001). Child delinquents. In R. Loeber & D. P. Farrington (Eds.),
Risk factors and successful interventions. Thousand Oaks, CA: Sage.
[9] K. Kim, S. Bang, and S. Kim, “Emotion recognition system using short-term
monitoring of physiological signals,” Medical and Biological Engineering and
Computing, vol. 42, no. 3, pp. 419–427, 2004.
[10] Bogdashina, O. (2006). Asperger's Syndrome and sexuality: From adolescence
through adulthood. Autism, 10(6), 644-645.
[11] Baio, J. (2012, March 30). Prevalence of Autism Spectrum Disorders — Autism
and Developmental Disabilities Monitoring Network, 14 Sites, United States,
2008. Retrieved September 12, 2013, from
http://www.cdc.gov/mmwr/preview/mmwrhtml/ss6103a1.htm
[12] Webster-Stratton, C., Reid, M. J. Strengthening Social and Emotional
Competence in Young Children—The Foundation for Early School Readiness and
Success. Incredible Years Classroom Social Skills and Problem-Solving
Curriculum. Infants and Young Children. 2004.
[13] American Psychiatric Association. (1994). Diagnostic and statistical manual of
mental disorders (4th ed.). Washington: Author.
[14] Chalfant, A., Rapee, R., & Carroll, L. (2007). Treating anxiety disorders in
children with high functioning autism spectrum disorders: A control trial. Journal
of Autism and Developmental Disorders, 37, 1842-1857.
[15] Brodkin, E. S., McDougle, C. J., Naylor, S. T., Cohen, D. J., & Price, L. H.
(1997). Clomipramine in adults with pervasive developmental disorders: A
prospective open-label investi- gation. Journal of Child and Adolescent
Psychopharmacol- ogy, 7, 109–121.
96
[16] Kalus, O., Asnis, G. M., Ribinson, E., Kahn, R., Friedman, J. M. H., Iqbal, N., et
al. (1991). Desipramine treatment in panic disorder. Journal of Affective
Disorders, 21, 239–244.
[17] McDougle, C. J., Price, L. H., Volkmar, F. R., Goodman, W. K., Ward-O’Brien,
D., Nielsen, J., et al. (1992). Clomipramine in autism: Preliminary evidence of
efficacy. Journal of the American Academy of Child and Adolescent Psychiatry,
31, 746–750.
[18] Nicolson, R., Awad, G., & Sloman, L. (1998). An open trial of risperidone in
young autistic children. Journal of the American Academy of Child and
Adolescent Psychiatry, 37, 372–376.
[19] Tsai, L. Y. (1999). Pharmacology in autism. Psychosomatic Medicine, 61, 651–
665.
[20] Chambless, D. L., & Hollon, S. D. (1998). Defining empirically supported
therapies. Journal of Consulting and Clinical Psychology, 6, 7–18.
[21] Barrett, P. M., Duffy, A. L., Dadds, M. R., & Rapee, R. M. (2001). Cognitive-
behavioral treatment of anxiety disorders in children: Long-term (6 year) follow-
up. Journal of Con- sulting and Clinical Psychology, 69, 135–141.
[22] Barrett, P. M., Rapee, R. M., Dadds, M. R., & Ryan, S. M. (1996). Family
enhancement of cognitive style in anxious and aggressive children. Journal of
Abnormal Child Psychology, 24, 187–203.
[23] Kendall, P. C., Safford, S., Flannery-Schroeder, E., & Webb, A. (2004). Child
anxiety treatment: Outcomes in adolescence and impact on substance use and
depression at 7.4 year follow-up. Journal of Consulting and Clinical Psychology,
72, 276–287.
[24] Levine, T. P., Sheinopf, S. J., Pescosolido, M., Rodino, A., Elia, G., Lester, B.
Physiologic Arousal to Social Stress in Children with Autism Spectrum
Disorders: A Pilot Study. 2012. Res Autism Spectr Disord.
[25] Hill E, Berthoz S, Frith U. Brief report: cognitive processing of own emotions in
individuals with autistic spectrum disorder and in their relatives. J Autism Dev
Disord. 2004; 34(2):229–235. [PubMed: 15162941]
[26] Losh M, Capps L. Understanding of emotional experience in autism: insights
from the personal accounts of high-functioning children with autism. Dev
Psychol. 2006; 42(5):809–818. [PubMed: 16953688]
[27] Shi, Y., Nguyen, M. H., Blitz, P., French, B., Fisk, S., Torre, F. D. I., Smailagic,
A., Siewiorek, D. P., Absi, M., Ertin, E., Kamarck, T., Kumar, S. Personalized
Stress Detection from Physiological Measurements.
[28] J. Healey and R. Picard, “Detecting stress during real-world driving tasks using
physiological sensors,” IEEE Transactions on Intelligent Transportation Systems,
vol. 6, no. 2, pp. 156– 166, 2005.
[29] S. Kreibig, F. Wilhelm, W. Roth, and J. Gross, “Cardiovascular, electrodermal,
and respiratory response patterns to fear- and sadness-inducing films,”
Psychophysiology, vol. 44, no. 5, pp. 787–806, 2007.
[30] T. Oka, K. Oka, and T. Hori, “Mechanisms and mediators of psychological stress-
induced rise in core temperature,” Psychosomatic Medicine, vol. 63, no. 3, p. 476,
2001.

97
[31] Jane Case-Smith, and Teresa Bryan, “The Effects of Occupational Therapy With
Sensory Integration Emphasis on Preschool-Age Children With Autism”, The
American Journal of Occupational Therapy, vol. 53, no. 5, p. 489, 1999
[32] Goldsmith, H. H., Reilly, J., Lemery, K. S., Longley, S., & Prescott, A. (1993).
Preschool Laboratory Temperament Assessment Battery (PS Lab-TAB; Version
1.0). Technical Report, Department of Psychology, University of Wisconsin—
Madison.
[33] Jaimovich, J. Emotion Recognition from Physiological Indicators for Musical
Applications. 2013. Queen’s University Belfast.
[34] Sansanee Boonnithi, Sukanya Phongsuphap, Computing in Cardiology
2011;38:85-88.
[35] Kumar M, Weippert M, Vilbrandt R, Kreuzfeld S, Stoll R. Fuzzy Evaluation of
Heart Rate Signals for Mental Stress Assessment. IEEE Trans. Fuzzy Systems
2007; 15(5):791-808.
[36] Salahuddin L, Jaegeol C, Myeong GJ, Desok K. Ultra Short Term Analysis of
Heart Rate Variability for Monitoring Mental Stress in Mobile Settings. In:
Proc. the 29th IEEE EMBC, Lyon, France, August 23-26, 2007;4656-4659.
[37] Bozhokin SV, Shchenkova IM. Analysis of the Heart Rate Variability Using
Stress Tests. Human Physiology 2008;34(4):461-467.
[38] Schubert C, Lambertz M, Nelesen RA, Bardwell W, Choi JB, Dimsdale JE.
Effects of stress on heart rate complexity - a comparison between short-term and
chronic stress. Biological Psychology 2009;80: 325-332.
[39] Jongyoon C, Gutierrez-Osuna R. Using Heart Rate Monitors to Detect Mental
Stress. In: Proc. the 2009 Sixth International Workshop on Wearable and
Implantable Body Sensor Networks 2009;219-223.
[40] Khandpur, R.S. (2003). Handbook of Biomedical Instrumentation (2nd ed.). New
Delhi, India: Tata McGraw-Hill Education
[41] Burleson, K.O. & Schwartz, G.E., 2005. Cardiac torsion and electromagnetic
fields: The cardiac bioinformation hypothesis. Medical Hypotheses, 64(6),
pp.1109–1116.
[42] R.W. Picard and J. Healey, “Affective wearables,” Proc. IEEE Intl Symp
Wearable Computers, 1997, pp. 231-240.
[43] Lykken, D.T. & Venables, P.H., 1971. Direct Measurement of Skin Conductance:
A Proposal for Standardization. Psychophysiology, 8(5), pp.656–672.
[44] Dawson, M.E. et al., 2007. The Electrodermal System. In J. T. Cacioppo, L. G.
Tassinary, & G. G. Berntson, eds. Handbook of Psychophysiology. New York:
Cambridge University Press, pp. 159–181.
[45] Biosignal Analysis and Medical Imaging Group - Kubios HRV. (n.d.). Retrieved
April 2, 2014, from http://kubios.uef.fi/
[46] Zadeh, L. (1965). Fuzzy sets. Information and Control, 8, 338-353.
[47] Davies, A., & Scott, A. (2014). Starting to read ECGs: The basics. Springer
London.
[48] Fowles, D., Christie, M., Edelberg, R., Grings, W., Lykken, D., & Venables, P.
(2012). Publication Recommendations for Electrodermal Measurements.
Psychophysiology, 49(8), 1017-1034.

98
[49] J-P. Niskanen, M.P. Tarvainen, P.O. Ranta-aho, and P.A. Karjalainen. Software
for advanced HRV analysis. Comput Meth Programs Biomed, 76(1):73–81, 2004.
[50] G.G. Berntson, J.T. Bigger Jr., D.L. Eckberg, P. Grossman, P.G. Kaufmann, M.
Malik, H.N. Na-garaja, S.W. Porges, J.P. Saul, P.H. Stone, and M.W. Van Der
Molen. Heart rate variability: Origins, methods, and interpretive caveats.
Psychophysiol, 34:623 - 648, 1997.
[51] Casa Paganini - InfoMus. (n.d.). Retrieved February 27, 2014, from
http://www.infomus.org/eyesweb_ita.php
[52] Lilly, J. (2010). Fuzzy control and identification (pp. 27-45). Hoboken, N.J.:
Wiley.
[53] Mamdani, E. (n.d.). Application of fuzzy algorithms for control of simple
dynamic plant. Proceedings of the Institution of Electrical Engineers, 1585-1585.
[54] Mamdani, July 15th
2014 Fuzzy interface systems. Retrieved from Lecture Notes
Online Web site:
http://www.cs.princeton.edu/courses/archive/fall07/cos436/HIDDEN/Knapp/fuzz
y004.htm
[55] Jang, J. (1993). ANFIS: Adaptive-network-based fuzzy inference system. IEEE
Transactions On Systems, Man, and Cybernetics, 23(3), 665-685.
[56] American Psychiatric Association (2000). Diagnostic and Statistical Manual for
Mental Disorders DSM-IV-TR (Text Revision) (Washington, D.C.: American
Psychiatric Association)
[57] Hyman, S. (2013). Autism: The Science of Mental Health. Hoboken: Taylor and
Francis.
[58] Shalom, D., Mostofky, S., Hazlett, R., Goldberg, M., Landa, R., Faran, Y.,
McLeod, D., & Hoehn-Saric, R. (2006). Normal physiological emotions but
differences in expression of conscious feelings in children with high functioning
autism. Journal of Autism and Developmental Disorders, 36(3), 395-400.
[59] Karen Veazey, January 28 2014, Wearable Tech Providing Better Monitoring for
Autistic Children, Wearable Tech World. Retrieved from:
http://www.wearabletechworld.com/topics/wearable-tech/articles/368306-
wearable-tech-providing-better-monitoring-autistic-children.htm
[60] Carrozzo M, May 15th
2014, Government-Funded GPS for Autism Could make
Wearables worth it, Connected World. http://connectedworld.com/government-
funded-gps-for-autism-could-make-wearables-worth-it/
[61] Johanna Mischke, May 20th
2014, Tech for Kids, Wearable Technologies.
Retrieved from: http://www.wearable-technologies.com/2013/05/tech-for-kids/
[62] Non-weighted vest for calming kids with sensory overload, autism, ADHD,
sensory processing disorders, PTSD, dementia using deep pressure touch. (n.d.).
Retrieved June 1, 2014, from http://www.mytjacket.com/
[63] Crichton, L. (n.d.). Music Therapy for the Autistic Child (second edition) by
Juliette Alvin and Auriel Warwick. Oxford: University Press, 1991. £9.95, 3152
pp. British Journal Of Music Education, 276-276.
[64] Canon, W.B., 1927. The James-Lange Theory of Emotions: A Critical
Examination and an Alternative Theory. The American Journal of Psychology,
39(1/4), pp.106–124.
[65] Marston, W.M., 1938. Lie Detector Test, New York: R.R. Smith.
99
[66] Ekman, P., 1999. Basic Emotions. In Handbook of Cognition and Emotion. Wiley
& Sons, Ltd., pp. 45–60.
[67] Russell, J.A., 1980. A circumplex model of affect. Journal of Personality and
Social Psychology, 39(6), pp.1161–1178.
[68] Russell, J.A., 2003. Core affect and the psychological construction of emotion.
Psychological Review, 110(1), pp.145–172.
[69] Documentation Center. (n.d.). Retrieved February 20, 2014, from
http://www.mathworks.com/help/fuzzy/index.html
[70] Documentation Center. (n.d.). Retrieved February 21, 2014, from
http://www.mathworks.com/help/fuzzy/anfis-and-the-anfis-editor-
gui.html#bq3s599
[71] Takagi, T., & Sugeno, M. (1985). Fuzzy identification of systems and its
applications to modeling and control. IEEE Transactions On Systems, Man, and
Cybernetics, 15(1), 116-132.
[72] Castillo, O., & Melin, P. (2008). Type-2 fuzzy logic theory and applications.
Berlin: Springer.
[73] Documentation Center. (n.d.). Retrieved February 26, 2014, from
http://www.mathworks.com/help/fuzzy/comparison-of-sugeno-and-mamdani-
systems.html
[74] Prevalence of Autism Spectrum Disorder Among Children Aged 8 Years —
Autism and Developmental Disabilities Monitoring Network, 11 Sites, United
States, 2010. (2014, March 28). Retrieved July 1, 2014, from
http://www.cdc.gov/mmwr/preview/mmwrhtml/ss6302a1.htm?s_cid=ss6302a1_w
[75] American Psychiatric Association. (2013). Diagnostic and statistical manual of
mental disorders (5th ed.). Arlington, VA: American Psychiatric Publishing.
[76] Mazefsky, C., Herrington, J., Siegel, M., Scarpa, A., Maddox, B., Scahill, L., &
White, S. (2013). The Role of Emotion Regulation in Autism Spectrum Disorder.
Journal of the American Academy of Child & Adolescent Psychiatry, 52(7), 679-
688.
[77] Baker J. No More Meltdowns. Arlington, TX: Future Horizons; 2008.
[78] Scarpa A, Reyes N. Improving emotion regulation with CBT in young children
with high functioning autism spectrum disorders: a pilot study. Behav Cogn
Psychother. 2011;39:495-500.
[79] Scarpa, A., & Reyes, N. (2011). Improving Emotion Regulation with CBT in
Young Children with High Functioning Autism Spectrum Disorders: A Pilot
Study. Behavioural and Cognitive Psychotherapy, 39(4), 495-500.
[80] Berntson, G. G., Bigger, J. T., Eckberg, D. L., Grossman, P., Kaufmann, P. G.,
Malik, M., Nagaraja, H. N., Porges, S. W., Saul, J. P., Stone, P. H., van der
Molen, M. W. (1997). Heart rate variability: Origins, methods, and interpretive
caveats. Psychophysiology, 34, 623-648.
[81] Boucsein, W. (2012). Electrodermal activity (Revised/Expanded ed.). New York:
Springer Science Business Media, LLC.
[82] Jang, J., & Sun, C. (1997). Neuro-fuzzy and soft computing: A computational
approach to learning and machine intelligence. Upper Saddle River, NJ: Prentice
Hall.

100
[83] Sugeno, M., & Kang, G. (1988). Structure identification of fuzzy model. Fuzzy
Sets and Systems, 28(1), 15-33.
[84] Takagi, T., & Sugeno, M. (1985). Fuzzy identification of systems and its
applications to modeling and control. IEEE Transactions On Systems, Man, and
Cybernetics, 15(1), 116-132.
[85] Prevalence of Autism Spectrum Disorders — Autism and Developmental
Disabilities Monitoring Network, 14 Sites, United States, 2008. (2012, March 30).
Retrieved October 11, 2013, from
http://www.cdc.gov/mmwr/preview/mmwrhtml/ss6103a1.htm
[86] Lord, C., Cook, E., Leventhal, B., & Amaral, D. (2000). Autism Spectrum
Disorders. Neuron, 28, 355-363.
[87] Russell, E., & Sofronoff, K. (2005). Anxiety and social worries in children with
Asperger syndrome. Australian and New Zealand Journal of Psychiatry, 39(7),
633-638.
[88] Tremblay, R. E., Mass, L. C., Pagani, L., & Vitaro, F. (1996). From childhood
physical aggression to adolescent maladjustment: The Montreal prevention
experiment. In R. D. Peters & R. J. MacMahon (Eds.), Preventing childhood
disorders, substance abuse and delinquency (pp. 268–298). Thousand Oaks, CA:
Sage.
[89] Raver, C. C., & Zigler, E. F. (1997). Social competence: An untapped dimension
in evaluating Head Start's success. Early Childhood Research Quarterly, 12(4),
363-385.
[90] Ladd, G. W., Kochenderfer, B. J., & Coleman, C. C. (1997). Classroom peer
acceptance, friendship, and victimization: Distinct relational systems that
contribute uniquely to children's school adjustment. Child Development, 68(6),
1181-1197.
[91] Shores, R. E., & Wehby, J. H. (1999). Analyzing the classroom social behavior of
students with EBD. Journal of Emotional and Behavioral Disorders, 7(4), 194-
199.
[92] Knapp, R.B., Kim, J. & André, E., 2011. Physiological Signals and Their Use in
Augmenting Emotion Recognition for Human–Machine Interaction. In R. Cowie,
C. Pelachaud, & P. Petta, eds. Emotion-Oriented Systems. Cognitive
Technologies. New York: Springer Berlin Heidelberg, pp. 133–159.
[93] Knapp, R.B. & Lyon, E., 2011. The Measurement of Performer and Audience
Emotional State as a New Means of Computer Music Interaction: A Performance
Case Study. In Proceedings of the International Computer Music Conference, 31
July -5 August. International Computer Music Conference (ICMC). University of
Huddersfield, England, pp. 415–420.
[94] Porges, S. (2011). The polyvagal theory: Neurophysiological foundations of
emotions, attachment, communication, and self-regulation. New York: W. W.
Norton.
[95] Sugarman, L., Garrison, B., & Williford, K. (2014). Symptoms as Solutions:
Hypnosis and Biofeedback for Autonomic Regulation in Autism Spectrum
Disorders. American Journal of Clinical Hypnosis, 152-173.
101
[96] Brang, D., & Ramachandran, V. (n.d.). Olfactory Bulb Dysgenesis, Mirror
Neuron System Dysfunction, And Autonomic Dysregulation As The Neural Basis
For Autism. Medical Hypotheses, 919-921.
[97] BioBeat v1.3 (n.d.). Retrieved January 28, 2014, from
http://infusionsystems.com/catalog/product_info.php/products_id/197
[98] BioEmo v2.0. (n.d.). Retrieved January 28, 2014, from
http://infusionsystems.com/catalog/product_info.php/products_id/203
[99] Wi-microSystem (incl. LiveSupport-1) (n.d.). Retrieved January 28, 2014, from
http://infusionsystems.com/catalog/product_info.php/products_id/98
[100] Documentation Center. (n.d.). Retrieved February 26, 2014, from
http://www.mathworks.com/help/fuzzy/an-introductory-example-fuzzy-versus-
nonfuzzy-logic.html
[101] SinusRhythmLabels (n.d.). Retrieved July 1, 2014 from
http://en.wikipedia.org/wiki/QRS_complex
[102] Li, H., & Gupta, M. (1995). Fuzzy logic and intelligent systems. Boston: Kluwer
Academic.