Embed Size (px)
Citation preview
Study on Economic Partnership Projects in Developing Countries in FY2015
Feasibility Study of Biomass Fuel Export and Power Generation Projects in Mindanao, Philippines
Final Report
February 2016
Prepared for: Ministry of Economy, Trade and Industry
Prepared by: Chodai Co., Ltd.
Biomass Power Consultant Inc. Omiya Seisakusho Co.,Ltd.

Reproduction Prohibited

Preface
This report represents the collated results of the “FY 2015 Infrastructure System Export Promotion Study
Project ((Study on Formation of Yen Loans and Private-Sector Infrastructure Projects)),” which was awarded by
the Ministry of Economy, Trade and Industry to CHODAI CO., LTD., Biomass Power Consultant Inc. and
Omiya Seisakusho Co.,Ltd..
The study that was conducted, “Feasibility Study of Biomass Fuel Export and Power Generation Projects in
Mindanao, Philippines” was an investigation into the biomass fuel exports and the placement of biomass-power
stations in Caraga, Region XIII of Mindanao, Philippines, in order to consider the feasibility on the construction of
power stations and the infrastructure improvements with the goal of helping to resolve the inherent serious power
shortage in Mindanao, Philippines.
This report is intended to aid in the realization of the above project, as well as providing reference material for
those participants based in Japan.
February 2016
Chodai Co., Ltd.
Biomass Power Consultant Inc. Omiya Seisakusho Co.,Ltd.
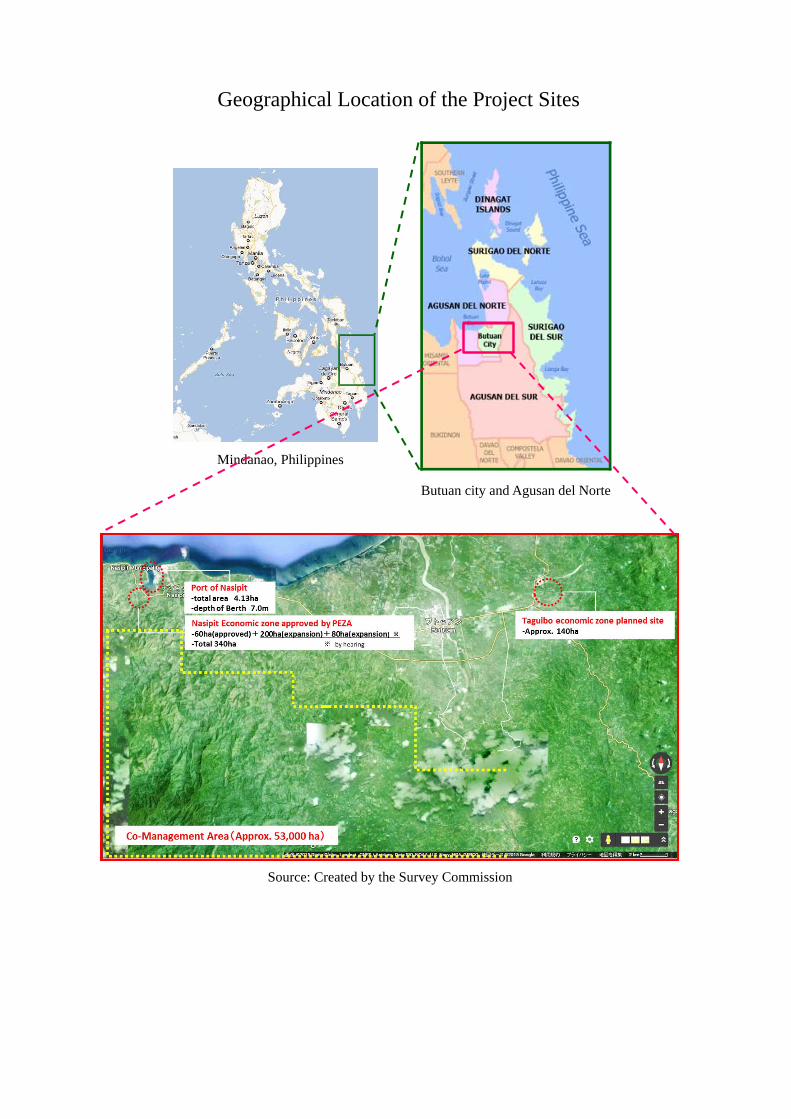
Geographical Location of the Project Sites
Source: Created by the Survey Commission
Mindanao, Philippines
Butuan city and Agusan del Norte
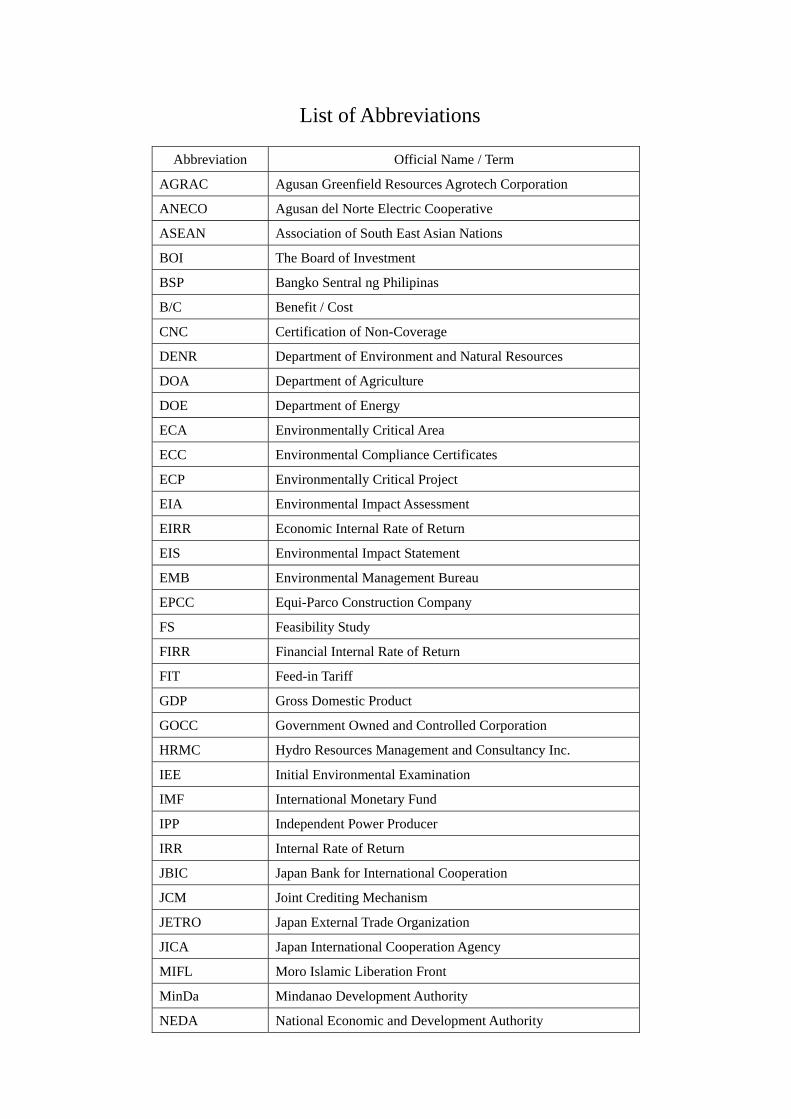
List of Abbreviations
Abbreviation Official Name / Term
AGRAC Agusan Greenfield Resources Agrotech Corporation
ANECO Agusan del Norte Electric Cooperative
ASEAN Association of South East Asian Nations
BOI The Board of Investment
BSP Bangko Sentral ng Philipinas
B/C Benefit / Cost
CNC Certification of Non-Coverage
DENR Department of Environment and Natural Resources
DOA Department of Agriculture
DOE Department of Energy
ECA Environmentally Critical Area
ECC Environmental Compliance Certificates
ECP Environmentally Critical Project
EIA Environmental Impact Assessment
EIRR Economic Internal Rate of Return
EIS Environmental Impact Statement
EMB Environmental Management Bureau
EPCC Equi-Parco Construction Company
FS Feasibility Study
FIRR Financial Internal Rate of Return
FIT Feed-in Tariff
GDP Gross Domestic Product
GOCC Government Owned and Controlled Corporation
HRMC Hydro Resources Management and Consultancy Inc.
IEE Initial Environmental Examination
IMF International Monetary Fund
IPP Independent Power Producer
IRR Internal Rate of Return
JBIC Japan Bank for International Cooperation
JCM Joint Crediting Mechanism
JETRO Japan External Trade Organization
JICA Japan International Cooperation Agency
MIFL Moro Islamic Liberation Front
MinDa Mindanao Development Authority
NEDA National Economic and Development Authority
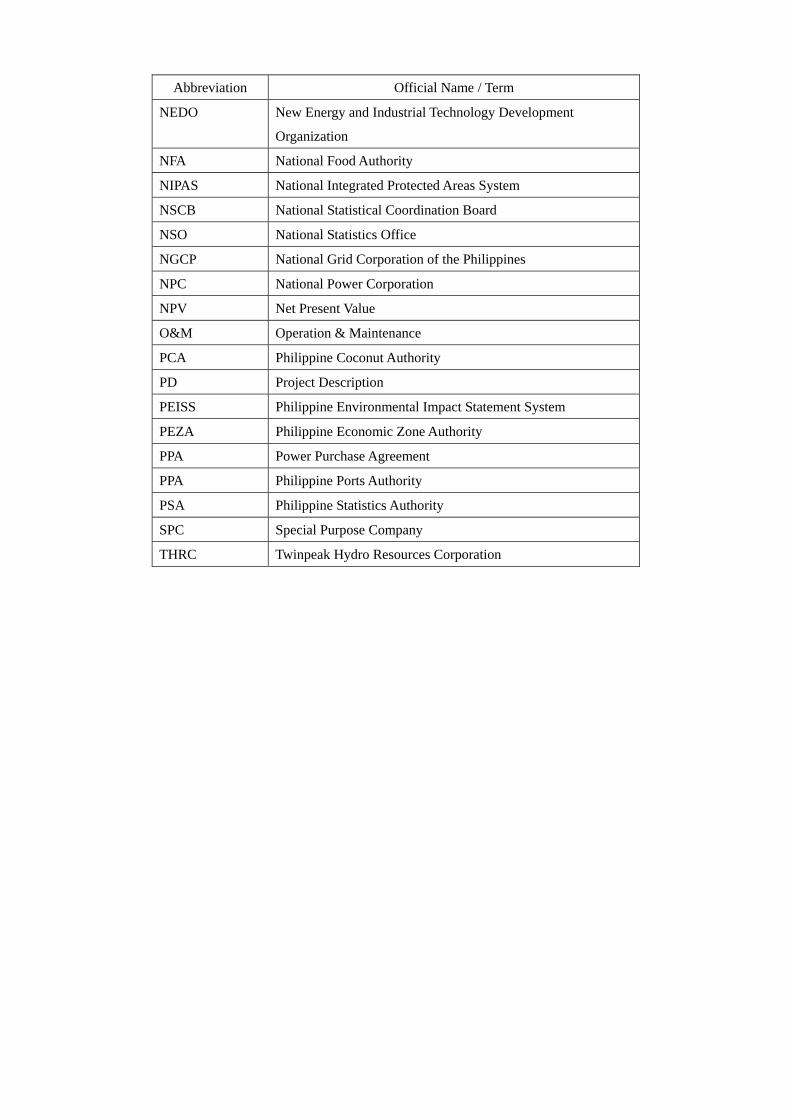
Abbreviation Official Name / Term
NEDO New Energy and Industrial Technology Development
Organization
NFA National Food Authority
NIPAS National Integrated Protected Areas System
NSCB National Statistical Coordination Board
NSO National Statistics Office
NGCP National Grid Corporation of the Philippines
NPC National Power Corporation
NPV Net Present Value
O&M Operation & Maintenance
PCA Philippine Coconut Authority
PD Project Description
PEISS Philippine Environmental Impact Statement System
PEZA Philippine Economic Zone Authority
PPA Power Purchase Agreement
PPA Philippine Ports Authority
PSA Philippine Statistics Authority
SPC Special Purpose Company
THRC Twinpeak Hydro Resources Corporation
Contents
Preface
Geographical Location of the Project Sites
List of Abbreviations
Contents
Executive Summary
(1)Project Background & Necessity ..................................................................................................... 1
(2)Basic Policy for Securing Project Approval ..................................................................................... 2
(3)Project Overview .............................................................................................................................. 5
(4)Implementation Schedule ................................................................................................................. 7
(5)Project Feasibility ............................................................................................................................ 9
(6)Competitive Advantages of Japanese Companies .......................................................................... 12
(7)Schedule towards Project Realization & Associated Risks ............................................................ 13
(8)Map of Project Location in Partner Country .................................................................................. 16
Chapter1 Overview of Partner Country and the Sector .................................................................. 1-2
(1)Economy of the partner country .................................................................................................... 1-1
1)Overview of the Economy1-1
2)Trade ............................................................................................................................................... 1-2
3)Inward investment .......................................................................................................................... 1-2
4)Structure of industry ....................................................................................................................... 1-3
5)Public finances ............................................................................................................................... 1-3
6)Population ....................................................................................................................................... 1-4
(2)Overview of the sector .................................................................................................................. 1-6
1)Electricity market in Mindanao ...................................................................................................... 1-6
2)Electric power network in Mindanao and Agusan del Norte .......................................................... 1-8
3)Issues in Mindanao and future development plans ....................................................................... 1-10
(3)Regional overview ...................................................................................................................... 1-11
1)Geographical and administrative divisions ................................................................................... 1-11
2)Climate and land use .................................................................................................................... 1-12
3)Population ..................................................................................................................................... 1-13
4)Local communities (barangays) ................................................................................................... 1-13
5)Infrastructure ................................................................................................................................ 1-13
6)Industry ......................................................................................................................................... 1-14
Chapter2 Methodology ................................................................................................................... 2-1
(1)Subject of the study ....................................................................................................................... 2-1
(2)Methodology and organization...................................................................................................... 2-3
(3)Research schedule ......................................................................................................................... 2-4
Chapter 3 Project Details and Investigation into Technological Feasibility ................................... 3-1
(1)Project Background, Requirement for the Project etc. ........................................................... 3-1
1) A chronic shortage of power in Mindanao ................................................................................. 3-1
2) Rich biomass resources in the region ......................................................................................... 3-2
3) Effects and influences of the implementation of this project ..................................................... 3-4
(2)Investigation into Acquisition of Usable Biomass Resources ................................................ 3-6
1) Outline ........................................................................................................................................ 3-6
2) Wood resources ........................................................................................................................ 3-10
3) Rice husks ................................................................................................................................ 3-22
4) Coconuts ................................................................................................................................... 3-23
(3)Current State of Nasipit Port ................................................................................................ 3-30
1)Overview of Nasipit Port ......................................................................................................... 3-30
2)Nasipit Port Specifications ....................................................................................................... 3-30
(4)Investigations Required to Determine Project Details ......................................................... 3-34
1) Policy for the use of biomass resources ....................................................................................... 3-34
2) Overview ..................................................................................................................................... 3-38
(5)Outline of Project Plan ......................................................................................................... 3-39
1)Power generation from the burning of rice husks ......................................................................... 3-39
2) Production and export of wood pellets made from sawdust ........................................................ 3-43
Chapter4 Environmental and Social Issues........................................................................................... 1
(1)Analysis of current environmental and social issues ............................................................. 4-1
1)The current situation .................................................................................................................. 4-1
2)Future projections (if the project does not go ahead) ................................................................. 4-5
(2)Environmental benefits of the project .................................................................................... 4-7
1)CO2 emissions from the project ................................................................................................ 4-8
2)Base line CO2 reductions from the project ................................................................................ 4-9
3)Reduction in greenhouse gases ................................................................................................ 4-11
(3)Environmental and social impact of the project ................................................................... 4-11
1)Environmental factors affected ................................................................................................ 4-11
2)Other concerns relating to environmental impact .................................................................... 4-15
(4)Overview of environmental and social legislation in the partner country ........................... 4-16
1)Basic Environment Act ............................................................................................................ 4-16
2)Philippine Environmental Impact Statement System ............................................................... 4-17
3)Regulations on land acquisition ............................................................................................... 4-18
(5)Items for action in the host country for the project to go ahead (by organizations implementing, or
involved in, the project) ....................................................................................................................... 4-19
Chapter 5 Financial & Economic Feasibility ..................................................................................... 5-1
(1)Estimation of project costs ............................................................................................................ 5-1
(2)Summary of results of preliminary financial/economic analysis .................................................. 5-2
1)Funding situation ............................................................................................................................ 5-2
2)Miscellaneous detailed terms ......................................................................................................... 5-2
3)Business plan .................................................................................................................................. 5-4
4)Summary of financial analysis results ............................................................................................ 5-5
5)Economic analysis .......................................................................................................................... 5-7
Chapter 6 Project Implementation Schedule ...................................................................................... 6-1
Chapter 7 Implementation Ability of Partner Country Implementing Bodies
(1)Power generation through the burning of rice husks ............................................................... 7-1
(2)Production and export of wood pellets made from sawdust .................................................... 7-2
Chapter8 Comparative Advantages of Japanese Companies ............................................................. 8-1
(1)Assumed role of Japanese companies (investment, supply of materials and equipment, facility
management, etc.) for the project .......................................................................................................... 8-1
(2)Advantages of Japanese companies (technical and financial) ....................................................... 8-2
(3)Necessary steps to facilitate orders from Japanese companies ..................................................... 8-3
Chapter 9 Prospects for Project Funding ........................................................................................... 9-1
(1)Consideration of funding sources and procurement plans ............................................................ 9-1
(2)Funding feasibility ........................................................................................................................ 9-5
(3)Cash flow analysis ........................................................................................................................ 9-6
Chapter 10 Action Plan & Challenges to Project Implementation ..................................................... 1
(1) Current efforts towards project realization ...................................................................................... 1
1) Establish a cooperative framework for the project ........................................................................... 1
2) Formation of an alliance for procuring raw materials ...................................................................... 2
(2) Efforts to secure the cooperation of the local governmental authorities and implementing bodies 4
(3) Existence of legal and economic restrictions in the partner country ............................................... 8
(4) Necessity for additional detailed analysis ....................................................................................... 9
1) Detailed technical investigation ....................................................................................................... 9
2) Tax benefits investigation ............................................................................................................... 10
3) Project implementation body .......................................................................................................... 10
4) Project scheme and method for raising capital ............................................................................... 10
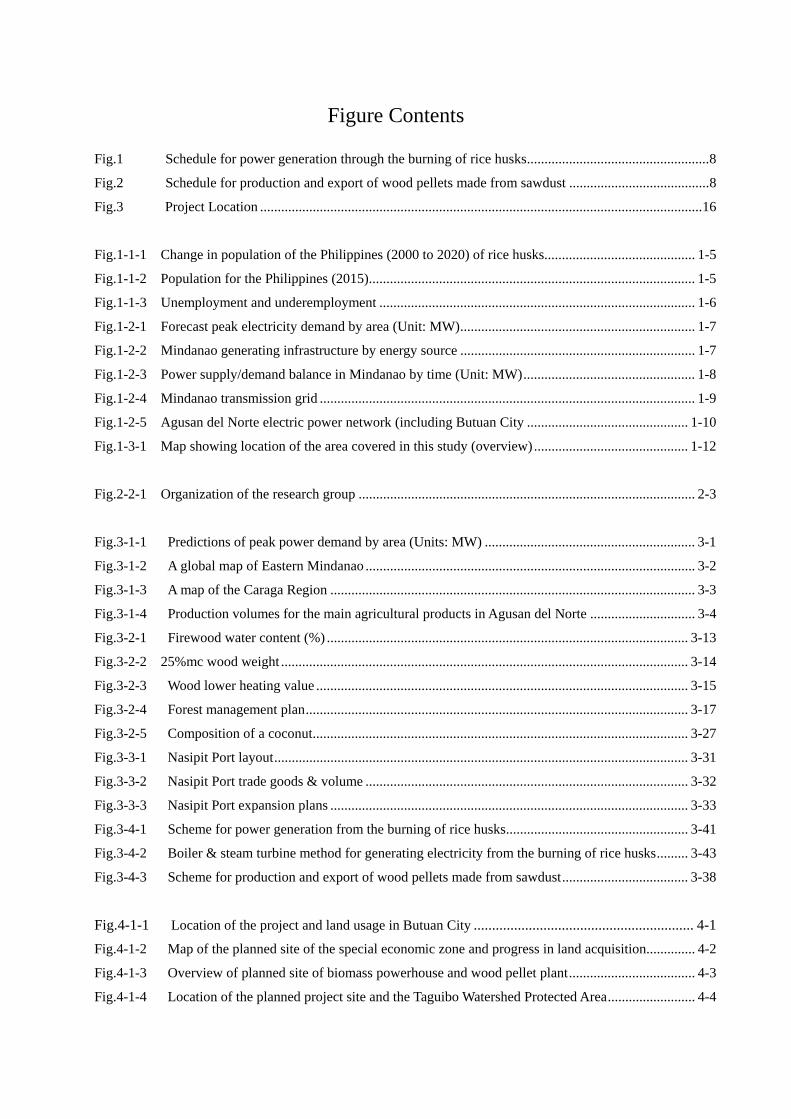
Figure Contents
Fig.1 Schedule for power generation through the burning of rice husks .................................................... 8
Fig.2 Schedule for production and export of wood pellets made from sawdust ........................................ 8
Fig.3 Project Location .............................................................................................................................. 16
Fig.1-1-1 Change in population of the Philippines (2000 to 2020) of rice husks ........................................... 1-5
Fig.1-1-2 Population for the Philippines (2015) ............................................................................................. 1-5
Fig.1-1-3 Unemployment and underemployment .......................................................................................... 1-6
Fig.1-2-1 Forecast peak electricity demand by area (Unit: MW) ................................................................... 1-7
Fig.1-2-2 Mindanao generating infrastructure by energy source ................................................................... 1-7
Fig.1-2-3 Power supply/demand balance in Mindanao by time (Unit: MW) ................................................. 1-8
Fig.1-2-4 Mindanao transmission grid ........................................................................................................... 1-9
Fig.1-2-5 Agusan del Norte electric power network (including Butuan City .............................................. 1-10
Fig.1-3-1 Map showing location of the area covered in this study (overview) ............................................ 1-12
Fig.2-2-1 Organization of the research group ................................................................................................ 2-3
Fig.3-1-1 Predictions of peak power demand by area (Units: MW) ............................................................ 3-1
Fig.3-1-2 A global map of Eastern Mindanao .............................................................................................. 3-2
Fig.3-1-3 A map of the Caraga Region ........................................................................................................ 3-3
Fig.3-1-4 Production volumes for the main agricultural products in Agusan del Norte .............................. 3-4
Fig.3-2-1 Firewood water content (%) ....................................................................................................... 3-13
Fig.3-2-2 25%mc wood weight .................................................................................................................... 3-14
Fig.3-2-3 Wood lower heating value .......................................................................................................... 3-15
Fig.3-2-4 Forest management plan ............................................................................................................. 3-17
Fig.3-2-5 Composition of a coconut ........................................................................................................... 3-27
Fig.3-3-1 Nasipit Port layout ...................................................................................................................... 3-31
Fig.3-3-2 Nasipit Port trade goods & volume ............................................................................................ 3-32
Fig.3-3-3 Nasipit Port expansion plans ...................................................................................................... 3-33
Fig.3-4-1 Scheme for power generation from the burning of rice husks .................................................... 3-41
Fig.3-4-2 Boiler & steam turbine method for generating electricity from the burning of rice husks ......... 3-43
Fig.3-4-3 Scheme for production and export of wood pellets made from sawdust .................................... 3-38
Fig.4-1-1 Location of the project and land usage in Butuan City ............................................................ 4-1
Fig.4-1-2 Map of the planned site of the special economic zone and progress in land acquisition.............. 4-2
Fig.4-1-3 Overview of planned site of biomass powerhouse and wood pellet plant .................................... 4-3
Fig.4-1-4 Location of the planned project site and the Taguibo Watershed Protected Area ......................... 4-4
Table Contents
Table 1 Potential for biomass resources as fuel for power generation ........................................................... 2
Table 2 Results of feasibility study for sourcing biomass resources .............................................................. 3
Table 3 Effective use of feasible biomass resources ...................................................................................... 4
Table 4 Project overview for power generation from the burning of rice husks ............................................ 5
Table 5 Project overview for production and export of wood pellets made from sawdust ............................ 6
Table 6 Implementation Ability of Partner Country Implementing Bodies .................................................... 9
Table 7 Project schedule for power generation through the burning of rice husks....................................... 13
Table 8 Project schedule for producing and exporting wood pellets made from sawdust ............................ 14
Table 9 Project risks for power generation from the burning of rice husks .................................................. 14
Table 10 Project risks for producing and exporting wood pellets made from sawdust ................................ 15
Table 1-1-1 Fundamental economic indicators .............................................................................................. 1-1
Table 1-1-2 Balance of trade (units: million USD) ........................................................................................ 1-2
Table 1-1-3 Direct foreign investment ........................................................................................................... 1-3
Table 1-1-4 GDP by sector ............................................................................................................................. 1-3
Table 1-1-5 Public finances ............................................................................................................................ 1-4
Table 1-2-1 Mindanao transmission network ................................................................................................. 1-9
Table 1-3-1 Butuan City land usage ............................................................................................................. 1-13
Table 1-3-2 Agusan del Norte land usage .................................................................................................... 1-13
Table 1-3-3 Agusan del Norte agricultural production ................................................................................. 1-14
Table 2-3-1 Research schedule ......................................................................................................................... 13
Table 2-3-2 Outline of findings from fieldwork ............................................................................................... 12
Table 3-1-1 Production volumes for the main agricultural products in the four provinces of the Caraga
Region (Units: Tons) ......................................................................................................................................... 3-1
Table 3-2-1 Types of biomass......................................................................................................................... 3-6
Table 3-2-2 Types of wood biomass ............................................................................................................... 3-7
Table 3-2-3 Oil content of oil crops ............................................................................................................. 3-10
Table 3-2-4 Outline of co-managed regions in Agusan del Norte ................................................................ 3-11
Table 3-2-5 Wood composition (water content %) ....................................................................................... 3-12
Table 3-2-6 Wood elemental composition (dry %)....................................................................................... 3-12
Table 3-2-7 Charcoal elemental analysis via fluorescent X rays (dry %) .................................................... 3-12
Table 3-2-8 Wood fuel research results ........................................................................................................ 3-13
Table 3-2-9 Wood lower heating value ......................................................................................................... 3-14
Table 3-2-10 Required volume of wood ....................................................................................................... 3-16
Table 3-2-11 Targets for wood production via forest management .............................................................. 3-16
Table 3-2-12 Outline of forest management project initial expenses ........................................................... 3-18
Table 3-2-13 Research & development costs ............................................................................................... 3-18
Table 3-2-14 Construction & road construction costs .................................................................................. 3-18
Table 3-2-15 Details of initial costs for plantation project ........................................................................... 3-19
Table 3-2-16 Annual expenses for the forest management project .............................................................. 3-19
Table 3-2-17 List of rice producers targeted by inquiry investigations ........................................................ 3-22
Table 3-2-18 Climate conditions .................................................................................................................. 3-25
Table 3-2-19 Soil Conditions ....................................................................................................................... 3-25
Table 3-3-1 Nasipit Port expansion plans & progress report ........................................................................ 3-32
Table 3-4-1 Investigations required to determine project details ................................................................. 3-35
Table 3-4-2 Outline of power generation from the burning of rice husks .................................................... 3-39
Table 3-4-3 Rice husks power generation process (power generation) ........................................................ 3-41
Table 3-4-4 Rice husks power generation process (power generation) ........................................................ 3-42
Table 3-4-5 Rice husks power generation process (power generation only) ................................................ 3-42
Table 3-4-6 Outline of production and export of wood pellets made from sawdust .................................... 3-43
Table 3-4-7 Pellet production process .......................................................................................................... 3-44
Table 4-1-1 Butuan City land usage ............................................................................................................... 4-1
Table 4-2-1 Scale of the project ..................................................................................................................... 4-6
Table 4-2-2 Reduction in greenhouse gases (CO2) ....................................................................................... 4-10
Table 4-3-1 JICA environment checklist (5 - Other power generation) ....................................................... 4-10
Table 4-4-1 Environmental legislation in the Philippines ............................................................................ 4-15
Table 4-4-2 Categories in the Philippine Environmental Impact Statement System (biomass power
generation) ....................................................................................................................................................... 4-16
Table 4-4-3 Legislation on land and indigenous peoples in the Philippines ................................................ 4-17
Table 5-1-1 Project costs for power generation through the burning of rice husks ........................................ 5-1
Table 5-1-2 Project costs for production and export of wood pellets made from sawdust ............................. 5-1
Table 5-2-1 Project terms for power generation through the burning of rice husks ....................................... 5-2
Table 5-2-2 Project terms for production and export of wood pellets made from sawdust ............................ 5-3
Table 5-2-3 Financial analysis for power generation through the burning of rice husks ............................. 5-4
Table 5-2-4 Cash flow for power generation through the burning of rice husks ............................................ 5-4
Table 5-2-5 Financial analysis for production and export of wood pellets made from sawdust (in the case of
procurement of Japanese manufacturer) ............................................................................................................ 5-5
Table 5-2-6 Cash flow for production and export of wood pellets made from sawdust (in the case of
procurement of Japanese manufacturer) ............................................................................................................ 5-5
Table 5-2-7 Financial analysis for production and export of wood pellets made from sawdust
(in the case of procurement of foreign manufacturer) ....................................................................................... 5-7
Table 5-2-8 Cash flow for production and export of wood pellets made from sawdust
(in the case of procurement of foreign manufacturer) ....................................................................................... 5-7
Table 5-2-9 Social and economic cost of the project to generate power through the burning of rice husks .. 5-8
Table 5-2-10 Calculation data for the social and economic cost of an alternative project ............................. 5-9
Table 5-2-11 Economic assessment of the project to generate power through the burning of rice husks ...... 5-9
Table 5-2-12 Comparison of the social and economic costs of the project to generate power through the
burning of rice husks versus an alternative project ......................................................................................... 5-10
Table 6-1-1 Implementation schedule for power generation through the burning of rice husks .................... 6-1
Table 6-1-2 Implementation schedule for production and export of wood pellets made from sawdust ......... 6-2
Table 7-1 Implementation ability of partner country implementing bodies ................................................... 7-1
Table 7-2 Implementation ability of partner country implementing bodies ................................................... 7-2
Table 9-1-1: Overview of meeting with NEDO ................................................................................................ 9-1
Table 9-1-2: Overview of Meeting with Ministry of the Environment ............................................................. 9-3
Table 9-3-1: Cash flow as seen by the project implementing bodies
(Power generation through the burning of rice husks) ...................................................................................... 9-6
Table 9-3-2: Cash flow as seen by the project implementing bodies
(Production and export of wood pellets made from sawdust) ........................................................................... 9-7
Table 9-3-3: Cash flow as seen by the fund providers and lenders
(Power generation through the burning of rice husks) ...................................................................................... 9-8
Table 9-3-4 Cash flow as seen by the fund providers and lenders
(Production and export of wood pellets made from sawdust) ........................................................................... 9-9
Table 9-3-5: Sensitivity analysis for the unit price of electric power sales ..................................................... 9-10
Table 9-3-6: Sensitivity analysis for the cost of required equipment .............................................................. 9-10
Table 9-3-7: Sensitivity analysis for unit price of wood pellet sales ............................................................... 9-10
Table 9-3-8: Sensitivity analysis for cost of required equipment .................................................................... 9-10
Table 10-1-1 Green Energy Laboratory Co., Ltd. conference summary ...................................................... 10-1
Table 10-1-2 Project information session for rice milling plants ................................................................. 10-2
Table 10-2-1 Rice husk combustion power plant survey results .................................................................. 10-4
Table 10-2-2 Meeting with electricity purchaser candidate (ANECO) ........................................................ 10-7
Picture Contents
Photo 3-2-1 Wood scraps in on-site wood mill-1 ........................................................................................... 3-7
Photo 3-2-2 Wood scraps in on-site wood mill-2 ........................................................................................... 3-7
Photo 3-2-3 Wood from construction work .................................................................................................... 3-8
Photo 3-2-4 Forest residual wood (e.g. from thinning) .................................................................................. 3-8
Photo 3-2-5 Grass biomass: rice straw ........................................................................................................... 3-9
Photo 3-2-6 Grass biomass: rice husks ........................................................................................................... 3-9
Photo 3-2-7 Oil biomass soy (as grass) ........................................................................................................ 3-10
Photo 3-2-8 Oil biomass soy (fruit) .............................................................................................................. 3-10
Photo 3-2-9 Jatropha seeds ........................................................................................................................... 3-10
Photo 3-2-10 A local market (stall selling coconuts) ................................................................................... 3-24
Photo 3-2-11 Coco palm trunk ..................................................................................................................... 3-26
Photo 3-2-12 Coco palm roots ..................................................................................................................... 3-26
Photo 3-2-13 Products derived from the coco palm ..................................................................................... 3-28
Photo 3-2-14 Works of art ............................................................................................................................ 3-28
Photo 3-2-15 Erosion prevention (sandbags) ............................................................................................... 3-29
Photo 3-2-16 Erosion prevention (slope protection) .................................................................................... 3-29
Photo 3-3-1 Nasipit Port ............................................................................................................................... 3-30
Photo 3-3-2 Nasipit Port trade goods ........................................................................................................... 3-31
Photo 3-3-3 Nasipit Port stockyard .............................................................................................................. 3-32
Photo 4-1-1 Inside the special economic zone (above: developed; below: undeveloped) ............................. 4-7
Photo 4-1-2 Planned site of the project .......................................................................................................... 4-7
Photo 4-1-3 Rice husks (left) and sawdust (right) dumped in the open air .................................................... 4-8
Photo 10-1-1 Project information session for rice milling plants .................................................................... 10-3
1
Overview
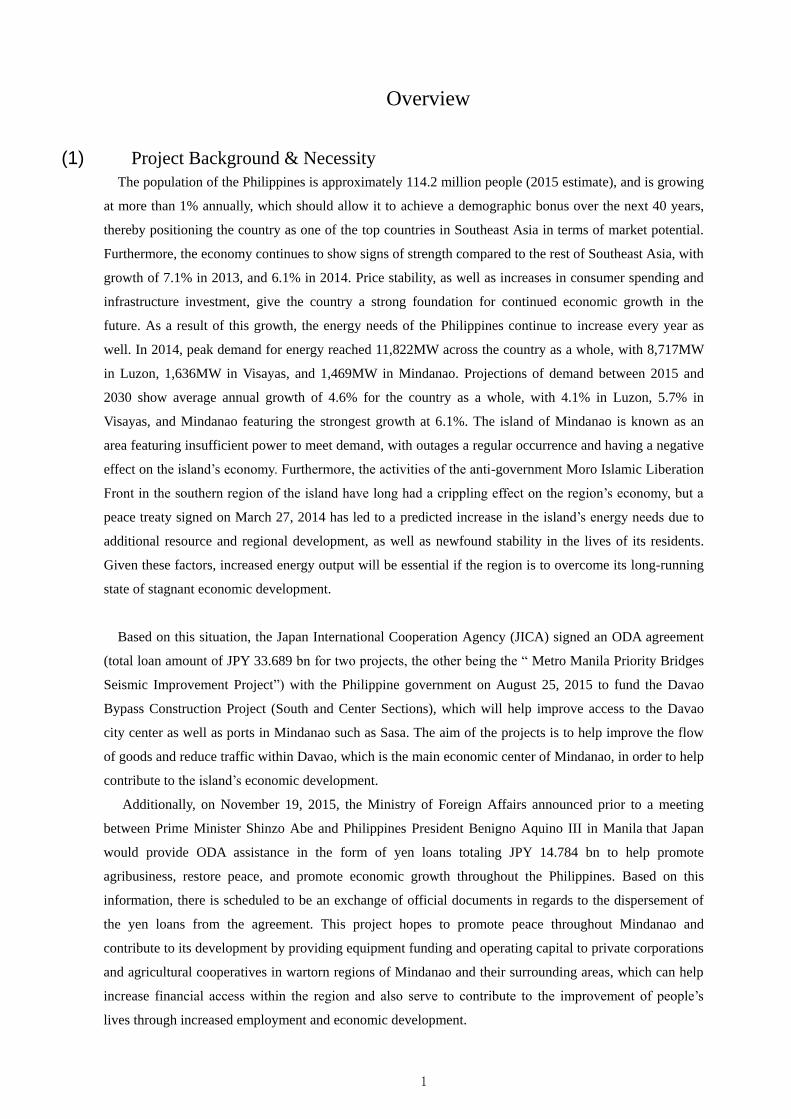
(1) Project Background & Necessity
The population of the Philippines is approximately 114.2 million people (2015 estimate), and is growing
at more than 1% annually, which should allow it to achieve a demographic bonus over the next 40 years,
thereby positioning the country as one of the top countries in Southeast Asia in terms of market potential.
Furthermore, the economy continues to show signs of strength compared to the rest of Southeast Asia, with
growth of 7.1% in 2013, and 6.1% in 2014. Price stability, as well as increases in consumer spending and
infrastructure investment, give the country a strong foundation for continued economic growth in the
future. As a result of this growth, the energy needs of the Philippines continue to increase every year as
well. In 2014, peak demand for energy reached 11,822MW across the country as a whole, with 8,717MW
in Luzon, 1,636MW in Visayas, and 1,469MW in Mindanao. Projections of demand between 2015 and
2030 show average annual growth of 4.6% for the country as a whole, with 4.1% in Luzon, 5.7% in
Visayas, and Mindanao featuring the strongest growth at 6.1%. The island of Mindanao is known as an
area featuring insufficient power to meet demand, with outages a regular occurrence and having a negative
effect on the island’s economy. Furthermore, the activities of the anti-government Moro Islamic Liberation
Front in the southern region of the island have long had a crippling effect on the region’s economy, but a
peace treaty signed on March 27, 2014 has led to a predicted increase in the island’s energy needs due to
additional resource and regional development, as well as newfound stability in the lives of its residents.
Given these factors, increased energy output will be essential if the region is to overcome its long-running
state of stagnant economic development.
Based on this situation, the Japan International Cooperation Agency (JICA) signed an ODA agreement
(total loan amount of JPY 33.689 bn for two projects, the other being the “ Metro Manila Priority Bridges
Seismic Improvement Project”) with the Philippine government on August 25, 2015 to fund the Davao
Bypass Construction Project (South and Center Sections), which will help improve access to the Davao
city center as well as ports in Mindanao such as Sasa. The aim of the projects is to help improve the flow
of goods and reduce traffic within Davao, which is the main economic center of Mindanao, in order to help
contribute to the island’s economic development.
Additionally, on November 19, 2015, the Ministry of Foreign Affairs announced prior to a meeting
between Prime Minister Shinzo Abe and Philippines President Benigno Aquino III in Manila that Japan
would provide ODA assistance in the form of yen loans totaling JPY 14.784 bn to help promote
agribusiness, restore peace, and promote economic growth throughout the Philippines. Based on this
information, there is scheduled to be an exchange of official documents in regards to the dispersement of
the yen loans from the agreement. This project hopes to promote peace throughout Mindanao and
contribute to its development by providing equipment funding and operating capital to private corporations
and agricultural cooperatives in wartorn regions of Mindanao and their surrounding areas, which can help
increase financial access within the region and also serve to contribute to the improvement of people’s
lives through increased employment and economic development.
2
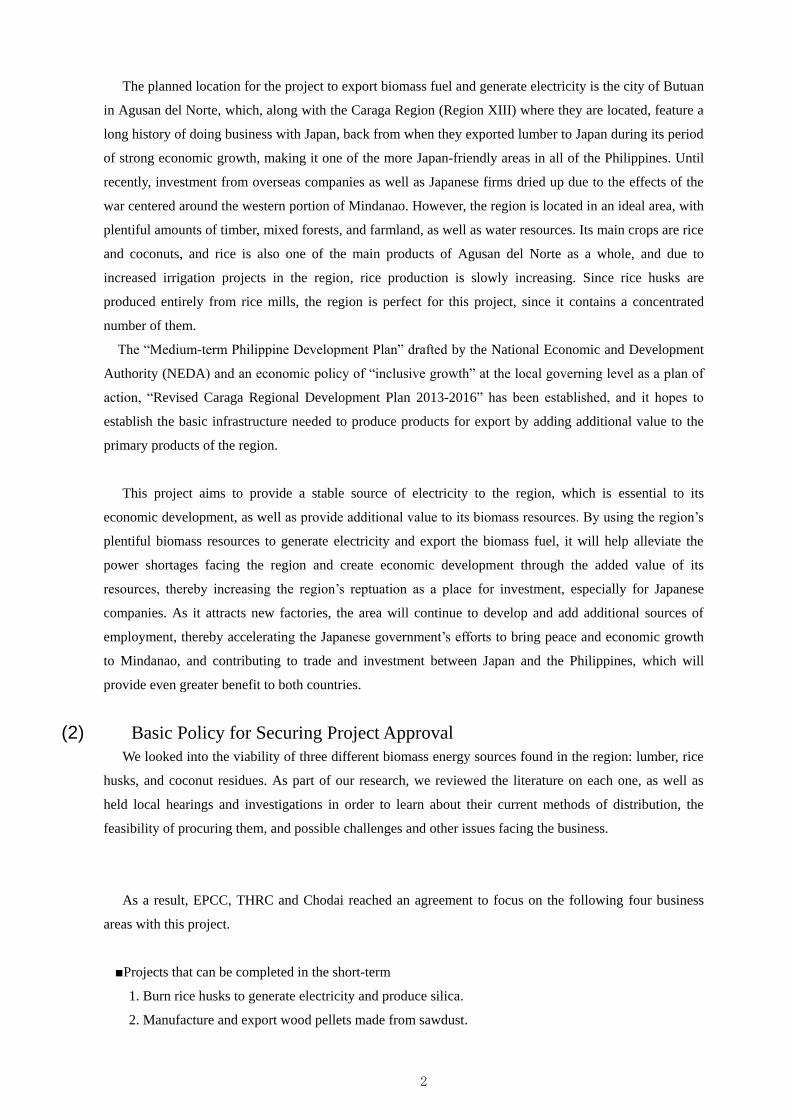
The planned location for the project to export biomass fuel and generate electricity is the city of Butuan
in Agusan del Norte, which, along with the Caraga Region (Region XIII) where they are located, feature a
long history of doing business with Japan, back from when they exported lumber to Japan during its period
of strong economic growth, making it one of the more Japan-friendly areas in all of the Philippines. Until
recently, investment from overseas companies as well as Japanese firms dried up due to the effects of the
war centered around the western portion of Mindanao. However, the region is located in an ideal area, with
plentiful amounts of timber, mixed forests, and farmland, as well as water resources. Its main crops are rice
and coconuts, and rice is also one of the main products of Agusan del Norte as a whole, and due to
increased irrigation projects in the region, rice production is slowly increasing. Since rice husks are
produced entirely from rice mills, the region is perfect for this project, since it contains a concentrated
number of them.
The “Medium-term Philippine Development Plan” drafted by the National Economic and Development
Authority (NEDA) and an economic policy of “inclusive growth” at the local governing level as a plan of
action, “Revised Caraga Regional Development Plan 2013-2016” has been established, and it hopes to
establish the basic infrastructure needed to produce products for export by adding additional value to the
primary products of the region.
This project aims to provide a stable source of electricity to the region, which is essential to its
economic development, as well as provide additional value to its biomass resources. By using the region’s
plentiful biomass resources to generate electricity and export the biomass fuel, it will help alleviate the
power shortages facing the region and create economic development through the added value of its
resources, thereby increasing the region’s reptuation as a place for investment, especially for Japanese
companies. As it attracts new factories, the area will continue to develop and add additional sources of
employment, thereby accelerating the Japanese government’s efforts to bring peace and economic growth
to Mindanao, and contributing to trade and investment between Japan and the Philippines, which will
provide even greater benefit to both countries.
(2) Basic Policy for Securing Project Approval
We looked into the viability of three different biomass energy sources found in the region: lumber, rice
husks, and coconut residues. As part of our research, we reviewed the literature on each one, as well as
held local hearings and investigations in order to learn about their current methods of distribution, the
feasibility of procuring them, and possible challenges and other issues facing the business.
As a result, EPCC, THRC and Chodai reached an agreement to focus on the following four business
areas with this project.
■Projects that can be completed in the short-term
1. Burn rice husks to generate electricity and produce silica.
2. Manufacture and export wood pellets made from sawdust.
3
■Projects that can be completed in the medium to long-term
3. Use coconut residues to generate electricity and produce activated carbon.
4. Attract lumber mills to an industrial complex in order to obtain and utilize scrap wood for a biomass
electricity generator.
In regards to options 3 and 4 above, it will be necessary to coordinate those efforts over the medium to
long-term with the formation of an industrial complex as previously mentioned, so the studies and research
that follow in this report are focused on options 1 and 2.
(3) Project Overview
1) Proposed project details and budget
After conducting a study to confirm which biomass resources could be easily procured and provide a
steady supply from the region, we decided to focus on two projects to provide detailed plans for: (1)
power generation and silica production from the burning of rice husks; and (2) production and export
of wood pellets made from sawdust.
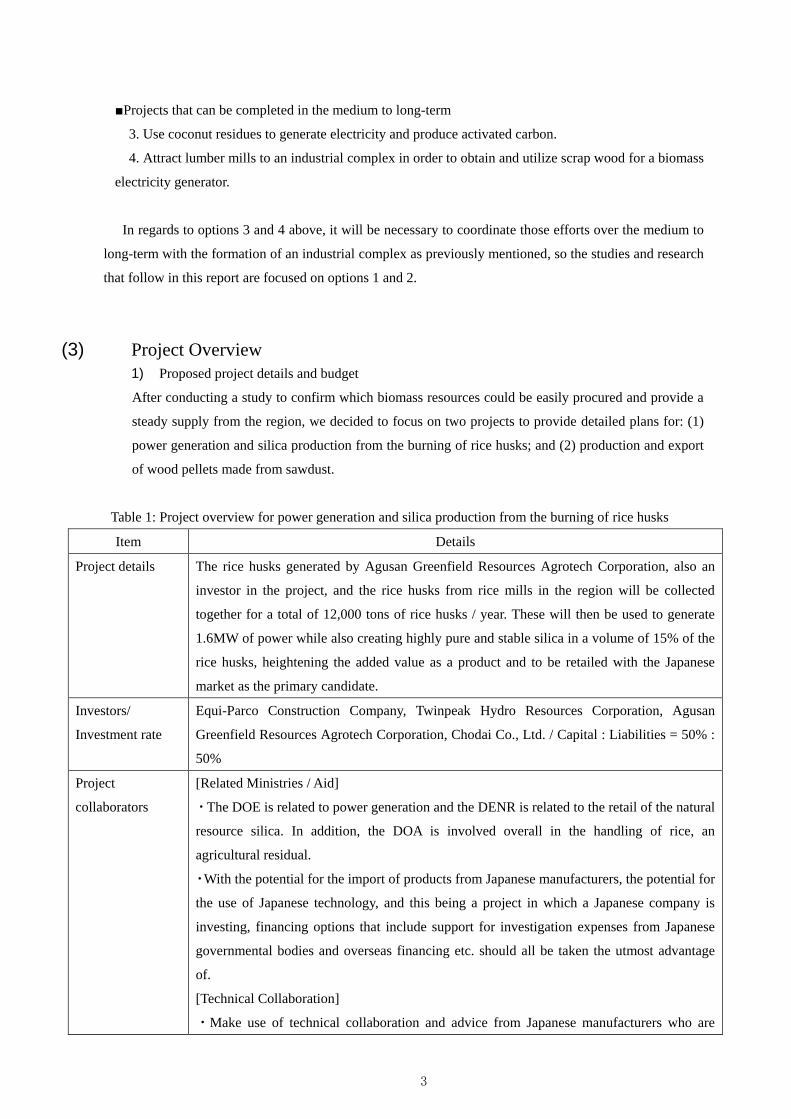
Table 1: Project overview for power generation and silica production from the burning of rice husks
Item Details
Project details The rice husks generated by Agusan Greenfield Resources Agrotech Corporation, also an
investor in the project, and the rice husks from rice mills in the region will be collected
together for a total of 12,000 tons of rice husks / year. These will then be used to generate
1.6MW of power while also creating highly pure and stable silica in a volume of 15% of the
rice husks, heightening the added value as a product and to be retailed with the Japanese
market as the primary candidate.
Investors/
Investment rate
Equi-Parco Construction Company, Twinpeak Hydro Resources Corporation, Agusan
Greenfield Resources Agrotech Corporation, Chodai Co., Ltd. / Capital : Liabilities = 50% :
50%
Project
collaborators
[Related Ministries / Aid]
・The DOE is related to power generation and the DENR is related to the retail of the natural
resource silica. In addition, the DOA is involved overall in the handling of rice, an
agricultural residual.
・With the potential for the import of products from Japanese manufacturers, the potential for
the use of Japanese technology, and this being a project in which a Japanese company is
investing, financing options that include support for investigation expenses from Japanese
governmental bodies and overseas financing etc. should all be taken the utmost advantage
of.
[Technical Collaboration]
・Make use of technical collaboration and advice from Japanese manufacturers who are
4
candidates for exporting products to, and Osaka University and Kurimoto Ltd., which are
conducting advanced research into the handling of rice husks.
[Collaboration for Acquisition of Materials]
・Assumes the formation of an alliance with regional rice millers, forming a collaborative
relationship in which the rice husks are obtained in return for a share of the project profits.
[Off Take]
・Sale of the power will be assumed to be made within the Philippines. In regard to the silica,
the project will be planned with export to the Japanese market in mind, while also taking the
market conditions within the Philippines into account.
Schedule Investigation period 2 years, project period 20 years
Products, retail
clients and retail
conditions
・Power / Assuming sale at FIT prices, whom to sell the power to is one of the points of
future investigation.
・Silica / After a detailed investigation into the technological aspects of this high level added
value, investigate the price and whom to sell to.
Project scale Approx. PHP 335 mn
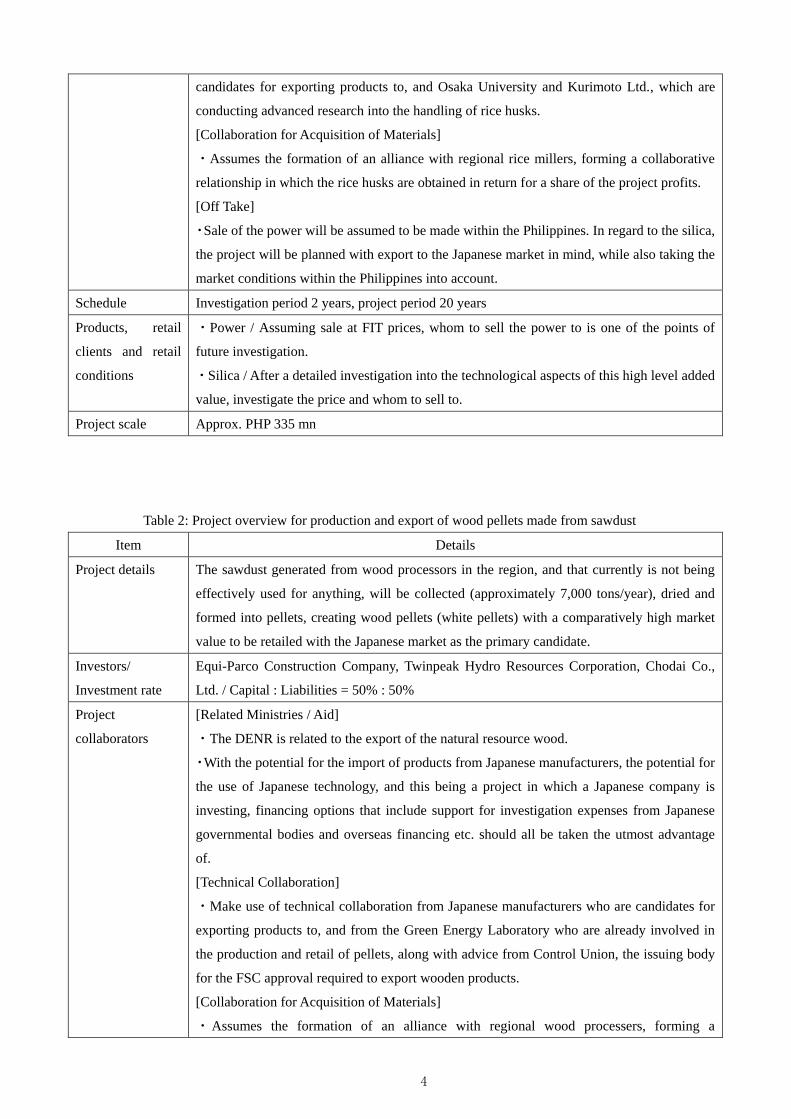
Table 2: Project overview for production and export of wood pellets made from sawdust
Item Details
Project details The sawdust generated from wood processors in the region, and that currently is not being
effectively used for anything, will be collected (approximately 7,000 tons/year), dried and
formed into pellets, creating wood pellets (white pellets) with a comparatively high market
value to be retailed with the Japanese market as the primary candidate.
Investors/
Investment rate
Equi-Parco Construction Company, Twinpeak Hydro Resources Corporation, Chodai Co.,
Ltd. / Capital : Liabilities = 50% : 50%
Project
collaborators
[Related Ministries / Aid]
・The DENR is related to the export of the natural resource wood.
・With the potential for the import of products from Japanese manufacturers, the potential for
the use of Japanese technology, and this being a project in which a Japanese company is
investing, financing options that include support for investigation expenses from Japanese
governmental bodies and overseas financing etc. should all be taken the utmost advantage
of.
[Technical Collaboration]
・Make use of technical collaboration from Japanese manufacturers who are candidates for
exporting products to, and from the Green Energy Laboratory who are already involved in
the production and retail of pellets, along with advice from Control Union, the issuing body
for the FSC approval required to export wooden products.
[Collaboration for Acquisition of Materials]
・Assumes the formation of an alliance with regional wood processers, forming a
5
collaborative relationship in which the sawdust is obtained in return for a share of the project
profits.
[Offtake]
・The project will be planned with export of the product wood pellets to the Japanese market
in mind.
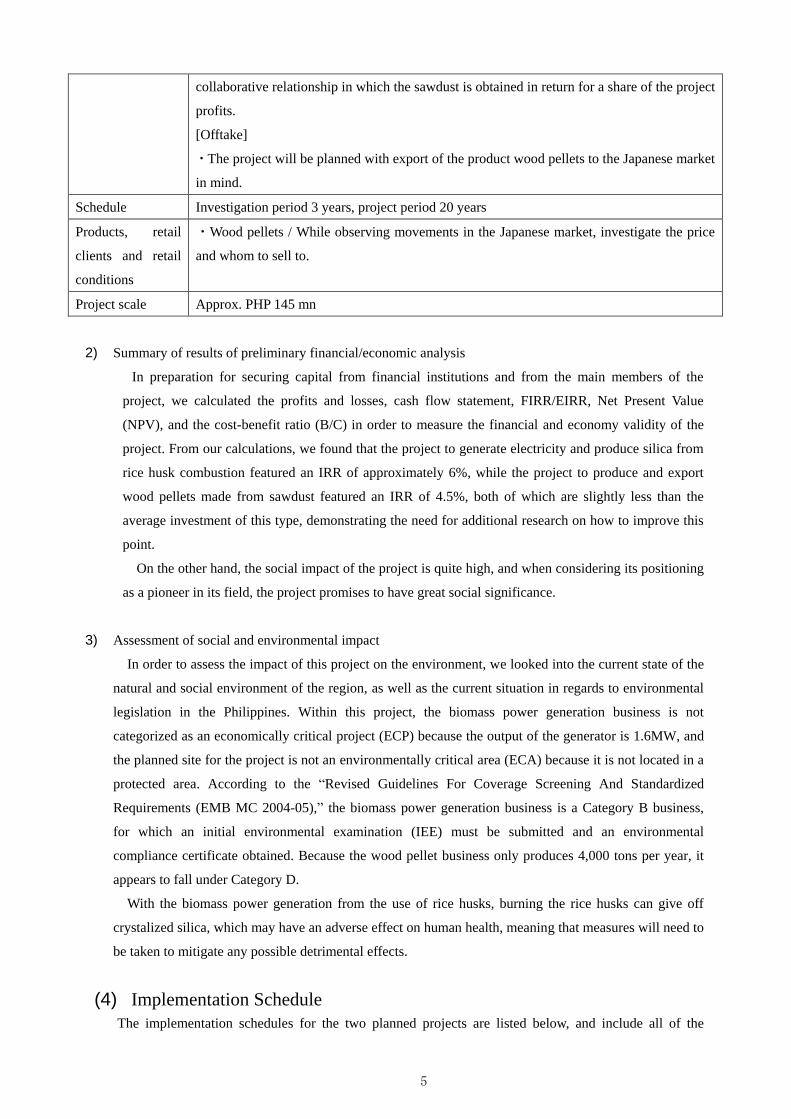
Schedule Investigation period 3 years, project period 20 years
Products, retail
clients and retail
conditions
・Wood pellets / While observing movements in the Japanese market, investigate the price
and whom to sell to.
Project scale Approx. PHP 145 mn
2) Summary of results of preliminary financial/economic analysis
In preparation for securing capital from financial institutions and from the main members of the
project, we calculated the profits and losses, cash flow statement, FIRR/EIRR, Net Present Value
(NPV), and the cost-benefit ratio (B/C) in order to measure the financial and economy validity of the
project. From our calculations, we found that the project to generate electricity and produce silica from
rice husk combustion featured an IRR of approximately 6%, while the project to produce and export
wood pellets made from sawdust featured an IRR of 4.5%, both of which are slightly less than the
average investment of this type, demonstrating the need for additional research on how to improve this
point.
On the other hand, the social impact of the project is quite high, and when considering its positioning
as a pioneer in its field, the project promises to have great social significance.
3) Assessment of social and environmental impact
In order to assess the impact of this project on the environment, we looked into the current state of the
natural and social environment of the region, as well as the current situation in regards to environmental
legislation in the Philippines. Within this project, the biomass power generation business is not
categorized as an economically critical project (ECP) because the output of the generator is 1.6MW, and
the planned site for the project is not an environmentally critical area (ECA) because it is not located in a
protected area. According to the “Revised Guidelines For Coverage Screening And Standardized
Requirements (EMB MC 2004-05),” the biomass power generation business is a Category B business,
for which an initial environmental examination (IEE) must be submitted and an environmental
compliance certificate obtained. Because the wood pellet business only produces 4,000 tons per year, it
appears to fall under Category D.
With the biomass power generation from the use of rice husks, burning the rice husks can give off
crystalized silica, which may have an adverse effect on human health, meaning that measures will need to
be taken to mitigate any possible detrimental effects.
(4) Implementation Schedule
The implementation schedules for the two planned projects are listed below, and include all of the
6
necessary planning, research and trial runs up until the projects begin actual operations.
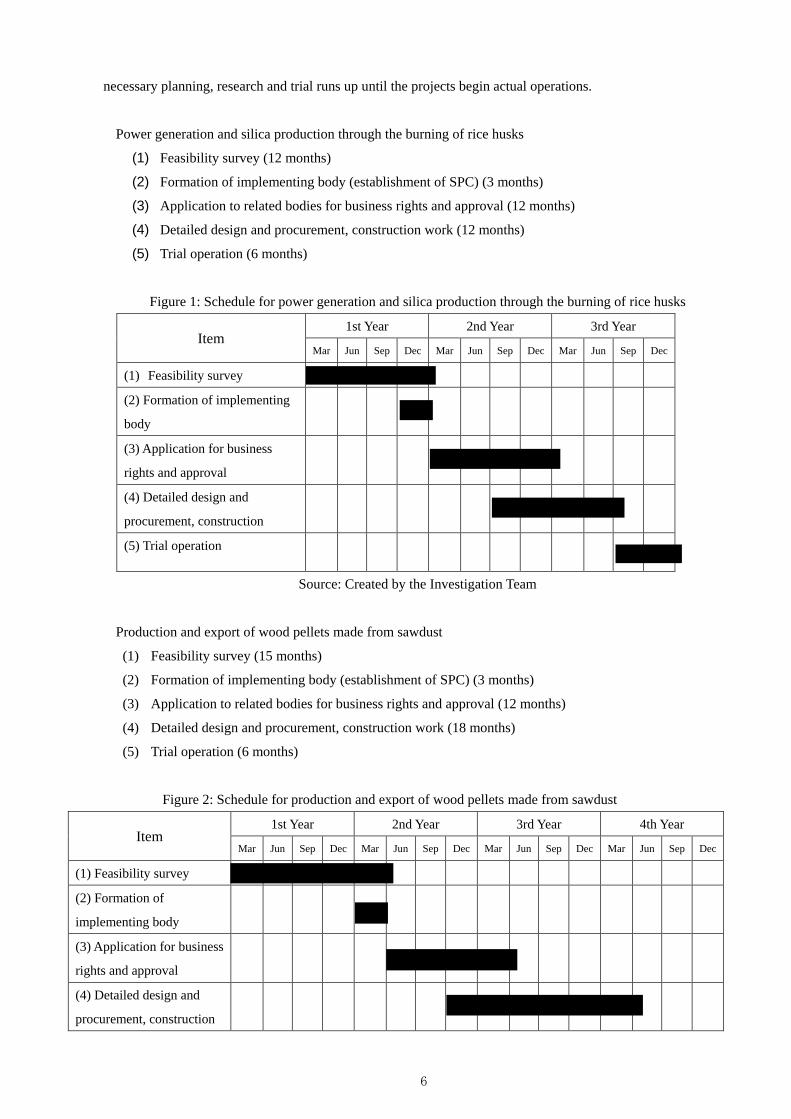
Power generation and silica production through the burning of rice husks
(1) Feasibility survey (12 months)
(2) Formation of implementing body (establishment of SPC) (3 months)
(3) Application to related bodies for business rights and approval (12 months)
(4) Detailed design and procurement, construction work (12 months)
(5) Trial operation (6 months)
Figure 1: Schedule for power generation and silica production through the burning of rice husks
Item 1st Year 2nd Year 3rd Year
Mar Jun Sep Dec Mar Jun Sep Dec Mar Jun Sep Dec
(1) Feasibility survey
(2) Formation of implementing
body
(3) Application for business
rights and approval
(4) Detailed design and
procurement, construction
(5) Trial operation
Source: Created by the Investigation Team
Production and export of wood pellets made from sawdust
(1) Feasibility survey (15 months)
(2) Formation of implementing body (establishment of SPC) (3 months)
(3) Application to related bodies for business rights and approval (12 months)
(4) Detailed design and procurement, construction work (18 months)
(5) Trial operation (6 months)
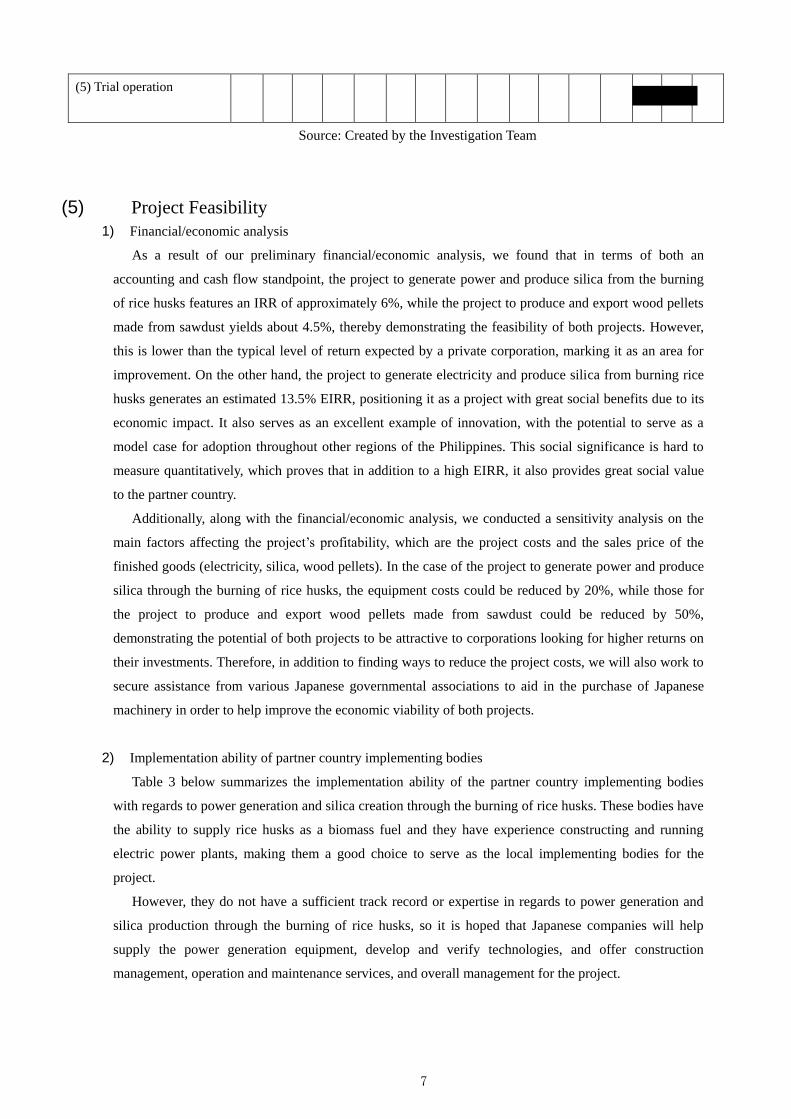
Figure 2: Schedule for production and export of wood pellets made from sawdust
Item 1st Year 2nd Year 3rd Year 4th Year
Mar Jun Sep Dec Mar Jun Sep Dec Mar Jun Sep Dec Mar Jun Sep Dec
(1) Feasibility survey
(2) Formation of
implementing body
(3) Application for business
rights and approval
(4) Detailed design and
procurement, construction
7
(5) Trial operation
Source: Created by the Investigation Team
(5) Project Feasibility
1) Financial/economic analysis
As a result of our preliminary financial/economic analysis, we found that in terms of both an
accounting and cash flow standpoint, the project to generate power and produce silica from the burning
of rice husks features an IRR of approximately 6%, while the project to produce and export wood pellets
made from sawdust yields about 4.5%, thereby demonstrating the feasibility of both projects. However,
this is lower than the typical level of return expected by a private corporation, marking it as an area for
improvement. On the other hand, the project to generate electricity and produce silica from burning rice
husks generates an estimated 13.5% EIRR, positioning it as a project with great social benefits due to its
economic impact. It also serves as an excellent example of innovation, with the potential to serve as a
model case for adoption throughout other regions of the Philippines. This social significance is hard to
measure quantitatively, which proves that in addition to a high EIRR, it also provides great social value
to the partner country.
Additionally, along with the financial/economic analysis, we conducted a sensitivity analysis on the
main factors affecting the project’s profitability, which are the project costs and the sales price of the
finished goods (electricity, silica, wood pellets). In the case of the project to generate power and produce
silica through the burning of rice husks, the equipment costs could be reduced by 20%, while those for
the project to produce and export wood pellets made from sawdust could be reduced by 50%,
demonstrating the potential of both projects to be attractive to corporations looking for higher returns on
their investments. Therefore, in addition to finding ways to reduce the project costs, we will also work to
secure assistance from various Japanese governmental associations to aid in the purchase of Japanese
machinery in order to help improve the economic viability of both projects.
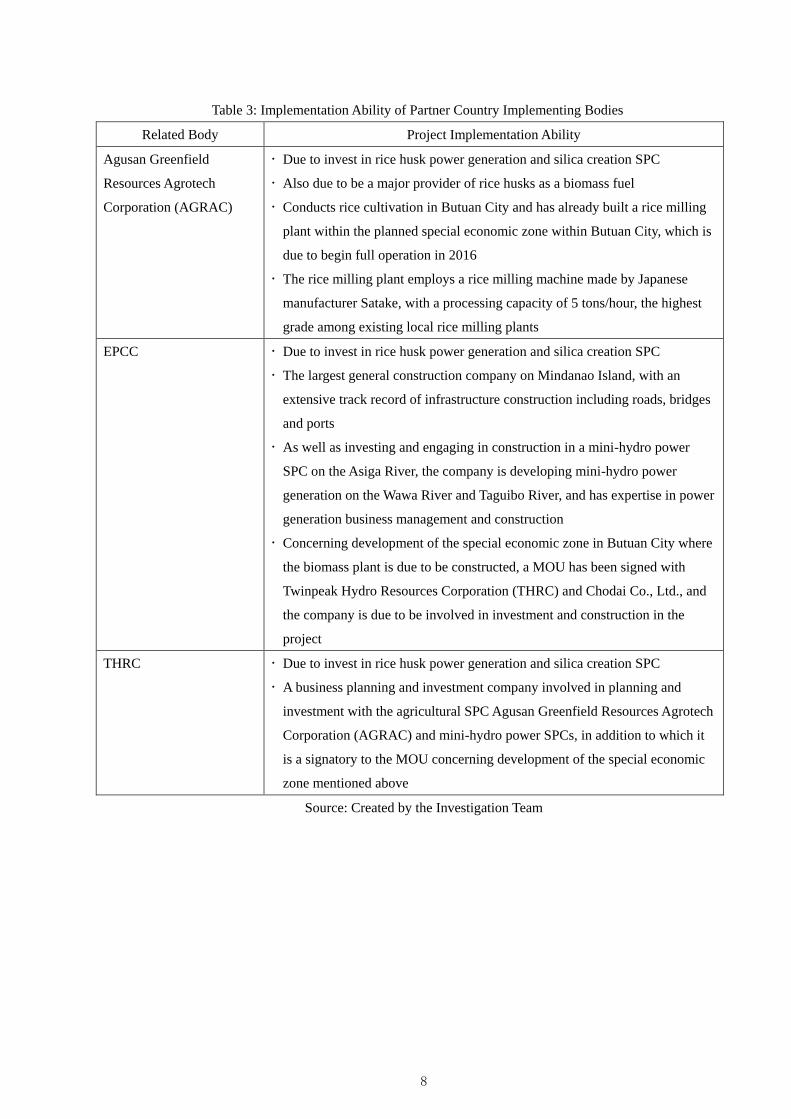
2) Implementation ability of partner country implementing bodies
Table 3 below summarizes the implementation ability of the partner country implementing bodies
with regards to power generation and silica creation through the burning of rice husks. These bodies have
the ability to supply rice husks as a biomass fuel and they have experience constructing and running
electric power plants, making them a good choice to serve as the local implementing bodies for the
project.
However, they do not have a sufficient track record or expertise in regards to power generation and
silica production through the burning of rice husks, so it is hoped that Japanese companies will help
supply the power generation equipment, develop and verify technologies, and offer construction
management, operation and maintenance services, and overall management for the project.
8
Table 3: Implementation Ability of Partner Country Implementing Bodies
Related Body Project Implementation Ability
Agusan Greenfield
Resources Agrotech
Corporation (AGRAC)
Due to invest in rice husk power generation and silica creation SPC
Also due to be a major provider of rice husks as a biomass fuel
Conducts rice cultivation in Butuan City and has already built a rice milling
plant within the planned special economic zone within Butuan City, which is
due to begin full operation in 2016
The rice milling plant employs a rice milling machine made by Japanese
manufacturer Satake, with a processing capacity of 5 tons/hour, the highest
grade among existing local rice milling plants
EPCC Due to invest in rice husk power generation and silica creation SPC
The largest general construction company on Mindanao Island, with an
extensive track record of infrastructure construction including roads, bridges
and ports
As well as investing and engaging in construction in a mini-hydro power
SPC on the Asiga River, the company is developing mini-hydro power
generation on the Wawa River and Taguibo River, and has expertise in power
generation business management and construction
Concerning development of the special economic zone in Butuan City where
the biomass plant is due to be constructed, a MOU has been signed with
Twinpeak Hydro Resources Corporation (THRC) and Chodai Co., Ltd., and
the company is due to be involved in investment and construction in the
project
THRC Due to invest in rice husk power generation and silica creation SPC
A business planning and investment company involved in planning and
investment with the agricultural SPC Agusan Greenfield Resources Agrotech
Corporation (AGRAC) and mini-hydro power SPCs, in addition to which it
is a signatory to the MOU concerning development of the special economic
zone mentioned above
Source: Created by the Investigation Team
9
(6) Competitive Advantages of Japanese Companies
(1) Technical advantages
For the project to generate power and produce silica from the burning of rice husks, Japanese
manufacturers possess unmatched skill and expertise in the area of the boilers and turbines needed for
power generation. Additionally, to create the high purity and value-added silica, basic research conducted
by Professor Katsuyoshi Kondoh of Osaka University and by Kurimoto, Inc. will prove invaluable to the
project’s implementation. Together, these factors give a strong Japanese presence throughout the project.
Finally, with the economic benefits of the project and its ability to serve as a pioneer in the field for the
Philippines, it will have a large social impact as well.
Meanwhile, the project to produce and export wood pellets made from sawdust will generate
additional value by utilizing previously unused waste wood to generate added value by taking a biomass
resource that serves as a source of greenhouse gases and converting it into a product bound for export.
This will also serve to increase energy diversity within Japan, making it socially significant in both
countries. However, Japan is not well-positioned in this field, meaning that the main equipment known as
pelletizers are quite expensive when compared to foreign brands, so in order to maintain the
attractiveness of the project as an investment, additional technological advances and public assistance
will be essential to the project.
(2) Topics for further analysis
As stated earlier, although there is great social significance for both of the proposed projects, and they
are relatively feasible from a business standpoint, they will both require technical advances to be made as
well as public assistance to succeed, meaning that the following topics below will need to be analyzed for
further study.
■Technical details
Technical research into the production of silica from the burning of rice husks is one of the largest
topics that needs to be studied in more depth. For this project, we are receiving advice from Osaka
University and Kurimoto, Inc. in order to establish a strong foundation for the project going forward.
■Eligibility for tax breaks and other benefits
Especially for the project to generate power and produce silica from the burning of rice husks, there
is the possibility of qualifying for additional benefits through renewable energy and investment laws.
Therefore, it will be necessary to research the benefits of both combining the project into a single SPC
versus splitting it into two separate ones.
Meanwhile, there is a strong possibility that many of these laws and benefits may change following
the upcoming presidential elections, meaning we will need to keep an eye on the situation and adapt our
proposals as necessary.
■Business scheme and method for raising capital
10
In order to raise capital with senior lenders, it will be necessary to provide detailed technical
analysis and facility designs to confirm the equipment procurement costs, construction costs,
procurement costs from the relevant financial institutions, operating costs, and more, while also
proceeding with negotiations with the main suppliers of the raw materials in order to negotiate with the
lenders.
(7) Schedule towards Project Realization & Associated Risks
1) Detailed schedule towards project realization
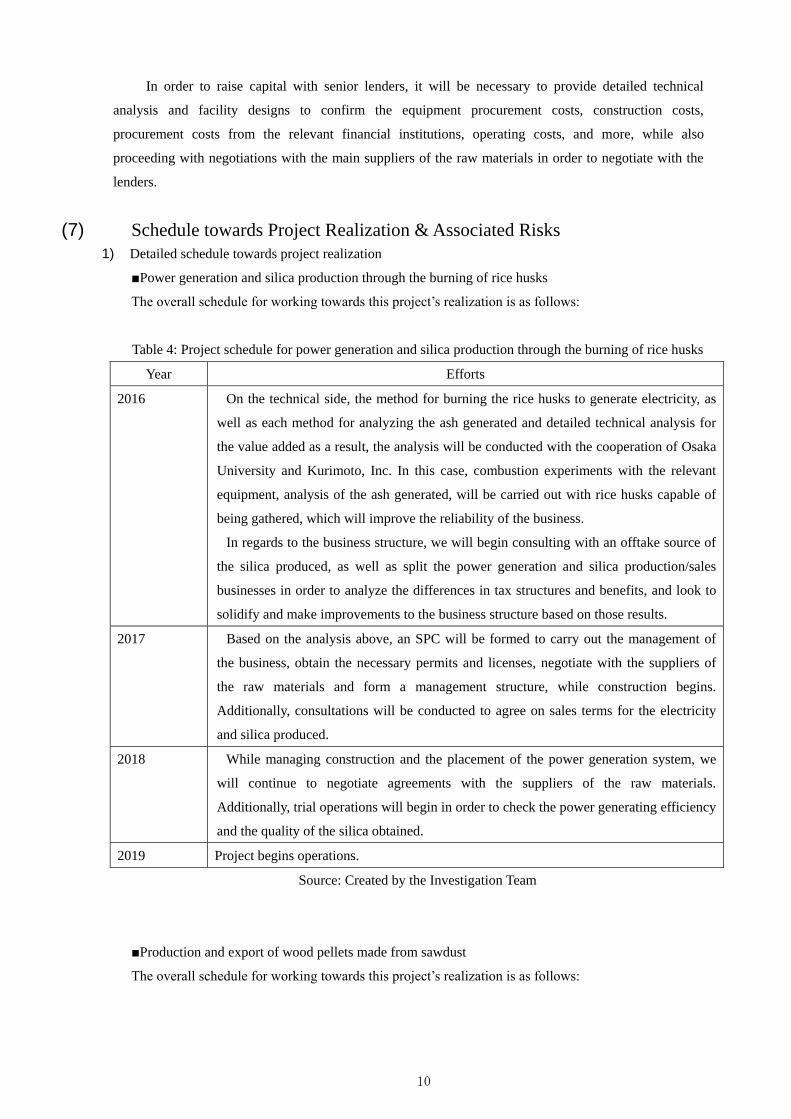
■Power generation and silica production through the burning of rice husks
The overall schedule for working towards this project’s realization is as follows:
Table 4: Project schedule for power generation and silica production through the burning of rice husks
Year Efforts
2016 On the technical side, the method for burning the rice husks to generate electricity, as
well as each method for analyzing the ash generated and detailed technical analysis for
the value added as a result, the analysis will be conducted with the cooperation of Osaka
University and Kurimoto, Inc. In this case, combustion experiments with the relevant
equipment, analysis of the ash generated, will be carried out with rice husks capable of
being gathered, which will improve the reliability of the business.
In regards to the business structure, we will begin consulting with an offtake source of
the silica produced, as well as split the power generation and silica production/sales
businesses in order to analyze the differences in tax structures and benefits, and look to
solidify and make improvements to the business structure based on those results.
2017 Based on the analysis above, an SPC will be formed to carry out the management of
the business, obtain the necessary permits and licenses, negotiate with the suppliers of
the raw materials and form a management structure, while construction begins.
Additionally, consultations will be conducted to agree on sales terms for the electricity
and silica produced.
2018 While managing construction and the placement of the power generation system, we
will continue to negotiate agreements with the suppliers of the raw materials.
Additionally, trial operations will begin in order to check the power generating efficiency
and the quality of the silica obtained.
2019 Project begins operations.
Source: Created by the Investigation Team
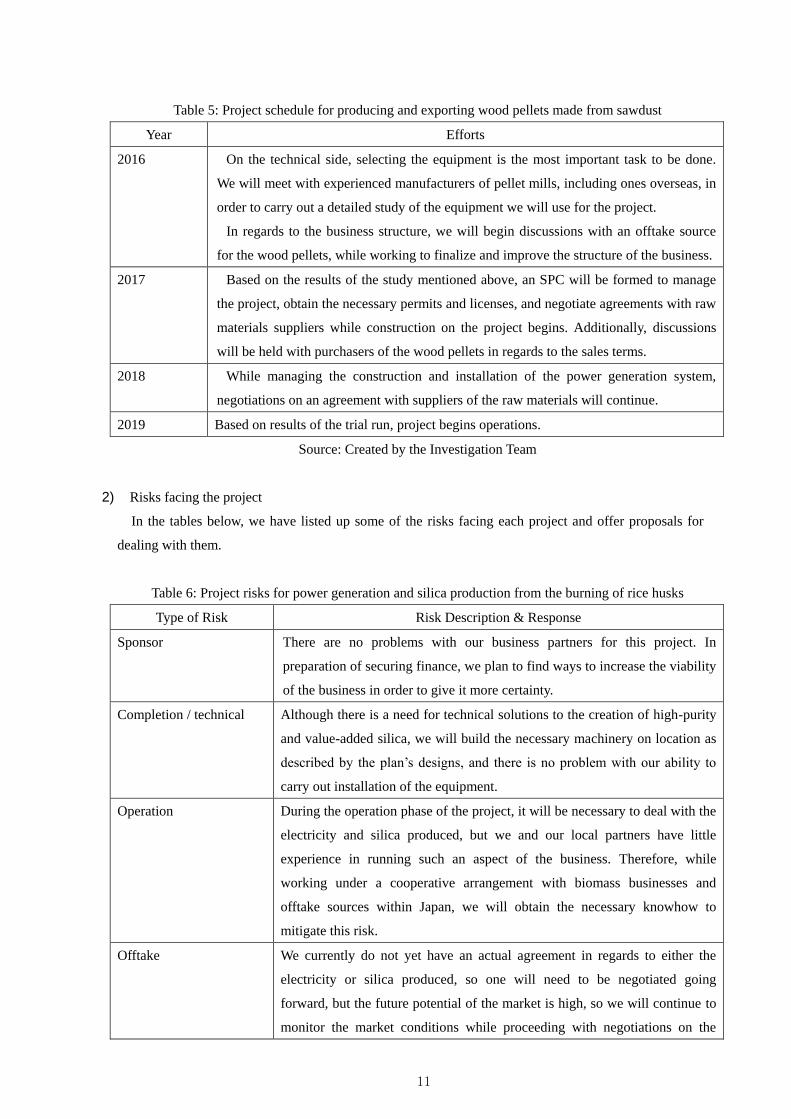
■Production and export of wood pellets made from sawdust
The overall schedule for working towards this project’s realization is as follows:
11
Table 5: Project schedule for producing and exporting wood pellets made from sawdust
Year Efforts
2016 On the technical side, selecting the equipment is the most important task to be done.
We will meet with experienced manufacturers of pellet mills, including ones overseas, in
order to carry out a detailed study of the equipment we will use for the project.
In regards to the business structure, we will begin discussions with an offtake source
for the wood pellets, while working to finalize and improve the structure of the business.
2017 Based on the results of the study mentioned above, an SPC will be formed to manage
the project, obtain the necessary permits and licenses, and negotiate agreements with raw
materials suppliers while construction on the project begins. Additionally, discussions
will be held with purchasers of the wood pellets in regards to the sales terms.
2018 While managing the construction and installation of the power generation system,
negotiations on an agreement with suppliers of the raw materials will continue.
2019 Based on results of the trial run, project begins operations.
Source: Created by the Investigation Team
2) Risks facing the project
In the tables below, we have listed up some of the risks facing each project and offer proposals for
dealing with them.
Table 6: Project risks for power generation and silica production from the burning of rice husks
Type of Risk Risk Description & Response
Sponsor There are no problems with our business partners for this project. In
preparation of securing finance, we plan to find ways to increase the viability
of the business in order to give it more certainty.
Completion / technical Although there is a need for technical solutions to the creation of high-purity
and value-added silica, we will build the necessary machinery on location as
described by the plan’s designs, and there is no problem with our ability to
carry out installation of the equipment.
Operation During the operation phase of the project, it will be necessary to deal with the
electricity and silica produced, but we and our local partners have little
experience in running such an aspect of the business. Therefore, while
working under a cooperative arrangement with biomass businesses and
offtake sources within Japan, we will obtain the necessary knowhow to
mitigate this risk.
Offtake We currently do not yet have an actual agreement in regards to either the
electricity or silica produced, so one will need to be negotiated going
forward, but the future potential of the market is high, so we will continue to
monitor the market conditions while proceeding with negotiations on the
12
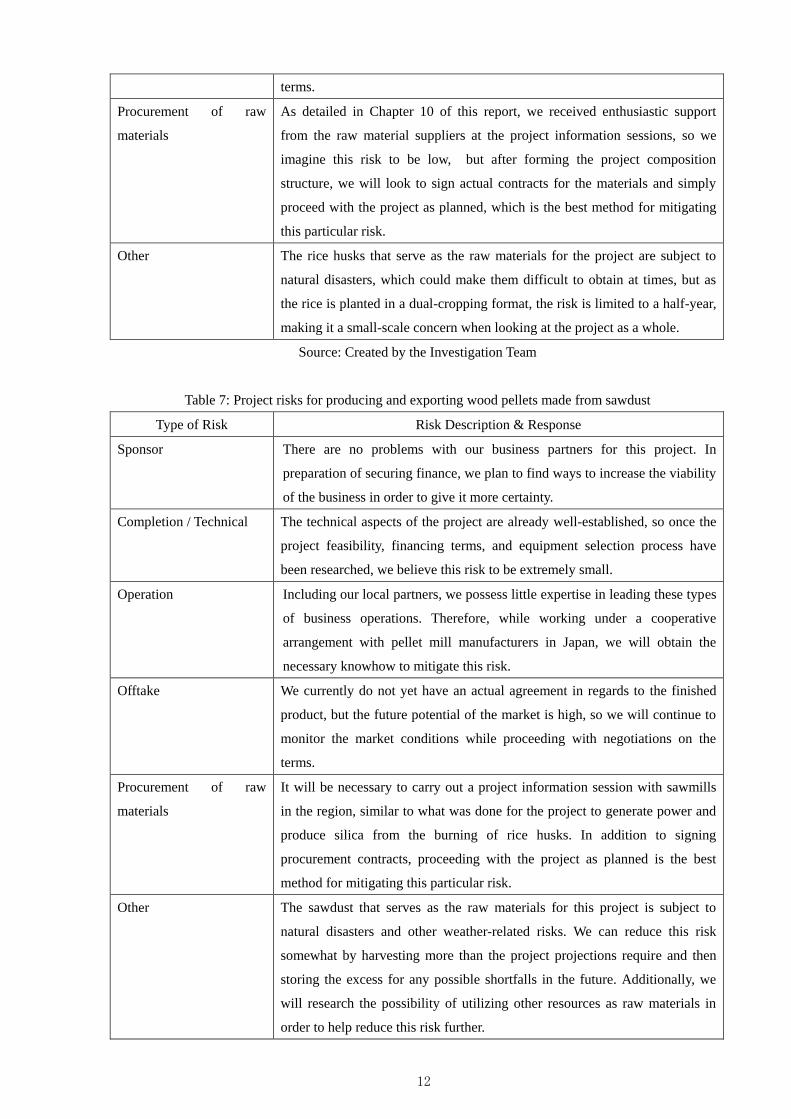
terms.
Procurement of raw
materials
As detailed in Chapter 10 of this report, we received enthusiastic support
from the raw material suppliers at the project information sessions, so we
imagine this risk to be low, but after forming the project composition
structure, we will look to sign actual contracts for the materials and simply
proceed with the project as planned, which is the best method for mitigating
this particular risk.
Other The rice husks that serve as the raw materials for the project are subject to
natural disasters, which could make them difficult to obtain at times, but as
the rice is planted in a dual-cropping format, the risk is limited to a half-year,
making it a small-scale concern when looking at the project as a whole.
Source: Created by the Investigation Team
Table 7: Project risks for producing and exporting wood pellets made from sawdust
Type of Risk Risk Description & Response
Sponsor There are no problems with our business partners for this project. In
preparation of securing finance, we plan to find ways to increase the viability
of the business in order to give it more certainty.
Completion / Technical The technical aspects of the project are already well-established, so once the
project feasibility, financing terms, and equipment selection process have
been researched, we believe this risk to be extremely small.
Operation Including our local partners, we possess little expertise in leading these types
of business operations. Therefore, while working under a cooperative
arrangement with pellet mill manufacturers in Japan, we will obtain the
necessary knowhow to mitigate this risk.
Offtake We currently do not yet have an actual agreement in regards to the finished
product, but the future potential of the market is high, so we will continue to
monitor the market conditions while proceeding with negotiations on the
terms.
Procurement of raw
materials
It will be necessary to carry out a project information session with sawmills
in the region, similar to what was done for the project to generate power and
produce silica from the burning of rice husks. In addition to signing
procurement contracts, proceeding with the project as planned is the best
method for mitigating this particular risk.
Other The sawdust that serves as the raw materials for this project is subject to
natural disasters and other weather-related risks. We can reduce this risk
somewhat by harvesting more than the project projections require and then
storing the excess for any possible shortfalls in the future. Additionally, we
will research the possibility of utilizing other resources as raw materials in
order to help reduce this risk further.
13
Source: Created by the Investigation Team
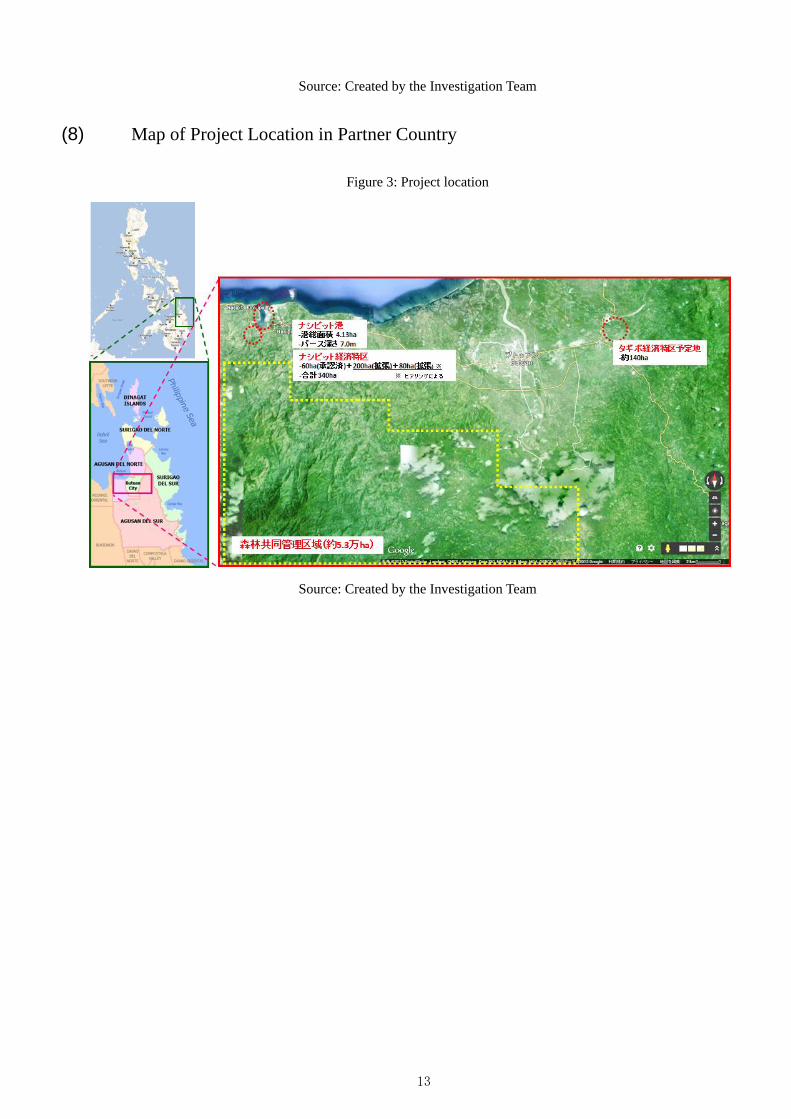
(8) Map of Project Location in Partner Country
Figure 3: Project location
Source: Created by the Investigation Team
Chapter1 Overview of Partner Country and the Sector
1-1
(1) Economy of the partner country
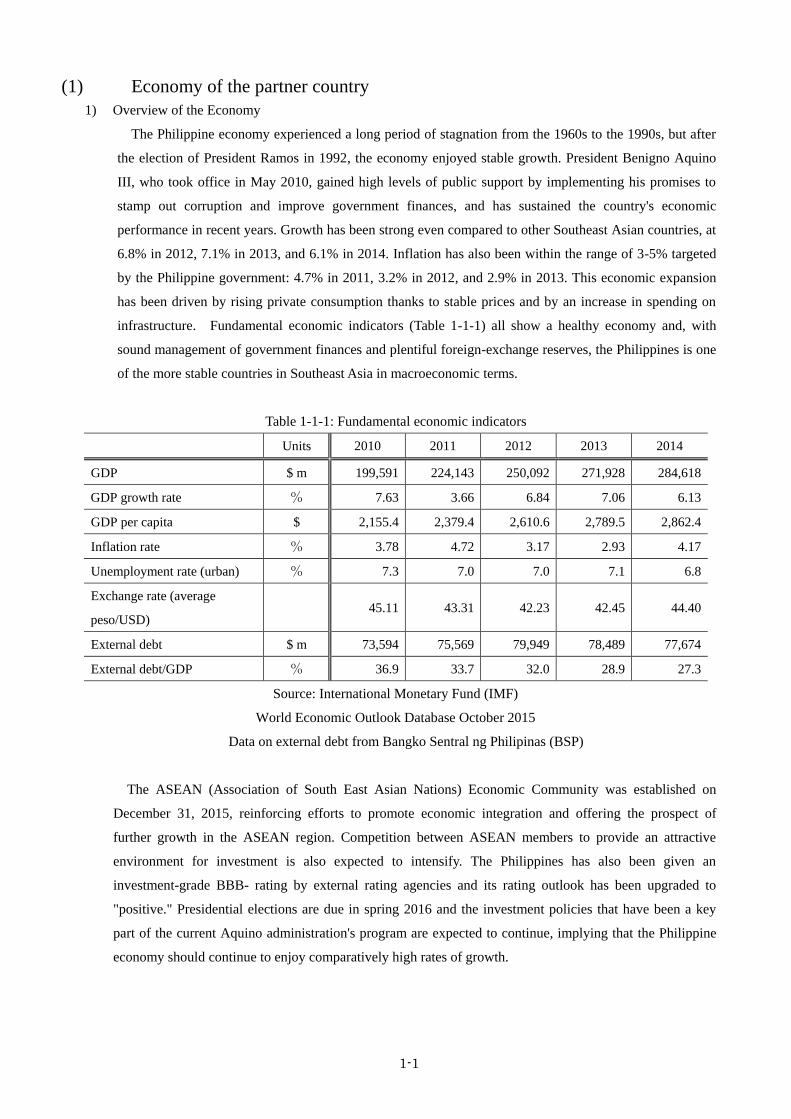
1) Overview of the Economy
The Philippine economy experienced a long period of stagnation from the 1960s to the 1990s, but after
the election of President Ramos in 1992, the economy enjoyed stable growth. President Benigno Aquino
III, who took office in May 2010, gained high levels of public support by implementing his promises to
stamp out corruption and improve government finances, and has sustained the country's economic
performance in recent years. Growth has been strong even compared to other Southeast Asian countries, at
6.8% in 2012, 7.1% in 2013, and 6.1% in 2014. Inflation has also been within the range of 3-5% targeted
by the Philippine government: 4.7% in 2011, 3.2% in 2012, and 2.9% in 2013. This economic expansion
has been driven by rising private consumption thanks to stable prices and by an increase in spending on
infrastructure. Fundamental economic indicators (Table 1-1-1) all show a healthy economy and, with
sound management of government finances and plentiful foreign-exchange reserves, the Philippines is one
of the more stable countries in Southeast Asia in macroeconomic terms.
Table 1-1-1: Fundamental economic indicators
Units 2010 2011 2012 2013 2014
GDP $ m 199,591 224,143 250,092 271,928 284,618
GDP growth rate % 7.63 3.66 6.84 7.06 6.13
GDP per capita $ 2,155.4 2,379.4 2,610.6 2,789.5 2,862.4
Inflation rate % 3.78 4.72 3.17 2.93 4.17
Unemployment rate (urban) % 7.3 7.0 7.0 7.1 6.8
Exchange rate (average
peso/USD) 45.11 43.31 42.23 42.45 44.40
External debt $ m 73,594 75,569 79,949 78,489 77,674
External debt/GDP % 36.9 33.7 32.0 28.9 27.3
Source: International Monetary Fund (IMF)
World Economic Outlook Database October 2015
Data on external debt from Bangko Sentral ng Philipinas (BSP)
The ASEAN (Association of South East Asian Nations) Economic Community was established on
December 31, 2015, reinforcing efforts to promote economic integration and offering the prospect of
further growth in the ASEAN region. Competition between ASEAN members to provide an attractive
environment for investment is also expected to intensify. The Philippines has also been given an
investment-grade BBB- rating by external rating agencies and its rating outlook has been upgraded to
"positive." Presidential elections are due in spring 2016 and the investment policies that have been a key
part of the current Aquino administration's program are expected to continue, implying that the Philippine
economy should continue to enjoy comparatively high rates of growth.
1-2
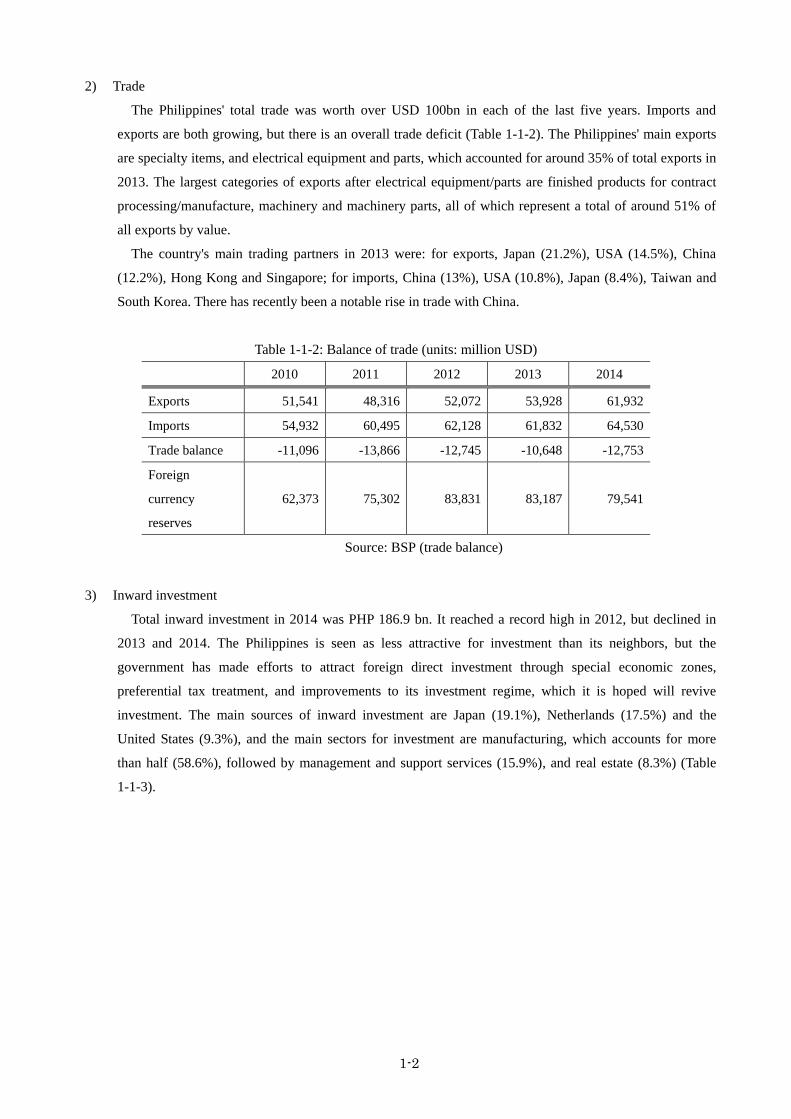
2) Trade
The Philippines' total trade was worth over USD 100bn in each of the last five years. Imports and
exports are both growing, but there is an overall trade deficit (Table 1-1-2). The Philippines' main exports
are specialty items, and electrical equipment and parts, which accounted for around 35% of total exports in
2013. The largest categories of exports after electrical equipment/parts are finished products for contract
processing/manufacture, machinery and machinery parts, all of which represent a total of around 51% of
all exports by value.
The country's main trading partners in 2013 were: for exports, Japan (21.2%), USA (14.5%), China
(12.2%), Hong Kong and Singapore; for imports, China (13%), USA (10.8%), Japan (8.4%), Taiwan and
South Korea. There has recently been a notable rise in trade with China.
Table 1-1-2: Balance of trade (units: million USD)
2010 2011 2012 2013 2014
Exports 51,541 48,316 52,072 53,928 61,932
Imports 54,932 60,495 62,128 61,832 64,530
Trade balance -11,096 -13,866 -12,745 -10,648 -12,753
Foreign
currency
reserves
62,373 75,302 83,831 83,187 79,541
Source: BSP (trade balance)
3) Inward investment
Total inward investment in 2014 was PHP 186.9 bn. It reached a record high in 2012, but declined in
2013 and 2014. The Philippines is seen as less attractive for investment than its neighbors, but the
government has made efforts to attract foreign direct investment through special economic zones,
preferential tax treatment, and improvements to its investment regime, which it is hoped will revive
investment. The main sources of inward investment are Japan (19.1%), Netherlands (17.5%) and the
United States (9.3%), and the main sectors for investment are manufacturing, which accounts for more
than half (58.6%), followed by management and support services (15.9%), and real estate (8.3%) (Table
1-1-3).
1-3
Table 1-1-3: Direct foreign investment
(Units: million pesos)
Sector 2013 2014 % Growth (%)
Manufacturing 77,557.6 109,495.3 58.6 41.2
Real estate 6,434.7 15,584.5 8.3 142.2
Power & gas 74,497.3 6,179.9 3.3 -91.7
Management & support services 24,567.6 29,755.3 15.9 21.1
Telecommunication 3,560.8 4,937.4 2.6 38.7
Construction 8.7 7,735.3 4.1 88,641.4
Hotels & catering 25,380.8 5,520.8 3.0 -78.2
Agriculture, forestry & fisheries 2,678.8 536.7 0.3 -80.0
Transport 55,468.1 6,103.4 3.3 -89.0
Wholesale, retail & auto repair 155.0 551.8 0.3 255.9
Total (including others) 274,013.5 186,943.1 100.0 -31.8
Source: Research by the Philippine National Statistical Coordination Board (NSCB)
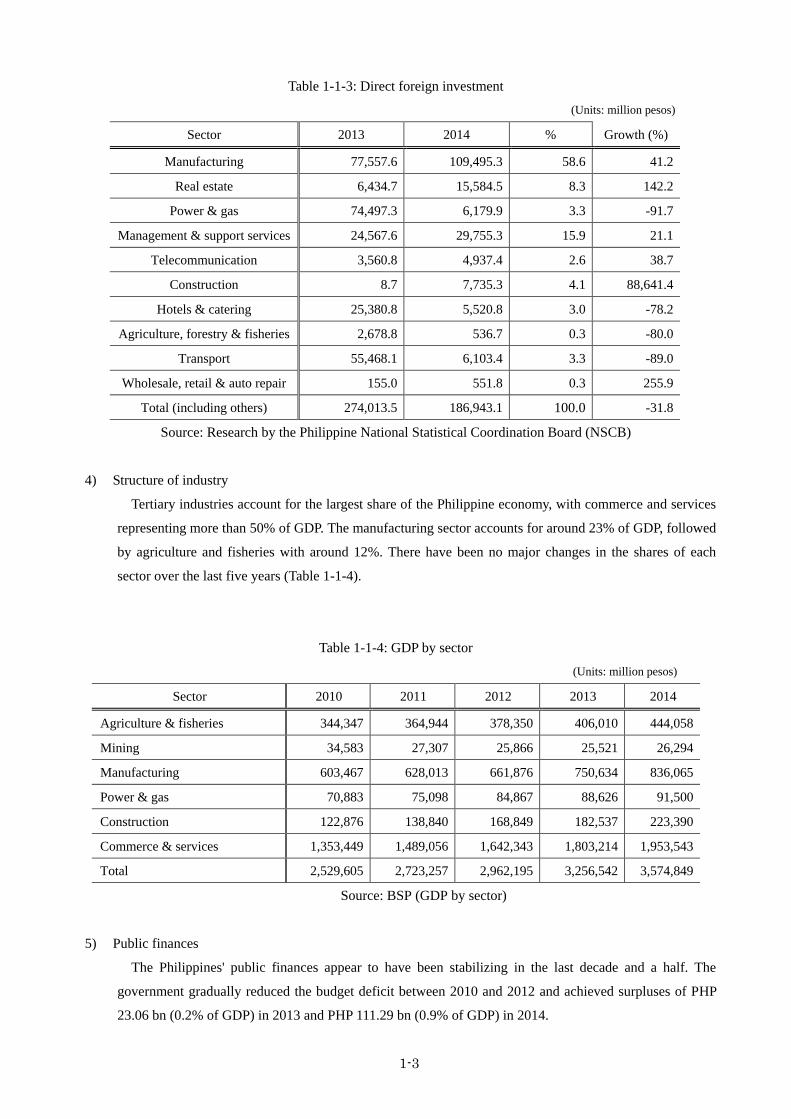
4) Structure of industry
Tertiary industries account for the largest share of the Philippine economy, with commerce and services
representing more than 50% of GDP. The manufacturing sector accounts for around 23% of GDP, followed
by agriculture and fisheries with around 12%. There have been no major changes in the shares of each
sector over the last five years (Table 1-1-4).
Table 1-1-4: GDP by sector
(Units: million pesos)
Sector 2010 2011 2012 2013 2014
Agriculture & fisheries 344,347 364,944 378,350 406,010 444,058
Mining 34,583 27,307 25,866 25,521 26,294
Manufacturing 603,467 628,013 661,876 750,634 836,065
Power & gas 70,883 75,098 84,867 88,626 91,500
Construction 122,876 138,840 168,849 182,537 223,390
Commerce & services 1,353,449 1,489,056 1,642,343 1,803,214 1,953,543
Total 2,529,605 2,723,257 2,962,195 3,256,542 3,574,849
Source: BSP (GDP by sector)
5) Public finances
The Philippines' public finances appear to have been stabilizing in the last decade and a half. The
government gradually reduced the budget deficit between 2010 and 2012 and achieved surpluses of PHP
23.06 bn (0.2% of GDP) in 2013 and PHP 111.29 bn (0.9% of GDP) in 2014.
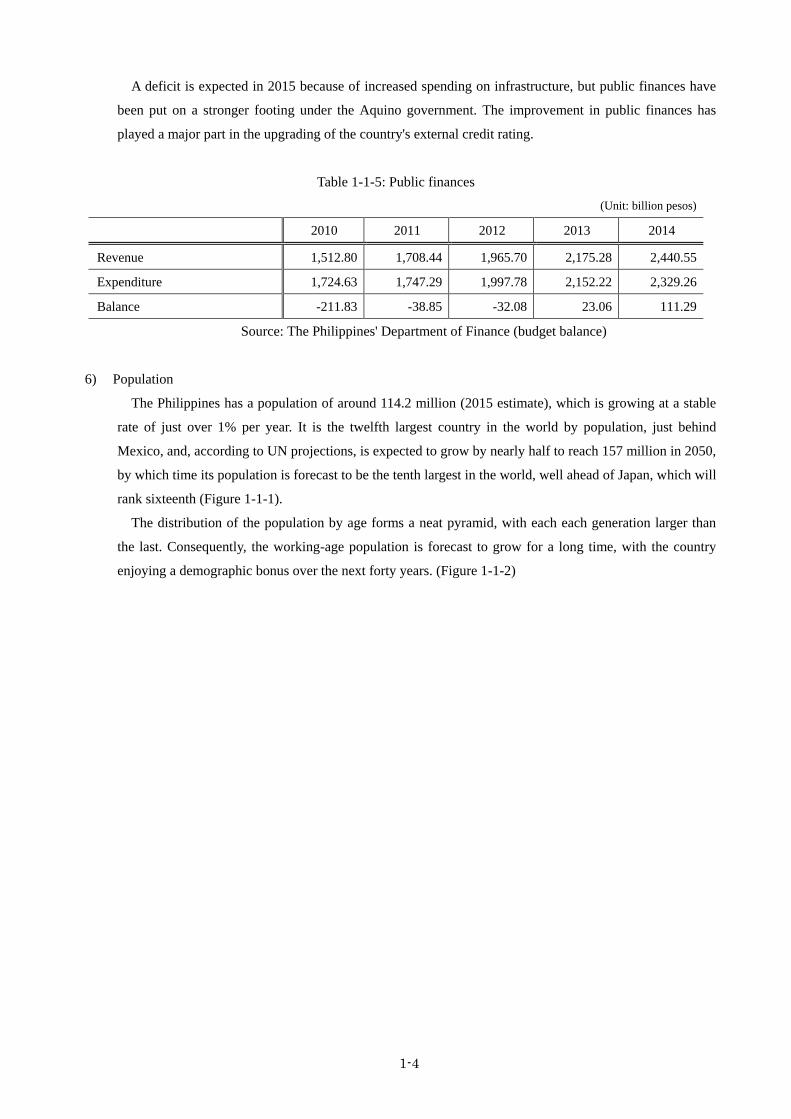
1-4
A deficit is expected in 2015 because of increased spending on infrastructure, but public finances have
been put on a stronger footing under the Aquino government. The improvement in public finances has
played a major part in the upgrading of the country's external credit rating.
Table 1-1-5: Public finances
(Unit: billion pesos)
2010 2011 2012 2013 2014
Revenue 1,512.80 1,708.44 1,965.70 2,175.28 2,440.55
Expenditure 1,724.63 1,747.29 1,997.78 2,152.22 2,329.26
Balance -211.83 -38.85 -32.08 23.06 111.29
Source: The Philippines' Department of Finance (budget balance)
6) Population
The Philippines has a population of around 114.2 million (2015 estimate), which is growing at a stable
rate of just over 1% per year. It is the twelfth largest country in the world by population, just behind
Mexico, and, according to UN projections, is expected to grow by nearly half to reach 157 million in 2050,
by which time its population is forecast to be the tenth largest in the world, well ahead of Japan, which will
rank sixteenth (Figure 1-1-1).
The distribution of the population by age forms a neat pyramid, with each each generation larger than
the last. Consequently, the working-age population is forecast to grow for a long time, with the country
enjoying a demographic bonus over the next forty years. (Figure 1-1-2)
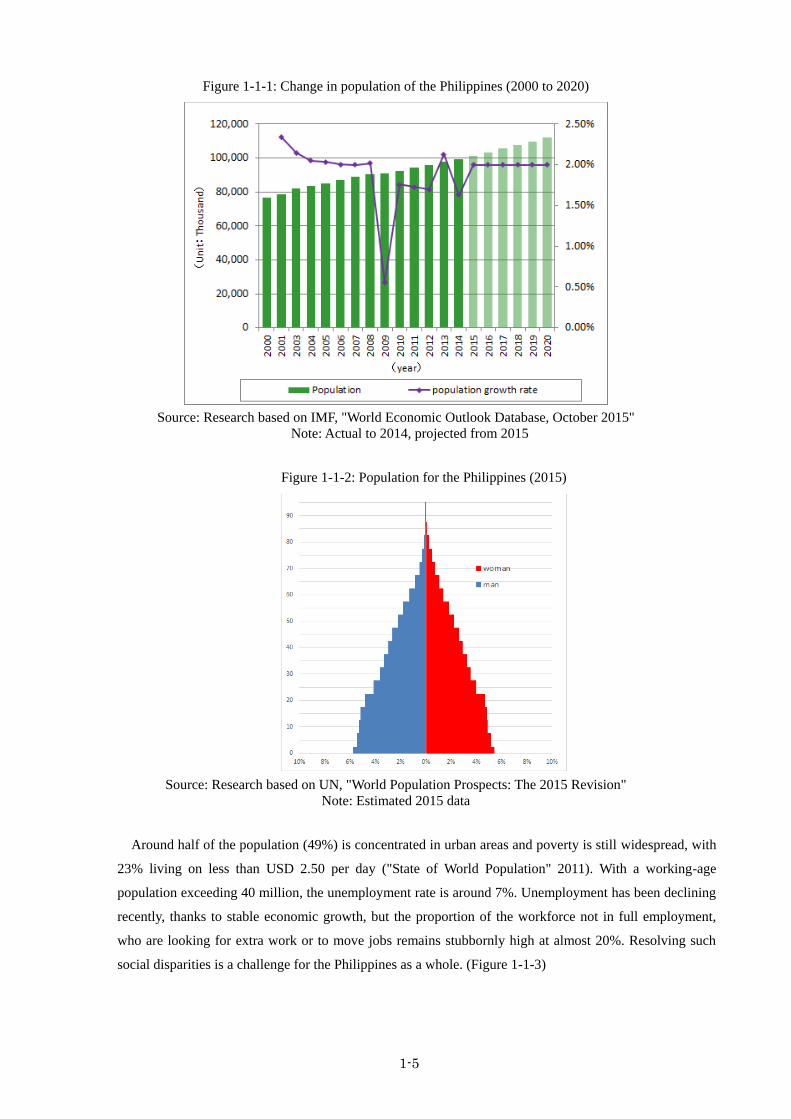
1-5
Figure 1-1-1: Change in population of the Philippines (2000 to 2020)
Source: Research based on IMF, "World Economic Outlook Database, October 2015"
Note: Actual to 2014, projected from 2015
Figure 1-1-2: Population for the Philippines (2015)
Source: Research based on UN, "World Population Prospects: The 2015 Revision"
Note: Estimated 2015 data
Around half of the population (49%) is concentrated in urban areas and poverty is still widespread, with
23% living on less than USD 2.50 per day ("State of World Population" 2011). With a working-age
population exceeding 40 million, the unemployment rate is around 7%. Unemployment has been declining
recently, thanks to stable economic growth, but the proportion of the workforce not in full employment,
who are looking for extra work or to move jobs remains stubbornly high at almost 20%. Resolving such
social disparities is a challenge for the Philippines as a whole. (Figure 1-1-3)
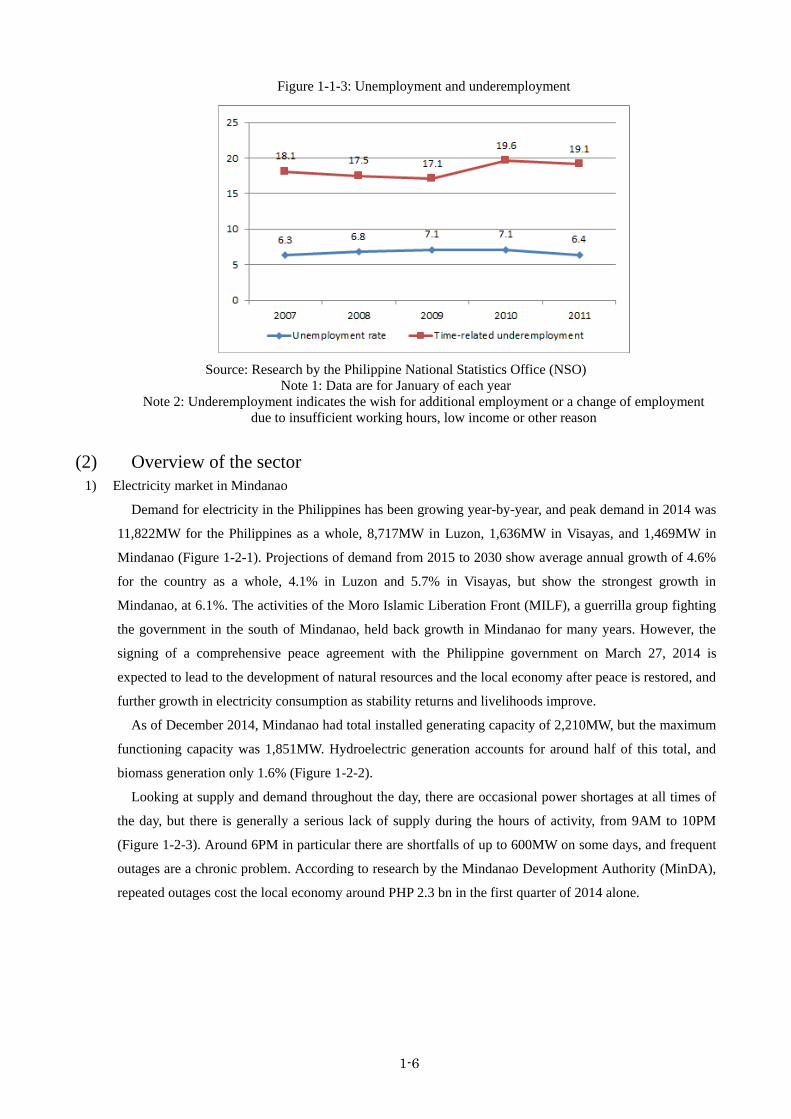
1-6
Figure 1-1-3: Unemployment and underemployment
Source: Research by the Philippine National Statistics Office (NSO)
Note 1: Data are for January of each year
Note 2: Underemployment indicates the wish for additional employment or a change of employment
due to insufficient working hours, low income or other reason
(2) Overview of the sector
1) Electricity market in Mindanao
Demand for electricity in the Philippines has been growing year-by-year, and peak demand in 2014 was
11,822MW for the Philippines as a whole, 8,717MW in Luzon, 1,636MW in Visayas, and 1,469MW in
Mindanao (Figure 1-2-1). Projections of demand from 2015 to 2030 show average annual growth of 4.6%
for the country as a whole, 4.1% in Luzon and 5.7% in Visayas, but show the strongest growth in
Mindanao, at 6.1%. The activities of the Moro Islamic Liberation Front (MILF), a guerrilla group fighting
the government in the south of Mindanao, held back growth in Mindanao for many years. However, the
signing of a comprehensive peace agreement with the Philippine government on March 27, 2014 is
expected to lead to the development of natural resources and the local economy after peace is restored, and
further growth in electricity consumption as stability returns and livelihoods improve.
As of December 2014, Mindanao had total installed generating capacity of 2,210MW, but the maximum
functioning capacity was 1,851MW. Hydroelectric generation accounts for around half of this total, and
biomass generation only 1.6% (Figure 1-2-2).
Looking at supply and demand throughout the day, there are occasional power shortages at all times of
the day, but there is generally a serious lack of supply during the hours of activity, from 9AM to 10PM
(Figure 1-2-3). Around 6PM in particular there are shortfalls of up to 600MW on some days, and frequent
outages are a chronic problem. According to research by the Mindanao Development Authority (MinDA),
repeated outages cost the local economy around PHP 2.3 bn in the first quarter of 2014 alone.
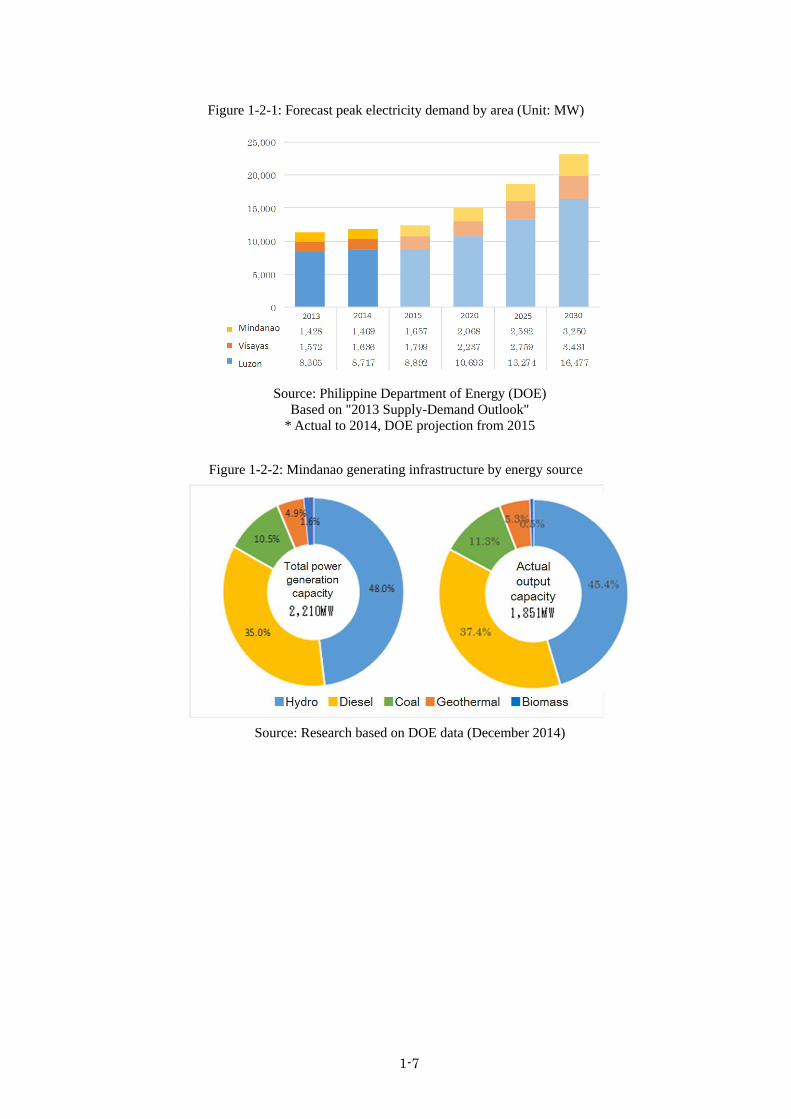
1-7
Figure 1-2-1: Forecast peak electricity demand by area (Unit: MW)
Source: Philippine Department of Energy (DOE)
Based on "2013 Supply-Demand Outlook"
* Actual to 2014, DOE projection from 2015
Figure 1-2-2: Mindanao generating infrastructure by energy source
Source: Research based on DOE data (December 2014)
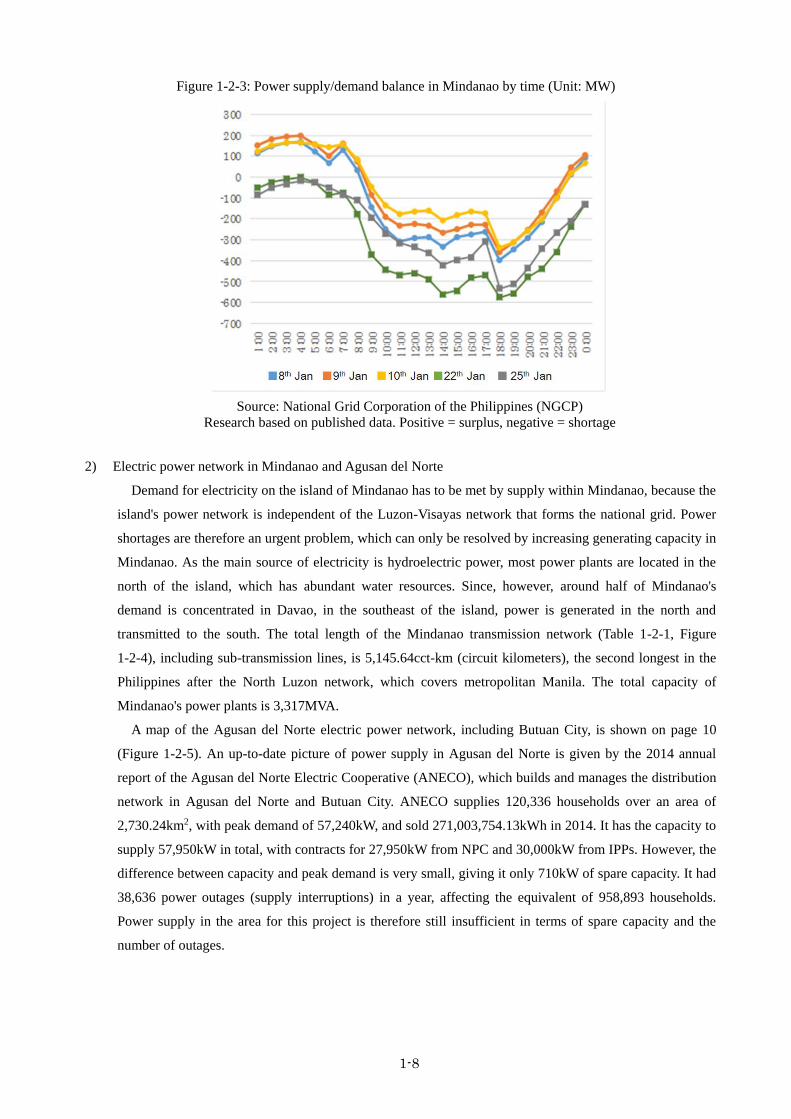
1-8
Figure 1-2-3: Power supply/demand balance in Mindanao by time (Unit: MW)
Source: National Grid Corporation of the Philippines (NGCP)
Research based on published data. Positive = surplus, negative = shortage
2) Electric power network in Mindanao and Agusan del Norte
Demand for electricity on the island of Mindanao has to be met by supply within Mindanao, because the
island's power network is independent of the Luzon-Visayas network that forms the national grid. Power
shortages are therefore an urgent problem, which can only be resolved by increasing generating capacity in
Mindanao. As the main source of electricity is hydroelectric power, most power plants are located in the
north of the island, which has abundant water resources. Since, however, around half of Mindanao's
demand is concentrated in Davao, in the southeast of the island, power is generated in the north and
transmitted to the south. The total length of the Mindanao transmission network (Table 1-2-1, Figure
1-2-4), including sub-transmission lines, is 5,145.64cct-km (circuit kilometers), the second longest in the
Philippines after the North Luzon network, which covers metropolitan Manila. The total capacity of
Mindanao's power plants is 3,317MVA.
A map of the Agusan del Norte electric power network, including Butuan City, is shown on page 10
(Figure 1-2-5). An up-to-date picture of power supply in Agusan del Norte is given by the 2014 annual
report of the Agusan del Norte Electric Cooperative (ANECO), which builds and manages the distribution
network in Agusan del Norte and Butuan City. ANECO supplies 120,336 households over an area of
2,730.24km2, with peak demand of 57,240kW, and sold 271,003,754.13kWh in 2014. It has the capacity to
supply 57,950kW in total, with contracts for 27,950kW from NPC and 30,000kW from IPPs. However, the
difference between capacity and peak demand is very small, giving it only 710kW of spare capacity. It had
38,636 power outages (supply interruptions) in a year, affecting the equivalent of 958,893 households.
Power supply in the area for this project is therefore still insufficient in terms of spare capacity and the
number of outages.
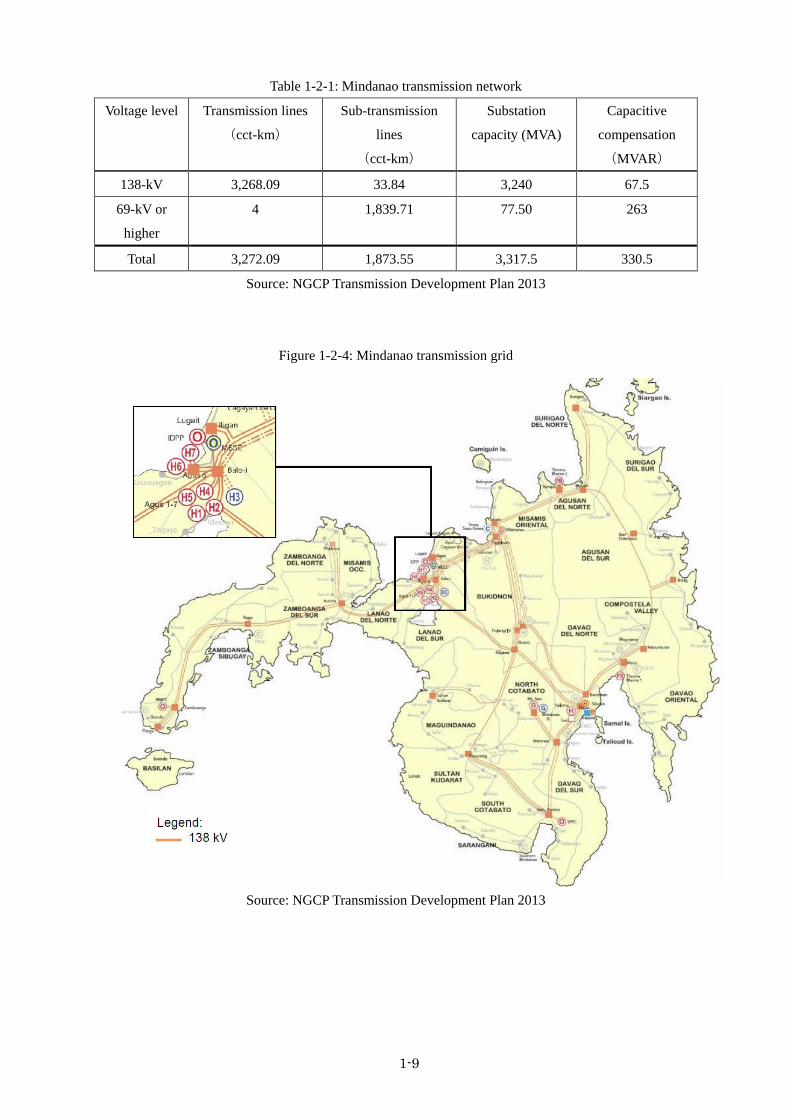
1-9
Table 1-2-1: Mindanao transmission network
Voltage level Transmission lines
(cct-km)
Sub-transmission
lines
(cct-km)
Substation
capacity (MVA)
Capacitive
compensation
(MVAR)
138-kV 3,268.09 33.84 3,240 67.5
69-kV or
higher
4 1,839.71 77.50 263
Total 3,272.09 1,873.55 3,317.5 330.5
Source: NGCP Transmission Development Plan 2013
Figure 1-2-4: Mindanao transmission grid
Source: NGCP Transmission Development Plan 2013
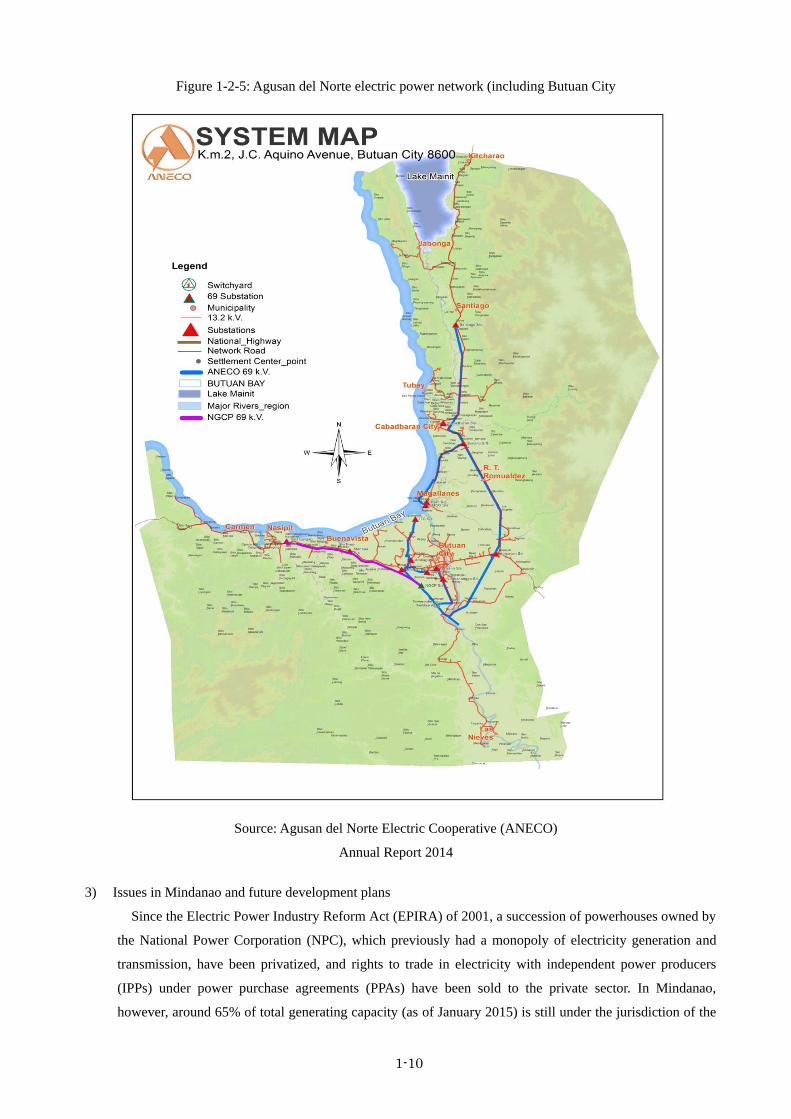
1-10
Figure 1-2-5: Agusan del Norte electric power network (including Butuan City
Source: Agusan del Norte Electric Cooperative (ANECO)
Annual Report 2014
3) Issues in Mindanao and future development plans
Since the Electric Power Industry Reform Act (EPIRA) of 2001, a succession of powerhouses owned by
the National Power Corporation (NPC), which previously had a monopoly of electricity generation and
transmission, have been privatized, and rights to trade in electricity with independent power producers
(IPPs) under power purchase agreements (PPAs) have been sold to the private sector. In Mindanao,
however, around 65% of total generating capacity (as of January 2015) is still under the jurisdiction of the
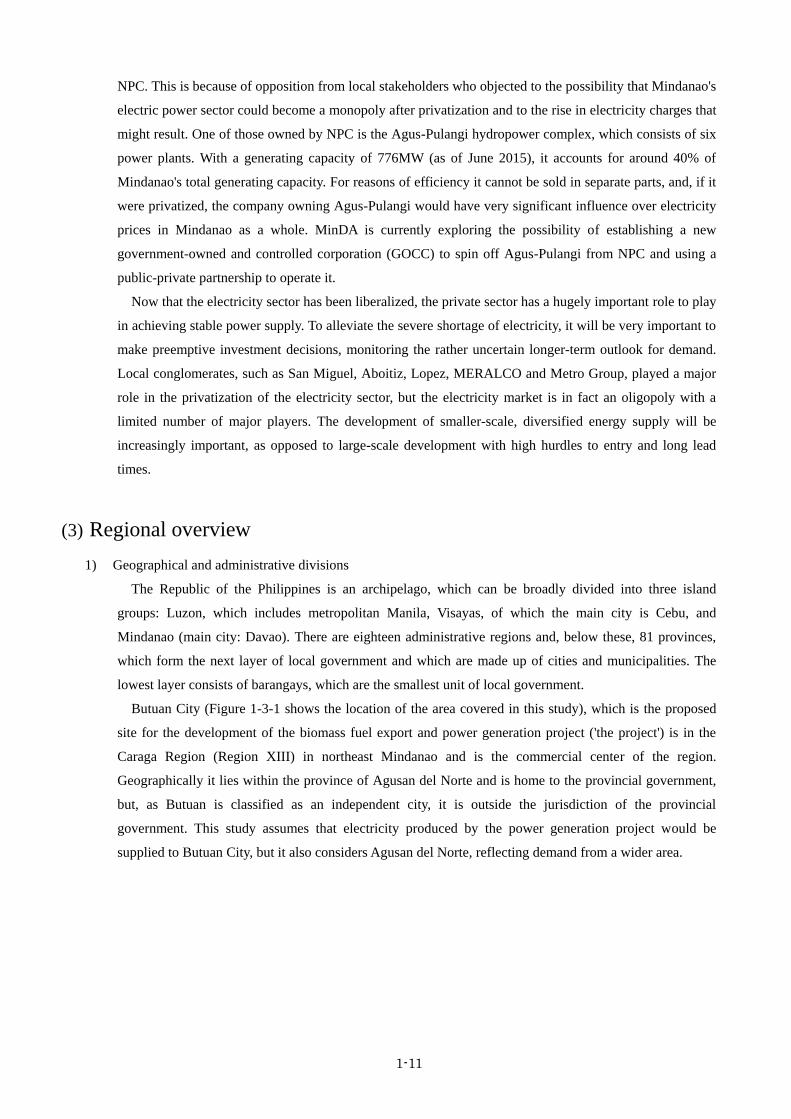
1-11
NPC. This is because of opposition from local stakeholders who objected to the possibility that Mindanao's
electric power sector could become a monopoly after privatization and to the rise in electricity charges that
might result. One of those owned by NPC is the Agus-Pulangi hydropower complex, which consists of six
power plants. With a generating capacity of 776MW (as of June 2015), it accounts for around 40% of
Mindanao's total generating capacity. For reasons of efficiency it cannot be sold in separate parts, and, if it
were privatized, the company owning Agus-Pulangi would have very significant influence over electricity
prices in Mindanao as a whole. MinDA is currently exploring the possibility of establishing a new
government-owned and controlled corporation (GOCC) to spin off Agus-Pulangi from NPC and using a
public-private partnership to operate it.
Now that the electricity sector has been liberalized, the private sector has a hugely important role to play
in achieving stable power supply. To alleviate the severe shortage of electricity, it will be very important to
make preemptive investment decisions, monitoring the rather uncertain longer-term outlook for demand.
Local conglomerates, such as San Miguel, Aboitiz, Lopez, MERALCO and Metro Group, played a major
role in the privatization of the electricity sector, but the electricity market is in fact an oligopoly with a
limited number of major players. The development of smaller-scale, diversified energy supply will be
increasingly important, as opposed to large-scale development with high hurdles to entry and long lead
times.
(3) Regional overview
1) Geographical and administrative divisions
The Republic of the Philippines is an archipelago, which can be broadly divided into three island
groups: Luzon, which includes metropolitan Manila, Visayas, of which the main city is Cebu, and
Mindanao (main city: Davao). There are eighteen administrative regions and, below these, 81 provinces,
which form the next layer of local government and which are made up of cities and municipalities. The
lowest layer consists of barangays, which are the smallest unit of local government.
Butuan City (Figure 1-3-1 shows the location of the area covered in this study), which is the proposed
site for the development of the biomass fuel export and power generation project ('the project') is in the
Caraga Region (Region XIII) in northeast Mindanao and is the commercial center of the region.
Geographically it lies within the province of Agusan del Norte and is home to the provincial government,
but, as Butuan is classified as an independent city, it is outside the jurisdiction of the provincial
government. This study assumes that electricity produced by the power generation project would be
supplied to Butuan City, but it also considers Agusan del Norte, reflecting demand from a wider area.
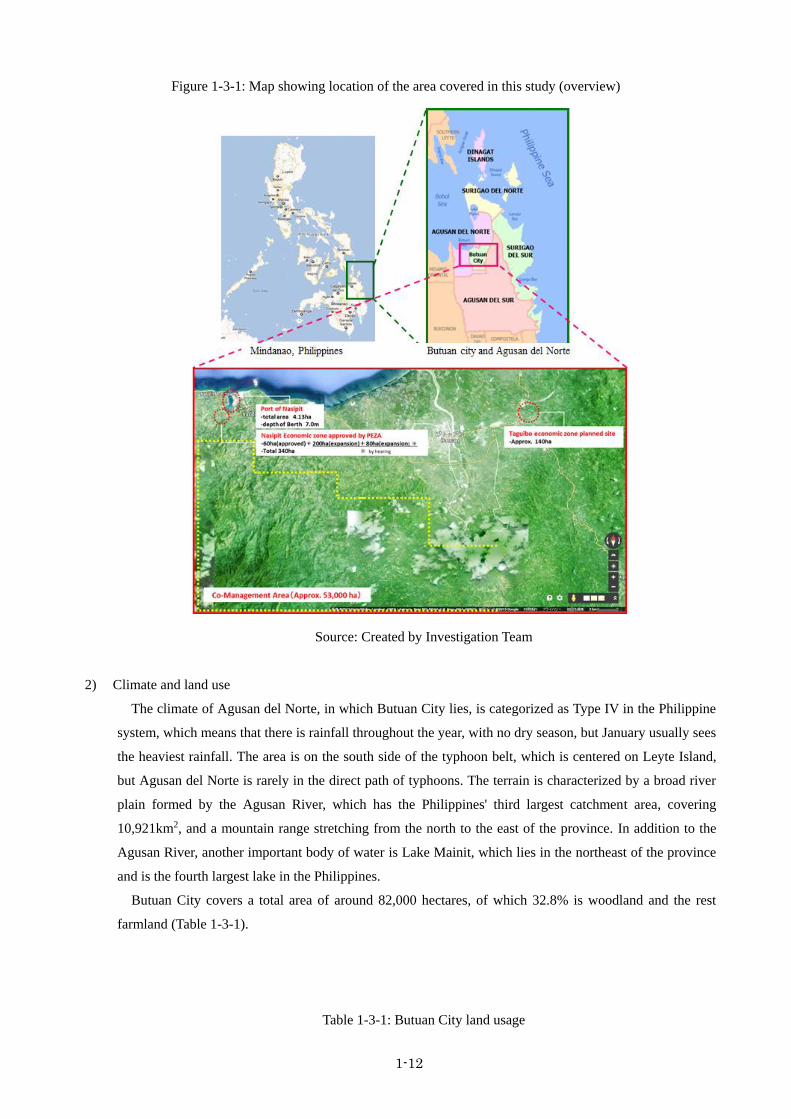
1-12
Figure 1-3-1: Map showing location of the area covered in this study (overview)
Source: Created by Investigation Team
2) Climate and land use
The climate of Agusan del Norte, in which Butuan City lies, is categorized as Type IV in the Philippine
system, which means that there is rainfall throughout the year, with no dry season, but January usually sees
the heaviest rainfall. The area is on the south side of the typhoon belt, which is centered on Leyte Island,
but Agusan del Norte is rarely in the direct path of typhoons. The terrain is characterized by a broad river
plain formed by the Agusan River, which has the Philippines' third largest catchment area, covering
10,921km2, and a mountain range stretching from the north to the east of the province. In addition to the
Agusan River, another important body of water is Lake Mainit, which lies in the northeast of the province
and is the fourth largest lake in the Philippines.
Butuan City covers a total area of around 82,000 hectares, of which 32.8% is woodland and the rest
farmland (Table 1-3-1).
Table 1-3-1: Butuan City land usage
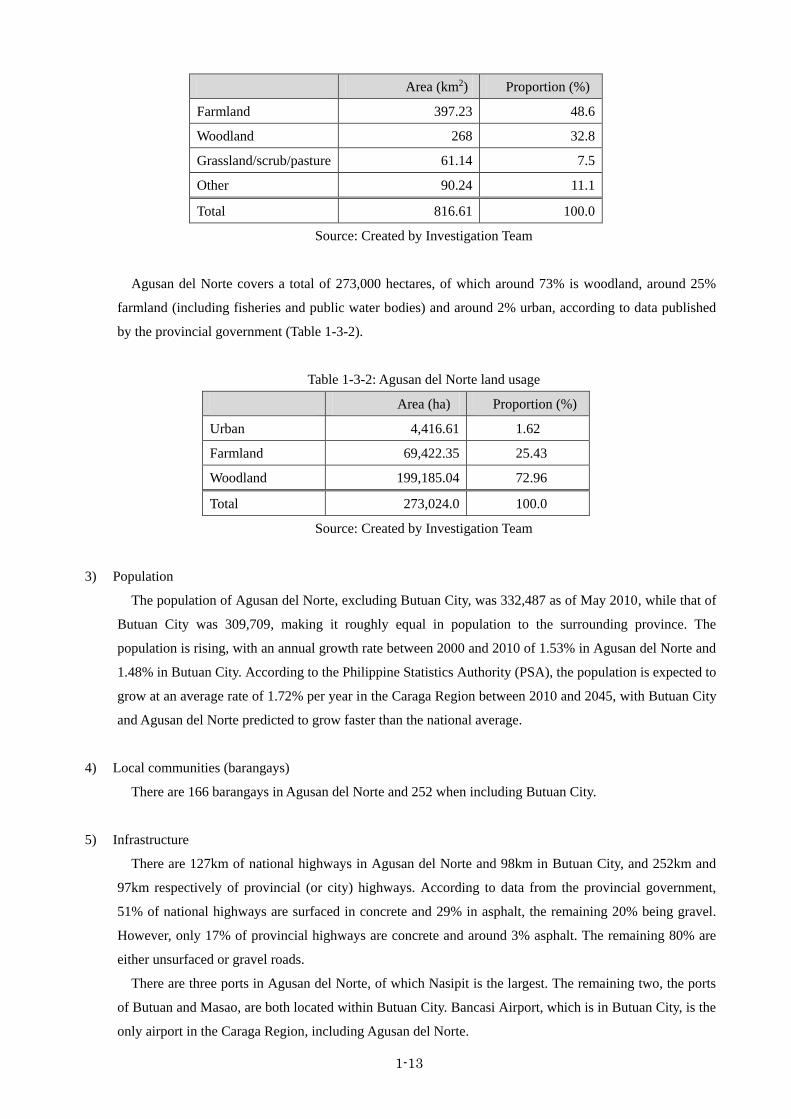
1-13
Area (km2) Proportion (%)
Farmland 397.23 48.6
Woodland 268 32.8
Grassland/scrub/pasture 61.14 7.5
Other 90.24 11.1
Total 816.61 100.0
Source: Created by Investigation Team
Agusan del Norte covers a total of 273,000 hectares, of which around 73% is woodland, around 25%
farmland (including fisheries and public water bodies) and around 2% urban, according to data published
by the provincial government (Table 1-3-2).
Table 1-3-2: Agusan del Norte land usage
Area (ha) Proportion (%)
Urban 4,416.61 1.62
Farmland 69,422.35 25.43
Woodland 199,185.04 72.96
Total 273,024.0 100.0
Source: Created by Investigation Team
3) Population
The population of Agusan del Norte, excluding Butuan City, was 332,487 as of May 2010, while that of
Butuan City was 309,709, making it roughly equal in population to the surrounding province. The
population is rising, with an annual growth rate between 2000 and 2010 of 1.53% in Agusan del Norte and
1.48% in Butuan City. According to the Philippine Statistics Authority (PSA), the population is expected to
grow at an average rate of 1.72% per year in the Caraga Region between 2010 and 2045, with Butuan City
and Agusan del Norte predicted to grow faster than the national average.
4) Local communities (barangays)
There are 166 barangays in Agusan del Norte and 252 when including Butuan City.
5) Infrastructure
There are 127km of national highways in Agusan del Norte and 98km in Butuan City, and 252km and
97km respectively of provincial (or city) highways. According to data from the provincial government,
51% of national highways are surfaced in concrete and 29% in asphalt, the remaining 20% being gravel.
However, only 17% of provincial highways are concrete and around 3% asphalt. The remaining 80% are
either unsurfaced or gravel roads.
There are three ports in Agusan del Norte, of which Nasipit is the largest. The remaining two, the ports
of Butuan and Masao, are both located within Butuan City. Bancasi Airport, which is in Butuan City, is the
only airport in the Caraga Region, including Agusan del Norte.
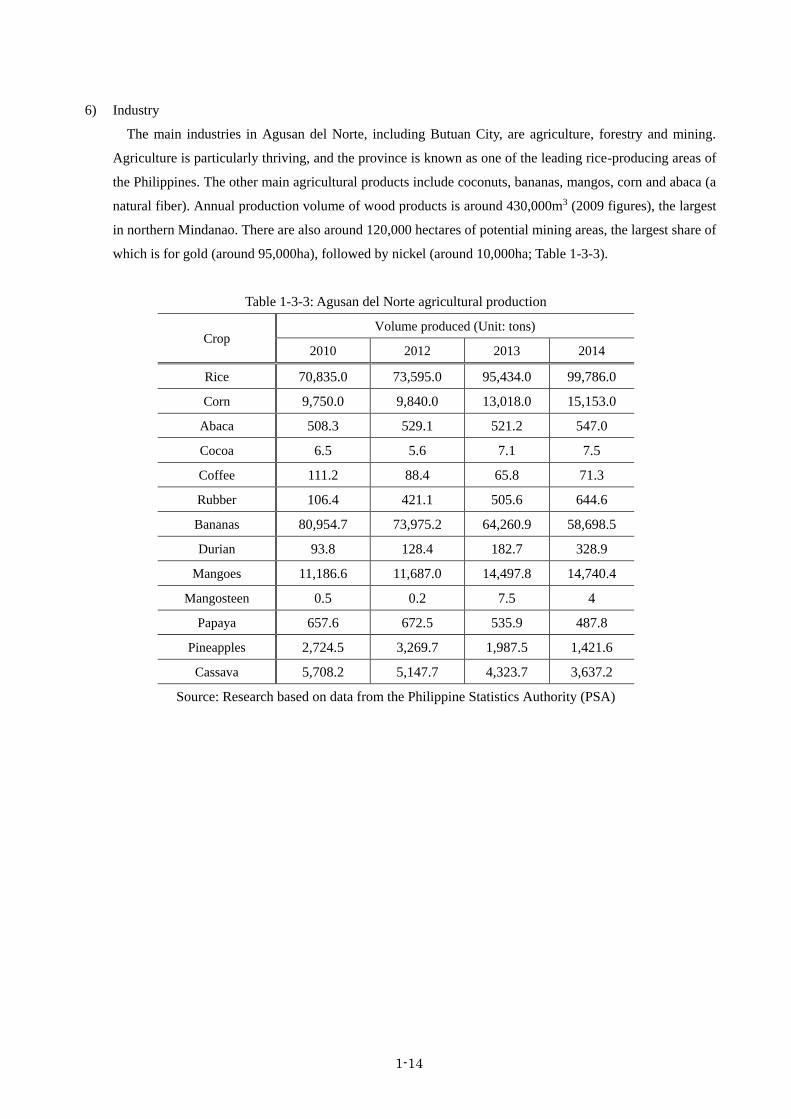
1-14
6) Industry
The main industries in Agusan del Norte, including Butuan City, are agriculture, forestry and mining.
Agriculture is particularly thriving, and the province is known as one of the leading rice-producing areas of
the Philippines. The other main agricultural products include coconuts, bananas, mangos, corn and abaca (a
natural fiber). Annual production volume of wood products is around 430,000m3 (2009 figures), the largest
in northern Mindanao. There are also around 120,000 hectares of potential mining areas, the largest share of
which is for gold (around 95,000ha), followed by nickel (around 10,000ha; Table 1-3-3).
Table 1-3-3: Agusan del Norte agricultural production
Crop Volume produced (Unit: tons)
2010 2012 2013 2014
Rice 70,835.0 73,595.0 95,434.0 99,786.0
Corn 9,750.0 9,840.0 13,018.0 15,153.0
Abaca 508.3 529.1 521.2 547.0
Cocoa 6.5 5.6 7.1 7.5
Coffee 111.2 88.4 65.8 71.3
Rubber 106.4 421.1 505.6 644.6
Bananas 80,954.7 73,975.2 64,260.9 58,698.5
Durian 93.8 128.4 182.7 328.9
Mangoes 11,186.6 11,687.0 14,497.8 14,740.4
Mangosteen 0.5 0.2 7.5 4
Papaya 657.6 672.5 535.9 487.8
Pineapples 2,724.5 3,269.7 1,987.5 1,421.6
Cassava 5,708.2 5,147.7 4,323.7 3,637.2
Source: Research based on data from the Philippine Statistics Authority (PSA)

Chapter2 Methodology
2-1
(1) Subject of the study
The study covered the points listed below in order to assess the feasibility of the project.
1) Outline of the partner country and the sector
a) Economy of the partner country
We compiled an overview of the economic and financial position of the Philippines, as well as its
industry and population growth, based on secondary sources.
b) Overview of the sector
We described the current supply and demand for electricity in the Philippines and on Mindanao, as
well as future projections, based on secondary sources.
c) Regional overview
We described the natural features and the state of society in northeastern Mindanao, which is the
location for the project.
2) Nature of the project and technical aspects
a) Background to the project and necessity
We describe the background to the project and the reasons why it is needed.
b) Feasibility study for sourcing usable biomass resources
Using existing research, we investigated the current availability of biomass resources and the
feasibility of sourcing these in addition to associated problems, as well as interviews and fact-finding
visits in the region. We considered three sources of biomass resources: wood, rice husks and coconut
residue.
We also looked at the legal framework relevant to the project, including forest management
certification.
c) Other issues affecting the nature of the project
Based on the results of these investigations, we considered various strategies for exploiting biomass
resources and selected projects that were feasible in the short and long term. We also considered in
detail two projects that were feasible in the short term: (a) burning rice husks to generate electricity and
produce silica, and (b) producing and exporting wood pellets made from sawdust.
3) Environmental and social issues
We produced a summary of information on social and environmental conditions in the region and
examined the potential environmental benefits of the project. We also examined the environmental and
social regulations of the partner country that would need to be considered when implementing the
project and what would need to be done to satisfy these.
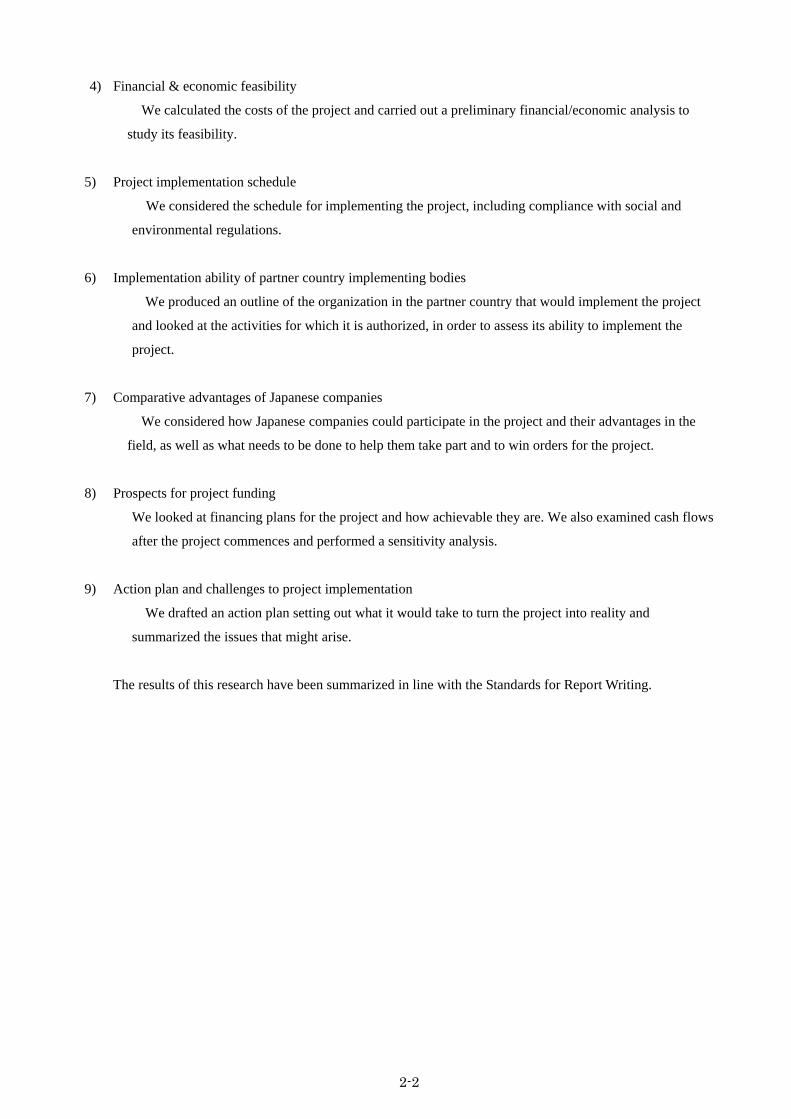
2-2
4) Financial & economic feasibility
We calculated the costs of the project and carried out a preliminary financial/economic analysis to
study its feasibility.
5) Project implementation schedule
We considered the schedule for implementing the project, including compliance with social and
environmental regulations.
6) Implementation ability of partner country implementing bodies
We produced an outline of the organization in the partner country that would implement the project
and looked at the activities for which it is authorized, in order to assess its ability to implement the
project.
7) Comparative advantages of Japanese companies
We considered how Japanese companies could participate in the project and their advantages in the
field, as well as what needs to be done to help them take part and to win orders for the project.
8) Prospects for project funding
We looked at financing plans for the project and how achievable they are. We also examined cash flows
after the project commences and performed a sensitivity analysis.
9) Action plan and challenges to project implementation
We drafted an action plan setting out what it would take to turn the project into reality and
summarized the issues that might arise.
The results of this research have been summarized in line with the Standards for Report Writing.
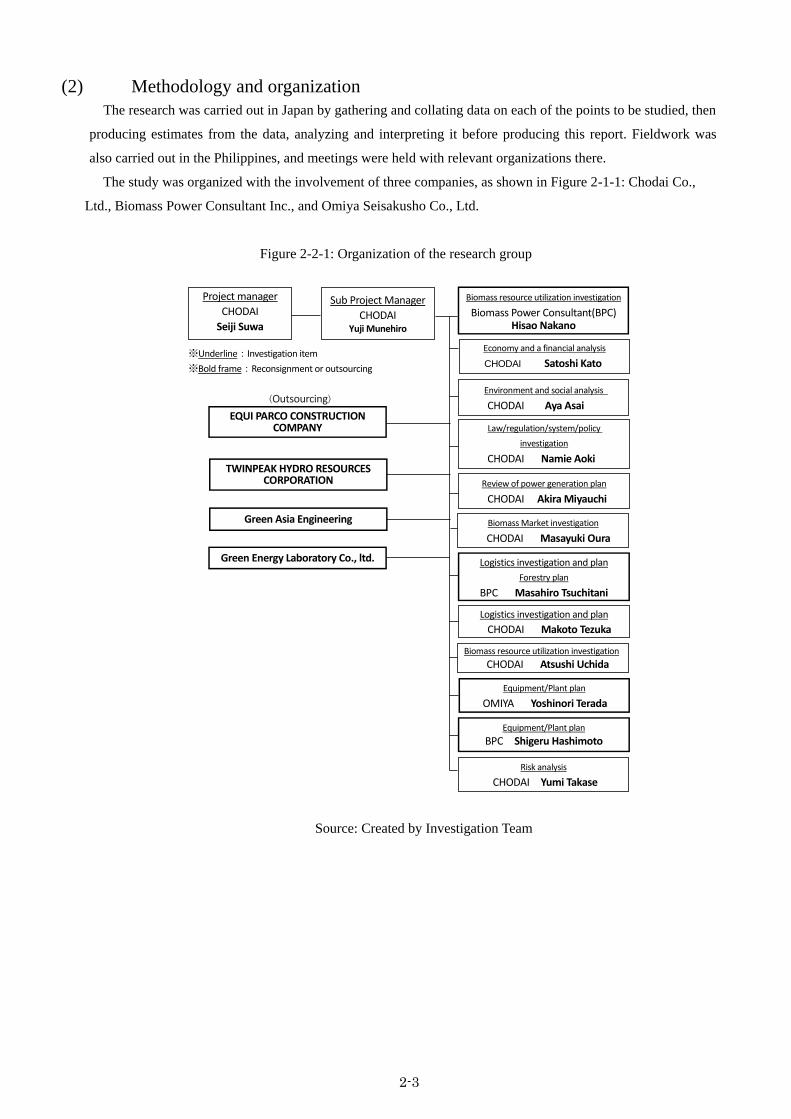
2-3
(2) Methodology and organization The research was carried out in Japan by gathering and collating data on each of the points to be studied, then
producing estimates from the data, analyzing and interpreting it before producing this report. Fieldwork was
also carried out in the Philippines, and meetings were held with relevant organizations there.
The study was organized with the involvement of three companies, as shown in Figure 2-1-1: Chodai Co.,
Ltd., Biomass Power Consultant Inc., and Omiya Seisakusho Co., Ltd.
Figure 2-2-1: Organization of the research group
1
※Underline:Investigation item
※Bold frame:Reconsignment or outsourcing
(Outsourcing)
Project manager
CHODAI
Seiji Suwa
Sub Project Manager
CHODAI Yuji Munehiro
EQUI PARCO CONSTRUCTION COMPANY
TWINPEAK HYDRO RESOURCES CORPORATION
Biomass resource utilization investigation
Biomass Power Consultant(BPC) Hisao Nakano
Logistics investigation and plan
CHODAI Makoto Tezuka
Environment and social analysis
CHODAI Aya Asai
Review of power generation plan
CHODAI Akira Miyauchi
Law/regulation/system/policy
investigation
CHODAI Namie Aoki
Logistics investigation and plan
Forestry plan
BPC Masahiro Tsuchitani
Biomass Market investigation
CHODAI Masayuki Oura
Biomass resource utilization investigation
CHODAI Atsushi Uchida
Equipment/Plant plan
OMIYA Yoshinori Terada
Equipment/Plant plan
BPC Shigeru Hashimoto
Risk analysis
CHODAI Yumi Takase
Economy and a financial analysis
CHODAI Satoshi Kato
Green Asia Engineering
Green Energy Laboratory Co., ltd.
Logistics investigation and plan
Biomass Power Consultant
Masahiro Tsuchitani
CHODAI
Makoto Tezuka
Forestry plan
Biomass Power Consultant
Yasuzumi Kondo
Environment and social analysis
CHODAI
Aya Asai
Risk analysis
CHODAI
Yumi Takase
Review of power generation plan
CHODAI
Akira Miyauchi
Source: Created by Investigation Team
2-4
(3) Research schedule Data gathering, analysis and interpretation were carried out in Japan between August 19 and December 24,
2015 and the report was written between December 21, 2015 and February 29, 2016. The schedule for
fieldwork was as shown in Table 2-3-1.
Table 2-3-1: Research schedule
Activity
2015
Aug
Sep
Oct
Nov
Dec
2016
Jan
Feb
Fieldwork
a) First fieldwork trip
b) Second fieldwork trip
c) Third fieldwork trip
d) Fourth fieldwork trip
e) Fifth fieldwork trip
f) Sixth fieldwork trip
g) Reporting to local partners
Work in Japan
Planning & preparation
(1) Outline of the partner country,
sector etc.
(2) Nature of the project and
technical aspects
(3) Environmental & social
analysis
(4) Economic & financial analysis
(5) Draft report produced
(6) Final report produced
Source: Created by Investigation Team
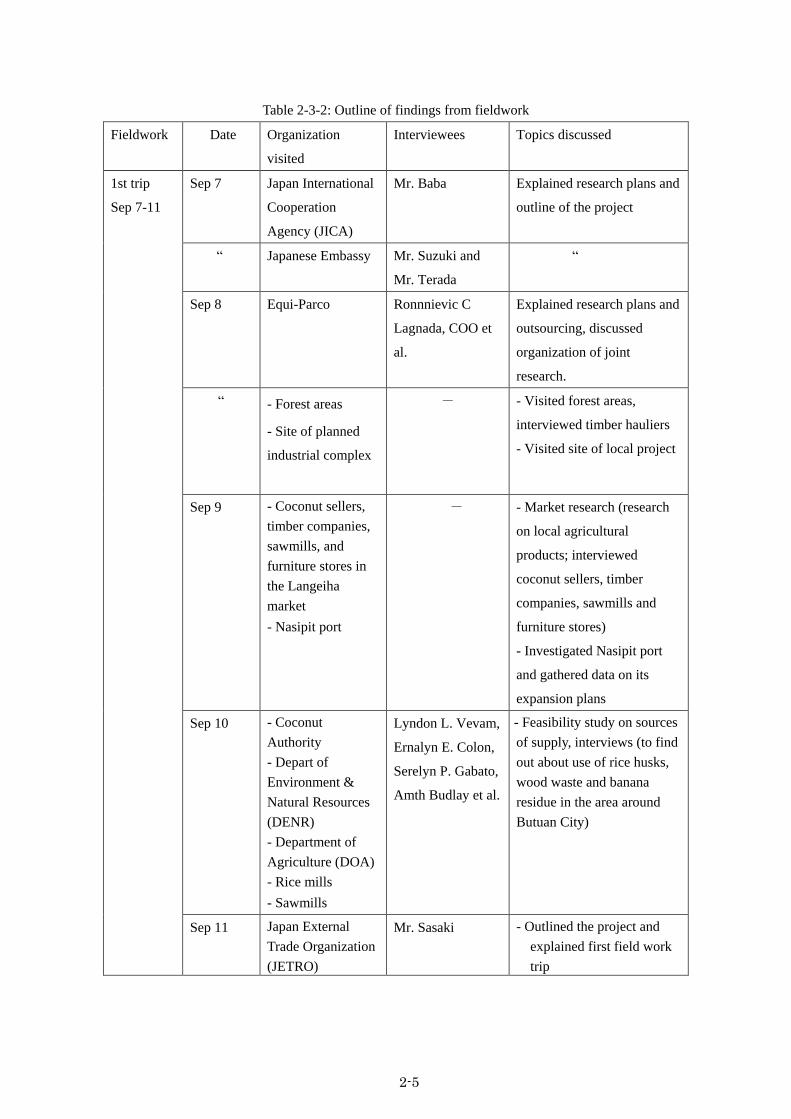
2-5
Table 2-3-2: Outline of findings from fieldwork
Fieldwork Date Organization
visited
Interviewees Topics discussed
1st trip
Sep 7-11
Sep 7 Japan International
Cooperation
Agency (JICA)
Mr. Baba Explained research plans and
outline of the project
“ Japanese Embassy Mr. Suzuki and
Mr. Terada
“
Sep 8 Equi-Parco Ronnnievic C
Lagnada, COO et
al.
Explained research plans and
outsourcing, discussed
organization of joint
research.
“ - Forest areas
- Site of planned
industrial complex
- - Visited forest areas,
interviewed timber hauliers
- Visited site of local project
Sep 9 - Coconut sellers,
timber companies,
sawmills, and
furniture stores in
the Langeiha
market
- Nasipit port
- - Market research (research
on local agricultural
products; interviewed
coconut sellers, timber
companies, sawmills and
furniture stores)
- Investigated Nasipit port
and gathered data on its
expansion plans
Sep 10 - Coconut
Authority
- Depart of
Environment &
Natural Resources
(DENR)
- Department of
Agriculture (DOA)
- Rice mills
- Sawmills
Lyndon L. Vevam,
Ernalyn E. Colon,
Serelyn P. Gabato,
Amth Budlay et al.
- Feasibility study on sources
of supply, interviews (to find
out about use of rice husks,
wood waste and banana
residue in the area around
Butuan City)
Sep 11 Japan External
Trade Organization
(JETRO)
Mr. Sasaki - Outlined the project and
explained first field work
trip
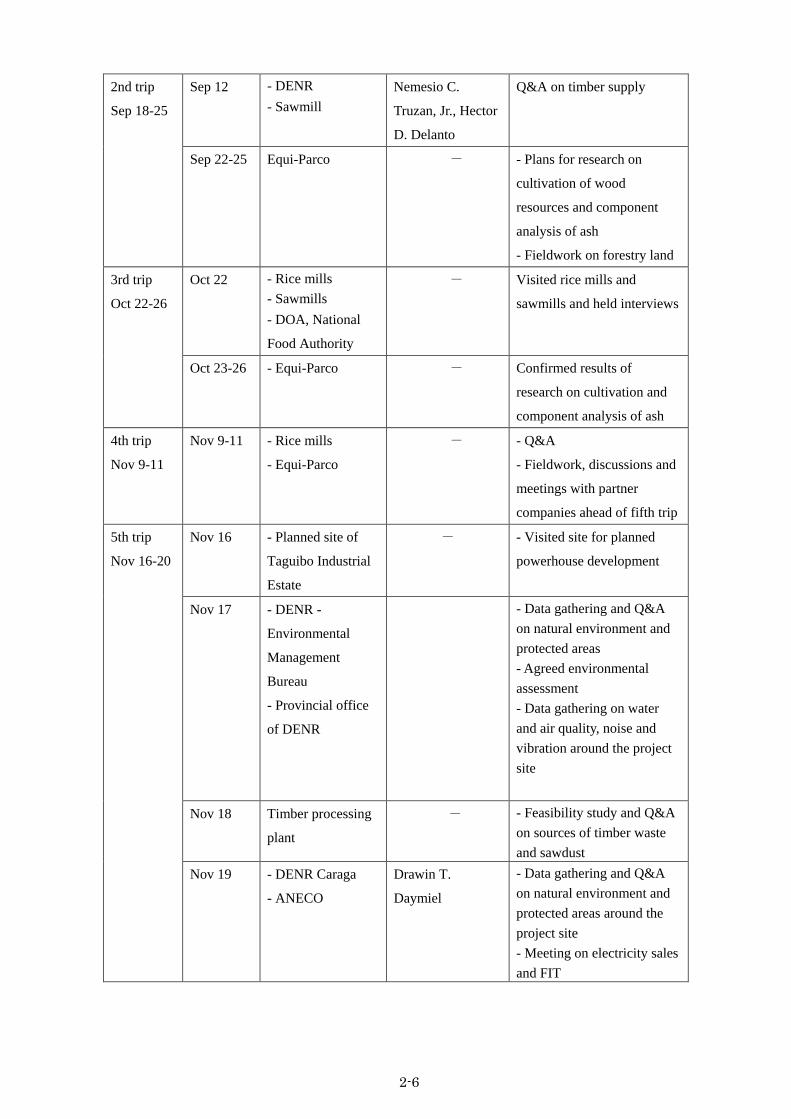
2-6
2nd trip
Sep 18-25
Sep 12 - DENR
- Sawmill
Nemesio C.
Truzan, Jr., Hector
D. Delanto
Q&A on timber supply
Sep 22-25 Equi-Parco - - Plans for research on
cultivation of wood
resources and component
analysis of ash
- Fieldwork on forestry land
3rd trip
Oct 22-26
Oct 22 - Rice mills
- Sawmills
- DOA, National
Food Authority
- Visited rice mills and
sawmills and held interviews
Oct 23-26 - Equi-Parco - Confirmed results of
research on cultivation and
component analysis of ash
4th trip
Nov 9-11
Nov 9-11 - Rice mills
- Equi-Parco
- - Q&A
- Fieldwork, discussions and
meetings with partner
companies ahead of fifth trip
5th trip
Nov 16-20
Nov 16 - Planned site of
Taguibo Industrial
Estate
- - Visited site for planned
powerhouse development
Nov 17 - DENR -
Environmental
Management
Bureau
- Provincial office
of DENR
- Data gathering and Q&A
on natural environment and
protected areas
- Agreed environmental
assessment
- Data gathering on water
and air quality, noise and
vibration around the project
site
Nov 18 Timber processing
plant
- - Feasibility study and Q&A
on sources of timber waste
and sawdust
Nov 19 - DENR Caraga
- ANECO
Drawin T.
Daymiel
- Data gathering and Q&A
on natural environment and
protected areas around the
project site
- Meeting on electricity sales
and FIT
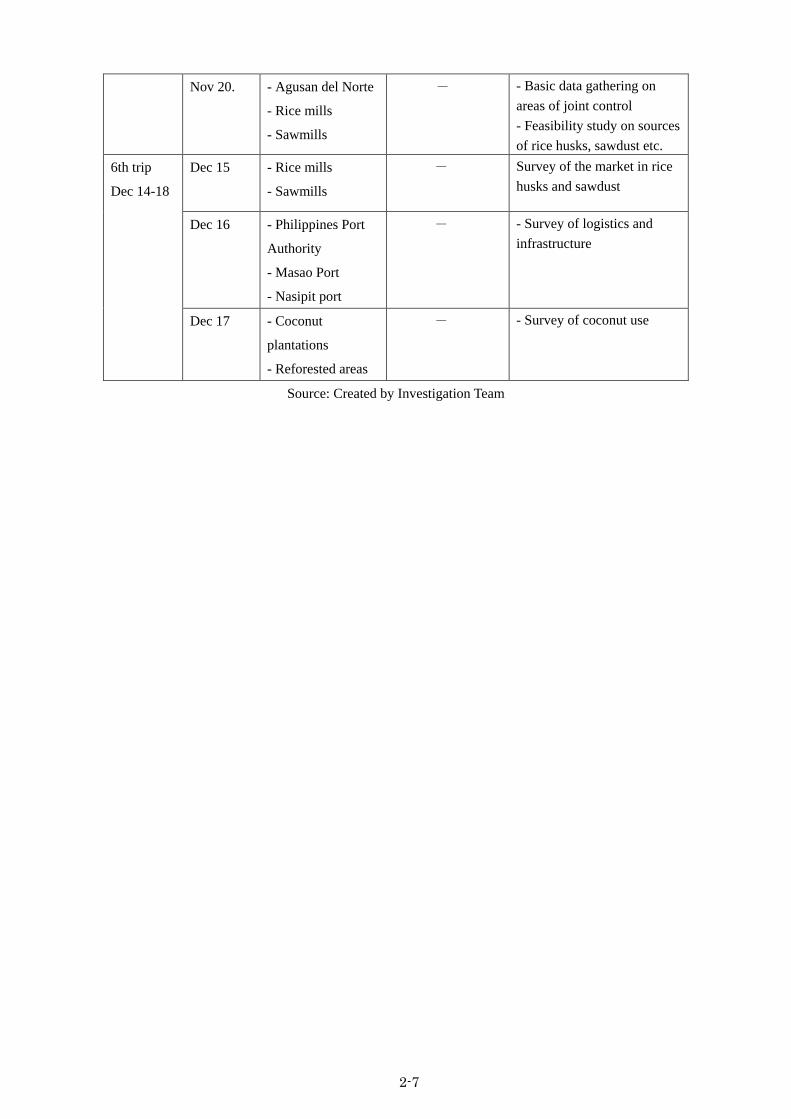
2-7
Nov 20. - Agusan del Norte
- Rice mills
- Sawmills
- - Basic data gathering on
areas of joint control
- Feasibility study on sources
of rice husks, sawdust etc.
6th trip
Dec 14-18
Dec 15 - Rice mills
- Sawmills
- Survey of the market in rice
husks and sawdust
Dec 16 - Philippines Port
Authority
- Masao Port
- Nasipit port
- - Survey of logistics and
infrastructure
Dec 17 - Coconut
plantations
- Reforested areas
- - Survey of coconut use
Source: Created by Investigation Team
Chapter 3 Project Details and Investigation into
Technological Feasibility
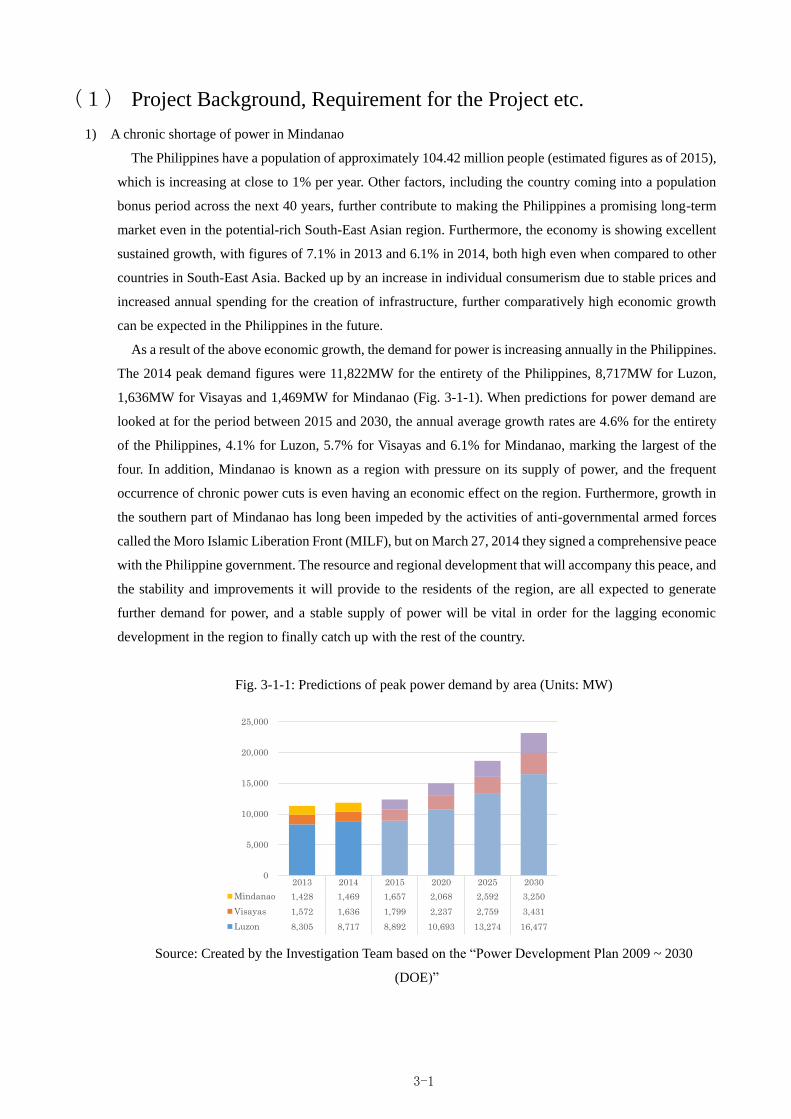
3-1
(1) Project Background, Requirement for the Project etc.
1) A chronic shortage of power in Mindanao
The Philippines have a population of approximately 104.42 million people (estimated figures as of 2015),
which is increasing at close to 1% per year. Other factors, including the country coming into a population
bonus period across the next 40 years, further contribute to making the Philippines a promising long-term
market even in the potential-rich South-East Asian region. Furthermore, the economy is showing excellent
sustained growth, with figures of 7.1% in 2013 and 6.1% in 2014, both high even when compared to other
countries in South-East Asia. Backed up by an increase in individual consumerism due to stable prices and
increased annual spending for the creation of infrastructure, further comparatively high economic growth
can be expected in the Philippines in the future.
As a result of the above economic growth, the demand for power is increasing annually in the Philippines.
The 2014 peak demand figures were 11,822MW for the entirety of the Philippines, 8,717MW for Luzon,
1,636MW for Visayas and 1,469MW for Mindanao (Fig. 3-1-1). When predictions for power demand are
looked at for the period between 2015 and 2030, the annual average growth rates are 4.6% for the entirety
of the Philippines, 4.1% for Luzon, 5.7% for Visayas and 6.1% for Mindanao, marking the largest of the
four. In addition, Mindanao is known as a region with pressure on its supply of power, and the frequent
occurrence of chronic power cuts is even having an economic effect on the region. Furthermore, growth in
the southern part of Mindanao has long been impeded by the activities of anti-governmental armed forces
called the Moro Islamic Liberation Front (MILF), but on March 27, 2014 they signed a comprehensive peace
with the Philippine government. The resource and regional development that will accompany this peace, and
the stability and improvements it will provide to the residents of the region, are all expected to generate
further demand for power, and a stable supply of power will be vital in order for the lagging economic
development in the region to finally catch up with the rest of the country.
Fig. 3-1-1: Predictions of peak power demand by area (Units: MW)
Source: Created by the Investigation Team based on the “Power Development Plan 2009 ~ 2030
(DOE)”
0
5,000
10,000
15,000
20,000
25,000
2013 2014 2015 2020 2025 2030
Mindanao 1,428 1,469 1,657 2,068 2,592 3,250
Visayas 1,572 1,636 1,799 2,237 2,759 3,431
Luzon 8,305 8,717 8,892 10,693 13,274 16,477
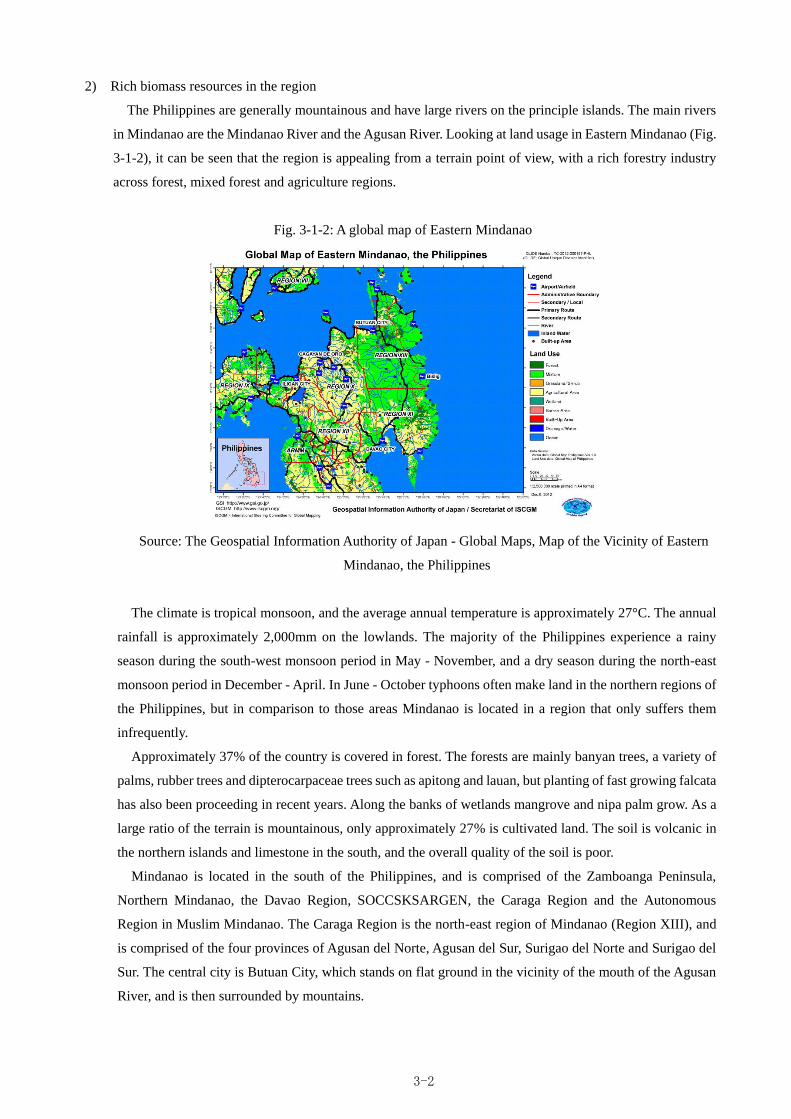
3-2
2) Rich biomass resources in the region
The Philippines are generally mountainous and have large rivers on the principle islands. The main rivers
in Mindanao are the Mindanao River and the Agusan River. Looking at land usage in Eastern Mindanao (Fig.
3-1-2), it can be seen that the region is appealing from a terrain point of view, with a rich forestry industry
across forest, mixed forest and agriculture regions.
Fig. 3-1-2: A global map of Eastern Mindanao
Source: The Geospatial Information Authority of Japan - Global Maps, Map of the Vicinity of Eastern
Mindanao, the Philippines
The climate is tropical monsoon, and the average annual temperature is approximately 27°C. The annual
rainfall is approximately 2,000mm on the lowlands. The majority of the Philippines experience a rainy
season during the south-west monsoon period in May - November, and a dry season during the north-east
monsoon period in December - April. In June - October typhoons often make land in the northern regions of
the Philippines, but in comparison to those areas Mindanao is located in a region that only suffers them
infrequently.
Approximately 37% of the country is covered in forest. The forests are mainly banyan trees, a variety of
palms, rubber trees and dipterocarpaceae trees such as apitong and lauan, but planting of fast growing falcata
has also been proceeding in recent years. Along the banks of wetlands mangrove and nipa palm grow. As a
large ratio of the terrain is mountainous, only approximately 27% is cultivated land. The soil is volcanic in
the northern islands and limestone in the south, and the overall quality of the soil is poor.
Mindanao is located in the south of the Philippines, and is comprised of the Zamboanga Peninsula,
Northern Mindanao, the Davao Region, SOCCSKSARGEN, the Caraga Region and the Autonomous
Region in Muslim Mindanao. The Caraga Region is the north-east region of Mindanao (Region XIII), and
is comprised of the four provinces of Agusan del Norte, Agusan del Sur, Surigao del Norte and Surigao del
Sur. The central city is Butuan City, which stands on flat ground in the vicinity of the mouth of the Agusan
River, and is then surrounded by mountains.
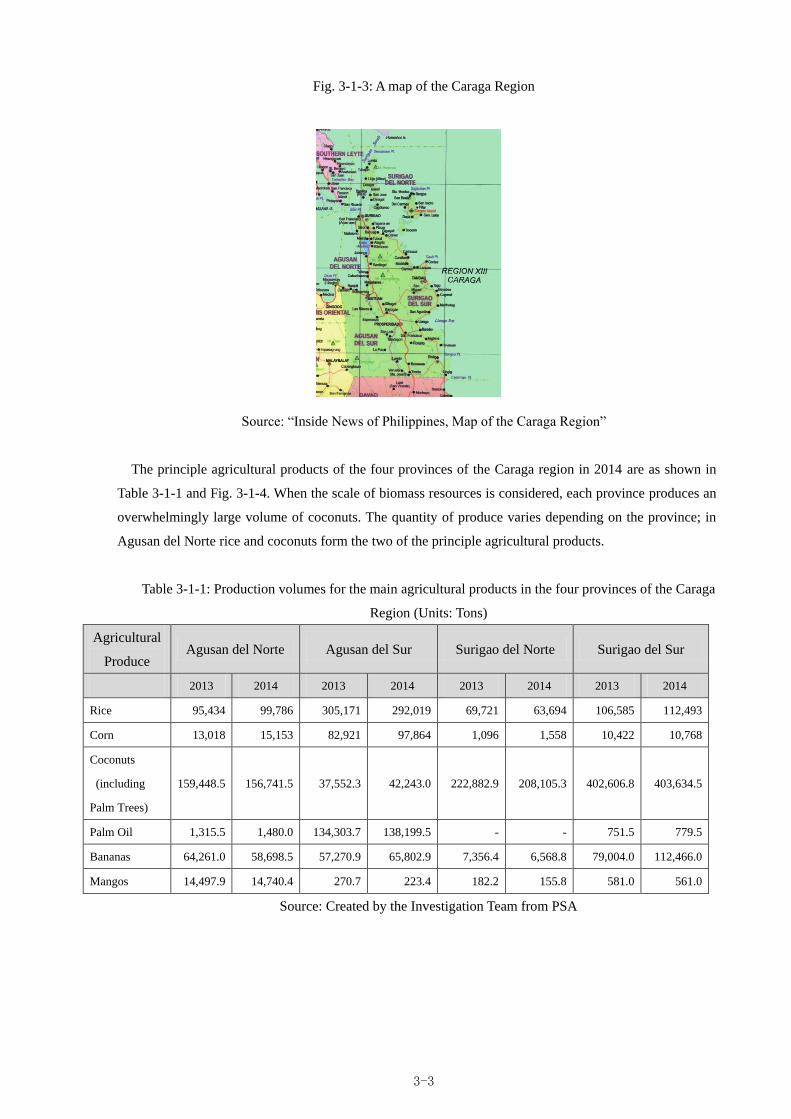
3-3
Fig. 3-1-3: A map of the Caraga Region
Source: “Inside News of Philippines, Map of the Caraga Region”
The principle agricultural products of the four provinces of the Caraga region in 2014 are as shown in
Table 3-1-1 and Fig. 3-1-4. When the scale of biomass resources is considered, each province produces an
overwhelmingly large volume of coconuts. The quantity of produce varies depending on the province; in
Agusan del Norte rice and coconuts form the two of the principle agricultural products.
Table 3-1-1: Production volumes for the main agricultural products in the four provinces of the Caraga
Region (Units: Tons)
Agricultural
Produce Agusan del Norte Agusan del Sur Surigao del Norte Surigao del Sur
2013 2014 2013 2014 2013 2014 2013 2014
Rice 95,434 99,786 305,171 292,019 69,721 63,694 106,585 112,493
Corn 13,018 15,153 82,921 97,864 1,096 1,558 10,422 10,768
Coconuts
(including
Palm Trees)
159,448.5 156,741.5 37,552.3 42,243.0 222,882.9 208,105.3 402,606.8 403,634.5
Palm Oil 1,315.5 1,480.0 134,303.7 138,199.5 - - 751.5 779.5
Bananas 64,261.0 58,698.5 57,270.9 65,802.9 7,356.4 6,568.8 79,004.0 112,466.0
Mangos 14,497.9 14,740.4 270.7 223.4 182.2 155.8 581.0 561.0
Source: Created by the Investigation Team from PSA
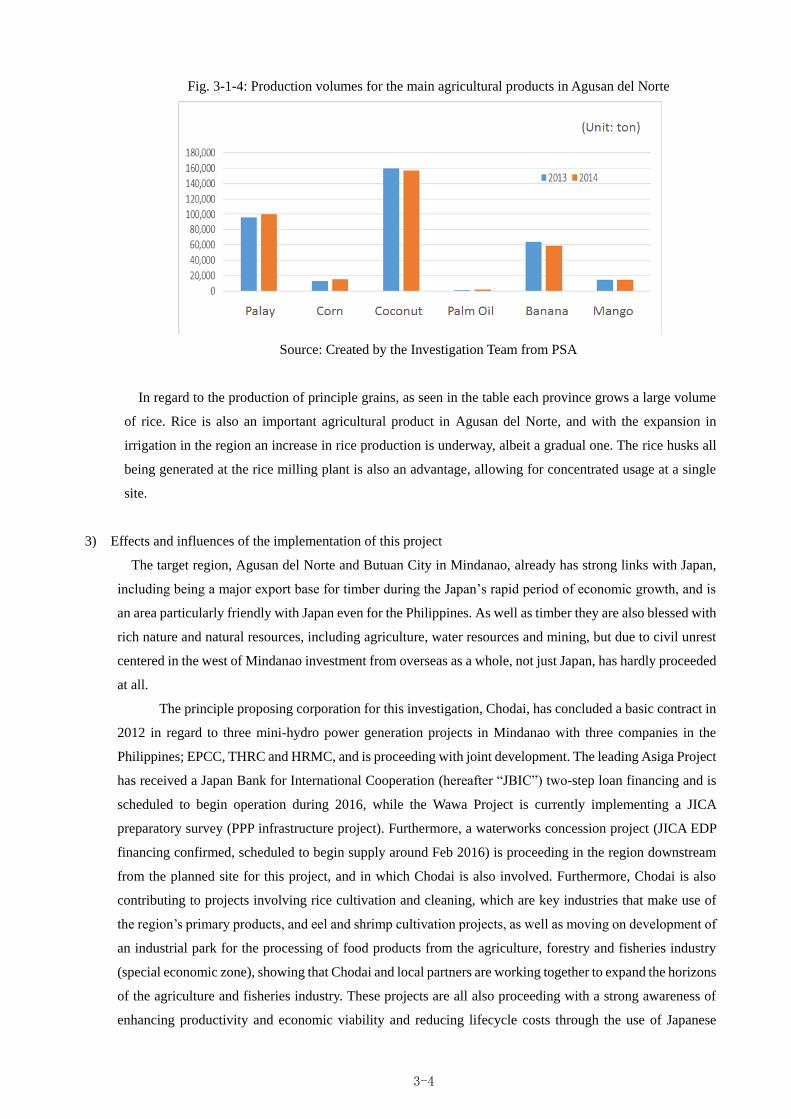
3-4
Fig. 3-1-4: Production volumes for the main agricultural products in Agusan del Norte
Source: Created by the Investigation Team from PSA
In regard to the production of principle grains, as seen in the table each province grows a large volume
of rice. Rice is also an important agricultural product in Agusan del Norte, and with the expansion in
irrigation in the region an increase in rice production is underway, albeit a gradual one. The rice husks all
being generated at the rice milling plant is also an advantage, allowing for concentrated usage at a single
site.
3) Effects and influences of the implementation of this project
The target region, Agusan del Norte and Butuan City in Mindanao, already has strong links with Japan,
including being a major export base for timber during the Japan’s rapid period of economic growth, and is
an area particularly friendly with Japan even for the Philippines. As well as timber they are also blessed with
rich nature and natural resources, including agriculture, water resources and mining, but due to civil unrest
centered in the west of Mindanao investment from overseas as a whole, not just Japan, has hardly proceeded
at all.
The principle proposing corporation for this investigation, Chodai, has concluded a basic contract in
2012 in regard to three mini-hydro power generation projects in Mindanao with three companies in the
Philippines; EPCC, THRC and HRMC, and is proceeding with joint development. The leading Asiga Project
has received a Japan Bank for International Cooperation (hereafter “JBIC”) two-step loan financing and is
scheduled to begin operation during 2016, while the Wawa Project is currently implementing a JICA
preparatory survey (PPP infrastructure project). Furthermore, a waterworks concession project (JICA EDP
financing confirmed, scheduled to begin supply around Feb 2016) is proceeding in the region downstream
from the planned site for this project, and in which Chodai is also involved. Furthermore, Chodai is also
contributing to projects involving rice cultivation and cleaning, which are key industries that make use of
the region’s primary products, and eel and shrimp cultivation projects, as well as moving on development of
an industrial park for the processing of food products from the agriculture, forestry and fisheries industry
(special economic zone), showing that Chodai and local partners are working together to expand the horizons
of the agriculture and fisheries industry. These projects are all also proceeding with a strong awareness of
enhancing productivity and economic viability and reducing lifecycle costs through the use of Japanese
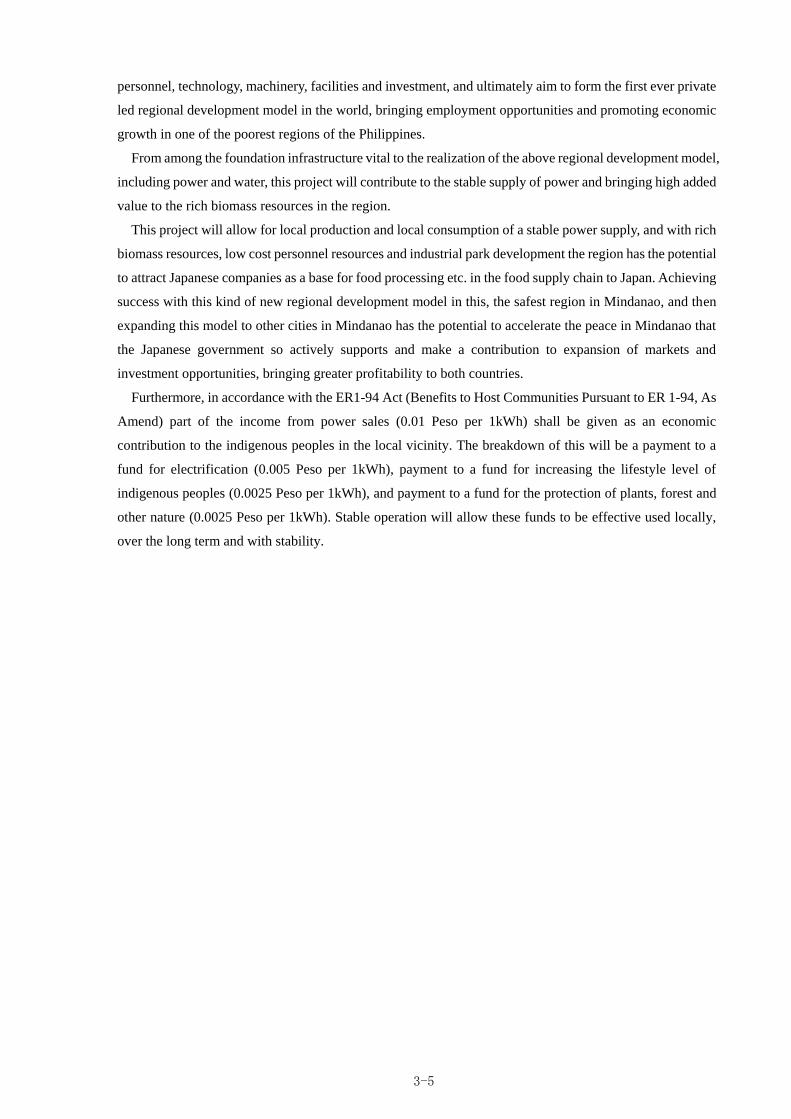
3-5
personnel, technology, machinery, facilities and investment, and ultimately aim to form the first ever private
led regional development model in the world, bringing employment opportunities and promoting economic
growth in one of the poorest regions of the Philippines.
From among the foundation infrastructure vital to the realization of the above regional development model,
including power and water, this project will contribute to the stable supply of power and bringing high added
value to the rich biomass resources in the region.
This project will allow for local production and local consumption of a stable power supply, and with rich
biomass resources, low cost personnel resources and industrial park development the region has the potential
to attract Japanese companies as a base for food processing etc. in the food supply chain to Japan. Achieving
success with this kind of new regional development model in this, the safest region in Mindanao, and then
expanding this model to other cities in Mindanao has the potential to accelerate the peace in Mindanao that
the Japanese government so actively supports and make a contribution to expansion of markets and
investment opportunities, bringing greater profitability to both countries.
Furthermore, in accordance with the ER1-94 Act (Benefits to Host Communities Pursuant to ER 1-94, As
Amend) part of the income from power sales (0.01 Peso per 1kWh) shall be given as an economic
contribution to the indigenous peoples in the local vicinity. The breakdown of this will be a payment to a
fund for electrification (0.005 Peso per 1kWh), payment to a fund for increasing the lifestyle level of
indigenous peoples (0.0025 Peso per 1kWh), and payment to a fund for the protection of plants, forest and
other nature (0.0025 Peso per 1kWh). Stable operation will allow these funds to be effective used locally,
over the long term and with stability.
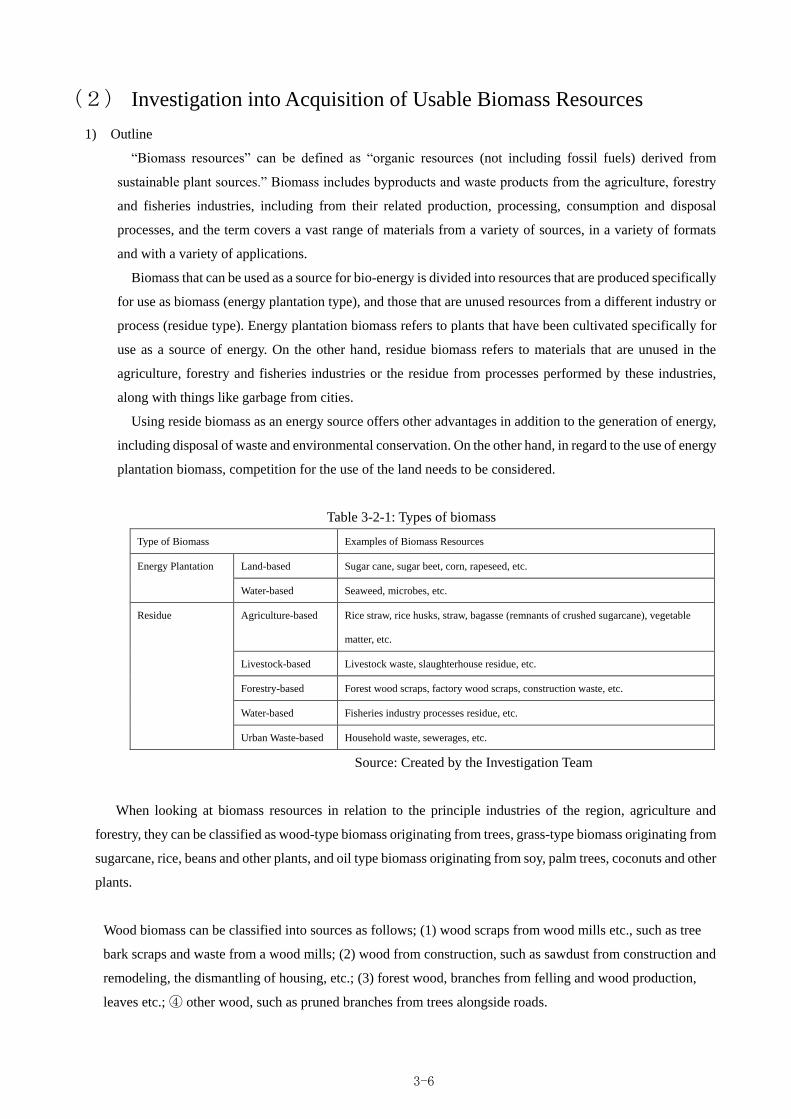
3-6
(2) Investigation into Acquisition of Usable Biomass Resources
1) Outline
“Biomass resources” can be defined as “organic resources (not including fossil fuels) derived from
sustainable plant sources.” Biomass includes byproducts and waste products from the agriculture, forestry
and fisheries industries, including from their related production, processing, consumption and disposal
processes, and the term covers a vast range of materials from a variety of sources, in a variety of formats
and with a variety of applications.
Biomass that can be used as a source for bio-energy is divided into resources that are produced specifically
for use as biomass (energy plantation type), and those that are unused resources from a different industry or
process (residue type). Energy plantation biomass refers to plants that have been cultivated specifically for
use as a source of energy. On the other hand, residue biomass refers to materials that are unused in the
agriculture, forestry and fisheries industries or the residue from processes performed by these industries,
along with things like garbage from cities.
Using reside biomass as an energy source offers other advantages in addition to the generation of energy,
including disposal of waste and environmental conservation. On the other hand, in regard to the use of energy
plantation biomass, competition for the use of the land needs to be considered.
Table 3-2-1: Types of biomass
Type of Biomass Examples of Biomass Resources
Energy Plantation Land-based Sugar cane, sugar beet, corn, rapeseed, etc.
Water-based Seaweed, microbes, etc.
Residue Agriculture-based Rice straw, rice husks, straw, bagasse (remnants of crushed sugarcane), vegetable
matter, etc.
Livestock-based Livestock waste, slaughterhouse residue, etc.
Forestry-based Forest wood scraps, factory wood scraps, construction waste, etc.
Water-based Fisheries industry processes residue, etc.
Urban Waste-based Household waste, sewerages, etc.
Source: Created by the Investigation Team
When looking at biomass resources in relation to the principle industries of the region, agriculture and
forestry, they can be classified as wood-type biomass originating from trees, grass-type biomass originating from
sugarcane, rice, beans and other plants, and oil type biomass originating from soy, palm trees, coconuts and other
plants.
Wood biomass can be classified into sources as follows; (1) wood scraps from wood mills etc., such as tree
bark scraps and waste from a wood mills; (2) wood from construction, such as sawdust from construction and
remodeling, the dismantling of housing, etc.; (3) forest wood, branches from felling and wood production,
leaves etc.; ④ other wood, such as pruned branches from trees alongside roads.
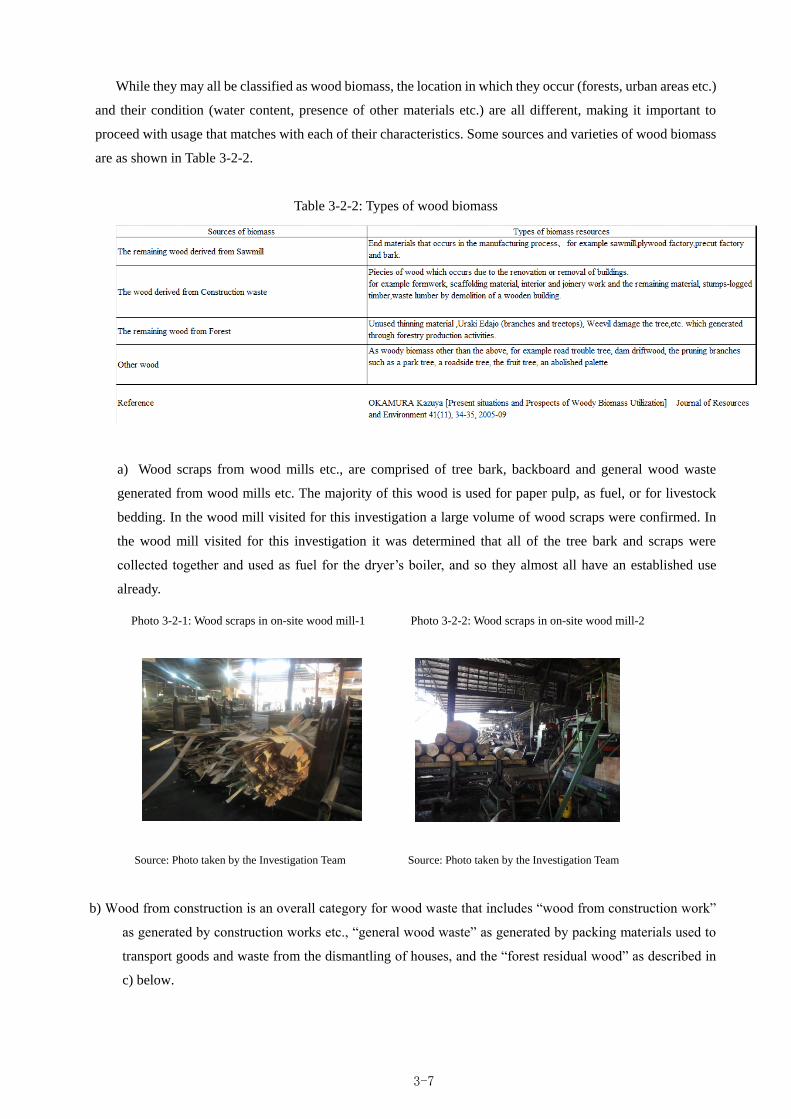
3-7
While they may all be classified as wood biomass, the location in which they occur (forests, urban areas etc.)
and their condition (water content, presence of other materials etc.) are all different, making it important to
proceed with usage that matches with each of their characteristics. Some sources and varieties of wood biomass
are as shown in Table 3-2-2.
Table 3-2-2: Types of wood biomass
a) Wood scraps from wood mills etc., are comprised of tree bark, backboard and general wood waste
generated from wood mills etc. The majority of this wood is used for paper pulp, as fuel, or for livestock
bedding. In the wood mill visited for this investigation a large volume of wood scraps were confirmed. In
the wood mill visited for this investigation it was determined that all of the tree bark and scraps were
collected together and used as fuel for the dryer’s boiler, and so they almost all have an established use
already.
Photo 3-2-1: Wood scraps in on-site wood mill-1 Photo 3-2-2: Wood scraps in on-site wood mill-2
Source: Photo taken by the Investigation Team Source: Photo taken by the Investigation Team
b) Wood from construction is an overall category for wood waste that includes “wood from construction work”
as generated by construction works etc., “general wood waste” as generated by packing materials used to
transport goods and waste from the dismantling of houses, and the “forest residual wood” as described in
c) below.
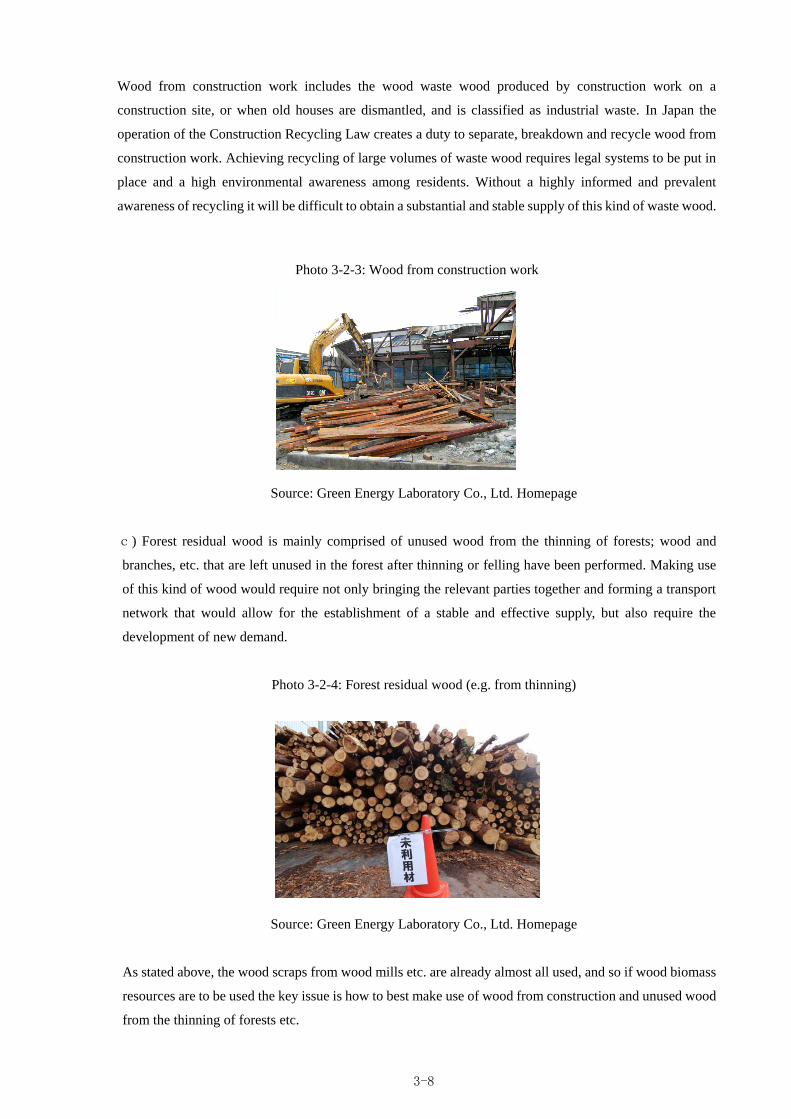
3-8
Wood from construction work includes the wood waste wood produced by construction work on a
construction site, or when old houses are dismantled, and is classified as industrial waste. In Japan the
operation of the Construction Recycling Law creates a duty to separate, breakdown and recycle wood from
construction work. Achieving recycling of large volumes of waste wood requires legal systems to be put in
place and a high environmental awareness among residents. Without a highly informed and prevalent
awareness of recycling it will be difficult to obtain a substantial and stable supply of this kind of waste wood.
Photo 3-2-3: Wood from construction work
Source: Green Energy Laboratory Co., Ltd. Homepage
c) Forest residual wood is mainly comprised of unused wood from the thinning of forests; wood and
branches, etc. that are left unused in the forest after thinning or felling have been performed. Making use
of this kind of wood would require not only bringing the relevant parties together and forming a transport
network that would allow for the establishment of a stable and effective supply, but also require the
development of new demand.
Photo 3-2-4: Forest residual wood (e.g. from thinning)
Source: Green Energy Laboratory Co., Ltd. Homepage
As stated above, the wood scraps from wood mills etc. are already almost all used, and so if wood biomass
resources are to be used the key issue is how to best make use of wood from construction and unused wood
from the thinning of forests etc.
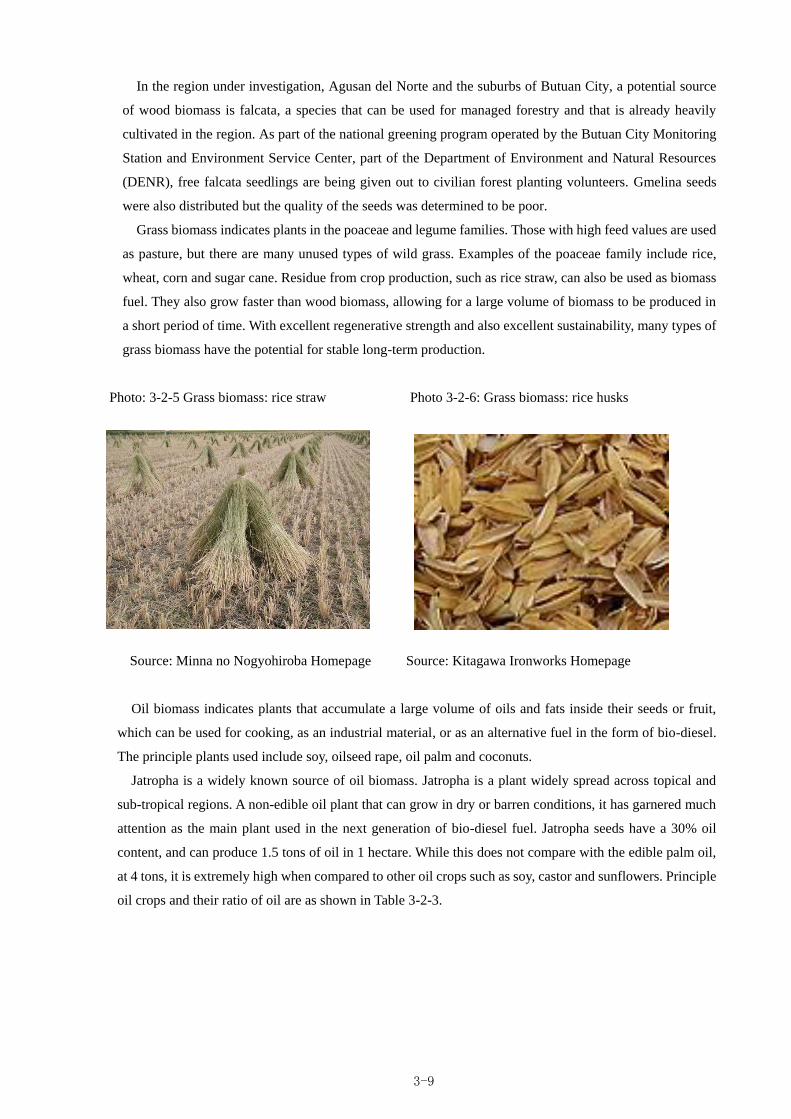
3-9
In the region under investigation, Agusan del Norte and the suburbs of Butuan City, a potential source
of wood biomass is falcata, a species that can be used for managed forestry and that is already heavily
cultivated in the region. As part of the national greening program operated by the Butuan City Monitoring
Station and Environment Service Center, part of the Department of Environment and Natural Resources
(DENR), free falcata seedlings are being given out to civilian forest planting volunteers. Gmelina seeds
were also distributed but the quality of the seeds was determined to be poor.
Grass biomass indicates plants in the poaceae and legume families. Those with high feed values are used
as pasture, but there are many unused types of wild grass. Examples of the poaceae family include rice,
wheat, corn and sugar cane. Residue from crop production, such as rice straw, can also be used as biomass
fuel. They also grow faster than wood biomass, allowing for a large volume of biomass to be produced in
a short period of time. With excellent regenerative strength and also excellent sustainability, many types of
grass biomass have the potential for stable long-term production.
Photo: 3-2-5 Grass biomass: rice straw Photo 3-2-6: Grass biomass: rice husks
Source: Minna no Nogyohiroba Homepage Source: Kitagawa Ironworks Homepage
Oil biomass indicates plants that accumulate a large volume of oils and fats inside their seeds or fruit,
which can be used for cooking, as an industrial material, or as an alternative fuel in the form of bio-diesel.
The principle plants used include soy, oilseed rape, oil palm and coconuts.
Jatropha is a widely known source of oil biomass. Jatropha is a plant widely spread across topical and
sub-tropical regions. A non-edible oil plant that can grow in dry or barren conditions, it has garnered much
attention as the main plant used in the next generation of bio-diesel fuel. Jatropha seeds have a 30% oil
content, and can produce 1.5 tons of oil in 1 hectare. While this does not compare with the edible palm oil,
at 4 tons, it is extremely high when compared to other oil crops such as soy, castor and sunflowers. Principle
oil crops and their ratio of oil are as shown in Table 3-2-3.
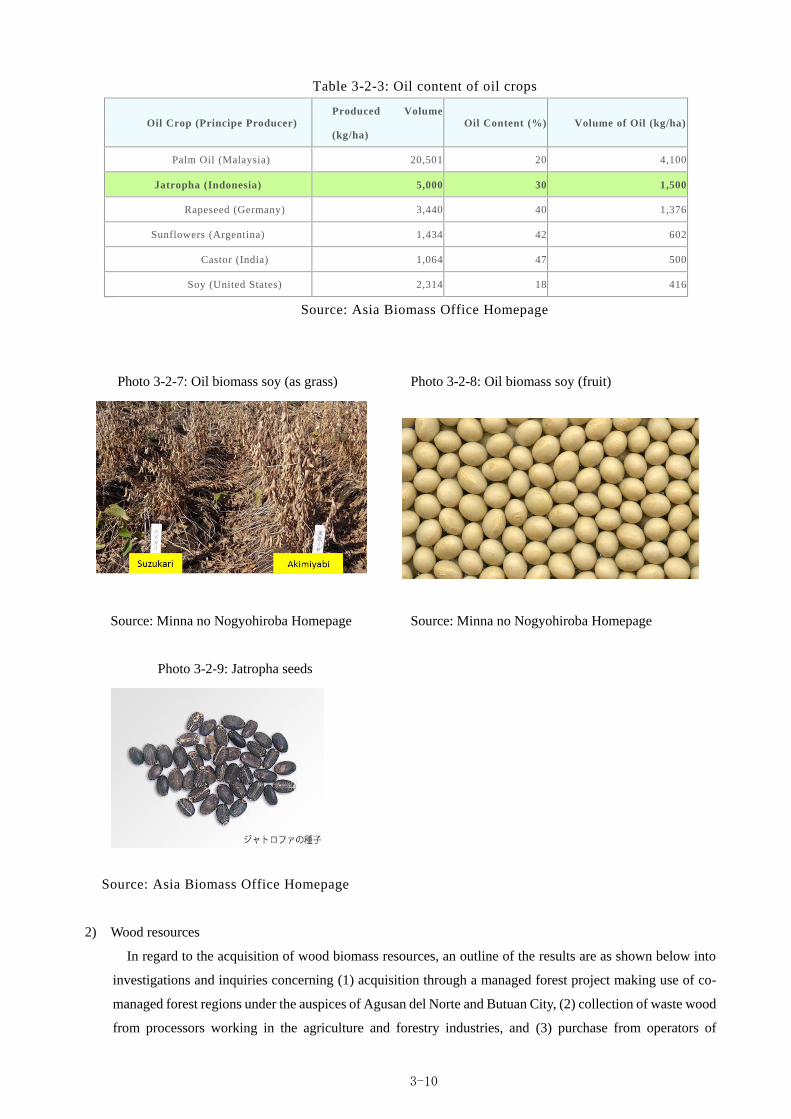
3-10
Table 3-2-3: Oil content of oil crops
Oil Crop (Principe Producer)
Produced Volume
(kg/ha)
Oil Content (%) Volume of Oil (kg/ha)
Palm Oil (Malaysia) 20,501 20 4,100
Jatropha (Indonesia) 5,000 30 1,500
Rapeseed (Germany) 3,440 40 1,376
Sunflowers (Argentina) 1,434 42 602
Castor (India) 1,064 47 500
Soy (United States) 2,314 18 416
Source: Asia Biomass Office Homepage
Photo 3-2-7: Oil biomass soy (as grass) Photo 3-2-8: Oil biomass soy (fruit)
Source: Minna no Nogyohiroba Homepage Source: Minna no Nogyohiroba Homepage
Photo 3-2-9: Jatropha seeds
Source: Asia Biomass Office Homepage
2) Wood resources
In regard to the acquisition of wood biomass resources, an outline of the results are as shown below into
investigations and inquiries concerning (1) acquisition through a managed forest project making use of co-
managed forest regions under the auspices of Agusan del Norte and Butuan City, (2) collection of waste wood
from processors working in the agriculture and forestry industries, and (3) purchase from operators of
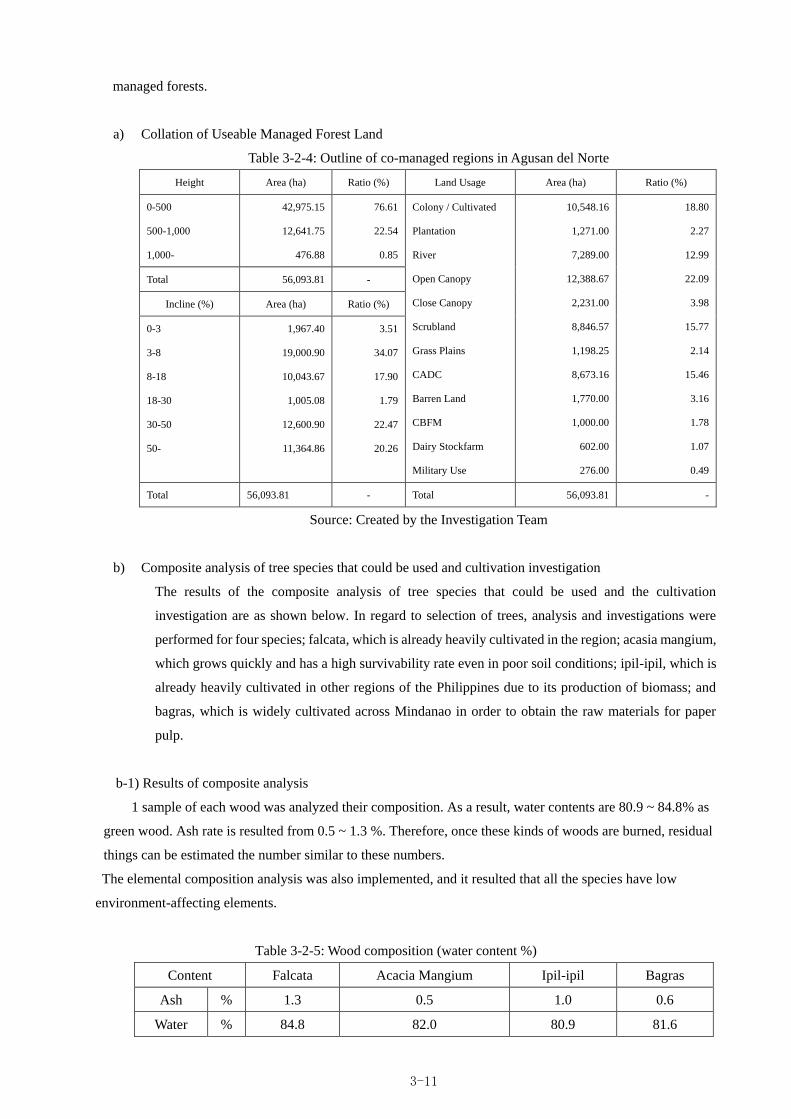
3-11
managed forests.
a) Collation of Useable Managed Forest Land
Table 3-2-4: Outline of co-managed regions in Agusan del Norte
Height Area (ha) Ratio (%) Land Usage Area (ha) Ratio (%)
0-500
500-1,000
1,000-
42,975.15
12,641.75
476.88
76.61
22.54
0.85
Colony / Cultivated
Plantation
River
Open Canopy
Close Canopy
Scrubland
Grass Plains
CADC
Barren Land
CBFM
Dairy Stockfarm
Military Use
10,548.16
1,271.00
7,289.00
12,388.67
2,231.00
8,846.57
1,198.25
8,673.16
1,770.00
1,000.00
602.00
276.00
18.80
2.27
12.99
22.09
3.98
15.77
2.14
15.46
3.16
1.78
1.07
0.49
Total 56,093.81 -
Incline (%) Area (ha) Ratio (%)
0-3
3-8
8-18
18-30
30-50
50-
1,967.40
19,000.90
10,043.67
1,005.08
12,600.90
11,364.86
3.51
34.07
17.90
1.79
22.47
20.26
Total 56,093.81 - Total 56,093.81 -
Source: Created by the Investigation Team
b) Composite analysis of tree species that could be used and cultivation investigation
The results of the composite analysis of tree species that could be used and the cultivation
investigation are as shown below. In regard to selection of trees, analysis and investigations were
performed for four species; falcata, which is already heavily cultivated in the region; acasia mangium,
which grows quickly and has a high survivability rate even in poor soil conditions; ipil-ipil, which is
already heavily cultivated in other regions of the Philippines due to its production of biomass; and
bagras, which is widely cultivated across Mindanao in order to obtain the raw materials for paper
pulp.
b-1) Results of composite analysis
1 sample of each wood was analyzed their composition. As a result, water contents are 80.9 ~ 84.8% as
green wood. Ash rate is resulted from 0.5 ~ 1.3 %. Therefore, once these kinds of woods are burned, residual
things can be estimated the number similar to these numbers.
The elemental composition analysis was also implemented, and it resulted that all the species have low
environment-affecting elements.
Table 3-2-5: Wood composition (water content %)
Content Falcata Acacia Mangium Ipil-ipil Bagras
Ash % 1.3 0.5 1.0 0.6
Water % 84.8 82.0 80.9 81.6
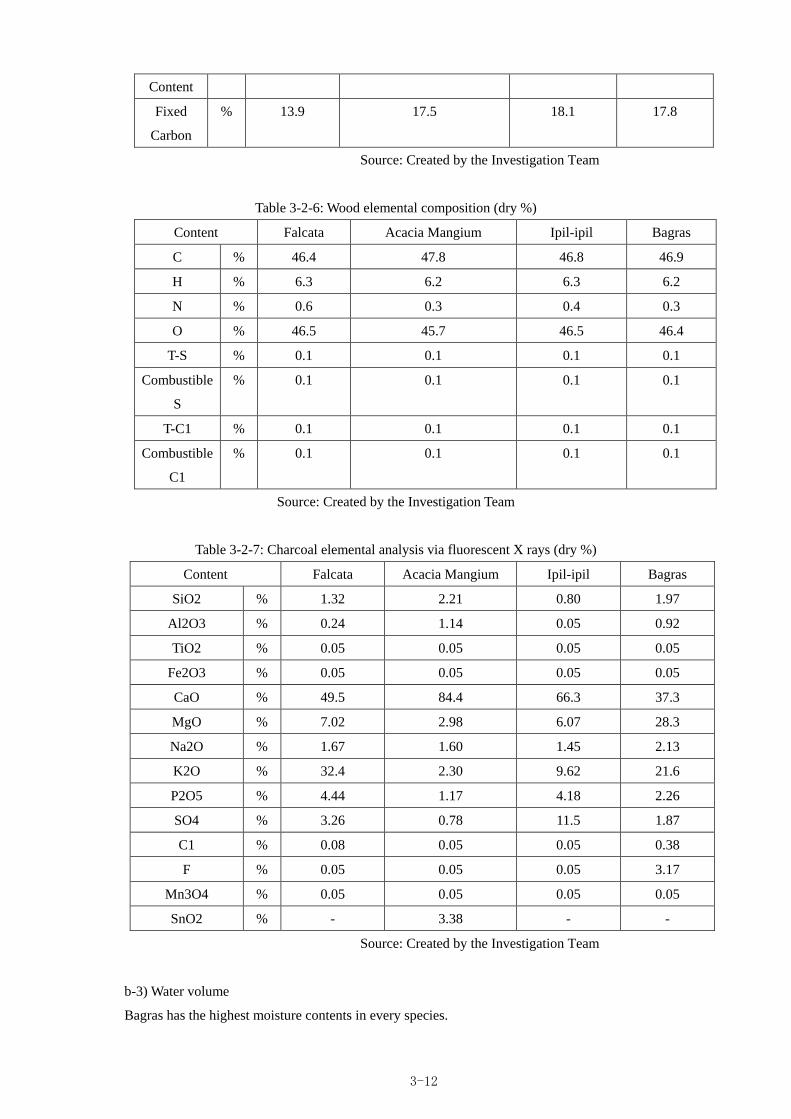
3-12
Content
Fixed
Carbon
% 13.9 17.5 18.1 17.8
Source: Created by the Investigation Team
Table 3-2-6: Wood elemental composition (dry %)
Content Falcata Acacia Mangium Ipil-ipil Bagras
C % 46.4 47.8 46.8 46.9
H % 6.3 6.2 6.3 6.2
N % 0.6 0.3 0.4 0.3
O % 46.5 45.7 46.5 46.4
T-S % 0.1 0.1 0.1 0.1
Combustible
S
% 0.1 0.1 0.1 0.1
T-C1 % 0.1 0.1 0.1 0.1
Combustible
C1
% 0.1 0.1 0.1 0.1
Source: Created by the Investigation Team
Table 3-2-7: Charcoal elemental analysis via fluorescent X rays (dry %)
Content Falcata Acacia Mangium Ipil-ipil Bagras
SiO2 % 1.32 2.21 0.80 1.97
Al2O3 % 0.24 1.14 0.05 0.92
TiO2 % 0.05 0.05 0.05 0.05
Fe2O3 % 0.05 0.05 0.05 0.05
CaO % 49.5 84.4 66.3 37.3
MgO % 7.02 2.98 6.07 28.3
Na2O % 1.67 1.60 1.45 2.13
K2O % 32.4 2.30 9.62 21.6
P2O5 % 4.44 1.17 4.18 2.26
SO4 % 3.26 0.78 11.5 1.87
C1 % 0.08 0.05 0.05 0.38
F % 0.05 0.05 0.05 3.17
Mn3O4 % 0.05 0.05 0.05 0.05
SnO2 % - 3.38 - -
Source: Created by the Investigation Team
b-3) Water volume
Bagras has the highest moisture contents in every species.
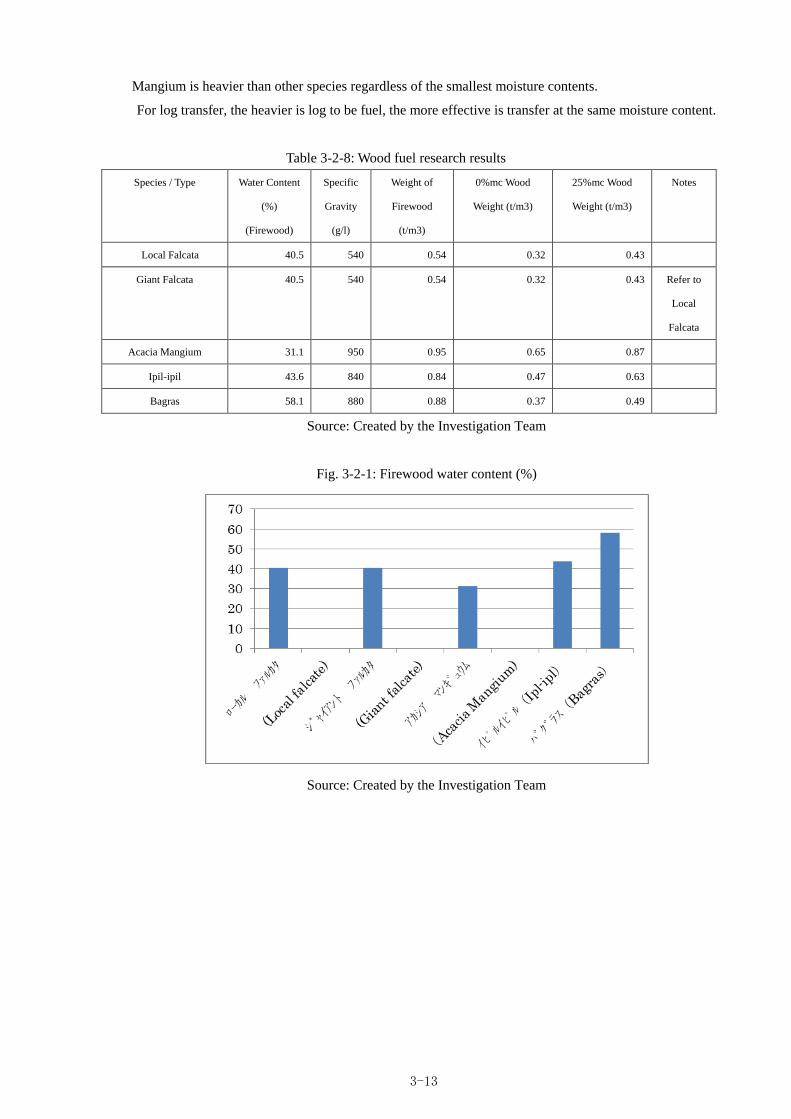
3-13
Mangium is heavier than other species regardless of the smallest moisture contents.
For log transfer, the heavier is log to be fuel, the more effective is transfer at the same moisture content.
Table 3-2-8: Wood fuel research results
Species / Type Water Content
(%)
(Firewood)
Specific
Gravity
(g/l)
Weight of
Firewood
(t/m3)
0%mc Wood
Weight (t/m3)
25%mc Wood
Weight (t/m3)
Notes
Local Falcata 40.5 540 0.54 0.32 0.43
Giant Falcata 40.5 540 0.54 0.32 0.43 Refer to
Local
Falcata
Acacia Mangium 31.1 950 0.95 0.65 0.87
Ipil-ipil 43.6 840 0.84 0.47 0.63
Bagras 58.1 880 0.88 0.37 0.49
Source: Created by the Investigation Team
Fig. 3-2-1: Firewood water content (%)
Source: Created by the Investigation Team
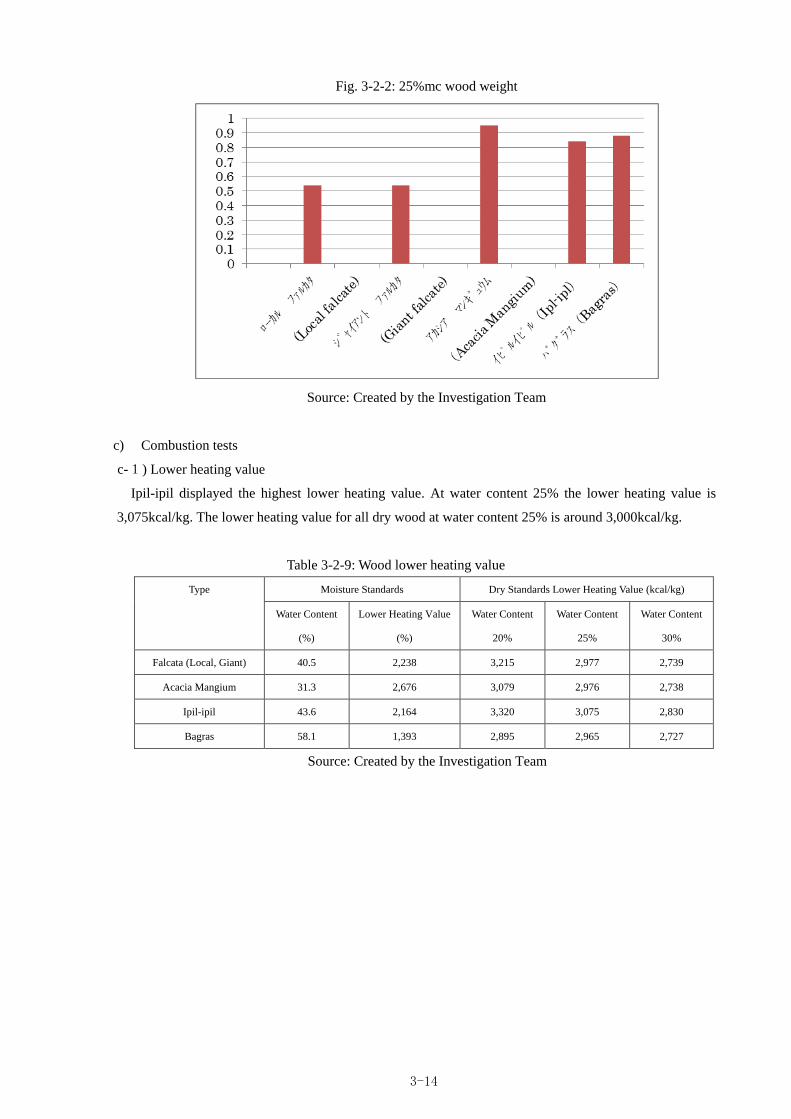
3-14
Fig. 3-2-2: 25%mc wood weight
Source: Created by the Investigation Team
c) Combustion tests
c-1) Lower heating value
Ipil-ipil displayed the highest lower heating value. At water content 25% the lower heating value is
3,075kcal/kg. The lower heating value for all dry wood at water content 25% is around 3,000kcal/kg.
Table 3-2-9: Wood lower heating value
Type Moisture Standards Dry Standards Lower Heating Value (kcal/kg)
Water Content
(%)
Lower Heating Value
(%)
Water Content
20%
Water Content
25%
Water Content
30%
Falcata (Local, Giant) 40.5 2,238 3,215 2,977 2,739
Acacia Mangium 31.3 2,676 3,079 2,976 2,738
Ipil-ipil 43.6 2,164 3,320 3,075 2,830
Bagras 58.1 1,393 2,895 2,965 2,727
Source: Created by the Investigation Team
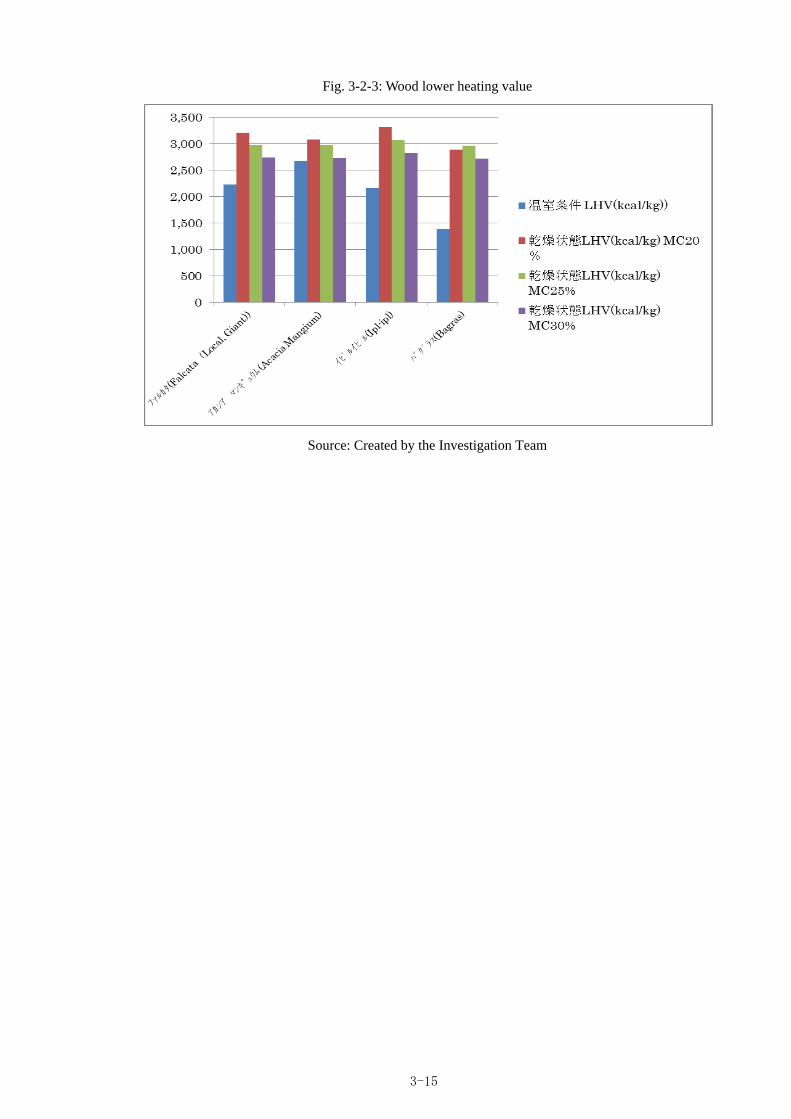
3-15
Fig. 3-2-3: Wood lower heating value
Source: Created by the Investigation Team
3-16
d) Forest Management Plan
d-1) Required volume of wood
If the volume of fuel required to generate 5MW is converted into volume of heat, it equals 525,000,000
kcal per day.
・“525,000,000 (kcal/day) / 24 (hours/day) x 0.2 (power efficiency) / 0.86 (kcal/time) ≒ 5,000kW”
The lower heating value of the wood (at water content 25%) is approximately 3,000 kcal/kg, and in
this case the required wood per day is 175 tons.
・“525,000,000 (kcal/day) / 3,000 (kcal/kg) = 175,000 (kg/day)”
Table 3-2-10: Required volume of wood
Volume of Power Generated 5MW
Required Heat 525,000,000 kcal/day
Heat Generated by Wood (Water Content
25%)
3,000 kcal/kg
Maximum Volume of Required Wood
(Water Content 25%)
175,000 kg/day
Source: Created by the Investigation Team
The requirement for sustained power generation of 5MW is therefore 175 tons of wood per day.
d-2) Forest management plan
Table 3-2-11: Targets for wood production via forest management
Species Volume of Chips
Required Every Day
(Water Content 25%)
(t/d)
Relative
Weight
(Water
Content 25%)
(t/m3)
Volume of
Chips Required
Every Day
(Firewood)
(m3/d)
Volume of
Wood
Consumed
Every Day
(tree/d)
Area
Harvested
Every Day
(ha)
Annual
Harvested
Area
(ha)
Required
Forest Area
(ha)
Acacia
Mangum 175 0.87 200.5 1,489 1.34 419.2 2,515
Harvesting is performed after a five-year growth period, followed by a one-year cultivation period.
One cycle is therefore six years.
Harvesting would be scheduled to start from the sixth year, and the forest management cycle would be
a repetition of planting, growth, and harvesting. The process is as shown below, (Fig. 3-2-5).
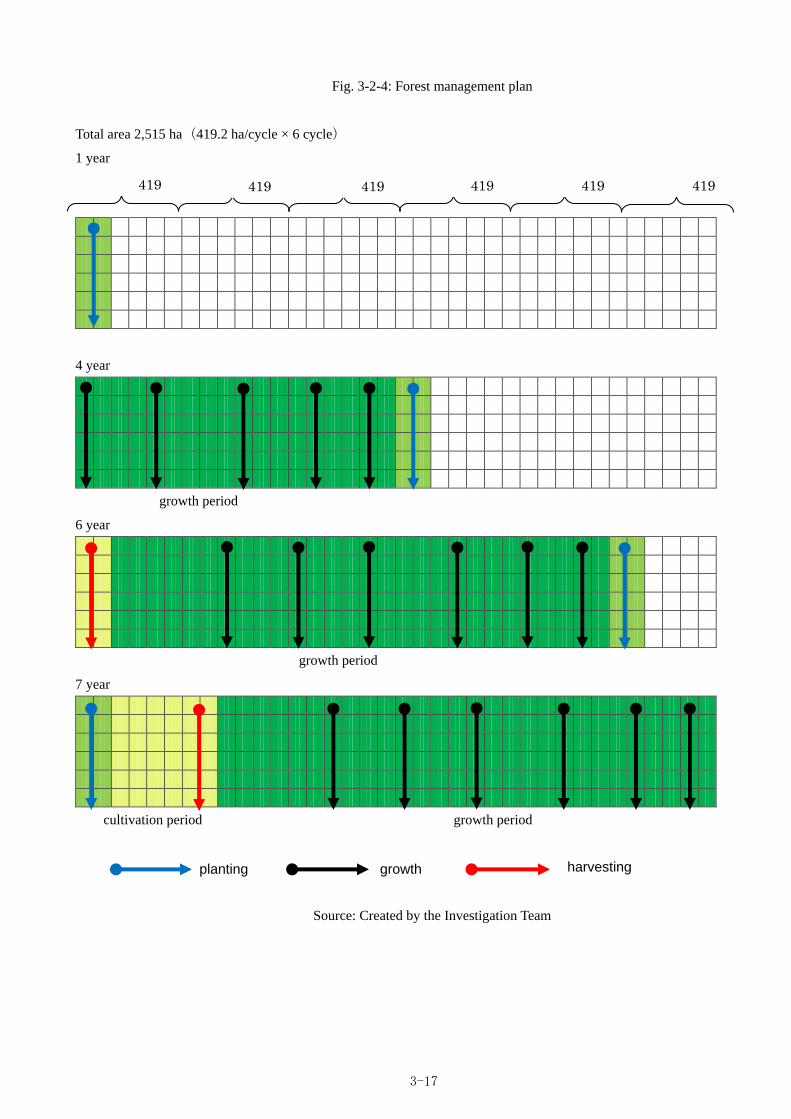
3-17
Fig. 3-2-4: Forest management plan
Total area 2,515 ha(419.2 ha/cycle × 6 cycle)
1 year
4 year
growth period
6 year
growth period
7 year
cultivation period growth period
Source: Created by the Investigation Team
419
.2ha
419
.2ha
419
.2ha
419
.2ha
419
.2ha
419
.2ha
planting growth harvesting
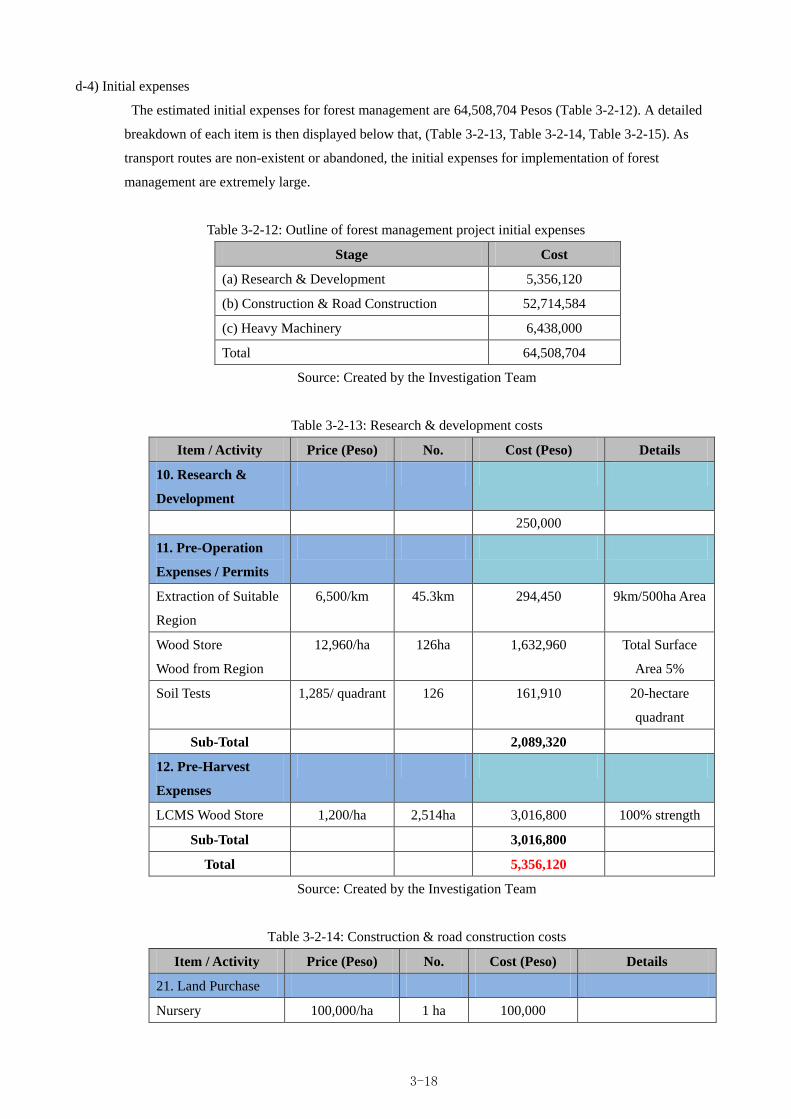
3-18
d-4) Initial expenses
The estimated initial expenses for forest management are 64,508,704 Pesos (Table 3-2-12). A detailed
breakdown of each item is then displayed below that, (Table 3-2-13, Table 3-2-14, Table 3-2-15). As
transport routes are non-existent or abandoned, the initial expenses for implementation of forest
management are extremely large.
Table 3-2-12: Outline of forest management project initial expenses
Stage Cost
(a) Research & Development 5,356,120
(b) Construction & Road Construction 52,714,584
(c) Heavy Machinery 6,438,000
Total 64,508,704
Source: Created by the Investigation Team
Table 3-2-13: Research & development costs
Item / Activity Price (Peso) No. Cost (Peso) Details
10. Research &
Development
250,000
11. Pre-Operation
Expenses / Permits
Extraction of Suitable
Region
6,500/km 45.3km 294,450 9km/500ha Area
Wood Store
Wood from Region
12,960/ha 126ha 1,632,960 Total Surface
Area 5%
Soil Tests 1,285/ quadrant 126 161,910 20-hectare
quadrant
Sub-Total 2,089,320
12. Pre-Harvest
Expenses
LCMS Wood Store 1,200/ha 2,514ha 3,016,800 100% strength
Sub-Total 3,016,800
Total 5,356,120
Source: Created by the Investigation Team
Table 3-2-14: Construction & road construction costs
Item / Activity Price (Peso) No. Cost (Peso) Details
21. Land Purchase
Nursery 100,000/ha 1 ha 100,000
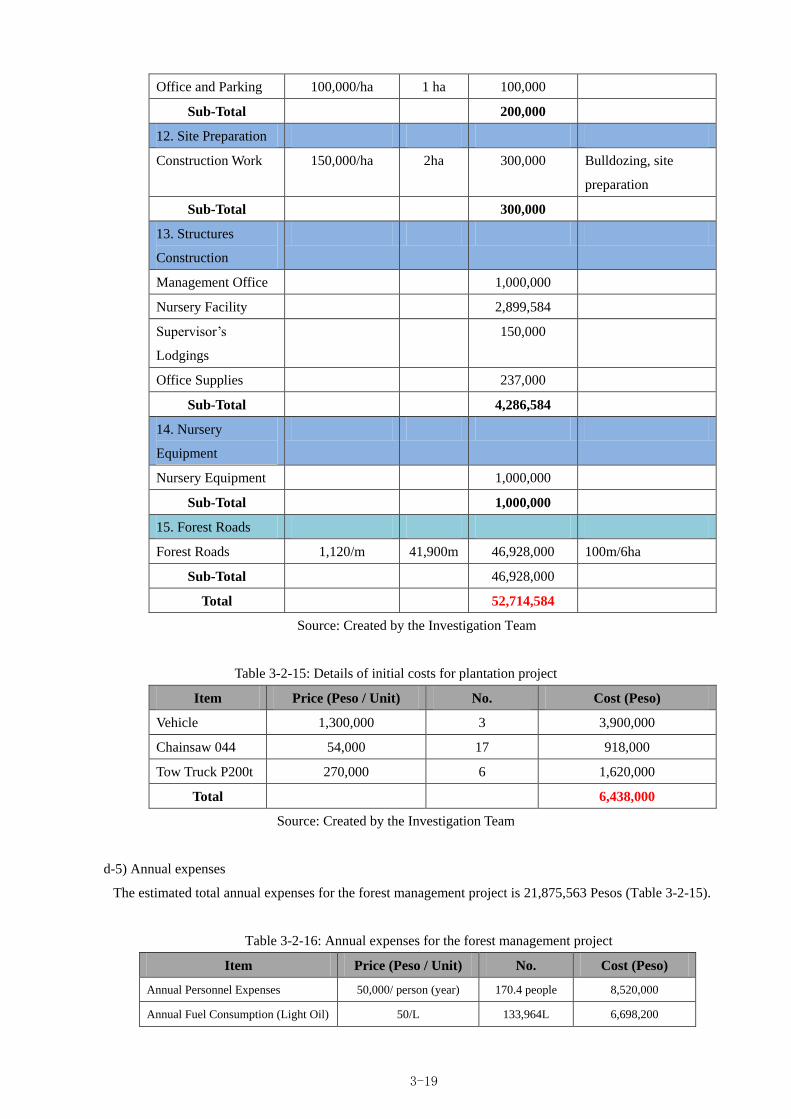
3-19
Office and Parking 100,000/ha 1 ha 100,000
Sub-Total 200,000
12. Site Preparation
Construction Work 150,000/ha 2ha 300,000 Bulldozing, site
preparation
Sub-Total 300,000
13. Structures
Construction
Management Office 1,000,000
Nursery Facility 2,899,584
Supervisor’s
Lodgings
150,000
Office Supplies 237,000
Sub-Total 4,286,584
14. Nursery
Equipment
Nursery Equipment 1,000,000
Sub-Total 1,000,000
15. Forest Roads
Forest Roads 1,120/m 41,900m 46,928,000 100m/6ha
Sub-Total 46,928,000
Total 52,714,584
Source: Created by the Investigation Team
Table 3-2-15: Details of initial costs for plantation project
Item Price (Peso / Unit) No. Cost (Peso)
Vehicle 1,300,000 3 3,900,000
Chainsaw 044 54,000 17 918,000
Tow Truck P200t 270,000 6 1,620,000
Total 6,438,000
Source: Created by the Investigation Team
d-5) Annual expenses
The estimated total annual expenses for the forest management project is 21,875,563 Pesos (Table 3-2-15).
Table 3-2-16: Annual expenses for the forest management project
Item Price (Peso / Unit) No. Cost (Peso)
Annual Personnel Expenses 50,000/ person (year) 170.4 people 8,520,000
Annual Fuel Consumption (Light Oil) 50/L 133,964L 6,698,200
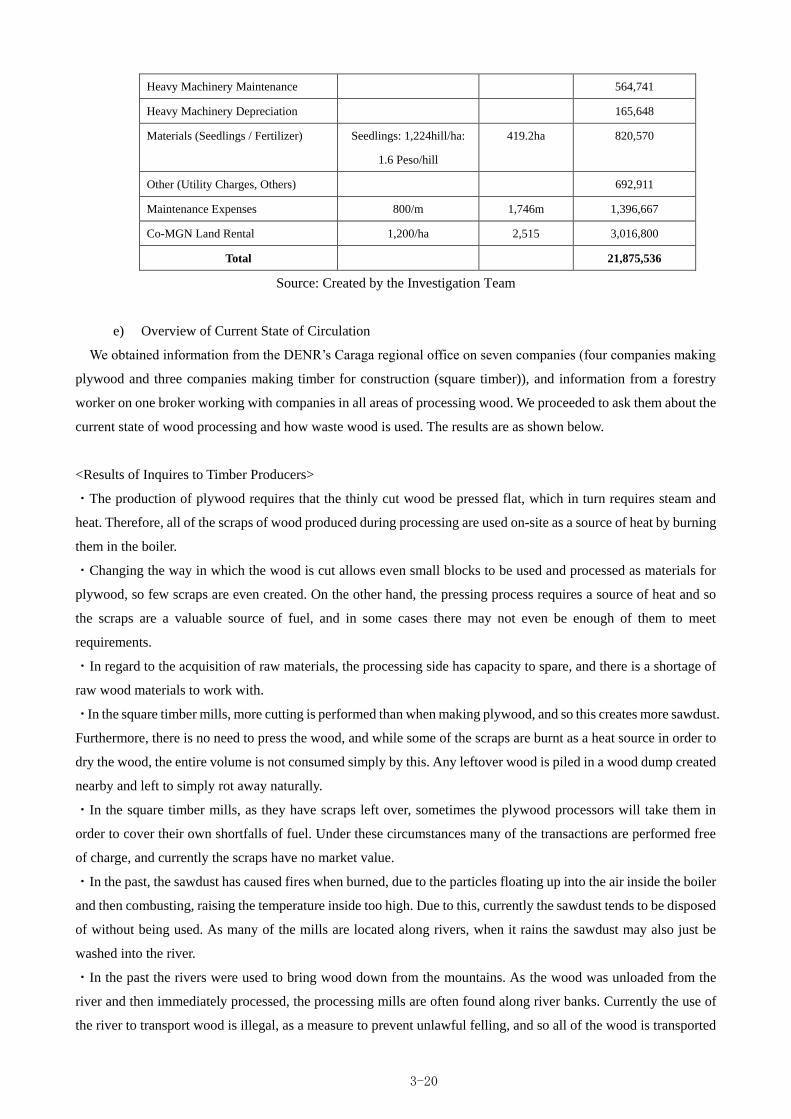
3-20
Heavy Machinery Maintenance 564,741
Heavy Machinery Depreciation 165,648
Materials (Seedlings / Fertilizer) Seedlings: 1,224hill/ha:
1.6 Peso/hill
419.2ha 820,570
Other (Utility Charges, Others) 692,911
Maintenance Expenses 800/m 1,746m 1,396,667
Co-MGN Land Rental 1,200/ha 2,515 3,016,800
Total 21,875,536
Source: Created by the Investigation Team
e) Overview of Current State of Circulation
We obtained information from the DENR’s Caraga regional office on seven companies (four companies making
plywood and three companies making timber for construction (square timber)), and information from a forestry
worker on one broker working with companies in all areas of processing wood. We proceeded to ask them about the
current state of wood processing and how waste wood is used. The results are as shown below.
<Results of Inquires to Timber Producers>
・The production of plywood requires that the thinly cut wood be pressed flat, which in turn requires steam and
heat. Therefore, all of the scraps of wood produced during processing are used on-site as a source of heat by burning
them in the boiler.
・Changing the way in which the wood is cut allows even small blocks to be used and processed as materials for
plywood, so few scraps are even created. On the other hand, the pressing process requires a source of heat and so
the scraps are a valuable source of fuel, and in some cases there may not even be enough of them to meet
requirements.
・In regard to the acquisition of raw materials, the processing side has capacity to spare, and there is a shortage of
raw wood materials to work with.
・In the square timber mills, more cutting is performed than when making plywood, and so this creates more sawdust.
Furthermore, there is no need to press the wood, and while some of the scraps are burnt as a heat source in order to
dry the wood, the entire volume is not consumed simply by this. Any leftover wood is piled in a wood dump created
nearby and left to simply rot away naturally.
・In the square timber mills, as they have scraps left over, sometimes the plywood processors will take them in
order to cover their own shortfalls of fuel. Under these circumstances many of the transactions are performed free
of charge, and currently the scraps have no market value.
・In the past, the sawdust has caused fires when burned, due to the particles floating up into the air inside the boiler
and then combusting, raising the temperature inside too high. Due to this, currently the sawdust tends to be disposed
of without being used. As many of the mills are located along rivers, when it rains the sawdust may also just be
washed into the river.
・In the past the rivers were used to bring wood down from the mountains. As the wood was unloaded from the
river and then immediately processed, the processing mills are often found along river banks. Currently the use of
the river to transport wood is illegal, as a measure to prevent unlawful felling, and so all of the wood is transported
3-21
overland.
・Many of the purchasers for both the plywood and the square timber are located in the Cagayan de Oro area.
<Results of Inquiries to Timber Broker>
・The reason for lack of supply of the raw material, wood, required by these local processors is because a large
volume of unprocessed wood is to the Cagayan de Oro region. Furthermore, while there are rich woodland resources
and land to use, there are too few people managing the forest, creating an insufficiency in supply.
・Transport of wood via the Agusan River is prohibited. While this is currently in place as a temporary measure, it
is unlikely to be lifted any point in the foreseeable future.
・When taking on the transport of wood overland to Cagayan de Oro, the fee for transport by truck is 30,000 Peso
/ truck / time. The payment for purchasing wood the equivalent of 20 feet from a famer is around 120,000 Peso /
truck, and so processors in Cagayan de Oro can obtain wood for approximately 150,000 Peso / truck. This means
that 25% of the cost is comprised of transportation fees.
・Many of the deliveries in Cagayan de Oro are to plywood producers, and after processing the wood into plywood
they generally export it overseas. It is likely that they have PEZA authorization. The port in Cagayan de Oro is of a
much larger scale than the Port of Nasipit in the suburbs of Butuan, making it extremely easy to perform exports or
transport products domestically from there.
f) Overview
f-1) The market value of wood
As the market value of wood is 120,000 Peso / truck load, chipping it and burning it to produce electricity would
be extremely expensive, and this makes the acquisition of wood from managed forest or purchase from the general
market an impossibility. Managed forest is not an option because if that is how the wood is obtained, the best way
to maximize its value is to sell it as wood, rather than burning it to generate power. Simply buying the wood is also
not an option because the costs of acquiring fuel would exceed the retail costs of the power generated, rendering the
project a failure as a business.
Therefore, the only wooden resource that can be used is waste wood. There are two types; (1) the wood that is
discarded after felling; (2) the scraps, sawdust and other waste wood that are created during the processing of wood.
However, as stated above, some processors burn these scraps as a source of heat, and so they currently cannot be
used.
f-2) Potential to make use of sawdust
Sawdust is currently not used for anything, and so could be used. It is currently simply piled up, regardless of
laws, and left to rot naturally. This means that a reduction in the methane gas produced by the rotting process could
contribute to a reduction in GHG if sawdust is used.
From the inquires made above, and further inquires to the DENR’s Caraga regional office and inquiries to
CENRO, including the names of manufacturers not included in the original list and then making some estimated
calculations suggest that approximately 7,000 tons of sawdust are being left unused every year.
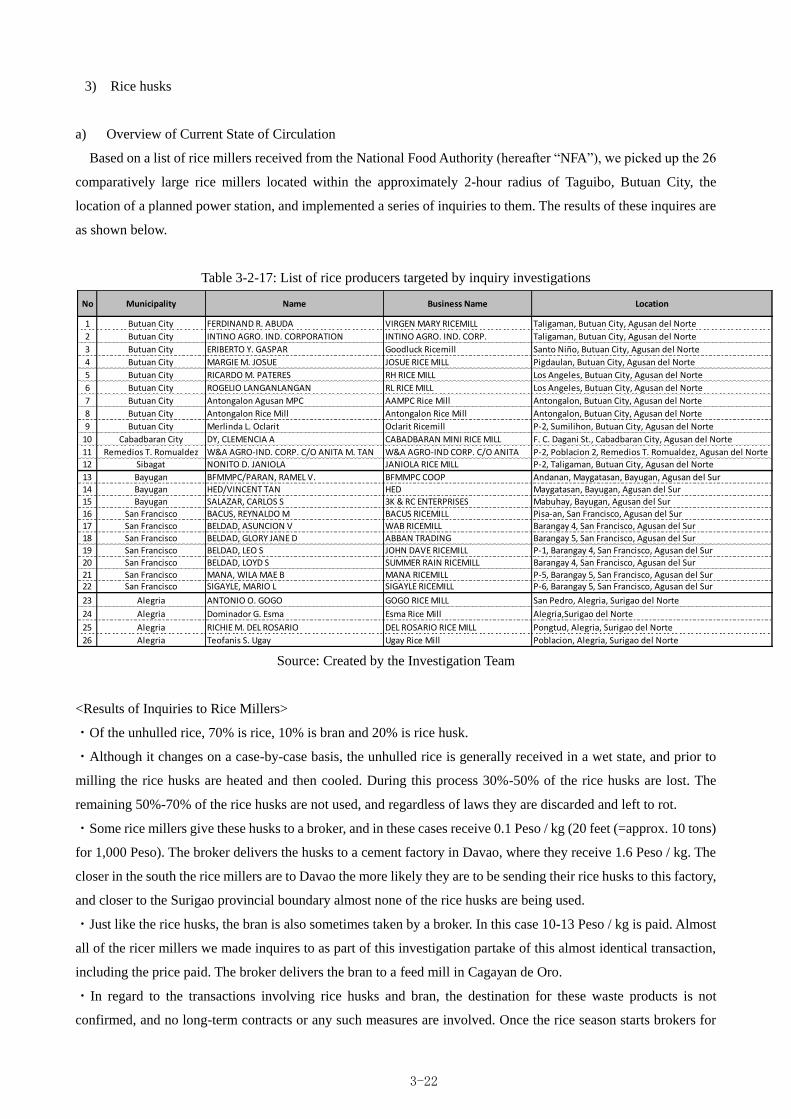
3-22
3) Rice husks
a) Overview of Current State of Circulation
Based on a list of rice millers received from the National Food Authority (hereafter “NFA”), we picked up the 26
comparatively large rice millers located within the approximately 2-hour radius of Taguibo, Butuan City, the
location of a planned power station, and implemented a series of inquiries to them. The results of these inquires are
as shown below.
Table 3-2-17: List of rice producers targeted by inquiry investigations
Source: Created by the Investigation Team
<Results of Inquiries to Rice Millers>
・Of the unhulled rice, 70% is rice, 10% is bran and 20% is rice husk.
・Although it changes on a case-by-case basis, the unhulled rice is generally received in a wet state, and prior to
milling the rice husks are heated and then cooled. During this process 30%-50% of the rice husks are lost. The
remaining 50%-70% of the rice husks are not used, and regardless of laws they are discarded and left to rot.
・Some rice millers give these husks to a broker, and in these cases receive 0.1 Peso / kg (20 feet (=approx. 10 tons)
for 1,000 Peso). The broker delivers the husks to a cement factory in Davao, where they receive 1.6 Peso / kg. The
closer in the south the rice millers are to Davao the more likely they are to be sending their rice husks to this factory,
and closer to the Surigao provincial boundary almost none of the rice husks are being used.
・Just like the rice husks, the bran is also sometimes taken by a broker. In this case 10-13 Peso / kg is paid. Almost
all of the ricer millers we made inquires to as part of this investigation partake of this almost identical transaction,
including the price paid. The broker delivers the bran to a feed mill in Cagayan de Oro.
・In regard to the transactions involving rice husks and bran, the destination for these waste products is not
confirmed, and no long-term contracts or any such measures are involved. Once the rice season starts brokers for
No Municipality Name Business Name Location
1 Butuan City FERDINAND R. ABUDA VIRGEN MARY RICEMILL Taligaman, Butuan City, Agusan del Norte
2 Butuan City INTINO AGRO. IND. CORPORATION INTINO AGRO. IND. CORP. Taligaman, Butuan City, Agusan del Norte
3 Butuan City ERIBERTO Y. GASPAR Goodluck Ricemill Santo Niño, Butuan City, Agusan del Norte
4 Butuan City MARGIE M. JOSUE JOSUE RICE MILL Pigdaulan, Butuan City, Agusan del Norte
5 Butuan City RICARDO M. PATERES RH RICE MILL Los Angeles, Butuan City, Agusan del Norte
6 Butuan City ROGELIO LANGANLANGAN RL RICE MILL Los Angeles, Butuan City, Agusan del Norte
7 Butuan City Antongalon Agusan MPC AAMPC Rice Mill Antongalon, Butuan City, Agusan del Norte
8 Butuan City Antongalon Rice Mill Antongalon Rice Mill Antongalon, Butuan City, Agusan del Norte
9 Butuan City Merlinda L. Oclarit Oclarit Ricemill P-2, Sumilihon, Butuan City, Agusan del Norte
10 Cabadbaran City DY, CLEMENCIA A CABADBARAN MINI RICE MILL F. C. Dagani St., Cabadbaran City, Agusan del Norte
11 Remedios T. Romualdez W&A AGRO-IND. CORP. C/O ANITA M. TAN W&A AGRO-IND CORP. C/O ANITA P-2, Poblacion 2, Remedios T. Romualdez, Agusan del Norte
12 Sibagat NONITO D. JANIOLA JANIOLA RICE MILL P-2, Taligaman, Butuan City, Agusan del Norte
13 Bayugan BFMMPC/PARAN, RAMEL V. BFMMPC COOP Andanan, Maygatasan, Bayugan, Agusan del Sur
14 Bayugan HED/VINCENT TAN HED Maygatasan, Bayugan, Agusan del Sur
15 Bayugan SALAZAR, CARLOS S 3K & RC ENTERPRISES Mabuhay, Bayugan, Agusan del Sur
16 San Francisco BACUS, REYNALDO M BACUS RICEMILL Pisa-an, San Francisco, Agusan del Sur
17 San Francisco BELDAD, ASUNCION V WAB RICEMILL Barangay 4, San Francisco, Agusan del Sur
18 San Francisco BELDAD, GLORY JANE D ABBAN TRADING Barangay 5, San Francisco, Agusan del Sur
19 San Francisco BELDAD, LEO S JOHN DAVE RICEMILL P-1, Barangay 4, San Francisco, Agusan del Sur
20 San Francisco BELDAD, LOYD S SUMMER RAIN RICEMILL Barangay 4, San Francisco, Agusan del Sur
21 San Francisco MANA, WILA MAE B MANA RICEMILL P-5, Barangay 5, San Francisco, Agusan del Sur22 San Francisco SIGAYLE, MARIO L SIGAYLE RICEMILL P-6, Barangay 5, San Francisco, Agusan del Sur
23 Alegria ANTONIO O. GOGO GOGO RICE MILL San Pedro, Alegria, Surigao del Norte
24 Alegria Dominador G. Esma Esma Rice Mill Alegria,Surigao del Norte
25 Alegria RICHIE M. DEL ROSARIO DEL ROSARIO RICE MILL Pongtud, Alegria, Surigao del Norte
26 Alegria Teofanis S. Ugay Ugay Rice Mill Poblacion, Alegria, Surigao del Norte
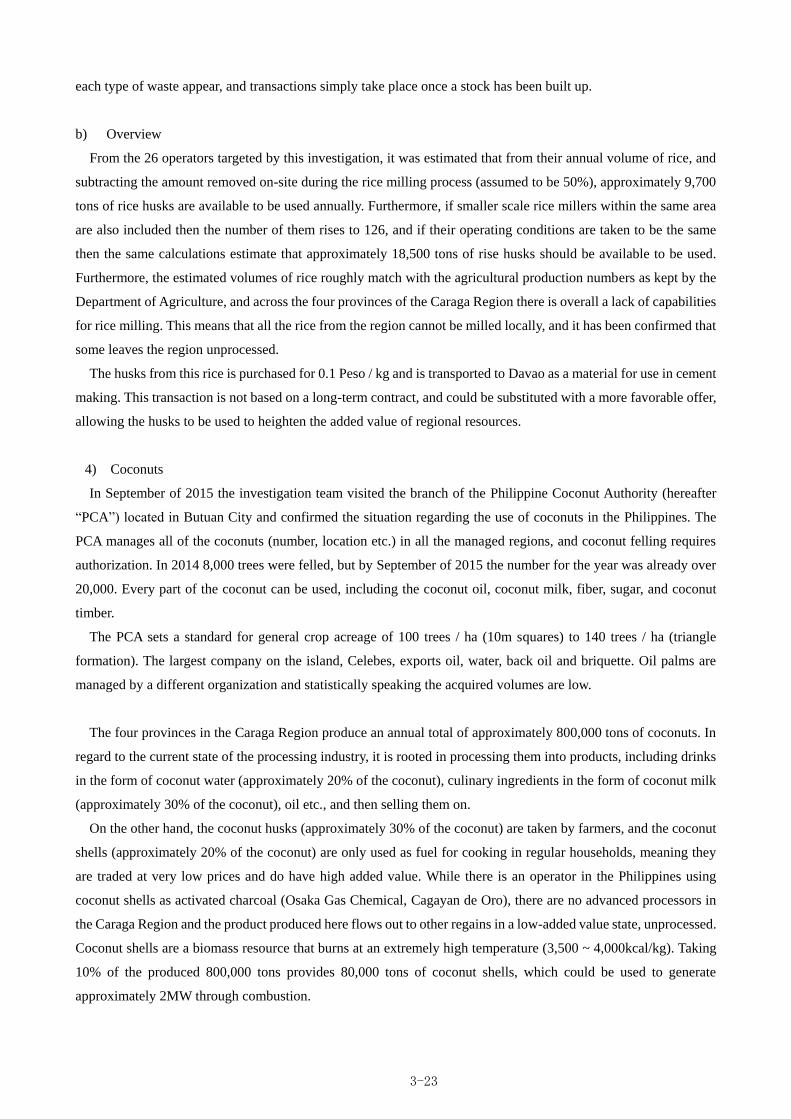
3-23
each type of waste appear, and transactions simply take place once a stock has been built up.
b) Overview
From the 26 operators targeted by this investigation, it was estimated that from their annual volume of rice, and
subtracting the amount removed on-site during the rice milling process (assumed to be 50%), approximately 9,700
tons of rice husks are available to be used annually. Furthermore, if smaller scale rice millers within the same area
are also included then the number of them rises to 126, and if their operating conditions are taken to be the same
then the same calculations estimate that approximately 18,500 tons of rise husks should be available to be used.
Furthermore, the estimated volumes of rice roughly match with the agricultural production numbers as kept by the
Department of Agriculture, and across the four provinces of the Caraga Region there is overall a lack of capabilities
for rice milling. This means that all the rice from the region cannot be milled locally, and it has been confirmed that
some leaves the region unprocessed.
The husks from this rice is purchased for 0.1 Peso / kg and is transported to Davao as a material for use in cement
making. This transaction is not based on a long-term contract, and could be substituted with a more favorable offer,
allowing the husks to be used to heighten the added value of regional resources.
4) Coconuts
In September of 2015 the investigation team visited the branch of the Philippine Coconut Authority (hereafter
“PCA”) located in Butuan City and confirmed the situation regarding the use of coconuts in the Philippines. The
PCA manages all of the coconuts (number, location etc.) in all the managed regions, and coconut felling requires
authorization. In 2014 8,000 trees were felled, but by September of 2015 the number for the year was already over
20,000. Every part of the coconut can be used, including the coconut oil, coconut milk, fiber, sugar, and coconut
timber.
The PCA sets a standard for general crop acreage of 100 trees / ha (10m squares) to 140 trees / ha (triangle
formation). The largest company on the island, Celebes, exports oil, water, back oil and briquette. Oil palms are
managed by a different organization and statistically speaking the acquired volumes are low.
The four provinces in the Caraga Region produce an annual total of approximately 800,000 tons of coconuts. In
regard to the current state of the processing industry, it is rooted in processing them into products, including drinks
in the form of coconut water (approximately 20% of the coconut), culinary ingredients in the form of coconut milk
(approximately 30% of the coconut), oil etc., and then selling them on.
On the other hand, the coconut husks (approximately 30% of the coconut) are taken by farmers, and the coconut
shells (approximately 20% of the coconut) are only used as fuel for cooking in regular households, meaning they
are traded at very low prices and do have high added value. While there is an operator in the Philippines using
coconut shells as activated charcoal (Osaka Gas Chemical, Cagayan de Oro), there are no advanced processors in
the Caraga Region and the product produced here flows out to other regains in a low-added value state, unprocessed.
Coconut shells are a biomass resource that burns at an extremely high temperature (3,500 ~ 4,000kcal/kg). Taking
10% of the produced 800,000 tons provides 80,000 tons of coconut shells, which could be used to generate
approximately 2MW through combustion.
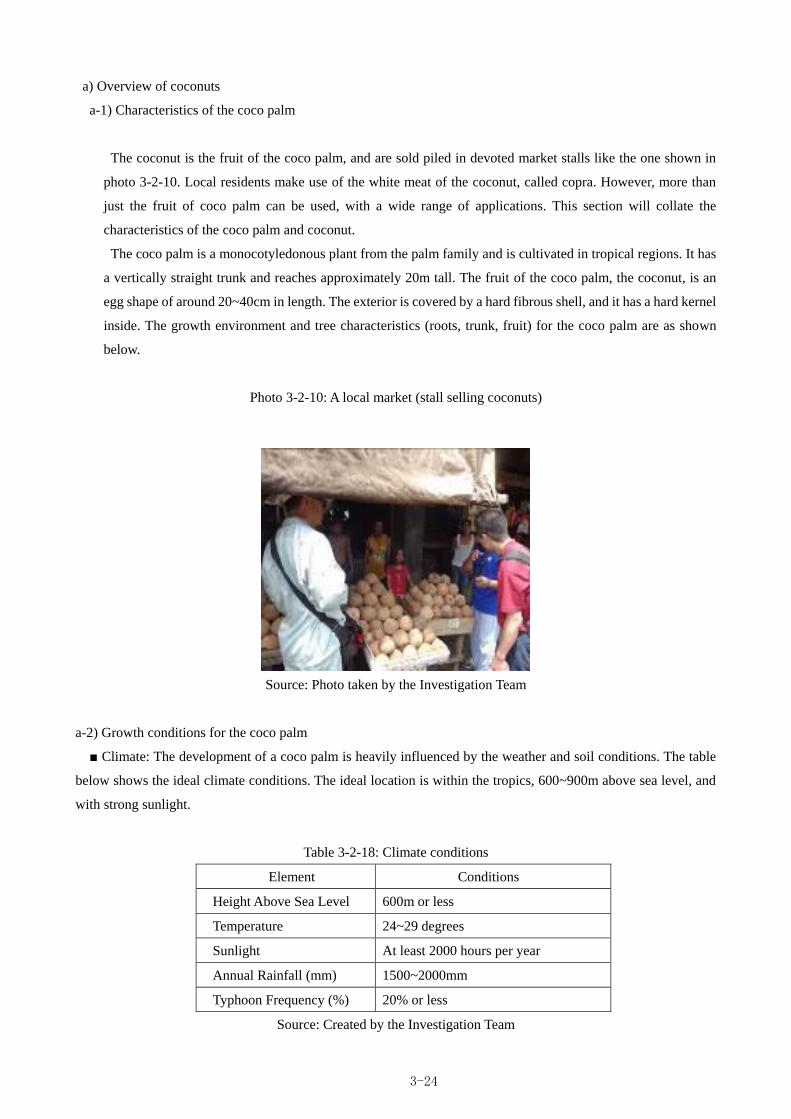
3-24
a) Overview of coconuts
a-1) Characteristics of the coco palm
The coconut is the fruit of the coco palm, and are sold piled in devoted market stalls like the one shown in
photo 3-2-10. Local residents make use of the white meat of the coconut, called copra. However, more than
just the fruit of coco palm can be used, with a wide range of applications. This section will collate the
characteristics of the coco palm and coconut.
The coco palm is a monocotyledonous plant from the palm family and is cultivated in tropical regions. It has
a vertically straight trunk and reaches approximately 20m tall. The fruit of the coco palm, the coconut, is an
egg shape of around 20~40cm in length. The exterior is covered by a hard fibrous shell, and it has a hard kernel
inside. The growth environment and tree characteristics (roots, trunk, fruit) for the coco palm are as shown
below.
Photo 3-2-10: A local market (stall selling coconuts)
Source: Photo taken by the Investigation Team
a-2) Growth conditions for the coco palm
■ Climate: The development of a coco palm is heavily influenced by the weather and soil conditions. The table
below shows the ideal climate conditions. The ideal location is within the tropics, 600~900m above sea level, and
with strong sunlight.
Table 3-2-18: Climate conditions
Element Conditions
Height Above Sea Level 600m or less
Temperature 24~29 degrees
Sunlight At least 2000 hours per year
Annual Rainfall (mm) 1500~2000mm
Typhoon Frequency (%) 20% or less
Source: Created by the Investigation Team
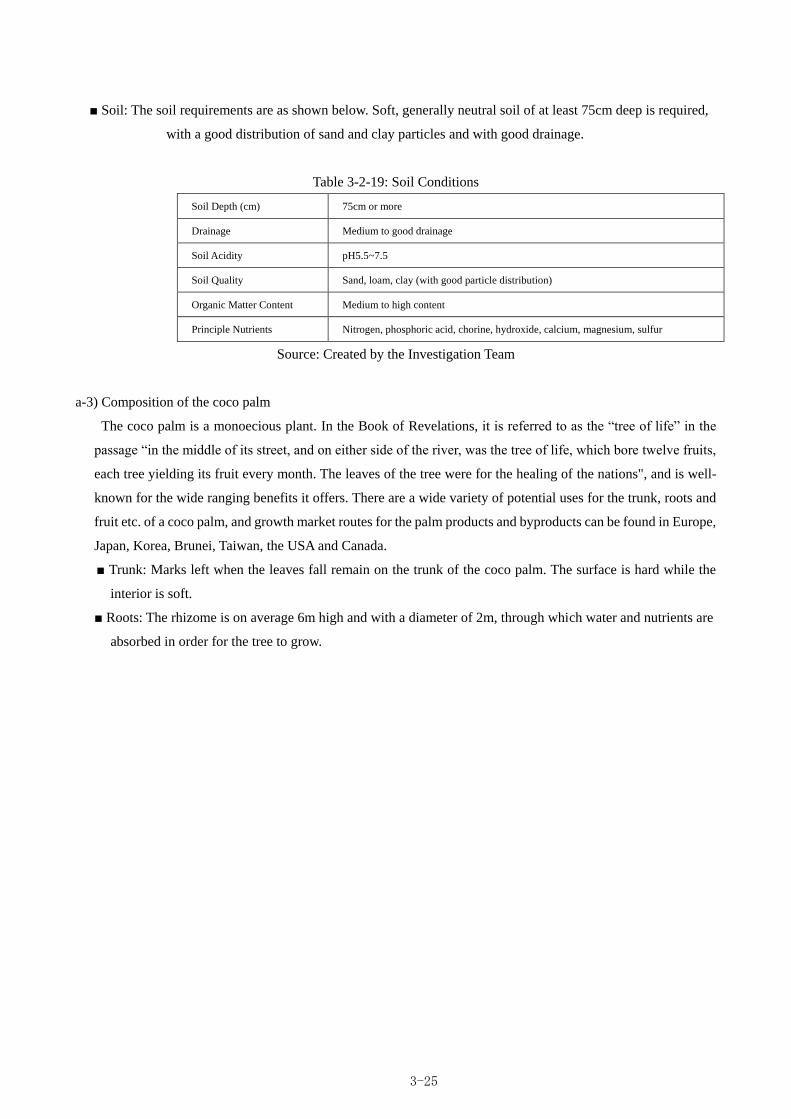
3-25
■ Soil: The soil requirements are as shown below. Soft, generally neutral soil of at least 75cm deep is required,
with a good distribution of sand and clay particles and with good drainage.
Table 3-2-19: Soil Conditions
Soil Depth (cm) 75cm or more
Drainage Medium to good drainage
Soil Acidity pH5.5~7.5
Soil Quality Sand, loam, clay (with good particle distribution)
Organic Matter Content Medium to high content
Principle Nutrients Nitrogen, phosphoric acid, chorine, hydroxide, calcium, magnesium, sulfur
Source: Created by the Investigation Team
a-3) Composition of the coco palm
The coco palm is a monoecious plant. In the Book of Revelations, it is referred to as the “tree of life” in the
passage “in the middle of its street, and on either side of the river, was the tree of life, which bore twelve fruits,
each tree yielding its fruit every month. The leaves of the tree were for the healing of the nations", and is well-
known for the wide ranging benefits it offers. There are a wide variety of potential uses for the trunk, roots and
fruit etc. of a coco palm, and growth market routes for the palm products and byproducts can be found in Europe,
Japan, Korea, Brunei, Taiwan, the USA and Canada.
■ Trunk: Marks left when the leaves fall remain on the trunk of the coco palm. The surface is hard while the
interior is soft.
■ Roots: The rhizome is on average 6m high and with a diameter of 2m, through which water and nutrients are
absorbed in order for the tree to grow.
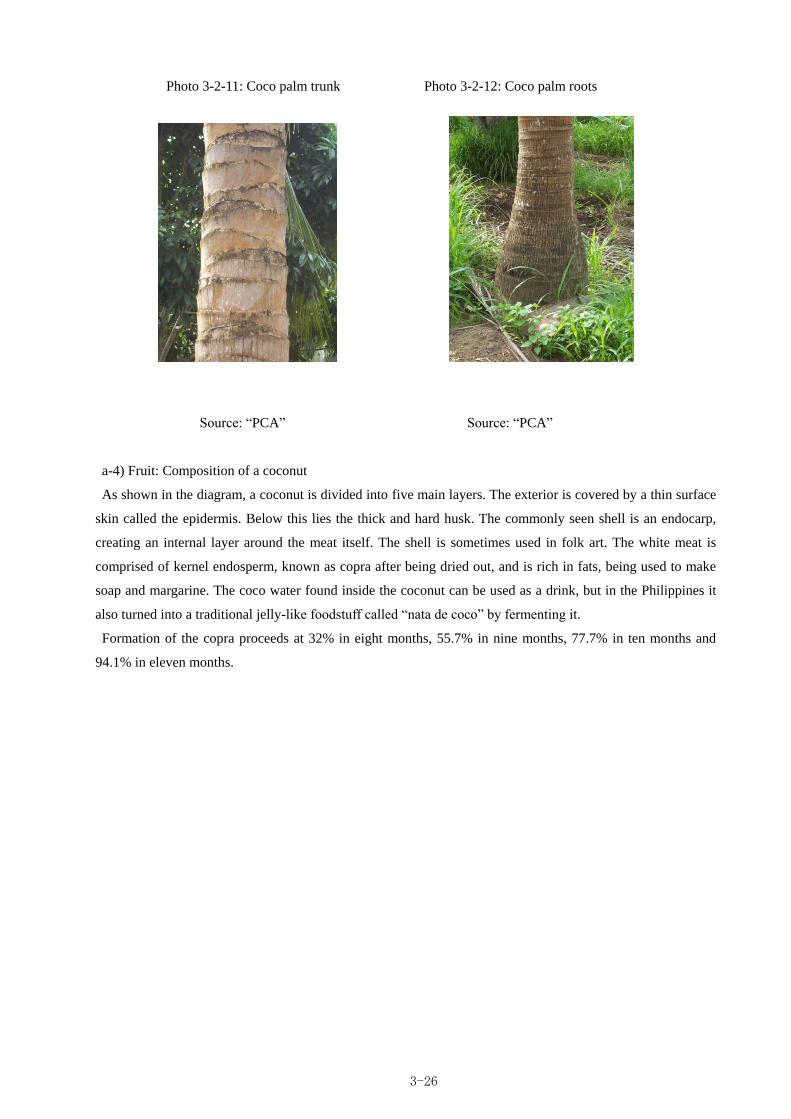
3-26
Photo 3-2-11: Coco palm trunk Photo 3-2-12: Coco palm roots
Source: “PCA” Source: “PCA”
a-4) Fruit: Composition of a coconut
As shown in the diagram, a coconut is divided into five main layers. The exterior is covered by a thin surface
skin called the epidermis. Below this lies the thick and hard husk. The commonly seen shell is an endocarp,
creating an internal layer around the meat itself. The shell is sometimes used in folk art. The white meat is
comprised of kernel endosperm, known as copra after being dried out, and is rich in fats, being used to make
soap and margarine. The coco water found inside the coconut can be used as a drink, but in the Philippines it
also turned into a traditional jelly-like foodstuff called “nata de coco” by fermenting it.
Formation of the copra proceeds at 32% in eight months, 55.7% in nine months, 77.7% in ten months and
94.1% in eleven months.
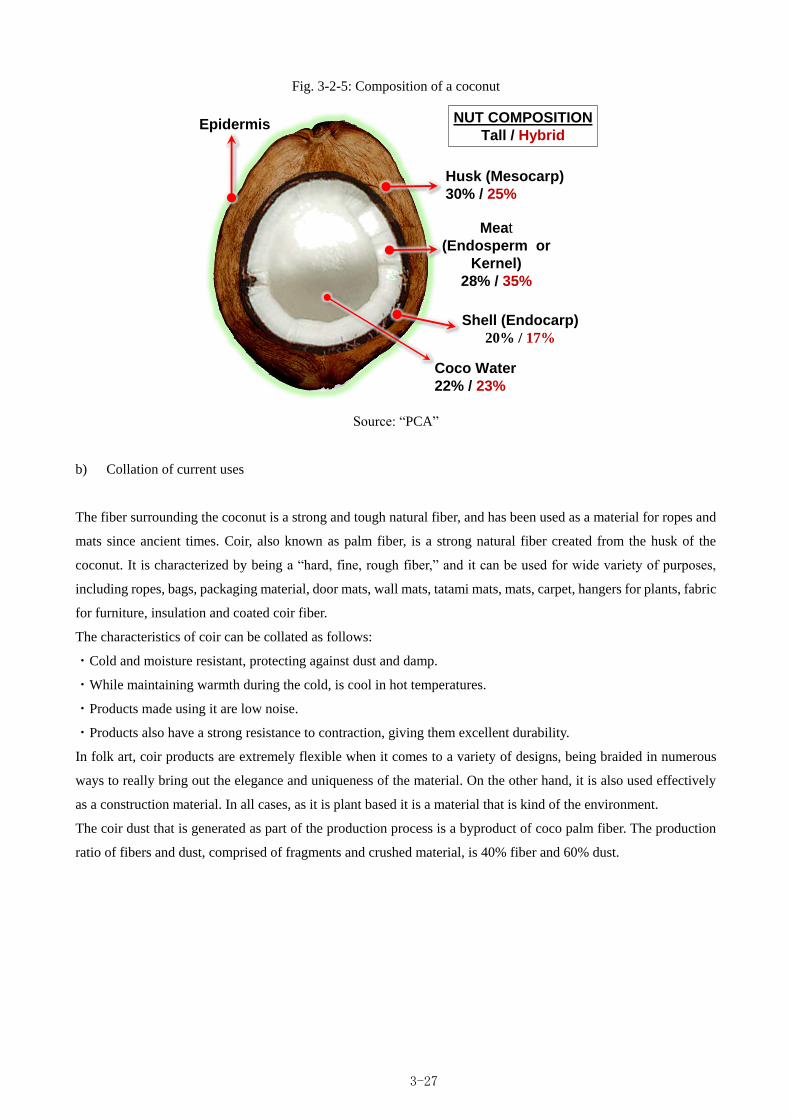
3-27
Fig. 3-2-5: Composition of a coconut
Source: “PCA”
b) Collation of current uses
The fiber surrounding the coconut is a strong and tough natural fiber, and has been used as a material for ropes and
mats since ancient times. Coir, also known as palm fiber, is a strong natural fiber created from the husk of the
coconut. It is characterized by being a “hard, fine, rough fiber,” and it can be used for wide variety of purposes,
including ropes, bags, packaging material, door mats, wall mats, tatami mats, mats, carpet, hangers for plants, fabric
for furniture, insulation and coated coir fiber.
The characteristics of coir can be collated as follows:
・Cold and moisture resistant, protecting against dust and damp.
・While maintaining warmth during the cold, is cool in hot temperatures.
・Products made using it are low noise.
・Products also have a strong resistance to contraction, giving them excellent durability.
In folk art, coir products are extremely flexible when it comes to a variety of designs, being braided in numerous
ways to really bring out the elegance and uniqueness of the material. On the other hand, it is also used effectively
as a construction material. In all cases, as it is plant based it is a material that is kind of the environment.
The coir dust that is generated as part of the production process is a byproduct of coco palm fiber. The production
ratio of fibers and dust, comprised of fragments and crushed material, is 40% fiber and 60% dust.
Husk (Mesocarp)
30% / 25%
Meat
(Endosperm or
Kernel)
28% / 35%
Shell (Endocarp)
20% / 17%
Coco Water
22% / 23%
NUT COMPOSITION
Tall / HybridEpidermis
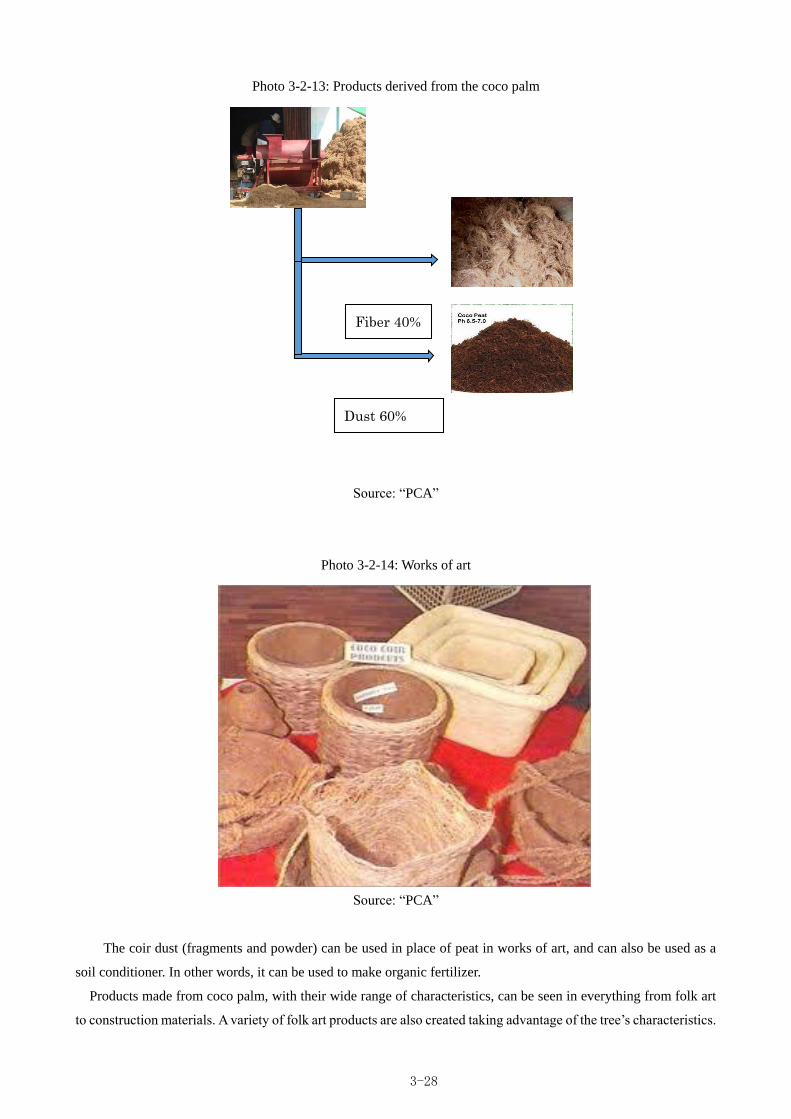
3-28
Photo 3-2-13: Products derived from the coco palm
Source: “PCA”
Photo 3-2-14: Works of art
Source: “PCA”
The coir dust (fragments and powder) can be used in place of peat in works of art, and can also be used as a
soil conditioner. In other words, it can be used to make organic fertilizer.
Products made from coco palm, with their wide range of characteristics, can be seen in everything from folk art
to construction materials. A variety of folk art products are also created taking advantage of the tree’s characteristics.
Fiber 40%
Dust 60%
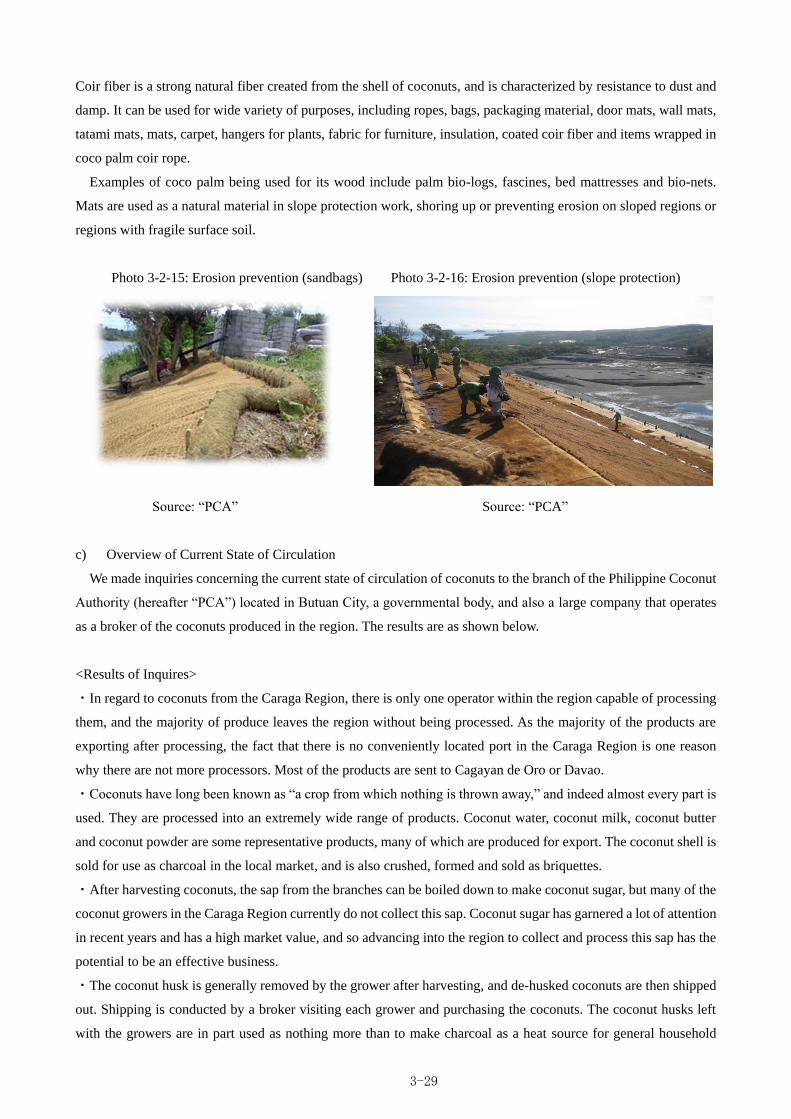
3-29
Coir fiber is a strong natural fiber created from the shell of coconuts, and is characterized by resistance to dust and
damp. It can be used for wide variety of purposes, including ropes, bags, packaging material, door mats, wall mats,
tatami mats, mats, carpet, hangers for plants, fabric for furniture, insulation, coated coir fiber and items wrapped in
coco palm coir rope.
Examples of coco palm being used for its wood include palm bio-logs, fascines, bed mattresses and bio-nets.
Mats are used as a natural material in slope protection work, shoring up or preventing erosion on sloped regions or
regions with fragile surface soil.
Photo 3-2-15: Erosion prevention (sandbags) Photo 3-2-16: Erosion prevention (slope protection)
Source: “PCA” Source: “PCA”
c) Overview of Current State of Circulation
We made inquiries concerning the current state of circulation of coconuts to the branch of the Philippine Coconut
Authority (hereafter “PCA”) located in Butuan City, a governmental body, and also a large company that operates
as a broker of the coconuts produced in the region. The results are as shown below.
<Results of Inquires>
・In regard to coconuts from the Caraga Region, there is only one operator within the region capable of processing
them, and the majority of produce leaves the region without being processed. As the majority of the products are
exporting after processing, the fact that there is no conveniently located port in the Caraga Region is one reason
why there are not more processors. Most of the products are sent to Cagayan de Oro or Davao.
・Coconuts have long been known as “a crop from which nothing is thrown away,” and indeed almost every part is
used. They are processed into an extremely wide range of products. Coconut water, coconut milk, coconut butter
and coconut powder are some representative products, many of which are produced for export. The coconut shell is
sold for use as charcoal in the local market, and is also crushed, formed and sold as briquettes.
・After harvesting coconuts, the sap from the branches can be boiled down to make coconut sugar, but many of the
coconut growers in the Caraga Region currently do not collect this sap. Coconut sugar has garnered a lot of attention
in recent years and has a high market value, and so advancing into the region to collect and process this sap has the
potential to be an effective business.
・The coconut husk is generally removed by the grower after harvesting, and de-husked coconuts are then shipped
out. Shipping is conducted by a broker visiting each grower and purchasing the coconuts. The coconut husks left
with the growers are in part used as nothing more than to make charcoal as a heat source for general household
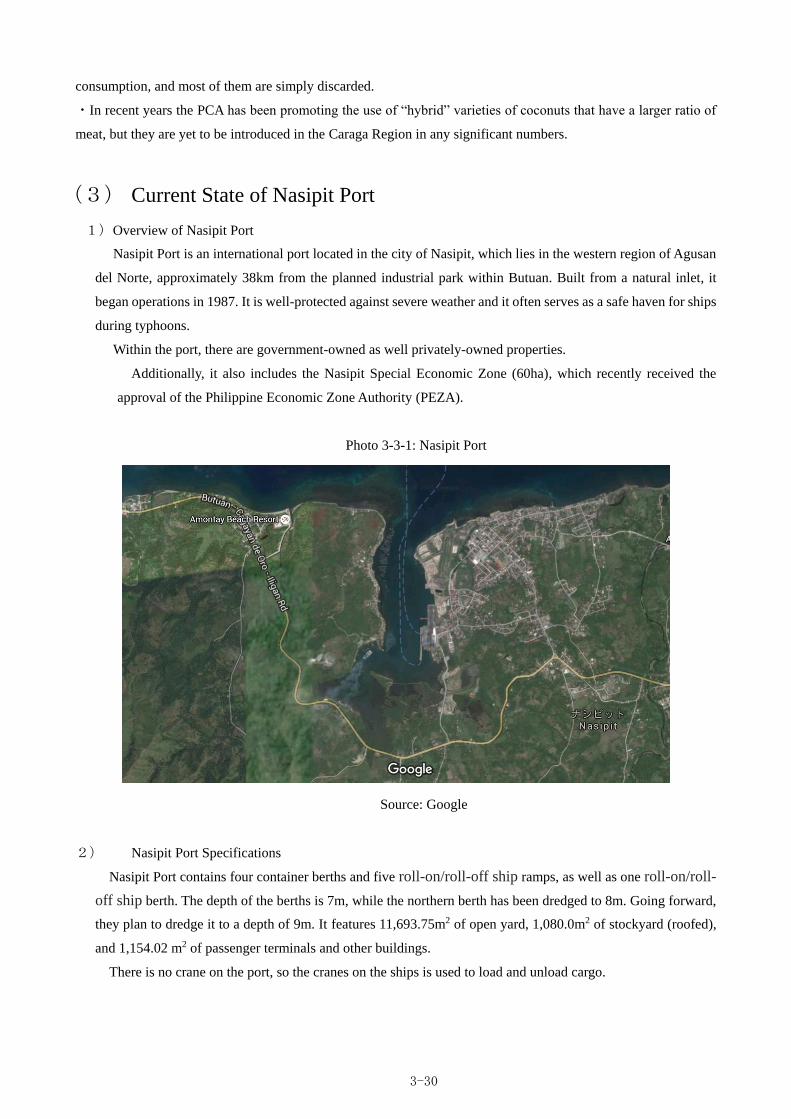
3-30
consumption, and most of them are simply discarded.
・In recent years the PCA has been promoting the use of “hybrid” varieties of coconuts that have a larger ratio of
meat, but they are yet to be introduced in the Caraga Region in any significant numbers.
(3) Current State of Nasipit Port
1)Overview of Nasipit Port
Nasipit Port is an international port located in the city of Nasipit, which lies in the western region of Agusan
del Norte, approximately 38km from the planned industrial park within Butuan. Built from a natural inlet, it
began operations in 1987. It is well-protected against severe weather and it often serves as a safe haven for ships
during typhoons.
Within the port, there are government-owned as well privately-owned properties.
Additionally, it also includes the Nasipit Special Economic Zone (60ha), which recently received the
approval of the Philippine Economic Zone Authority (PEZA).
Photo 3-3-1: Nasipit Port
Source: Google
2) Nasipit Port Specifications
Nasipit Port contains four container berths and five roll-on/roll-off ship ramps, as well as one roll-on/roll-
off ship berth. The depth of the berths is 7m, while the northern berth has been dredged to 8m. Going forward,
they plan to dredge it to a depth of 9m. It features 11,693.75m2 of open yard, 1,080.0m2 of stockyard (roofed),
and 1,154.02 m2 of passenger terminals and other buildings.
There is no crane on the port, so the cranes on the ships is used to load and unload cargo.
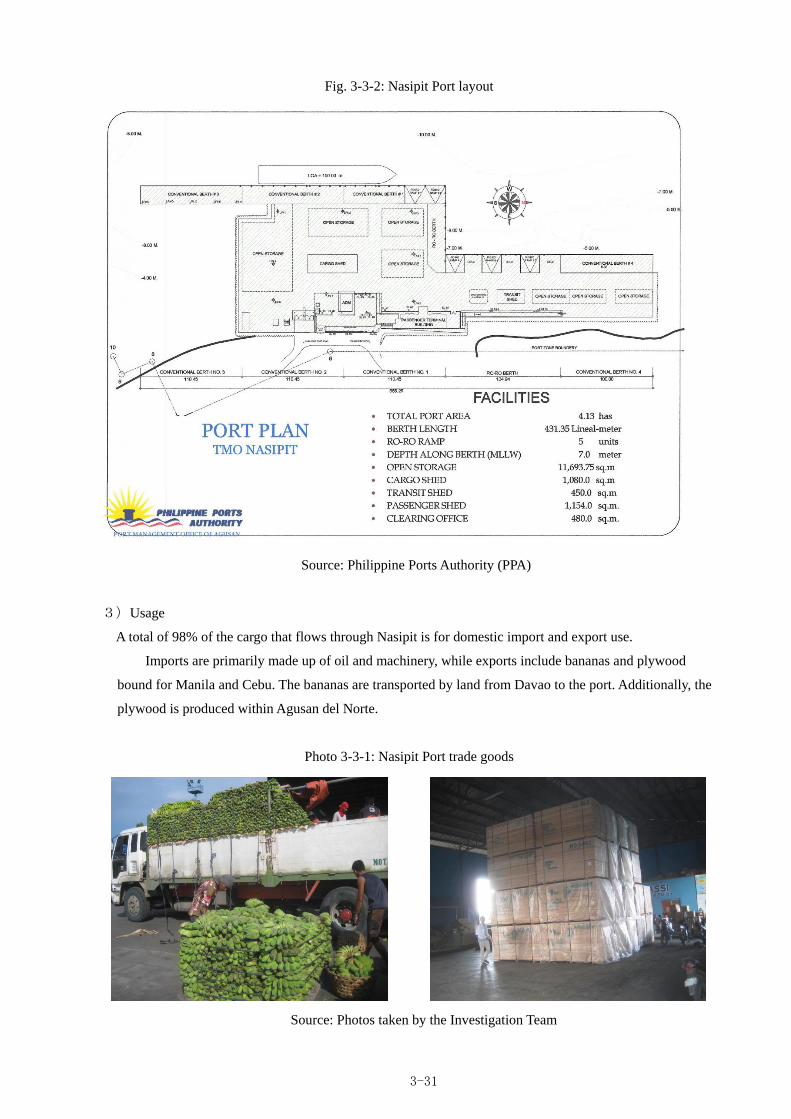
3-31
Fig. 3-3-2: Nasipit Port layout
Source: Philippine Ports Authority (PPA)
3)Usage
A total of 98% of the cargo that flows through Nasipit is for domestic import and export use.
Imports are primarily made up of oil and machinery, while exports include bananas and plywood
bound for Manila and Cebu. The bananas are transported by land from Davao to the port. Additionally, the
plywood is produced within Agusan del Norte.
Photo 3-3-1: Nasipit Port trade goods
Source: Photos taken by the Investigation Team

3-32
Fig. 3-3-3:
Nasipit Port trade goods & volume
Source: PPA
4)Expansion Plans
Currently, there are plans to expand the berths in the port, along with further dredging, and expanding
the yard, and a portion of the construction has already begun. A progress report based on the expansion
plans contained within the CARAGA Regional Development Plan 2013-2016 and from a meeting with the
PPA is listed below.
Table 3-3-1: Nasipit Port expansion plans & progress report
Details Timeframe Amount
(PHP 1 mn) Status
Expand passenger terminal by 165 m2 (gate, air
conditioning system, backup power generator, and
security fence)
2013 - 2014 3.5 Completed
Replace old and broken down buoys at the port
entrance, and add lighted buoys 2013 - 2014 22
TBD
(scheduled
for next year)
Expand the access road into the port 2013 - 2014 55 Completed
0 100,000 200,000 300,000 400,000 500,000
Other Gen. Cargo
Ref, Petrol. Products
Transport Equipment
Crude palm oil
Metal Ores
Cement
Bottled Cargo
Fish & Fish Prep.
Live Animals
Fruits/Vegetables
Wood by products
Other General Cargo
Transport Equipment
Bottled Cargo
Fish/Fish Preparation
Grains
Meat,Dairty products
Metal ores
Coconut by products
Abaca
Dairy Products
Animal Feeds
Crude palm oil
INB
OU
ND
OU
TBO
UN
D
EXP
OR T
DO
MES
TIC
FO REI
GN
Nasipit Port Cargo Volume by Commodity Unit: Metric Ton
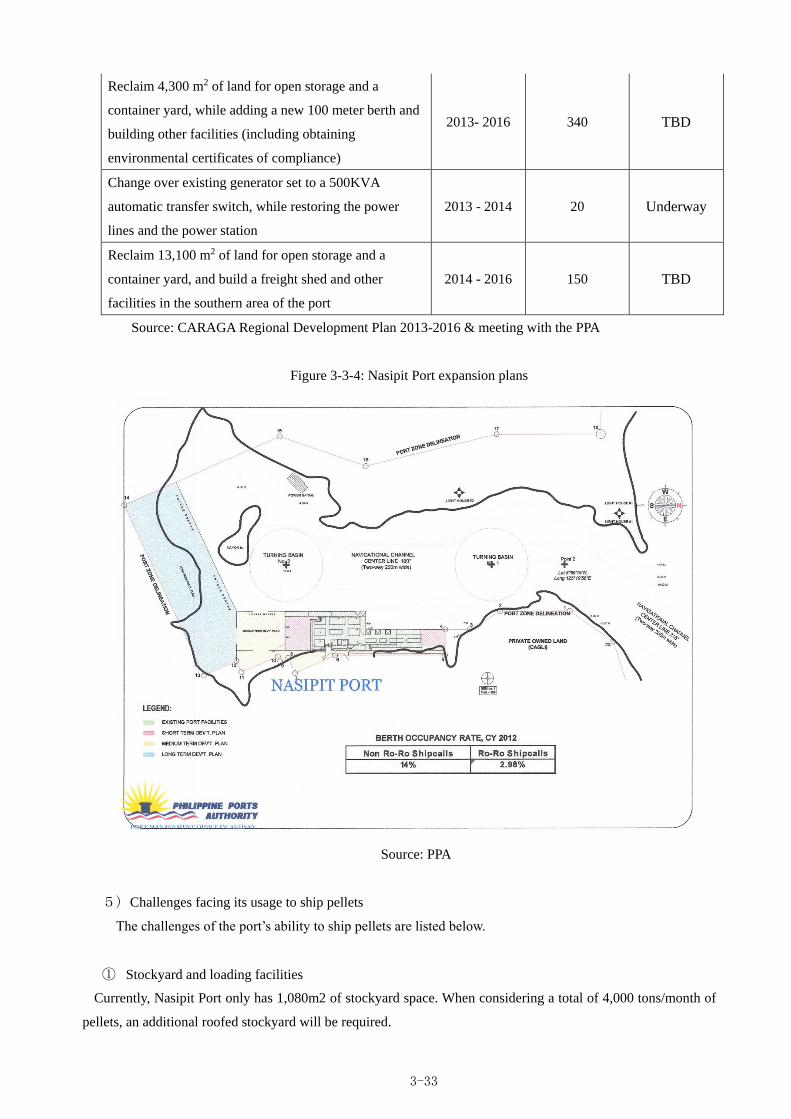
3-33
Reclaim 4,300 m2 of land for open storage and a
container yard, while adding a new 100 meter berth and
building other facilities (including obtaining
environmental certificates of compliance)
2013- 2016 340 TBD
Change over existing generator set to a 500KVA
automatic transfer switch, while restoring the power
lines and the power station
2013 - 2014 20 Underway
Reclaim 13,100 m2 of land for open storage and a
container yard, and build a freight shed and other
facilities in the southern area of the port
2014 - 2016 150 TBD
Source: CARAGA Regional Development Plan 2013-2016 & meeting with the PPA
Figure 3-3-4: Nasipit Port expansion plans
Source: PPA
5)Challenges facing its usage to ship pellets
The challenges of the port’s ability to ship pellets are listed below.
① Stockyard and loading facilities
Currently, Nasipit Port only has 1,080m2 of stockyard space. When considering a total of 4,000 tons/month of
pellets, an additional roofed stockyard will be required.
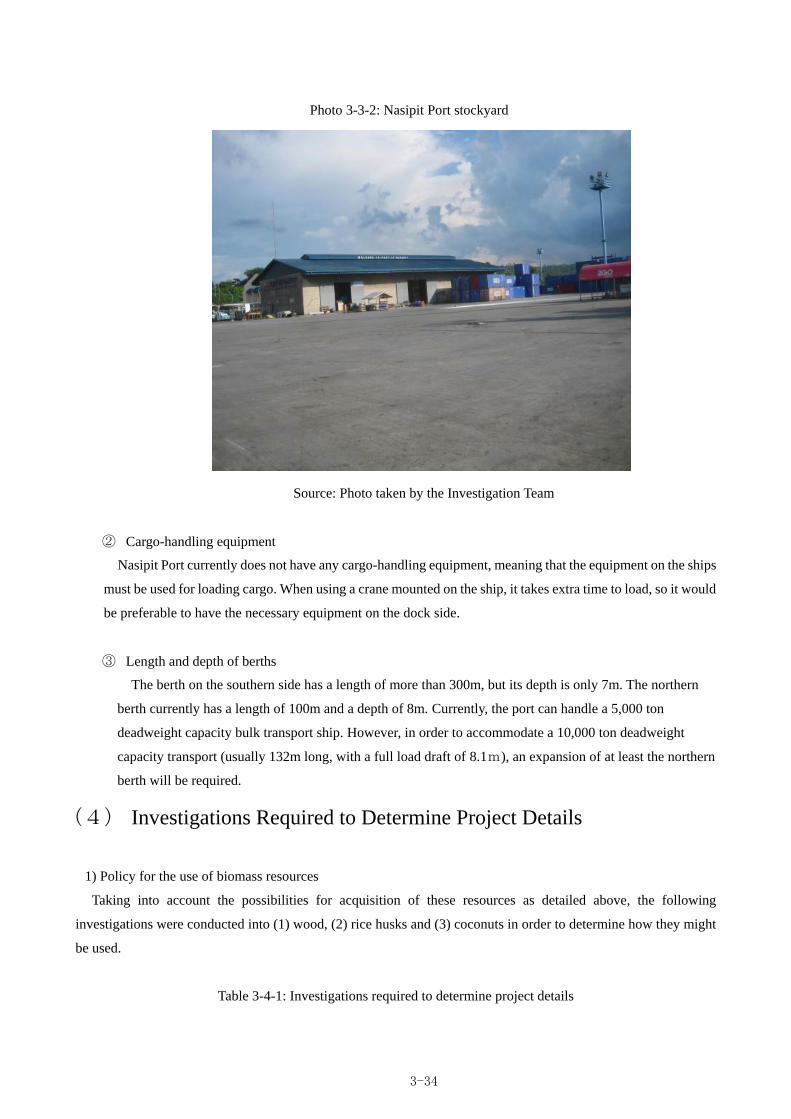
3-34
Photo 3-3-2: Nasipit Port stockyard
Source: Photo taken by the Investigation Team
② Cargo-handling equipment
Nasipit Port currently does not have any cargo-handling equipment, meaning that the equipment on the ships
must be used for loading cargo. When using a crane mounted on the ship, it takes extra time to load, so it would
be preferable to have the necessary equipment on the dock side.
③ Length and depth of berths
The berth on the southern side has a length of more than 300m, but its depth is only 7m. The northern
berth currently has a length of 100m and a depth of 8m. Currently, the port can handle a 5,000 ton
deadweight capacity bulk transport ship. However, in order to accommodate a 10,000 ton deadweight
capacity transport (usually 132m long, with a full load draft of 8.1m), an expansion of at least the northern
berth will be required.
(4) Investigations Required to Determine Project Details
1) Policy for the use of biomass resources
Taking into account the possibilities for acquisition of these resources as detailed above, the following
investigations were conducted into (1) wood, (2) rice husks and (3) coconuts in order to determine how they might
be used.
Table 3-4-1: Investigations required to determine project details
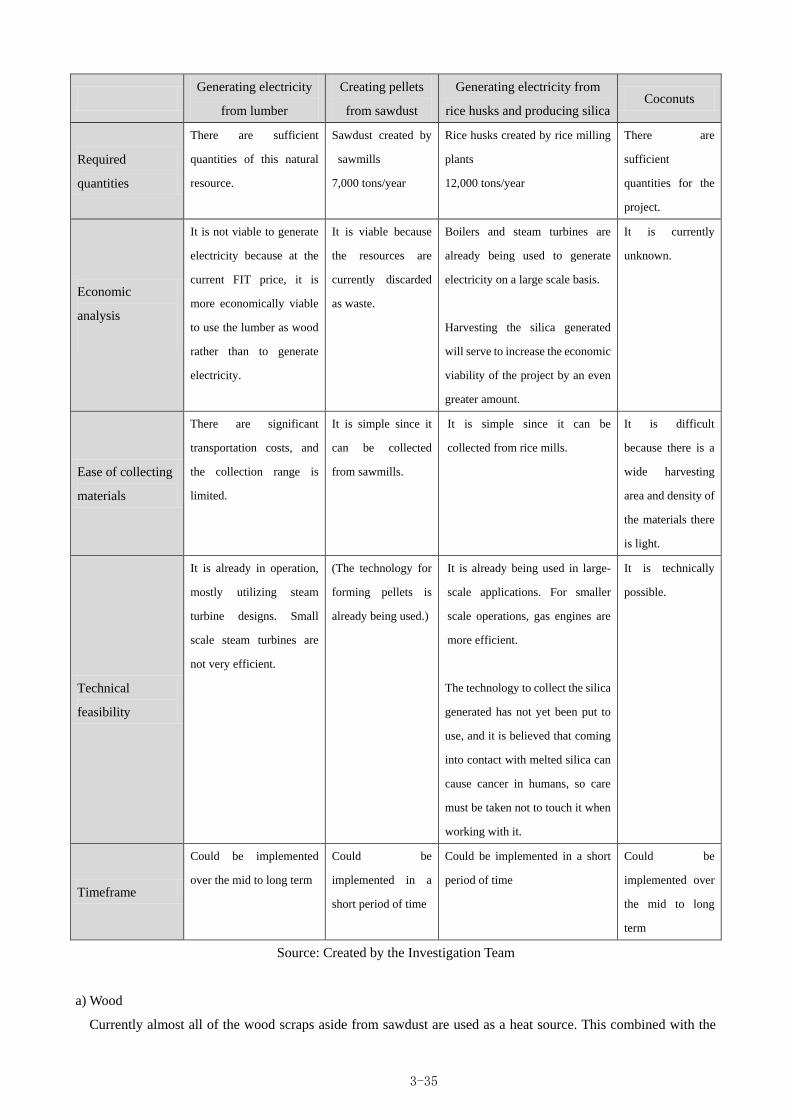
3-35
Generating electricity
from lumber
Creating pellets
from sawdust
Generating electricity from
rice husks and producing silica Coconuts
Required
quantities
There are sufficient
quantities of this natural
resource.
Sawdust created by
sawmills
7,000 tons/year
Rice husks created by rice milling
plants
12,000 tons/year
There are
sufficient
quantities for the
project.
Economic
analysis
It is not viable to generate
electricity because at the
current FIT price, it is
more economically viable
to use the lumber as wood
rather than to generate
electricity.
It is viable because
the resources are
currently discarded
as waste.
Boilers and steam turbines are
already being used to generate
electricity on a large scale basis.
Harvesting the silica generated
will serve to increase the economic
viability of the project by an even
greater amount.
It is currently
unknown.
Ease of collecting
materials
There are significant
transportation costs, and
the collection range is
limited.
It is simple since it
can be collected
from sawmills.
It is simple since it can be
collected from rice mills.
It is difficult
because there is a
wide harvesting
area and density of
the materials there
is light.
Technical
feasibility
It is already in operation,
mostly utilizing steam
turbine designs. Small
scale steam turbines are
not very efficient.
(The technology for
forming pellets is
already being used.)
It is already being used in large-
scale applications. For smaller
scale operations, gas engines are
more efficient.
The technology to collect the silica
generated has not yet been put to
use, and it is believed that coming
into contact with melted silica can
cause cancer in humans, so care
must be taken not to touch it when
working with it.
It is technically
possible.
Timeframe
Could be implemented
over the mid to long term
Could be
implemented in a
short period of time
Could be implemented in a short
period of time
Could be
implemented over
the mid to long
term
Source: Created by the Investigation Team
a) Wood
Currently almost all of the wood scraps aside from sawdust are used as a heat source. This combined with the
3-36
location of the wood mills along the river means that it is not possible to form a privately led project that involves
collecting these wood scraps from the wood mills and making use of them. On the other hand, the current burning
of the scraps for heat is inefficient due to the age of the facilities in each of the wood mills, and there it is extremely
likely that excessive amounts of fuel are being burned when compared to the heat that is required. Furthermore, as
each operator has their own individual boiler for heating, the efficiency of heating can be considered to be poor
when the volume of heat loss is also taken into account.
Therefore, as the core of the industrial park that is being advanced as a separate project, attracting regional wood
processors and new wood processors to the park, bringing them all together in one place, collecting the scraps that
could be used as a biomass resource and using these with a highly efficient heat exchange system may allow for the
establishment of a power generation project. Furthermore, by providing the heat created during the power generation
to the wood processors as a heat source, they will be able to obtain the same heat required for the pressing process
as they currently have now.
The reason for so many of the wood mills being located along both banks of the river is because, in the past, the
wood was transported via the Agusan River. Now, however, the transport of wood by river is prohibited, and there
are no signs that this prohibition will be lifted at any point in the future. When this is combined with the frequency
of river flooding during the rainy season, it is highly probable that mills will transfer their site of operation to one
alongside trunk roads in the future. Even some simple inquiries confirmed the possibility and intent to relocate.
However, due to the wood processors having been in this region for a long time, residential areas have been formed
centered in the workers at the mills in the region along the river banks, and so the relocation is not something that
could happen in a short space of time. It would require a managerial decision from the wood processors and need
to be undertaken as a long-term project.
On the other hand, the sawdust that is currently hardly being used could be made use of. In the Philippines natural
forest cannot be felled, but all other artificially planted forest can be. The wood handled by processors is in principle
falcata and mangium etc., those species that are recommended by the Philippine government, and a university in
the Caraga Region has been proceeding with research into their use as a biomass resource, indicating no need for
illegal or excessive felling and no legal issues with making use of them.
The results of a composition analysis of the species of trees from which the sawdust is derived revealed no content
that could cause any problems during the combustion process, and no issues with its formation into wooden pellets.
The results of a cultivation investigation show that 5~8 years of forest management could provide an extremely
high harvest of materials, and in regard to generated heat, in a chipped state heat volume of around 3,000kcla/kg
can be predicted, which shows extremely high potential as a biomass fuel. Furthermore, as this is sawdust from
cutting the processing of it is already complete; it simply needs to be dried to the requisite water content level and
it can then be formed into pellets.
b) Rice husks
The rice husks from rice produced in every country and region of the world are generally extremely similar in
terms of composition and heat volume; in terms of the latter, energy of around 3,500kcal/kg can be considered to
be obtainable through combustion. Furthermore, the husks contain approximately 15-20% silica. In the past this
high silica content has caused rice husks to be considered a resource that is more difficult to use as a fuel. This is
because the silica fuses during combustion and then hardens inside the combustion furnace, causing damage to its
3-37
interior. Furthermore, during combustion at temperatures higher than 1,000 degrees the silica may crystallize.
Crystallized silica has been stipulated by the International Agency for Research on Cancer as a dangerous material
with carcinogenic properties, which creates both a requirement to prevent crystallization through careful
temperature control and for the waste ash to be handled with the utmost care.
On the other hand, highly pure non-crystallized silica has a wide variety of uses, including reinforcement for
cement and tires, an additive to fertilizer, and an additive to cosmetics and foodstuffs, giving it industrial product
value. The silica in these cases is generally obtained through extraction from minerals, but such mining causes many
issues in the regions in which it takes place and a tendency is increasing in recent years to obtain silica from rice
husks instead.
Taking the above into account, a policy can be conceived of in which as many rice husks as possible are collected
from the region, and are then used not only as a heat source in combustion for biomass power generation but also
have their added value as a resource heightened through the production of highly pure silica and the turning of it
into a saleable product.
In regard to Japanese technology concerning the formation of silica from the combustion of rice husks, there are
results available from research being conducted by Professor Katsuyoshi Kondo at the Department of Composite
Materials Processing in the Joining and Welding Institute at Osaka University and Kurimoto Ltd. Investigations
include receiving aid from the Ministry of Agriculture, Forestry and Fisheries in 2013 as a “Innovative environment
technology project for green and water,” and performing operational experiments in a test plant as a “Feasibility
investigation into using bio-silica obtained from the combustion of rice husks as a substitute source of industrial
silica.” There is a requirement to proceed safely and assuredly with the project through cooperation with these
bodies that already have an accumulation of knowledge in this area.
c) Coconuts
Currently the coconut husks are removed prior to shipping, and are left with the coconut producers. While these
coconut husks could be used as a biomass fuel, they are just discarded. When it is considered that the produce is
being sent out with the husks removed, while a requirement will be generated to collect the husks up, as a broker is
already going around each grower in order buy the coconuts without the husks, this collection process does not
represent a significant hurdle. Furthermore, as the husks have a higher relative weight than rice husks and sawdust,
collection efficiency is comparatively higher.
In regard to the meat found inside the coconut shell, businesses processing it into products such as coconut oil,
coconut milk and coconut water are all already in place, and while those handling it can be seen to suffer from a
lack of capacity in the volume they can handle, the added value is significantly high in the region.
On the other hand, the coconut shell burns incredibly hot and so is often used in regular households as a source
of fuel charcoal, and is sold incredibly cheaply, indicating that its added value has not been sufficiently heightened.
As an example in the Philippines, in Davao and Cagayan de Oro the company Osaka Gas Chemical, a subsidiary of
Osaka Gas, has a plant that produces activated charcoal from coconut shells while using combustion of coconut
husks to generate the heat required by this process, and this can be considered the optimal policy for heightening
the added value of the regional resource of coconuts.
However, currently there is only one company in Butuan City that processes coconuts, and while the four
provinces of the Caraga Region together produce around 800,000 tons of coconuts annually almost all of them flow
3-38
out of the region without their added value being heightened at all. One of the primary reasons for this, an opinion
expressed by multiple operators to whom inquiries were made and included wood processors, is that there is no
conveniently located port for shipping in the region. If the Port of Nasipit, the port in the region with the highest
potential for development, were to be expanded then the target region around Butuan City can be expected to achieve
heightened potential as a location for coconut processors.
In accordance with the above, the policy here would be a project placed in the medium to long term range,
planning the expansion of the Port of Nasipit whole working with Japanese manufacturers and dealers related to
coconut products in order to make use of the coconut shells and coconut husks that are currently just going to waste.
2) Overview
Taking the above into account, and though this investigation as whole, agreement has been reached between Equi-
Parco Construction Company, Twinpeak Hydro Resources Corporation and Chodai Co., Ltd., the counterparts in
this investigation, to adopt the following four projects as those that shall be proceeded with.
■ Projects that can be implemented in the short term
(1) Power generation and silica production from the burning of rice husks
(2) Production and export of wood pellets made from sawdust
■ Projects that can be implemented in the medium and long term
(3) Power generation and production of activated charcoal from coconut waste materials
(4) Biomass power generation by attracting wood processors to an industrial park in order to concentrate waste
materials and make use of them
In regard to (3) and (4), as stated above, they will need to proceed in the medium or long term in conjunction with
the progress of a separate project, the development of an industrial park. Therefore, the remainder of this
investigation will place the focus on just (1) and (2).
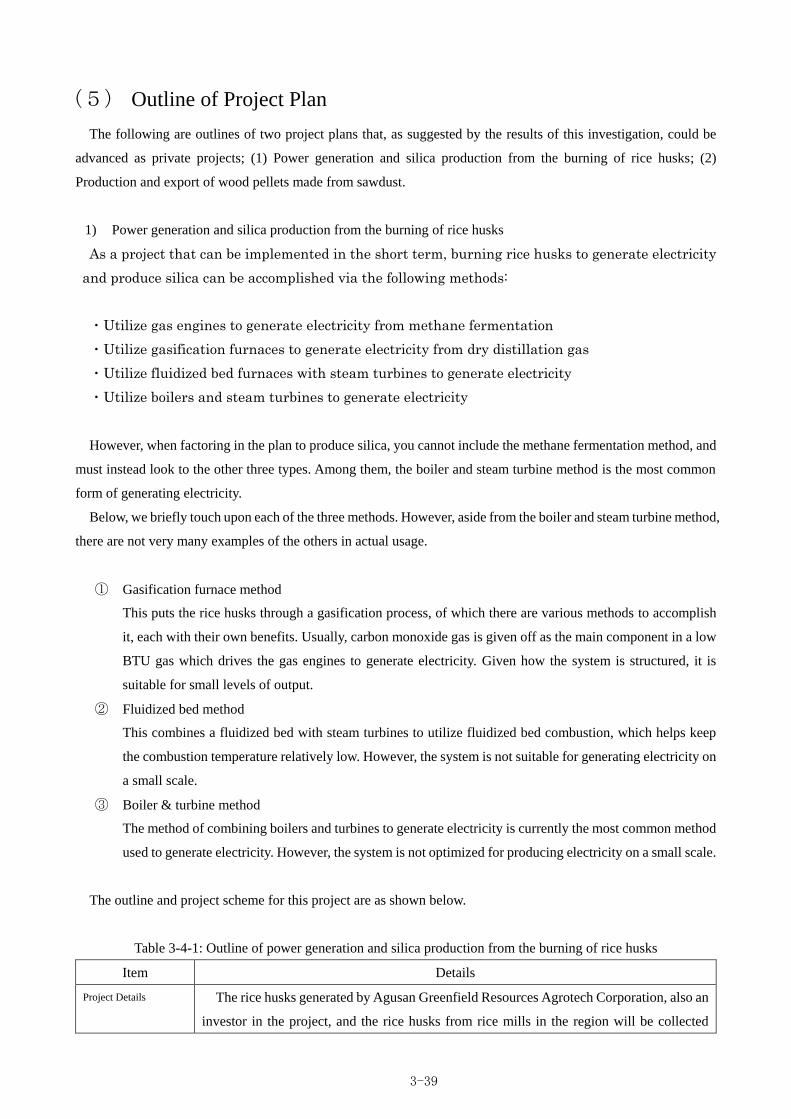
3-39
(5) Outline of Project Plan
The following are outlines of two project plans that, as suggested by the results of this investigation, could be
advanced as private projects; (1) Power generation and silica production from the burning of rice husks; (2)
Production and export of wood pellets made from sawdust.
1) Power generation and silica production from the burning of rice husks
As a project that can be implemented in the short term, burning rice husks to generate electricity
and produce silica can be accomplished via the following methods:
・Utilize gas engines to generate electricity from methane fermentation
・Utilize gasification furnaces to generate electricity from dry distillation gas
・Utilize fluidized bed furnaces with steam turbines to generate electricity
・Utilize boilers and steam turbines to generate electricity
However, when factoring in the plan to produce silica, you cannot include the methane fermentation method, and
must instead look to the other three types. Among them, the boiler and steam turbine method is the most common
form of generating electricity.
Below, we briefly touch upon each of the three methods. However, aside from the boiler and steam turbine method,
there are not very many examples of the others in actual usage.
① Gasification furnace method
This puts the rice husks through a gasification process, of which there are various methods to accomplish
it, each with their own benefits. Usually, carbon monoxide gas is given off as the main component in a low
BTU gas which drives the gas engines to generate electricity. Given how the system is structured, it is
suitable for small levels of output.
② Fluidized bed method
This combines a fluidized bed with steam turbines to utilize fluidized bed combustion, which helps keep
the combustion temperature relatively low. However, the system is not suitable for generating electricity on
a small scale.
③ Boiler & turbine method
The method of combining boilers and turbines to generate electricity is currently the most common method
used to generate electricity. However, the system is not optimized for producing electricity on a small scale.
The outline and project scheme for this project are as shown below.
Table 3-4-1: Outline of power generation and silica production from the burning of rice husks
Item Details
Project Details The rice husks generated by Agusan Greenfield Resources Agrotech Corporation, also an
investor in the project, and the rice husks from rice mills in the region will be collected
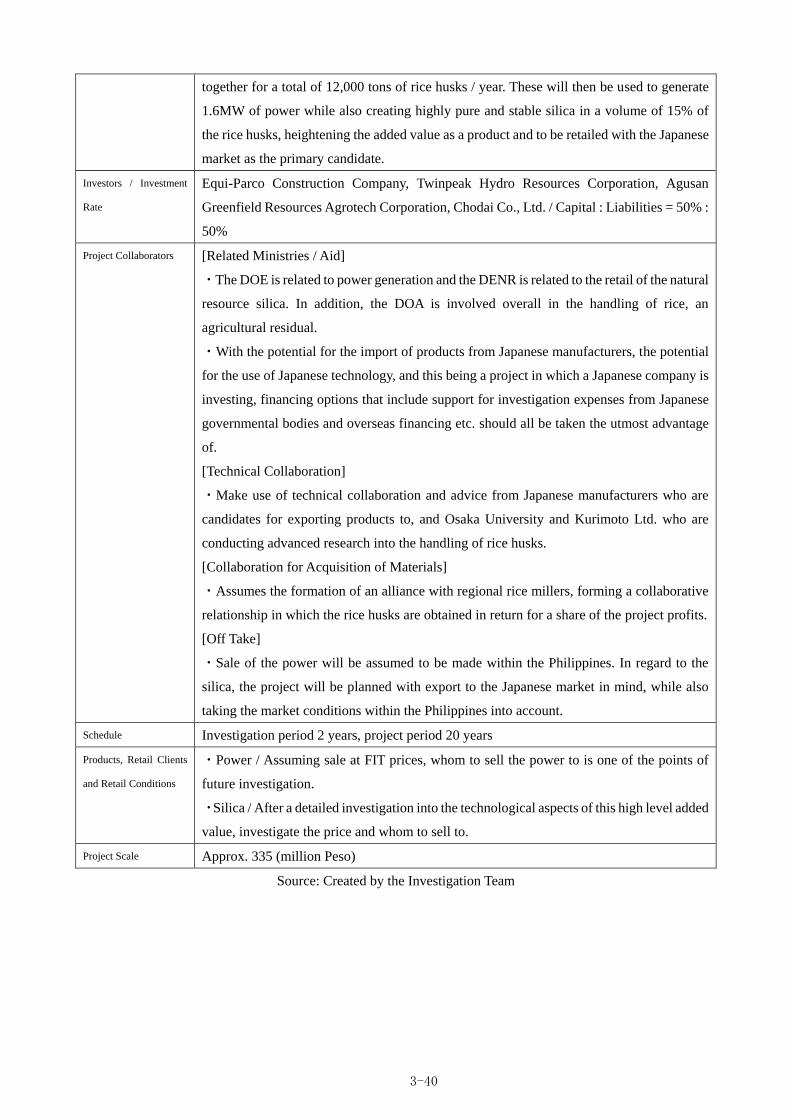
3-40
together for a total of 12,000 tons of rice husks / year. These will then be used to generate
1.6MW of power while also creating highly pure and stable silica in a volume of 15% of
the rice husks, heightening the added value as a product and to be retailed with the Japanese
market as the primary candidate.
Investors / Investment
Rate
Equi-Parco Construction Company, Twinpeak Hydro Resources Corporation, Agusan
Greenfield Resources Agrotech Corporation, Chodai Co., Ltd. / Capital : Liabilities = 50% :
50%
Project Collaborators [Related Ministries / Aid]
・The DOE is related to power generation and the DENR is related to the retail of the natural
resource silica. In addition, the DOA is involved overall in the handling of rice, an
agricultural residual.
・With the potential for the import of products from Japanese manufacturers, the potential
for the use of Japanese technology, and this being a project in which a Japanese company is
investing, financing options that include support for investigation expenses from Japanese
governmental bodies and overseas financing etc. should all be taken the utmost advantage
of.
[Technical Collaboration]
・Make use of technical collaboration and advice from Japanese manufacturers who are
candidates for exporting products to, and Osaka University and Kurimoto Ltd. who are
conducting advanced research into the handling of rice husks.
[Collaboration for Acquisition of Materials]
・Assumes the formation of an alliance with regional rice millers, forming a collaborative
relationship in which the rice husks are obtained in return for a share of the project profits.
[Off Take]
・Sale of the power will be assumed to be made within the Philippines. In regard to the
silica, the project will be planned with export to the Japanese market in mind, while also
taking the market conditions within the Philippines into account.
Schedule Investigation period 2 years, project period 20 years
Products, Retail Clients
and Retail Conditions
・Power / Assuming sale at FIT prices, whom to sell the power to is one of the points of
future investigation.
・Silica / After a detailed investigation into the technological aspects of this high level added
value, investigate the price and whom to sell to.
Project Scale Approx. 335 (million Peso)
Source: Created by the Investigation Team
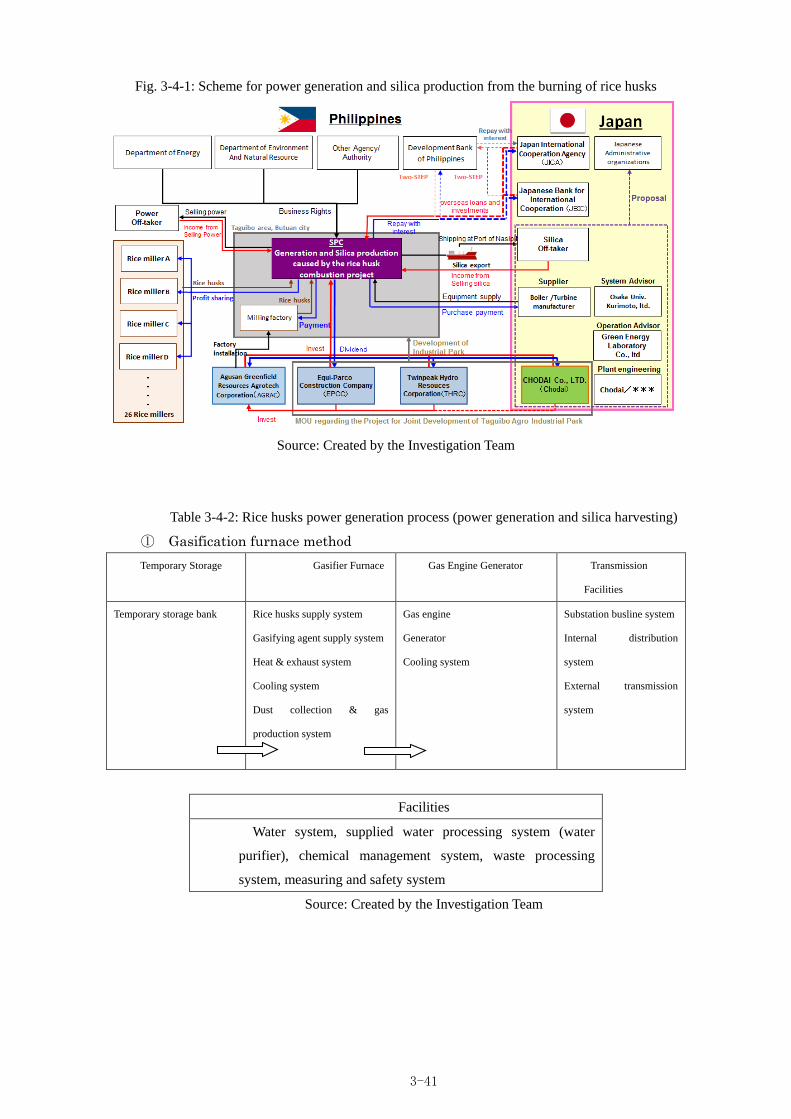
3-41
Fig. 3-4-1: Scheme for power generation and silica production from the burning of rice husks
Source: Created by the Investigation Team
Table 3-4-2: Rice husks power generation process (power generation and silica harvesting)
① Gasification furnace method
Temporary Storage Gasifier Furnace Gas Engine Generator Transmission
Facilities
Temporary storage bank Rice husks supply system
Gasifying agent supply system
Heat & exhaust system
Cooling system
Dust collection & gas
production system
Gas engine
Generator
Cooling system
Substation busline system
Internal distribution
system
External transmission
system
Facilities
Water system, supplied water processing system (water
purifier), chemical management system, waste processing
system, measuring and safety system
Source: Created by the Investigation Team
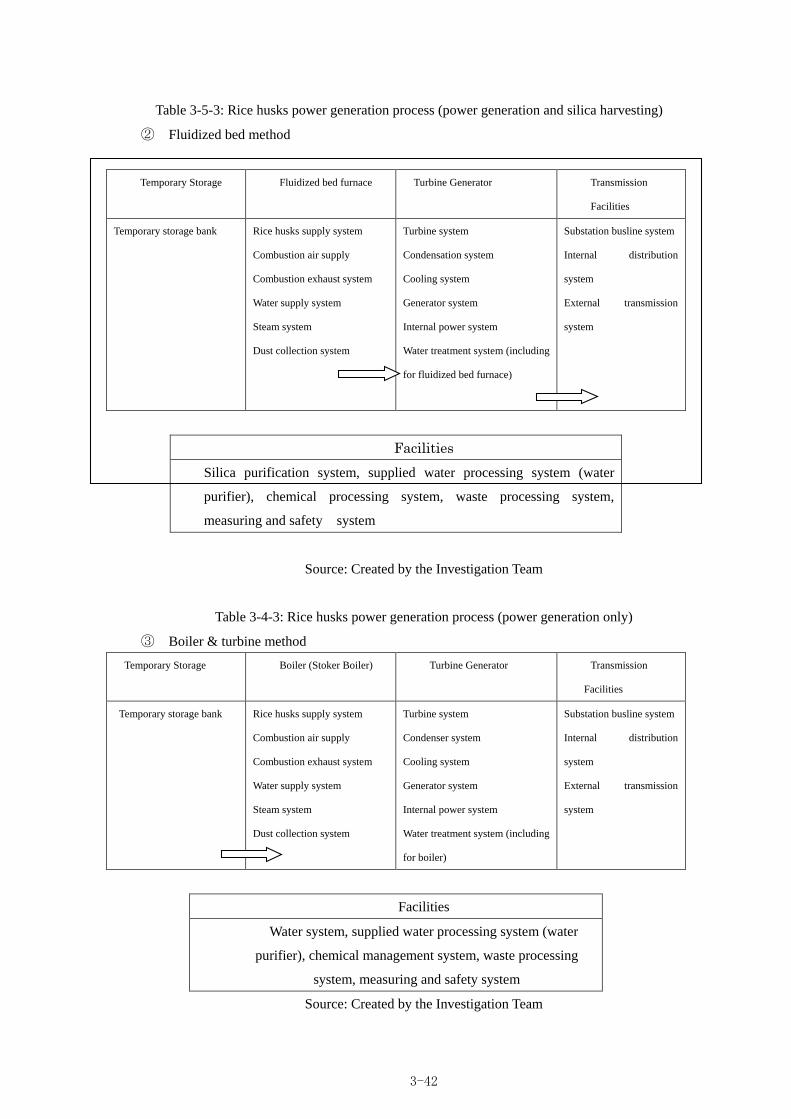
3-42
Table 3-5-3: Rice husks power generation process (power generation and silica harvesting)
② Fluidized bed method
Temporary Storage Fluidized bed furnace Turbine Generator Transmission
Facilities
Temporary storage bank Rice husks supply system
Combustion air supply
Combustion exhaust system
Water supply system
Steam system
Dust collection system
Turbine system
Condensation system
Cooling system
Generator system
Internal power system
Water treatment system (including
for fluidized bed furnace)
Substation busline system
Internal distribution
system
External transmission
system
Facilities
Silica purification system, supplied water processing system (water
purifier), chemical processing system, waste processing system,
measuring and safety system
Source: Created by the Investigation Team
Table 3-4-3: Rice husks power generation process (power generation only)
③ Boiler & turbine method
Temporary Storage Boiler (Stoker Boiler) Turbine Generator Transmission
Facilities
Temporary storage bank Rice husks supply system
Combustion air supply
Combustion exhaust system
Water supply system
Steam system
Dust collection system
Turbine system
Condenser system
Cooling system
Generator system
Internal power system
Water treatment system (including
for boiler)
Substation busline system
Internal distribution
system
External transmission
system
Facilities
Water system, supplied water processing system (water
purifier), chemical management system, waste processing
system, measuring and safety system
Source: Created by the Investigation Team
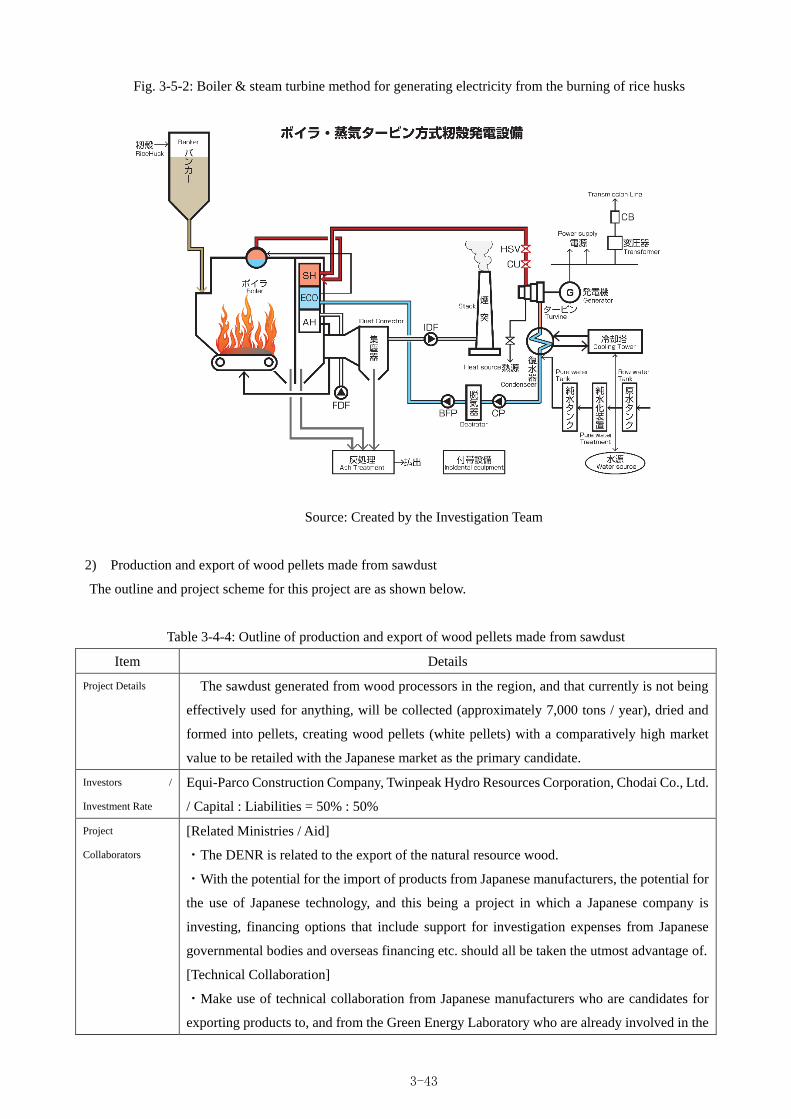
3-43
Fig. 3-5-2: Boiler & steam turbine method for generating electricity from the burning of rice husks
Source: Created by the Investigation Team
2) Production and export of wood pellets made from sawdust
The outline and project scheme for this project are as shown below.
Table 3-4-4: Outline of production and export of wood pellets made from sawdust
Item Details
Project Details The sawdust generated from wood processors in the region, and that currently is not being
effectively used for anything, will be collected (approximately 7,000 tons / year), dried and
formed into pellets, creating wood pellets (white pellets) with a comparatively high market
value to be retailed with the Japanese market as the primary candidate.
Investors /
Investment Rate
Equi-Parco Construction Company, Twinpeak Hydro Resources Corporation, Chodai Co., Ltd.
/ Capital : Liabilities = 50% : 50%
Project
Collaborators
[Related Ministries / Aid]
・The DENR is related to the export of the natural resource wood.
・With the potential for the import of products from Japanese manufacturers, the potential for
the use of Japanese technology, and this being a project in which a Japanese company is
investing, financing options that include support for investigation expenses from Japanese
governmental bodies and overseas financing etc. should all be taken the utmost advantage of.
[Technical Collaboration]
・Make use of technical collaboration from Japanese manufacturers who are candidates for
exporting products to, and from the Green Energy Laboratory who are already involved in the
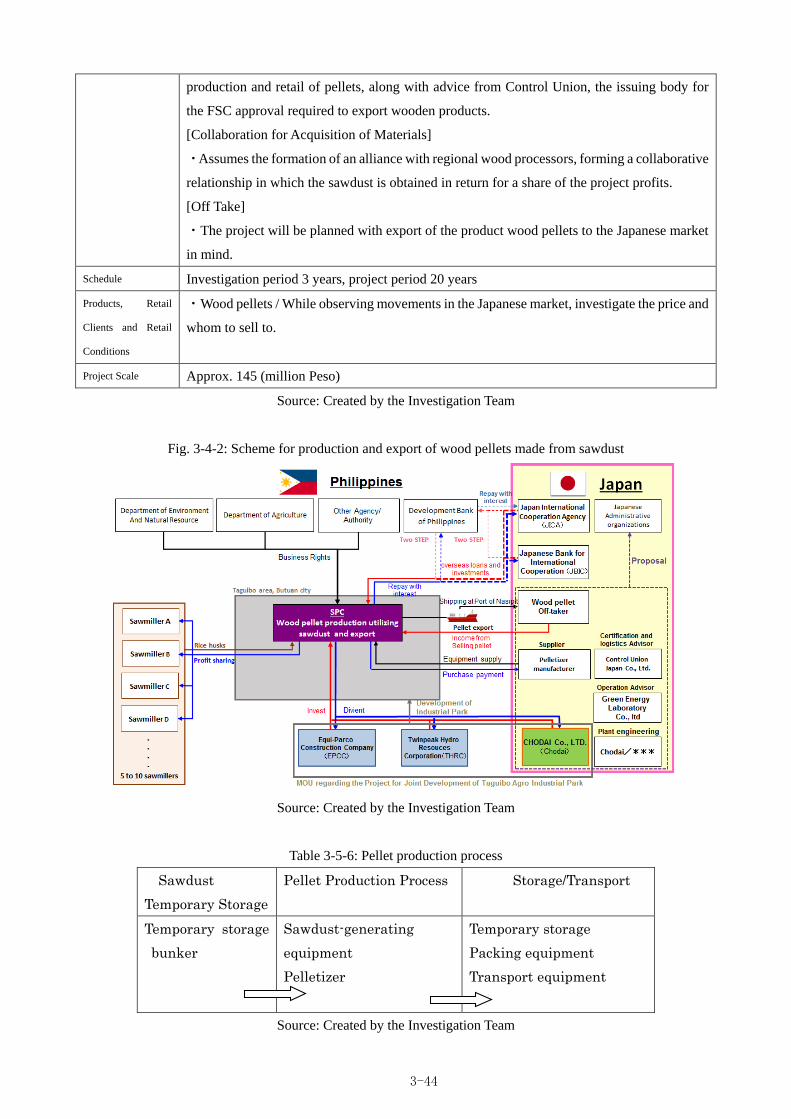
3-44
production and retail of pellets, along with advice from Control Union, the issuing body for
the FSC approval required to export wooden products.
[Collaboration for Acquisition of Materials]
・Assumes the formation of an alliance with regional wood processors, forming a collaborative
relationship in which the sawdust is obtained in return for a share of the project profits.
[Off Take]
・The project will be planned with export of the product wood pellets to the Japanese market
in mind.
Schedule Investigation period 3 years, project period 20 years
Products, Retail
Clients and Retail
Conditions
・Wood pellets / While observing movements in the Japanese market, investigate the price and
whom to sell to.
Project Scale Approx. 145 (million Peso)
Source: Created by the Investigation Team
Fig. 3-4-2: Scheme for production and export of wood pellets made from sawdust
Source: Created by the Investigation Team
Table 3-5-6: Pellet production process
Sawdust
Temporary Storage
Pellet Production Process Storage/Transport
Temporary storage
bunker
Sawdust-generating
equipment
Pelletizer
Temporary storage
Packing equipment
Transport equipment
Source: Created by the Investigation Team
Chapter4 Environmental and Social Issues
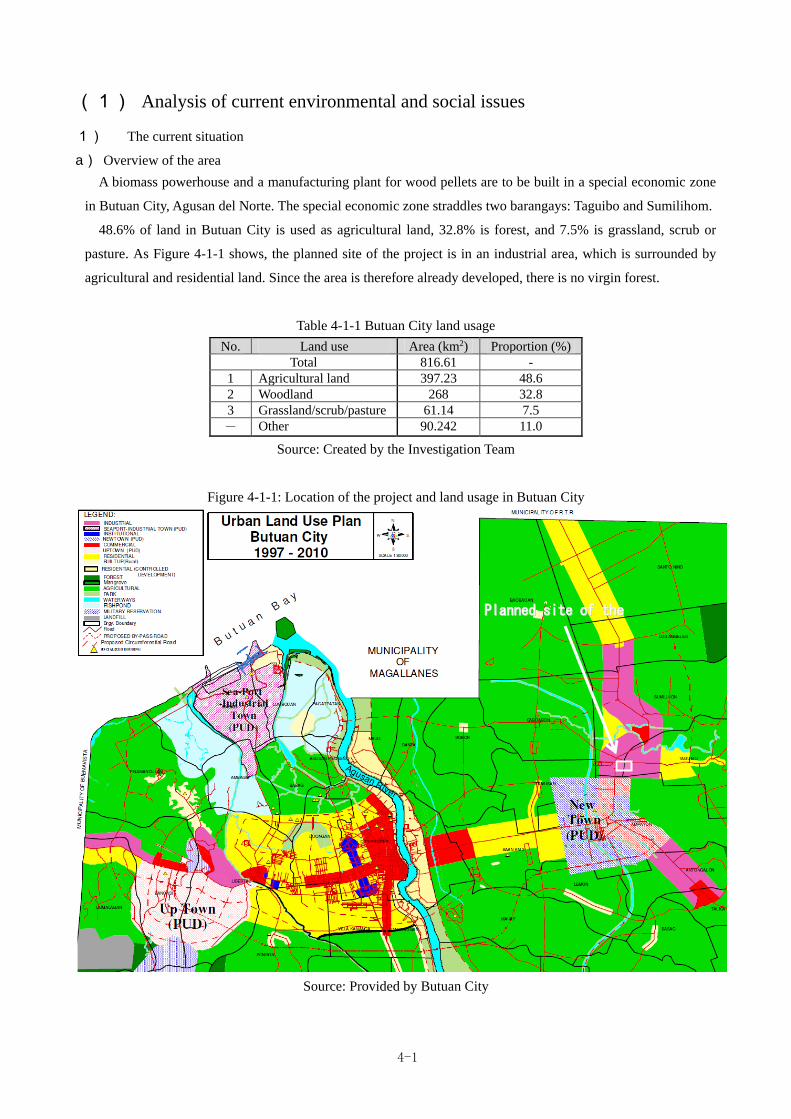
4-1
(1) Analysis of current environmental and social issues
1) The current situation
a) Overview of the area
A biomass powerhouse and a manufacturing plant for wood pellets are to be built in a special economic zone
in Butuan City, Agusan del Norte. The special economic zone straddles two barangays: Taguibo and Sumilihom.
48.6% of land in Butuan City is used as agricultural land, 32.8% is forest, and 7.5% is grassland, scrub or
pasture. As Figure 4-1-1 shows, the planned site of the project is in an industrial area, which is surrounded by
agricultural and residential land. Since the area is therefore already developed, there is no virgin forest.
Table 4-1-1 Butuan City land usage
No. Land use Area (km2) Proportion (%)
Total 816.61 -
1 Agricultural land 397.23 48.6
2 Woodland 268 32.8
3 Grassland/scrub/pasture 61.14 7.5
- Other 90.242 11.0
Source: Created by the Investigation Team
Figure 4-1-1: Location of the project and land usage in Butuan City
Source: Provided by Butuan City
PPllaannnneedd ssiittee ooff tthhee
pprroojjeecctt
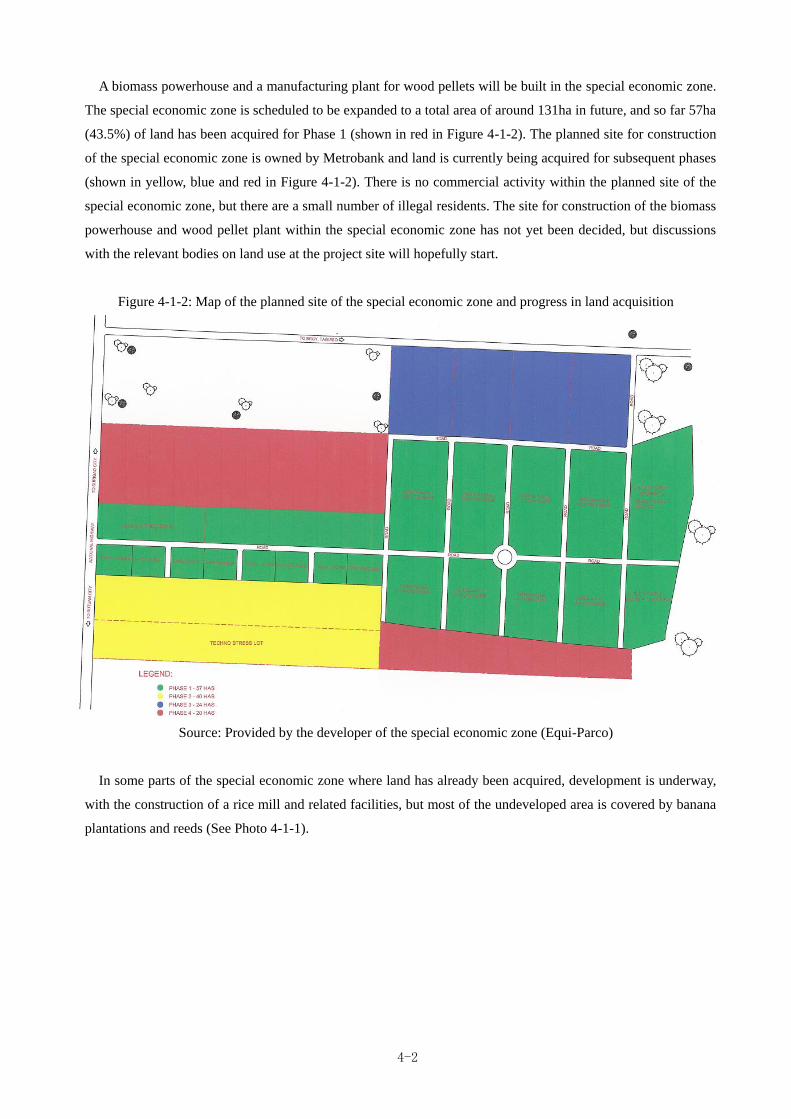
4-2
A biomass powerhouse and a manufacturing plant for wood pellets will be built in the special economic zone.
The special economic zone is scheduled to be expanded to a total area of around 131ha in future, and so far 57ha
(43.5%) of land has been acquired for Phase 1 (shown in red in Figure 4-1-2). The planned site for construction
of the special economic zone is owned by Metrobank and land is currently being acquired for subsequent phases
(shown in yellow, blue and red in Figure 4-1-2). There is no commercial activity within the planned site of the
special economic zone, but there are a small number of illegal residents. The site for construction of the biomass
powerhouse and wood pellet plant within the special economic zone has not yet been decided, but discussions
with the relevant bodies on land use at the project site will hopefully start.
Figure 4-1-2: Map of the planned site of the special economic zone and progress in land acquisition
Source: Provided by the developer of the special economic zone (Equi-Parco)
In some parts of the special economic zone where land has already been acquired, development is underway,
with the construction of a rice mill and related facilities, but most of the undeveloped area is covered by banana
plantations and reeds (See Photo 4-1-1).
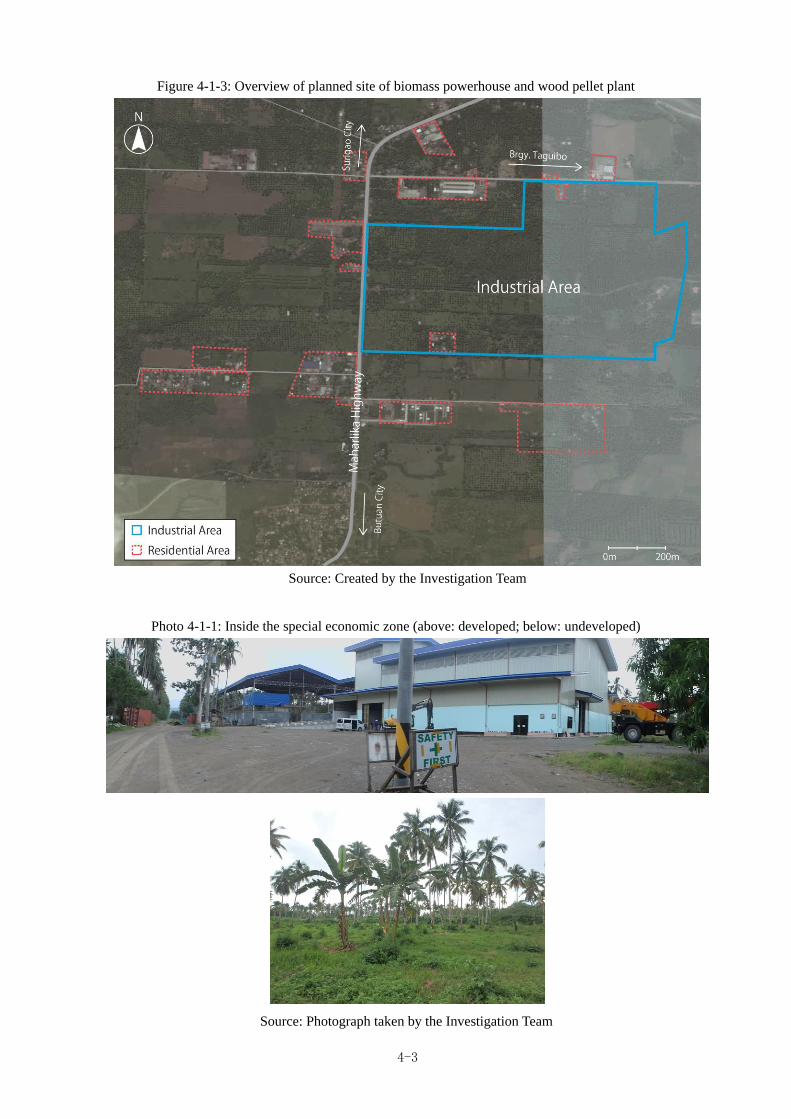
4-3
Figure 4-1-3: Overview of planned site of biomass powerhouse and wood pellet plant
Source: Created by the Investigation Team
Photo 4-1-1: Inside the special economic zone (above: developed; below: undeveloped)
Source: Photograph taken by the Investigation Team
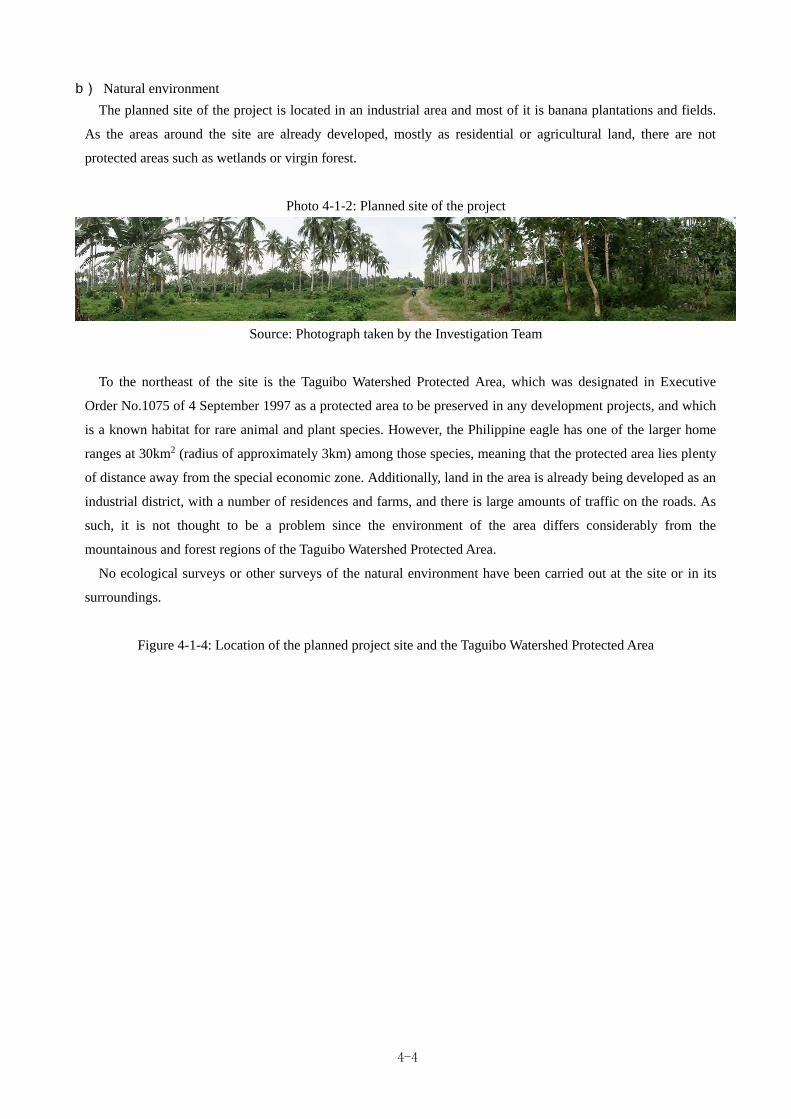
4-4
b) Natural environment
The planned site of the project is located in an industrial area and most of it is banana plantations and fields.
As the areas around the site are already developed, mostly as residential or agricultural land, there are not
protected areas such as wetlands or virgin forest.
Photo 4-1-2: Planned site of the project
Source: Photograph taken by the Investigation Team
To the northeast of the site is the Taguibo Watershed Protected Area, which was designated in Executive
Order No.1075 of 4 September 1997 as a protected area to be preserved in any development projects, and which
is a known habitat for rare animal and plant species. However, the Philippine eagle has one of the larger home
ranges at 30km2 (radius of approximately 3km) among those species, meaning that the protected area lies plenty
of distance away from the special economic zone. Additionally, land in the area is already being developed as an
industrial district, with a number of residences and farms, and there is large amounts of traffic on the roads. As
such, it is not thought to be a problem since the environment of the area differs considerably from the
mountainous and forest regions of the Taguibo Watershed Protected Area.
No ecological surveys or other surveys of the natural environment have been carried out at the site or in its
surroundings.
Figure 4-1-4: Location of the planned project site and the Taguibo Watershed Protected Area
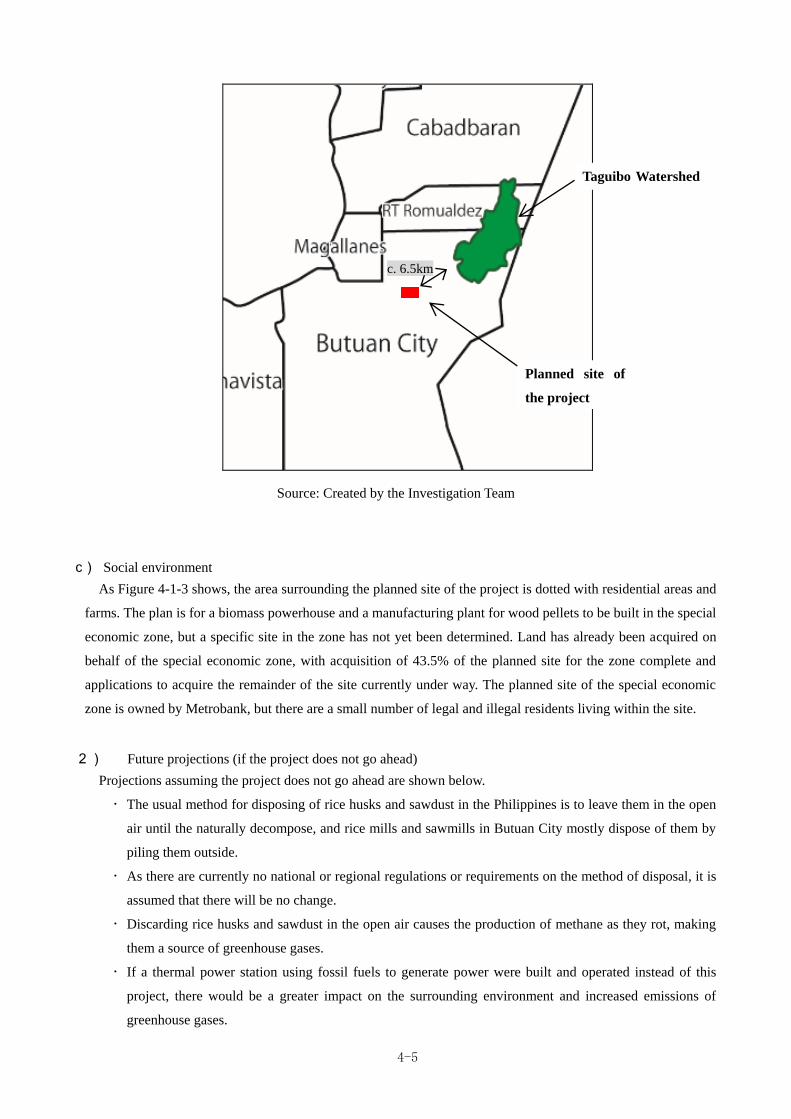
4-5
Source: Created by the Investigation Team
c) Social environment
As Figure 4-1-3 shows, the area surrounding the planned site of the project is dotted with residential areas and
farms. The plan is for a biomass powerhouse and a manufacturing plant for wood pellets to be built in the special
economic zone, but a specific site in the zone has not yet been determined. Land has already been acquired on
behalf of the special economic zone, with acquisition of 43.5% of the planned site for the zone complete and
applications to acquire the remainder of the site currently under way. The planned site of the special economic
zone is owned by Metrobank, but there are a small number of legal and illegal residents living within the site.
2) Future projections (if the project does not go ahead)
Projections assuming the project does not go ahead are shown below.
The usual method for disposing of rice husks and sawdust in the Philippines is to leave them in the open
air until the naturally decompose, and rice mills and sawmills in Butuan City mostly dispose of them by
piling them outside.
As there are currently no national or regional regulations or requirements on the method of disposal, it is
assumed that there will be no change.
Discarding rice husks and sawdust in the open air causes the production of methane as they rot, making
them a source of greenhouse gases.
If a thermal power station using fossil fuels to generate power were built and operated instead of this
project, there would be a greater impact on the surrounding environment and increased emissions of
greenhouse gases.
Taguibo Watershed
Protected Area
Planned site of
the project
c. 6.5km
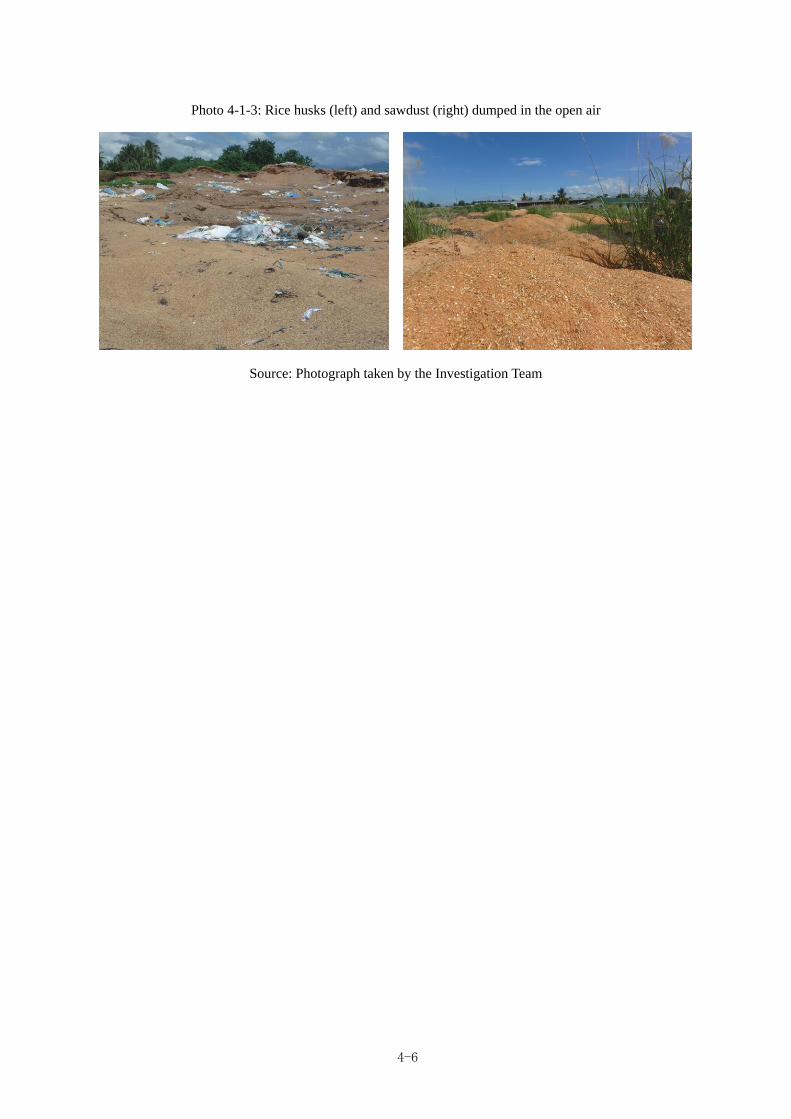
4-6
Photo 4-1-3: Rice husks (left) and sawdust (right) dumped in the open air
Source: Photograph taken by the Investigation Team
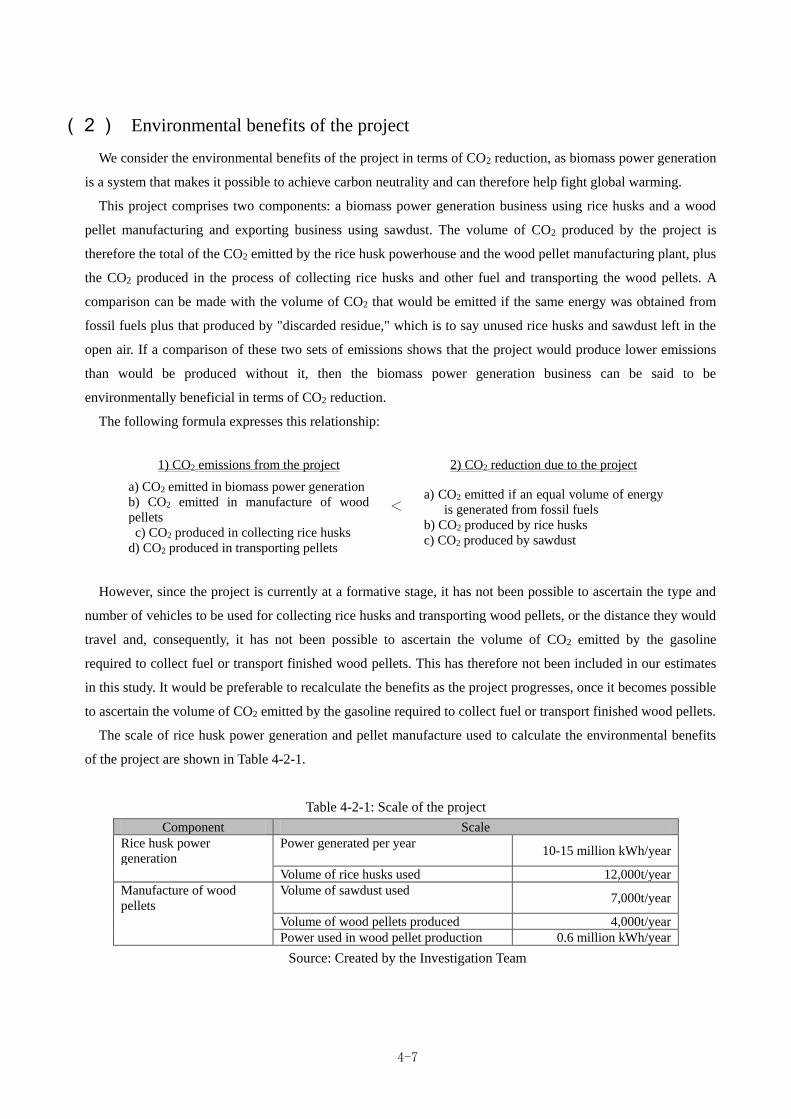
4-7
(2) Environmental benefits of the project
We consider the environmental benefits of the project in terms of CO2 reduction, as biomass power generation
is a system that makes it possible to achieve carbon neutrality and can therefore help fight global warming.
This project comprises two components: a biomass power generation business using rice husks and a wood
pellet manufacturing and exporting business using sawdust. The volume of CO2 produced by the project is
therefore the total of the CO2 emitted by the rice husk powerhouse and the wood pellet manufacturing plant, plus
the CO2 produced in the process of collecting rice husks and other fuel and transporting the wood pellets. A
comparison can be made with the volume of CO2 that would be emitted if the same energy was obtained from
fossil fuels plus that produced by "discarded residue," which is to say unused rice husks and sawdust left in the
open air. If a comparison of these two sets of emissions shows that the project would produce lower emissions
than would be produced without it, then the biomass power generation business can be said to be
environmentally beneficial in terms of CO2 reduction.
The following formula expresses this relationship:
1) CO2 emissions from the project
<
2) CO2 reduction due to the project
a) CO2 emitted in biomass power generation a) CO2 emitted if an equal volume of energy
is generated from fossil fuels
b) CO2 produced by rice husks
c) CO2 produced by sawdust
b) CO2 emitted in manufacture of wood
pellets
c) CO2 produced in collecting rice husks
d) CO2 produced in transporting pellets
However, since the project is currently at a formative stage, it has not been possible to ascertain the type and
number of vehicles to be used for collecting rice husks and transporting wood pellets, or the distance they would
travel and, consequently, it has not been possible to ascertain the volume of CO2 emitted by the gasoline
required to collect fuel or transport finished wood pellets. This has therefore not been included in our estimates
in this study. It would be preferable to recalculate the benefits as the project progresses, once it becomes possible
to ascertain the volume of CO2 emitted by the gasoline required to collect fuel or transport finished wood pellets.
The scale of rice husk power generation and pellet manufacture used to calculate the environmental benefits
of the project are shown in Table 4-2-1.
Table 4-2-1: Scale of the project
Component Scale
Rice husk power
generation
Power generated per year 10-15 million kWh/year
Volume of rice husks used 12,000t/year
Manufacture of wood
pellets
Volume of sawdust used 7,000t/year
Volume of wood pellets produced 4,000t/year
Power used in wood pellet production 0.6 million kWh/year
Source: Created by the Investigation Team
4-8
1) CO2 emissions from the project
a) CO2 emitted in biomass power generation
As all of the energy requirements of the biomass powerhouse can be met from the power generated on-site,
the annual emissions of CO2 at the facility would be 0t-CO2 per year.
b) CO2 emitted in manufacture of wood pellets
As the power used in the manufacture of wood pellets could not be provided by biomass generation, power
generated elsewhere in the Philippines would be used. The power consumed in the manufacture of wood pellets
would be 0.6 million kWh per year. The volume of CO2 emitted in the manufacture of wood pellets is calculated
as the emissions from diesel generation of the equivalent quantity of power.
The calculation is as follows:
Annual CO2 emissions = volume of fuel used* x 38.2GJ/ton (calorific value per unit of fuel used)
x 0.0187ton-C/GJ (carbon emissions per unit of calorific value) x 44 (molecular weight of
CO2)
/12 (atomic weight of carbon)
[Ref: Article 6 Paragraph 1-1 of the Ordinance, Article 2 and Appendix 1 of the Calculation Ordinance]
* The diesel generation is assumed to use gasoline, the quantity of which is calculated as follows:
Annual volume of gasoline used (tons) = power generated per year (MWh) x conversion coefficient for
calorific value (9.0GJ/MWh)
x inverse of the calorific value of gasoline (0.02193ton/GJ)
= 600 MWh × 0.19737ton/MWh
= 118.422ton
Annual CO2 emissions = 118.422ton x 38.2GJ/t x 0.0187ton-C/GJ x 44/12
= 310.2ton-CO2
Therefore, the expected annual volume of CO2 emissions from the manufacture of wood pellets is
310.2ton-CO2.
c) CO2 produced in collecting rice husks and sawdust
The volume of CO2 produced in collecting rice husks and sawdust is calculated as the volume of CO2 emitted
in the use of motor vehicles. The most accurate way to calculate this would be to use the fuel method, which
derives the volume of emissions from the volume of fuel used, but, as it is difficult to obtain data on fuel use, the
calculation must use either the distance transported and fuel costs or ton-kilometers.
The formula for calculating the volume of CO2 emitted in collecting rice husks is as follows:
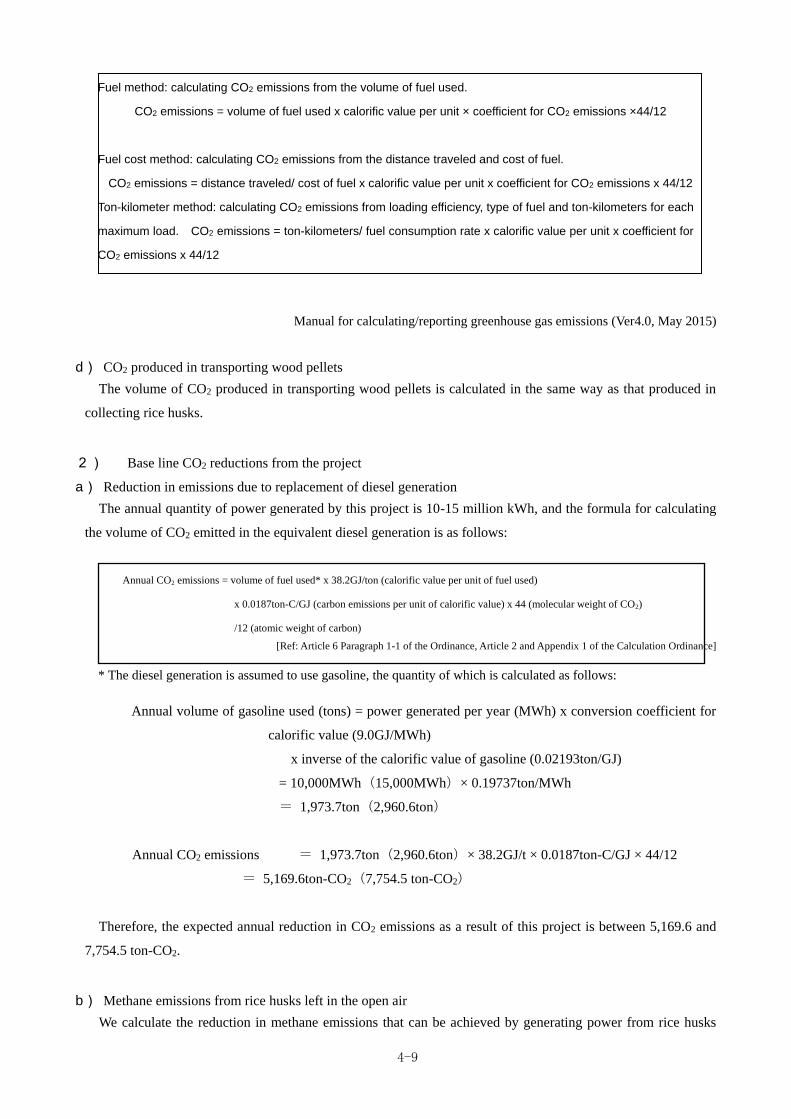
4-9
Manual for calculating/reporting greenhouse gas emissions (Ver4.0, May 2015)
d) CO2 produced in transporting wood pellets
The volume of CO2 produced in transporting wood pellets is calculated in the same way as that produced in
collecting rice husks.
2) Base line CO2 reductions from the project
a) Reduction in emissions due to replacement of diesel generation
The annual quantity of power generated by this project is 10-15 million kWh, and the formula for calculating
the volume of CO2 emitted in the equivalent diesel generation is as follows:
Annual CO2 emissions = volume of fuel used* x 38.2GJ/ton (calorific value per unit of fuel used)
x 0.0187ton-C/GJ (carbon emissions per unit of calorific value) x 44 (molecular weight of CO2)
/12 (atomic weight of carbon)
[Ref: Article 6 Paragraph 1-1 of the Ordinance, Article 2 and Appendix 1 of the Calculation Ordinance]
* The diesel generation is assumed to use gasoline, the quantity of which is calculated as follows:
Annual volume of gasoline used (tons) = power generated per year (MWh) x conversion coefficient for
calorific value (9.0GJ/MWh)
x inverse of the calorific value of gasoline (0.02193ton/GJ)
= 10,000MWh(15,000MWh)× 0.19737ton/MWh
= 1,973.7ton(2,960.6ton)
Annual CO2 emissions = 1,973.7ton(2,960.6ton)× 38.2GJ/t × 0.0187ton-C/GJ × 44/12
= 5,169.6ton-CO2(7,754.5 ton-CO2)
Therefore, the expected annual reduction in CO2 emissions as a result of this project is between 5,169.6 and
7,754.5 ton-CO2.
b) Methane emissions from rice husks left in the open air
We calculate the reduction in methane emissions that can be achieved by generating power from rice husks
Fuel method: calculating CO2 emissions from the volume of fuel used.
CO2 emissions = volume of fuel used x calorific value per unit × coefficient for CO2 emissions ×44/12
Fuel cost method: calculating CO2 emissions from the distance traveled and cost of fuel.
CO2 emissions = distance traveled/ cost of fuel x calorific value per unit x coefficient for CO2 emissions x 44/12
Ton-kilometer method: calculating CO2 emissions from loading efficiency, type of fuel and ton-kilometers for each
maximum load. CO2 emissions = ton-kilometers/ fuel consumption rate x calorific value per unit x coefficient for
CO2 emissions x 44/12
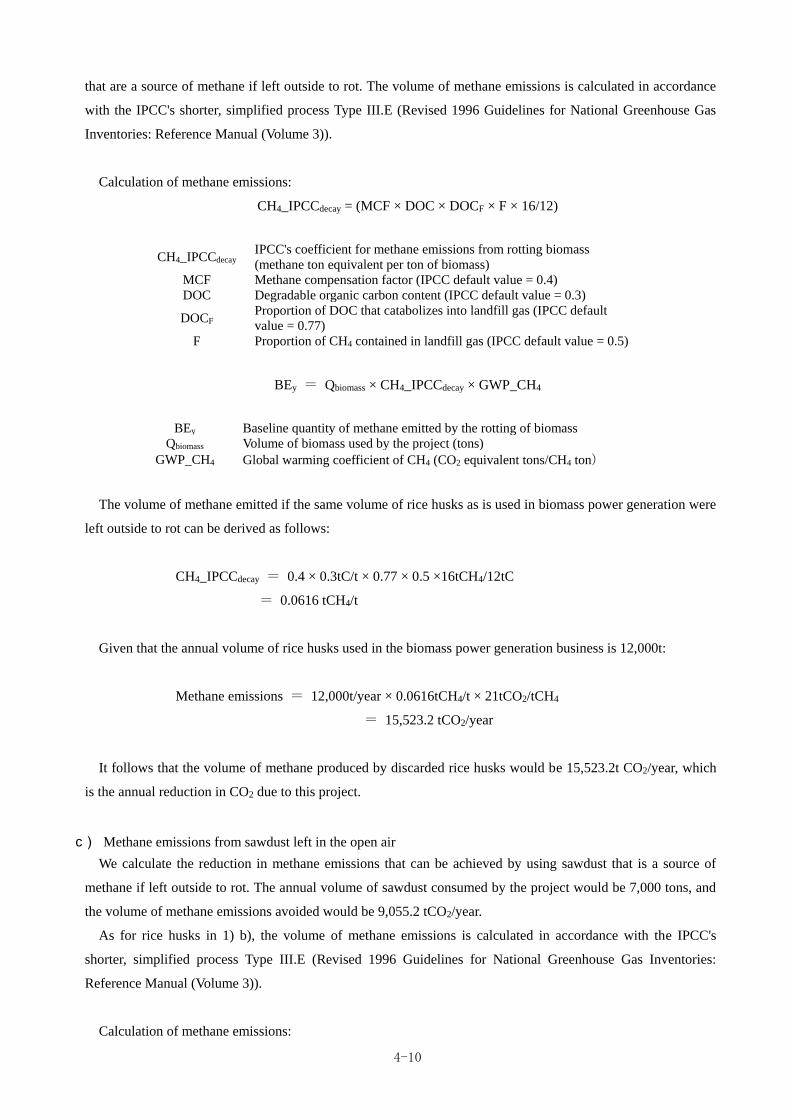
4-10
that are a source of methane if left outside to rot. The volume of methane emissions is calculated in accordance
with the IPCC's shorter, simplified process Type III.E (Revised 1996 Guidelines for National Greenhouse Gas
Inventories: Reference Manual (Volume 3)).
Calculation of methane emissions:
CH4_IPCCdecay = (MCF × DOC × DOCF × F × 16/12)
CH4_IPCCdecay IPCC's coefficient for methane emissions from rotting biomass
(methane ton equivalent per ton of biomass)
MCF Methane compensation factor (IPCC default value = 0.4)
DOC Degradable organic carbon content (IPCC default value = 0.3)
DOCF Proportion of DOC that catabolizes into landfill gas (IPCC default
value = 0.77)
F Proportion of CH4 contained in landfill gas (IPCC default value = 0.5)
BEy = Qbiomass × CH4_IPCCdecay × GWP_CH4
BEy Baseline quantity of methane emitted by the rotting of biomass
Qbiomass Volume of biomass used by the project (tons)
GWP_CH4 Global warming coefficient of CH4 (CO2 equivalent tons/CH4 ton)
The volume of methane emitted if the same volume of rice husks as is used in biomass power generation were
left outside to rot can be derived as follows:
CH4_IPCCdecay = 0.4 × 0.3tC/t × 0.77 × 0.5 ×16tCH4/12tC
= 0.0616 tCH4/t
Given that the annual volume of rice husks used in the biomass power generation business is 12,000t:
Methane emissions = 12,000t/year × 0.0616tCH4/t × 21tCO2/tCH4
= 15,523.2 tCO2/year
It follows that the volume of methane produced by discarded rice husks would be 15,523.2t CO2/year, which
is the annual reduction in CO2 due to this project.
c) Methane emissions from sawdust left in the open air
We calculate the reduction in methane emissions that can be achieved by using sawdust that is a source of
methane if left outside to rot. The annual volume of sawdust consumed by the project would be 7,000 tons, and
the volume of methane emissions avoided would be 9,055.2 tCO2/year.
As for rice husks in 1) b), the volume of methane emissions is calculated in accordance with the IPCC's
shorter, simplified process Type III.E (Revised 1996 Guidelines for National Greenhouse Gas Inventories:
Reference Manual (Volume 3)).
Calculation of methane emissions:
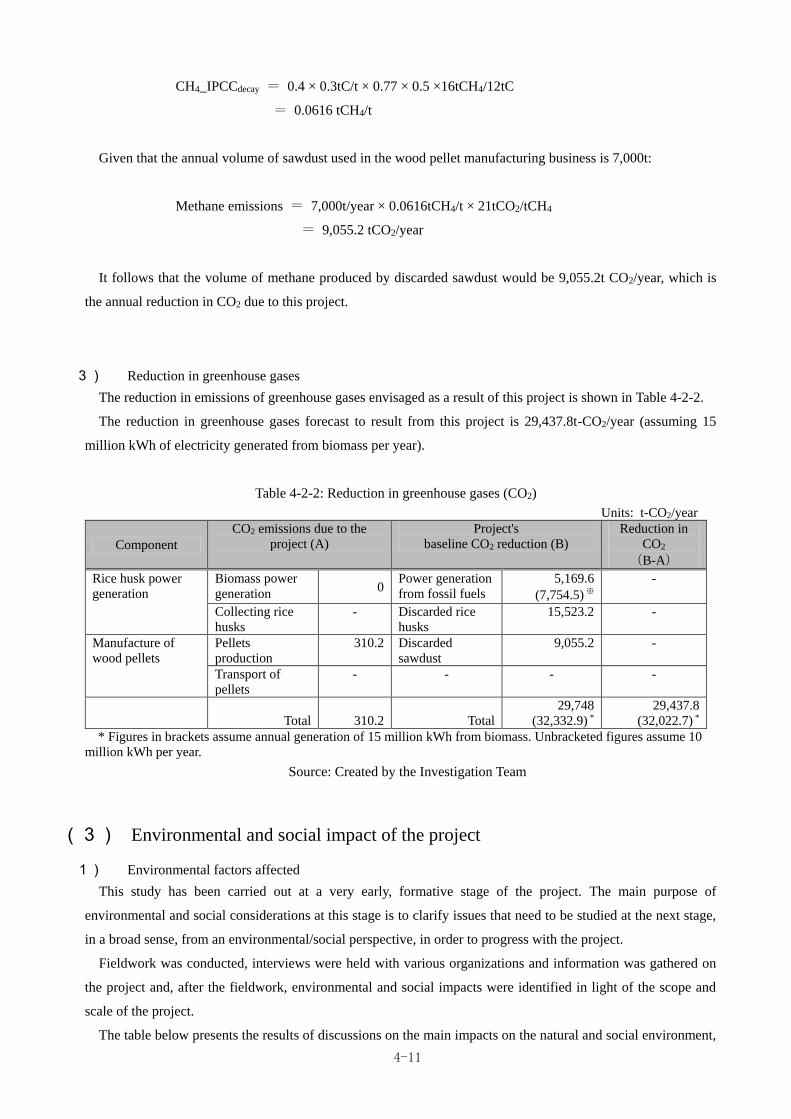
4-11
CH4_IPCCdecay = 0.4 × 0.3tC/t × 0.77 × 0.5 ×16tCH4/12tC
= 0.0616 tCH4/t
Given that the annual volume of sawdust used in the wood pellet manufacturing business is 7,000t:
Methane emissions = 7,000t/year × 0.0616tCH4/t × 21tCO2/tCH4
= 9,055.2 tCO2/year
It follows that the volume of methane produced by discarded sawdust would be 9,055.2t CO2/year, which is
the annual reduction in CO2 due to this project.
3) Reduction in greenhouse gases
The reduction in emissions of greenhouse gases envisaged as a result of this project is shown in Table 4-2-2.
The reduction in greenhouse gases forecast to result from this project is 29,437.8t-CO2/year (assuming 15
million kWh of electricity generated from biomass per year).
Table 4-2-2: Reduction in greenhouse gases (CO2)
Units: t-CO2/year
Component
CO2 emissions due to the
project (A)
Project's
baseline CO2 reduction (B)
Reduction in
CO2
(B-A)
Rice husk power
generation
Biomass power
generation 0
Power generation
from fossil fuels
5,169.6
(7,754.5) ※
-
Collecting rice
husks
- Discarded rice
husks
15,523.2 -
Manufacture of
wood pellets
Pellets
production
310.2 Discarded
sawdust
9,055.2 -
Transport of
pellets
- - - -
Total 310.2 Total
29,748
(32,332.9) *
29,437.8
(32,022.7) *
* Figures in brackets assume annual generation of 15 million kWh from biomass. Unbracketed figures assume 10
million kWh per year.
Source: Created by the Investigation Team
(3) Environmental and social impact of the project
1) Environmental factors affected
This study has been carried out at a very early, formative stage of the project. The main purpose of
environmental and social considerations at this stage is to clarify issues that need to be studied at the next stage,
in a broad sense, from an environmental/social perspective, in order to progress with the project.
Fieldwork was conducted, interviews were held with various organizations and information was gathered on
the project and, after the fieldwork, environmental and social impacts were identified in light of the scope and
scale of the project.
The table below presents the results of discussions on the main impacts on the natural and social environment,
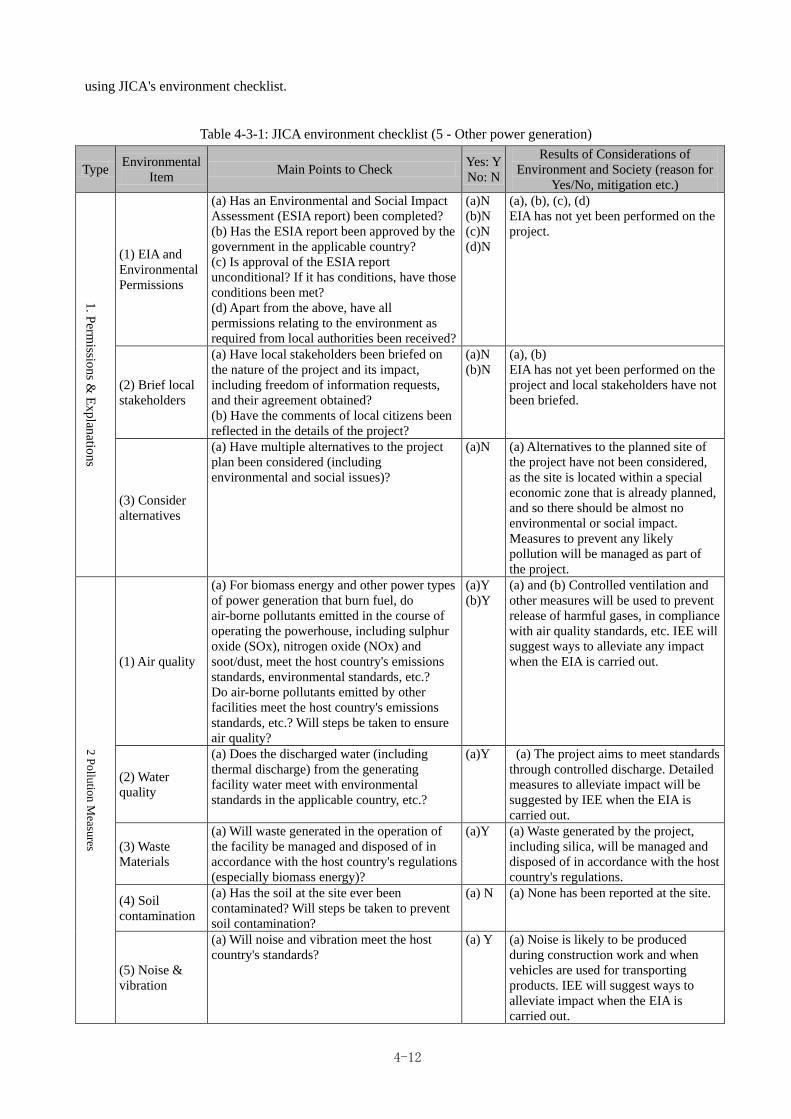
4-12
using JICA's environment checklist.
Table 4-3-1: JICA environment checklist (5 - Other power generation)
Type Environmental
Item Main Points to Check
Yes: Y
No: N
Results of Considerations of
Environment and Society (reason for
Yes/No, mitigation etc.)
1. P
ermissio
ns &
Ex
plan
ation
s
(1) EIA and
Environmental
Permissions
(a) Has an Environmental and Social Impact
Assessment (ESIA report) been completed?
(b) Has the ESIA report been approved by the
government in the applicable country?
(c) Is approval of the ESIA report
unconditional? If it has conditions, have those
conditions been met?
(d) Apart from the above, have all
permissions relating to the environment as
required from local authorities been received?
(a)N
(b)N
(c)N
(d)N
(a), (b), (c), (d)
EIA has not yet been performed on the
project.
(2) Brief local
stakeholders
(a) Have local stakeholders been briefed on
the nature of the project and its impact,
including freedom of information requests,
and their agreement obtained?
(b) Have the comments of local citizens been
reflected in the details of the project?
(a)N
(b)N
(a), (b)
EIA has not yet been performed on the
project and local stakeholders have not
been briefed.
(3) Consider
alternatives
(a) Have multiple alternatives to the project
plan been considered (including
environmental and social issues)?
(a)N (a) Alternatives to the planned site of
the project have not been considered,
as the site is located within a special
economic zone that is already planned,
and so there should be almost no
environmental or social impact.
Measures to prevent any likely
pollution will be managed as part of
the project.
2 P
ollu
tion M
easures
(1) Air quality
(a) For biomass energy and other power types
of power generation that burn fuel, do
air-borne pollutants emitted in the course of
operating the powerhouse, including sulphur
oxide (SOx), nitrogen oxide (NOx) and
soot/dust, meet the host country's emissions
standards, environmental standards, etc.?
Do air-borne pollutants emitted by other
facilities meet the host country's emissions
standards, etc.? Will steps be taken to ensure
air quality?
(a)Y
(b)Y
(a) and (b) Controlled ventilation and
other measures will be used to prevent
release of harmful gases, in compliance
with air quality standards, etc. IEE will
suggest ways to alleviate any impact
when the EIA is carried out.
(2) Water
quality
(a) Does the discharged water (including
thermal discharge) from the generating
facility water meet with environmental
standards in the applicable country, etc.?
(a)Y
(a) The project aims to meet standards
through controlled discharge. Detailed
measures to alleviate impact will be
suggested by IEE when the EIA is
carried out.
(3) Waste
Materials
(a) Will waste generated in the operation of
the facility be managed and disposed of in
accordance with the host country's regulations
(especially biomass energy)?
(a)Y (a) Waste generated by the project,
including silica, will be managed and
disposed of in accordance with the host
country's regulations.
(4) Soil
contamination
(a) Has the soil at the site ever been
contaminated? Will steps be taken to prevent
soil contamination?
(a) N (a) None has been reported at the site.
(5) Noise &
vibration
(a) Will noise and vibration meet the host
country's standards?
(a) Y (a) Noise is likely to be produced
during construction work and when
vehicles are used for transporting
products. IEE will suggest ways to
alleviate impact when the EIA is
carried out.
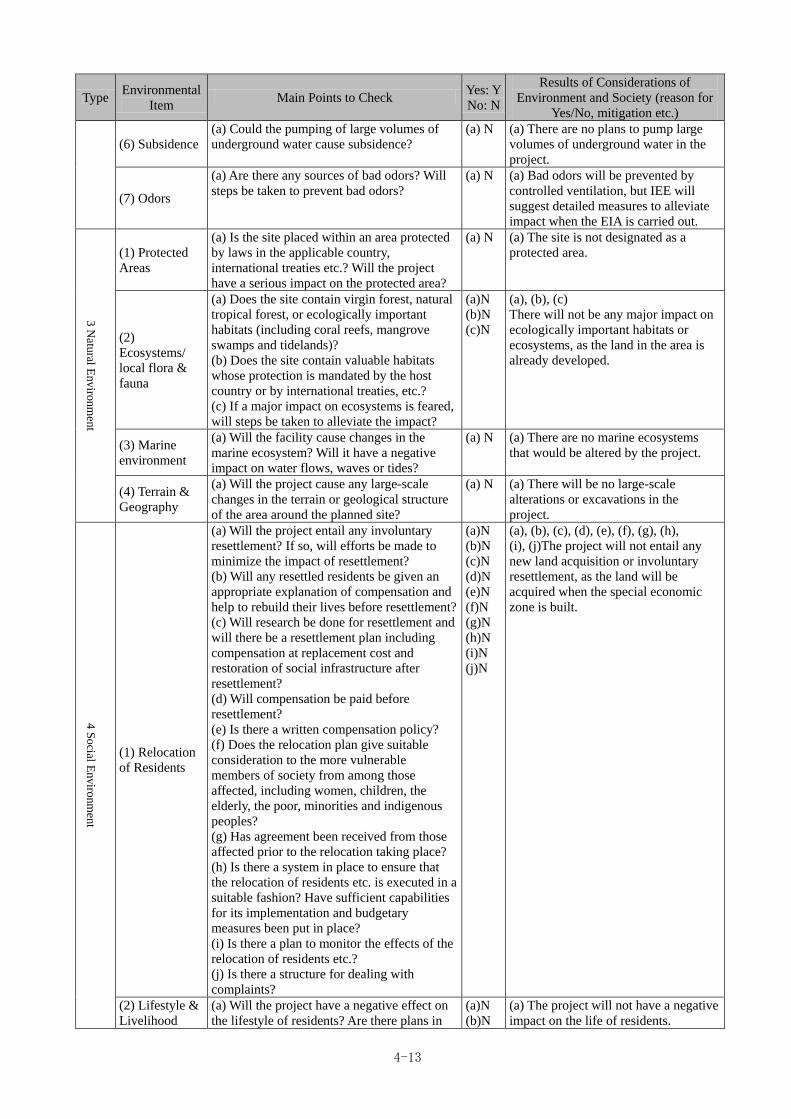
4-13
Type Environmental
Item Main Points to Check
Yes: Y
No: N
Results of Considerations of
Environment and Society (reason for
Yes/No, mitigation etc.)
(6) Subsidence
(a) Could the pumping of large volumes of
underground water cause subsidence?
(a) N (a) There are no plans to pump large
volumes of underground water in the
project.
(7) Odors
(a) Are there any sources of bad odors? Will
steps be taken to prevent bad odors?
(a) N (a) Bad odors will be prevented by
controlled ventilation, but IEE will
suggest detailed measures to alleviate
impact when the EIA is carried out.
3 N
atural E
nviro
nm
ent
(1) Protected
Areas
(a) Is the site placed within an area protected
by laws in the applicable country,
international treaties etc.? Will the project
have a serious impact on the protected area?
(a) N (a) The site is not designated as a
protected area.
(2)
Ecosystems/
local flora &
fauna
(a) Does the site contain virgin forest, natural
tropical forest, or ecologically important
habitats (including coral reefs, mangrove
swamps and tidelands)?
(b) Does the site contain valuable habitats
whose protection is mandated by the host
country or by international treaties, etc.?
(c) If a major impact on ecosystems is feared,
will steps be taken to alleviate the impact?
(a)N
(b)N
(c)N
(a), (b), (c)
There will not be any major impact on
ecologically important habitats or
ecosystems, as the land in the area is
already developed.
(3) Marine
environment
(a) Will the facility cause changes in the
marine ecosystem? Will it have a negative
impact on water flows, waves or tides?
(a) N (a) There are no marine ecosystems
that would be altered by the project.
(4) Terrain &
Geography
(a) Will the project cause any large-scale
changes in the terrain or geological structure
of the area around the planned site?
(a) N (a) There will be no large-scale
alterations or excavations in the
project.
4 S
ocial E
nviro
nm
ent
(1) Relocation
of Residents
(a) Will the project entail any involuntary
resettlement? If so, will efforts be made to
minimize the impact of resettlement?
(b) Will any resettled residents be given an
appropriate explanation of compensation and
help to rebuild their lives before resettlement?
(c) Will research be done for resettlement and
will there be a resettlement plan including
compensation at replacement cost and
restoration of social infrastructure after
resettlement?
(d) Will compensation be paid before
resettlement?
(e) Is there a written compensation policy?
(f) Does the relocation plan give suitable
consideration to the more vulnerable
members of society from among those
affected, including women, children, the
elderly, the poor, minorities and indigenous
peoples?
(g) Has agreement been received from those
affected prior to the relocation taking place?
(h) Is there a system in place to ensure that
the relocation of residents etc. is executed in a
suitable fashion? Have sufficient capabilities
for its implementation and budgetary
measures been put in place?
(i) Is there a plan to monitor the effects of the
relocation of residents etc.?
(j) Is there a structure for dealing with
complaints?
(a)N
(b)N
(c)N
(d)N
(e)N
(f)N
(g)N
(h)N
(i)N
(j)N
(a), (b), (c), (d), (e), (f), (g), (h),
(i), (j)The project will not entail any
new land acquisition or involuntary
resettlement, as the land will be
acquired when the special economic
zone is built.
(2) Lifestyle &
Livelihood
(a) Will the project have a negative effect on
the lifestyle of residents? Are there plans in
(a)N
(b)N
(a) The project will not have a negative
impact on the life of residents.
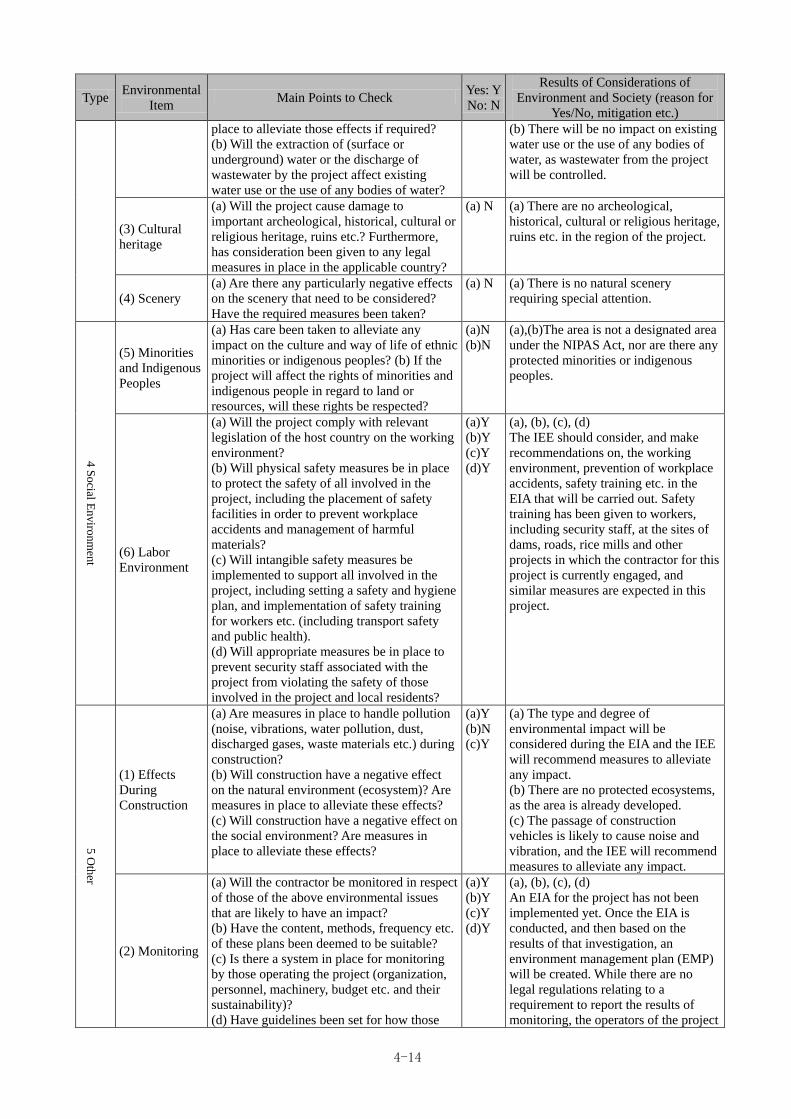
4-14
Type Environmental
Item Main Points to Check
Yes: Y
No: N
Results of Considerations of
Environment and Society (reason for
Yes/No, mitigation etc.)
place to alleviate those effects if required?
(b) Will the extraction of (surface or
underground) water or the discharge of
wastewater by the project affect existing
water use or the use of any bodies of water?
(b) There will be no impact on existing
water use or the use of any bodies of
water, as wastewater from the project
will be controlled.
(3) Cultural
heritage
(a) Will the project cause damage to
important archeological, historical, cultural or
religious heritage, ruins etc.? Furthermore,
has consideration been given to any legal
measures in place in the applicable country?
(a) N (a) There are no archeological,
historical, cultural or religious heritage,
ruins etc. in the region of the project.
(4) Scenery
(a) Are there any particularly negative effects
on the scenery that need to be considered?
Have the required measures been taken?
(a) N (a) There is no natural scenery
requiring special attention.
4 S
ocial E
nviro
nm
ent
(5) Minorities
and Indigenous
Peoples
(a) Has care been taken to alleviate any
impact on the culture and way of life of ethnic
minorities or indigenous peoples? (b) If the
project will affect the rights of minorities and
indigenous people in regard to land or
resources, will these rights be respected?
(a)N
(b)N
(a),(b)The area is not a designated area
under the NIPAS Act, nor are there any
protected minorities or indigenous
peoples.
(6) Labor
Environment
(a) Will the project comply with relevant
legislation of the host country on the working
environment?
(b) Will physical safety measures be in place
to protect the safety of all involved in the
project, including the placement of safety
facilities in order to prevent workplace
accidents and management of harmful
materials?
(c) Will intangible safety measures be
implemented to support all involved in the
project, including setting a safety and hygiene
plan, and implementation of safety training
for workers etc. (including transport safety
and public health).
(d) Will appropriate measures be in place to
prevent security staff associated with the
project from violating the safety of those
involved in the project and local residents?
(a)Y
(b)Y
(c)Y
(d)Y
(a), (b), (c), (d)
The IEE should consider, and make
recommendations on, the working
environment, prevention of workplace
accidents, safety training etc. in the
EIA that will be carried out. Safety
training has been given to workers,
including security staff, at the sites of
dams, roads, rice mills and other
projects in which the contractor for this
project is currently engaged, and
similar measures are expected in this
project.
5 O
ther
(1) Effects
During
Construction
(a) Are measures in place to handle pollution
(noise, vibrations, water pollution, dust,
discharged gases, waste materials etc.) during
construction?
(b) Will construction have a negative effect
on the natural environment (ecosystem)? Are
measures in place to alleviate these effects?
(c) Will construction have a negative effect on
the social environment? Are measures in
place to alleviate these effects?
(a)Y
(b)N
(c)Y
(a) The type and degree of
environmental impact will be
considered during the EIA and the IEE
will recommend measures to alleviate
any impact.
(b) There are no protected ecosystems,
as the area is already developed.
(c) The passage of construction
vehicles is likely to cause noise and
vibration, and the IEE will recommend
measures to alleviate any impact.
(2) Monitoring
(a) Will the contractor be monitored in respect
of those of the above environmental issues
that are likely to have an impact?
(b) Have the content, methods, frequency etc.
of these plans been deemed to be suitable?
(c) Is there a system in place for monitoring
by those operating the project (organization,
personnel, machinery, budget etc. and their
sustainability)?
(d) Have guidelines been set for how those
(a)Y
(b)Y
(c)Y
(d)Y
(a), (b), (c), (d)
An EIA for the project has not been
implemented yet. Once the EIA is
conducted, and then based on the
results of that investigation, an
environment management plan (EMP)
will be created. While there are no
legal regulations relating to a
requirement to report the results of
monitoring, the operators of the project
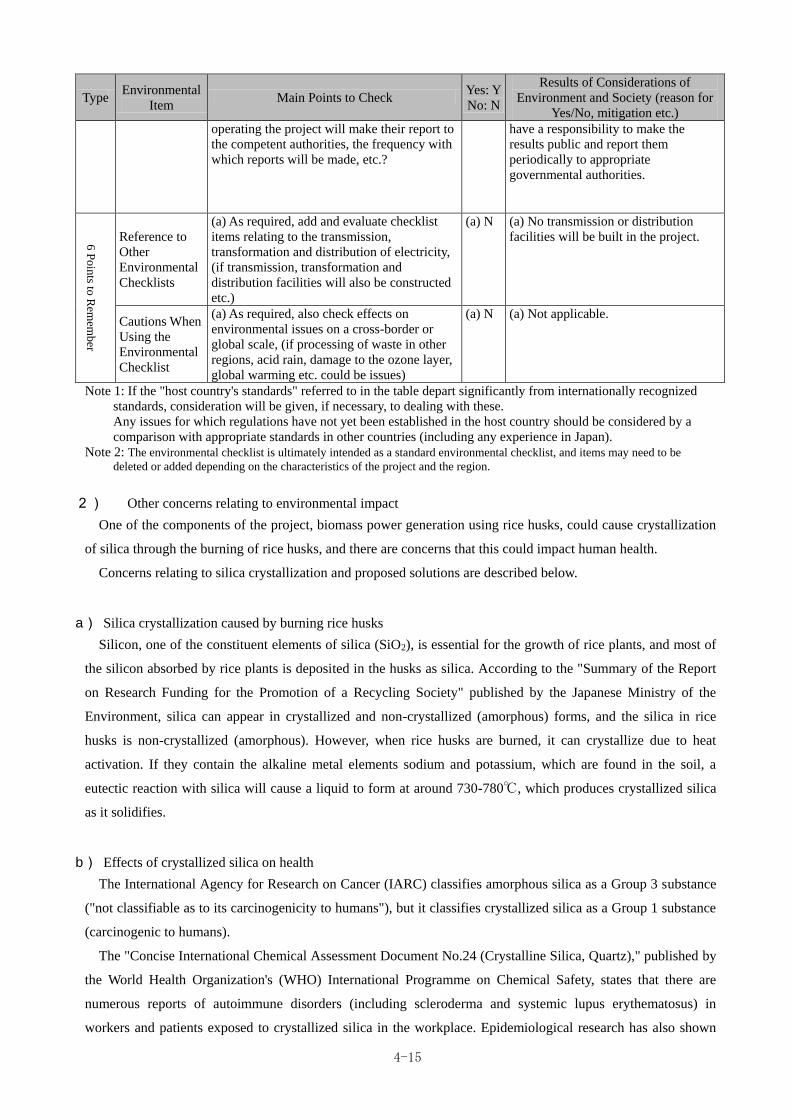
4-15
Type Environmental
Item Main Points to Check
Yes: Y
No: N
Results of Considerations of
Environment and Society (reason for
Yes/No, mitigation etc.)
operating the project will make their report to
the competent authorities, the frequency with
which reports will be made, etc.?
have a responsibility to make the
results public and report them
periodically to appropriate
governmental authorities.
6 P
oin
ts to R
emem
ber
Reference to
Other
Environmental
Checklists
(a) As required, add and evaluate checklist
items relating to the transmission,
transformation and distribution of electricity,
(if transmission, transformation and
distribution facilities will also be constructed
etc.)
(a) N (a) No transmission or distribution
facilities will be built in the project.
Cautions When
Using the
Environmental
Checklist
(a) As required, also check effects on
environmental issues on a cross-border or
global scale, (if processing of waste in other
regions, acid rain, damage to the ozone layer,
global warming etc. could be issues)
(a) N (a) Not applicable.
Note 1: If the "host country's standards" referred to in the table depart significantly from internationally recognized
standards, consideration will be given, if necessary, to dealing with these.
Any issues for which regulations have not yet been established in the host country should be considered by a
comparison with appropriate standards in other countries (including any experience in Japan).
Note 2: The environmental checklist is ultimately intended as a standard environmental checklist, and items may need to be
deleted or added depending on the characteristics of the project and the region.
2) Other concerns relating to environmental impact
One of the components of the project, biomass power generation using rice husks, could cause crystallization
of silica through the burning of rice husks, and there are concerns that this could impact human health.
Concerns relating to silica crystallization and proposed solutions are described below.
a) Silica crystallization caused by burning rice husks
Silicon, one of the constituent elements of silica (SiO2), is essential for the growth of rice plants, and most of
the silicon absorbed by rice plants is deposited in the husks as silica. According to the "Summary of the Report
on Research Funding for the Promotion of a Recycling Society" published by the Japanese Ministry of the
Environment, silica can appear in crystallized and non-crystallized (amorphous) forms, and the silica in rice
husks is non-crystallized (amorphous). However, when rice husks are burned, it can crystallize due to heat
activation. If they contain the alkaline metal elements sodium and potassium, which are found in the soil, a
eutectic reaction with silica will cause a liquid to form at around 730-780℃, which produces crystallized silica
as it solidifies.
b) Effects of crystallized silica on health
The International Agency for Research on Cancer (IARC) classifies amorphous silica as a Group 3 substance
("not classifiable as to its carcinogenicity to humans"), but it classifies crystallized silica as a Group 1 substance
(carcinogenic to humans).
The "Concise International Chemical Assessment Document No.24 (Crystalline Silica, Quartz)," published by
the World Health Organization's (WHO) International Programme on Chemical Safety, states that there are
numerous reports of autoimmune disorders (including scleroderma and systemic lupus erythematosus) in
workers and patients exposed to crystallized silica in the workplace. Epidemiological research has also shown
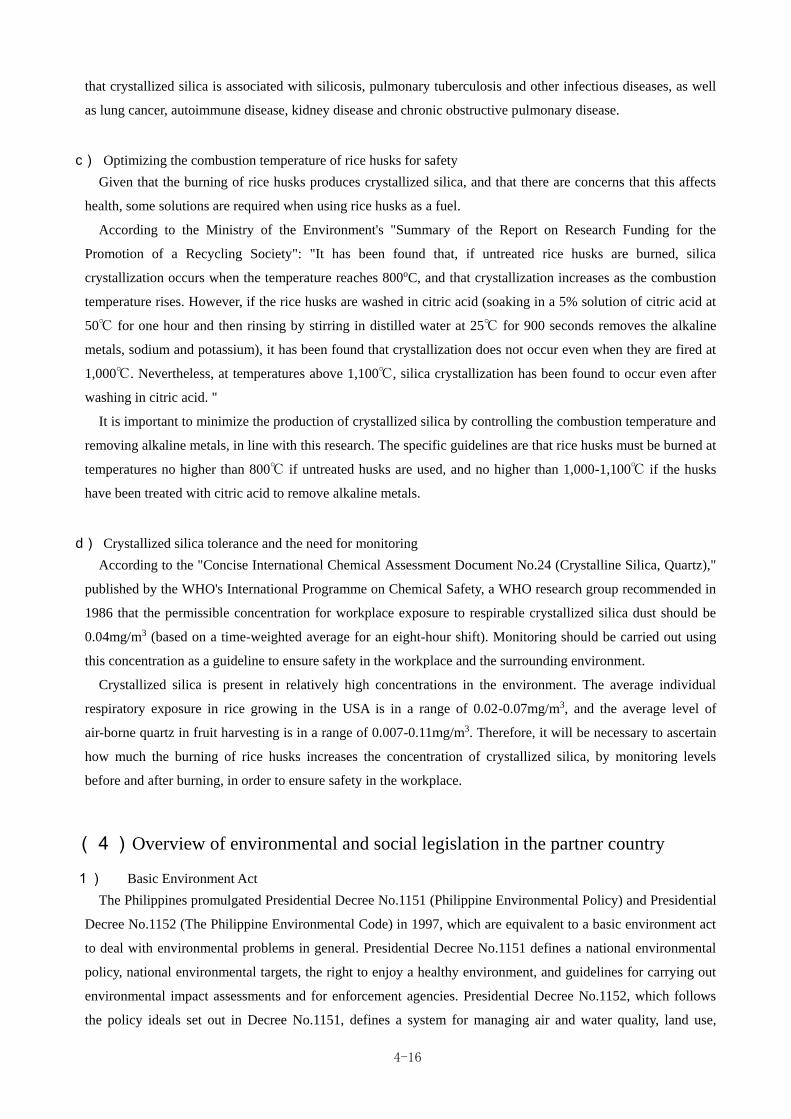
4-16
that crystallized silica is associated with silicosis, pulmonary tuberculosis and other infectious diseases, as well
as lung cancer, autoimmune disease, kidney disease and chronic obstructive pulmonary disease.
c) Optimizing the combustion temperature of rice husks for safety
Given that the burning of rice husks produces crystallized silica, and that there are concerns that this affects
health, some solutions are required when using rice husks as a fuel.
According to the Ministry of the Environment's "Summary of the Report on Research Funding for the
Promotion of a Recycling Society": "It has been found that, if untreated rice husks are burned, silica
crystallization occurs when the temperature reaches 800oC, and that crystallization increases as the combustion
temperature rises. However, if the rice husks are washed in citric acid (soaking in a 5% solution of citric acid at
50℃ for one hour and then rinsing by stirring in distilled water at 25℃ for 900 seconds removes the alkaline
metals, sodium and potassium), it has been found that crystallization does not occur even when they are fired at
1,000℃. Nevertheless, at temperatures above 1,100℃, silica crystallization has been found to occur even after
washing in citric acid. "
It is important to minimize the production of crystallized silica by controlling the combustion temperature and
removing alkaline metals, in line with this research. The specific guidelines are that rice husks must be burned at
temperatures no higher than 800℃ if untreated husks are used, and no higher than 1,000-1,100℃ if the husks
have been treated with citric acid to remove alkaline metals.
d) Crystallized silica tolerance and the need for monitoring
According to the "Concise International Chemical Assessment Document No.24 (Crystalline Silica, Quartz),"
published by the WHO's International Programme on Chemical Safety, a WHO research group recommended in
1986 that the permissible concentration for workplace exposure to respirable crystallized silica dust should be
0.04mg/m3 (based on a time-weighted average for an eight-hour shift). Monitoring should be carried out using
this concentration as a guideline to ensure safety in the workplace and the surrounding environment.
Crystallized silica is present in relatively high concentrations in the environment. The average individual
respiratory exposure in rice growing in the USA is in a range of 0.02-0.07mg/m3, and the average level of
air-borne quartz in fruit harvesting is in a range of 0.007-0.11mg/m3. Therefore, it will be necessary to ascertain
how much the burning of rice husks increases the concentration of crystallized silica, by monitoring levels
before and after burning, in order to ensure safety in the workplace.
(4) Overview of environmental and social legislation in the partner country
1) Basic Environment Act
The Philippines promulgated Presidential Decree No.1151 (Philippine Environmental Policy) and Presidential
Decree No.1152 (The Philippine Environmental Code) in 1997, which are equivalent to a basic environment act
to deal with environmental problems in general. Presidential Decree No.1151 defines a national environmental
policy, national environmental targets, the right to enjoy a healthy environment, and guidelines for carrying out
environmental impact assessments and for enforcement agencies. Presidential Decree No.1152, which follows
the policy ideals set out in Decree No.1151, defines a system for managing air and water quality, land use,
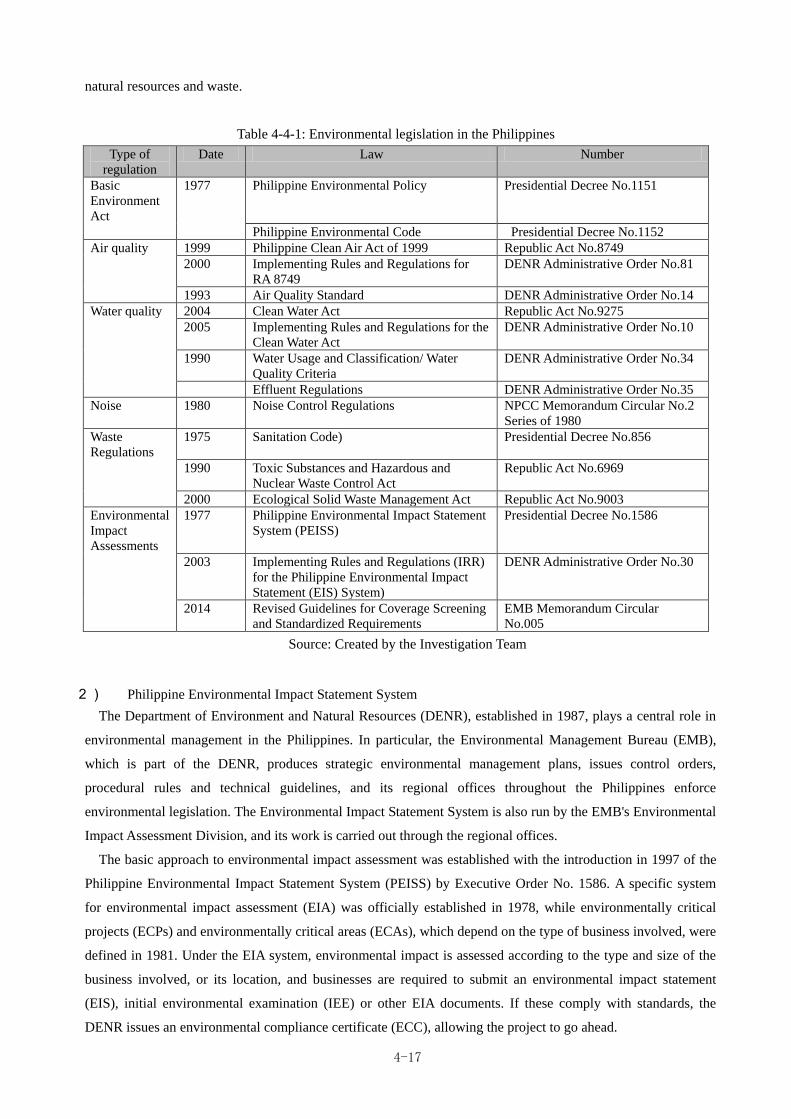
4-17
natural resources and waste.
Table 4-4-1: Environmental legislation in the Philippines
Type of
regulation
Date Law Number
Basic
Environment
Act
1977 Philippine Environmental Policy Presidential Decree No.1151
Philippine Environmental Code Presidential Decree No.1152
Air quality 1999 Philippine Clean Air Act of 1999 Republic Act No.8749
2000 Implementing Rules and Regulations for
RA 8749
DENR Administrative Order No.81
1993 Air Quality Standard DENR Administrative Order No.14
Water quality 2004 Clean Water Act Republic Act No.9275
2005 Implementing Rules and Regulations for the
Clean Water Act
DENR Administrative Order No.10
1990 Water Usage and Classification/ Water
Quality Criteria
DENR Administrative Order No.34
Effluent Regulations DENR Administrative Order No.35
Noise 1980 Noise Control Regulations NPCC Memorandum Circular No.2
Series of 1980
Waste
Regulations
1975 Sanitation Code) Presidential Decree No.856
1990 Toxic Substances and Hazardous and
Nuclear Waste Control Act
Republic Act No.6969
2000 Ecological Solid Waste Management Act Republic Act No.9003
Environmental
Impact
Assessments
1977 Philippine Environmental Impact Statement
System (PEISS)
Presidential Decree No.1586
2003 Implementing Rules and Regulations (IRR)
for the Philippine Environmental Impact
Statement (EIS) System)
DENR Administrative Order No.30
2014 Revised Guidelines for Coverage Screening
and Standardized Requirements
EMB Memorandum Circular
No.005
Source: Created by the Investigation Team
2) Philippine Environmental Impact Statement System
The Department of Environment and Natural Resources (DENR), established in 1987, plays a central role in
environmental management in the Philippines. In particular, the Environmental Management Bureau (EMB),
which is part of the DENR, produces strategic environmental management plans, issues control orders,
procedural rules and technical guidelines, and its regional offices throughout the Philippines enforce
environmental legislation. The Environmental Impact Statement System is also run by the EMB's Environmental
Impact Assessment Division, and its work is carried out through the regional offices.
The basic approach to environmental impact assessment was established with the introduction in 1997 of the
Philippine Environmental Impact Statement System (PEISS) by Executive Order No. 1586. A specific system
for environmental impact assessment (EIA) was officially established in 1978, while environmentally critical
projects (ECPs) and environmentally critical areas (ECAs), which depend on the type of business involved, were
defined in 1981. Under the EIA system, environmental impact is assessed according to the type and size of the
business involved, or its location, and businesses are required to submit an environmental impact statement
(EIS), initial environmental examination (IEE) or other EIA documents. If these comply with standards, the
DENR issues an environmental compliance certificate (ECC), allowing the project to go ahead.
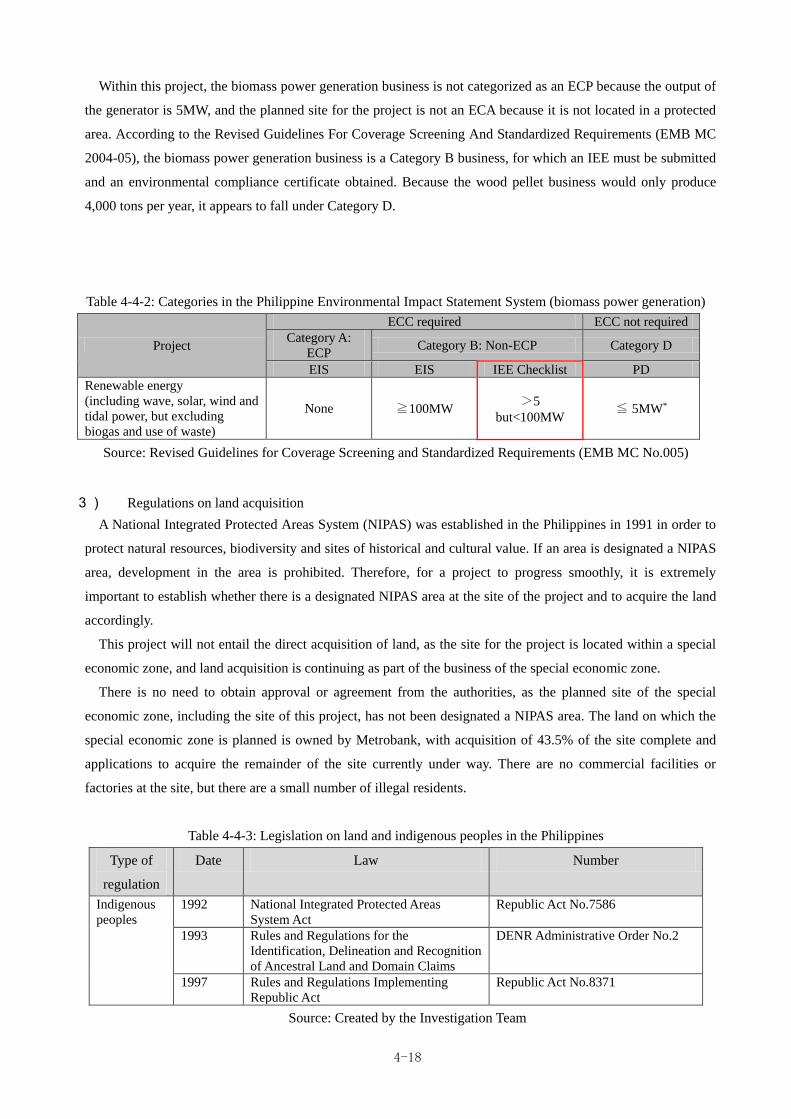
4-18
Within this project, the biomass power generation business is not categorized as an ECP because the output of
the generator is 5MW, and the planned site for the project is not an ECA because it is not located in a protected
area. According to the Revised Guidelines For Coverage Screening And Standardized Requirements (EMB MC
2004-05), the biomass power generation business is a Category B business, for which an IEE must be submitted
and an environmental compliance certificate obtained. Because the wood pellet business would only produce
4,000 tons per year, it appears to fall under Category D.
Table 4-4-2: Categories in the Philippine Environmental Impact Statement System (biomass power generation)
Project
ECC required ECC not required
Category A:
ECP Category B: Non-ECP Category D
EIS EIS IEE Checklist PD
Renewable energy
(including wave, solar, wind and
tidal power, but excluding
biogas and use of waste)
None ≧100MW >5
but<100MW ≦ 5MW*
Source: Revised Guidelines for Coverage Screening and Standardized Requirements (EMB MC No.005)
3) Regulations on land acquisition
A National Integrated Protected Areas System (NIPAS) was established in the Philippines in 1991 in order to
protect natural resources, biodiversity and sites of historical and cultural value. If an area is designated a NIPAS
area, development in the area is prohibited. Therefore, for a project to progress smoothly, it is extremely
important to establish whether there is a designated NIPAS area at the site of the project and to acquire the land
accordingly.
This project will not entail the direct acquisition of land, as the site for the project is located within a special
economic zone, and land acquisition is continuing as part of the business of the special economic zone.
There is no need to obtain approval or agreement from the authorities, as the planned site of the special
economic zone, including the site of this project, has not been designated a NIPAS area. The land on which the
special economic zone is planned is owned by Metrobank, with acquisition of 43.5% of the site complete and
applications to acquire the remainder of the site currently under way. There are no commercial facilities or
factories at the site, but there are a small number of illegal residents.
Table 4-4-3: Legislation on land and indigenous peoples in the Philippines
Type of
regulation
Date Law Number
Indigenous
peoples
1992 National Integrated Protected Areas
System Act
Republic Act No.7586
1993 Rules and Regulations for the
Identification, Delineation and Recognition
of Ancestral Land and Domain Claims
DENR Administrative Order No.2
1997 Rules and Regulations Implementing
Republic Act
Republic Act No.8371
Source: Created by the Investigation Team

4-19
(5) Items for action in the host country for the project to go ahead (by
organizations implementing, or involved in, the project)
This project is still at the outline stage. In terms of environmental issues, the EIA required for an ECC
application, which is necessary for the project to go ahead, has not yet been carried out. To progress with the
project, the contractor will need to deal with the following environmental issues, as well as carrying out the EIA.
Promptly carry out an EIA and produce an IEE for the project, in accordance with the PEISS.
Obtain approval of the IEE and an ECC from the DENR's Environmental Management Bureau.
Chapter 5 Financial & Economic Feasibility
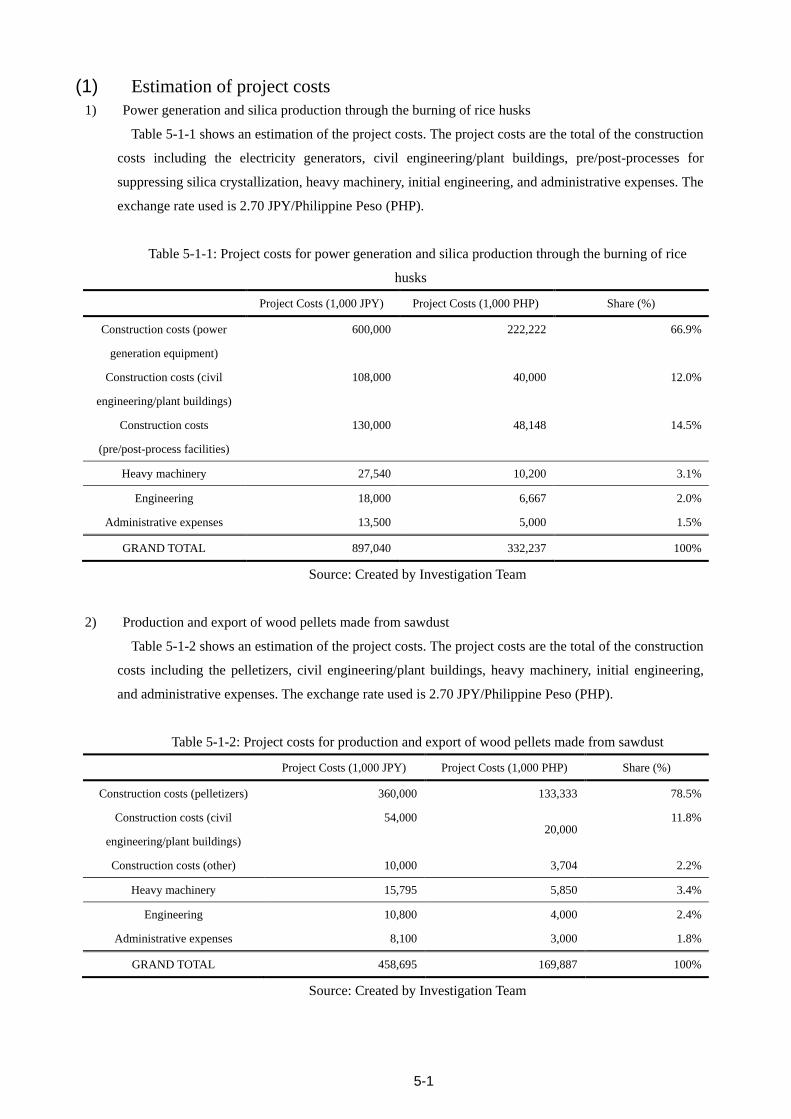
5-1
(1) Estimation of project costs
1) Power generation and silica production through the burning of rice husks
Table 5-1-1 shows an estimation of the project costs. The project costs are the total of the construction
costs including the electricity generators, civil engineering/plant buildings, pre/post-processes for
suppressing silica crystallization, heavy machinery, initial engineering, and administrative expenses. The
exchange rate used is 2.70 JPY/Philippine Peso (PHP).
Table 5-1-1: Project costs for power generation and silica production through the burning of rice
husks
Project Costs (1,000 JPY) Project Costs (1,000 PHP) Share (%)
Construction costs (power
generation equipment)
600,000 222,222 66.9%
Construction costs (civil
engineering/plant buildings)
108,000 40,000 12.0%
Construction costs
(pre/post-process facilities)
130,000 48,148 14.5%
Heavy machinery 27,540 10,200 3.1%
Engineering 18,000 6,667 2.0%
Administrative expenses 13,500 5,000 1.5%
GRAND TOTAL 897,040 332,237 100%
Source: Created by Investigation Team
2) Production and export of wood pellets made from sawdust
Table 5-1-2 shows an estimation of the project costs. The project costs are the total of the construction
costs including the pelletizers, civil engineering/plant buildings, heavy machinery, initial engineering,
and administrative expenses. The exchange rate used is 2.70 JPY/Philippine Peso (PHP).
Table 5-1-2: Project costs for production and export of wood pellets made from sawdust
Project Costs (1,000 JPY) Project Costs (1,000 PHP) Share (%)
Construction costs (pelletizers) 360,000 133,333 78.5%
Construction costs (civil
engineering/plant buildings)
54,000 20,000
11.8%
Construction costs (other) 10,000 3,704 2.2%
Heavy machinery 15,795 5,850 3.4%
Engineering 10,800 4,000 2.4%
Administrative expenses 8,100 3,000 1.8%
GRAND TOTAL 458,695 169,887 100%
Source: Created by Investigation Team
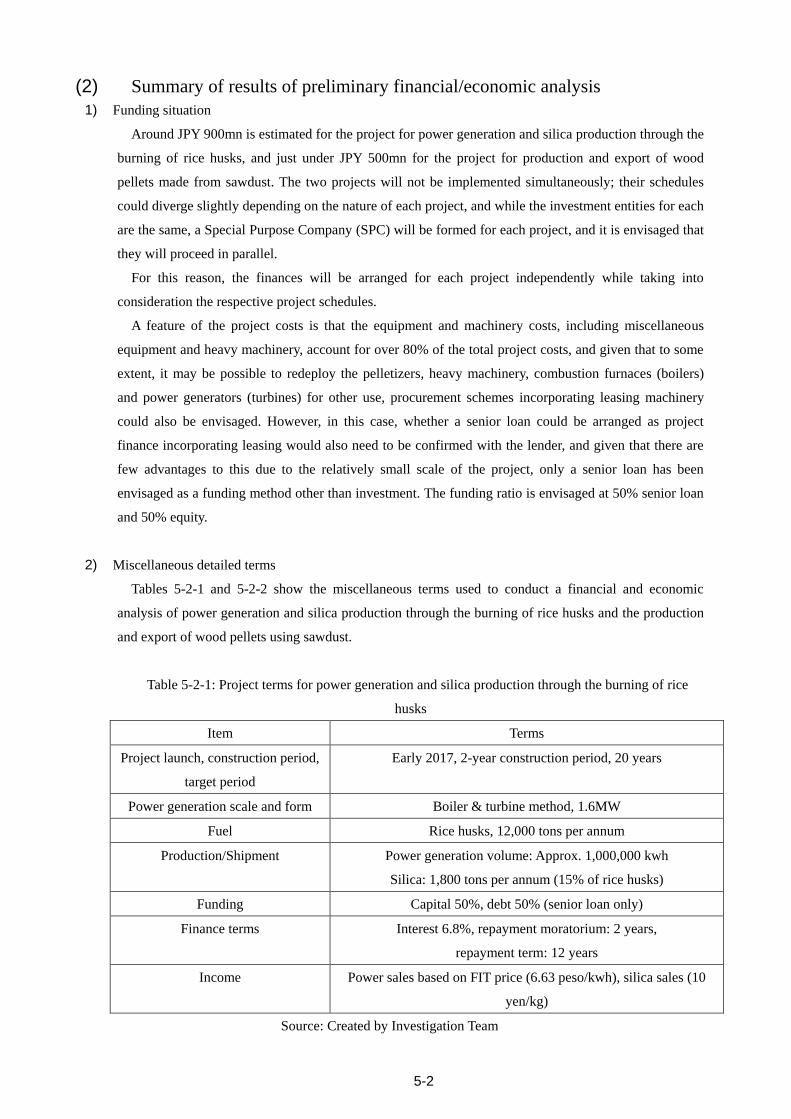
5-2
(2) Summary of results of preliminary financial/economic analysis
1) Funding situation
Around JPY 900mn is estimated for the project for power generation and silica production through the
burning of rice husks, and just under JPY 500mn for the project for production and export of wood
pellets made from sawdust. The two projects will not be implemented simultaneously; their schedules
could diverge slightly depending on the nature of each project, and while the investment entities for each
are the same, a Special Purpose Company (SPC) will be formed for each project, and it is envisaged that
they will proceed in parallel.
For this reason, the finances will be arranged for each project independently while taking into
consideration the respective project schedules.
A feature of the project costs is that the equipment and machinery costs, including miscellaneous
equipment and heavy machinery, account for over 80% of the total project costs, and given that to some
extent, it may be possible to redeploy the pelletizers, heavy machinery, combustion furnaces (boilers)
and power generators (turbines) for other use, procurement schemes incorporating leasing machinery
could also be envisaged. However, in this case, whether a senior loan could be arranged as project
finance incorporating leasing would also need to be confirmed with the lender, and given that there are
few advantages to this due to the relatively small scale of the project, only a senior loan has been
envisaged as a funding method other than investment. The funding ratio is envisaged at 50% senior loan
and 50% equity.
2) Miscellaneous detailed terms
Tables 5-2-1 and 5-2-2 show the miscellaneous terms used to conduct a financial and economic
analysis of power generation and silica production through the burning of rice husks and the production
and export of wood pellets using sawdust.
Table 5-2-1: Project terms for power generation and silica production through the burning of rice
husks
Item Terms
Project launch, construction period,
target period
Early 2017, 2-year construction period, 20 years
Power generation scale and form Boiler & turbine method, 1.6MW
Fuel Rice husks, 12,000 tons per annum
Production/Shipment Power generation volume: Approx. 1,000,000 kwh
Silica: 1,800 tons per annum (15% of rice husks)
Funding Capital 50%, debt 50% (senior loan only)
Finance terms Interest 6.8%, repayment moratorium: 2 years,
repayment term: 12 years
Income Power sales based on FIT price (6.63 peso/kwh), silica sales (10
yen/kg)
Source: Created by Investigation Team
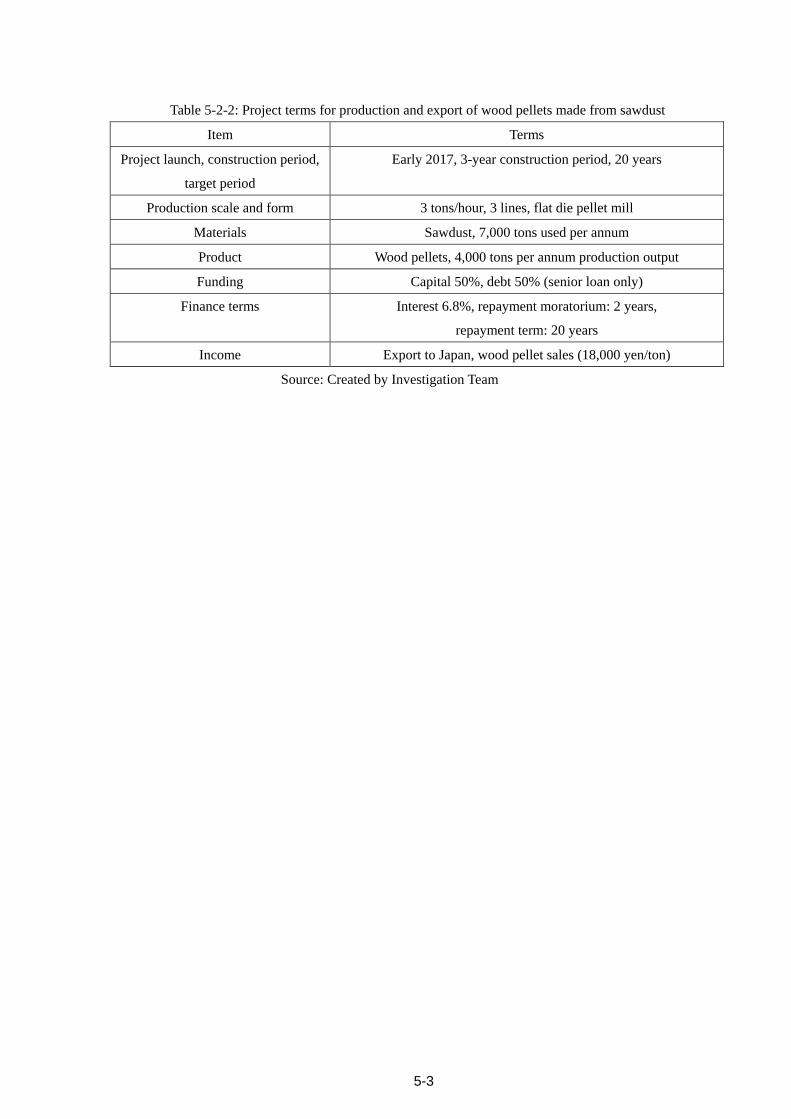
5-3
Table 5-2-2: Project terms for production and export of wood pellets made from sawdust
Item Terms
Project launch, construction period,
target period
Early 2017, 3-year construction period, 20 years
Production scale and form 3 tons/hour, 3 lines, flat die pellet mill
Materials Sawdust, 7,000 tons used per annum
Product Wood pellets, 4,000 tons per annum production output
Funding Capital 50%, debt 50% (senior loan only)
Finance terms Interest 6.8%, repayment moratorium: 2 years,
repayment term: 20 years
Income Export to Japan, wood pellet sales (18,000 yen/ton)
Source: Created by Investigation Team
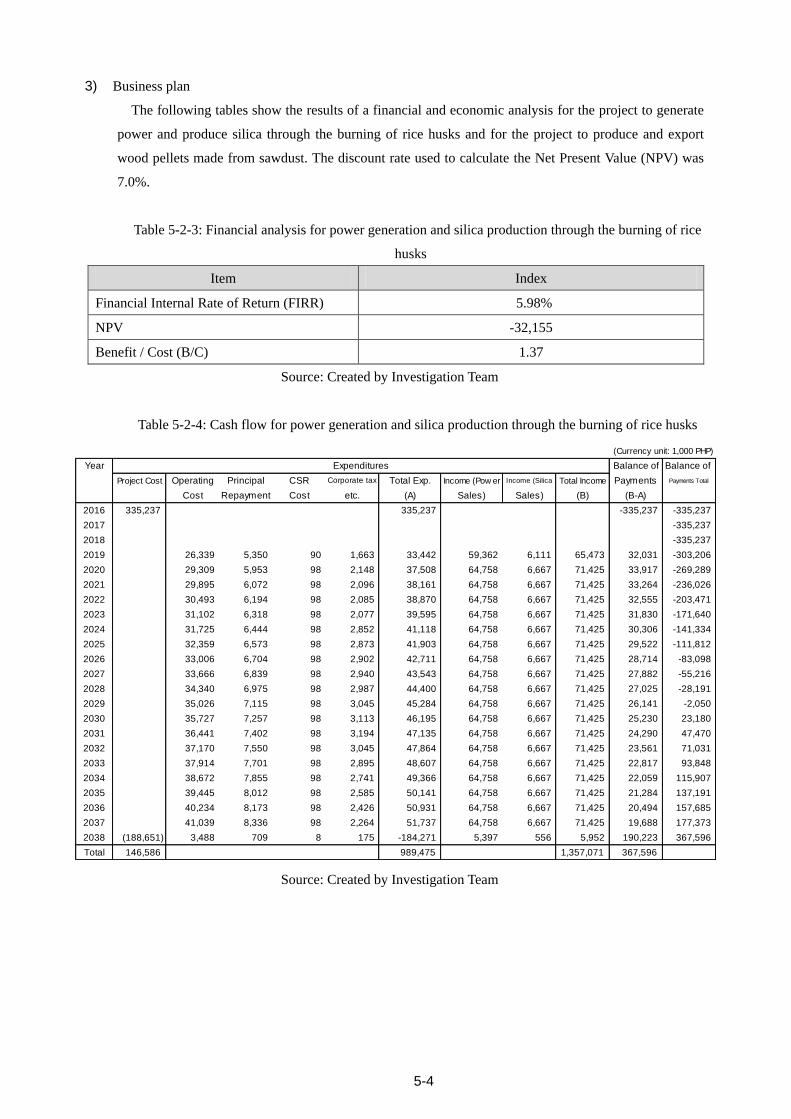
5-4
3) Business plan
The following tables show the results of a financial and economic analysis for the project to generate
power and produce silica through the burning of rice husks and for the project to produce and export
wood pellets made from sawdust. The discount rate used to calculate the Net Present Value (NPV) was
7.0%.
Table 5-2-3: Financial analysis for power generation and silica production through the burning of rice
husks
Item Index
Financial Internal Rate of Return (FIRR) 5.98%
NPV -32,155
Benefit / Cost (B/C) 1.37
Source: Created by Investigation Team
Table 5-2-4: Cash flow for power generation and silica production through the burning of rice husks
(Currency unit: 1,000 PHP)
Year Expenditures Balance of Balance of
Project Cost Operating Principal CSR Corporate tax Total Exp. Income (Pow er Income (Silica Total Income Payments Payments Total
Cost Repayment Cost etc. (A) Sales) Sales) (B) (B-A)
2016 335,237 335,237 -335,237 -335,237
2017 -335,237
2018 -335,237
2019 26,339 5,350 90 1,663 33,442 59,362 6,111 65,473 32,031 -303,206
2020 29,309 5,953 98 2,148 37,508 64,758 6,667 71,425 33,917 -269,289
2021 29,895 6,072 98 2,096 38,161 64,758 6,667 71,425 33,264 -236,026
2022 30,493 6,194 98 2,085 38,870 64,758 6,667 71,425 32,555 -203,471
2023 31,102 6,318 98 2,077 39,595 64,758 6,667 71,425 31,830 -171,640
2024 31,725 6,444 98 2,852 41,118 64,758 6,667 71,425 30,306 -141,334
2025 32,359 6,573 98 2,873 41,903 64,758 6,667 71,425 29,522 -111,812
2026 33,006 6,704 98 2,902 42,711 64,758 6,667 71,425 28,714 -83,098
2027 33,666 6,839 98 2,940 43,543 64,758 6,667 71,425 27,882 -55,216
2028 34,340 6,975 98 2,987 44,400 64,758 6,667 71,425 27,025 -28,191
2029 35,026 7,115 98 3,045 45,284 64,758 6,667 71,425 26,141 -2,050
2030 35,727 7,257 98 3,113 46,195 64,758 6,667 71,425 25,230 23,180
2031 36,441 7,402 98 3,194 47,135 64,758 6,667 71,425 24,290 47,470
2032 37,170 7,550 98 3,045 47,864 64,758 6,667 71,425 23,561 71,031
2033 37,914 7,701 98 2,895 48,607 64,758 6,667 71,425 22,817 93,848
2034 38,672 7,855 98 2,741 49,366 64,758 6,667 71,425 22,059 115,907
2035 39,445 8,012 98 2,585 50,141 64,758 6,667 71,425 21,284 137,191
2036 40,234 8,173 98 2,426 50,931 64,758 6,667 71,425 20,494 157,685
2037 41,039 8,336 98 2,264 51,737 64,758 6,667 71,425 19,688 177,373
2038 (188,651) 3,488 709 8 175 -184,271 5,397 556 5,952 190,223 367,596
Total 146,586 989,475 1,357,071 367,596
Source: Created by Investigation Team
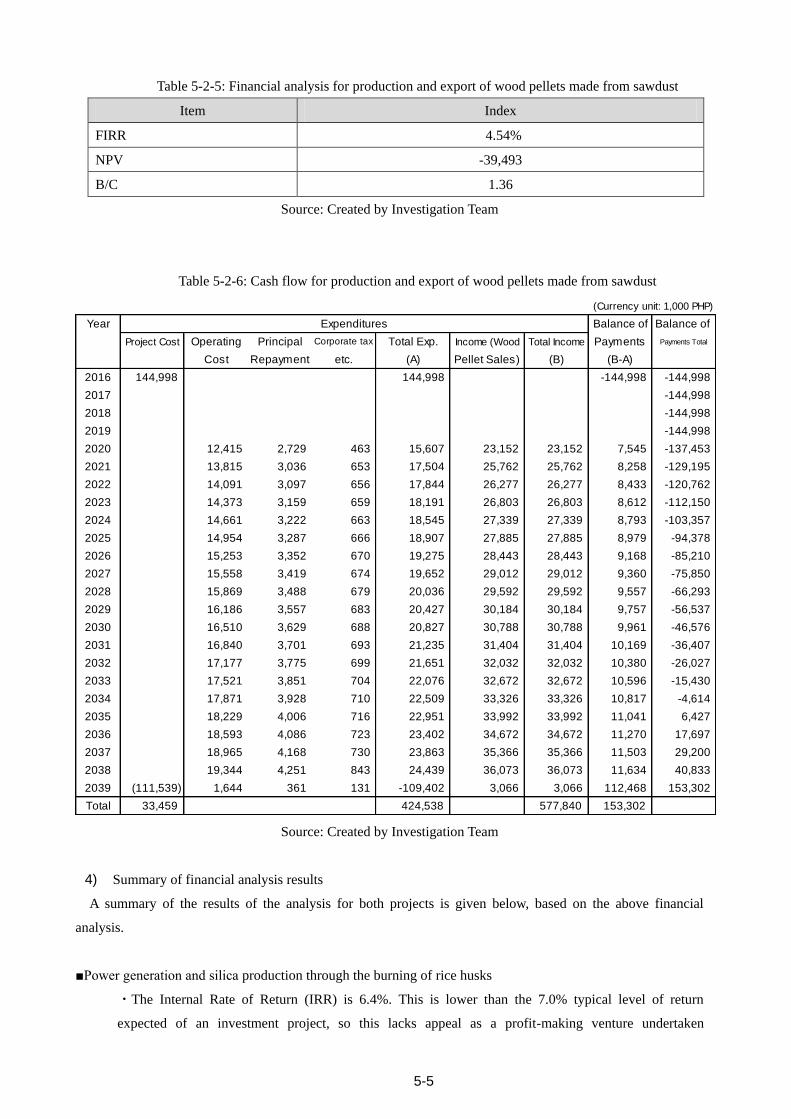
5-5
Table 5-2-5: Financial analysis for production and export of wood pellets made from sawdust
Item Index
FIRR 4.54%
NPV -39,493
B/C 1.36
Source: Created by Investigation Team
Table 5-2-6: Cash flow for production and export of wood pellets made from sawdust
(Currency unit: 1,000 PHP)
Year Expenditures Balance of Balance of
Project Cost Operating Principal Corporate tax Total Exp. Income (Wood Total Income Payments Payments Total
Cost Repayment etc. (A) Pellet Sales) (B) (B-A)
2016 144,998 144,998 -144,998 -144,998
2017 -144,998
2018 -144,998
2019 -144,998
2020 12,415 2,729 463 15,607 23,152 23,152 7,545 -137,453
2021 13,815 3,036 653 17,504 25,762 25,762 8,258 -129,195
2022 14,091 3,097 656 17,844 26,277 26,277 8,433 -120,762
2023 14,373 3,159 659 18,191 26,803 26,803 8,612 -112,150
2024 14,661 3,222 663 18,545 27,339 27,339 8,793 -103,357
2025 14,954 3,287 666 18,907 27,885 27,885 8,979 -94,378
2026 15,253 3,352 670 19,275 28,443 28,443 9,168 -85,210
2027 15,558 3,419 674 19,652 29,012 29,012 9,360 -75,850
2028 15,869 3,488 679 20,036 29,592 29,592 9,557 -66,293
2029 16,186 3,557 683 20,427 30,184 30,184 9,757 -56,537
2030 16,510 3,629 688 20,827 30,788 30,788 9,961 -46,576
2031 16,840 3,701 693 21,235 31,404 31,404 10,169 -36,407
2032 17,177 3,775 699 21,651 32,032 32,032 10,380 -26,027
2033 17,521 3,851 704 22,076 32,672 32,672 10,596 -15,430
2034 17,871 3,928 710 22,509 33,326 33,326 10,817 -4,614
2035 18,229 4,006 716 22,951 33,992 33,992 11,041 6,427
2036 18,593 4,086 723 23,402 34,672 34,672 11,270 17,697
2037 18,965 4,168 730 23,863 35,366 35,366 11,503 29,200
2038 19,344 4,251 843 24,439 36,073 36,073 11,634 40,833
2039 (111,539) 1,644 361 131 -109,402 3,066 3,066 112,468 153,302
Total 33,459 424,538 577,840 153,302
Source: Created by Investigation Team
4) Summary of financial analysis results
A summary of the results of the analysis for both projects is given below, based on the above financial
analysis.
■Power generation and silica production through the burning of rice husks
・The Internal Rate of Return (IRR) is 6.4%. This is lower than the 7.0% typical level of return
expected of an investment project, so this lacks appeal as a profit-making venture undertaken
5-6
independently by a private sector company.
・As the project feasibility will be enhanced through improvements in power generation efficiency and
also through the generation of high value-added silica, the precision of future feasibility studies needs to
be improved.
・The project also has great social significance, since as well as making effective use of the region’s
natural resources, it helps to supplement the shortage of electric power in regional areas and also reduces
the overall level of CO2 emissions in society, as described in Chapter 4.
・In addition, given that the project has the potential to become a model project for the development of
new power sources, not just in the Philippines but also in other rice farming areas throughout Southeast
Asia, it is hoped that this project will lead to the expansion of similar projects in the region.
■Production and export of wood pellets made from sawdust
・Since the wood pellets produced will be white pellets, with almost no ash remaining following
combustion, a relatively high sale price of 18,000 yen/kg has been set. In addition, an annual rise in the
sale price of 2% is envisaged, taking into consideration rising global awareness of carbon reduction
initiatives, such as through COP21.
・Notwithstanding the terms set above, although the B/C is higher than 1.0, it will take 15 years to make
a return on investment, and with the IRR at 4.54%, it is evident that the project will have low appeal to
private sector companies aiming for a profit.
・It is extremely significant that the project is being considered on the assumption that pellet
manufacturing equipment will be procured from a Japanese manufacturer, and consideration needs to be
given to this, including price negotiations with domestic manufacturers and the introduction of
manufacturing equipment from highly cost-competitive overseas manufacturers.
・As a reference case, the FIRR rises to approx. 8.0% by reducing the costs of the pelletizer equipment
and peripheral equipment to 50% of the total costs, as shown in the table below, and the project becomes
attractive. As mentioned in Chapter 3, using overseas products makes it possible to reduce the cost of
facilities and equipment, so it is clear that introducing pelletizer equipment from a Japanese
manufacturer represents an extremely challenging hurdle.
・In addition, the current plans entail the production of wood pellets in small lots, making transportation
in large bulk vessels impossible, and this is one factor behind the high transportation costs associated
with export. Therefore, it is also necessary to consider reducing the transportation cost by taking a
long-term perspective on the project and expanding the scale of production, such as by targeting an
industrial complex with a concentration of timber processing contractors with a view to intensive
collection of scrap wood in order to utilize larger shipping vessels and reduce shipping costs.
・At the same time, the project has great social significance, since as well as making effective use of the
region’s natural resources, it helps to diversify energy resources in Japan and reduces the overall level of
CO2 emissions in society, as described in Chapter 4.
・Furthermore, from the perspective of enhancing the added value of the available natural resources in
regional areas, forms of use other than the production/export of wood pellets can be envisaged,
including the possibility of their use as a biomass fuel for biomass power generation through simple
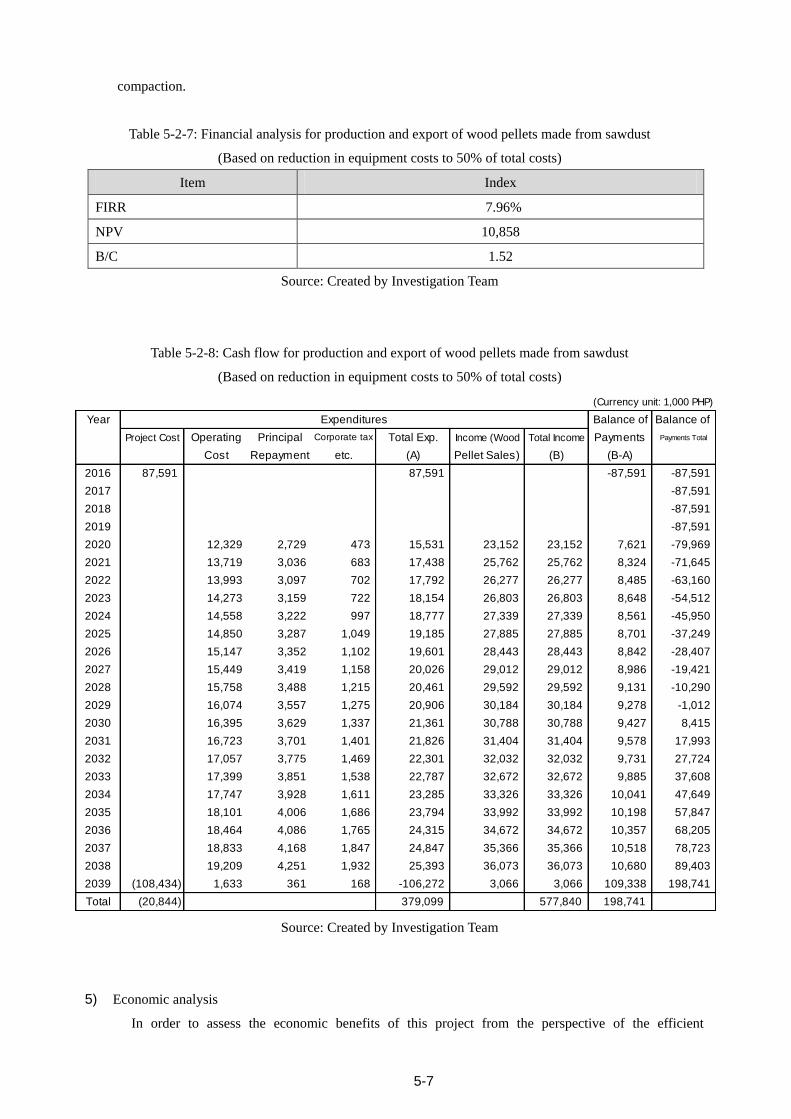
5-7
compaction.
Table 5-2-7: Financial analysis for production and export of wood pellets made from sawdust
(Based on reduction in equipment costs to 50% of total costs)
Item Index
FIRR 7.96%
NPV 10,858
B/C 1.52
Source: Created by Investigation Team
Table 5-2-8: Cash flow for production and export of wood pellets made from sawdust
(Based on reduction in equipment costs to 50% of total costs)
(Currency unit: 1,000 PHP)
Year Expenditures Balance of Balance of
Project Cost Operating Principal Corporate tax Total Exp. Income (Wood Total Income Payments Payments Total
Cost Repayment etc. (A) Pellet Sales) (B) (B-A)
2016 87,591 87,591 -87,591 -87,591
2017 -87,591
2018 -87,591
2019 -87,591
2020 12,329 2,729 473 15,531 23,152 23,152 7,621 -79,969
2021 13,719 3,036 683 17,438 25,762 25,762 8,324 -71,645
2022 13,993 3,097 702 17,792 26,277 26,277 8,485 -63,160
2023 14,273 3,159 722 18,154 26,803 26,803 8,648 -54,512
2024 14,558 3,222 997 18,777 27,339 27,339 8,561 -45,950
2025 14,850 3,287 1,049 19,185 27,885 27,885 8,701 -37,249
2026 15,147 3,352 1,102 19,601 28,443 28,443 8,842 -28,407
2027 15,449 3,419 1,158 20,026 29,012 29,012 8,986 -19,421
2028 15,758 3,488 1,215 20,461 29,592 29,592 9,131 -10,290
2029 16,074 3,557 1,275 20,906 30,184 30,184 9,278 -1,012
2030 16,395 3,629 1,337 21,361 30,788 30,788 9,427 8,415
2031 16,723 3,701 1,401 21,826 31,404 31,404 9,578 17,993
2032 17,057 3,775 1,469 22,301 32,032 32,032 9,731 27,724
2033 17,399 3,851 1,538 22,787 32,672 32,672 9,885 37,608
2034 17,747 3,928 1,611 23,285 33,326 33,326 10,041 47,649
2035 18,101 4,006 1,686 23,794 33,992 33,992 10,198 57,847
2036 18,464 4,086 1,765 24,315 34,672 34,672 10,357 68,205
2037 18,833 4,168 1,847 24,847 35,366 35,366 10,518 78,723
2038 19,209 4,251 1,932 25,393 36,073 36,073 10,680 89,403
2039 (108,434) 1,633 361 168 -106,272 3,066 3,066 109,338 198,741
Total (20,844) 379,099 577,840 198,741
Source: Created by Investigation Team
5) Economic analysis
In order to assess the economic benefits of this project from the perspective of the efficient
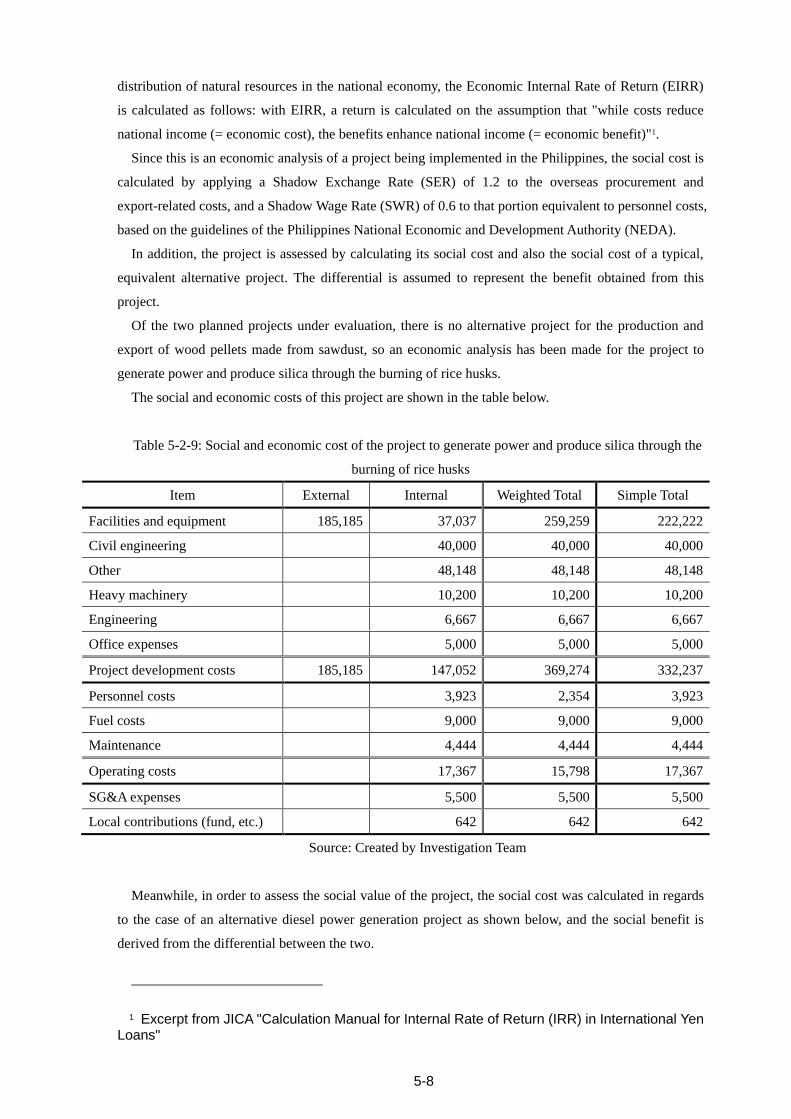
5-8
distribution of natural resources in the national economy, the Economic Internal Rate of Return (EIRR)
is calculated as follows: with EIRR, a return is calculated on the assumption that "while costs reduce
national income (= economic cost), the benefits enhance national income (= economic benefit)"1.
Since this is an economic analysis of a project being implemented in the Philippines, the social cost is
calculated by applying a Shadow Exchange Rate (SER) of 1.2 to the overseas procurement and
export-related costs, and a Shadow Wage Rate (SWR) of 0.6 to that portion equivalent to personnel costs,
based on the guidelines of the Philippines National Economic and Development Authority (NEDA).
In addition, the project is assessed by calculating its social cost and also the social cost of a typical,
equivalent alternative project. The differential is assumed to represent the benefit obtained from this
project.
Of the two planned projects under evaluation, there is no alternative project for the production and
export of wood pellets made from sawdust, so an economic analysis has been made for the project to
generate power and produce silica through the burning of rice husks.
The social and economic costs of this project are shown in the table below.
Table 5-2-9: Social and economic cost of the project to generate power and produce silica through the
burning of rice husks
Item External Internal Weighted Total Simple Total
Facilities and equipment 185,185 37,037 259,259 222,222
Civil engineering 40,000 40,000 40,000
Other 48,148 48,148 48,148
Heavy machinery 10,200 10,200 10,200
Engineering 6,667 6,667 6,667
Office expenses 5,000 5,000 5,000
Project development costs 185,185 147,052 369,274 332,237
Personnel costs 3,923 2,354 3,923
Fuel costs 9,000 9,000 9,000
Maintenance 4,444 4,444 4,444
Operating costs 17,367 15,798 17,367
SG&A expenses 5,500 5,500 5,500
Local contributions (fund, etc.) 642 642 642
Source: Created by Investigation Team
Meanwhile, in order to assess the social value of the project, the social cost was calculated in regards
to the case of an alternative diesel power generation project as shown below, and the social benefit is
derived from the differential between the two.
1 Excerpt from JICA "Calculation Manual for Internal Rate of Return (IRR) in International Yen
Loans"
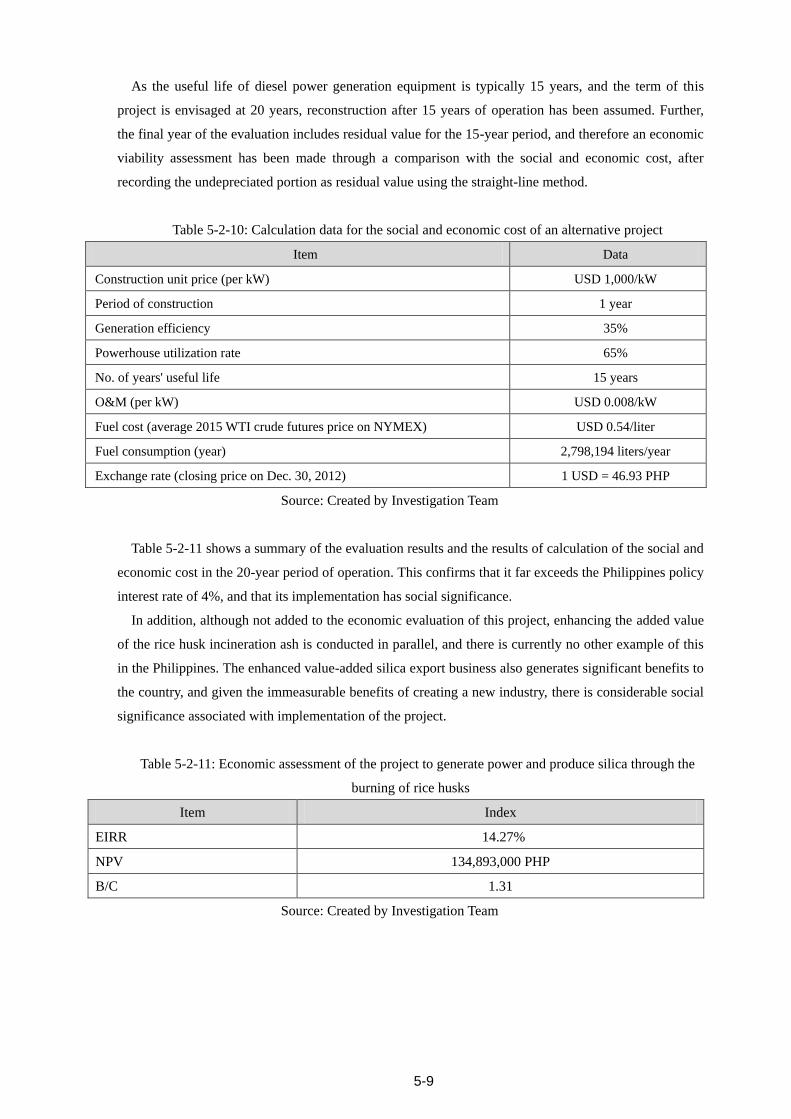
5-9
As the useful life of diesel power generation equipment is typically 15 years, and the term of this
project is envisaged at 20 years, reconstruction after 15 years of operation has been assumed. Further,
the final year of the evaluation includes residual value for the 15-year period, and therefore an economic
viability assessment has been made through a comparison with the social and economic cost, after
recording the undepreciated portion as residual value using the straight-line method.
Table 5-2-10: Calculation data for the social and economic cost of an alternative project
Item Data
Construction unit price (per kW) USD 1,000/kW
Period of construction 1 year
Generation efficiency 35%
Powerhouse utilization rate 65%
No. of years' useful life 15 years
O&M (per kW) USD 0.008/kW
Fuel cost (average 2015 WTI crude futures price on NYMEX) USD 0.54/liter
Fuel consumption (year) 2,798,194 liters/year
Exchange rate (closing price on Dec. 30, 2012) 1 USD = 46.93 PHP
Source: Created by Investigation Team
Table 5-2-11 shows a summary of the evaluation results and the results of calculation of the social and
economic cost in the 20-year period of operation. This confirms that it far exceeds the Philippines policy
interest rate of 4%, and that its implementation has social significance.
In addition, although not added to the economic evaluation of this project, enhancing the added value
of the rice husk incineration ash is conducted in parallel, and there is currently no other example of this
in the Philippines. The enhanced value-added silica export business also generates significant benefits to
the country, and given the immeasurable benefits of creating a new industry, there is considerable social
significance associated with implementation of the project.
Table 5-2-11: Economic assessment of the project to generate power and produce silica through the
burning of rice husks
Item Index
EIRR 14.27%
NPV 134,893,000 PHP
B/C 1.31
Source: Created by Investigation Team
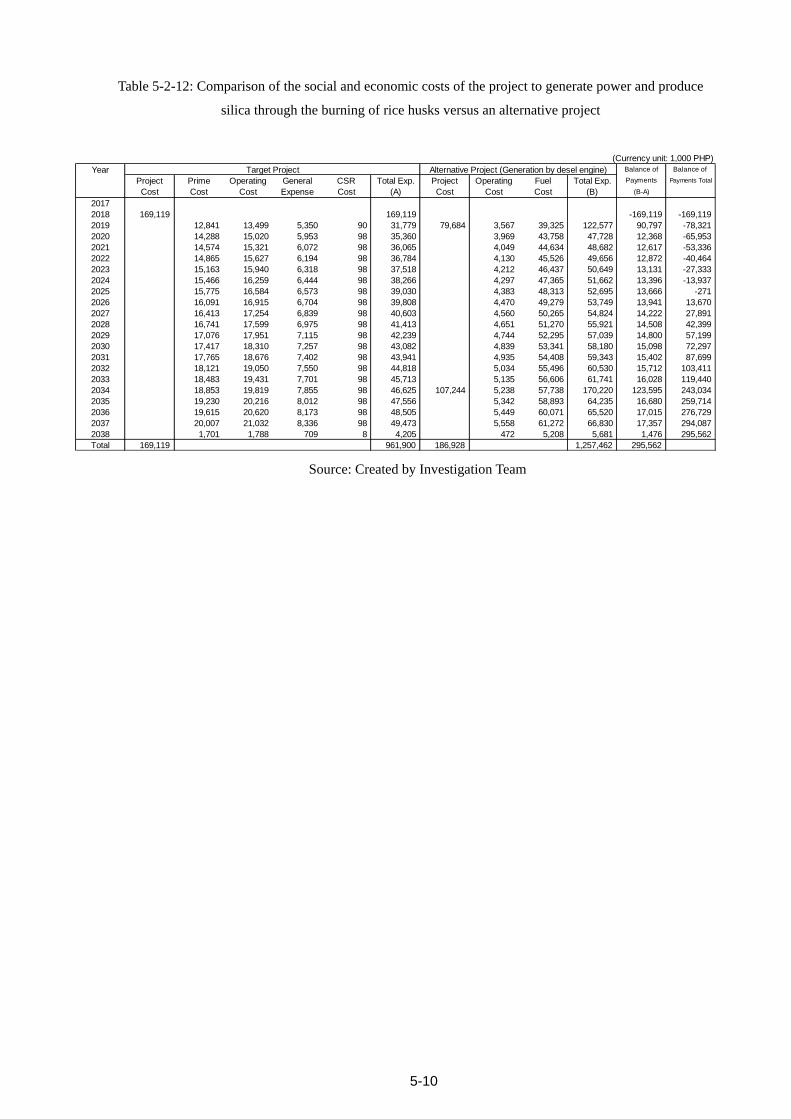
5-10
Table 5-2-12: Comparison of the social and economic costs of the project to generate power and produce
silica through the burning of rice husks versus an alternative project
(Currency unit: 1,000 PHP)
Year Target Project Alternative Project (Generation by desel engine) Balance of Balance of
Project Prime Operating General CSR Total Exp. Project Operating Fuel Total Exp. Payments Payments Total
Cost Cost Cost Expense Cost (A) Cost Cost Cost (B) (B-A)
2017
2018 169,119 169,119 -169,119 -169,119
2019 12,841 13,499 5,350 90 31,779 79,684 3,567 39,325 122,577 90,797 -78,321
2020 14,288 15,020 5,953 98 35,360 3,969 43,758 47,728 12,368 -65,953
2021 14,574 15,321 6,072 98 36,065 4,049 44,634 48,682 12,617 -53,336
2022 14,865 15,627 6,194 98 36,784 4,130 45,526 49,656 12,872 -40,464
2023 15,163 15,940 6,318 98 37,518 4,212 46,437 50,649 13,131 -27,333
2024 15,466 16,259 6,444 98 38,266 4,297 47,365 51,662 13,396 -13,937
2025 15,775 16,584 6,573 98 39,030 4,383 48,313 52,695 13,666 -271
2026 16,091 16,915 6,704 98 39,808 4,470 49,279 53,749 13,941 13,670
2027 16,413 17,254 6,839 98 40,603 4,560 50,265 54,824 14,222 27,891
2028 16,741 17,599 6,975 98 41,413 4,651 51,270 55,921 14,508 42,399
2029 17,076 17,951 7,115 98 42,239 4,744 52,295 57,039 14,800 57,199
2030 17,417 18,310 7,257 98 43,082 4,839 53,341 58,180 15,098 72,297
2031 17,765 18,676 7,402 98 43,941 4,935 54,408 59,343 15,402 87,699
2032 18,121 19,050 7,550 98 44,818 5,034 55,496 60,530 15,712 103,411
2033 18,483 19,431 7,701 98 45,713 5,135 56,606 61,741 16,028 119,440
2034 18,853 19,819 7,855 98 46,625 107,244 5,238 57,738 170,220 123,595 243,034
2035 19,230 20,216 8,012 98 47,556 5,342 58,893 64,235 16,680 259,714
2036 19,615 20,620 8,173 98 48,505 5,449 60,071 65,520 17,015 276,729
2037 20,007 21,032 8,336 98 49,473 5,558 61,272 66,830 17,357 294,087
2038 1,701 1,788 709 8 4,205 472 5,208 5,681 1,476 295,562
Total 169,119 961,900 186,928 1,257,462 295,562
Source: Created by Investigation Team
Chapter 6 Project Implementation Schedule
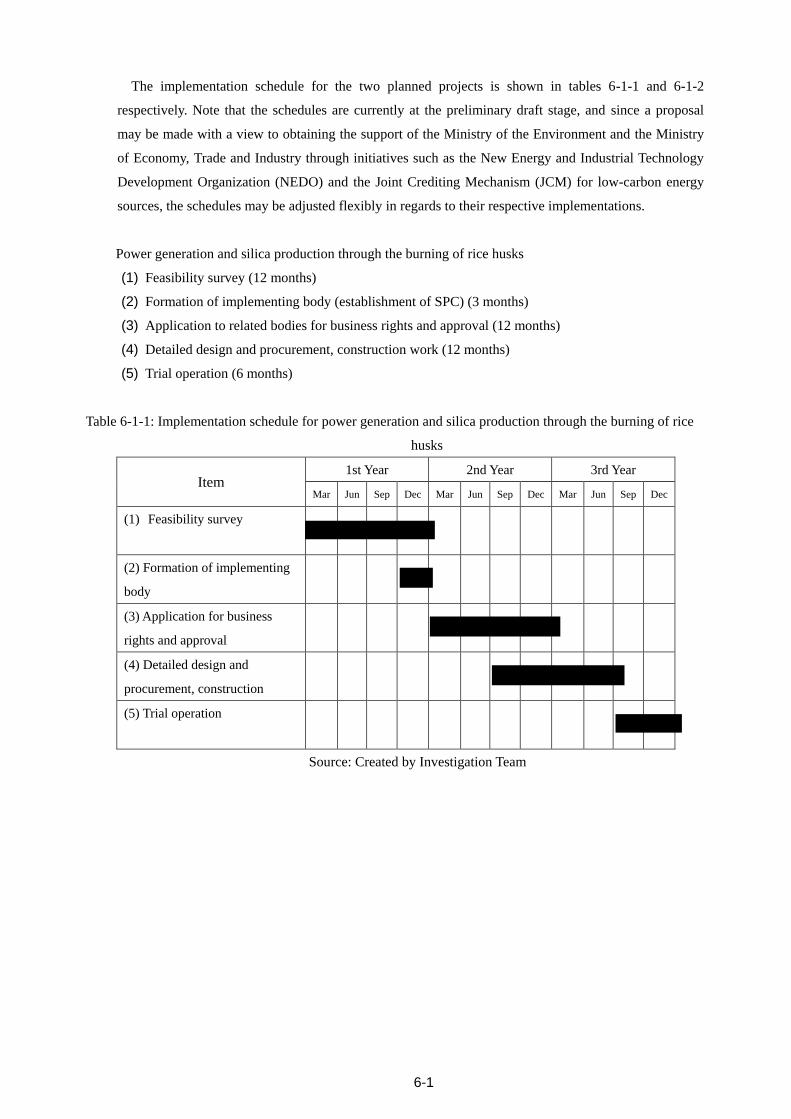
6-1
The implementation schedule for the two planned projects is shown in tables 6-1-1 and 6-1-2
respectively. Note that the schedules are currently at the preliminary draft stage, and since a proposal
may be made with a view to obtaining the support of the Ministry of the Environment and the Ministry
of Economy, Trade and Industry through initiatives such as the New Energy and Industrial Technology
Development Organization (NEDO) and the Joint Crediting Mechanism (JCM) for low-carbon energy
sources, the schedules may be adjusted flexibly in regards to their respective implementations.
Power generation and silica production through the burning of rice husks
(1) Feasibility survey (12 months)
(2) Formation of implementing body (establishment of SPC) (3 months)
(3) Application to related bodies for business rights and approval (12 months)
(4) Detailed design and procurement, construction work (12 months)
(5) Trial operation (6 months)
Table 6-1-1: Implementation schedule for power generation and silica production through the burning of rice
husks
Item 1st Year 2nd Year 3rd Year
Mar Jun Sep Dec Mar Jun Sep Dec Mar Jun Sep Dec
(1) Feasibility survey
(2) Formation of implementing
body
(3) Application for business
rights and approval
(4) Detailed design and
procurement, construction
(5) Trial operation
Source: Created by Investigation Team
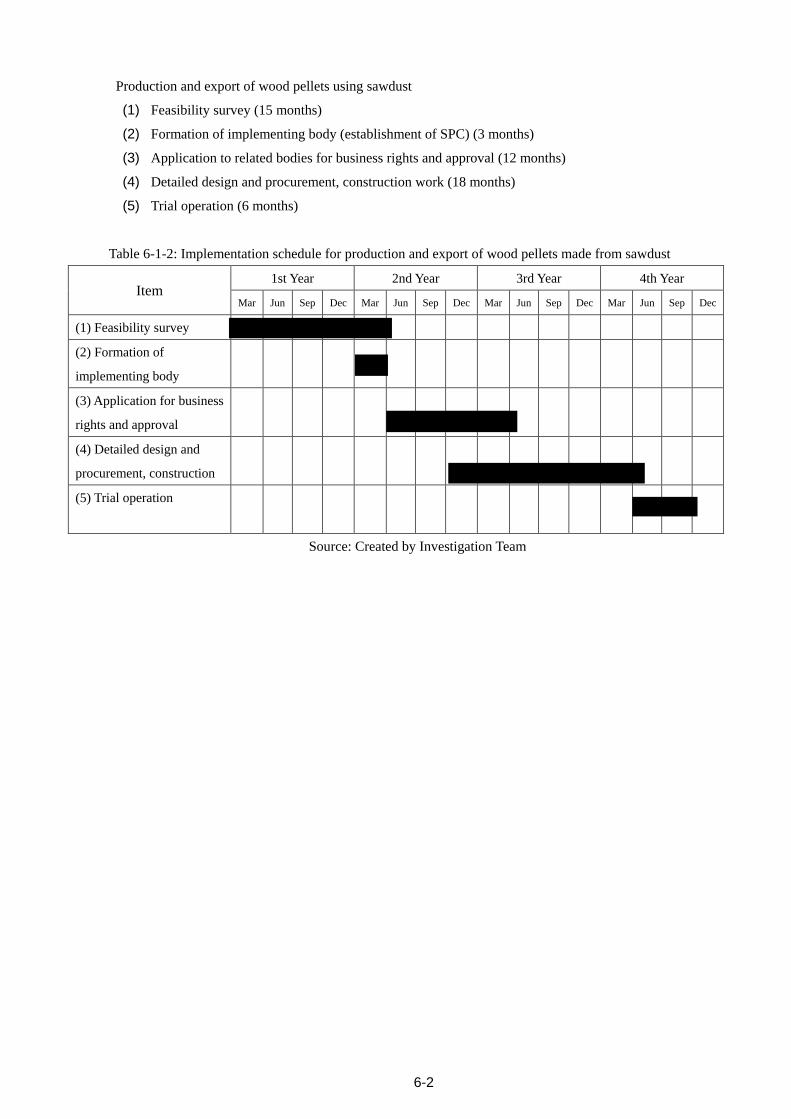
6-2
Production and export of wood pellets using sawdust
(1) Feasibility survey (15 months)
(2) Formation of implementing body (establishment of SPC) (3 months)
(3) Application to related bodies for business rights and approval (12 months)
(4) Detailed design and procurement, construction work (18 months)
(5) Trial operation (6 months)
Table 6-1-2: Implementation schedule for production and export of wood pellets made from sawdust
Item 1st Year 2nd Year 3rd Year 4th Year
Mar Jun Sep Dec Mar Jun Sep Dec Mar Jun Sep Dec Mar Jun Sep Dec
(1) Feasibility survey
(2) Formation of
implementing body
(3) Application for business
rights and approval
(4) Detailed design and
procurement, construction
(5) Trial operation
Source: Created by Investigation Team
Chapter 7 Implementation Ability of Partner Country
Implementing Bodies
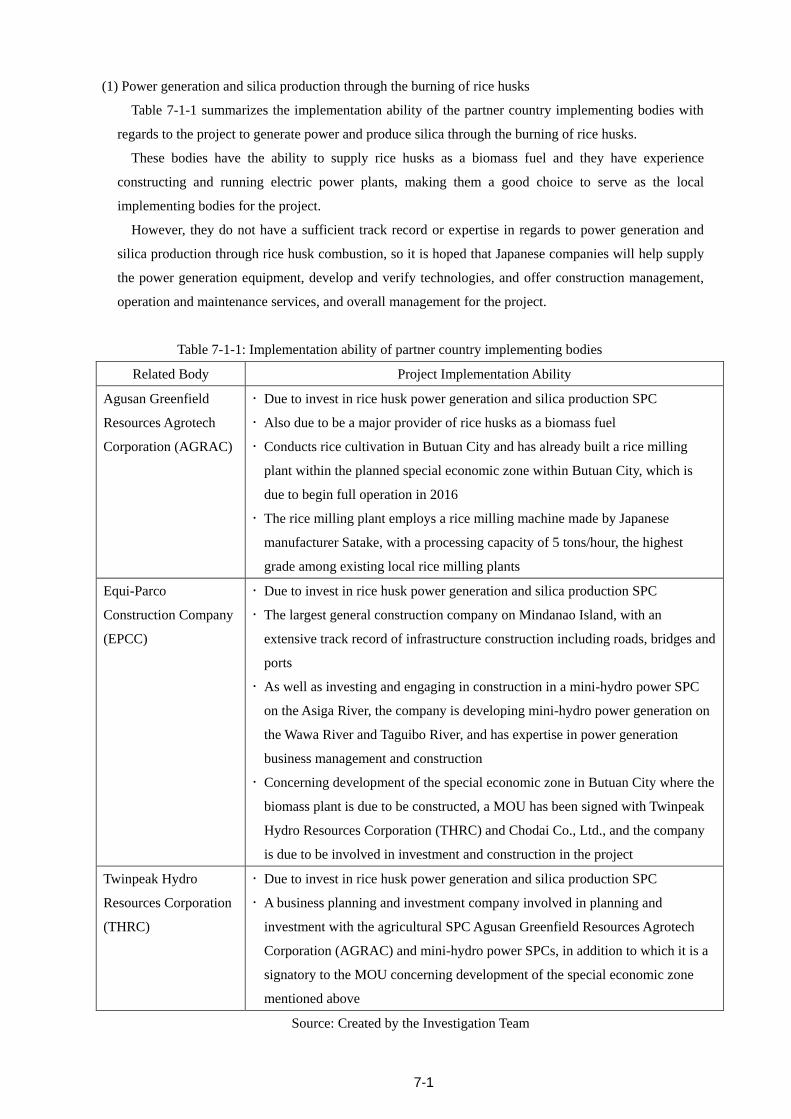
7-1
(1) Power generation and silica production through the burning of rice husks
Table 7-1-1 summarizes the implementation ability of the partner country implementing bodies with
regards to the project to generate power and produce silica through the burning of rice husks.
These bodies have the ability to supply rice husks as a biomass fuel and they have experience
constructing and running electric power plants, making them a good choice to serve as the local
implementing bodies for the project.
However, they do not have a sufficient track record or expertise in regards to power generation and
silica production through rice husk combustion, so it is hoped that Japanese companies will help supply
the power generation equipment, develop and verify technologies, and offer construction management,
operation and maintenance services, and overall management for the project.
Table 7-1-1: Implementation ability of partner country implementing bodies
Related Body Project Implementation Ability
Agusan Greenfield
Resources Agrotech
Corporation (AGRAC)
Due to invest in rice husk power generation and silica production SPC
Also due to be a major provider of rice husks as a biomass fuel
Conducts rice cultivation in Butuan City and has already built a rice milling
plant within the planned special economic zone within Butuan City, which is
due to begin full operation in 2016
The rice milling plant employs a rice milling machine made by Japanese
manufacturer Satake, with a processing capacity of 5 tons/hour, the highest
grade among existing local rice milling plants
Equi-Parco
Construction Company
(EPCC)
Due to invest in rice husk power generation and silica production SPC
The largest general construction company on Mindanao Island, with an
extensive track record of infrastructure construction including roads, bridges and
ports
As well as investing and engaging in construction in a mini-hydro power SPC
on the Asiga River, the company is developing mini-hydro power generation on
the Wawa River and Taguibo River, and has expertise in power generation
business management and construction
Concerning development of the special economic zone in Butuan City where the
biomass plant is due to be constructed, a MOU has been signed with Twinpeak
Hydro Resources Corporation (THRC) and Chodai Co., Ltd., and the company
is due to be involved in investment and construction in the project
Twinpeak Hydro
Resources Corporation
(THRC)
Due to invest in rice husk power generation and silica production SPC
A business planning and investment company involved in planning and
investment with the agricultural SPC Agusan Greenfield Resources Agrotech
Corporation (AGRAC) and mini-hydro power SPCs, in addition to which it is a
signatory to the MOU concerning development of the special economic zone
mentioned above
Source: Created by the Investigation Team
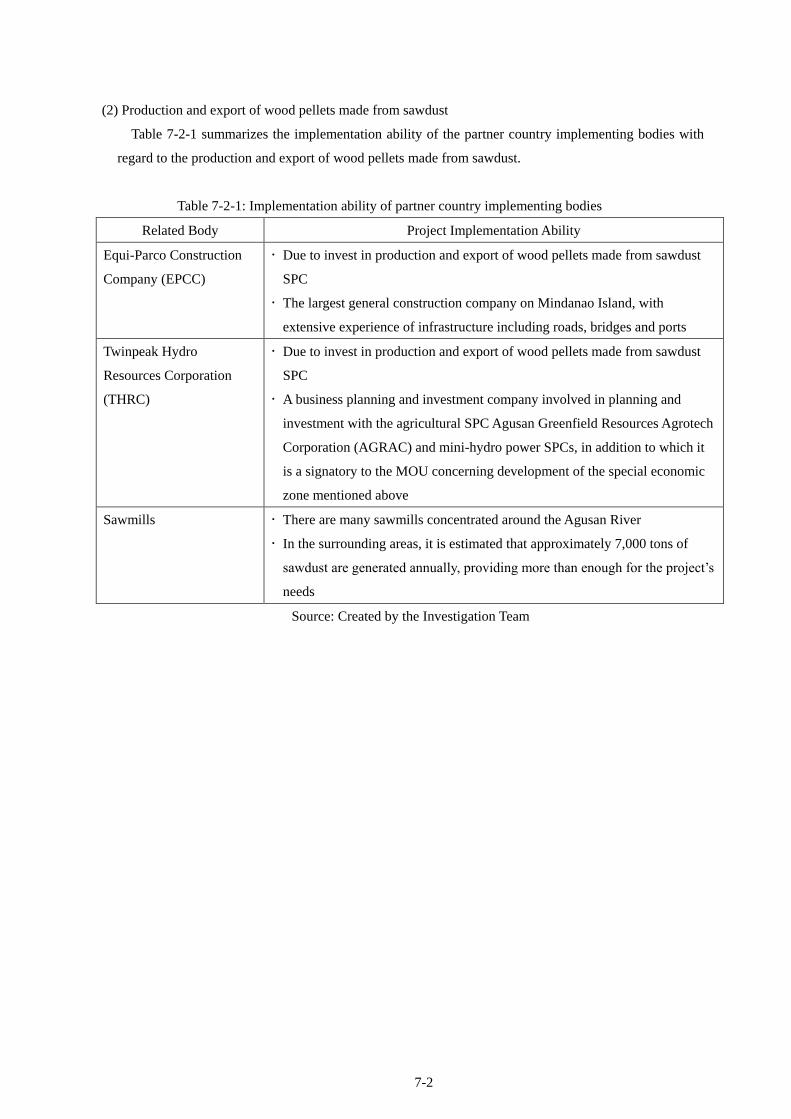
7-2
(2) Production and export of wood pellets made from sawdust
Table 7-2-1 summarizes the implementation ability of the partner country implementing bodies with
regard to the production and export of wood pellets made from sawdust.
Table 7-2-1: Implementation ability of partner country implementing bodies
Related Body Project Implementation Ability
Equi-Parco Construction
Company (EPCC)
Due to invest in production and export of wood pellets made from sawdust
SPC
The largest general construction company on Mindanao Island, with
extensive experience of infrastructure including roads, bridges and ports
Twinpeak Hydro
Resources Corporation
(THRC)
Due to invest in production and export of wood pellets made from sawdust
SPC
A business planning and investment company involved in planning and
investment with the agricultural SPC Agusan Greenfield Resources Agrotech
Corporation (AGRAC) and mini-hydro power SPCs, in addition to which it
is a signatory to the MOU concerning development of the special economic
zone mentioned above
Sawmills There are many sawmills concentrated around the Agusan River
In the surrounding areas, it is estimated that approximately 7,000 tons of
sawdust are generated annually, providing more than enough for the project’s
needs
Source: Created by the Investigation Team
Chapter8 Comparative Advantages of Japanese
Companies
8-1
(1) Assumed role of Japanese companies (investment, supply of materials and
equipment, facility management, etc.) for the project
With the project to generate power and produce silica through the burning of rice husks, we envision the
role of Japanese corporations to include the planning and design of the overall project, the supply of
equipment such as the combustion furnaces and power generation equipment, the offtake of the silica
produced, regular involvement in the operations and management of the project, and capital investment in
the resulting SPC.
Similarly, for the project to produce and export wood pellets made from sawdust, we imagine the role of
Japanese corporations to include the planning of the overall project, the supply of equipment such as
pelletizers, the offtake of the wood pellets produced, construction management, regular involvement in the
operations and management of the project, and capital investment in the resulting SPC.
For both projects, it is possible for Japanese companies to provide a total consulting service, encompassing
personnel, equipment and funding as an overall governing body that supervises everything from the planning
phase to the management of the day-to-day operations of the business.
Furthermore, for the project to generate power and produce silica from the burning of rice husks in the
partner country, the rice husks are usually discarded or are simply burned in order to generate electricity, so
this project aims to create additional value by using them to produce silica through the use of advanced
refinement techniques, thereby positioning itself as a pioneer in the field within the Philippines. As a whole,
the Philippines is a large producer of rice, creating a strong possibility that these techniques, if successful,
can eventually be adopted throughout the country.
At the current moment, the main investors in this project are EPCC, which is the local counterpart for the
project in the Philippines, THRC, and the Japanese company, Chodai Co., Ltd., which is providing project
planning, construction management, and overall operation and management of the project. Additionally, we
are evaluating other Japanese companies as strong candidates to provide the combustion furnaces, power
generation equipment, and pelletizers needed for the project as well.
The project is also receiving advice from a research team led by Professor Kondoh of Osaka University in
regards to producing high-purity silica from the rice husk combustion process to generate additional added
value to the incinerated ash generated by burning the rice husks.
We currently plan to enlist Japanese companies to carry out the following activities as the main proposers,
joint proposers, and cooperating companies in regards to the project.
Chodai Co., Ltd. ・Provide advice and leadership for the project as a whole
・Offer a comprehensive consulting service as an owner’s engineer, covering
everything from planning to operation management
・Give advice for securing Japanese equipment and low-interest capital
・Invest in the SPC formed for the project
8-2
(2) Advantages of Japanese companies (technical and financial)
The creation of a system to secure and supply a stable source of the necessary raw materials is a vital step
in both the project to generate power and produce silica through the burning of rice husks and also in the
project to produce and export wood pellets made from sawdust. The main suppliers of both materials will be
rice milling plants and lumber mills that are not part of the capital investments or command structure of this
project, making the establishment of a cooperative framework and alliance essential to the projects’ success.
This will require the negotiation skills and management ability of our local partners EPCC and THRC.
Meanwhile, it will be important to establish relationships with multiple large and reliable suppliers of the
raw materials, and to properly manage them and the project itself. By ensuring that the raw material
suppliers who commit to the project during negotiations are able to profit, it will be possible to form a strong
alliance and partnership framework based on the concept of mutual benefit.
In order to realize these goals, it is necessary to carefully plan and design the project from a highly
technical and multifaceted perspective, while also operating under a competent management authority
during the construction and equipment installation phase, and with sufficient capital.
We also envision Japanese companies participating in other areas of the project as detailed below. Using
this as a basis, we will proactively work towards securing capital from Japanese corporations.
Management
ability
Able to comprehensively analyze the project as a whole while flexibly working towards
its realization from a variety of different directions
Able to strictly adhere to schedules, as well as quality and cost requirements through
project completion
Solutions
provider
Able to solve problems through new ideas and overall resourcefulness
Able to proactively predict and devise solutions for unforeseen problems as well as
current ones
Engineering
ability
Power plant designs that achieve increases in output and annual energy output
Facility layouts that promote workability and utilize space efficiently
Technical
competitive
advantages
Superior design, construction, maintenance and repair skills, breadth of choice in
materials
Long product life and reliability through operation and maintenance knowhow
Superior performance offers significant lifecycle cost advantages
Advanced schedule management techniques ensure construction periods and schedules
are adhered to
Economic clout Financial assistance and loan facilities provided to establish a JCM via the
Ministry of Economy, Trade and Industry, and the Ministry of the Environment.
Information gathering, coordination efforts, and negotiations through NEDO to secure
additional capital for the project costs
Investment from Japanese companies
8-3
(3) Necessary steps to facilitate orders from Japanese companies
In regards to the supply of materials and equipment, the competitive strength of Japanese companies
makes it difficult to drive down the price for individual equipment orders through competition. Therefore, it
will be imperative to explain the quality advantages, reliability, trouble-free nature, and detailed after-sales
care with easy access to supplies that Japanese companies provide, and that the costs must be evaluated by
looking at the total lifecycle costs in order to demonstrate the technical advantages of Japanese suppliers.
To place orders for this project, it will be necessary to obtain commitments on the Japanese side from the
major partners and supporting companies, while also establishing a reliable implementing body and
consensus-building system in the partner country. Working towards this goal, Chodai, the driving force
behind this proposal, has engaged in the following efforts that will help it create the foundation this project
needs to succeed.
Chodai is participating with EPCC and THRC as a joint investor in mini-hydro power plants and water
infrastructure projects in the partner country, thereby developing a strong working relationship and mutual
trust with both companies.
With these projects already underway, Chodai has demonstrated the necessity for the engineering skill
and project management ability of Japanese companies, as well as the impact that those traits have on a
project’s profitability; earning Chodai significant influence in regards to the project planning and design,
management, and financing arrangements for the projects, despite only have a minor investment in them.
Based on this mutual trust, Chodai has already signed a contract with the SPC responsible for the
mini-hydro power plant to cover engineering reviews, construction management, and financial advice, and
after stressing the importance of a comparative evaluation of the lifecycle costs, selected a Japanese
manufacturer for the ductile water pipes needed for the mini-hydro power plant water turbines and water
infrastructure projects.
Similarly, for this proposal, Chodai is recommending the use of Japanese engineering knowhow for the
plant design and construction management, as well as Japanese sources for the main equipment after
performing a lifecycle cost analysis.
For the two areas of this project, the equipment needed will largely consist of combustion furnaces,
power generating equipment, and pelletizers, all of which we cover in more detail below.
Combustion Furnaces
Furnaces can be divided into two main types: boilers and gasifiers. Of the two, Japanese companies
specialize in boiler type furnaces and possess a high competitive advantage with them. However, gasifier
type furnaces are more efficient when converting the heat generated from the fuel input into electricity, and
although Japanese companies are gradually increasing their knowhow in this field as well, they currently
trail their overseas counterparts in terms of quality and cost.
8-4
Power Generating Equipment
Alongside the combustion furnaces, there are steam turbine generators that attach to boiler type furnaces,
and gas engine generators that attach to gasifier type furnaces. Similarly, there is a strong track record of
manufacturing steam turbine generators within Japan, while gas engine type generators are still mostly in the
developmental phase and are extremely expensive, meaning that they lag behind their foreign counterparts in
terms of competitiveness.
The calculations concerning the plant running costs and power generating efficiency contained within the
financial analysis of this report were all based on the use of boiler type furnaces to generate heat and drive
steam turbine generators.
Pelletizers
Since there is miniscule demand within Japan for wood pellet production, there are not many
manufacturers in the country who specialize in machines capable of handling the large-scale production of
pellets. While there are domestic Japanese manufacturers for machines that can handle the scale envisioned
by this project, it will be difficult to select them when looking at the overall lifecycle cost when compared to
machines made in other countries such as Vietnam.

Chapter 9 Prospects for Project Funding
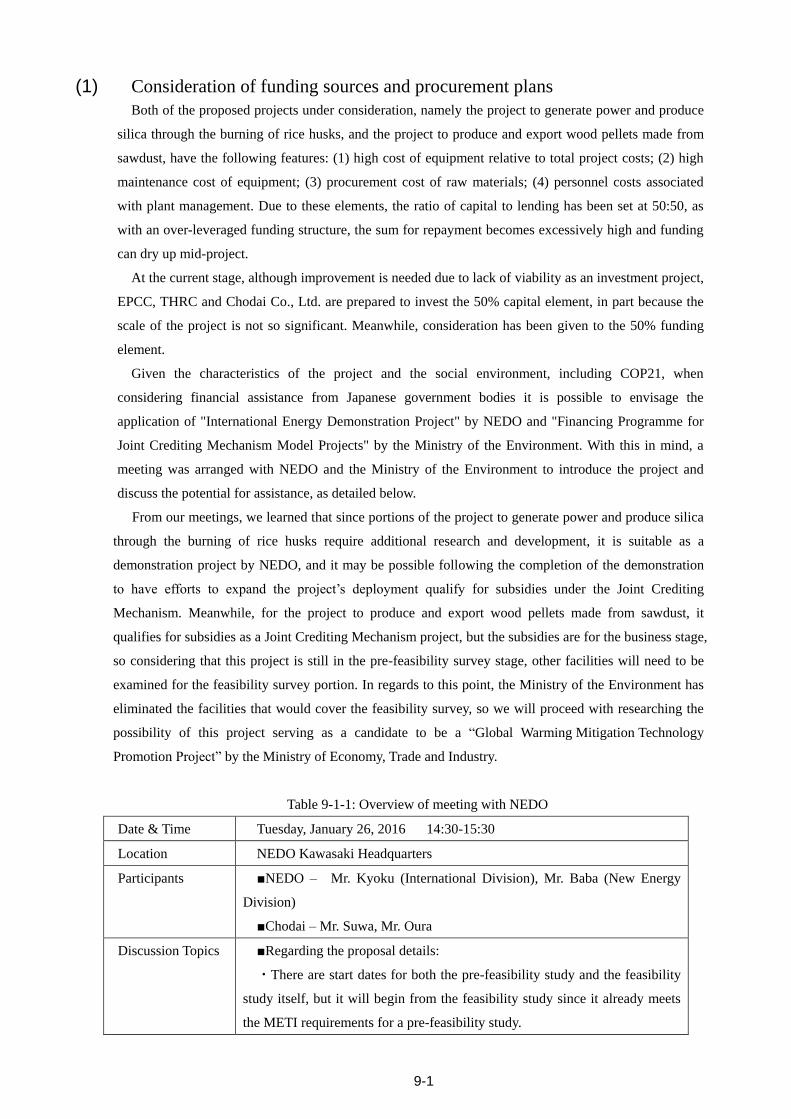
9-1
(1) Consideration of funding sources and procurement plans
Both of the proposed projects under consideration, namely the project to generate power and produce
silica through the burning of rice husks, and the project to produce and export wood pellets made from
sawdust, have the following features: (1) high cost of equipment relative to total project costs; (2) high
maintenance cost of equipment; (3) procurement cost of raw materials; (4) personnel costs associated
with plant management. Due to these elements, the ratio of capital to lending has been set at 50:50, as
with an over-leveraged funding structure, the sum for repayment becomes excessively high and funding
can dry up mid-project.
At the current stage, although improvement is needed due to lack of viability as an investment project,
EPCC, THRC and Chodai Co., Ltd. are prepared to invest the 50% capital element, in part because the
scale of the project is not so significant. Meanwhile, consideration has been given to the 50% funding
element.
Given the characteristics of the project and the social environment, including COP21, when
considering financial assistance from Japanese government bodies it is possible to envisage the
application of "International Energy Demonstration Project" by NEDO and "Financing Programme for
Joint Crediting Mechanism Model Projects" by the Ministry of the Environment. With this in mind, a
meeting was arranged with NEDO and the Ministry of the Environment to introduce the project and
discuss the potential for assistance, as detailed below.
From our meetings, we learned that since portions of the project to generate power and produce silica
through the burning of rice husks require additional research and development, it is suitable as a
demonstration project by NEDO, and it may be possible following the completion of the demonstration
to have efforts to expand the project’s deployment qualify for subsidies under the Joint Crediting
Mechanism. Meanwhile, for the project to produce and export wood pellets made from sawdust, it
qualifies for subsidies as a Joint Crediting Mechanism project, but the subsidies are for the business stage,
so considering that this project is still in the pre-feasibility survey stage, other facilities will need to be
examined for the feasibility survey portion. In regards to this point, the Ministry of the Environment has
eliminated the facilities that would cover the feasibility survey, so we will proceed with researching the
possibility of this project serving as a candidate to be a “Global Warming Mitigation Technology
Promotion Project” by the Ministry of Economy, Trade and Industry.
Table 9-1-1: Overview of meeting with NEDO
Date & Time Tuesday, January 26, 2016 14:30-15:30
Location NEDO Kawasaki Headquarters
Participants ■NEDO – Mr. Kyoku (International Division), Mr. Baba (New Energy
Division)
■Chodai – Mr. Suwa, Mr. Oura
Discussion Topics ■Regarding the proposal details:
・There are start dates for both the pre-feasibility study and the feasibility
study itself, but it will begin from the feasibility study since it already meets
the METI requirements for a pre-feasibility study.
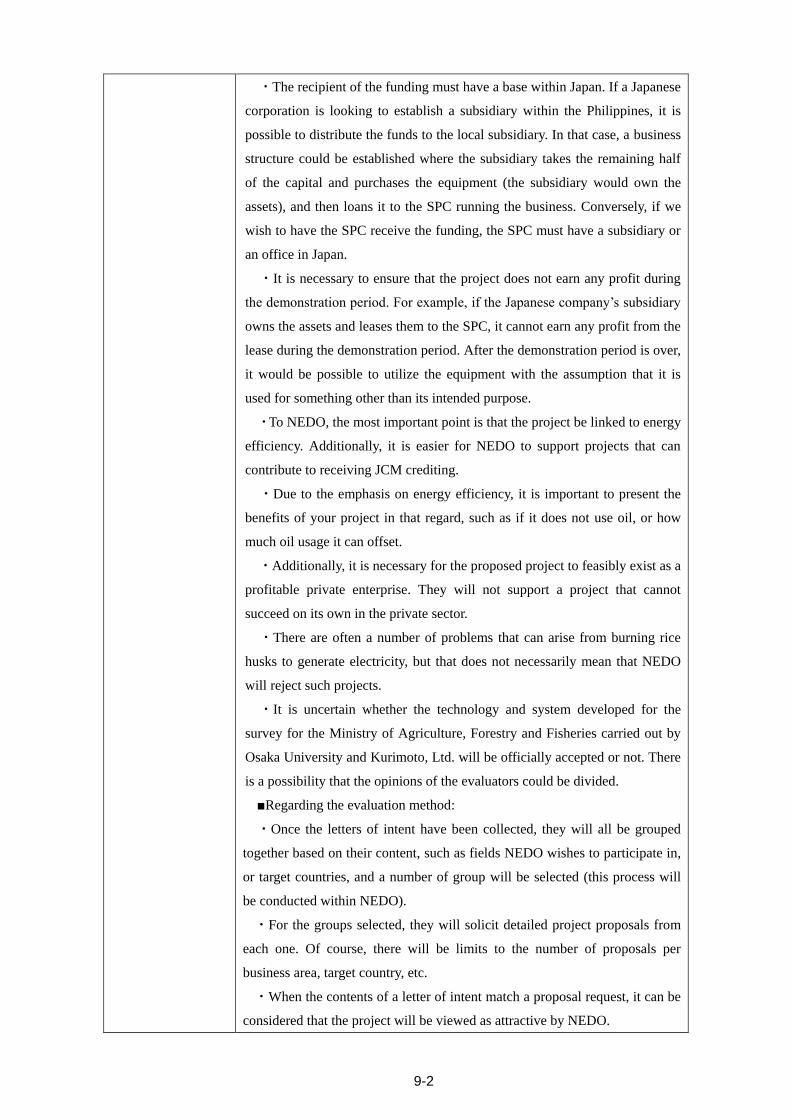
9-2
・The recipient of the funding must have a base within Japan. If a Japanese
corporation is looking to establish a subsidiary within the Philippines, it is
possible to distribute the funds to the local subsidiary. In that case, a business
structure could be established where the subsidiary takes the remaining half
of the capital and purchases the equipment (the subsidiary would own the
assets), and then loans it to the SPC running the business. Conversely, if we
wish to have the SPC receive the funding, the SPC must have a subsidiary or
an office in Japan.
・It is necessary to ensure that the project does not earn any profit during
the demonstration period. For example, if the Japanese company’s subsidiary
owns the assets and leases them to the SPC, it cannot earn any profit from the
lease during the demonstration period. After the demonstration period is over,
it would be possible to utilize the equipment with the assumption that it is
used for something other than its intended purpose.
・To NEDO, the most important point is that the project be linked to energy
efficiency. Additionally, it is easier for NEDO to support projects that can
contribute to receiving JCM crediting.
・Due to the emphasis on energy efficiency, it is important to present the
benefits of your project in that regard, such as if it does not use oil, or how
much oil usage it can offset.
・Additionally, it is necessary for the proposed project to feasibly exist as a
profitable private enterprise. They will not support a project that cannot
succeed on its own in the private sector.
・There are often a number of problems that can arise from burning rice
husks to generate electricity, but that does not necessarily mean that NEDO
will reject such projects.
・It is uncertain whether the technology and system developed for the
survey for the Ministry of Agriculture, Forestry and Fisheries carried out by
Osaka University and Kurimoto, Ltd. will be officially accepted or not. There
is a possibility that the opinions of the evaluators could be divided.
■Regarding the evaluation method:
・Once the letters of intent have been collected, they will all be grouped
together based on their content, such as fields NEDO wishes to participate in,
or target countries, and a number of group will be selected (this process will
be conducted within NEDO).
・For the groups selected, they will solicit detailed project proposals from
each one. Of course, there will be limits to the number of proposals per
business area, target country, etc.
・When the contents of a letter of intent match a proposal request, it can be
considered that the project will be viewed as attractive by NEDO.
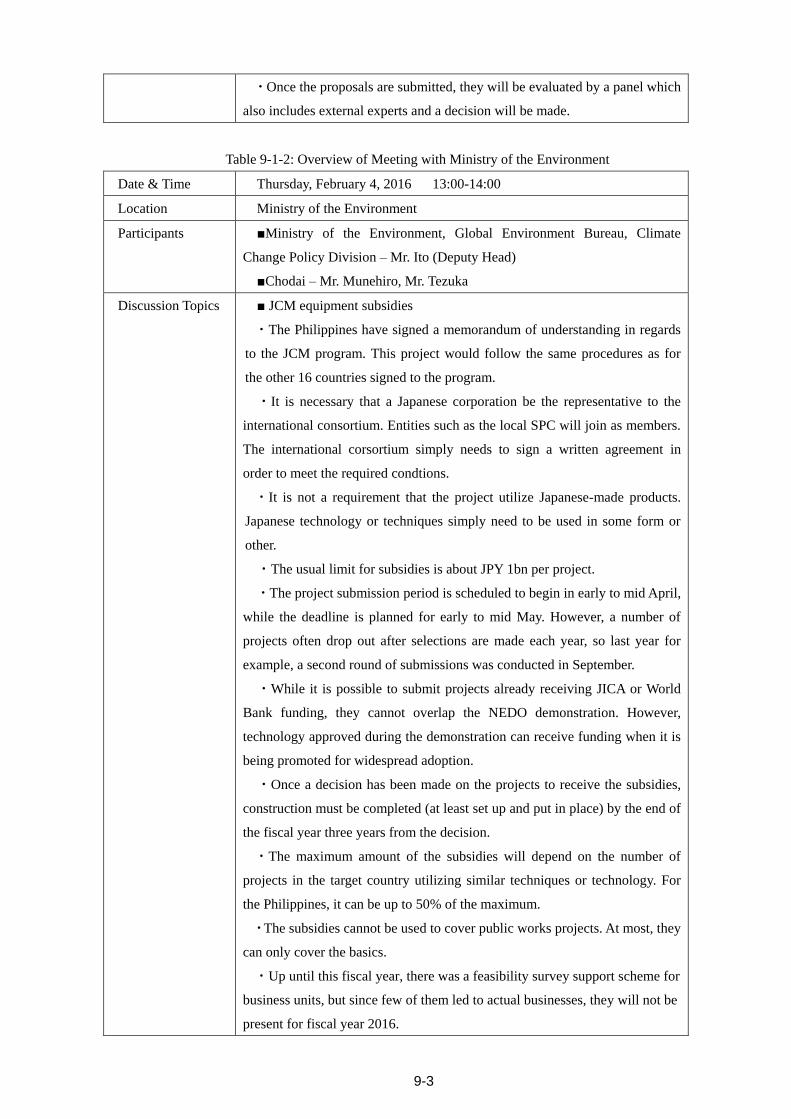
9-3
・Once the proposals are submitted, they will be evaluated by a panel which
also includes external experts and a decision will be made.
Table 9-1-2: Overview of Meeting with Ministry of the Environment
Date & Time Thursday, February 4, 2016 13:00-14:00
Location Ministry of the Environment
Participants ■Ministry of the Environment, Global Environment Bureau, Climate
Change Policy Division – Mr. Ito (Deputy Head)
■Chodai – Mr. Munehiro, Mr. Tezuka
Discussion Topics ■ JCM equipment subsidies
・The Philippines have signed a memorandum of understanding in regards
to the JCM program. This project would follow the same procedures as for
the other 16 countries signed to the program.
・It is necessary that a Japanese corporation be the representative to the
international consortium. Entities such as the local SPC will join as members.
The international corsortium simply needs to sign a written agreement in
order to meet the required condtions.
・It is not a requirement that the project utilize Japanese-made products.
Japanese technology or techniques simply need to be used in some form or
other.
・The usual limit for subsidies is about JPY 1bn per project.
・The project submission period is scheduled to begin in early to mid April,
while the deadline is planned for early to mid May. However, a number of
projects often drop out after selections are made each year, so last year for
example, a second round of submissions was conducted in September.
・While it is possible to submit projects already receiving JICA or World
Bank funding, they cannot overlap the NEDO demonstration. However,
technology approved during the demonstration can receive funding when it is
being promoted for widespread adoption.
・Once a decision has been made on the projects to receive the subsidies,
construction must be completed (at least set up and put in place) by the end of
the fiscal year three years from the decision.
・The maximum amount of the subsidies will depend on the number of
projects in the target country utilizing similar techniques or technology. For
the Philippines, it can be up to 50% of the maximum.
・The subsidies cannot be used to cover public works projects. At most, they
can only cover the basics.
・Up until this fiscal year, there was a feasibility survey support scheme for
business units, but since few of them led to actual businesses, they will not be
present for fiscal year 2016.
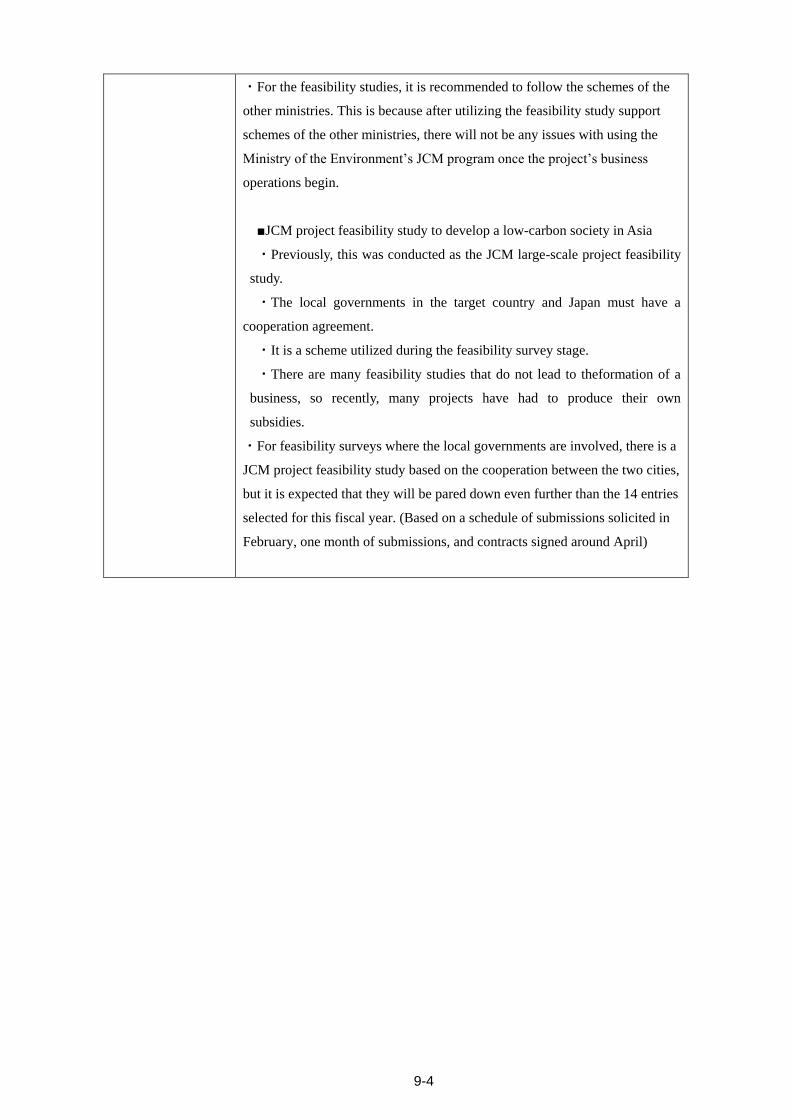
9-4
・For the feasibility studies, it is recommended to follow the schemes of the
other ministries. This is because after utilizing the feasibility study support
schemes of the other ministries, there will not be any issues with using the
Ministry of the Environment’s JCM program once the project’s business
operations begin.
■JCM project feasibility study to develop a low-carbon society in Asia
・Previously, this was conducted as the JCM large-scale project feasibility
study.
・The local governments in the target country and Japan must have a
cooperation agreement.
・It is a scheme utilized during the feasibility survey stage.
・There are many feasibility studies that do not lead to theformation of a
business, so recently, many projects have had to produce their own
subsidies.
・For feasibility surveys where the local governments are involved, there is a
JCM project feasibility study based on the cooperation between the two cities,
but it is expected that they will be pared down even further than the 14 entries
selected for this fiscal year. (Based on a schedule of submissions solicited in
February, one month of submissions, and contracts signed around April)
9-5
(2) Funding feasibility
The generation of sufficient cash flow by the project is a major prerequisite to the feasibility of
funding, both in terms of lending and investment. On this point, the project has great social significance,
as verified by the economic assessment in Chapter 5, and in terms of funding, the meetings conducted as
detailed in section (1) above revealed a strong possibility of assistance for the project from the Ministry
of the Environment and NEDO. When envisaging such assistance, the feasibility of both projects is
increased and the possibility of the projects being established as projects involving private sector
companies also rises. In addition, there is increased confidence in funding for the lending element, and
while a financial analysis incorporating feedback on the lending terms would need to be carried out, the
potential for fund procurement is high.
A summary is given below concerning the feasibility of funding for the project, from both the lending
and investment perspectives.
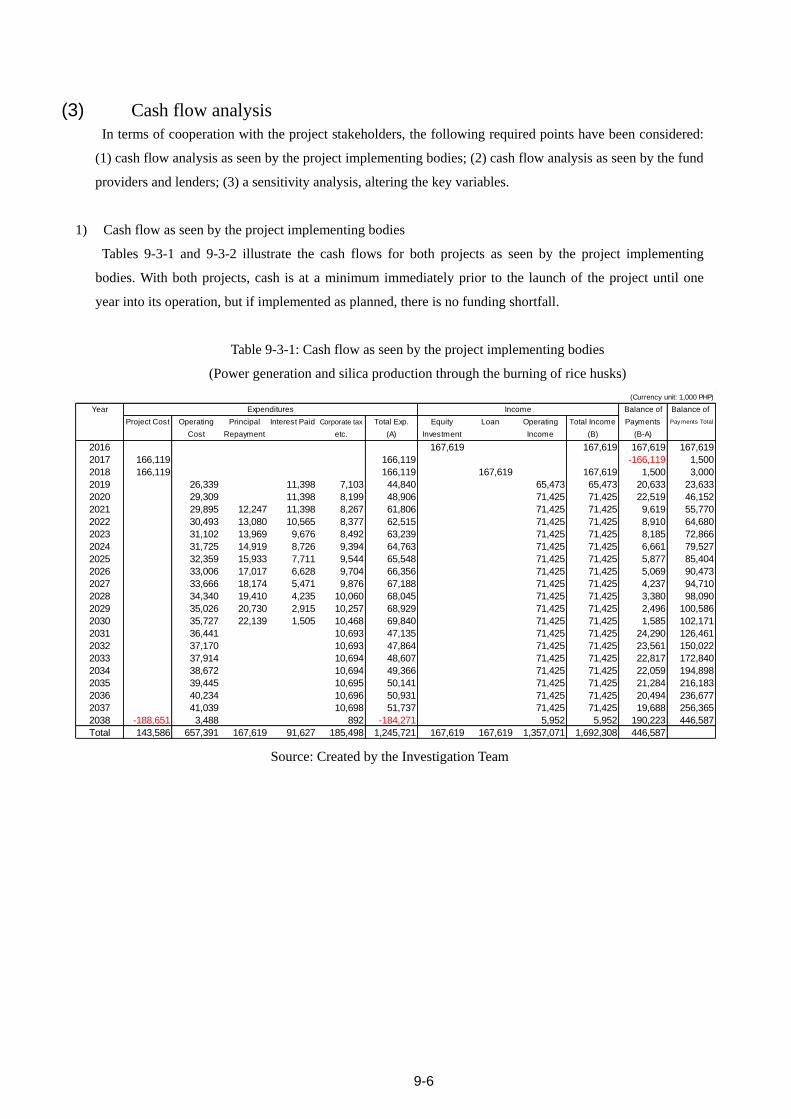
9-6
(3) Cash flow analysis
In terms of cooperation with the project stakeholders, the following required points have been considered:
(1) cash flow analysis as seen by the project implementing bodies; (2) cash flow analysis as seen by the fund
providers and lenders; (3) a sensitivity analysis, altering the key variables.
1) Cash flow as seen by the project implementing bodies
Tables 9-3-1 and 9-3-2 illustrate the cash flows for both projects as seen by the project implementing
bodies. With both projects, cash is at a minimum immediately prior to the launch of the project until one
year into its operation, but if implemented as planned, there is no funding shortfall.
Table 9-3-1: Cash flow as seen by the project implementing bodies
(Power generation and silica production through the burning of rice husks)
(Currency unit: 1,000 PHP)
Year Expenditures Income Balance of Balance of
Project Cost Operating Principal Interest Paid Corporate tax Total Exp. Equity Loan Operating Total Income Payments Pay ments Total
Cost Repayment etc. (A) Investment Income (B) (B-A)
2016 167,619 167,619 167,619 167,619
2017 166,119 166,119 -166,119 1,500
2018 166,119 166,119 167,619 167,619 1,500 3,000
2019 26,339 11,398 7,103 44,840 65,473 65,473 20,633 23,633
2020 29,309 11,398 8,199 48,906 71,425 71,425 22,519 46,152
2021 29,895 12,247 11,398 8,267 61,806 71,425 71,425 9,619 55,770
2022 30,493 13,080 10,565 8,377 62,515 71,425 71,425 8,910 64,680
2023 31,102 13,969 9,676 8,492 63,239 71,425 71,425 8,185 72,866
2024 31,725 14,919 8,726 9,394 64,763 71,425 71,425 6,661 79,527
2025 32,359 15,933 7,711 9,544 65,548 71,425 71,425 5,877 85,404
2026 33,006 17,017 6,628 9,704 66,356 71,425 71,425 5,069 90,473
2027 33,666 18,174 5,471 9,876 67,188 71,425 71,425 4,237 94,710
2028 34,340 19,410 4,235 10,060 68,045 71,425 71,425 3,380 98,090
2029 35,026 20,730 2,915 10,257 68,929 71,425 71,425 2,496 100,586
2030 35,727 22,139 1,505 10,468 69,840 71,425 71,425 1,585 102,171
2031 36,441 10,693 47,135 71,425 71,425 24,290 126,461
2032 37,170 10,693 47,864 71,425 71,425 23,561 150,022
2033 37,914 10,694 48,607 71,425 71,425 22,817 172,840
2034 38,672 10,694 49,366 71,425 71,425 22,059 194,898
2035 39,445 10,695 50,141 71,425 71,425 21,284 216,183
2036 40,234 10,696 50,931 71,425 71,425 20,494 236,677
2037 41,039 10,698 51,737 71,425 71,425 19,688 256,365
2038 -188,651 3,488 892 -184,271 5,952 5,952 190,223 446,587
Total 143,586 657,391 167,619 91,627 185,498 1,245,721 167,619 167,619 1,357,071 1,692,308 446,587
Source: Created by the Investigation Team
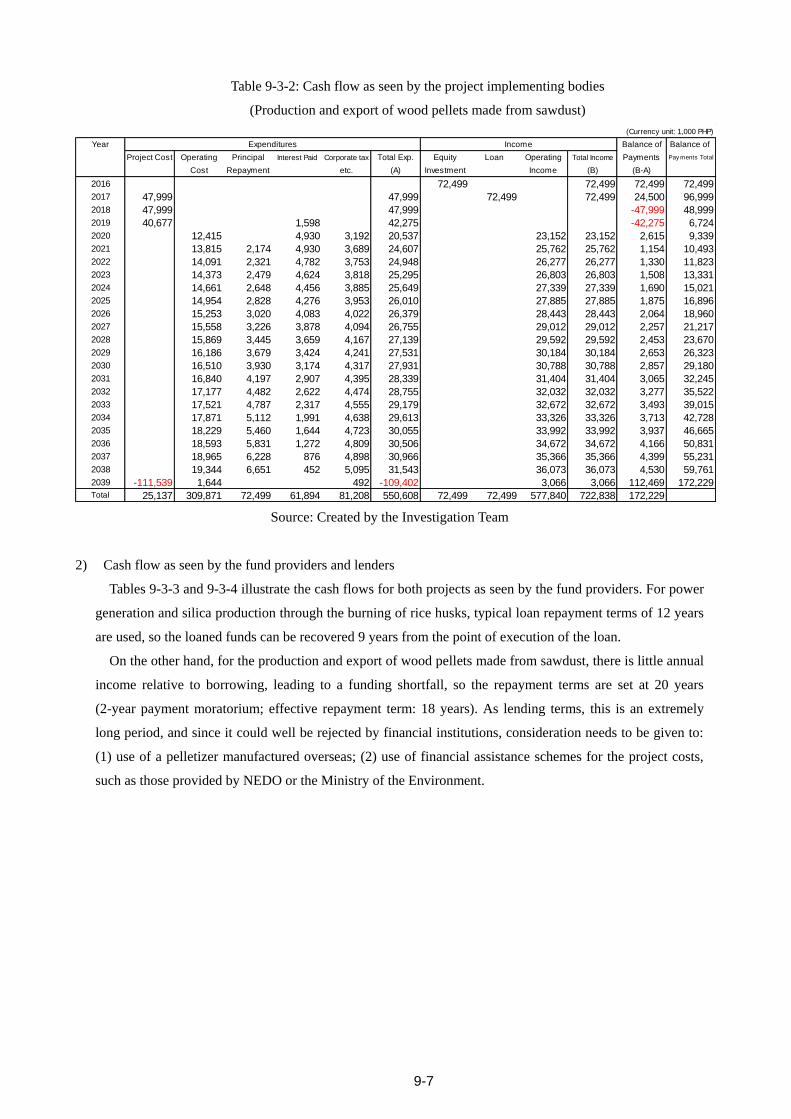
9-7
Table 9-3-2: Cash flow as seen by the project implementing bodies
(Production and export of wood pellets made from sawdust)
(Currency unit: 1,000 PHP)
Year Expenditures Income Balance of Balance of
Project Cost Operating Principal Interest Paid Corporate tax Total Exp. Equity Loan Operating Total Income Payments Pay ments Total
Cost Repayment etc. (A) Investment Income (B) (B-A)
2016 72,499 72,499 72,499 72,499
2017 47,999 47,999 72,499 72,499 24,500 96,999
2018 47,999 47,999 -47,999 48,999
2019 40,677 1,598 42,275 -42,275 6,724
2020 12,415 4,930 3,192 20,537 23,152 23,152 2,615 9,339
2021 13,815 2,174 4,930 3,689 24,607 25,762 25,762 1,154 10,493
2022 14,091 2,321 4,782 3,753 24,948 26,277 26,277 1,330 11,823
2023 14,373 2,479 4,624 3,818 25,295 26,803 26,803 1,508 13,331
2024 14,661 2,648 4,456 3,885 25,649 27,339 27,339 1,690 15,021
2025 14,954 2,828 4,276 3,953 26,010 27,885 27,885 1,875 16,896
2026 15,253 3,020 4,083 4,022 26,379 28,443 28,443 2,064 18,960
2027 15,558 3,226 3,878 4,094 26,755 29,012 29,012 2,257 21,217
2028 15,869 3,445 3,659 4,167 27,139 29,592 29,592 2,453 23,670
2029 16,186 3,679 3,424 4,241 27,531 30,184 30,184 2,653 26,323
2030 16,510 3,930 3,174 4,317 27,931 30,788 30,788 2,857 29,180
2031 16,840 4,197 2,907 4,395 28,339 31,404 31,404 3,065 32,245
2032 17,177 4,482 2,622 4,474 28,755 32,032 32,032 3,277 35,522
2033 17,521 4,787 2,317 4,555 29,179 32,672 32,672 3,493 39,015
2034 17,871 5,112 1,991 4,638 29,613 33,326 33,326 3,713 42,728
2035 18,229 5,460 1,644 4,723 30,055 33,992 33,992 3,937 46,665
2036 18,593 5,831 1,272 4,809 30,506 34,672 34,672 4,166 50,831
2037 18,965 6,228 876 4,898 30,966 35,366 35,366 4,399 55,231
2038 19,344 6,651 452 5,095 31,543 36,073 36,073 4,530 59,761
2039 -111,539 1,644 492 -109,402 3,066 3,066 112,469 172,229Total 25,137 309,871 72,499 61,894 81,208 550,608 72,499 72,499 577,840 722,838 172,229
Source: Created by the Investigation Team
2) Cash flow as seen by the fund providers and lenders
Tables 9-3-3 and 9-3-4 illustrate the cash flows for both projects as seen by the fund providers. For power
generation and silica production through the burning of rice husks, typical loan repayment terms of 12 years
are used, so the loaned funds can be recovered 9 years from the point of execution of the loan.
On the other hand, for the production and export of wood pellets made from sawdust, there is little annual
income relative to borrowing, leading to a funding shortfall, so the repayment terms are set at 20 years
(2-year payment moratorium; effective repayment term: 18 years). As lending terms, this is an extremely
long period, and since it could well be rejected by financial institutions, consideration needs to be given to:
(1) use of a pelletizer manufactured overseas; (2) use of financial assistance schemes for the project costs,
such as those provided by NEDO or the Ministry of the Environment.
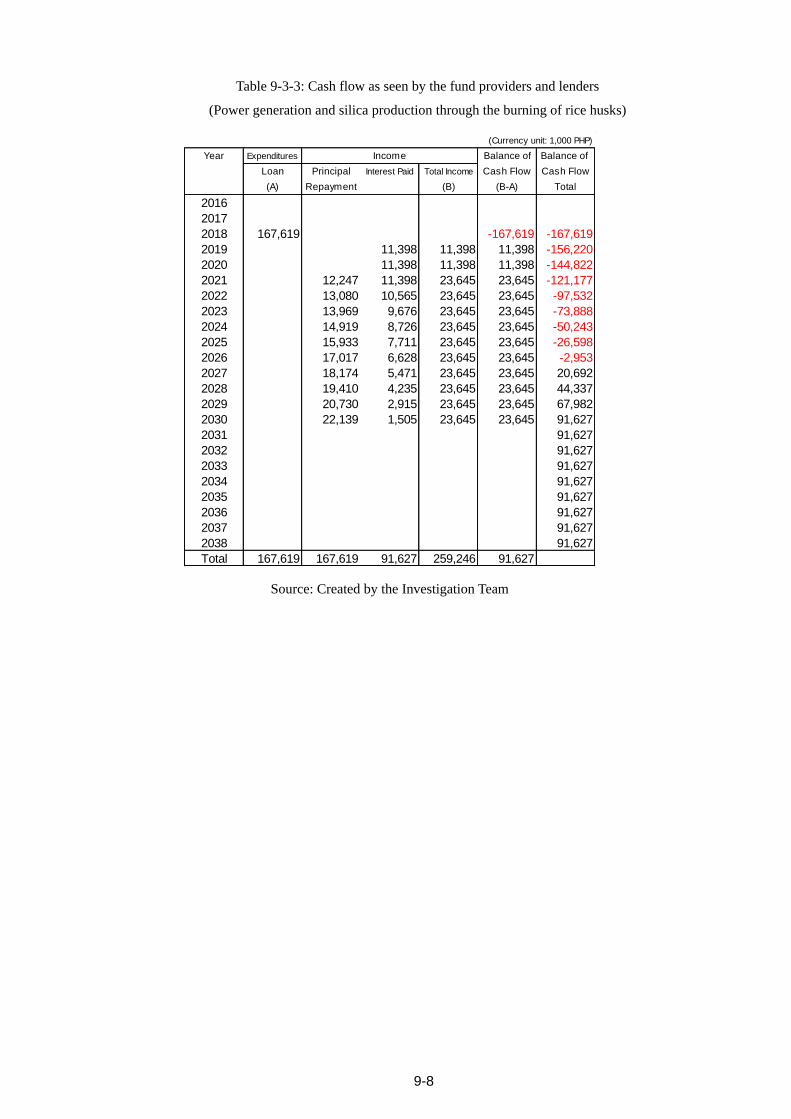
9-8
Table 9-3-3: Cash flow as seen by the fund providers and lenders
(Power generation and silica production through the burning of rice husks)
(Currency unit: 1,000 PHP)
Year Expenditures Income Balance of Balance of
Loan Principal Interest Paid Total Income Cash Flow Cash Flow
(A) Repayment (B) (B-A) Total
2016
2017
2018 167,619 -167,619 -167,619
2019 11,398 11,398 11,398 -156,220
2020 11,398 11,398 11,398 -144,822
2021 12,247 11,398 23,645 23,645 -121,177
2022 13,080 10,565 23,645 23,645 -97,532
2023 13,969 9,676 23,645 23,645 -73,888
2024 14,919 8,726 23,645 23,645 -50,243
2025 15,933 7,711 23,645 23,645 -26,598
2026 17,017 6,628 23,645 23,645 -2,953
2027 18,174 5,471 23,645 23,645 20,692
2028 19,410 4,235 23,645 23,645 44,337
2029 20,730 2,915 23,645 23,645 67,982
2030 22,139 1,505 23,645 23,645 91,627
2031 91,627
2032 91,627
2033 91,627
2034 91,627
2035 91,627
2036 91,627
2037 91,627
2038 91,627
Total 167,619 167,619 91,627 259,246 91,627
Source: Created by the Investigation Team
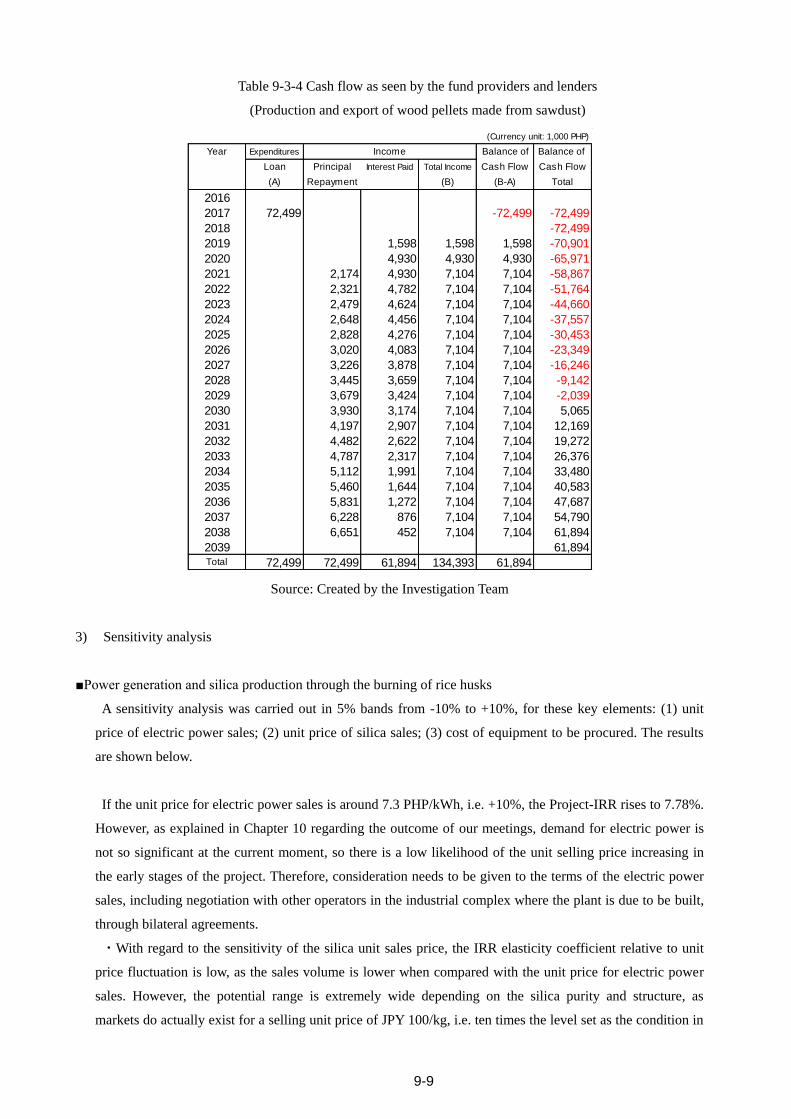
9-9
Table 9-3-4 Cash flow as seen by the fund providers and lenders
(Production and export of wood pellets made from sawdust)
(Currency unit: 1,000 PHP)
Year Expenditures Income Balance of Balance of
Loan Principal Interest Paid Total Income Cash Flow Cash Flow
(A) Repayment (B) (B-A) Total
2016
2017 72,499 -72,499 -72,499
2018 -72,499
2019 1,598 1,598 1,598 -70,901
2020 4,930 4,930 4,930 -65,971
2021 2,174 4,930 7,104 7,104 -58,867
2022 2,321 4,782 7,104 7,104 -51,764
2023 2,479 4,624 7,104 7,104 -44,660
2024 2,648 4,456 7,104 7,104 -37,557
2025 2,828 4,276 7,104 7,104 -30,453
2026 3,020 4,083 7,104 7,104 -23,349
2027 3,226 3,878 7,104 7,104 -16,246
2028 3,445 3,659 7,104 7,104 -9,142
2029 3,679 3,424 7,104 7,104 -2,039
2030 3,930 3,174 7,104 7,104 5,065
2031 4,197 2,907 7,104 7,104 12,169
2032 4,482 2,622 7,104 7,104 19,272
2033 4,787 2,317 7,104 7,104 26,376
2034 5,112 1,991 7,104 7,104 33,480
2035 5,460 1,644 7,104 7,104 40,583
2036 5,831 1,272 7,104 7,104 47,687
2037 6,228 876 7,104 7,104 54,790
2038 6,651 452 7,104 7,104 61,894
2039 61,894Total 72,499 72,499 61,894 134,393 61,894
Source: Created by the Investigation Team
3) Sensitivity analysis
■Power generation and silica production through the burning of rice husks
A sensitivity analysis was carried out in 5% bands from -10% to +10%, for these key elements: (1) unit
price of electric power sales; (2) unit price of silica sales; (3) cost of equipment to be procured. The results
are shown below.
If the unit price for electric power sales is around 7.3 PHP/kWh, i.e. +10%, the Project-IRR rises to 7.78%.
However, as explained in Chapter 10 regarding the outcome of our meetings, demand for electric power is
not so significant at the current moment, so there is a low likelihood of the unit selling price increasing in
the early stages of the project. Therefore, consideration needs to be given to the terms of the electric power
sales, including negotiation with other operators in the industrial complex where the plant is due to be built,
through bilateral agreements.
・With regard to the sensitivity of the silica unit sales price, the IRR elasticity coefficient relative to unit
price fluctuation is low, as the sales volume is lower when compared with the unit price for electric power
sales. However, the potential range is extremely wide depending on the silica purity and structure, as
markets do actually exist for a selling unit price of JPY 100/kg, i.e. ten times the level set as the condition in
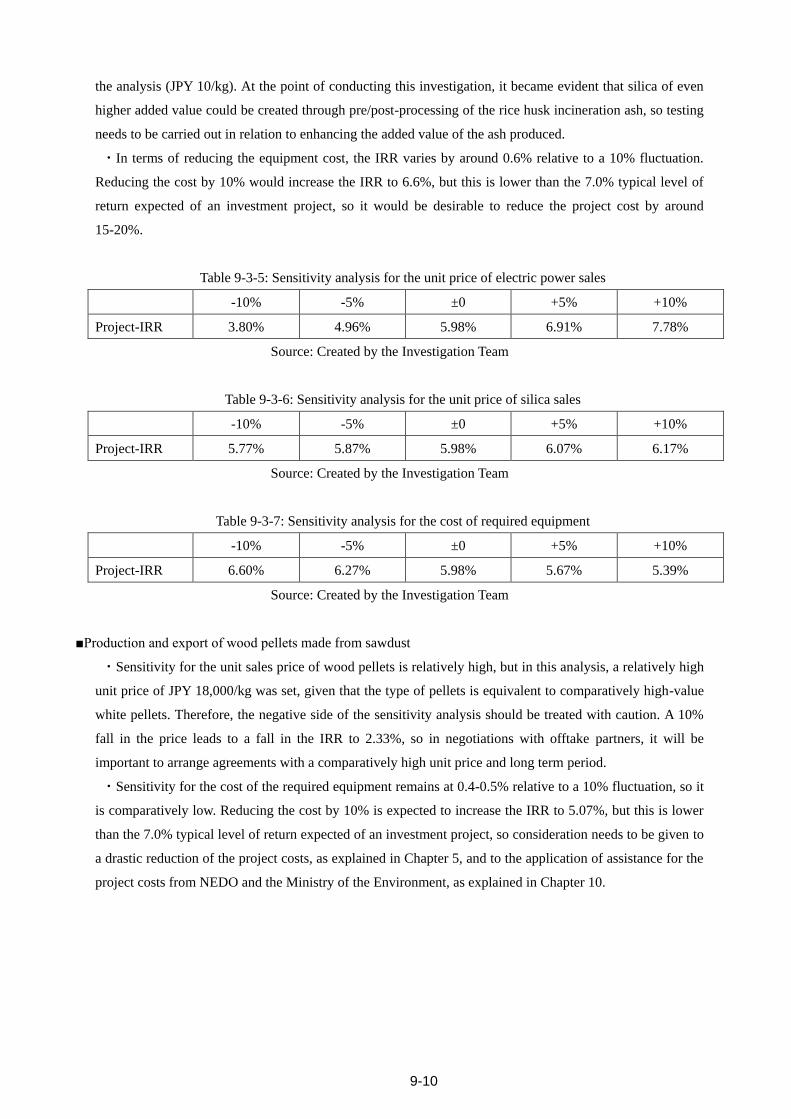
9-10
the analysis (JPY 10/kg). At the point of conducting this investigation, it became evident that silica of even
higher added value could be created through pre/post-processing of the rice husk incineration ash, so testing
needs to be carried out in relation to enhancing the added value of the ash produced.
・In terms of reducing the equipment cost, the IRR varies by around 0.6% relative to a 10% fluctuation.
Reducing the cost by 10% would increase the IRR to 6.6%, but this is lower than the 7.0% typical level of
return expected of an investment project, so it would be desirable to reduce the project cost by around
15-20%.
Table 9-3-5: Sensitivity analysis for the unit price of electric power sales
-10% -5% ±0 +5% +10%
Project-IRR 3.80% 4.96% 5.98% 6.91% 7.78%
Source: Created by the Investigation Team
Table 9-3-6: Sensitivity analysis for the unit price of silica sales
-10% -5% ±0 +5% +10%
Project-IRR 5.77% 5.87% 5.98% 6.07% 6.17%
Source: Created by the Investigation Team
Table 9-3-7: Sensitivity analysis for the cost of required equipment
-10% -5% ±0 +5% +10%
Project-IRR 6.60% 6.27% 5.98% 5.67% 5.39%
Source: Created by the Investigation Team
■Production and export of wood pellets made from sawdust
・Sensitivity for the unit sales price of wood pellets is relatively high, but in this analysis, a relatively high
unit price of JPY 18,000/kg was set, given that the type of pellets is equivalent to comparatively high-value
white pellets. Therefore, the negative side of the sensitivity analysis should be treated with caution. A 10%
fall in the price leads to a fall in the IRR to 2.33%, so in negotiations with offtake partners, it will be
important to arrange agreements with a comparatively high unit price and long term period.
・Sensitivity for the cost of the required equipment remains at 0.4-0.5% relative to a 10% fluctuation, so it
is comparatively low. Reducing the cost by 10% is expected to increase the IRR to 5.07%, but this is lower
than the 7.0% typical level of return expected of an investment project, so consideration needs to be given to
a drastic reduction of the project costs, as explained in Chapter 5, and to the application of assistance for the
project costs from NEDO and the Ministry of the Environment, as explained in Chapter 10.
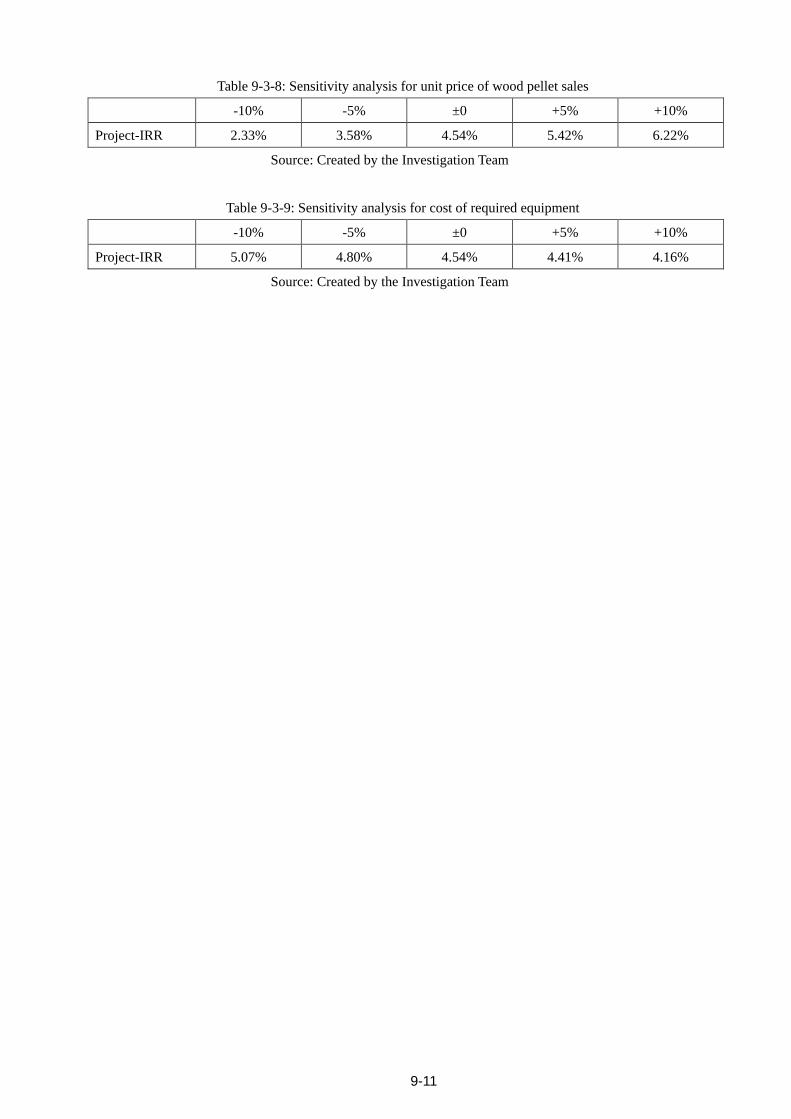
9-11
Table 9-3-8: Sensitivity analysis for unit price of wood pellet sales
-10% -5% ±0 +5% +10%
Project-IRR 2.33% 3.58% 4.54% 5.42% 6.22%
Source: Created by the Investigation Team
Table 9-3-9: Sensitivity analysis for cost of required equipment
-10% -5% ±0 +5% +10%
Project-IRR 5.07% 4.80% 4.54% 4.41% 4.16%
Source: Created by the Investigation Team
Chapter 10 Action Plan & Challenges to Project
Implementation
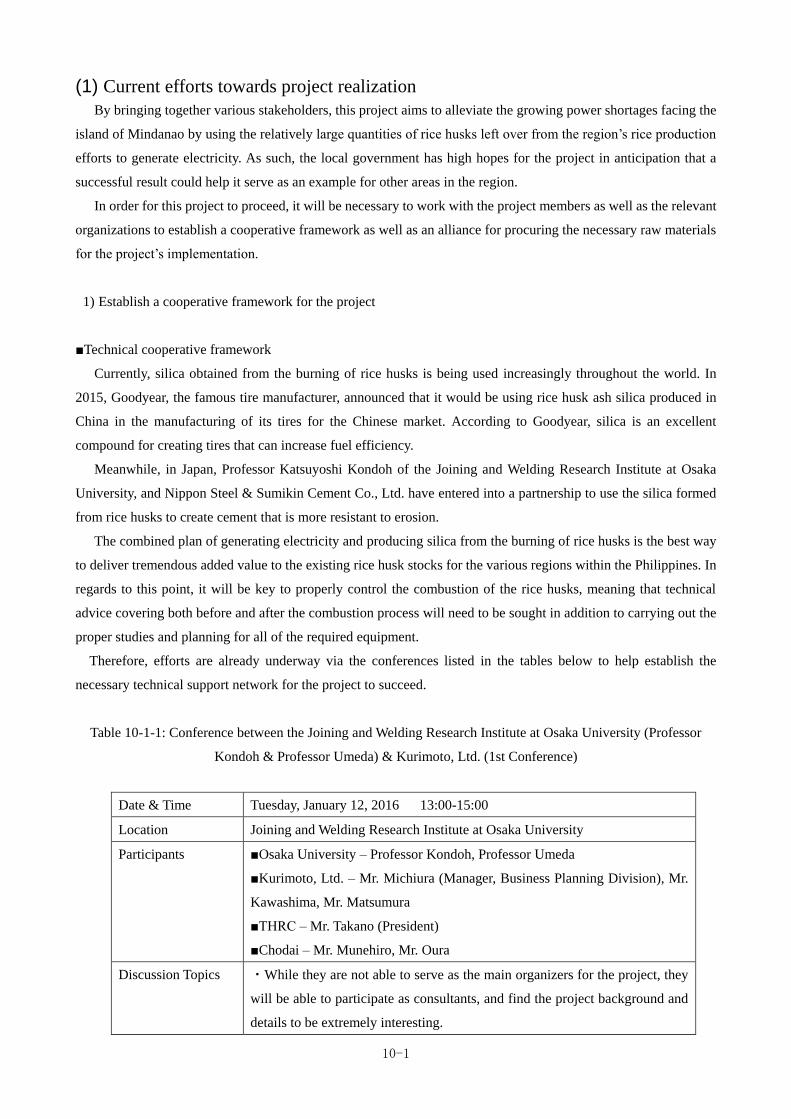
10-1
(1) Current efforts towards project realization
By bringing together various stakeholders, this project aims to alleviate the growing power shortages facing the
island of Mindanao by using the relatively large quantities of rice husks left over from the region’s rice production
efforts to generate electricity. As such, the local government has high hopes for the project in anticipation that a
successful result could help it serve as an example for other areas in the region.
In order for this project to proceed, it will be necessary to work with the project members as well as the relevant
organizations to establish a cooperative framework as well as an alliance for procuring the necessary raw materials
for the project’s implementation.
1) Establish a cooperative framework for the project
■Technical cooperative framework
Currently, silica obtained from the burning of rice husks is being used increasingly throughout the world. In
2015, Goodyear, the famous tire manufacturer, announced that it would be using rice husk ash silica produced in
China in the manufacturing of its tires for the Chinese market. According to Goodyear, silica is an excellent
compound for creating tires that can increase fuel efficiency.
Meanwhile, in Japan, Professor Katsuyoshi Kondoh of the Joining and Welding Research Institute at Osaka
University, and Nippon Steel & Sumikin Cement Co., Ltd. have entered into a partnership to use the silica formed
from rice husks to create cement that is more resistant to erosion.
The combined plan of generating electricity and producing silica from the burning of rice husks is the best way
to deliver tremendous added value to the existing rice husk stocks for the various regions within the Philippines. In
regards to this point, it will be key to properly control the combustion of the rice husks, meaning that technical
advice covering both before and after the combustion process will need to be sought in addition to carrying out the
proper studies and planning for all of the required equipment.
Therefore, efforts are already underway via the conferences listed in the tables below to help establish the
necessary technical support network for the project to succeed.
Table 10-1-1: Conference between the Joining and Welding Research Institute at Osaka University (Professor
Kondoh & Professor Umeda) & Kurimoto, Ltd. (1st Conference)
Date & Time Tuesday, January 12, 2016 13:00-15:00
Location Joining and Welding Research Institute at Osaka University
Participants ■Osaka University – Professor Kondoh, Professor Umeda
■Kurimoto, Ltd. – Mr. Michiura (Manager, Business Planning Division), Mr.
Kawashima, Mr. Matsumura
■THRC – Mr. Takano (President)
■Chodai – Mr. Munehiro, Mr. Oura
Discussion Topics ・While they are not able to serve as the main organizers for the project, they
will be able to participate as consultants, and find the project background and
details to be extremely interesting.
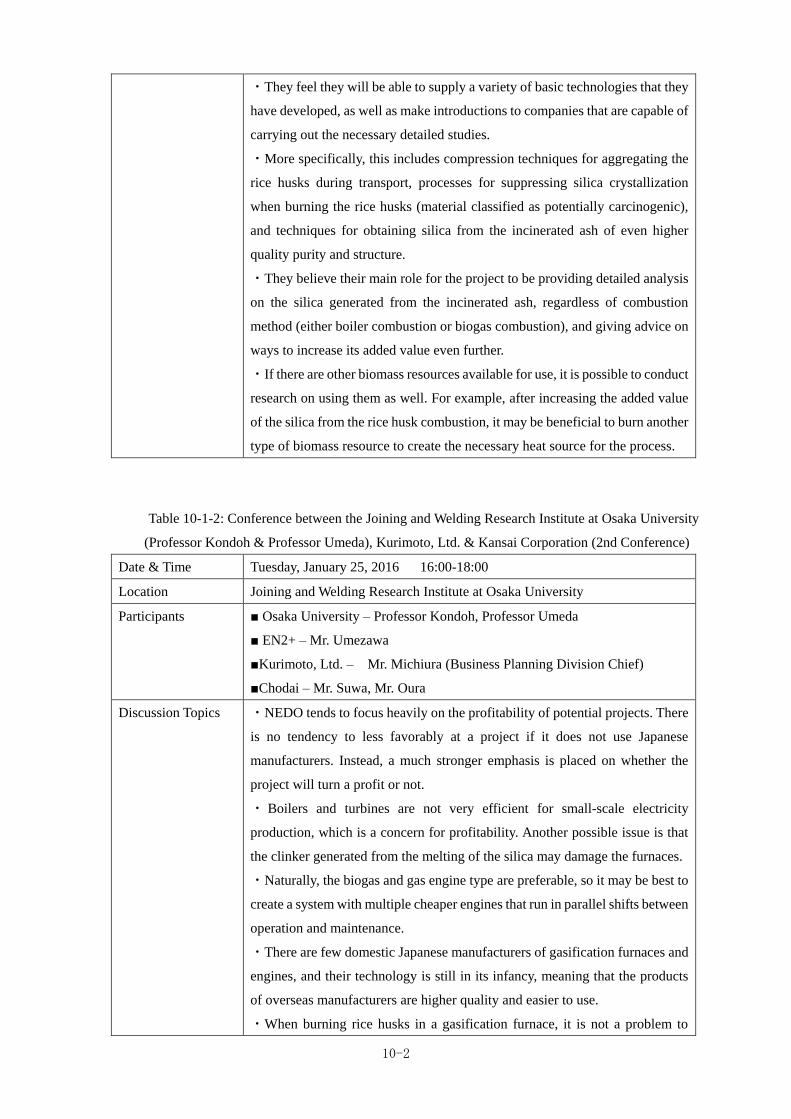
10-2
・They feel they will be able to supply a variety of basic technologies that they
have developed, as well as make introductions to companies that are capable of
carrying out the necessary detailed studies.
・More specifically, this includes compression techniques for aggregating the
rice husks during transport, processes for suppressing silica crystallization
when burning the rice husks (material classified as potentially carcinogenic),
and techniques for obtaining silica from the incinerated ash of even higher
quality purity and structure.
・They believe their main role for the project to be providing detailed analysis
on the silica generated from the incinerated ash, regardless of combustion
method (either boiler combustion or biogas combustion), and giving advice on
ways to increase its added value even further.
・If there are other biomass resources available for use, it is possible to conduct
research on using them as well. For example, after increasing the added value
of the silica from the rice husk combustion, it may be beneficial to burn another
type of biomass resource to create the necessary heat source for the process.
Table 10-1-2: Conference between the Joining and Welding Research Institute at Osaka University
(Professor Kondoh & Professor Umeda), Kurimoto, Ltd. & Kansai Corporation (2nd Conference)
Date & Time Tuesday, January 25, 2016 16:00-18:00
Location Joining and Welding Research Institute at Osaka University
Participants ■ Osaka University – Professor Kondoh, Professor Umeda
■ EN2+ – Mr. Umezawa
■Kurimoto, Ltd. – Mr. Michiura (Business Planning Division Chief)
■Chodai – Mr. Suwa, Mr. Oura
Discussion Topics ・NEDO tends to focus heavily on the profitability of potential projects. There
is no tendency to less favorably at a project if it does not use Japanese
manufacturers. Instead, a much stronger emphasis is placed on whether the
project will turn a profit or not.
・ Boilers and turbines are not very efficient for small-scale electricity
production, which is a concern for profitability. Another possible issue is that
the clinker generated from the melting of the silica may damage the furnaces.
・Naturally, the biogas and gas engine type are preferable, so it may be best to
create a system with multiple cheaper engines that run in parallel shifts between
operation and maintenance.
・There are few domestic Japanese manufacturers of gasification furnaces and
engines, and their technology is still in its infancy, meaning that the products
of overseas manufacturers are higher quality and easier to use.
・When burning rice husks in a gasification furnace, it is not a problem to
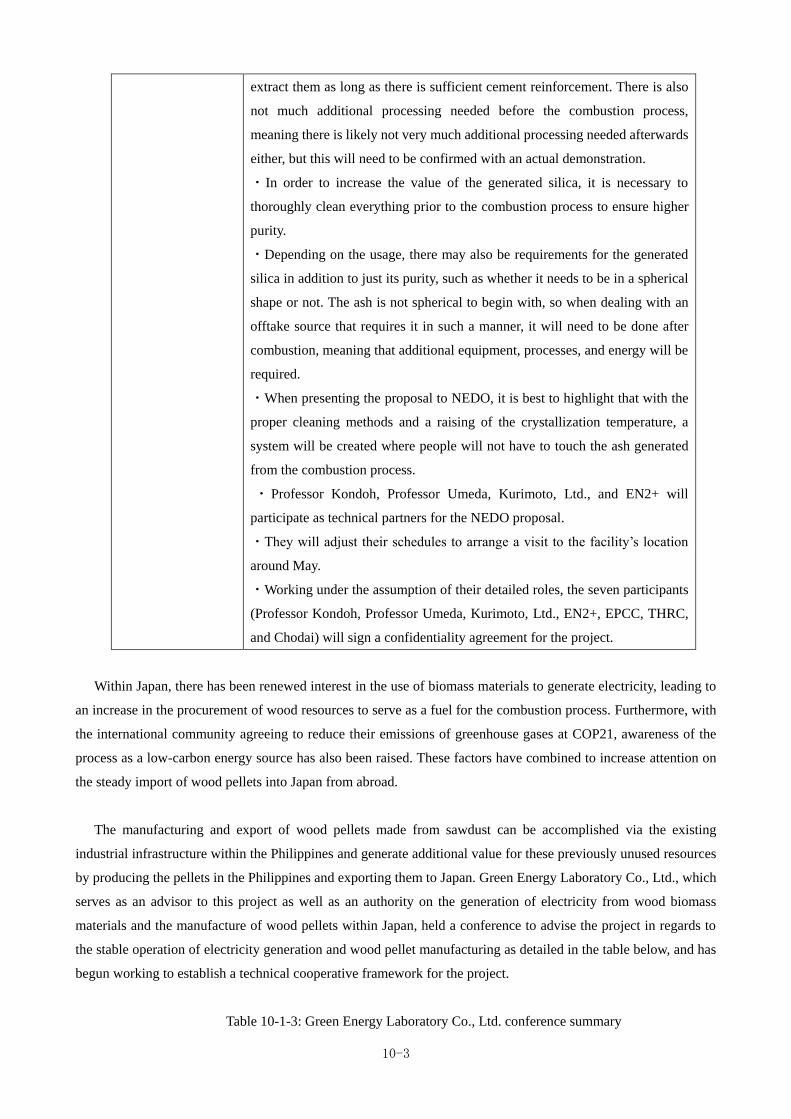
10-3
extract them as long as there is sufficient cement reinforcement. There is also
not much additional processing needed before the combustion process,
meaning there is likely not very much additional processing needed afterwards
either, but this will need to be confirmed with an actual demonstration.
・In order to increase the value of the generated silica, it is necessary to
thoroughly clean everything prior to the combustion process to ensure higher
purity.
・Depending on the usage, there may also be requirements for the generated
silica in addition to just its purity, such as whether it needs to be in a spherical
shape or not. The ash is not spherical to begin with, so when dealing with an
offtake source that requires it in such a manner, it will need to be done after
combustion, meaning that additional equipment, processes, and energy will be
required.
・When presenting the proposal to NEDO, it is best to highlight that with the
proper cleaning methods and a raising of the crystallization temperature, a
system will be created where people will not have to touch the ash generated
from the combustion process.
・ Professor Kondoh, Professor Umeda, Kurimoto, Ltd., and EN2+ will
participate as technical partners for the NEDO proposal.
・They will adjust their schedules to arrange a visit to the facility’s location
around May.
・Working under the assumption of their detailed roles, the seven participants
(Professor Kondoh, Professor Umeda, Kurimoto, Ltd., EN2+, EPCC, THRC,
and Chodai) will sign a confidentiality agreement for the project.
Within Japan, there has been renewed interest in the use of biomass materials to generate electricity, leading to
an increase in the procurement of wood resources to serve as a fuel for the combustion process. Furthermore, with
the international community agreeing to reduce their emissions of greenhouse gases at COP21, awareness of the
process as a low-carbon energy source has also been raised. These factors have combined to increase attention on
the steady import of wood pellets into Japan from abroad.
The manufacturing and export of wood pellets made from sawdust can be accomplished via the existing
industrial infrastructure within the Philippines and generate additional value for these previously unused resources
by producing the pellets in the Philippines and exporting them to Japan. Green Energy Laboratory Co., Ltd., which
serves as an advisor to this project as well as an authority on the generation of electricity from wood biomass
materials and the manufacture of wood pellets within Japan, held a conference to advise the project in regards to
the stable operation of electricity generation and wood pellet manufacturing as detailed in the table below, and has
begun working to establish a technical cooperative framework for the project.
Table 10-1-3: Green Energy Laboratory Co., Ltd. conference summary
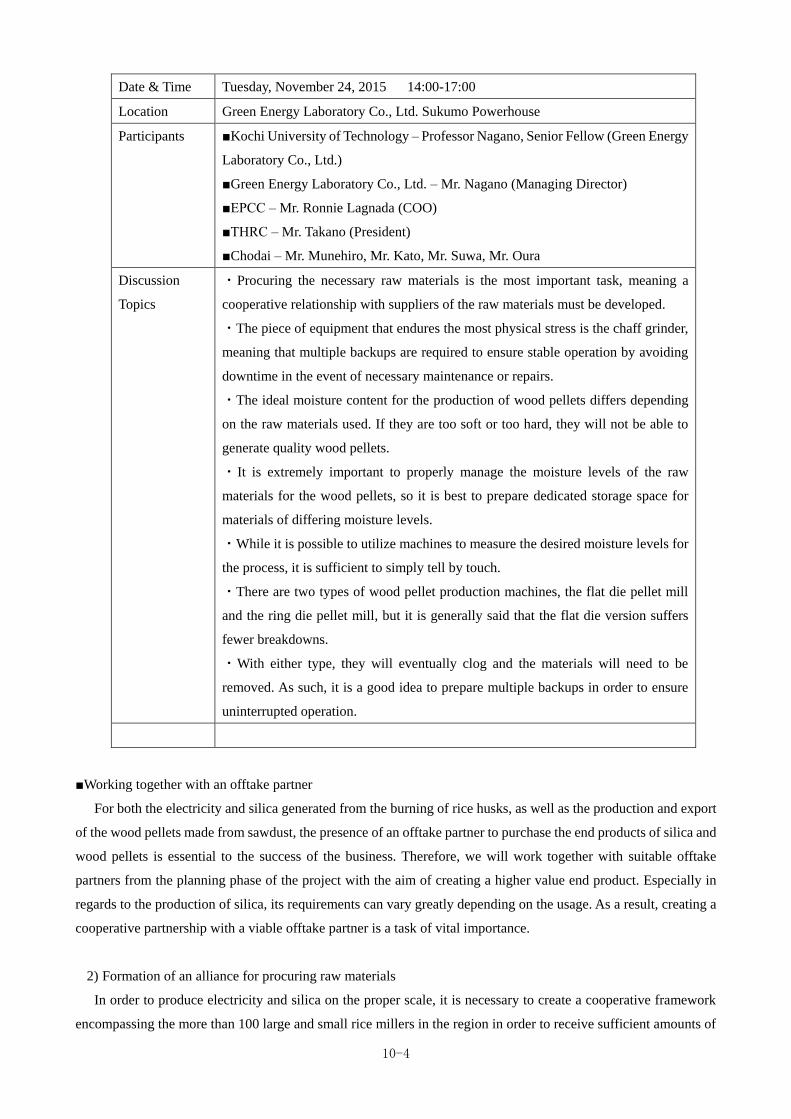
10-4
Date & Time Tuesday, November 24, 2015 14:00-17:00
Location Green Energy Laboratory Co., Ltd. Sukumo Powerhouse
Participants ■Kochi University of Technology – Professor Nagano, Senior Fellow (Green Energy
Laboratory Co., Ltd.)
■Green Energy Laboratory Co., Ltd. – Mr. Nagano (Managing Director)
■EPCC – Mr. Ronnie Lagnada (COO)
■THRC – Mr. Takano (President)
■Chodai – Mr. Munehiro, Mr. Kato, Mr. Suwa, Mr. Oura
Discussion
Topics
・Procuring the necessary raw materials is the most important task, meaning a
cooperative relationship with suppliers of the raw materials must be developed.
・The piece of equipment that endures the most physical stress is the chaff grinder,
meaning that multiple backups are required to ensure stable operation by avoiding
downtime in the event of necessary maintenance or repairs.
・The ideal moisture content for the production of wood pellets differs depending
on the raw materials used. If they are too soft or too hard, they will not be able to
generate quality wood pellets.
・It is extremely important to properly manage the moisture levels of the raw
materials for the wood pellets, so it is best to prepare dedicated storage space for
materials of differing moisture levels.
・While it is possible to utilize machines to measure the desired moisture levels for
the process, it is sufficient to simply tell by touch.
・There are two types of wood pellet production machines, the flat die pellet mill
and the ring die pellet mill, but it is generally said that the flat die version suffers
fewer breakdowns.
・With either type, they will eventually clog and the materials will need to be
removed. As such, it is a good idea to prepare multiple backups in order to ensure
uninterrupted operation.
■Working together with an offtake partner
For both the electricity and silica generated from the burning of rice husks, as well as the production and export
of the wood pellets made from sawdust, the presence of an offtake partner to purchase the end products of silica and
wood pellets is essential to the success of the business. Therefore, we will work together with suitable offtake
partners from the planning phase of the project with the aim of creating a higher value end product. Especially in
regards to the production of silica, its requirements can vary greatly depending on the usage. As a result, creating a
cooperative partnership with a viable offtake partner is a task of vital importance.
2) Formation of an alliance for procuring raw materials
In order to produce electricity and silica on the proper scale, it is necessary to create a cooperative framework
encompassing the more than 100 large and small rice millers in the region in order to receive sufficient amounts of
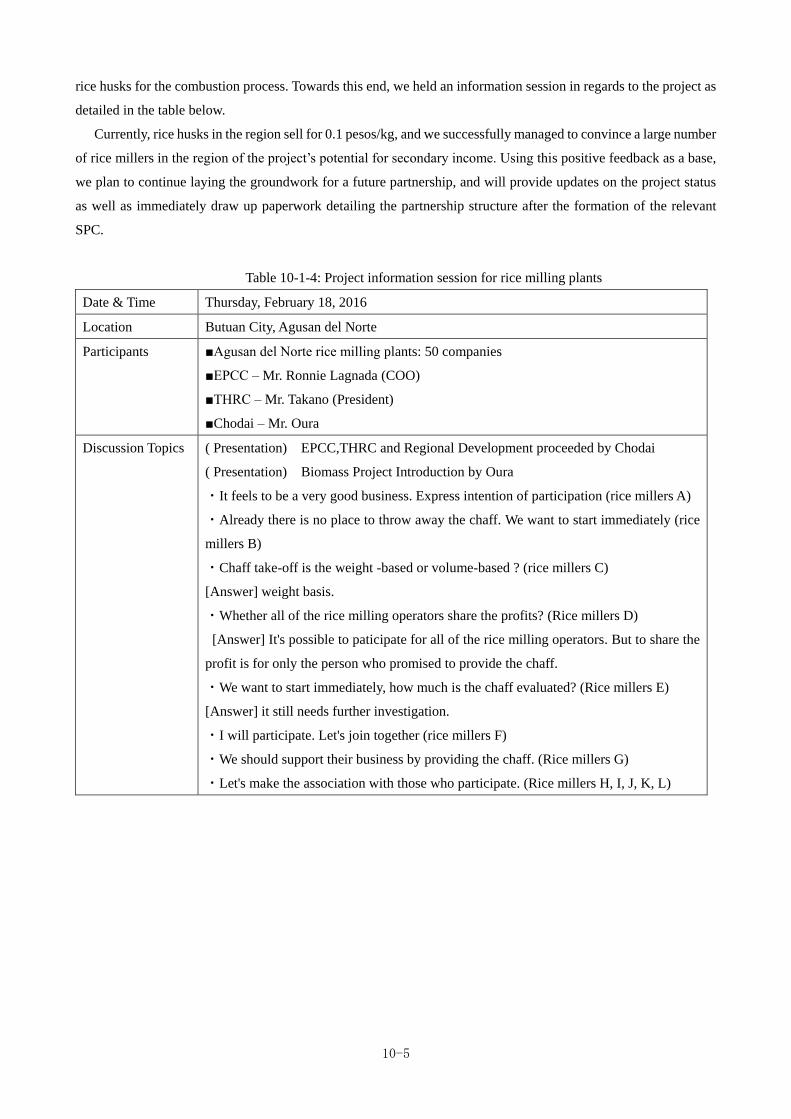
10-5
rice husks for the combustion process. Towards this end, we held an information session in regards to the project as
detailed in the table below.
Currently, rice husks in the region sell for 0.1 pesos/kg, and we successfully managed to convince a large number
of rice millers in the region of the project’s potential for secondary income. Using this positive feedback as a base,
we plan to continue laying the groundwork for a future partnership, and will provide updates on the project status
as well as immediately draw up paperwork detailing the partnership structure after the formation of the relevant
SPC.
Table 10-1-4: Project information session for rice milling plants
Date & Time Thursday, February 18, 2016
Location Butuan City, Agusan del Norte
Participants ■Agusan del Norte rice milling plants: 50 companies
■EPCC – Mr. Ronnie Lagnada (COO)
■THRC – Mr. Takano (President)
■Chodai – Mr. Oura
Discussion Topics ( Presentation) EPCC,THRC and Regional Development proceeded by Chodai
( Presentation) Biomass Project Introduction by Oura
・It feels to be a very good business. Express intention of participation (rice millers A)
・Already there is no place to throw away the chaff. We want to start immediately (rice
millers B)
・Chaff take-off is the weight -based or volume-based ? (rice millers C)
[Answer] weight basis.
・Whether all of the rice milling operators share the profits? (Rice millers D)
[Answer] It's possible to paticipate for all of the rice milling operators. But to share the
profit is for only the person who promised to provide the chaff.
・We want to start immediately, how much is the chaff evaluated? (Rice millers E)
[Answer] it still needs further investigation.
・I will participate. Let's join together (rice millers F)
・We should support their business by providing the chaff. (Rice millers G)
・Let's make the association with those who participate. (Rice millers H, I, J, K, L)
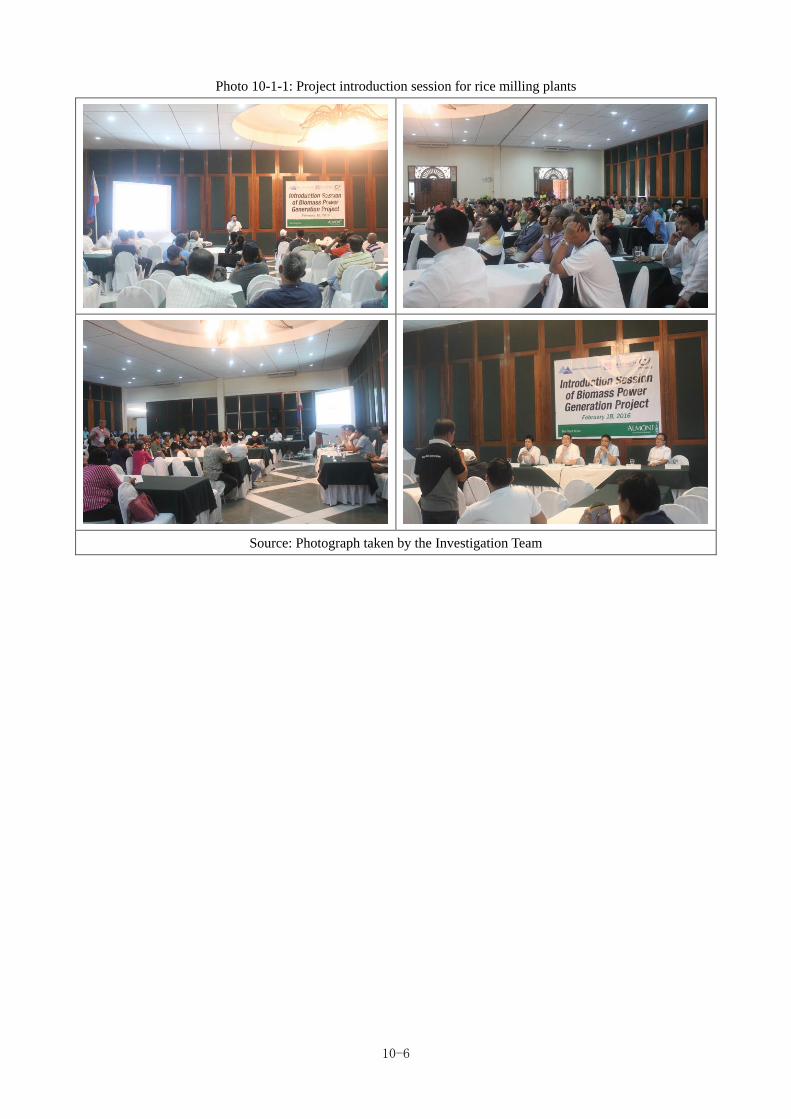
10-6
Photo 10-1-1: Project introduction session for rice milling plants
Source: Photograph taken by the Investigation Team
10-7
(2) Efforts to secure the cooperation of the local governmental authorities and
implementing bodies
■Rice farming-related institutions
There are two major institutions covering the area of rice farming in the Philippines: the rice farming research
institute known as PhilRice, and the National Food Authority (NFA), which is responsible for food safety for the
entire nation. The NFA is an especially important contributor to rice farming, as it is responsible for issuing licenses
to the rice milling plants. Additionally, there are already large quantities of rice husks from rice grown in the area
around the rice milling plants, leading to numerous rice milling plants burning the rice husks in order to generate
electricity.
For the purposes of this study, we visited the largest rice husk combustion power plant in the Philippines, a
20MW facility located in the Isabela region. The facility’s background, as well as the results of our meeting with its
operators are detailed in the table below.
Table 10-2-1: Rice husk combustion power plant survey results
Date & Time Saturday, January 16, 2016 14:00-17:00
Location Kawayan region, Luzon, Philippines
Participants ■Isabela La Suerte Rice Mill Corporation - Mr. Raymond Tan
■Green Asia Engineering – Mr. Maeda (President)
■Chodai – Mr. Oura
10-8
Discussion Topics ・They currently operate a 1MW plant to supply the electricity needs of the
mill. It utilizes equipment made in Belgium and Germany. At present, they
are constructing a 5MW plant since the current plant does not generate enough
electricity for their needs and will be utilizing Japanese-made turbines.
・There are three other plants nearby, generating 20MW, 2MW, and 2MW of
electricity, as well as a 60MW mixed-combustion plant that burns both rice
husks and bagasse. Rice husks are being used quite extensively, but there
seems to still be a surplus throughout the region as a whole.
・The price of rice husks varies depending on rice production, which is
affected by things such as the weather and seasons, but in general, it trades at
about 0.8 to 1.5 pesos/kg. (However, this is the price based on hauling the rice
husks about 30km from here to the powerhouse.)
・For transporting the rice husks, a trailer will be modified to fit a 40ft
container, and with the space saved by utilizing a lower floor, the container
can be loaded onto the trailer (20t/container).
・They currently do not have any use for the ash generated from the
combustion and are eager to implement any methods to help in that regard.
・Since the electricity generated is used for internal use within the plant, it is
running 24 hours a day, so it therefore requires rice husks all throughout the
day as well. This means that they also need to run the machine to separate the
rice from the husks all day long.
・However, since they only mill rice during the daytime, they have silos to
store the brown rice obtained from the husking process during the night until
the rice milling process begins again the following day.
・The rice is usually stored in either its unhulled or milled form.
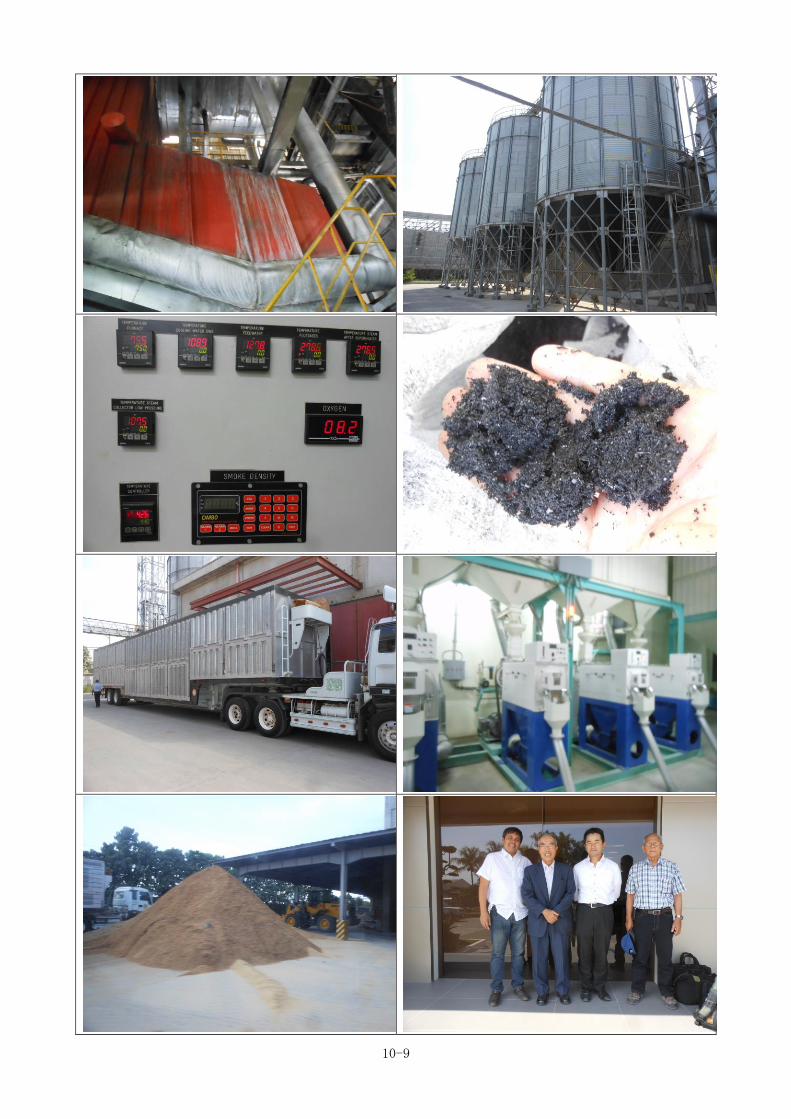
10-9
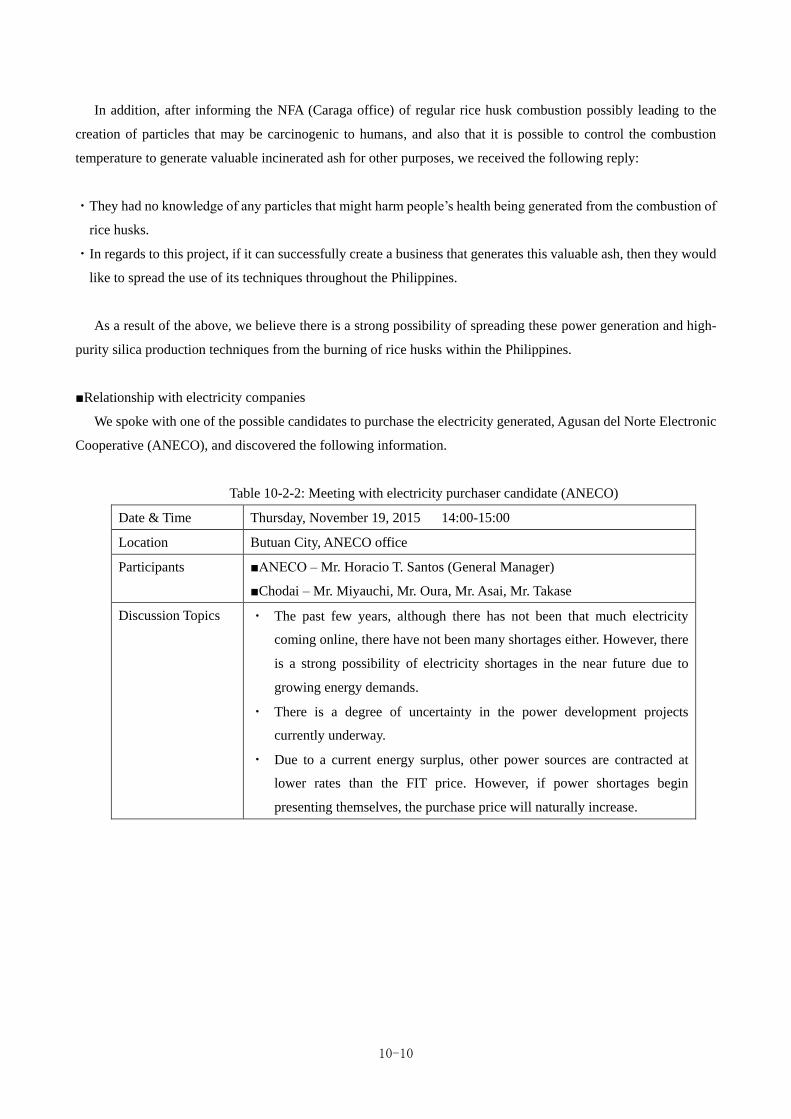
10-10
In addition, after informing the NFA (Caraga office) of regular rice husk combustion possibly leading to the
creation of particles that may be carcinogenic to humans, and also that it is possible to control the combustion
temperature to generate valuable incinerated ash for other purposes, we received the following reply:
・They had no knowledge of any particles that might harm people’s health being generated from the combustion of
rice husks.
・In regards to this project, if it can successfully create a business that generates this valuable ash, then they would
like to spread the use of its techniques throughout the Philippines.
As a result of the above, we believe there is a strong possibility of spreading these power generation and high-
purity silica production techniques from the burning of rice husks within the Philippines.
■Relationship with electricity companies
We spoke with one of the possible candidates to purchase the electricity generated, Agusan del Norte Electronic
Cooperative (ANECO), and discovered the following information.
Table 10-2-2: Meeting with electricity purchaser candidate (ANECO)
Date & Time Thursday, November 19, 2015 14:00-15:00
Location Butuan City, ANECO office
Participants ■ANECO – Mr. Horacio T. Santos (General Manager)
■Chodai – Mr. Miyauchi, Mr. Oura, Mr. Asai, Mr. Takase
Discussion Topics ・ The past few years, although there has not been that much electricity
coming online, there have not been many shortages either. However, there
is a strong possibility of electricity shortages in the near future due to
growing energy demands.
・ There is a degree of uncertainty in the power development projects
currently underway.
・ Due to a current energy surplus, other power sources are contracted at
lower rates than the FIT price. However, if power shortages begin
presenting themselves, the purchase price will naturally increase.
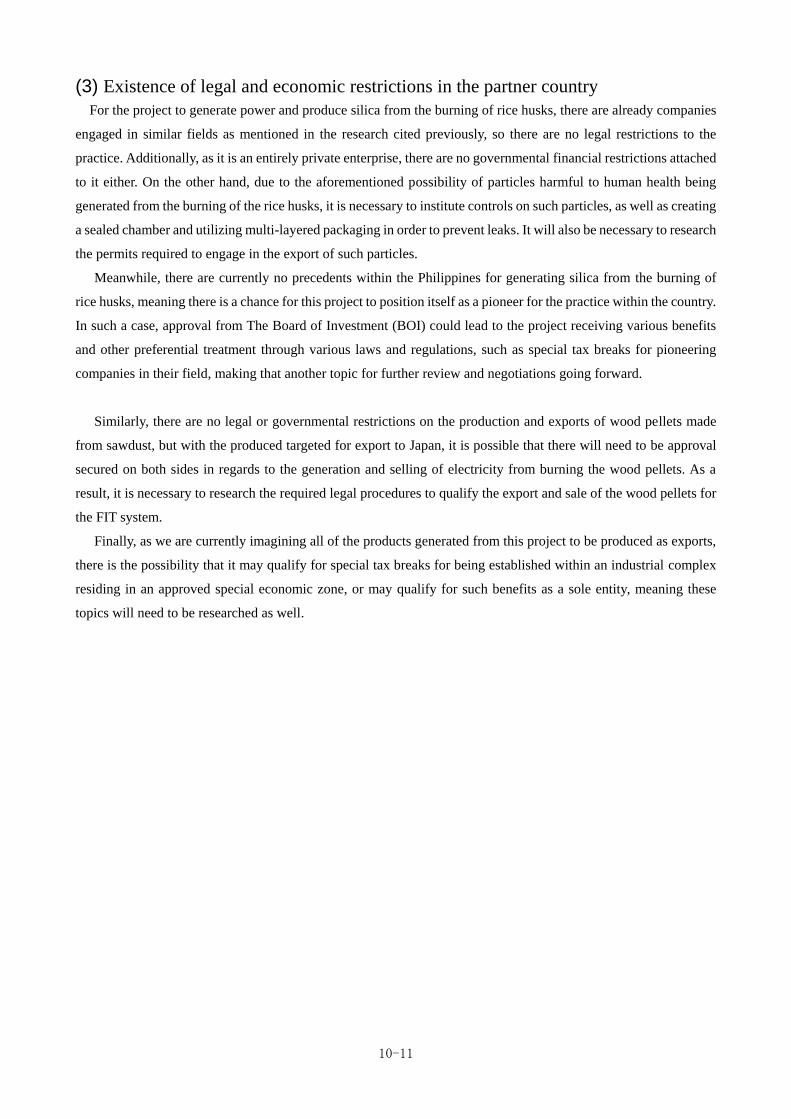
10-11
(3) Existence of legal and economic restrictions in the partner country
For the project to generate power and produce silica from the burning of rice husks, there are already companies
engaged in similar fields as mentioned in the research cited previously, so there are no legal restrictions to the
practice. Additionally, as it is an entirely private enterprise, there are no governmental financial restrictions attached
to it either. On the other hand, due to the aforementioned possibility of particles harmful to human health being
generated from the burning of the rice husks, it is necessary to institute controls on such particles, as well as creating
a sealed chamber and utilizing multi-layered packaging in order to prevent leaks. It will also be necessary to research
the permits required to engage in the export of such particles.
Meanwhile, there are currently no precedents within the Philippines for generating silica from the burning of
rice husks, meaning there is a chance for this project to position itself as a pioneer for the practice within the country.
In such a case, approval from The Board of Investment (BOI) could lead to the project receiving various benefits
and other preferential treatment through various laws and regulations, such as special tax breaks for pioneering
companies in their field, making that another topic for further review and negotiations going forward.
Similarly, there are no legal or governmental restrictions on the production and exports of wood pellets made
from sawdust, but with the produced targeted for export to Japan, it is possible that there will need to be approval
secured on both sides in regards to the generation and selling of electricity from burning the wood pellets. As a
result, it is necessary to research the required legal procedures to qualify the export and sale of the wood pellets for
the FIT system.
Finally, as we are currently imagining all of the products generated from this project to be produced as exports,
there is the possibility that it may qualify for special tax breaks for being established within an industrial complex
residing in an approved special economic zone, or may qualify for such benefits as a sole entity, meaning these
topics will need to be researched as well.
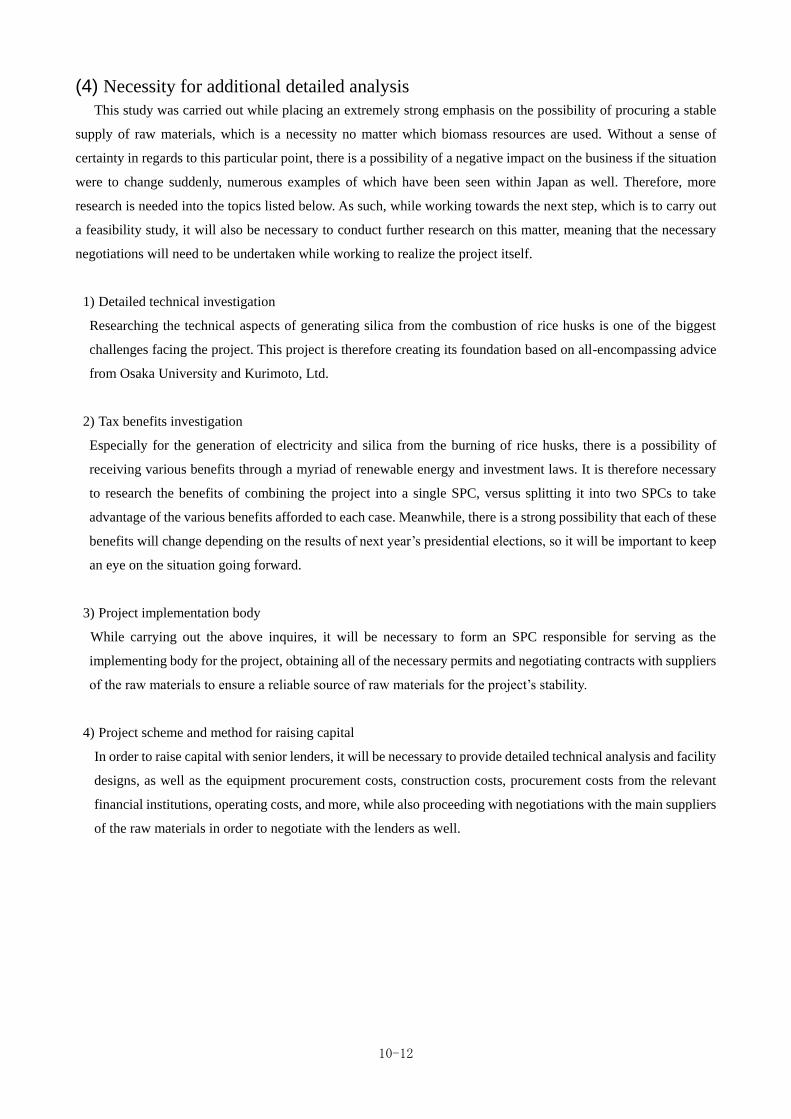
10-12
(4) Necessity for additional detailed analysis
This study was carried out while placing an extremely strong emphasis on the possibility of procuring a stable
supply of raw materials, which is a necessity no matter which biomass resources are used. Without a sense of
certainty in regards to this particular point, there is a possibility of a negative impact on the business if the situation
were to change suddenly, numerous examples of which have been seen within Japan as well. Therefore, more
research is needed into the topics listed below. As such, while working towards the next step, which is to carry out
a feasibility study, it will also be necessary to conduct further research on this matter, meaning that the necessary
negotiations will need to be undertaken while working to realize the project itself.
1) Detailed technical investigation
Researching the technical aspects of generating silica from the combustion of rice husks is one of the biggest
challenges facing the project. This project is therefore creating its foundation based on all-encompassing advice
from Osaka University and Kurimoto, Ltd.
2) Tax benefits investigation
Especially for the generation of electricity and silica from the burning of rice husks, there is a possibility of
receiving various benefits through a myriad of renewable energy and investment laws. It is therefore necessary
to research the benefits of combining the project into a single SPC, versus splitting it into two SPCs to take
advantage of the various benefits afforded to each case. Meanwhile, there is a strong possibility that each of these
benefits will change depending on the results of next year’s presidential elections, so it will be important to keep
an eye on the situation going forward.
3) Project implementation body
While carrying out the above inquires, it will be necessary to form an SPC responsible for serving as the
implementing body for the project, obtaining all of the necessary permits and negotiating contracts with suppliers
of the raw materials to ensure a reliable source of raw materials for the project’s stability.
4) Project scheme and method for raising capital
In order to raise capital with senior lenders, it will be necessary to provide detailed technical analysis and facility
designs, as well as the equipment procurement costs, construction costs, procurement costs from the relevant
financial institutions, operating costs, and more, while also proceeding with negotiations with the main suppliers
of the raw materials in order to negotiate with the lenders as well.