Embed Size (px)
Citation preview
12 Issue 198 January 2007 CIRCUIT CELLAR® www.circuitcellar.com
tured an ATmega32 microcontroller.You can leave the logger (untouchedand isolated) in the field to collectdata for months or years.
SYSTEM OVERVIEWThe solar-powered data logger features
a photodiode that measures solar insola-tion levels and converts this analog signalto a digital value that’s stored in flashmemory. Every time the system logs adata point it also logs a time and datestamp so that the data can be downloadedto a PC and analyzed in the future.
When the system is logging, real-time data is displayed on its small LCDscreen. The system displays several use-ful bits of information: the battery’svoltage, the time and date, the length oftime the system has been logging, andthe length of time it can continue tolog before running out of memory.
The logger has a dedicated solarpower system that enablesautonomous operation. A simplecharge controller regulates the charg-ing of a sealed battery (gel cell leadacid) by a small solar panel.
APPLICATIONSWhen planning an off-grid solar elec-
On a seemingly rare sunny day inIthaca, New York, the sun deliversabout 1,000 W of power per squaremeter and just begs to be put to somepurpose besides browning the backs ofthe students lying out in the gorges.At up to 15% conversion efficiency,COTS photovoltaics (PVs) can turn thatlight into electricity. A growing numberof Ithacans have heeded the sun’s calland installed solar electric PV systemsto power their homes and businesses.Ithaca may get 40% less solar insolationthan San Diego, but it gets 25% morethan Germany, the world leader ininstalled PV capacity. Tompkins County,where Ithaca is located, has roughly2.9 W of installed solar capacity perperson, which makes it second in theU.S. to only Palo Alto, California.
With the Finger Lakes, ridgelines,and valleys cutting through the region,clouds and fog levels vary significantlyfrom one part of town to another. Butweather data is only available from afew select locations. How is a potentialPV buyer to know how much power hersystem will produce unless they canmeasure the incoming light? And howcan a proud PV owner know how her sys-tem is performing or detect faults unlessshe can confirm the conversion effi-ciency? Expensive commercial data log-ging systems that cost thousands of dol-lars do this well, but they are entirelyunreasonable for the small system owner.
For Bruce Land’s ECE476 Microcon-troller Design course at Cornell Uni-versity (http://instruct1.cit.cornell.edu/courses/ee476/), I designed an inexpen-sive self-powered solar data logger tomeet this need (see Photo 1). I builtthe system around an Atmel AVRSTK500 development board that fea-
tric power system (one that isn’t con-nected to a larger power grid), the out-put must be matched closely with theload in order to provide sufficient powerwithout considerable waste. Althoughthe price of photovoltaics has droppedby almost fivefold in my lifetime, it isstill quite expensive.[1] Good planningand system design ensure that you canprovide sufficient power without havingto buy more PV than necessary.
The power output from photo-voltaics is directly related to the inso-lation level. Although seasonal andannual average insolation levels formost major U.S. cities are available onthe Internet, cloud cover and otherweather effects can be extremelylocalized depending on the topogra-phy. Thus, the data for large citiesisn’t always the same as the data forthe smaller towns in its vicinity. Inaddition, this data is not available forevery part of the world. While accu-rate predictions of power output areimportant for grid-tied solar electricsystems (in which the grid is used as‘storage’ for any excess electricity pro-duced and drawn upon for any elec-tricity shortfall), this mainly impactsthe return on investment expectationsrather than the system sizing.
PV power systems are the onlydevices currently available for generat-ing electricity without any movingparts. This makes them brilliantlysimple and easy to care for, which is areal benefit for homeowners who donot want to spend their weekendsgreasing bearings and performing regu-lar system checks. But without anymaintenance needs or means for visualinspection, it is easy for system faultsto go undetected for quite some time.
FEATURE ARTICLE by Abigail Krich
Self-Powered Solar Data LoggerAbigail designed a microcontroller-based, self-powered solar data logger that uses a photo-diode to measure solar insolation levels. The system converts the analog signal to a digitalvalue that’s stored in flash memory.
Photo 1—Check out the complete solar data loggersystem with the PV panel, battery, and a mess of wires.
2712014krich.qxp 12/5/2006 11:41 AM Page 12
Circuit Cellar, the Magazine for Computer Applications. Reprintedby permission. For subscription information, call (860) 875-2199, orwww.circuitcellar.com. Entire contents copyright ©2007 CircuitCellar Inc. All rights reserved.
Large commercial PV installa-tions typically have sophisticatedsensors and monitoring softwarethat can detect system faults andactivate an alarm when mainte-nance is needed. These featuresare usually too costly for residen-tial sized PV systems. The centralcomponent of these monitoringsystems is an insolation sensorwhose output is compared withsystem power production. Whenthe power production strays sig-nificantly from what would beexpected given the insolation, analarm is triggered and maintenancechecks can be performed. Althoughyou may not need a fully automated,integrated monitoring system, somemeans for determining your PV sys-tem’s efficiency enables you to per-form maintenance only when it’s nec-essary and to have peace of mind atother times that everything is func-tioning properly.
HARDWAREThe system schematic is shown in
Figure 1. The pins of the STK500board are depicted along the bottom.Note that the RXD and TXD pins forthe RS-232 connection and the dataflash are also located on the board.
Port A connects to the photodiodeand the switches. Port B also connectswith the switches as well as the dataflash. Port C controls the LCD andPort D sends data to the RS-232 con-nection and the field effect transistor.These ports connect to the ATmega32microcontroller.
POWER SUPPLYThe logger has a dedicated solar-
charging system to enable forautonomous operation. It was builtaround a 3.2-W solar panel a Volkswa-gen dealer gave me to accessorize theoriginally diesel-fueled VolkswagenGolf TDI that I bought and convertedto run on vegetable oil. But that car isanother story.
Even without much optimization forefficiency, the power needs of the loggerare very small. The maximum powerdrawn by each of the main componentsis 5 mW for the LCD, 75 mW for theATmega32, and 75 mW for the photo-
diode for a total of 155 mW. If all com-ponents run at maximum power at alltimes, this would amount to 3.72Wh/day. This does not account forlosses in the voltage regulator or otherminor components, but there is plentyof energy available for the system sothis is not a problem.
The battery I chose was a 12-V, 5-Ahsealed gel cell lead acid deep cycle bat-tery. This type of battery is the mostcost effective when size and weightare not a concern, but safety, ease ofhandling, and the ability to deep-cyclethe battery are. Although a 12-V, 5-Ahbattery could provide 60 Wh, drainingany battery too low (even a deep cyclebattery) can cause damage. Five days ofenergy storage in Ithaca is consideredconservative, but due to the reliabilityneeds of an autonomous system such asthis, it is worth having a good factor ofsafety. Note that 37 Wh of useful stor-age enables the system to ride through10 days with no sun, giving plenty ofleeway with the battery chosen.
Even with enough storage, it is nec-essary to be sure that the energy bal-ance of the system is kept positive orthe battery will eventually drain. Itha-ca averages 2.3 sun hours per day inthe winter.[2] What this means is that asolar cell rated at 1 W would produce1 Wh of electricity per sun hour. My3.2-W solar panel would therefore beable to produce 7.4 Wh (on average) ofelectricity per day during the darkesttime of year in Ithaca if kept at itsmaximum power point. Because thereis no maximum power point trackingin this system, it can be expectedthat the panel will produce about 5.2Wh per day in the winter, which still
far exceeds the maximum loadexpected.
The PV panel, which is rated at18.8 V at its maximum powerpoint, was designed for tricklecharging a 12-V car battery and socould be directly connected to thedata logger. However, to preventbattery damage from overcharg-ing, I needed a way to disconnectthe panel once the battery wasfully charged. Using a BUZ71field effect transistor and a pollingroutine, the panel was effectivelydisconnected when the battery
voltage rose above 12 V.Depending upon the state of charge,
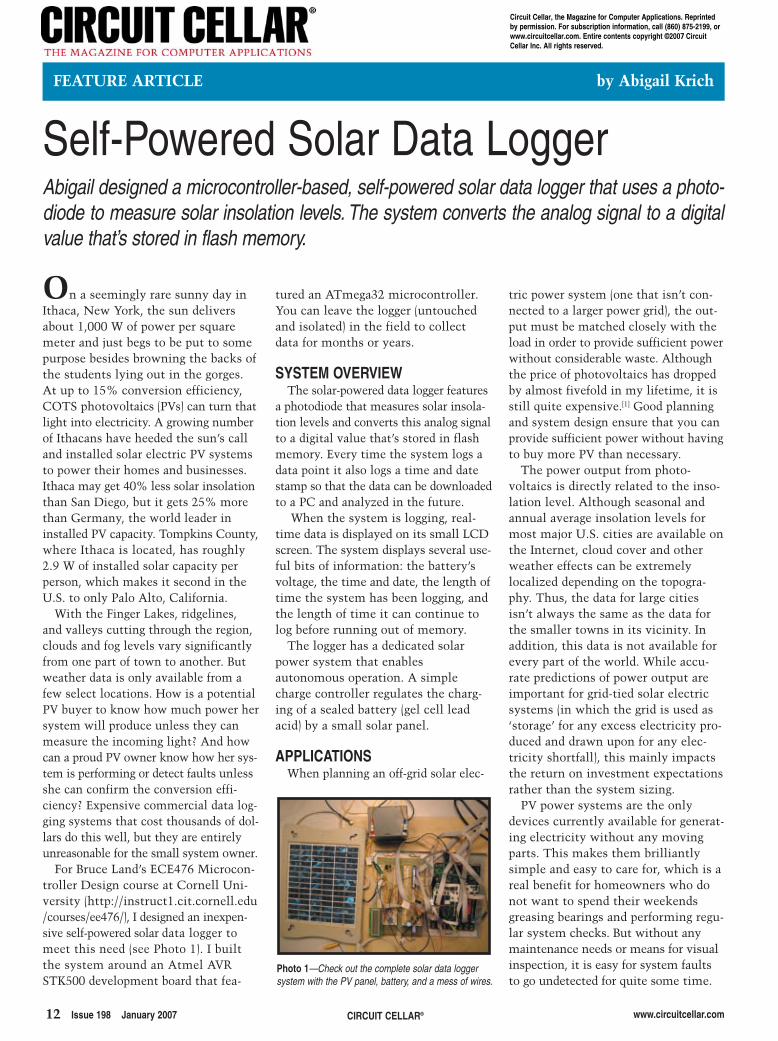
the battery voltage will float around12 V but will not remain steady. Thelogger components required a constant5-V power supply. The ON Semicon-ductor LM2574, a 0.5-A, 5-V stepdown switching regulator (buck con-verter) regulates the voltage from thebattery to the level needed for the sys-tem components (see Photo 2). Thisregulator has a typical efficiency of72%, which is much higher thanresistance-based voltage regulation.
An unresolved and bizarre result ofrunning the logger off of the solarpower supply as compared to the stan-dard AC/DC power supply was thatthe on-off switch on the STK500ceased to function. The only way toturn the logger on or off when con-nected to the solar power supply wasto actually disconnect a battery lead.
PHOTOSENSORA Texas Instruments OPT101—a
monolithic photodiode and single-sup-ply transimpedance amplifier—is usedto sense the incoming solar insolationlevel. Natural sunlight ranges inintensity from 0 to approximately1,000 W per square meter, but theOPT101 puts out its maximum volt-age at roughly 10 W per square meterof incident insolation. With hardly anylight striking the sensor, it reached itsupper limit. It was thus necessary toattenuate the intensity of the lightstriking the photodiode to increase therange over which the sensor could dif-ferentiate intensity.
Ideally, this would have been donewith neutral density filters, but I didn’t
www.circuitcellar.com CIRCUIT CELLAR® Issue 198 January 2007 13
Photo 2—The LM2574 step-down switching regulator maintains thevoltage supply to the logger at 5 V.
2712014krich.qxp 12/5/2006 11:41 AM Page 13

14 Issue 198 January 2007 CIRCUIT CELLAR® www.circuitcellar.com
have any on hand. I used the next bestscientifically accurate and availabletool: electrical tape. Two layers ofelectrical tape covering the photodi-ode were found to be quite effective.This solution enabled the sensor togive reasonably reliable readings overthe full range of expected intensities(see Photo 3).
The microcontroller’s ADC has amaximum value of 255. Multiplyingby a factor of four roughly convertedthe ADC reading to watts per squaremeter. Ideally, this system would becalibrated and the factor would bemore precise than four, but thisapproximation gave reasonableresults with a range of readings from0 to 1,020 W per square meter.
I used the ATmega32-basedSTK500 development board becauseof its integral flash memory andswitches. However, if this systemwere commercialized or rebuilt, it isfairly obvious that the STK500 wouldnot necessarily be used. It has manyfeatures that are unnecessary for thisproject. A far simpler and more com-
pact board can be designed.
PROGRAMAn interrupt-driven program runs
the system and enables accurate tim-ing. An interrupt service routinedecrements a series of task timersonce per millisecond. The main task
in the program calls various subrou-tines at predetermined intervals whentheir task timers run out and theappropriate flags are set to enable atask to run. Each of the eight buttonsis polled separately once every 30 mswith a state machine to debounce thebutton as it stabilizes after a transi-
Figure 1—The system’s schematic shows the STK500 and its connections with each of the other components.
2712014krich.qxp 12/5/2006 11:41 AM Page 14

www.circuitcellar.com CIRCUIT CELLAR® Issue 198 January 2007 15
tion. The only button that isnot debounced is the LCD Wakebutton because bouncing is not aconcern with this function. Thedebouncing routine is based oncode written by Bruce Land.
Each time the system isturned on or reset, it welcomesthe user and guides her throughthe set-up process (see Photo 4).During set-up, you set the sys-tem time and date, select thelogging frequency, decidewhether to clear any stored dataor to continue by appendingfuture data, and indicate whento actually begin logging afterthe system is in place.
In order to enable data appendingafter a reset, the memory pointershave to be stored in nonvolatile mem-ory and initialized only when the chipis programmed, not each time the sys-tem is reset. The ATmega32 contains1,024 bytes of data EEPROM memoryorganized as a separate data space inwhich single bytes can be read andwritten. The pointers to the flash
memory as well as a log of how longthe system has been logging are keptin EEPROM. During operation, youcan reset the time if needed or changethe logging frequency without inter-rupting the data collection. If the log-ging frequency were changed, it wouldbe impossible to calculate how longthe system had been logging unless arunning tally had been kept.
A series of flags and state machines
are used throughout the pro-gram to prevent erroneous userinput from activating a sectionof code out of order. At anygiven point in the program, onlythe relevant buttons are activeand their functions change asshown in the button labels inPhoto 5.
The battery voltage and thephotodiode output are fed intotwo channels of the ATmega32’sADC. The ADC has a maxi-mum input of 5 V. So, in orderto read the battery voltage, itwas necessary to use a voltagedivider to guarantee that the
input to the ADC was within range.Initially, the system sampled only thelight level with the frequency atwhich the user wanted data stored.However, with logging frequencies of1 min. to 1 h, this did not allow for asatisfying real-time display thatshowed changes in light intensity.Moreover, it allowed less accuracy ifonly one sample was taken per storeddata point. Instead, the final design
Photo 3—The photosensor is covered with two layers of electrical tape toprovide a larger range of sensitivity. The inset shows the sensor withoutthe tape cover.
2712014krich.qxp 12/5/2006 11:41 AM Page 15

16 Issue 198 January 2007 CIRCUIT CELLAR® www.circuitcellar.com
reads the ADC once per secondthrough a task that enables an ADCinterrupt routine and starts a conver-sion. The ADC interrupt automatical-ly switches between the two channelsfor the photodiode and the batteryvoltage, reading the battery voltageonce for every five times the photodi-ode is read.
To get an accurate battery voltagereading, the PV panel is disconnectedjust before the reading is taken andthen reconnected immediately after ifthe battery voltage is below 13 V. If itis at 13 or above, the PV panel is notreconnected to prevent overcharging.
The instantaneous readings are dis-played to the LCD screen and kept in arunning average over the logging interval.When the logging interval is complete, adata point is stored in the flash memo-ry and the running average is cleared.
To be able to run for a useful lengthof time, the data logger needed anexternal memory for storing measureddata. The older STK500 boards haveflash memory chips built into them(as can be seen on the upper right ofthe board in Photo 5), making this anobvious choice. Unfortunately, I didnot have any instruction set for inter-facing with the flash memory. An ear-lier ECE476 project used this flashmemory. Based on the project’s codeand comments, I was able to learnhow the flash memory interfaceworked.[3] The designers used a pro-gram named dFlash, which was writ-ten by Terje Frostad of Atmel Norway.I e-mailed the Atmel AVR technicalsupport team and received permissionto use dFlash in my project as well.The dFlash program provides a set ofroutines to interface with the flashmemory by writing to a 264-bytebuffer. This buffer is then written to
one of 1,024 264-byte pages of theflash memory.
Because the routines take byte-sizedata as input, I had to break the inso-lation value (stored as an integer) into2 bytes and then put it back togetheragain when storing or retrieving it.The 2-byte insolation together withthe time and date stamp meant thateach time the system logged a datapoint it used 8 bytes of memory. Thisallowed the system to log 33,792 datapoints. The logging interval is user-selec-table from 1 min. to 1 h. At an intervalof 1 min., the system is able to continu-ously log data for 23.4 days before fillingthe memory. At an interval of 1 h, thesystem is able to log for 3.8 years.
One thing I did not realize that causedme a considerable headache was thatPortB.4:7 is used for interfacing with theflash. I had initially been using PortB asinput for the switches, but I found thatthree of the switches ceased functioningproperly. When I realized that dFlashwas reinitializing these pins, I was ableto switch these buttons to PortA.
The flash memory can be readeither through a buffer or directly, thelatter being my choice for the logger.If you were to call for the data to beretrieved before the buffer had filledand written the data to flash, therewould be no data to retrieve. Thus, itwas necessary to write the buffer toflash memory just before the dataretrieve routine was entered as well aswhen the buffer became full. It was alsonecessary to give the microcontroller abrief period to finish writing the bufferbefore the read command was executedor the same problem would occur.
The read command is executedwhen you press the Retrieve Data but-ton (active only when the logger isstopped). The logger must be connect-ed to a computer using an RS-232cable with straight-through connec-tion. You should start a simple termi-nal program on the PC (e.g., HyperTer-minal) set to 9,600 bps, no parity, 1stop bit, and no flow control.
When the Retrieve Data button ispressed, the system prints identifyingheader rows followed by a row foreach data point logged with the timeand date at which it was stored. TheLCD displays the message “Uploading
Photo 4—The data logger greets users before leadingthem through the system setup.
����������� �����
Available in 40 and 44 pin header configuration
Support PIO 0-4 and Ultra DMA 3 mode.
Bootable from Transflash/micro SD.
Low power consumption.
SD-IDE-40/44
6V to 40V DC input range
+5V, +12V, -5V and -12V DC output
High efficiency up to 95%
PC/104 compliant
HE104-DX
Fanless Design
Intel® ULV Celeron® 650MHz Processor
1 PCI (optional 2nd PCI)/ 2 PCMCIA Slots
Wide Range DC or AC Power Input
Advanced Fanless Embedded Controller
IDE Flash Drive Carrier Board with Micro SD Interface
60 Watt High Efficiency PC/104 PSU
AEC-6900
1.800.665.5600www.tri-m.com [email protected]
tel: 604.945.9565 fax: 604.945.9566HEAD OFFICE: VANCOUVER
2712014krich.qxp 12/5/2006 11:41 AM Page 16

18 Issue 198 January 2007 CIRCUIT CELLAR® www.circuitcellar.com
Data” followed by the time and insola-tion value presently being uploaded.Upon reaching the end of the data, afooter row is printed to the terminal pro-gram and the LCD displays the message“Done Uploading Please Restart.” Thedata in the terminal program on the PCmay then be copied into another pro-gram for storage or analysis. If an incom-plete transmission was made, you mayreset the logger and choose to upload thedata at the first prompt. The data maybe uploaded as many times as the userdesires until the memory is cleared.
Initially, the program was writtenwith each of the subroutines thatupdated a parameter sending its updateto the LCD. This avoided updating theLCD more frequently than necessary.However, when power-saving code wasincorporated to turn the LCD screenoff when the system was idle by driv-ing it with a port pin, the systemwould freeze every time it went idle. Itturns out that the LCD sends andreceives messages to and from themicrocontroller. If the LCD is off whenthe microcontroller sends it a message,
it is not able to respond and the micro-controller hangs, waiting. The programthus had to be rewritten to prevent theLCD from being called when the LCDscreen was turned off. I did this bywriting a single routine that printed tothe LCD screen. A state machine and a
variety of flags controlled it so that thecorrect message would be displayed.
Additionally, there was some diffi-culty at times with the LCD not mak-ing proper contact with the surpluswhiteboard I was using. When theLCD lost contact momentarily, itwould cause the system to freeze.Thus, I added an extra new whiteboardsolely to hold the LCD screen securelybecause I was not able to solder theborrowed LCD to my project. Anotherproblem I had with the LCD waswhen the STK ground was not properlyconnected to the system ground, thenegative terminal of the battery. Thishappened during testing with theSTK500 plugged into an AC/DC powersupply. When the two grounds werenot at equal voltages, the voltageacross the LCD was not in its operatingrange. The positive voltage was comingfrom the STK port pin and the negativevoltage from the battery negative ter-minal. Once the two systems werejoined by connecting to the STKground pin (or also powering the STKfrom the battery), the LCD resumed
Photo 5—Check out the STK500 board with labels foreach of the eight buttons.
2712014krich.qxp 12/5/2006 1:58 PM Page 18

www.circuitcellar.com CIRCUIT CELLAR® Issue 198 January 2007 19
REFERENCES[1] R. Wiser, M. Bolinger, P. Cappers, and
R. Margolis, “Letting the Sun Shineon Solar Costs: An Empirical Investi-gation of Photovoltaic Cost Trends inCalifornia,” LBNL-59282, NREL/TP-620-39300, 2006, http://eetd.lbl.gov/ea/ems/reports/59282.pdf.
[2] Solar Insolation for Major U.S. Cities,Advanced Energy Group, www.solar4power.com/solar-power-insolation-window.html.
RESOURCEDatasheets, dFlash.c, and the UserGuide, http://instruct1.cit.cornell.edu/courses/ee476/FinalProjects/s2006/ajk28/ajk28/index.html.
Abigail Krich ([email protected])holds a B.S. in biological and environ-mental engineering and a Master’sdegree in electrical engineering fromCornell University. She is now a proj-ect developer at Tamarack Energy, arenewable energy development compa-ny. She has previously worked at theNational Renewable Energy Laborato-ry’s National Wind Technology Centerand at Northern Power Systems.
PROJECT FILESTo download the code, go to ftp://ftp.circuitcellar.com/pub/Circuit_Cellar/2007/198.
[3] S. Jean-Louis and C. Pandarinath,“The Big Red Guide,” ECE476Final Design Project, Cornell Uni-versity, 2004, http://instruct1.cit.cornell.edu/courses/ee476/FinalProjects/s2004/sj74/main.htm.
normal operation.
IMPROVEMENTSIf I rebuild this system for fun or
commercialization, it will need to bepackaged in a weatherproof enclosureto allow for outdoor operation. Addition-ally, since not everyone has a spare PVpanel lying around the house, it would beimportant to increase the system’s effi-ciency to allow for a reduced panel sizebecause this is the most expensive com-ponent. This can be done in many ways.
The first way would be to have amaximum power point tracking chargecontroller rather than the simple on-offswitch used in this project. This wouldkeep the voltage of the solar cells atthe maximum power point on the I-Vcurve. It would effectively extractabout 30% more power from the panelthan allowing the battery to determinethe panel’s operating voltage. The sec-ond way to improve efficiency wouldbe to reduce the power consumption ofthe system. Because I had plenty ofpower from my PV panel and sufficientbattery capacity, there was no need forthis system to do more than turn theLCD screen off when idle. However, itwould be possible to reduce powerneeds further by reducing the chip’sclock speed, letting the chip go idlebetween readings or at night, and elim-inating the LEDs on the STK500 boardor using another board entirely.
The sun was shining in my eyes as Istarted working on this article lastsummer. I think I’ll soon have to jointhe fold and get a PV system of myown to go with the logger. I
2712014krich.qxp 12/5/2006 11:41 AM Page 19