Embed Size (px)
Citation preview
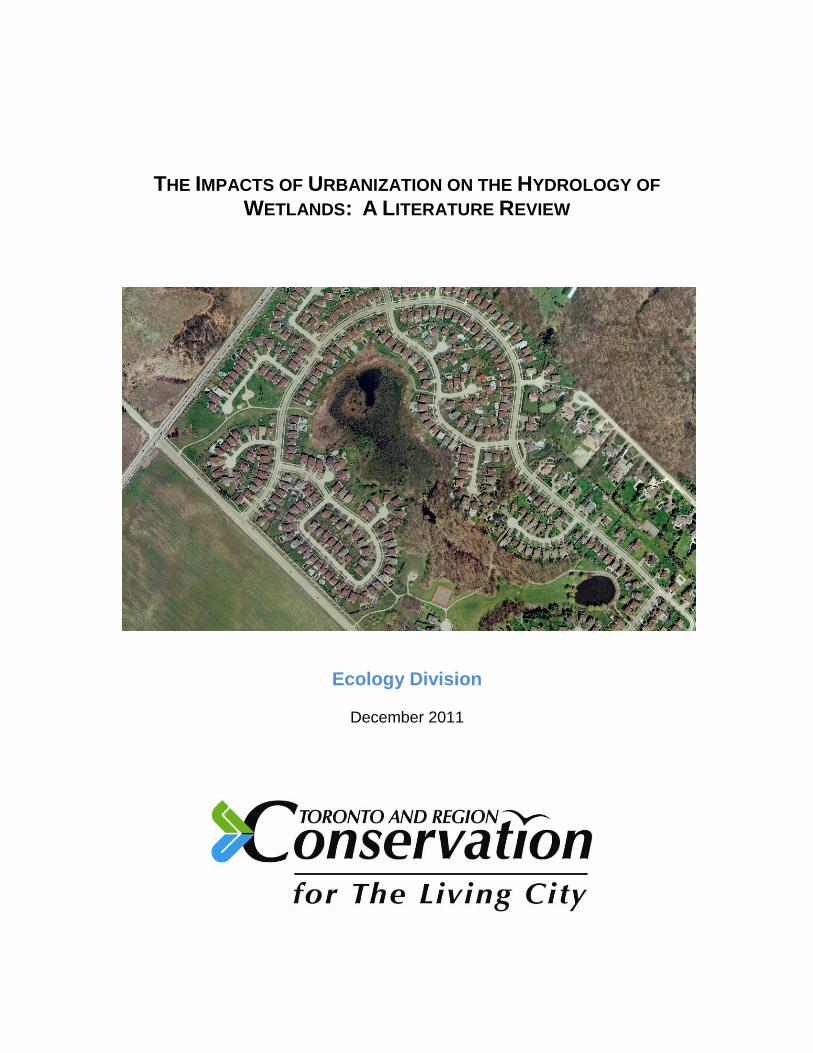
THE IMPACTS OF URBANIZATION ON THE HYDROLOGY OF
WETLANDS: A LITERATURE REVIEW
Ecology Division
December 2011
Toronto and Region Conservation Authority, December 2011 Page ii
Acknowledgements This document was made possible through funding and support by the following: The Regional Municipality of Peel The Regional Municipality of York The City of Toronto The Regional Municipality of Durham Credit Valley Conservation This document was researched, written and edited by the following TRCA staff: Elyssa Elton Laura Del Giudice Kelly Montgomery Lisa Roberti
Publication Information For further information or comments about this publication, please contact: Laura Del Giudice, B.Sc., M.F.C. Senior Planning Ecologist Toronto and Region Conservation Authority 5 Shoreham Drive Downsview, Ontario, Canada M3N 1S4 Email: [email protected] With over 50 years of experience, Toronto and Region Conservation (TRCA) helps people understand, enjoy and look after the natural environment. Our vision is for The Living City®—a cleaner, greener and healthier place to live, for you today and for your children tomorrow. For more information, call 416-661-6600 or visit us at www.trca.on.ca © Toronto and Region Conservation Authority
Toronto and Region Conservation Authority, December 2011 Page iii
Executive Summary Hydrology is a key factor that determines a wetland‘s ecological composition, structure and function. One of the most significant indirect impacts to wetlands caused by urbanization is the alteration of wetland hydrology. As natural cover is replaced by impervious cover and stormwater is efficiently directed towards the stormwater management system, the variables controlling a wetland‘s water balance become highly altered, changing a wetland‘s hydrological regime. This literature review provides a synthesis of the current research regarding the hydrological impacts of urbanization on wetlands. The goal of the review is to identify gaps in current knowledge and support the development of a guideline to protect the hydrology, water quality and the ecological function of wetlands through the urbanization process. This literature review identified several urbanization impacts to wetlands which were shown to affect the ecological function and the biological communities.
1. Hydrological impacts included changes to water level fluctuations, changes in ponding and alterations to the groundwater regime through loss of recharge in developed areas.
2. Water quality impairments included an increase in toxic metals, hydrocarbons, bacterial loads, nutrients, chlorides as well as suspended sediments.
3. Changes to the hydrologic regime, as well as water quality, affect the ecological condition and function of wetlands in urbanizing areas leading to measurable biological responses. Wetland flora and fauna communities are dependent on the wetland‘s hydroperiod. Changes to the hydrologic regime resulted in reduced species richness and the loss of sensitive species. Water quality changes resulted in shifts in vegetation community and a concern regarding the bioaccumulation of toxins. However, it is not just one type of impact that accounts for the biological effects in wetlands, but the compounding effects of all impacts.
This review examines two case studies of wetlands that were monitored during the development process to assess change. These case studies highlight problems with data collection and analysis pre- and post-development. Gaps in knowledge are identified through both these case studies and the literature. Recommendations for future work, both research and guideline/protocol development are outlined.
Toronto and Region Conservation Authority, December 2011 Page iv
Table of Contents
List of Figures: .................................................................................................................... v
List of Tables: ...................................................................................................................... v
1. Introduction ............................................................................................................. 1
1.1 Purpose of the Project .................................................................................................. 1
1.2 Study Objectives ........................................................................................................... 3
2. Relevant Concepts and Definitions ........................................................................... 3
2.1 Wetland Definitions ..................................................................................................... 3
2.2 Wetland Types and Sites ............................................................................................. 4
2.3 Ecosystem Services and the Natural Functions of Wetlands ................................... 5
2.4 Wetland Hydrology ...................................................................................................... 6
3. The Impacts of Urbanization on Wetlands ............................................................... 9
3.1 Puget Sound Wetlands Study and Other Research ..................................................... 10
3.2 Hydrological changes to wetlands following urbanization ..................................... 10
3.3 Transport of pollutants to wetlands following urbanization .................................. 15
3.4 Biological responses of wetlands following urbanization ....................................... 18 3.4.1 Water level fluctuations .........................................................................................................20 3.4.2 Depth and Duration of Flooding ............................................................................................22 3.4.3 Water quality impacts ............................................................................................................25 3.4.4 Conclusions ...........................................................................................................................27
4. Case Studies.............................................................................................................. 29
4.1 Keele Wetlands (A.K.A. Dreamworks) .................................................................... 29 4.1.1 Context ..................................................................................................................................29 4.1.2 Pre-development Conditions .................................................................................................30 4.1.3 Mitigation Measures ..............................................................................................................31 4.1.4 Monitoring Results ................................................................................................................31 4.1.5 Water Levels ..........................................................................................................................32 4.1.6 Water Temperature ................................................................................................................33 4.1.7 Water Quality ........................................................................................................................35 4.1.8 Flora Surveys .........................................................................................................................38 4.1.9 Fauna Surveys........................................................................................................................39 4.1.10 Conclusions ............................................................................................................................41
4.2 Wilcox-St. George Wetland Complex (A.K.A. Snively Wetland) .......................... 43 4.2.1 Context and Pre-development Conditions .............................................................................43 4.2.2 Modelling ..............................................................................................................................43 4.2.3 Baseline Monitoring ..............................................................................................................44 4.2.4 Monitoring Results ................................................................................................................45 4.2.5 Conclusions ...........................................................................................................................47
5. Overall Recommendations ....................................................................................... 48
5.1 Gap Analysis ............................................................................................................... 48
5.2 Overall Conclusions ................................................................................................... 50
5.3 Recommended Future Work ..................................................................................... 51
Toronto and Region Conservation Authority, December 2011 Page v
6. Glossary .................................................................................................................... 52
7. References ................................................................................................................ 53
APPENDIX ...................................................................................................................... 58
Examples of the Impacts of Water Balance Problems on Natural Features ................ 58
List of Figures: FIGURE 2.1: Wetland water balance………………………………………………………………………9 FIGURE 2.2: Examples of wetland hydrographs………………………………………………………..10 FIGURE 3.1: Relationship between water level fluctuations and total impervious cover…………..15 FIGURE 3.2: Typical hydrographs of wetlands in developed and rural areas……………………….16 FIGURE 3.3: Relationships between relative abundances in developed & undeveloped areas…..21 FIGURE 3.4: Plant richness, frequency, and duration of flooding……...……………………………..22 FIGURE 3.5: Species richness of plants in marsh sods exposed to four hydrologic regime treatments in the greenhouse…………………………………………………………………………...25
List of Tables: TABLE 4.1: Summary of water quality data from Keele Wetland………………………………….….35 TABLE 4.2: Vegetation survey results for the Keele Wetland…………………………………………36
Toronto and Region Conservation Authority, December 2011 Page 1
1. Introduction
1.1 Purpose of the Project
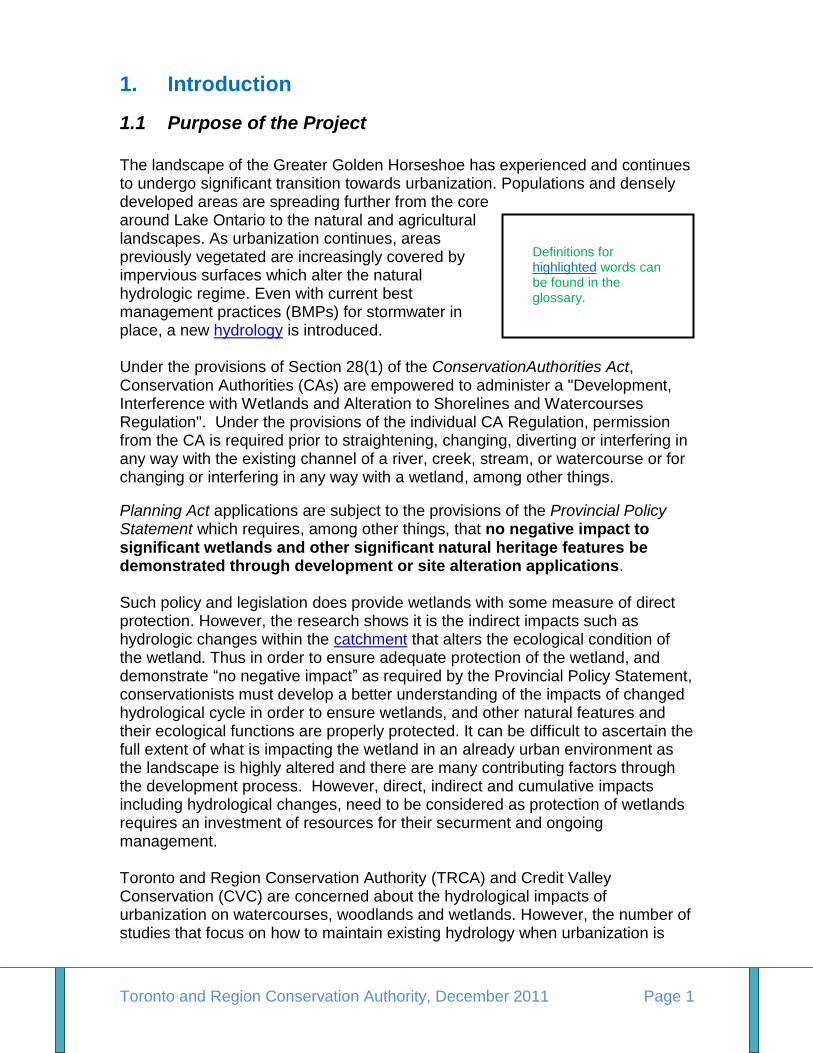
The landscape of the Greater Golden Horseshoe has experienced and continues to undergo significant transition towards urbanization. Populations and densely developed areas are spreading further from the core around Lake Ontario to the natural and agricultural landscapes. As urbanization continues, areas previously vegetated are increasingly covered by impervious surfaces which alter the natural hydrologic regime. Even with current best management practices (BMPs) for stormwater in place, a new hydrology is introduced. Under the provisions of Section 28(1) of the ConservationAuthorities Act, Conservation Authorities (CAs) are empowered to administer a "Development, Interference with Wetlands and Alteration to Shorelines and Watercourses Regulation". Under the provisions of the individual CA Regulation, permission from the CA is required prior to straightening, changing, diverting or interfering in any way with the existing channel of a river, creek, stream, or watercourse or for changing or interfering in any way with a wetland, among other things.
Planning Act applications are subject to the provisions of the Provincial Policy Statement which requires, among other things, that no negative impact to significant wetlands and other significant natural heritage features be demonstrated through development or site alteration applications. Such policy and legislation does provide wetlands with some measure of direct protection. However, the research shows it is the indirect impacts such as hydrologic changes within the catchment that alters the ecological condition of the wetland. Thus in order to ensure adequate protection of the wetland, and demonstrate ―no negative impact‖ as required by the Provincial Policy Statement, conservationists must develop a better understanding of the impacts of changed hydrological cycle in order to ensure wetlands, and other natural features and their ecological functions are properly protected. It can be difficult to ascertain the full extent of what is impacting the wetland in an already urban environment as the landscape is highly altered and there are many contributing factors through the development process. However, direct, indirect and cumulative impacts including hydrological changes, need to be considered as protection of wetlands requires an investment of resources for their securment and ongoing management. Toronto and Region Conservation Authority (TRCA) and Credit Valley Conservation (CVC) are concerned about the hydrological impacts of urbanization on watercourses, woodlands and wetlands. However, the number of studies that focus on how to maintain existing hydrology when urbanization is
Definitions for highlighted words can be found in the glossary.
Toronto and Region Conservation Authority, December 2011 Page 2
contemplated within the catchment of these natural features are limited, particularly for woodlands and watercourses. This literature review focuses on wetlands since there are some studies to report on with respect to these features, but even with wetlands, the number of studies is limited.
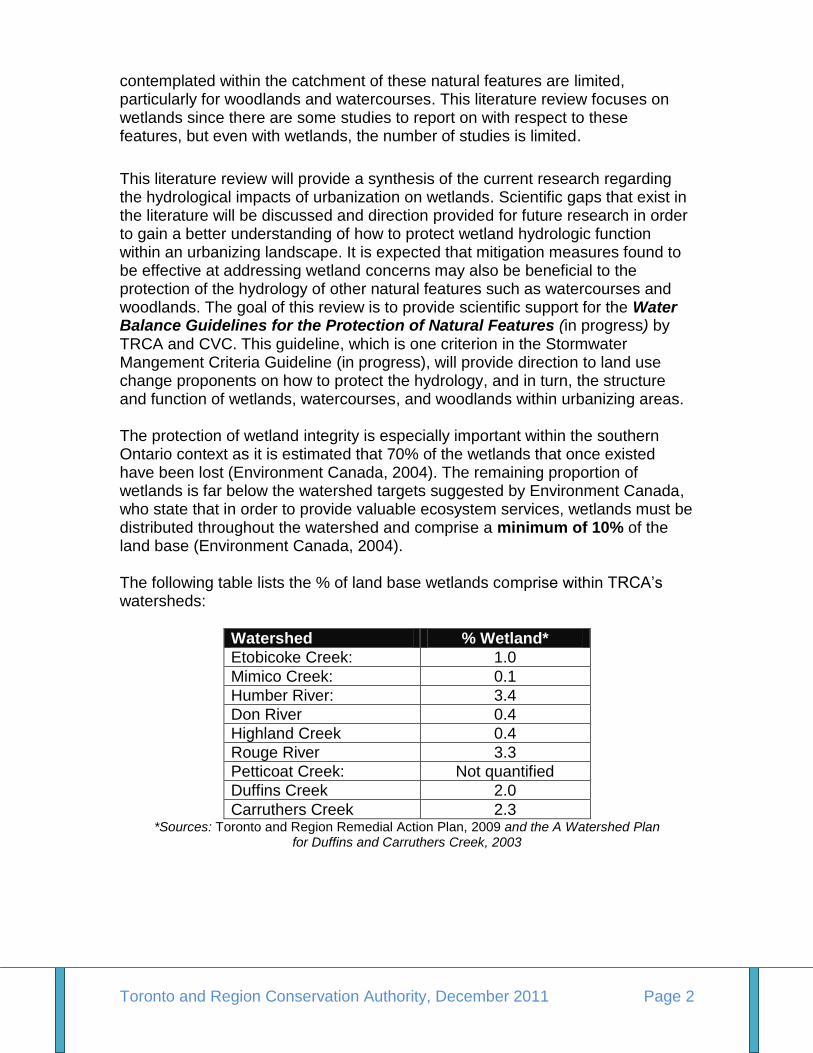
This literature review will provide a synthesis of the current research regarding the hydrological impacts of urbanization on wetlands. Scientific gaps that exist in the literature will be discussed and direction provided for future research in order to gain a better understanding of how to protect wetland hydrologic function within an urbanizing landscape. It is expected that mitigation measures found to be effective at addressing wetland concerns may also be beneficial to the protection of the hydrology of other natural features such as watercourses and woodlands. The goal of this review is to provide scientific support for the Water Balance Guidelines for the Protection of Natural Features (in progress) by TRCA and CVC. This guideline, which is one criterion in the Stormwater Mangement Criteria Guideline (in progress), will provide direction to land use change proponents on how to protect the hydrology, and in turn, the structure and function of wetlands, watercourses, and woodlands within urbanizing areas. The protection of wetland integrity is especially important within the southern Ontario context as it is estimated that 70% of the wetlands that once existed have been lost (Environment Canada, 2004). The remaining proportion of wetlands is far below the watershed targets suggested by Environment Canada, who state that in order to provide valuable ecosystem services, wetlands must be distributed throughout the watershed and comprise a minimum of 10% of the land base (Environment Canada, 2004). The following table lists the % of land base wetlands comprise within TRCA‘s watersheds:
Watershed % Wetland*
Etobicoke Creek: 1.0
Mimico Creek: 0.1
Humber River: 3.4
Don River 0.4
Highland Creek 0.4
Rouge River 3.3
Petticoat Creek: Not quantified
Duffins Creek 2.0
Carruthers Creek 2.3 *Sources: Toronto and Region Remedial Action Plan, 2009 and the A Watershed Plan
for Duffins and Carruthers Creek, 2003
Toronto and Region Conservation Authority, December 2011 Page 3
1.2 Study Objectives
The objectives of this literature review are to understand:
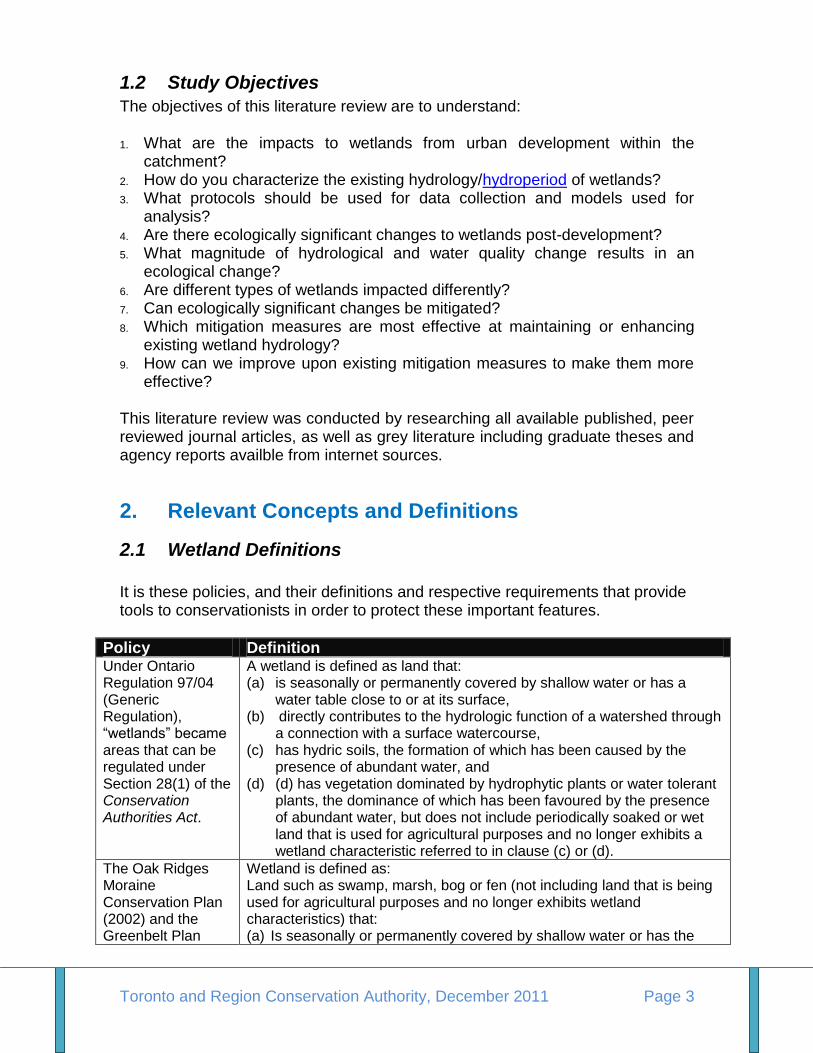
1. What are the impacts to wetlands from urban development within the catchment?
2. How do you characterize the existing hydrology/hydroperiod of wetlands? 3. What protocols should be used for data collection and models used for
analysis? 4. Are there ecologically significant changes to wetlands post-development? 5. What magnitude of hydrological and water quality change results in an
ecological change? 6. Are different types of wetlands impacted differently? 7. Can ecologically significant changes be mitigated? 8. Which mitigation measures are most effective at maintaining or enhancing
existing wetland hydrology? 9. How can we improve upon existing mitigation measures to make them more
effective?
This literature review was conducted by researching all available published, peer reviewed journal articles, as well as grey literature including graduate theses and agency reports availble from internet sources.
2. Relevant Concepts and Definitions
2.1 Wetland Definitions
It is these policies, and their definitions and respective requirements that provide tools to conservationists in order to protect these important features.
Policy Definition Under Ontario Regulation 97/04 (Generic Regulation), ―wetlands‖ became areas that can be regulated under Section 28(1) of the Conservation Authorities Act.
A wetland is defined as land that: (a) is seasonally or permanently covered by shallow water or has a
water table close to or at its surface, (b) directly contributes to the hydrologic function of a watershed through
a connection with a surface watercourse, (c) has hydric soils, the formation of which has been caused by the
presence of abundant water, and (d) (d) has vegetation dominated by hydrophytic plants or water tolerant
plants, the dominance of which has been favoured by the presence of abundant water, but does not include periodically soaked or wet land that is used for agricultural purposes and no longer exhibits a wetland characteristic referred to in clause (c) or (d).
The Oak Ridges Moraine Conservation Plan (2002) and the Greenbelt Plan
Wetland is defined as: Land such as swamp, marsh, bog or fen (not including land that is being used for agricultural purposes and no longer exhibits wetland characteristics) that: (a) Is seasonally or permanently covered by shallow water or has the
Toronto and Region Conservation Authority, December 2011 Page 4
Policy Definition (2005):
water table close to or at the surface; (b) Has hydric soils and vegetation dominated by hydrophytic or water-
tolerant plants; and (c) Has been further identified, by the Ministry of Natural Resources or by
any other person, according to evaluation procedures established by the Ministry of Natural Resources, as amended from time to time.
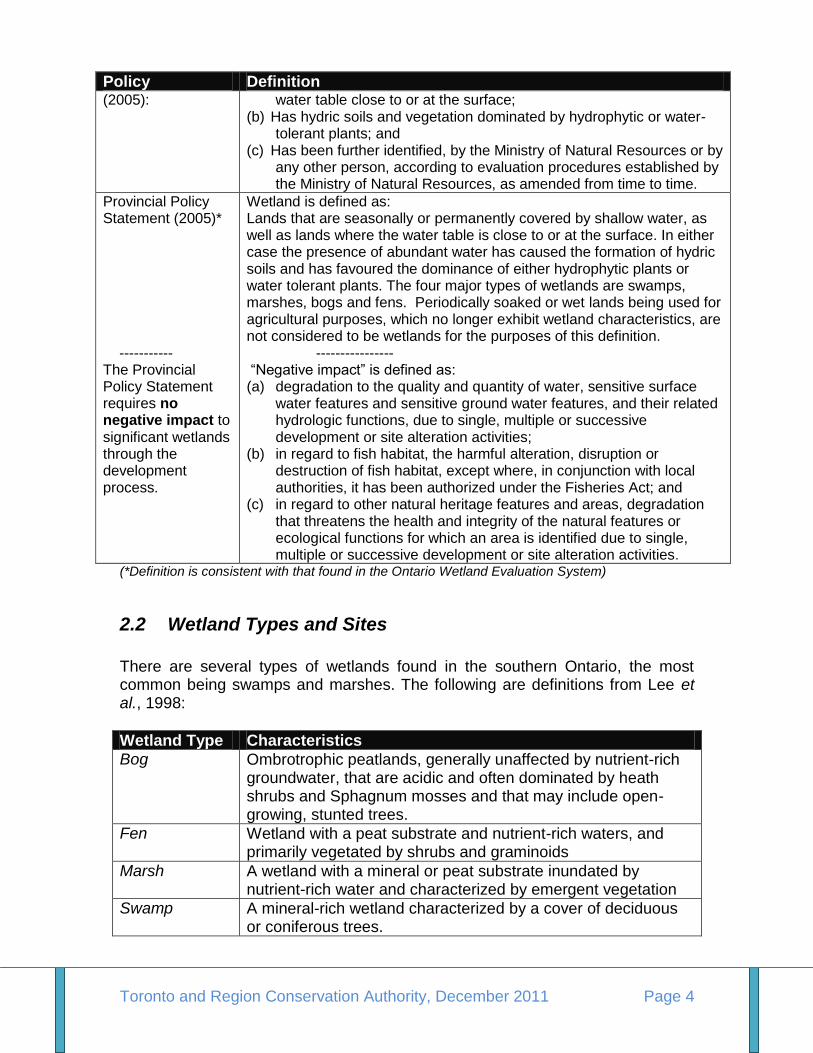
Provincial Policy Statement (2005)* ----------- The Provincial Policy Statement requires no negative impact to significant wetlands through the development process.
Wetland is defined as: Lands that are seasonally or permanently covered by shallow water, as well as lands where the water table is close to or at the surface. In either case the presence of abundant water has caused the formation of hydric soils and has favoured the dominance of either hydrophytic plants or water tolerant plants. The four major types of wetlands are swamps, marshes, bogs and fens. Periodically soaked or wet lands being used for agricultural purposes, which no longer exhibit wetland characteristics, are not considered to be wetlands for the purposes of this definition. ---------------- ―Negative impact‖ is defined as: (a) degradation to the quality and quantity of water, sensitive surface
water features and sensitive ground water features, and their related hydrologic functions, due to single, multiple or successive development or site alteration activities;
(b) in regard to fish habitat, the harmful alteration, disruption or destruction of fish habitat, except where, in conjunction with local authorities, it has been authorized under the Fisheries Act; and
(c) in regard to other natural heritage features and areas, degradation that threatens the health and integrity of the natural features or ecological functions for which an area is identified due to single, multiple or successive development or site alteration activities.
(*Definition is consistent with that found in the Ontario Wetland Evaluation System)
2.2 Wetland Types and Sites
There are several types of wetlands found in the southern Ontario, the most common being swamps and marshes. The following are definitions from Lee et al., 1998:
Wetland Type Characteristics
Bog Ombrotrophic peatlands, generally unaffected by nutrient-rich groundwater, that are acidic and often dominated by heath shrubs and Sphagnum mosses and that may include open-growing, stunted trees.
Fen Wetland with a peat substrate and nutrient-rich waters, and primarily vegetated by shrubs and graminoids
Marsh A wetland with a mineral or peat substrate inundated by nutrient-rich water and characterized by emergent vegetation
Swamp A mineral-rich wetland characterized by a cover of deciduous or coniferous trees.
Toronto and Region Conservation Authority, December 2011 Page 5
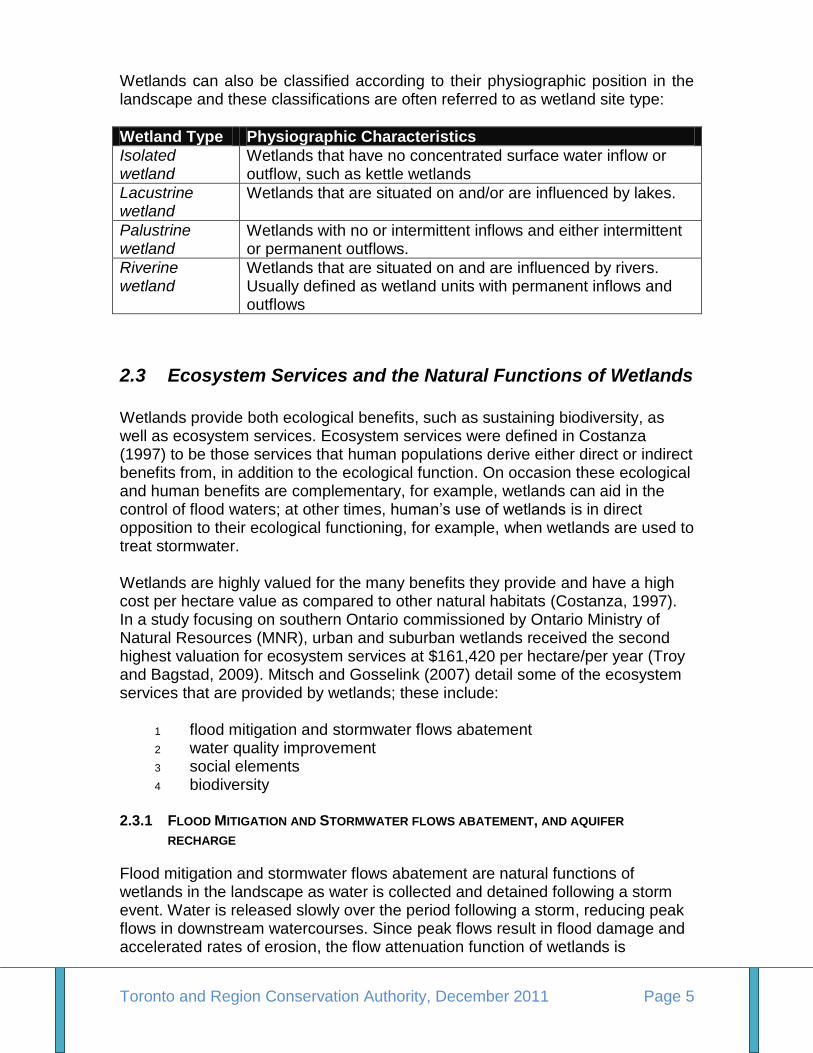
Wetlands can also be classified according to their physiographic position in the landscape and these classifications are often referred to as wetland site type:
Wetland Type Physiographic Characteristics
Isolated wetland
Wetlands that have no concentrated surface water inflow or outflow, such as kettle wetlands
Lacustrine wetland
Wetlands that are situated on and/or are influenced by lakes.
Palustrine wetland
Wetlands with no or intermittent inflows and either intermittent or permanent outflows.
Riverine wetland
Wetlands that are situated on and are influenced by rivers. Usually defined as wetland units with permanent inflows and outflows
2.3 Ecosystem Services and the Natural Functions of Wetlands
Wetlands provide both ecological benefits, such as sustaining biodiversity, as well as ecosystem services. Ecosystem services were defined in Costanza (1997) to be those services that human populations derive either direct or indirect benefits from, in addition to the ecological function. On occasion these ecological and human benefits are complementary, for example, wetlands can aid in the control of flood waters; at other times, human‘s use of wetlands is in direct opposition to their ecological functioning, for example, when wetlands are used to treat stormwater. Wetlands are highly valued for the many benefits they provide and have a high cost per hectare value as compared to other natural habitats (Costanza, 1997). In a study focusing on southern Ontario commissioned by Ontario Ministry of Natural Resources (MNR), urban and suburban wetlands received the second highest valuation for ecosystem services at $161,420 per hectare/per year (Troy and Bagstad, 2009). Mitsch and Gosselink (2007) detail some of the ecosystem services that are provided by wetlands; these include:
1 flood mitigation and stormwater flows abatement 2 water quality improvement 3 social elements 4 biodiversity
2.3.1 FLOOD MITIGATION AND STORMWATER FLOWS ABATEMENT, AND AQUIFER
RECHARGE
Flood mitigation and stormwater flows abatement are natural functions of wetlands in the landscape as water is collected and detained following a storm event. Water is released slowly over the period following a storm, reducing peak flows in downstream watercourses. Since peak flows result in flood damage and accelerated rates of erosion, the flow attenuation function of wetlands is
Toronto and Region Conservation Authority, December 2011 Page 6
especially important within the urban context where infrastructure and property is often located in close proximity to watercourses. Repairing flood damage and implementing erosion control measures can be extremely costly and preserving wetlands in the landscape can help minimize these expenses. Natural wetlands, however, should not be used as flood mitigation areas into which urban stormwater is directed, as this would impair their ecological functions. 2.3.2 WATER QUALITY IMPROVEMENT
Wetlands are also often recognized as important to water quality in downstream systems. Wetlands can decrease the sediment load in downstream areas by slowing the flow rates, thus promoting deposition rather than erosion. They are also recognized as systems that promote denitrification, chemical precipitation and various other chemical reactions which are able to extract harmful chemicals from the water column (Mitsch and Gosselink, 2007). This cleansing property of wetlands has led to their use as stormwater treatment areas in the past, however, it is now recognized that releasing untreated stormwater to natural wetlands is not compatible with maintaining biodiversity (Hansson et al., 2005, Zedler, 2000). 2.3.3 SOCIAL ELEMENTS
In addition to the above ecosystem services, wetlands, especially those in urban areas, provide aesthetic enjoyment, though this is a difficult service to quantify (Mitsch and Gosselink, 2007). In many parts of the world, wetlands are also critically important for the subsistence of human populations. As wetlands are often high in biodiversity they are important locations for fishing, bird watching and the provision of other goods used by humans. 2.3.4 BIODIVERSITY
Wetlands are integral to biological diversity as they support species which are dependent on them for survival, such as amphibians, while also providing more temporary habitat and refugia for other terrestrial species. It is estimated that 80% of breeding birds in North America rely on wetlands despite not all being wetland residents (Mitsch and Gosselink, 2007). Wetlands are, therefore, not only critical for the survival of wetland flora and fauna, they are also a vital part of an entire region‘s biodiversity (Hansson et al., 2005). Wetlands must therefore be valued for their ecosystem services as well as their biological functions and these interests should be balanced in an urban environment.
2.4 Wetland Hydrology
Hydrology is a key factor that determines a wetland‘s ecological composition, structure and function. Wetland hydrology is the most important factor that affects wetland ecology as well as persistence on the landscape (Carter, 1986). Water, which creates and maintains wetland habitat, is a source of energy and nutrients
Toronto and Region Conservation Authority, December 2011 Page 7
that are being constantly replenished through precipitation as well as surface flows and groundwater flows, or both. As stated in Mitsch and Gosselink (2007):
Hydrology is probably the single most important determinant of the establishment and maintenance of specific types of wetlands and wetland processes.
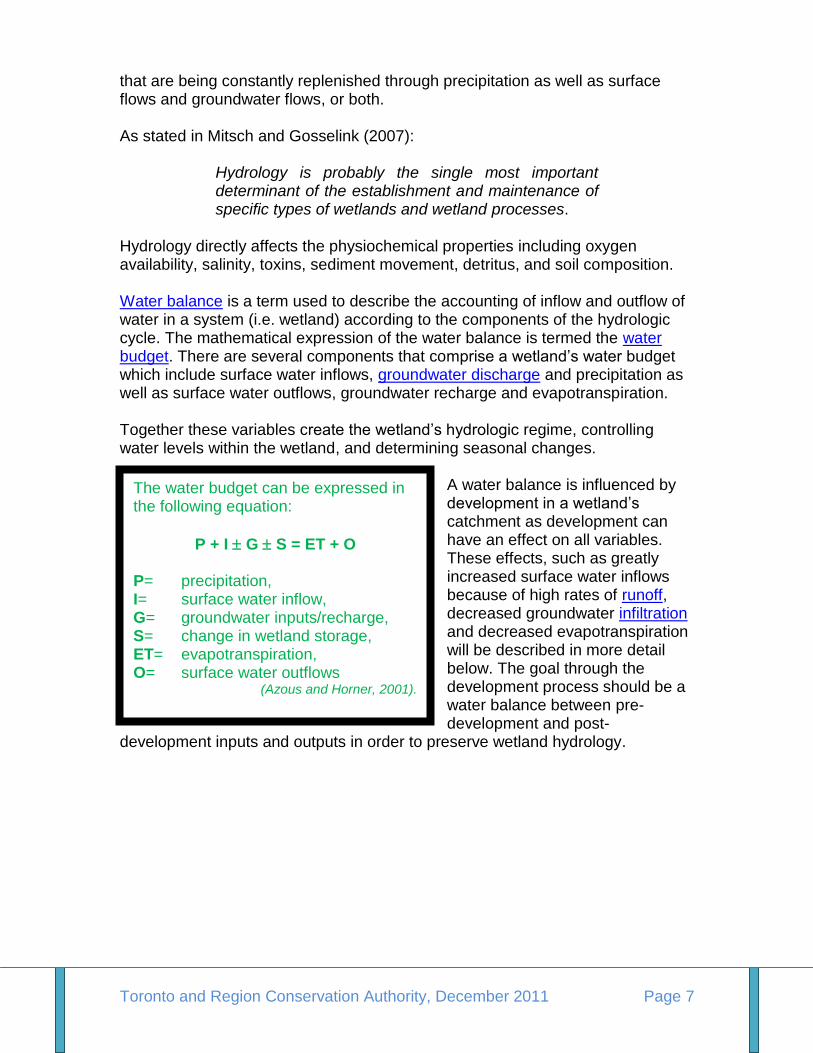
Hydrology directly affects the physiochemical properties including oxygen availability, salinity, toxins, sediment movement, detritus, and soil composition. Water balance is a term used to describe the accounting of inflow and outflow of water in a system (i.e. wetland) according to the components of the hydrologic cycle. The mathematical expression of the water balance is termed the water budget. There are several components that comprise a wetland‘s water budget which include surface water inflows, groundwater discharge and precipitation as well as surface water outflows, groundwater recharge and evapotranspiration. Together these variables create the wetland‘s hydrologic regime, controlling water levels within the wetland, and determining seasonal changes.
A water balance is influenced by development in a wetland‘s catchment as development can have an effect on all variables. These effects, such as greatly increased surface water inflows because of high rates of runoff, decreased groundwater infiltration and decreased evapotranspiration will be described in more detail below. The goal through the development process should be a water balance between pre-development and post-
development inputs and outputs in order to preserve wetland hydrology.
The water budget can be expressed in the following equation:
P + I G S = ET + O
P= precipitation, I= surface water inflow, G= groundwater inputs/recharge, S= change in wetland storage, ET= evapotranspiration, O= surface water outflows
(Azous and Horner, 2001).
Toronto and Region Conservation Authority, December 2011 Page 8
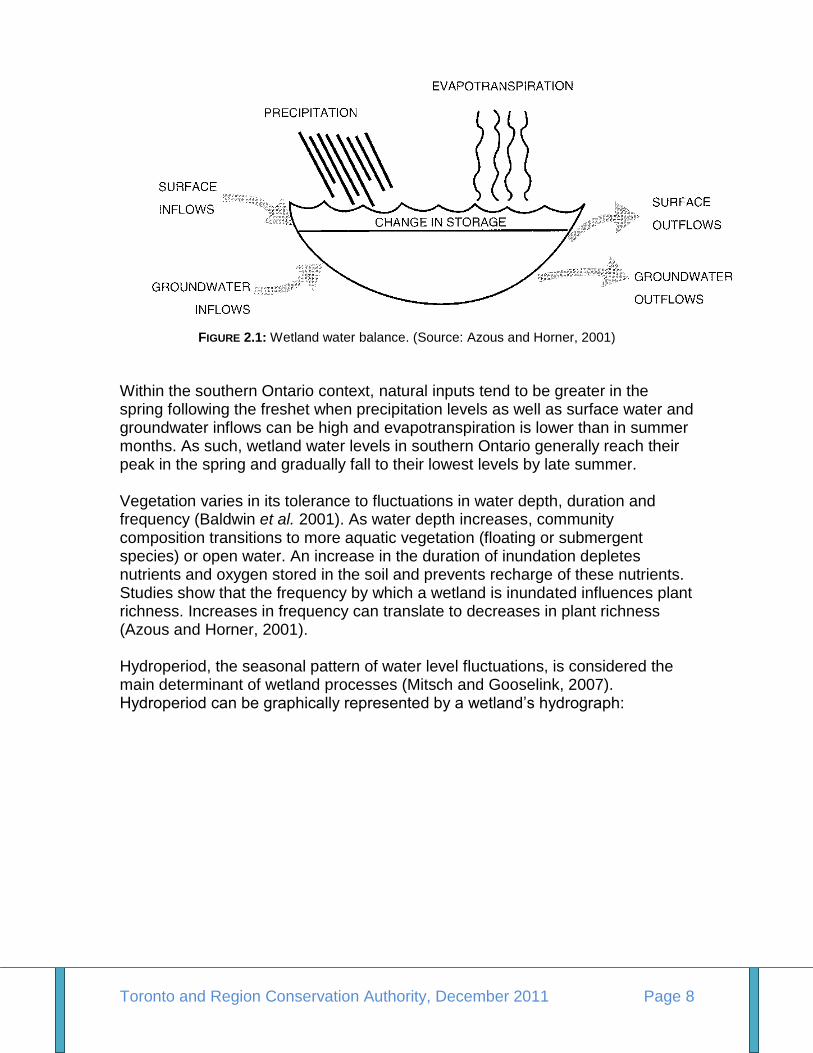
FIGURE 2.1: Wetland water balance. (Source: Azous and Horner, 2001)
Within the southern Ontario context, natural inputs tend to be greater in the spring following the freshet when precipitation levels as well as surface water and groundwater inflows can be high and evapotranspiration is lower than in summer months. As such, wetland water levels in southern Ontario generally reach their peak in the spring and gradually fall to their lowest levels by late summer. Vegetation varies in its tolerance to fluctuations in water depth, duration and frequency (Baldwin et al. 2001). As water depth increases, community composition transitions to more aquatic vegetation (floating or submergent species) or open water. An increase in the duration of inundation depletes nutrients and oxygen stored in the soil and prevents recharge of these nutrients. Studies show that the frequency by which a wetland is inundated influences plant richness. Increases in frequency can translate to decreases in plant richness (Azous and Horner, 2001). Hydroperiod, the seasonal pattern of water level fluctuations, is considered the main determinant of wetland processes (Mitsch and Gooselink, 2007). Hydroperiod can be graphically represented by a wetland‘s hydrograph:
Toronto and Region Conservation Authority, December 2011 Page 9
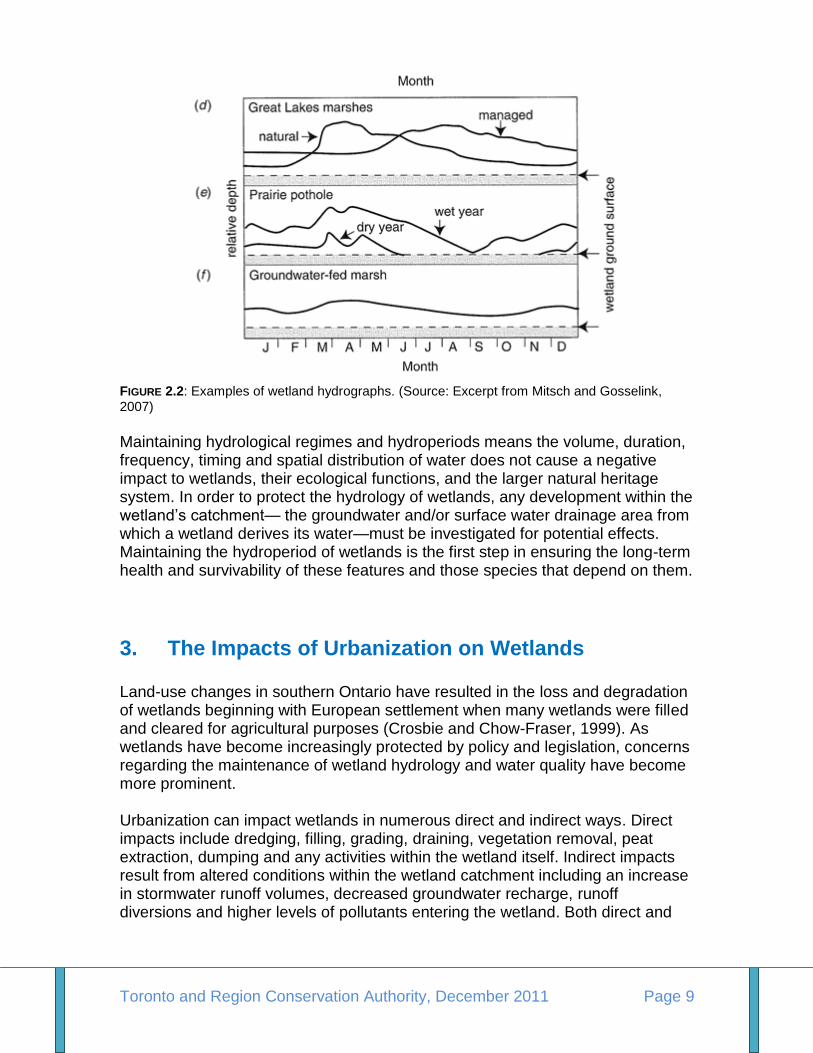
FIGURE 2.2: Examples of wetland hydrographs. (Source: Excerpt from Mitsch and Gosselink, 2007)
Maintaining hydrological regimes and hydroperiods means the volume, duration, frequency, timing and spatial distribution of water does not cause a negative impact to wetlands, their ecological functions, and the larger natural heritage system. In order to protect the hydrology of wetlands, any development within the wetland‘s catchment— the groundwater and/or surface water drainage area from which a wetland derives its water—must be investigated for potential effects. Maintaining the hydroperiod of wetlands is the first step in ensuring the long-term health and survivability of these features and those species that depend on them.
3. The Impacts of Urbanization on Wetlands Land-use changes in southern Ontario have resulted in the loss and degradation of wetlands beginning with European settlement when many wetlands were filled and cleared for agricultural purposes (Crosbie and Chow-Fraser, 1999). As wetlands have become increasingly protected by policy and legislation, concerns regarding the maintenance of wetland hydrology and water quality have become more prominent. Urbanization can impact wetlands in numerous direct and indirect ways. Direct impacts include dredging, filling, grading, draining, vegetation removal, peat extraction, dumping and any activities within the wetland itself. Indirect impacts result from altered conditions within the wetland catchment including an increase in stormwater runoff volumes, decreased groundwater recharge, runoff diversions and higher levels of pollutants entering the wetland. Both direct and
Toronto and Region Conservation Authority, December 2011 Page 10
indirect impacts result in physical changes to wetlands, which affect their function and biological composition. The effects are outlined below.
3.1 Puget Sound Wetlands Study and Other Research
The most comprehensive study conducted to date on the impacts of urbanization on wetlands was carried out in King County, Washington, U.S.A. on wetlands in the Puget Sound region and was named the Puget Sound Wetlands and Stormwater Management Research Program. The research program began in the 1980‘s and culminated in the publication of a book entitled Wetlands and Urbanization: Implications for the Future reporting the findings of a series of studies published in 2000 and the development of a guideline for wetland and stormwater management for King County. The study focused on 19 palustrine wetlands located within an area that was undergoing various levels of urban development. The Puget Sound researchers examined development impacts to wetland hydrology, water quality, as well as flora and fauna communities. The research program found that wetlands were highly affected by development within their catchments. An important consideration when analyzing the data for the Puget Sound research project is the fact that, in the Puget Sound area, the developing lowlands are forested prior to the commencement of urbanization (Reinelt and Taylor, 2001). This landscape is strikingly different from that of southern Ontario where historical agricultural activities had largely cleared the landscape of extensive forested tracks in the early 20th century. As development currently proceeds within southern Ontario, land conversion is generally from agricultural to urban, rather than from forested to urban, and many of the impacts of forest removal have already been experienced in the wetlands. Various other literature reviews and studies have examined development impacts on wetlands. In 2006, the Centre for Watershed Protection (CWP) released a series of papers titled Wetlands and Watersheds, one of which was a review of the literature on the Direct and Indirect Impacts of Urbanization on Wetland Quality (Wright et al., 2006). The results of the Puget Sound study, the review by the CWP, as well as information collected in other studies will be discussed below.
3.2 Hydrological changes to wetlands following urbanization
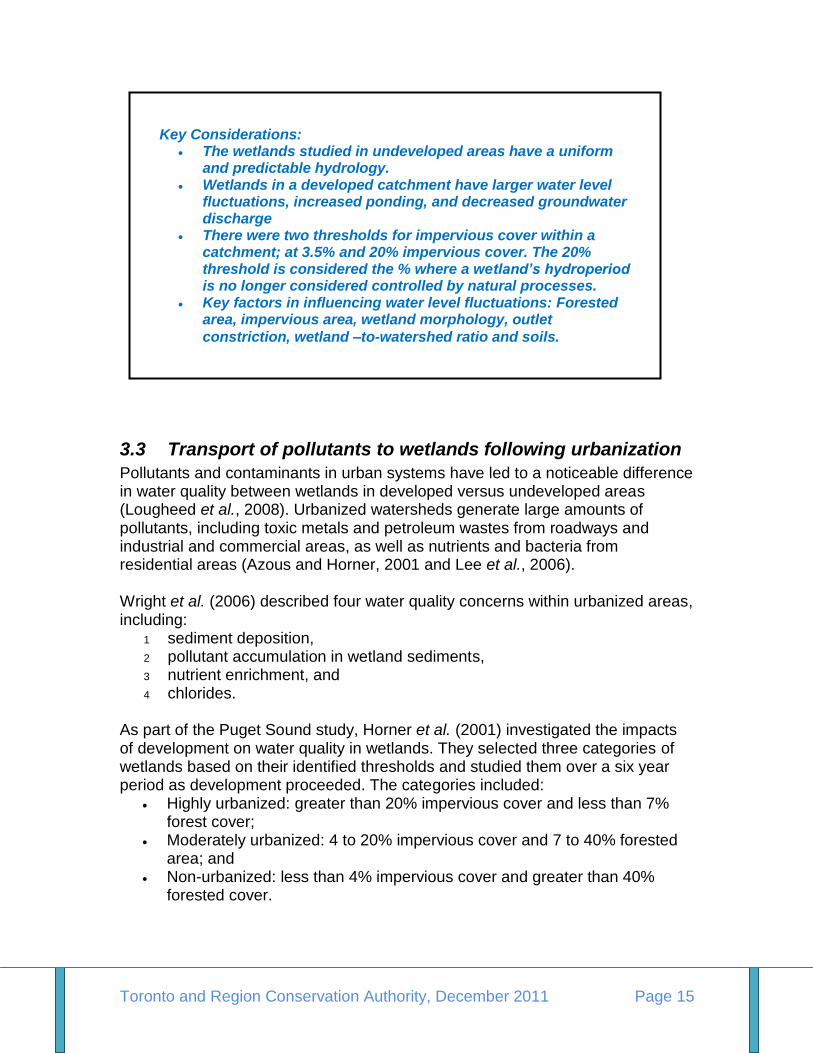
One of the most significant indirect impacts to wetlands caused by urbanization is the alteration of wetland hydrology. Wetlands in undeveloped areas have a uniform and predictable hydrology while urban development within the catchment results in larger water level fluctuations (Schueler and Holland, 2000). These
Toronto and Region Conservation Authority, December 2011 Page 11
hydrologic changes are caused by many factors, including increased runoff from impervious surfaces and reduced natural cover. As natural cover is replaced by impervious cover and stormwater is efficiently directed towards the stormwater management system, the variables controlling the water balance become highly altered, changing a wetland‘s hydrological regime. Infiltration and evapotranspiration are greatly reduced while runoff increases sharply even when current BMPs, such as stormwater management ponds, are in place. As this excess runoff is released into the natural system, the resulting effects on wetlands are increased water level fluctuations, increased ponding, and decreased groundwater discharge to wetlands (Wright et al., 2006). The altered environment can be further exacerbated by constrictions at the inlets and outlets of wetlands caused by roads and grading alterations, which disrupt flow patterns and can lead to increased flooding or drying depending on the location of the constriction (Wright et al., 2006). All of these changes affect the ecological condition and function of wetlands in urbanizing areas leading to measurable biological responses. None of the papers that we examined had studied the effects of best management practices that would specifically mitigate the impacts of hydrological changes on wetland ecological functions. While water levels can fluctuate in all wetlands, fluctuations in developed areas differ from the natural regime. In the Puget Sound study, it was found that the higher stormwater flows led to increased water levels following storm events, and this change occurred with increased frequency throughout the wet season and for greater periods of time (Reinelt and Taylor, 2001). Increased impermeable surfaces and decreased forest cover led to water level fluctuations after storm events of up to 0.3 metres or greater in urbanized areas, while wetlands in undeveloped areas demonstrated fluctuations of less than 0.1 metres (Schueler and Holland, 2000). During the Puget Sound research program, two thresholds for percent impervious cover within a wetland‘s catchment were determined (Reinelt and Taylor, 2001):
the first threshold occurred at approximately 3.5% impervious cover, the second threshold at 20% imperviousness cover
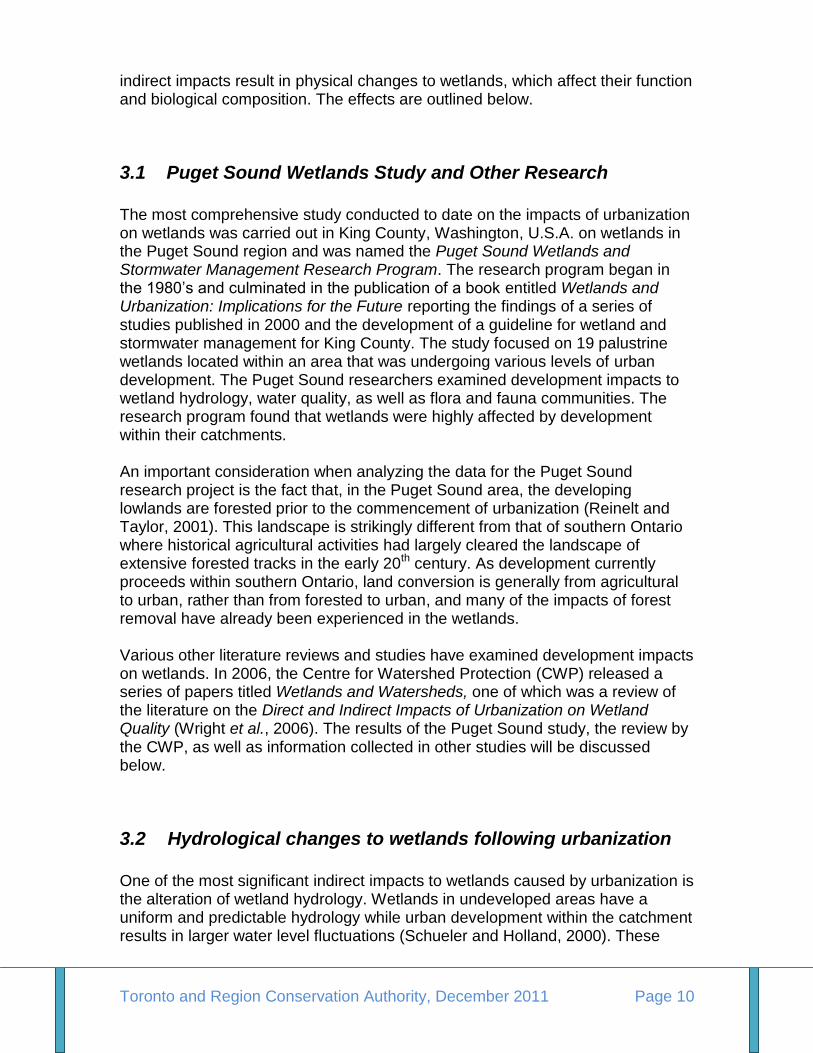
The first threshold represents low levels of development accompanied by some forest clearing and minor storm drain systems. The second threshold was the point when the wetland‘s hydroperiod was no longer controlled by natural processes, but was dominated by the urban regime. Figure 3.1 graphically represents the relationship between water level fluctuations (WLF) and percent impervious area as well as the thresholds.
There is limited research completed to assess the impact of urbanization in a Southern Ontario context.
Toronto and Region Conservation Authority, December 2011 Page 12
FIGURE 3.1: Relationship between water level fluctuations (WLF) and total impervious cover (TIC). (Source: Reinelt et al., 1998)
Kentula et al. (2004) published 16 years of research completed on 164 wetlands in Portland, Oregon. In their study, they also looked at palustrine wetlands, and focused on small wetlands under 2 hectares in size, classifying them as either palustrine emergent marsh or palustrine open water. The wetlands under study were surrounded by a variety of land uses including urban (considered commercial or industrial), residential, agricultural and undeveloped. They estimated that the average amount of impervious surface associated with agricultural areas and undeveloped areas was on average 10% for both land use classes. There was 30% impervious surface in residential areas and 48% in urban areas. Similar to the Puget Sound study, the results of the hydrological investigations were that wetlands found in developed areas (urban and residential) exhibited water level fluctuations of up to 1 metre, with much smaller fluctuations following storm events in undeveloped and agricultural areas. They also noted that the period of water retention within the wetlands was longer in rural areas, whereas the water levels in developed areas showed a sharp rise and fall in response to a storm event.
Stormwater management ponds do not have the ability to mimic the natural seasonal delays that occur through the groundwater infiltration process.
Toronto and Region Conservation Authority, December 2011 Page 13
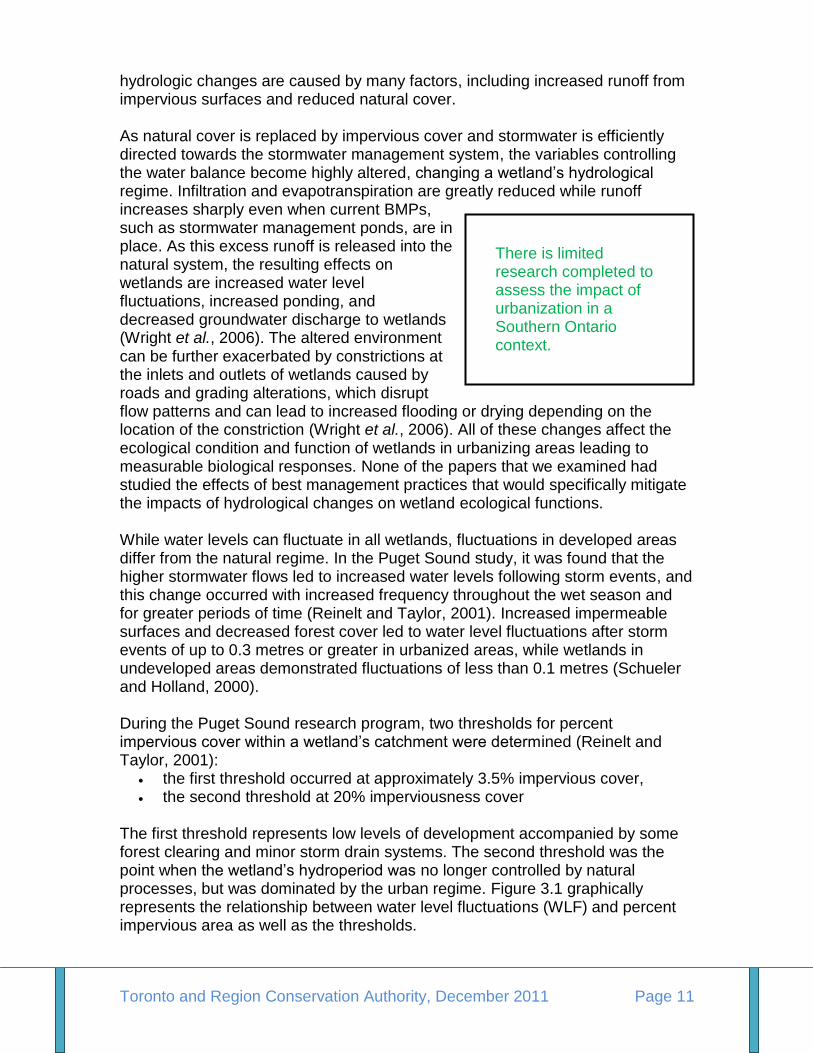
FIGURE 3.2: Typical hydrographs of wetlands in developed and rural areas. During the first two urban storms the levels were even higher than the instrumentation resulting in the flat peaks. (Source: Kentula et al., 2004)
Figure 3.2 demonstrates the typical differences between hydrographs of wetlands located within developed and rural areas. Stage is calculated by measuring the distance between the lowest point in the wetland and the top of the water level. The Portland Oregon and Puget Sound studies show that urbanization leads to an increase in water level fluctuations through an increase in imperviousness in the landscape. In addition to water level fluctuations, increased ponding or flooding associated with urban land uses results in measurable wetland impacts. Ponding differs from water fluctuations in that the higher water levels are present for several seasons or the whole year, rather than for shorter durations in response to storm events. Increased ponding in wetlands is a common indirect impact of a developed catchment that results when the excess runoff from impervious areas is not able to drain rapidly. Higher water levels within the wetland change the hydroperiod of the wetland which leads to impacts to flora and fauna (discussed in more detail below). Ponding can be further exacerbated by a constriction such as an undersized culvert at a wetland outlet (Wright et al., 2006). Another issue that affects wetland hydrology in urban systems with impervious surfaces is the reduction of groundwater infiltration which then results in reduced discharge to groundwater-fed wetlands. Under natural conditions, groundwater-fed wetlands have been shown to have more uniform water levels throughout the year than surface water fed wetlands, which tend to vary seasonally (Mitsh and Gosselink, 2007). In an urban setting, decreased groundwater recharge, in combination with increased runoff, alters the timing of water inputs to a wetland (Owen, 1999). Groundwater levels, which are replenished in undeveloped areas during the spring freshet, provide a steady source of water throughout the growing season to groundwater-fed wetlands. As impervious surfaces reduce infiltration, and as surface water dynamics dominate in urban areas, the previously predictable water levels in these wetlands become flashy. This affects the wetland‘s hydroperiod. Best management practices (BMP), such as stormwater management ponds, are designed to mitigate the effects of flooding
Toronto and Region Conservation Authority, December 2011 Page 14
and degraded water quality from urbanization. As described in Booth et al. (2002), stormwater ponds can retain water for several days, but do not have the ability to mimic the natural seasonal delays that occur through the groundwater infiltration process. Hydrological impacts to wetlands, however, are not uniform even in urbanized areas and can vary by wetland type. There are virtually no studies comparing different types of wetlands and their sensitivity to development, however, there is a consensus that some habitats, such as bogs and fens, are highly susceptible to change given their requirement for a narrow range of conditions (Wright, et al., 2006). The conceptual model used within the Puget Sound study identified the following as key factors on influencing water level fluctuations (Reinelt and Taylor, 2001):
1 forested area; 2 impervious area; 3 wetland morphology; 4 outlet constriction; 5 wetland-to-watershed ratio; and 6 watershed soils.
Within their study, one wetland diverged from the trend of increased water level fluctuation resulting from increased percent impervious cover as well as a constricted outlet. This anomalous wetland was different from the others studied as it had glacial outwash soils within the catchment. These permeable glacial soils acted to reduce runoff through higher infiltration rates in the remaining pervious areas (Reinelt and Taylor, 2001). This example shows that soil type within the wetland and the catchment play a role in the level of runoff impacts.
Toronto and Region Conservation Authority, December 2011 Page 15
3.3 Transport of pollutants to wetlands following urbanization
Pollutants and contaminants in urban systems have led to a noticeable difference in water quality between wetlands in developed versus undeveloped areas (Lougheed et al., 2008). Urbanized watersheds generate large amounts of pollutants, including toxic metals and petroleum wastes from roadways and industrial and commercial areas, as well as nutrients and bacteria from residential areas (Azous and Horner, 2001 and Lee et al., 2006). Wright et al. (2006) described four water quality concerns within urbanized areas, including:
1 sediment deposition, 2 pollutant accumulation in wetland sediments, 3 nutrient enrichment, and 4 chlorides.
As part of the Puget Sound study, Horner et al. (2001) investigated the impacts of development on water quality in wetlands. They selected three categories of wetlands based on their identified thresholds and studied them over a six year period as development proceeded. The categories included:
Highly urbanized: greater than 20% impervious cover and less than 7% forest cover;
Moderately urbanized: 4 to 20% impervious cover and 7 to 40% forested area; and
Non-urbanized: less than 4% impervious cover and greater than 40% forested cover.
Key Considerations: The wetlands studied in undeveloped areas have a uniform
and predictable hydrology. Wetlands in a developed catchment have larger water level
fluctuations, increased ponding, and decreased groundwater discharge
There were two thresholds for impervious cover within a catchment; at 3.5% and 20% impervious cover. The 20% threshold is considered the % where a wetland’s hydroperiod is no longer considered controlled by natural processes.
Key factors in influencing water level fluctuations: Forested area, impervious area, wetland morphology, outlet
constriction, wetland –to-watershed ratio and soils.
Toronto and Region Conservation Authority, December 2011 Page 16
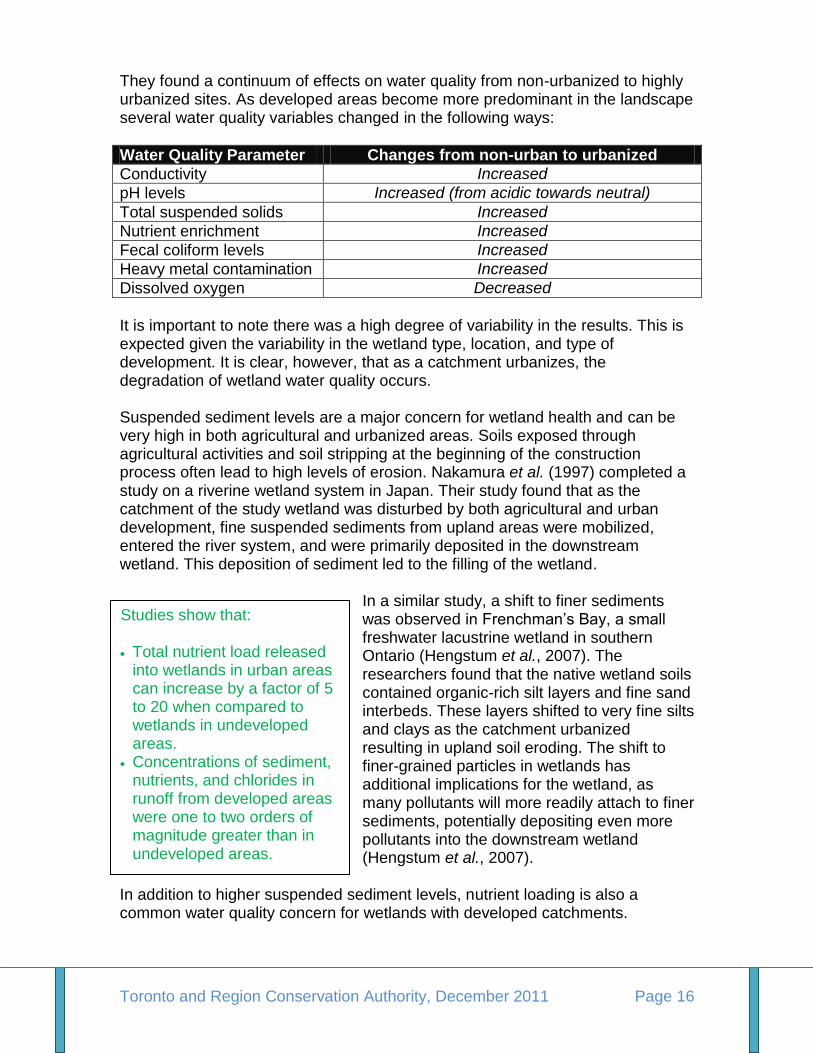
They found a continuum of effects on water quality from non-urbanized to highly urbanized sites. As developed areas become more predominant in the landscape several water quality variables changed in the following ways:
Water Quality Parameter Changes from non-urban to urbanized
Conductivity Increased
pH levels Increased (from acidic towards neutral)
Total suspended solids Increased
Nutrient enrichment Increased
Fecal coliform levels Increased
Heavy metal contamination Increased
Dissolved oxygen Decreased
It is important to note there was a high degree of variability in the results. This is expected given the variability in the wetland type, location, and type of development. It is clear, however, that as a catchment urbanizes, the degradation of wetland water quality occurs. Suspended sediment levels are a major concern for wetland health and can be very high in both agricultural and urbanized areas. Soils exposed through agricultural activities and soil stripping at the beginning of the construction process often lead to high levels of erosion. Nakamura et al. (1997) completed a study on a riverine wetland system in Japan. Their study found that as the catchment of the study wetland was disturbed by both agricultural and urban development, fine suspended sediments from upland areas were mobilized, entered the river system, and were primarily deposited in the downstream wetland. This deposition of sediment led to the filling of the wetland.
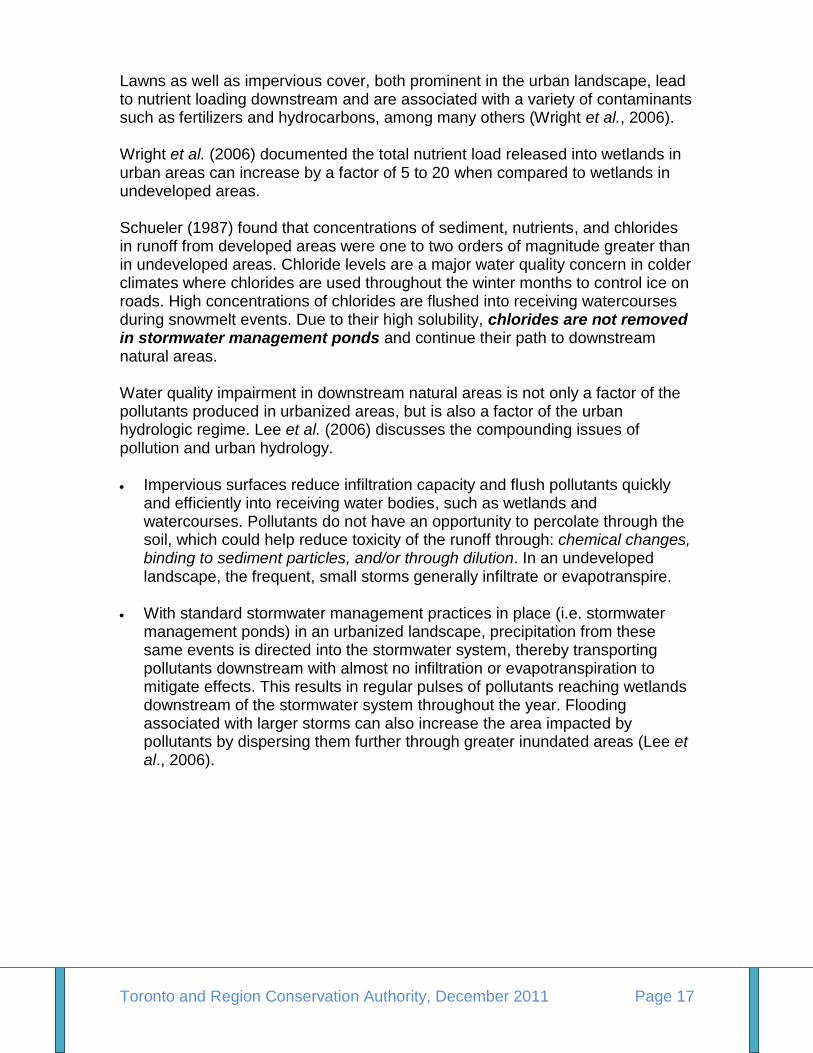
In a similar study, a shift to finer sediments was observed in Frenchman‘s Bay, a small freshwater lacustrine wetland in southern Ontario (Hengstum et al., 2007). The researchers found that the native wetland soils contained organic-rich silt layers and fine sand interbeds. These layers shifted to very fine silts and clays as the catchment urbanized resulting in upland soil eroding. The shift to finer-grained particles in wetlands has additional implications for the wetland, as many pollutants will more readily attach to finer sediments, potentially depositing even more pollutants into the downstream wetland (Hengstum et al., 2007).
In addition to higher suspended sediment levels, nutrient loading is also a common water quality concern for wetlands with developed catchments.
Studies show that: Total nutrient load released
into wetlands in urban areas can increase by a factor of 5 to 20 when compared to wetlands in undeveloped areas.
Concentrations of sediment, nutrients, and chlorides in runoff from developed areas were one to two orders of magnitude greater than in undeveloped areas.
Toronto and Region Conservation Authority, December 2011 Page 17
Lawns as well as impervious cover, both prominent in the urban landscape, lead to nutrient loading downstream and are associated with a variety of contaminants such as fertilizers and hydrocarbons, among many others (Wright et al., 2006). Wright et al. (2006) documented the total nutrient load released into wetlands in urban areas can increase by a factor of 5 to 20 when compared to wetlands in undeveloped areas. Schueler (1987) found that concentrations of sediment, nutrients, and chlorides in runoff from developed areas were one to two orders of magnitude greater than in undeveloped areas. Chloride levels are a major water quality concern in colder climates where chlorides are used throughout the winter months to control ice on roads. High concentrations of chlorides are flushed into receiving watercourses during snowmelt events. Due to their high solubility, chlorides are not removed in stormwater management ponds and continue their path to downstream natural areas. Water quality impairment in downstream natural areas is not only a factor of the pollutants produced in urbanized areas, but is also a factor of the urban hydrologic regime. Lee et al. (2006) discusses the compounding issues of pollution and urban hydrology. Impervious surfaces reduce infiltration capacity and flush pollutants quickly
and efficiently into receiving water bodies, such as wetlands and watercourses. Pollutants do not have an opportunity to percolate through the soil, which could help reduce toxicity of the runoff through: chemical changes, binding to sediment particles, and/or through dilution. In an undeveloped landscape, the frequent, small storms generally infiltrate or evapotranspire.
With standard stormwater management practices in place (i.e. stormwater
management ponds) in an urbanized landscape, precipitation from these same events is directed into the stormwater system, thereby transporting pollutants downstream with almost no infiltration or evapotranspiration to mitigate effects. This results in regular pulses of pollutants reaching wetlands downstream of the stormwater system throughout the year. Flooding associated with larger storms can also increase the area impacted by pollutants by dispersing them further through greater inundated areas (Lee et al., 2006).
Toronto and Region Conservation Authority, December 2011 Page 18
3.4 Biological responses of wetlands following urbanization
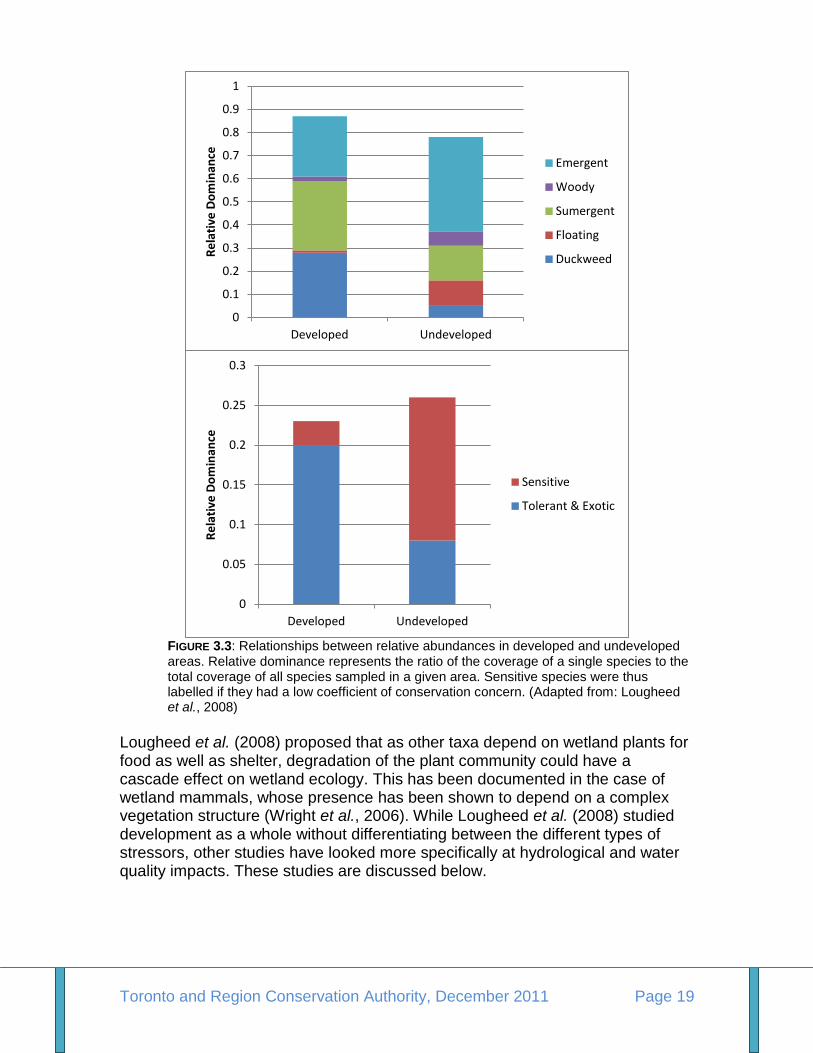
Development within a wetland‘s catchment has measurable impacts on its biological community. These impacts are caused by the changes to the water quality and hydrology as discussed above, as well as other stressors linked to urbanization, such as fragmentation and isolation within an urban setting. A study carried out in Michigan by Lougheed et al. (2008) investigated whether urban development stressors led to the homogenization of four taxonomic groups in study wetlands. Taxonomic groups included: aquatic vascular plants and their associated communities of diatoms, zooplankton, and macroinvertebrates. They examined wetlands in developed areas (with an average of 42% combined agricultural and urban land uses within 1 kilometre) and undeveloped sites (less than 5% developed land). Wetlands classified as ―developed‖ exhibited greater fragmentation and had significantly higher chloride levels. Some of their findings included:
Three of the four taxonomic groups studied showed reduced species richness in the developed sites.
Developed sites also had significantly less rooted floating vegetation, significantly fewer sensitive plant species, and greater amounts of both tolerant and exotic species.
These relationships are shown below in Figure 3.3.
Key Considerations: Monitoring results for water quality parameters will
vary depending on wetland type, location, and type of development
Chlorides are a major water quality concern for wetlands
There are compounding impacts from urban hydrology on the amount and speed at which pollution reaches wetlands in urban areas
Toronto and Region Conservation Authority, December 2011 Page 19
FIGURE 3.3: Relationships between relative abundances in developed and undeveloped areas. Relative dominance represents the ratio of the coverage of a single species to the total coverage of all species sampled in a given area. Sensitive species were thus labelled if they had a low coefficient of conservation concern. (Adapted from: Lougheed et al., 2008)
Lougheed et al. (2008) proposed that as other taxa depend on wetland plants for food as well as shelter, degradation of the plant community could have a cascade effect on wetland ecology. This has been documented in the case of wetland mammals, whose presence has been shown to depend on a complex vegetation structure (Wright et al., 2006). While Lougheed et al. (2008) studied development as a whole without differentiating between the different types of stressors, other studies have looked more specifically at hydrological and water quality impacts. These studies are discussed below.
0
0.1
0.2
0.3
0.4
0.5
0.6
0.7
0.8
0.9
1
Developed Undeveloped
Re
lati
ve D
om
inan
ce
Emergent
Woody
Sumergent
Floating
Duckweed
0
0.05
0.1
0.15
0.2
0.25
0.3
Developed Undeveloped
Re
lati
ve D
om
inan
ce
Sensitive
Tolerant & Exotic
Toronto and Region Conservation Authority, December 2011 Page 20
3.4.1 Water level fluctuations
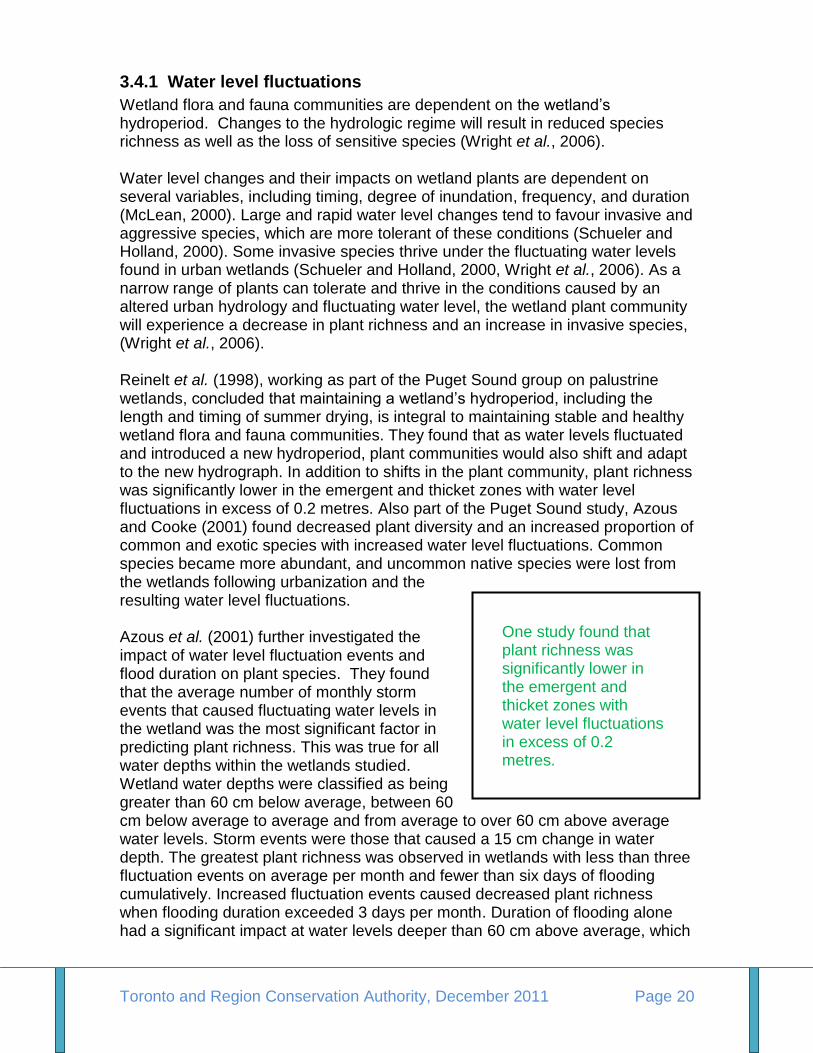
Wetland flora and fauna communities are dependent on the wetland‘s hydroperiod. Changes to the hydrologic regime will result in reduced species richness as well as the loss of sensitive species (Wright et al., 2006). Water level changes and their impacts on wetland plants are dependent on several variables, including timing, degree of inundation, frequency, and duration (McLean, 2000). Large and rapid water level changes tend to favour invasive and aggressive species, which are more tolerant of these conditions (Schueler and Holland, 2000). Some invasive species thrive under the fluctuating water levels found in urban wetlands (Schueler and Holland, 2000, Wright et al., 2006). As a narrow range of plants can tolerate and thrive in the conditions caused by an altered urban hydrology and fluctuating water level, the wetland plant community will experience a decrease in plant richness and an increase in invasive species, (Wright et al., 2006). Reinelt et al. (1998), working as part of the Puget Sound group on palustrine wetlands, concluded that maintaining a wetland‘s hydroperiod, including the length and timing of summer drying, is integral to maintaining stable and healthy wetland flora and fauna communities. They found that as water levels fluctuated and introduced a new hydroperiod, plant communities would also shift and adapt to the new hydrograph. In addition to shifts in the plant community, plant richness was significantly lower in the emergent and thicket zones with water level fluctuations in excess of 0.2 metres. Also part of the Puget Sound study, Azous and Cooke (2001) found decreased plant diversity and an increased proportion of common and exotic species with increased water level fluctuations. Common species became more abundant, and uncommon native species were lost from the wetlands following urbanization and the resulting water level fluctuations. Azous et al. (2001) further investigated the impact of water level fluctuation events and flood duration on plant species. They found that the average number of monthly storm events that caused fluctuating water levels in the wetland was the most significant factor in predicting plant richness. This was true for all water depths within the wetlands studied. Wetland water depths were classified as being greater than 60 cm below average, between 60 cm below average to average and from average to over 60 cm above average water levels. Storm events were those that caused a 15 cm change in water depth. The greatest plant richness was observed in wetlands with less than three fluctuation events on average per month and fewer than six days of flooding cumulatively. Increased fluctuation events caused decreased plant richness when flooding duration exceeded 3 days per month. Duration of flooding alone had a significant impact at water levels deeper than 60 cm above average, which
One study found that plant richness was significantly lower in the emergent and thicket zones with water level fluctuations in excess of 0.2 metres.
Toronto and Region Conservation Authority, December 2011 Page 21
was the deepest water level category studied. The effects of flood duration increased with events longer than six days. They concluded that plant communities influenced by more than three hydrologic events per month had reduced plant richness. Some of their results are presented in Figure 3.4 below.
FIGURE 3.4: Plant richness, frequency, and duration of flooding. (Source: Azous et al., 2001)
Owen (1999) completed a study on a 92 ha urban peatland in Wisconsin that had been heavily affected by agriculture and subsequently by urban development between 1850 and 1990. Owen estimated the changes in surface runoff from the surrounding landscape in a typical rainy season (April-October). Aerial photographs, historic maps and water levels of the area were used to examine changes in land use, wetland vegetation and groundwater and surface flows over time. Prior to 1850, there was limited disturbance in the catchment, it was estimated there was almost no surface runoff to the wetland. As land uses in the surrounding area changed from natural to row crops then to urban by 1990, runoff to the wetland was estimated to have increased twenty-fold. The results of the study were as follows: 1 runoff changes have resulted in higher water level fluctuations and higher
mean water levels; 2 parts of the wetland that previously exhibited artesian conditions became
areas of recharge, suggesting that urban development reversed groundwater gradients;
3 the hydrological changes have lead to Phalaris arundinacea and Typha spp. (including the non-native Typha angustifolia) increasing in abundance; the more sensitive Carex spp. community, which had dominated historically, was on the decline;
Toronto and Region Conservation Authority, December 2011 Page 22
4 P. arundinacea was found to be dominant at the drier sites with high water level fluctuations, while T. angustifolia was most prevalent at the wettest sites; and
5 Carex spp. was still dominant in the parts of the wetland where groundwater levels were close to the surface, but this represented only small sections of the wetland.
Wetland fauna species are also affected by urban hydrologic conditions. Amphibian species richness was demonstrated to be inversely related to the amount of impervious cover in a watershed and mean water level fluctuations in the wetland (Schueler and Holland, 2000). Reinelt et al. (1998) found that water level fluctuations of more than 0.2 m caused a significant reduction in the average number of amphibian species as compared to wetlands with lower water level fluctuations. Wetlands with these high water level fluctuations supported only three or fewer species of amphibians. While the exact cause of the decreased number of species was not investigated, water level fluctuations can cause direct damage to egg masses and water temperature changes related to hydrological changes; these same condition changes will likely also affect amphibians (Reinelt et al. 1998). Most research on amphibian communities in urban areas have linked their declines to other urbanization impacts including fragmentation, habitat loss and extensive road networks and have not focused on water level fluctuations (Rubbo and Kiesecker, 2005, Hamer and McDonnell, 2008 and Pillsbury and Miller, 2008).
3.4.2 Depth and Duration of Flooding
Increased flooding depth and duration in urbanized wetlands has been shown to suppress herbaceous growth and increase invasion by opportunistic species (McClean, 2000). Even obligate wetland plant species may not have a tolerance for flood conditions as species are adapted to specific water levels (McLean, 2000 and Wright et al., 2006). Flooding also impacts woody species as many
One study found that water level fluctuations of more than 0.2m caused a significant reduction in the average number of amphibian species as compared to wetlands with lower water level fluctuations.
Key Considerations: Changes to the hydrologic regime will result in
reduced species richness as well as the loss of sensitive species
Changes will depend on timing, degree of inundation, frequency and duration.

Toronto and Region Conservation Authority, December 2011 Page 23
common wetland woody species in southern Ontario are not flood tolerant. Wetland trees are especially sensitive to flooding if the tree root collar is inundated which inhibits respiration, or if increased flooding occurs during the growing season (McClean, 2000). In Baldwin et al. (2001), timing of flooding was found to be especially important to plant growth through a series of field, greenhouse and seed bank experiments conducted at various flooding regimes. In their greenhouse-based seed bank experiment, they found a dramatic difference in species richness between the flooding regimes studied. The flooding regimes are as follows:
continuously flooded (FF) – 10 cm below water level for 5 months flooded then nonflooded (FN) - 35 days 10 cm below water level and then
10 cm above water level for the four months nonflooded then flooded (NF) – 35 days at 10 cm above water level and
then 10 cm below water level for four months nonflooded continuously (NN) –10 cm above water level for 5 months
NN sods were not dry, but were moist as characterized by wetland conditions. Specific species were not selected for but the sod used was representative of the species diversity in the wetland and thus contained a mix of wetland species. The various flooding regimes produced very different results and the FF wetland sods had half the species richness of the NN sods. The FN sods were similar to the FF ones, and the NF sods exhibited intermediate species richness. These wetland experiments also demonstrated that the timing of flooding was extremely important. Flooding for over a month to a depth of 10 cm in the early growing season had the most detrimental impact on the herbaceous species studied (Figure 3.5).
FIGURE 3.5: Species richness of plants in marsh sods exposed to four hydrologic regime treatments in the greenhouse. Means with different letters are significantly different. (Source: Baldwin et al., 2001)
Baldwin et al. also found that lowering marsh sods by 10 cm (i.e., wetter conditions) in the field reduced plant species richness by 26% compared to the sods placed level with the marsh surface, while raising sods by 10 cm (drier
Toronto and Region Conservation Authority, December 2011 Page 24
conditions) increased richness by 42%. Seed bank results were also important as they found that twice as many species of seedlings and five times as many individuals sprouted under the NN conditions as under the FF conditions. Even 10 cm of flooding early in the growing season, for as little as a month, caused more suppression of growth than later flooding of up to four months in duration. Because of the effects of the timing of flooding on plant growth, they concluded that:
seedlings and plants resprouting following winter dormancy are more susceptible to the impacts of flooding than plants later in the growing season (Baldwin et al., 2001).
water level fluctuation, timing, and depth of inundation, especially when it coincided with the early growing season, affected plant assemblages in wetlands (Reinelt et al. 1998).
Simmons et al. (2007) studied flooding in bottomland hardwood forests and woody species in particular. The three woody species they focused on were Cephalanthus occidentalis L. (Buttonbush), Fraxinus pensylvanica (Green ash) and Quercus shumardii (Shumard oak) because of their prevalence in bottomland forests. They experimentally compared long and short ‗urban‘ flooding regimes with a rural hydrologic regime. They found individualistic species responses to the various experimental flooding regimes with the facultative species, F. pensylvanica, greatly affected by prolonged flooding while Q. shumardii did not have a strong response. They determined that flood duration appears to be a critical factor for the woody species studied and more important than flooding frequency. As the species specific responses were individualistic, they concluded that urban hydrological conditions would result in a shift in species composition over time, as some species are more tolerant of the new hydrologic regime than others. A paper by Wei and Chow-Fraser (2006) looked at the impacts of flooding on a wetland plant community at Cootes Paradise, a 250 ha coastal marsh on Lake Ontario. The marsh was historically dominated by Typha latifolia, but was invaded during the mid 1900‘s by Glyceria maxima, and later by Lythrum salicaria and Phragmites australis. Wei and Chow-Fraser looked at the correlation between Typha and Glyceria and a number of variables, including human population density and water levels. Their research showed that while the growth of both Typha and Glyceria were negatively correlated with high water levels, Glyceria‘s abundance showed a positive correlation with human population density. Furthermore, they found that ability of Glyceria to establish itself following a disturbance, such as flooding, was much greater than that of Typha. As high water levels caused by urbanization affected both species, the recovery following the disturbance pushed the population towards a Glyceria dominated marsh. In Wei and Chow-Fraser (2005), they found that area of
One study found that flood duration appears to be a critical factor for the woody species studied and more important than flooding frequency
Toronto and Region Conservation Authority, December 2011 Page 25
inundation combined with human population levels were able to explain almost 92% of the variability in emergent plant cover. Flooding is also considered the greatest threat to the persistence of wetland avifauna (Richter and Azous, 2001). As part of the Puget Sound study, Richter and Azous (2001) found that flooding led to the inundation of nest sites of ground-nesting species and the dispersion of pollutants, making them more readily able for bioaccumulation in birds. Any impacts on plant species caused by flooding and other hydrological changes will affect food availability, sources and cover required by wetland avifauna. These are just some of the many factors contributing to the decline in bird species richness in wetlands within developed watersheds. Wetland flood duration has been found to be one of the key metrics for predicting breeding effort and amphibian community composition (Skidds et al., 2007). Amphibian species can experience both positive and negative effects from increased flooding in urbanized areas. Longer periods of inundation may enhance habitat for amphibian species which breed in late spring and summer (Pillsbury and Miller, 2008). However, increased periods of inundation can also lead to a greater presence of fish predators. Rubbo and Kiesecker (2005) proposed fish predation to be one of the causes for reduced urban amphibian species diversity as compared to the number of species found in rural wetlands. Conversely, water diversion to stormwater management ponds can reduce flooding resulting in earlier summer drying and habitat loss (Hamer and McDonnell, 2008).
3.4.3 Water quality impacts
There is a measurable impact on flora and fauna as a consequence of decreased water quality in wetlands within developed areas. Nakamura et al. (1997) found that sediment deposition within the study wetland altered the vegetation community. The fine sediment deposited in the wetland lowered the soil organic content to 10 to 15 % from the >60% organic content in undisturbed wetland soils. This caused the wetland to shift from a dominant sedge community to a Salix dominated community, which is more typical of riparian vegetation rather than wetland vegetation in the study region. Higher than natural levels of sediment deposition have also been linked to reduced seed germination and reduced survival of native species furthering the shift towards more tolerant and invasive wetland plant species (Wright et al., 2006). In the Frenchman‘s Bay study (Hengstum et al., 2007), changes in the sediment size to finer particles, an increase in turbidity and other impacts of urbanization have been linked to many changes in the wetland, including:
the loss of emergent and submergent aquatic vegetation, and the loss and degradation of fish and aquatic habitat.
They proposed that the fine silts had a direct impact on macrophytes in the wetland, which do not thrive in silts and clays. As macrophytes are involved with
Toronto and Region Conservation Authority, December 2011 Page 26
sediment trapping, their loss within the wetland was thought to compound the effects of increased sediment loading. Furthermore, sediment deposition has been linked to a species shift in the aquatic invertebrate community as the substrate within the wetland changes (Wright et al., 2006). Nutrient loading has also been shown to disrupt wetland plant communities and lead to changes in plant species composition, nutrient cycling, species richness and abundance (Lee et al., 2006). In nutrient enriched wetlands, the community shifts towards those dominated by species tolerant of high nutrient levels, which can out compete native species (Wright et al., 2006). A study completed by Crosbie and Chow-Fraser (1999) on 22 wetlands in southern Ontario found species richness was higher for submergent plants in wetlands with decreased water turbidity and nutrient loading. Wei and Chow-Fraser (2005, 2006) reported that exotic species, such as Glyceria (manna grass), were positively correlated to human population density. In addition, they found that Glyceria grew in soils that were high in concentrations of iron, phosphorous and nitrogen, which were unsuitable for the native Typha community. Nutrient loading has also been linked to a decrease in invertebrate diversity, especially in areas that also have high concentrations of chlorides (Wright et al., 2006). In addition to nutrient loading, high levels of chlorides represent a critical concern for flora and fauna communities. Lougheed et al. (2008) found that in isolated developed wetlands, mean chloride levels were significantly higher than in undeveloped areas and that plant species richness was reduced. Chronic low levels of chlorides have been shown to be detrimental to some aquatic flora and fauna and can lead to changes in populations or community structure (Environment Canada, 2001). High levels of chlorides, which can be found in wetlands near heavily salted roads or snow storage areas, have acute toxic effects (Environment Canada, 2001). Several common invasive species, such as purple loosestrife (Lythrum salicaria), narrow-leaved cattail (Typha augustifolia) and common reed-grass (Phragmites australis) tolerate and even thrive in high salt areas, such as roadside ditches (Environment Canada, 2001). Chlorides also impact the macroinvertebrate community reducing species richness (Wright et al., 2006). Wetland types that are especially vulnerable to chloride inputs include wetlands lacking distinct outlets, such as vernal pools where the chlorides are unable to leave the wetland through an outflow channel (Wright et al., 2006). Amphibian species are particularly sensitive to water quality changes, particularly the negative changes associated with urban areas. While some species are more sensitive than others, studies have found negative impacts from metals and pollutants in wetland sediments in urban areas (Hamer and McDonnell, 2008). While urban water quality conditions are lethal to most sensitive species such as wood frog (Rana sylvatica), such conditions can even result in reduced growth rates for more urban tolerant species (Hamer and McDonnell, 2008). In contrast to other water quality parameters, the direct link between heavy metal levels and what biological response they produce is less clear despite the many studies documenting higher levels of metals in wetlands with urbanized
Toronto and Region Conservation Authority, December 2011 Page 27
catchments (Ehrenfeld, 2008). Reported metal concentrations in urban wetlands, such as those for zinc, are generally below levels considered to be acutely toxic (Ehrenfeld, 2008). Hydrocarbons that accumulate in wetland sediment are similarly not well understood in terms of toxicity (Wright et al., 2006). A major concern of toxic sediment is the bioaccumulation of chemicals in wetland organisms (Wright et al., 2006).
3.4.4 Conclusions
An important conclusion of the Puget Sound study was that hydrologic changes were found to be the dominant factor affecting wetland plant and amphibian communities. Changes in wetland hydrology were seen to have rapidly affected community composition and to have a greater impact than other factors, such as decreased water quality (Azous et al., 2001). However, it is not just one impact stemming from urbanization that accounts for all the biological changes in wetlands, but it is the compounding factors that lead to the greatest impacts. Below are some of the key findings from the literature reviewed:
Wei and Chow-Fraser (2005) found that high water levels and human population act together creating even greater effects on emergent plants than either factor alone.
Reinelt et al. (1998) found that increased impervious cover combined with
constricted outlets resulted in the highest observed water level fluctuations.
Ludwa and Richter (2001) concluded that water quality, in combination with hydrologic parameters, were able to explain a significant amount of the urbanization impacts on macroinvertebrates, such as reduced taxa richness.
Key Considerations: Increased sediment loading will lead to a shift in
wetland plant community, reduction in seed germination and tends to favour invasive species.
Increased nutrient loading leads to changes in plant species composition, nutrient cycling, species richness and abundance.
Changes caused by water quality impacts have a compounding, exacerbating effect.
Toronto and Region Conservation Authority, December 2011 Page 28
Faulkner (2004) noted that an altered hydrologic regime combined with increased contaminant and nutrient loadings can lead to changes in plant species assemblages and nutrient cycling. This subsequently leads to changes in species richness and abundance of avian, amphibian and macroinvertebrate species.
Ehrenfeld (2008) concluded that invasive species take hold in urban
wetlands because of several factors at the site level, such as soils, anthropogenic effects and response of each individual species to all factors.
Protecting one aspect of wetland integrity alone will not eliminate the impacts of urbanization as a whole. Hence, it is important to maintain water quality and hydrologic regime through the urbanization process, in addition to protecting the wetland feature itself, in order to limit the cumulative stressors and improve feature resiliency.
Key Considerations: The timing of flooding was found to be
especially important to plant growth. Wetland flooding duration impacts both fauna
and flora diversity.
Toronto and Region Conservation Authority, December 2011 Page 29
4. Case Studies
The following section outlines two case studies of development impacts to wetlands within the Toronto and Region Conservation Authority‘s jurisdiction. Though development around these sites is still in early stages, there are already concerns regarding future of the Keele Wetlands and Wilcox-St. George Wetland Complex. The results of the monitoring programs for these two cases are discussed below.
4.1 Keele Wetlands (A.K.A. Dreamworks)
4.1.1 Context
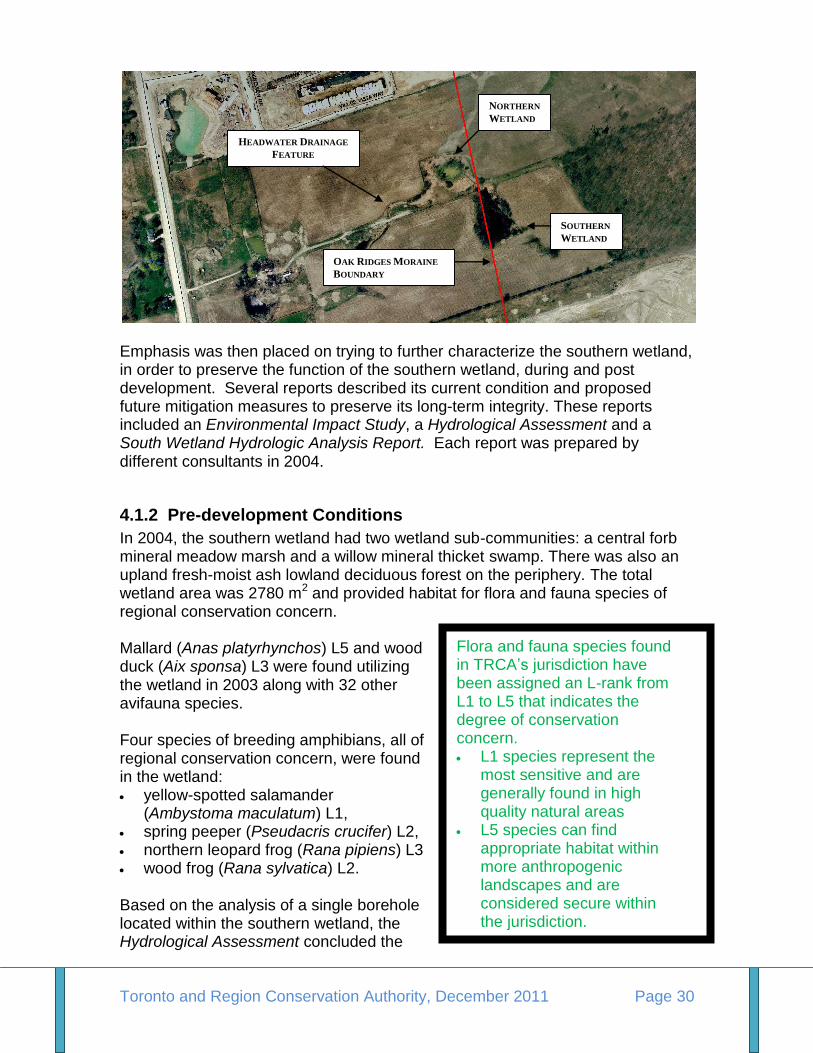
In 2004, a development application was initiated for a property that contained the locally significant Keele Wetlands. The property contained two wetland units, referred to as the northern and southern wetlands. The northern and southern wetlands were hydrologically disconnected except at high water levels by a farm laneway and associated berm, which bisected the two units. At high water levels, the southern wetland would flow into the northern wetland which had an outlet into a headwater drainage feature. The final development plan involved the elimination of the northern wetland and its associated headwater drainage feature, which flowed seasonally. The southern wetland would be retained. A 50 m wide corridor was retained between the southern wetland and the provincially significant Maple Uplands and Kettles Area of Natural and Scientific Interest located on the property and to the east. The border of the Oak Ridges Moraine passes approximately between the wetlands. As a result, the southern wetland was considered within the protected area and protection under the Oak Ridges Conservation Plan. The northern wetland was not considered part of the plan area thus not afforded as significant protection. In addition to policy differences, the northern wetland had recently been severely affected by sedimentation due to a lack of adequate sediment and erosion control as the property to the north underwent construction. This resulted in the deposition of up to 25 cm of sediment in the wetland, suffocating much of the wetland vegetation and reducing the habitat quality for amphibians. The development to the north caused 70% of the northern wetland‘s catchment to be redirected to a stormwater management system. Sediment deposition had resulted in fundamental changes to the soils and vegetation units, and the hydrological conditions had changed due to the surrounding development; the argument was put forth that since the northern wetland was no longer functioning as a wetland, it should not be afforded the same protection as a wetland normally would. As a result, the northern wetland would not be retained.
Toronto and Region Conservation Authority, December 2011 Page 30
Emphasis was then placed on trying to further characterize the southern wetland, in order to preserve the function of the southern wetland, during and post development. Several reports described its current condition and proposed future mitigation measures to preserve its long-term integrity. These reports included an Environmental Impact Study, a Hydrological Assessment and a South Wetland Hydrologic Analysis Report. Each report was prepared by different consultants in 2004.
4.1.2 Pre-development Conditions
In 2004, the southern wetland had two wetland sub-communities: a central forb mineral meadow marsh and a willow mineral thicket swamp. There was also an upland fresh-moist ash lowland deciduous forest on the periphery. The total wetland area was 2780 m2 and provided habitat for flora and fauna species of regional conservation concern. Mallard (Anas platyrhynchos) L5 and wood duck (Aix sponsa) L3 were found utilizing the wetland in 2003 along with 32 other avifauna species. Four species of breeding amphibians, all of regional conservation concern, were found in the wetland: yellow-spotted salamander
(Ambystoma maculatum) L1, spring peeper (Pseudacris crucifer) L2, northern leopard frog (Rana pipiens) L3 wood frog (Rana sylvatica) L2. Based on the analysis of a single borehole located within the southern wetland, the Hydrological Assessment concluded the
HEADWATER DRAINAGE
FEATURE
NORTHERN
WETLAND
SOUTHERN
WETLAND
OAK RIDGES MORAINE
BOUNDARY
Flora and fauna species found in TRCA‘s jurisdiction have been assigned an L-rank from L1 to L5 that indicates the degree of conservation concern. L1 species represent the
most sensitive and are generally found in high quality natural areas
L5 species can find appropriate habitat within more anthropogenic landscapes and are considered secure within the jurisdiction.
Toronto and Region Conservation Authority, December 2011 Page 31
wetland was fed solely by surface water inputs, with no groundwater inputs, and was deemed an area of groundwater recharge. There were no piezometers installed in order to measure the upward or downward gradient of groundwater movement. Based on the assumption that the wetland had no groundwater input, the following water budget equation was derived from the data:
P (865 mm) = ET (560 mm) + I (305 mm) + R (0 mm) Total Infiltration: 17 929 m3/a plus the runoff component from off-site (1884 m3/a) for a total of 18 813 m3/a
The QUALHYMO hydrologic/hydraulic model was used to analyze the hydrologic regime. Discrete storm events were analyzed and a continuous six-year simulation was completed. Water levels in the wetland were monitored continuously between mid-April to mid-August in 2004. These four months of data were used to calibrate the model along with a calculated drawdown rate of approximately 14 mm/day following storm events.
4.1.3 Mitigation Measures
The post-development mitigation scenario consisted of directing runoff from rear-yards to the wetland as well as directing clean roof runoff to the wetland via a third pipe system. These mitigation measures were designed to compensate for the loss of surface water runoff from the former catchment which was redirected to the stormwater management system. With mitigation, the model predictions from the Hydrologic Analysis Report concluded that:
wetland water levels following storm events would be between 0.03 and 0.08 metres above or below current levels;
runoff from less frequent storm events could not be matched post-development due to a reduction in drainage area; and
the annual pre-development hydrologic regime of the wetland would be maintained under developed conditions.
4.1.4 Monitoring Results
Three years of post-development monitoring were completed on the wetland in 2006, 2007 and 2008. This monitoring coincided with the construction phase of the subdivision, which began in 2005. House construction is visible in the photomonitoring directly surrounding the wetland in the fall of 2006. Restoration of the wetland buffer occurred during the growing season in 2007. The monitoring report does not indicate when construction was completed, but it states that construction activities that might have an impact on the wetland were expected to be completed in 2008.
Toronto and Region Conservation Authority, December 2011 Page 32
Monitoring reports were submitted in 2007, 2008 and 2009 and were supplemented with some baseline data from 2003 and 2004. Unfortunately, the baseline data did not include all the parameters measured in subsequent years. The post-development monitoring program measured water levels, water temperature, water quality, and the presence/absence of flora and fauna. There are several concerns with both data collection and data presentation that severely hindered data interpretation, this includes the following issues:
a consistent survey effort was not employed in the flora and fauna surveys. Some years involved more surveys hours than others, rendering the data incomparable;
water level and temperature data were presented on difference scales for
different years. This made it difficult to determine if the differences stemmed from the use of different scales or data differences; and
the addition of several water quality parameters in 2007 that had not been
included in 2006 and, again, this data was presented differently in 2008 than in 2007 and 2006.
4.1.5 Water Levels
For post-development monitoring, water levels were measured continuously using a pressure transducer and a data logger and these results were compared to rainfall data from Buttonville Airport. Unfortunately, the post-development water levels were not compared to the pre-development water levels (2004 data), and in fact, the latter were not provided in the reports. It is stated in the 2006 report that 2006 data will be used as baseline data to compare to subsequent years, although this was after construction had commenced. In 2006, the water levels were highest in the spring and decreased throughout the summer, although the wetland did not dry up at any point. Minor increases in water level were observed following significant rainfall events. Water levels appeared to be fairly uniform with the exception of some seasonal variation and some construction related impacts. The significant fluctuations in water levels for this year, in August and September (2006), correspond to construction dewatering impacts as the watermains were constructed on site and the excess groundwater was pumped directly into the wetland. As noted in the monitoring report, these water level fluctuations appeared to be consistent with a wetland having some groundwater inputs rather than one fed solely through surface water inputs as had been concluded in the earlier studies. The second year of data collection (2007) was plagued with disruptions. The data logger was stolen at the beginning of April and another logger was not replaced until May 18. As 2007 was characterized by drought conditions and not
Toronto and Region Conservation Authority, December 2011 Page 33
representative of an average year. Drought caused the wetland to dry up by August and data collection ceased between the end of July 2007 and May 1, 2008. The 2007 data shows that even in the spring 2007, immediately following snowmelt, water levels in the wetland were much lower than in the spring of 2006. Between April and July 2006, water levels were consistently around 90 to 100 cm while at the beginning of April 2007, just before the theft of the logger, water levels were only around 50 cm. Furthermore, it appears that subsequent to the build-out of the houses around the wetland area, larger water level fluctuations and less consistent water levels occurred in the wetland. Final conclusions regarding the differences in water level fluctuations are further complicated by the different water level scales used to present the data in 2006 and 2007. The summer of 2008 was a cool, wet summer. In 2008, the wetland did not dry out, but the water levels remained far below 2006 water levels. It also appears that water level fluctuations resulting from storm events also increased, however, the scale problems confounded data interpretation as in 2007. The monitoring report concluded that: ―Based on the three years of monitoring, it appears as though the development has not significantly altered the wetland‘s hydrology.‖ This statement does not seem to accurately reflect the data presented in the reports as water levels in the wetland dropped significantly and fluctuations following storm events may have increased.
4.1.6 Water Temperature
Water temperature was continuously measured throughout the monitoring period, except during periods when the wetland was dry or when the data logger was missing. In 2006, the water temperature data were characteristic of a groundwater-fed wetland. Temperatures remained below 21 degrees Celsius even when the daytime air temperature was consistently over 30 degrees and stayed above 1 degree Celsius in the winter months when the air temperature was well below freezing. The monitoring report states that water temperature responded similarly in 2007 as it did in 2006, however, the graphed data appears to show that temperature fluctuations may have been greater in 2007 than in 2006. Furthermore, temperatures appear to have been lower in the winter months and potentially higher in the summer months. The data are inconclusive because of the large gap in April and May and the onset of summer drying during the drought.
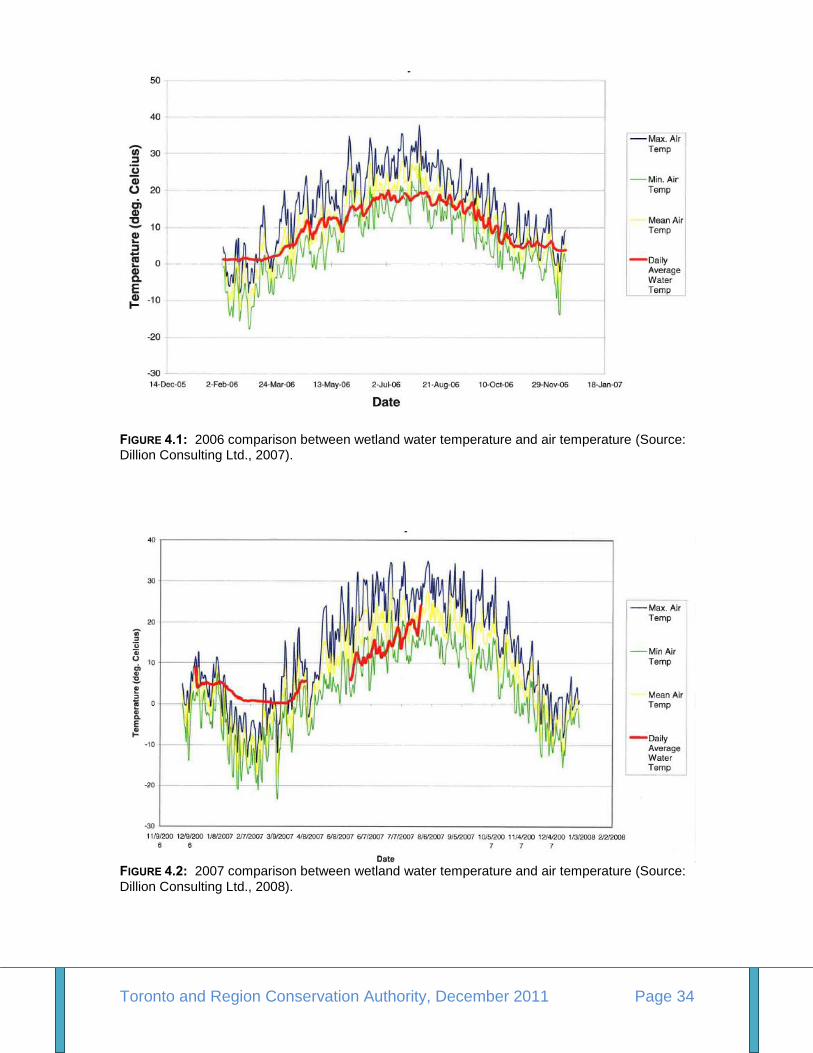
Toronto and Region Conservation Authority, December 2011 Page 34
FIGURE 4.1: 2006 comparison between wetland water temperature and air temperature (Source: Dillion Consulting Ltd., 2007).
FIGURE 4.2: 2007 comparison between wetland water temperature and air temperature (Source:
Dillion Consulting Ltd., 2008).
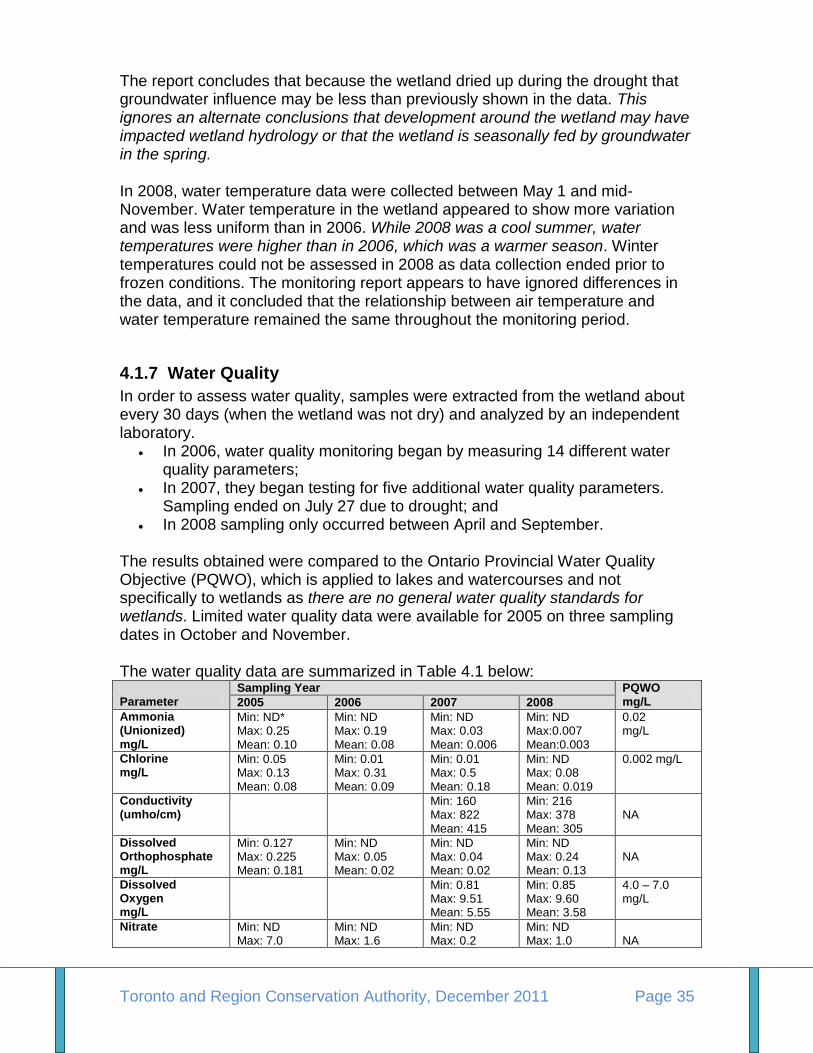
Toronto and Region Conservation Authority, December 2011 Page 35
The report concludes that because the wetland dried up during the drought that groundwater influence may be less than previously shown in the data. This ignores an alternate conclusions that development around the wetland may have impacted wetland hydrology or that the wetland is seasonally fed by groundwater in the spring. In 2008, water temperature data were collected between May 1 and mid-November. Water temperature in the wetland appeared to show more variation and was less uniform than in 2006. While 2008 was a cool summer, water temperatures were higher than in 2006, which was a warmer season. Winter temperatures could not be assessed in 2008 as data collection ended prior to frozen conditions. The monitoring report appears to have ignored differences in the data, and it concluded that the relationship between air temperature and water temperature remained the same throughout the monitoring period.
4.1.7 Water Quality
In order to assess water quality, samples were extracted from the wetland about every 30 days (when the wetland was not dry) and analyzed by an independent laboratory.
In 2006, water quality monitoring began by measuring 14 different water quality parameters;
In 2007, they began testing for five additional water quality parameters. Sampling ended on July 27 due to drought; and
In 2008 sampling only occurred between April and September.
The results obtained were compared to the Ontario Provincial Water Quality Objective (PQWO), which is applied to lakes and watercourses and not specifically to wetlands as there are no general water quality standards for wetlands. Limited water quality data were available for 2005 on three sampling dates in October and November. The water quality data are summarized in Table 4.1 below: Parameter
Sampling Year PQWO mg/L 2005 2006 2007 2008
Ammonia (Unionized) mg/L
Min: ND* Max: 0.25 Mean: 0.10
Min: ND Max: 0.19 Mean: 0.08
Min: ND Max: 0.03 Mean: 0.006
Min: ND Max:0.007 Mean:0.003
0.02 mg/L
Chlorine mg/L
Min: 0.05 Max: 0.13 Mean: 0.08
Min: 0.01 Max: 0.31 Mean: 0.09
Min: 0.01 Max: 0.5 Mean: 0.18
Min: ND Max: 0.08 Mean: 0.019
0.002 mg/L
Conductivity (umho/cm)
Min: 160 Max: 822 Mean: 415
Min: 216 Max: 378 Mean: 305
NA
Dissolved Orthophosphate mg/L
Min: 0.127 Max: 0.225 Mean: 0.181
Min: ND Max: 0.05 Mean: 0.02
Min: ND Max: 0.04 Mean: 0.02
Min: ND Max: 0.24 Mean: 0.13
NA
Dissolved Oxygen mg/L
Min: 0.81 Max: 9.51 Mean: 5.55
Min: 0.85 Max: 9.60 Mean: 3.58
4.0 – 7.0 mg/L
Nitrate Min: ND Max: 7.0
Min: ND Max: 1.6
Min: ND Max: 0.2
Min: ND Max: 1.0
NA
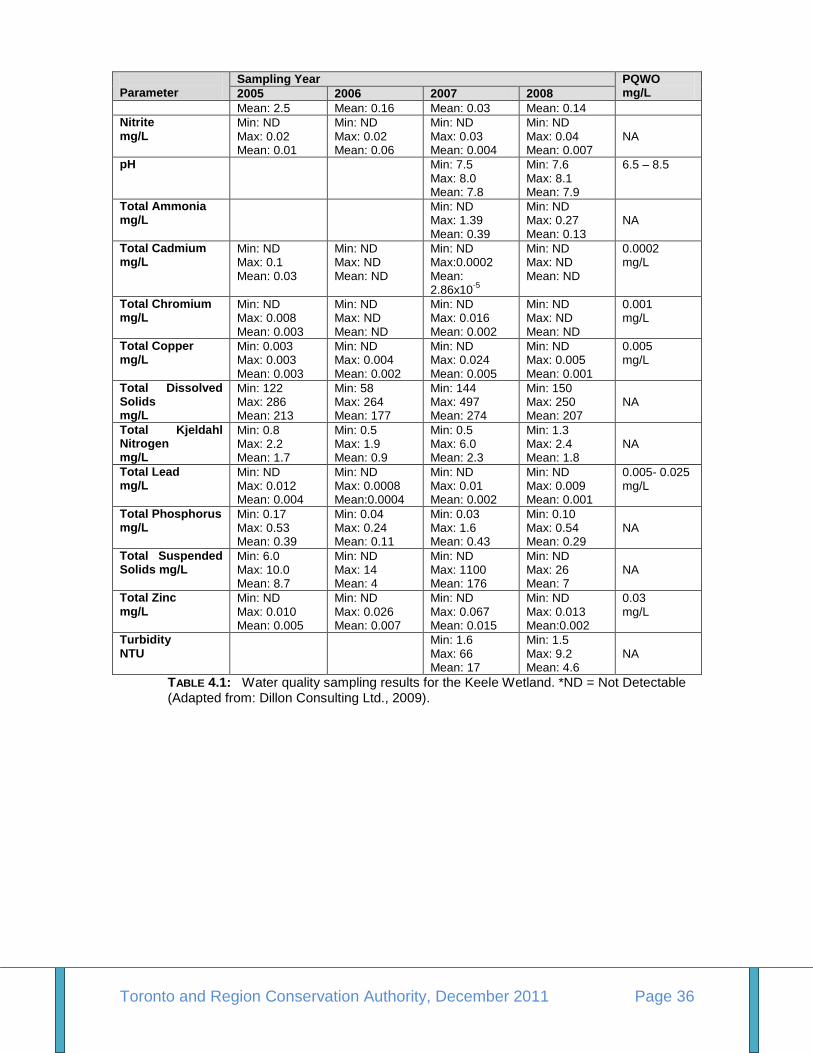
Toronto and Region Conservation Authority, December 2011 Page 36
Parameter
Sampling Year PQWO mg/L 2005 2006 2007 2008
Mean: 2.5 Mean: 0.16 Mean: 0.03 Mean: 0.14
Nitrite mg/L
Min: ND Max: 0.02 Mean: 0.01
Min: ND Max: 0.02 Mean: 0.06
Min: ND Max: 0.03 Mean: 0.004
Min: ND Max: 0.04 Mean: 0.007
NA
pH Min: 7.5 Max: 8.0 Mean: 7.8
Min: 7.6 Max: 8.1 Mean: 7.9
6.5 – 8.5
Total Ammonia mg/L
Min: ND Max: 1.39 Mean: 0.39
Min: ND Max: 0.27 Mean: 0.13
NA
Total Cadmium mg/L
Min: ND Max: 0.1 Mean: 0.03
Min: ND Max: ND Mean: ND
Min: ND Max:0.0002 Mean: 2.86x10
-5
Min: ND Max: ND Mean: ND
0.0002 mg/L
Total Chromium mg/L
Min: ND Max: 0.008 Mean: 0.003
Min: ND Max: ND Mean: ND
Min: ND Max: 0.016 Mean: 0.002
Min: ND Max: ND Mean: ND
0.001 mg/L
Total Copper mg/L
Min: 0.003 Max: 0.003 Mean: 0.003
Min: ND Max: 0.004 Mean: 0.002
Min: ND Max: 0.024 Mean: 0.005
Min: ND Max: 0.005 Mean: 0.001
0.005 mg/L
Total Dissolved Solids mg/L
Min: 122 Max: 286 Mean: 213
Min: 58 Max: 264 Mean: 177
Min: 144 Max: 497 Mean: 274
Min: 150 Max: 250 Mean: 207
NA
Total Kjeldahl Nitrogen mg/L
Min: 0.8 Max: 2.2 Mean: 1.7
Min: 0.5 Max: 1.9 Mean: 0.9
Min: 0.5 Max: 6.0 Mean: 2.3
Min: 1.3 Max: 2.4 Mean: 1.8
NA
Total Lead mg/L
Min: ND Max: 0.012 Mean: 0.004
Min: ND Max: 0.0008 Mean:0.0004
Min: ND Max: 0.01 Mean: 0.002
Min: ND Max: 0.009 Mean: 0.001
0.005- 0.025 mg/L
Total Phosphorus mg/L
Min: 0.17 Max: 0.53 Mean: 0.39
Min: 0.04 Max: 0.24 Mean: 0.11
Min: 0.03 Max: 1.6 Mean: 0.43
Min: 0.10 Max: 0.54 Mean: 0.29
NA
Total Suspended Solids mg/L
Min: 6.0 Max: 10.0 Mean: 8.7
Min: ND Max: 14 Mean: 4
Min: ND Max: 1100 Mean: 176
Min: ND Max: 26 Mean: 7
NA
Total Zinc mg/L
Min: ND Max: 0.010 Mean: 0.005
Min: ND Max: 0.026 Mean: 0.007
Min: ND Max: 0.067 Mean: 0.015
Min: ND Max: 0.013 Mean:0.002
0.03 mg/L
Turbidity NTU
Min: 1.6 Max: 66 Mean: 17
Min: 1.5 Max: 9.2 Mean: 4.6
NA
TABLE 4.1: Water quality sampling results for the Keele Wetland. *ND = Not Detectable (Adapted from: Dillon Consulting Ltd., 2009).
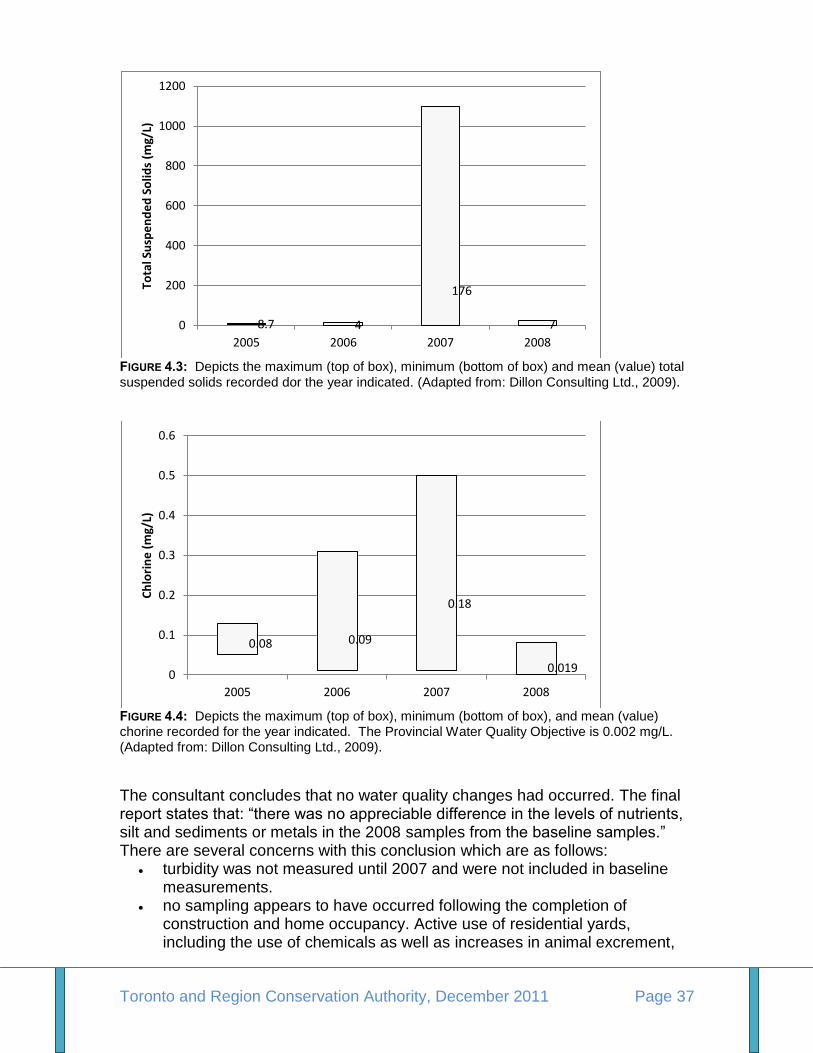
Toronto and Region Conservation Authority, December 2011 Page 37
FIGURE 4.3: Depicts the maximum (top of box), minimum (bottom of box) and mean (value) total
suspended solids recorded dor the year indicated. (Adapted from: Dillon Consulting Ltd., 2009).
FIGURE 4.4: Depicts the maximum (top of box), minimum (bottom of box), and mean (value) chorine recorded for the year indicated. The Provincial Water Quality Objective is 0.002 mg/L. (Adapted from: Dillon Consulting Ltd., 2009).
The consultant concludes that no water quality changes had occurred. The final report states that: ―there was no appreciable difference in the levels of nutrients, silt and sediments or metals in the 2008 samples from the baseline samples.‖ There are several concerns with this conclusion which are as follows:
turbidity was not measured until 2007 and were not included in baseline measurements.
no sampling appears to have occurred following the completion of construction and home occupancy. Active use of residential yards, including the use of chemicals as well as increases in animal excrement,
8.7 4
176
7 0
200
400
600
800
1000
1200
2005 2006 2007 2008
Tota
l Su
spe
nd
ed
So
lids
(mg/
L)
0.08 0.09
0.18
0.019 0
0.1
0.2
0.3
0.4
0.5
0.6
2005 2006 2007 2008
Ch
lori
ne
(m
g/L)
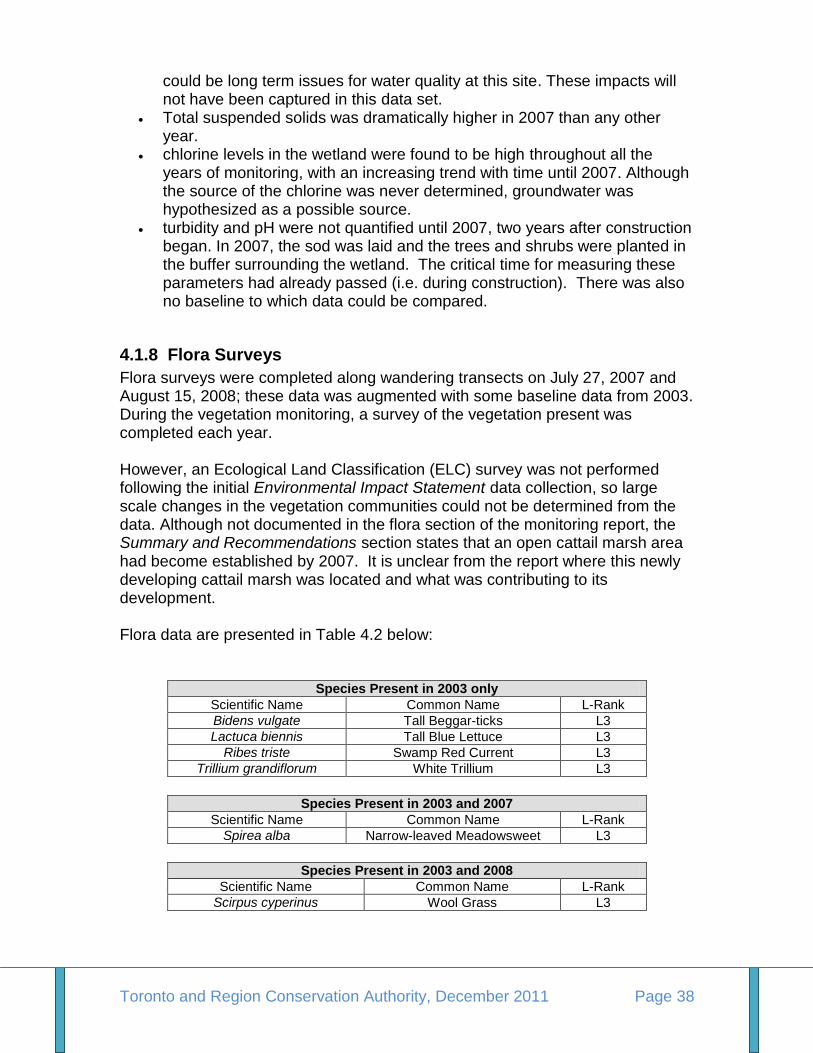
Toronto and Region Conservation Authority, December 2011 Page 38
could be long term issues for water quality at this site. These impacts will not have been captured in this data set.
Total suspended solids was dramatically higher in 2007 than any other year.
chlorine levels in the wetland were found to be high throughout all the years of monitoring, with an increasing trend with time until 2007. Although the source of the chlorine was never determined, groundwater was hypothesized as a possible source.
turbidity and pH were not quantified until 2007, two years after construction began. In 2007, the sod was laid and the trees and shrubs were planted in the buffer surrounding the wetland. The critical time for measuring these parameters had already passed (i.e. during construction). There was also no baseline to which data could be compared.
4.1.8 Flora Surveys
Flora surveys were completed along wandering transects on July 27, 2007 and August 15, 2008; these data was augmented with some baseline data from 2003. During the vegetation monitoring, a survey of the vegetation present was completed each year. However, an Ecological Land Classification (ELC) survey was not performed following the initial Environmental Impact Statement data collection, so large scale changes in the vegetation communities could not be determined from the data. Although not documented in the flora section of the monitoring report, the Summary and Recommendations section states that an open cattail marsh area had become established by 2007. It is unclear from the report where this newly developing cattail marsh was located and what was contributing to its development. Flora data are presented in Table 4.2 below:
Species Present in 2003 only
Scientific Name Common Name L-Rank
Bidens vulgate Tall Beggar-ticks L3
Lactuca biennis Tall Blue Lettuce L3
Ribes triste Swamp Red Current L3
Trillium grandiflorum White Trillium L3
Species Present in 2003 and 2007
Scientific Name Common Name L-Rank
Spirea alba Narrow-leaved Meadowsweet L3
Species Present in 2003 and 2008
Scientific Name Common Name L-Rank
Scirpus cyperinus Wool Grass L3
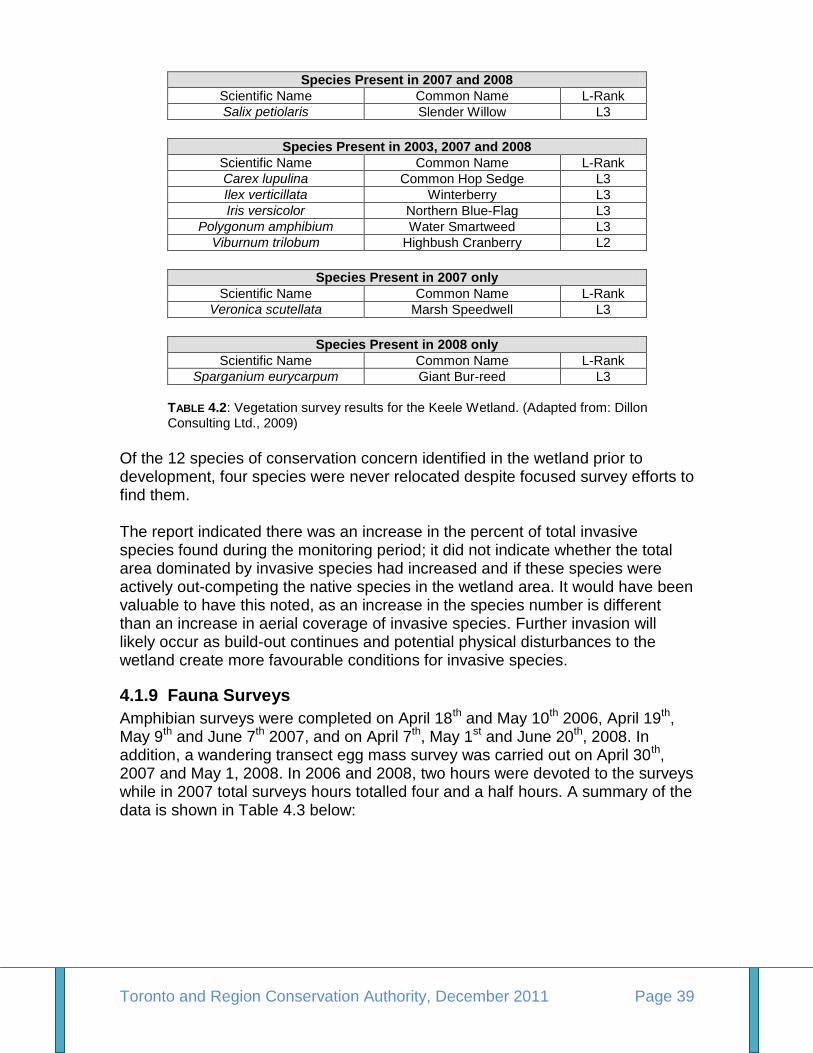
Toronto and Region Conservation Authority, December 2011 Page 39
Species Present in 2007 and 2008
Scientific Name Common Name L-Rank
Salix petiolaris Slender Willow L3
Species Present in 2003, 2007 and 2008
Scientific Name Common Name L-Rank
Carex lupulina Common Hop Sedge L3
Ilex verticillata Winterberry L3
Iris versicolor Northern Blue-Flag L3
Polygonum amphibium Water Smartweed L3
Viburnum trilobum Highbush Cranberry L2
Species Present in 2007 only
Scientific Name Common Name L-Rank
Veronica scutellata Marsh Speedwell L3
Species Present in 2008 only
Scientific Name Common Name L-Rank
Sparganium eurycarpum Giant Bur-reed L3
TABLE 4.2: Vegetation survey results for the Keele Wetland. (Adapted from: Dillon Consulting Ltd., 2009)
Of the 12 species of conservation concern identified in the wetland prior to development, four species were never relocated despite focused survey efforts to find them. The report indicated there was an increase in the percent of total invasive species found during the monitoring period; it did not indicate whether the total area dominated by invasive species had increased and if these species were actively out-competing the native species in the wetland area. It would have been valuable to have this noted, as an increase in the species number is different than an increase in aerial coverage of invasive species. Further invasion will likely occur as build-out continues and potential physical disturbances to the wetland create more favourable conditions for invasive species.
4.1.9 Fauna Surveys
Amphibian surveys were completed on April 18th and May 10th 2006, April 19th, May 9th and June 7th 2007, and on April 7th, May 1st and June 20th, 2008. In addition, a wandering transect egg mass survey was carried out on April 30th, 2007 and May 1, 2008. In 2006 and 2008, two hours were devoted to the surveys while in 2007 total surveys hours totalled four and a half hours. A summary of the data is shown in Table 4.3 below:
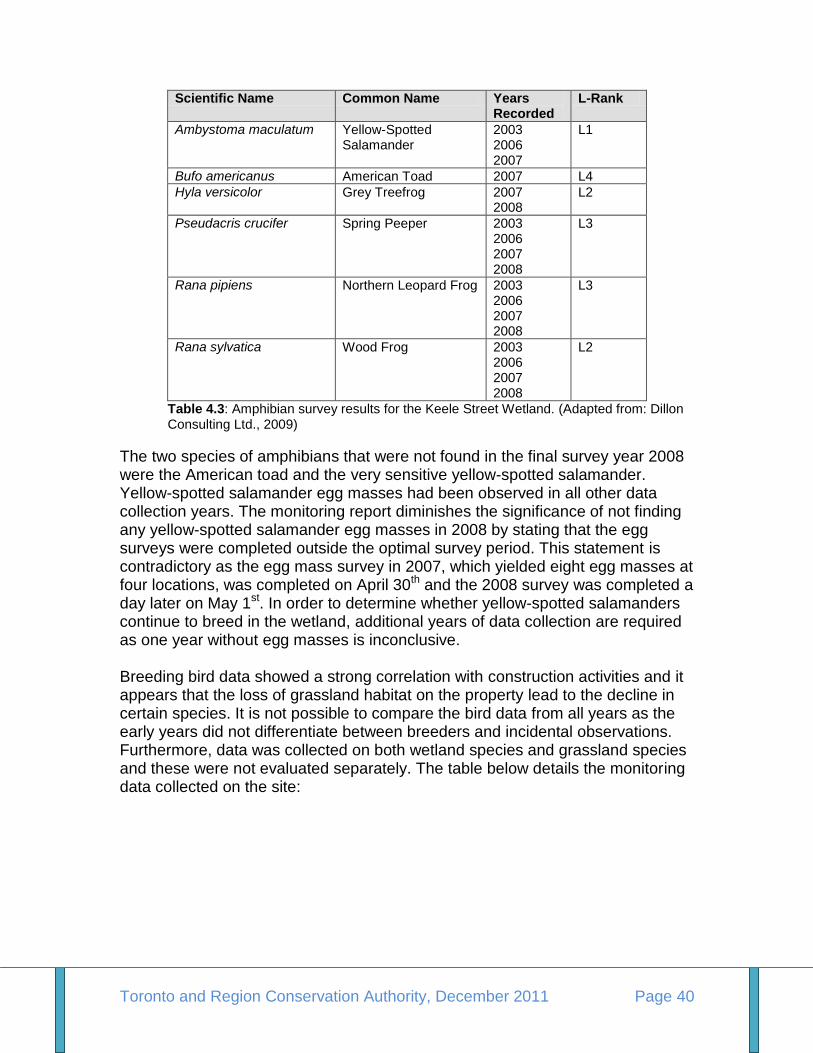
Toronto and Region Conservation Authority, December 2011 Page 40
Scientific Name Common Name Years
Recorded L-Rank
Ambystoma maculatum Yellow-Spotted Salamander
2003 2006 2007
L1
Bufo americanus American Toad 2007 L4
Hyla versicolor Grey Treefrog 2007 2008
L2
Pseudacris crucifer Spring Peeper 2003 2006 2007 2008
L3
Rana pipiens Northern Leopard Frog 2003 2006 2007 2008
L3
Rana sylvatica Wood Frog 2003 2006 2007 2008
L2
Table 4.3: Amphibian survey results for the Keele Street Wetland. (Adapted from: Dillon Consulting Ltd., 2009)
The two species of amphibians that were not found in the final survey year 2008 were the American toad and the very sensitive yellow-spotted salamander. Yellow-spotted salamander egg masses had been observed in all other data collection years. The monitoring report diminishes the significance of not finding any yellow-spotted salamander egg masses in 2008 by stating that the egg surveys were completed outside the optimal survey period. This statement is contradictory as the egg mass survey in 2007, which yielded eight egg masses at four locations, was completed on April 30th and the 2008 survey was completed a day later on May 1st. In order to determine whether yellow-spotted salamanders continue to breed in the wetland, additional years of data collection are required as one year without egg masses is inconclusive. Breeding bird data showed a strong correlation with construction activities and it appears that the loss of grassland habitat on the property lead to the decline in certain species. It is not possible to compare the bird data from all years as the early years did not differentiate between breeders and incidental observations. Furthermore, data was collected on both wetland species and grassland species and these were not evaluated separately. The table below details the monitoring data collected on the site:
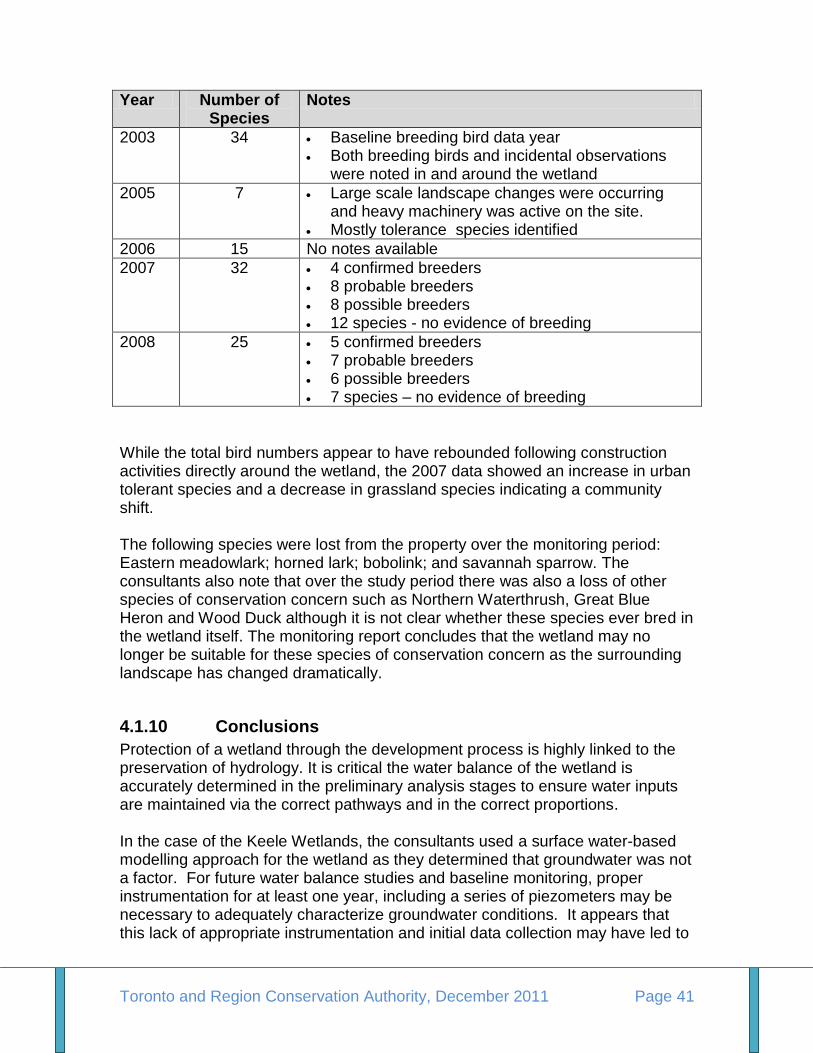
Toronto and Region Conservation Authority, December 2011 Page 41
Year Number of Species
Notes
2003 34 Baseline breeding bird data year Both breeding birds and incidental observations
were noted in and around the wetland
2005 7 Large scale landscape changes were occurring and heavy machinery was active on the site.
Mostly tolerance species identified
2006 15 No notes available
2007 32 4 confirmed breeders 8 probable breeders 8 possible breeders 12 species - no evidence of breeding
2008 25 5 confirmed breeders 7 probable breeders 6 possible breeders 7 species – no evidence of breeding
While the total bird numbers appear to have rebounded following construction activities directly around the wetland, the 2007 data showed an increase in urban tolerant species and a decrease in grassland species indicating a community shift. The following species were lost from the property over the monitoring period: Eastern meadowlark; horned lark; bobolink; and savannah sparrow. The consultants also note that over the study period there was also a loss of other species of conservation concern such as Northern Waterthrush, Great Blue Heron and Wood Duck although it is not clear whether these species ever bred in the wetland itself. The monitoring report concludes that the wetland may no longer be suitable for these species of conservation concern as the surrounding landscape has changed dramatically.
4.1.10 Conclusions
Protection of a wetland through the development process is highly linked to the preservation of hydrology. It is critical the water balance of the wetland is accurately determined in the preliminary analysis stages to ensure water inputs are maintained via the correct pathways and in the correct proportions. In the case of the Keele Wetlands, the consultants used a surface water-based modelling approach for the wetland as they determined that groundwater was not a factor. For future water balance studies and baseline monitoring, proper instrumentation for at least one year, including a series of piezometers may be necessary to adequately characterize groundwater conditions. It appears that this lack of appropriate instrumentation and initial data collection may have led to
Toronto and Region Conservation Authority, December 2011 Page 42
hydrological changes in the wetland following build-out which can be seen in both the water quantity and water temperature data. Furthermore, the surface water model itself was only calibrated using four months of data, which may be insufficient to adequately understand the hydrologic conditions in the wetland. Data collected for purposes of site characterization at earlier planning stages is not appropriate for pre or post-development comparisons. An adequate study design needs to be developed as part of the terms of reference (TOR) for the monitoring. An adequate baseline period instituted prior to any grading or construction activity within the catchment of the feature needs to be established. These data need to be compared to the post-development data in order to assess if hydrological, or related ecological, changes have resulted from the development. Comparing the initial years of construction to later years of construction does not serve an obvious purpose. Field survey efforts and timing were not consistent. These factors may have contributed to differences in the data methodology rather than differences resulting from changing conditions. This inconsistent approach makes it difficult to compare and draw accurate conclusions. The data presentation on graphs with different scales made data interpretation challenging, and such issues are avoidable and easily remedied. The timing of the monitoring work was not fully representative of post-development conditionsas the monitoring was completed prior to the houses being occupied and the implementation of the roof water collection mitigation measure that was designed to outlet to the wetland. According to the reports, construction in the vicinity of the wetland area was expected to be complete in 2008. The monitoring, therefore, did not measure the effectiveness of the mitigation measures proposed in the pre-development analyses which may have contributed to changes in water quantity observed over the monitoring period. Further impacts that would have not have been reflected in the monitoring results, may stem from such activities as:
an increase in domestic pets using the area, an increase in light and noise pollution, an increase in trampling and/or plant collection; and the introduction of invasive species from gardens.
Future studies should stagger monitoring years to adequately cover the periods during and after construction/occupancy, as well as the efficacy of operational mitigation measures.
Toronto and Region Conservation Authority, December 2011 Page 43
4.2 Wilcox-St. George Wetland Complex (A.K.A. Snively Wetland)
4.2.1 Context and Pre-development Conditions
In 2002, data collection in support of a proposed residential subdivision began on a wetland which forms part of the provincially significant Wilcox-St. George Wetland Complex. Data collection and future monitoring work was mandated by draft plan conditions, as the wetland was the only location for the new development‘s stormwater management system to outlet. The wetland, located on the Oak Ridges Moraine, was internally draining with no watercourse outlet, and there were no nearby watercourses. One small and partially blocked culvert existed through a private landowner‘s downstream property, but the function of this culvert was never fully examined and its reliability and function were questioned by the consultants. The pre-developed site was characterized by typical moraine topography with rolling hills and depressions, and likely had limited surface water runoff to the wetland. Pre- and post-development monitoring was required in order to preserve the water balance and ecological function of the wetland following build-out.
4.2.2 Modelling
The Stormwater Management and Pond Design Report presented the stormwater management scenario proposed for the development. This report identified that runoff to the wetland would be increased significantly. The pre-development annual estimate of runoff reaching the wetland from the site to be developed was determined to be 59,000 m3/a, which would be doubled post-development to 116,000 m3/a. A detailed hydrologic analysis, completed at the functional servicing plan (FSP) stage in the mid 1990‘s, using the Hydrologic Simulation Program Fortran (HSPF) model, determined that the maximum monthly increase in water levels in the wetland would be 0.13 m. The average annual increase in runoff was estimated to be 3,100 m3, and the average annual increase in water level would be 0.06 m. The conclusion in the FSP, which did not include an ecological component, was that the wetland had enough freeboard to accommodate these increases in water level and would be able to prevent any future flooding of adjacent properties. This analysis, however, was completed using an underestimated imperviousness, which was assumed to be only 35%. The estimates were increased at the design stage and actual imperviousness was planned to be 47%, as is typical of an urban residential subdivision. Because of this change, the monthly increases were amended to 0.17 metres and the average annual increase to 0.08 m. The modelling results that determined the wetland water levels would not rise dramatically, despite a doubling of runoff inputs, were based on the infiltration capacity of the soils and the behaviour of the underlying shallow aquifer.
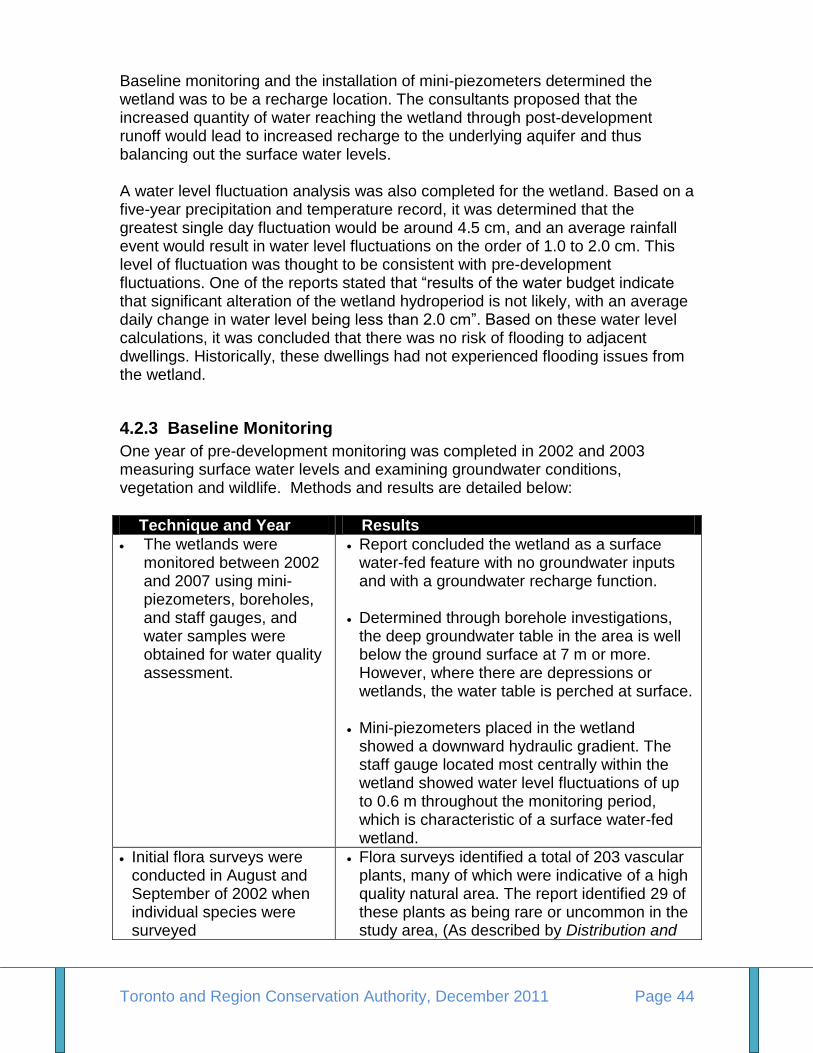
Toronto and Region Conservation Authority, December 2011 Page 44
Baseline monitoring and the installation of mini-piezometers determined the wetland was to be a recharge location. The consultants proposed that the increased quantity of water reaching the wetland through post-development runoff would lead to increased recharge to the underlying aquifer and thus balancing out the surface water levels. A water level fluctuation analysis was also completed for the wetland. Based on a five-year precipitation and temperature record, it was determined that the greatest single day fluctuation would be around 4.5 cm, and an average rainfall event would result in water level fluctuations on the order of 1.0 to 2.0 cm. This level of fluctuation was thought to be consistent with pre-development fluctuations. One of the reports stated that ―results of the water budget indicate that significant alteration of the wetland hydroperiod is not likely, with an average daily change in water level being less than 2.0 cm‖. Based on these water level calculations, it was concluded that there was no risk of flooding to adjacent dwellings. Historically, these dwellings had not experienced flooding issues from the wetland.
4.2.3 Baseline Monitoring
One year of pre-development monitoring was completed in 2002 and 2003 measuring surface water levels and examining groundwater conditions, vegetation and wildlife. Methods and results are detailed below:
Technique and Year Results
The wetlands were monitored between 2002 and 2007 using mini-piezometers, boreholes, and staff gauges, and water samples were obtained for water quality assessment.
Report concluded the wetland as a surface water-fed feature with no groundwater inputs and with a groundwater recharge function.
Determined through borehole investigations,
the deep groundwater table in the area is well below the ground surface at 7 m or more. However, where there are depressions or wetlands, the water table is perched at surface.
Mini-piezometers placed in the wetland
showed a downward hydraulic gradient. The staff gauge located most centrally within the wetland showed water level fluctuations of up to 0.6 m throughout the monitoring period, which is characteristic of a surface water-fed wetland.
Initial flora surveys were conducted in August and September of 2002 when individual species were surveyed
Flora surveys identified a total of 203 vascular plants, many of which were indicative of a high quality natural area. The report identified 29 of these plants as being rare or uncommon in the study area, (As described by Distribution and
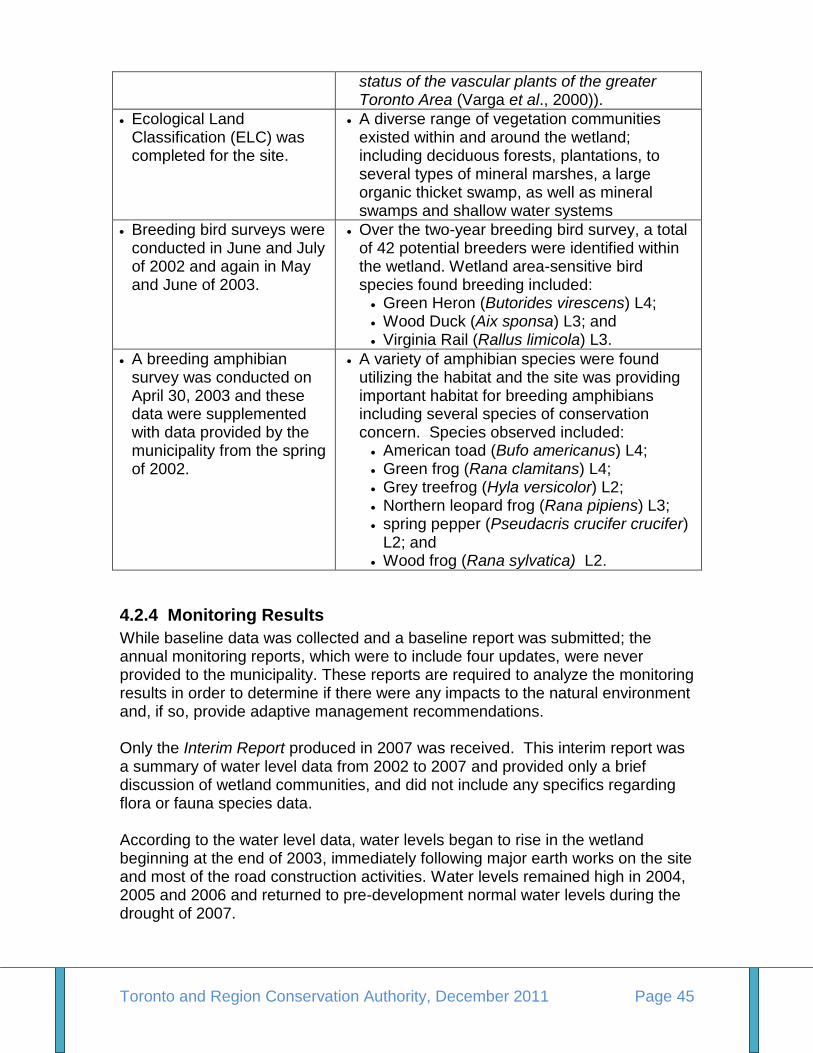
Toronto and Region Conservation Authority, December 2011 Page 45
status of the vascular plants of the greater Toronto Area (Varga et al., 2000)).
Ecological Land Classification (ELC) was completed for the site.
A diverse range of vegetation communities existed within and around the wetland; including deciduous forests, plantations, to several types of mineral marshes, a large organic thicket swamp, as well as mineral swamps and shallow water systems
Breeding bird surveys were conducted in June and July of 2002 and again in May and June of 2003.
Over the two-year breeding bird survey, a total of 42 potential breeders were identified within the wetland. Wetland area-sensitive bird species found breeding included:
Green Heron (Butorides virescens) L4; Wood Duck (Aix sponsa) L3; and Virginia Rail (Rallus limicola) L3.
A breeding amphibian survey was conducted on April 30, 2003 and these data were supplemented with data provided by the municipality from the spring of 2002.
A variety of amphibian species were found utilizing the habitat and the site was providing important habitat for breeding amphibians including several species of conservation concern. Species observed included:
American toad (Bufo americanus) L4; Green frog (Rana clamitans) L4; Grey treefrog (Hyla versicolor) L2; Northern leopard frog (Rana pipiens) L3; spring pepper (Pseudacris crucifer crucifer)
L2; and Wood frog (Rana sylvatica) L2.
4.2.4 Monitoring Results
While baseline data was collected and a baseline report was submitted; the annual monitoring reports, which were to include four updates, were never provided to the municipality. These reports are required to analyze the monitoring results in order to determine if there were any impacts to the natural environment and, if so, provide adaptive management recommendations. Only the Interim Report produced in 2007 was received. This interim report was a summary of water level data from 2002 to 2007 and provided only a brief discussion of wetland communities, and did not include any specifics regarding flora or fauna species data. According to the water level data, water levels began to rise in the wetland beginning at the end of 2003, immediately following major earth works on the site and most of the road construction activities. Water levels remained high in 2004, 2005 and 2006 and returned to pre-development normal water levels during the drought of 2007.
Toronto and Region Conservation Authority, December 2011 Page 46
In the Interim Report, the consultant suggested the wetland had returned to pre-development water levels in 2007, noting that the wetland had been affected during the construction phase but was returning to normal after construction was completed. However, 2007 was a drought year, and water levels had remained consistently about 0.5 metres above pre-development levels. As a result, the ―return to normal conditions‖ could be attributed to the fact that it was a dry summer, and not because the hydrology of the wetland was not impacted. The report proposes several reasons for the 0.5 metre increase in water level observed in the wetland in the three years following earth works:
increased runoff volumes from the development site; partial blockage of the wetland outlet; climatological factors; and synergistic actions of all the factors.
However, the partial blockage of the wetland outlet is not a new condition, as the culvert was also noted as being blocked in 1995. The climatological factors are not further discussed in the report and no details are provided to determine if there were any above-average rainfall years or cooler than average years which may have led to increased water levels in the wetland. No water level data were collected subsequent to 2007 which would have enabled the determination of the long term impact. In the brief discussion on wetland communities, the report indicates that the boundaries of vegetation communities have changed and there are larger areas of standing water and a decline in the shallow water marsh areas. The report proposes these types of changes are normal for surface water wetland communities. After a visit to the site, it was evident that these changes are more significant than indicated in the report. As observed during site visits, there are large scale die-backs of the same vegetation that the consultants assured would be tolerant of water level changes, including dogwood and willow thicket swamp vegetation. The town is also dealing with complaints from the older community to the south about flooding problems in their backyards resulting from increased water levels within the wetland. A remedial measure, such as creating an artificial outlet to the wetland, is being considered.
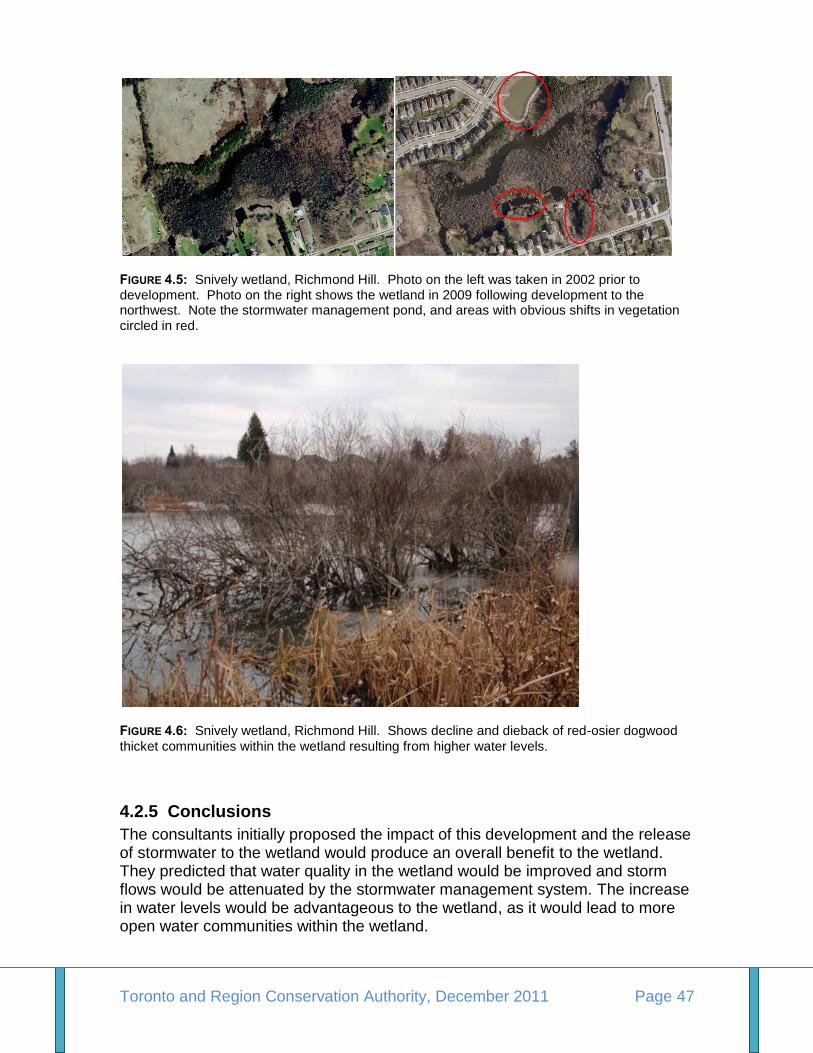
Toronto and Region Conservation Authority, December 2011 Page 47
FIGURE 4.5: Snively wetland, Richmond Hill. Photo on the left was taken in 2002 prior to development. Photo on the right shows the wetland in 2009 following development to the northwest. Note the stormwater management pond, and areas with obvious shifts in vegetation circled in red.
FIGURE 4.6: Snively wetland, Richmond Hill. Shows decline and dieback of red-osier dogwood
thicket communities within the wetland resulting from higher water levels.
4.2.5 Conclusions
The consultants initially proposed the impact of this development and the release of stormwater to the wetland would produce an overall benefit to the wetland. They predicted that water quality in the wetland would be improved and storm flows would be attenuated by the stormwater management system. The increase in water levels would be advantageous to the wetland, as it would lead to more open water communities within the wetland.
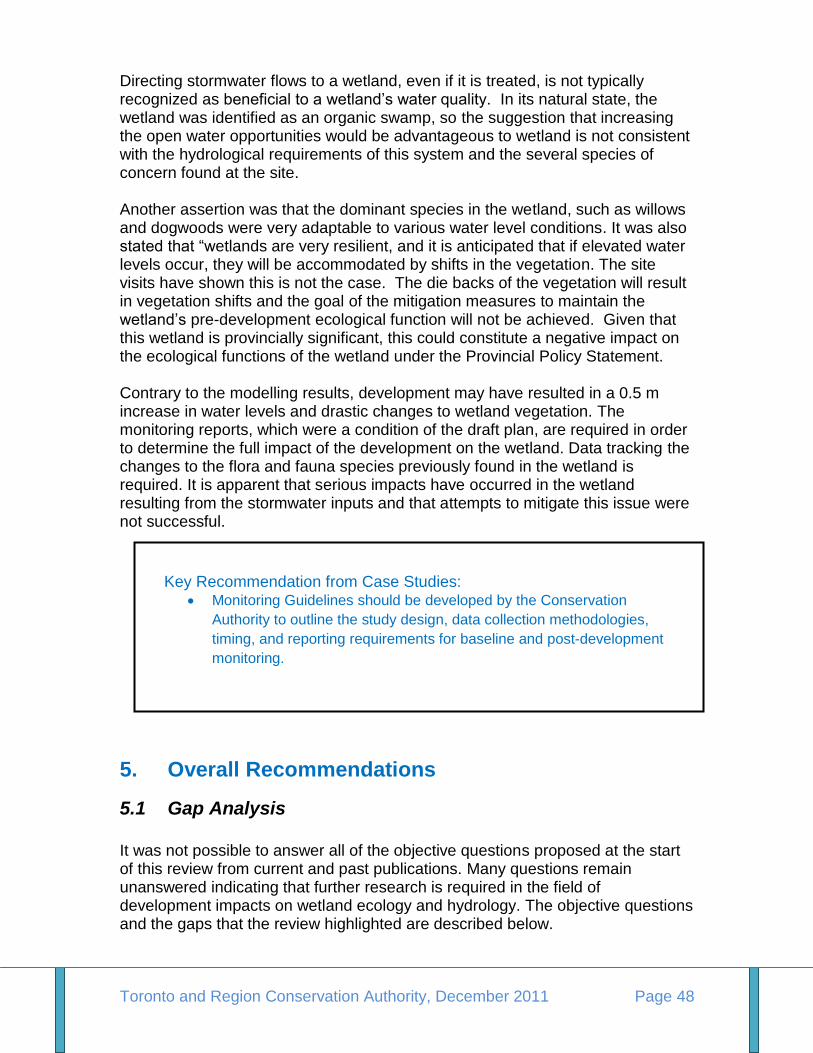
Toronto and Region Conservation Authority, December 2011 Page 48
Directing stormwater flows to a wetland, even if it is treated, is not typically recognized as beneficial to a wetland‘s water quality. In its natural state, the wetland was identified as an organic swamp, so the suggestion that increasing the open water opportunities would be advantageous to wetland is not consistent with the hydrological requirements of this system and the several species of concern found at the site. Another assertion was that the dominant species in the wetland, such as willows and dogwoods were very adaptable to various water level conditions. It was also stated that ―wetlands are very resilient, and it is anticipated that if elevated water levels occur, they will be accommodated by shifts in the vegetation. The site visits have shown this is not the case. The die backs of the vegetation will result in vegetation shifts and the goal of the mitigation measures to maintain the wetland‘s pre-development ecological function will not be achieved. Given that this wetland is provincially significant, this could constitute a negative impact on the ecological functions of the wetland under the Provincial Policy Statement. Contrary to the modelling results, development may have resulted in a 0.5 m increase in water levels and drastic changes to wetland vegetation. The monitoring reports, which were a condition of the draft plan, are required in order to determine the full impact of the development on the wetland. Data tracking the changes to the flora and fauna species previously found in the wetland is required. It is apparent that serious impacts have occurred in the wetland resulting from the stormwater inputs and that attempts to mitigate this issue were not successful.
5. Overall Recommendations
5.1 Gap Analysis
It was not possible to answer all of the objective questions proposed at the start of this review from current and past publications. Many questions remain unanswered indicating that further research is required in the field of development impacts on wetland ecology and hydrology. The objective questions and the gaps that the review highlighted are described below.
Key Recommendation from Case Studies: Monitoring Guidelines should be developed by the Conservation
Authority to outline the study design, data collection methodologies,
timing, and reporting requirements for baseline and post-development
monitoring.
Toronto and Region Conservation Authority, December 2011 Page 49
1 What are the impacts to wetlands from urban development within the catchment?
Research demonstrates a clear connection between urban development and negative impacts to wetlands. Unfortunately, few studies have been conducted in southern Ontario or in a comparable context. While the Puget Sound study provides many valuable insights into development impacts, the landscape of southern Ontario is sufficiently different such that the guidelines produced for that region could not be applied with confidence in our region. In order to support a guideline and develop acceptable thresholds for hydrological changes in southern Ontario, research conducted on typical wetlands in this area must be completed.
2 Are different types of wetlands impacted differently?
There is a consensus that some habitats, such as bogs and fens, are highly susceptible to change given their requirement for a narrow range of conditions. Swamps and marshes can also be sensitive to water level changes depending on the sensitivity of the particular flora and fauna they sustain. Some of the studies reviewed demonstrated that marsh and swamp communities could have reduced plant and amphibian diversity from water level fluctuations in excess of 0.2 m. These two wetland types are the most common in TRCA‘s jurisdiction and are likely the most vulnerable given that they are the types of wetlands most common in future growth planning areas (i.e. Whitebelt lands). At present, there are limited studies comparing different types of wetlands and their sensitivity to development. As research is conducted within the southern Ontario context, it should attempt to determine the sensitivity of various wetland types as comparisons of the sensitivity of various types of wetlands to development are absent from the literature. This information is necessary as resources to protect wetlands should be focused on those types that are most in need of protection rather than on those wetlands already able to tolerate changes in hydrology and water quality.
3 How do you characterize the existing hydrology/hydroperiod of wetlands?
Standard data collection protocols to assess wetland hydrology and to characterize the hydroperiod of wetlands are required. Based on the literature reviewed, there was not a standard data collection protocol. Investigation into the types of instrumentation necessary to properly study wetland hydroperiod would benefit both the academic as well as the applied ecology community. As noted in both case studies, baseline data collection can impact the final results of a water balance leading to potentially incorrect conclusions. Also, site characterization is not equal to
In order to support a guideline and develop acceptable thresholds for hydrological changes in southern Ontario, research conducted on typical wetlands in this area must be completed.
Toronto and Region Conservation Authority, December 2011 Page 50
baseline monitoring, so an adequate study design is necessary to answer the right questions.
4 What protocols should be used for data collection and models used for
analysis? Another major gap in the existing literature and tool-kit for wetland protection is appropriate and accurate models. Currently, models produced for other purposes have been adapted for use in determining wetland hydroperiod. As such, models that are able to adequately incorporate both surface and groundwater components to complete a water balance analysis have not been typically applied. Models are important in both determining the pre-development, as well as the expected post-development conditions in wetlands. The models used so the case studies we examined, did not always produce accurate results. The reasons for this were possibly because of the assumptions made, but the models may not have accurately characterized these complex ecological systems, particularly the groundwater component. Models that can accurately capture water balance of wetlands are necessary, as well the type and amount of baseline data required to adequately calibrate the model should also be determined through further study.
5 Can ecologically significant changes be mitigated? And which mitigation
measures are most effective at maintaining or enhancing existing wetland hydrology?
Urbanization, even with the incorporation of current best management practices, may still be affecting wetlands. More research into effective mitigation measures is required. The determination of mitigation measures that are effective at maintaining or enhancing existing wetland hydrology is critical, in particular those that are able to mitigate ecological change in wetlands post-development.
5.2 Overall Conclusions
As research and further studies are carried out to improve models, mitigation measures and the understanding of the impacts to wetland from urbanization in a southern Ontario context, it is important to proceed with current development using the precautionary principle. Impacts to wetlands caused by urbanization are clear in all studies illustrating that it is important to make every effort possible to protect wetlands with current techniques, BMPs and available legislation. It should be noted that current BMPs, such as stormwater management ponds, have not been able to maintain the pre-development hydrological regime or water quality in receiving wetlands and natural systems. New and innovative strategies, such as low impact development techniques, should be implemented in all developments that will impact the natural system. These measures represent the best available technology to resolve outstanding concerns.
Toronto and Region Conservation Authority, December 2011 Page 51
While thresholds for acceptable change post-development are required for a guideline, it is important to remember that thresholds are simply artificially imposed limits. Booth et al. (2002) claim that thresholds of effect are not a true characteristic of the system but are an artefact of measurements; the biological response is not a threshold response but a continuum. Thresholds do not differentiate between a condition of ―no impact‖ from one of ―some impact‖ but between ―some impact‖ and ―gross and easily perceived impact‖ (Booth et al., 2002). Each increment of increased imperviousness results in increased degradation of the natural system and the impacts are not solely found at specific levels of imperviousness. The only true way to protect these resources is to limit imperviousness and the loss of natural cover by instituting new and innovative approaches for mitigating impacts.
5.3 Recommended Future Work
The following is a list of key activities that should be undertaken to improve our collective understanding of the impacts of hydrological changes to wetlands and how best to mitigate these impacts:
1. Conduct research to better understand the ecological tolerances of different
wetland types and communities to hydrological changes caused by urbanization.
2. Develop protocols and guidelines for water balance monitoring. This would
include direction for developing a proper study design, data collection
methodologies, timing, and reporting requirements for baseline and post-
development monitoring.
3. Develop a list and/or guidance document outlining the appropriate models to use
for water balance analyses, how the models should be applied, and when (and
which) integrated models are required.
4. Conduct research on the efficacy of various mitigation measures on maintaining
the water balance of wetlands.
5. Update the Water Balance for the Protection of Natural Features Guideline to
integrate the findings of the work completed above.
Toronto and Region Conservation Authority, December 2011 Page 52
6. Glossary Catchment – the groundwater and/or surface water drainage area from which a woodland, wetland or watercourse derives its water. Denitrification – the conversion of nitrate to gaseous products, chiefly (N2) and/or nitrous oxide (N2O), by certain types of bacteria. Denitrification occurs mainly under anaerobic or micro-aerobic conditions. Facultative - Capable of existing to more than one set of (environmental) conditions Freeboard - The factor of safety applied to the depth of a feature‘s/facilities‘ water level and the top of a structure. Groundwater discharge – the removal of water from the saturated zone within soil across the water table surface, together with the associated flow towards the water table within the saturated zone. Headwater drainage feature– an ill-defined ephemeral or intermittent swale or zero-order stream Hydrology – A science dealing with the properties, distribution, and circulation of water on the land surface and in the soil, underlying rocks, and atmosphere. Hydroperiod – the seasonal pattern of water level fluctuation. This approximates the hydrologic signature of each wetland type (Mitsch and Gooselink, 2007; Wright et al. 2006; Azous and Horner, 2001; Reinelt et al., 1998). Four attributes are important for this pattern, including extent, duration, depth and timing of inundation. Infiltration – the movement of water from the land surface into the soil Recharge – the process by which water is added to a zone of saturation, usually by percolation from the soil surface, e.g. the recharge of an aquifer. Riparian – the land, together with the vegetation it supports, immediately in contact with the stream and sufficiently close to have a major influence on the total ecological character and functional process of the stream. Runoff – the water from rain, snowmelt or irrigation that flows over the land surface and is not absorbed into the ground, instead flowing into streams or other surface waters or land depressions. Vernal pools – temporary pools of water that are usually devoid of fish, and thus allow the safe development of natal amphibian and insect species. Water budget – the mathematical expression of the water balance. Water balance – the accounting of inflow and outflow of water in a system according to the components of the hydrologic cycle.
Toronto and Region Conservation Authority, December 2011 Page 53
7. References Azous, A. and S. Cooke. 2001. Wetland plant communities in relation to watershed development. In: Wetlands and Urbanization: Implications for the Future, A. Azous and R.Horner (eds.) New York: Lewis Publishers. Azous, A. and R. Horner. (eds.) 1997. Wetlands and Urbanization: Implications for the Future. New York: CRC Press LLC. Azous, A., L. Reinelt and J. Burkey. 2001. Managing wetlands hydroperiod: issues and concerns. In: Wetlands and Urbanization: Implications for the Future, A. Azous and R.Horner (eds.) New York: Lewis Publishers. Baldwin, A., M. Egnotovich and E. Clarke. 2001. Hydrological change and vegetation of tidal freshwater marshes: Field, greenhouse, and seed-bank experiments. Wetlands 21: 519-531. Booth, D., D. Hartley and R. Jackson. 2002. Forest cover, impervious surface area, and the mitigation of stormwater impacts. Journal of the American Water Resources Association 38(3):835-845. Crosbie, B. and P. Chow-Fraser. 1999. Percentage land use in the watershed determines the water and sediment quality of 22 marshes in the great lakes basin. Canadian Journal of Fisheries and Aquatic Science 56:1781-1791. Caldwell, P., M. Vepraskas, R. Skaggs, and J. Gregory. 2007. Simulating the water budgets of natural Carolina Bay wetlands. Wetlands 27(4):1112-1123. Carter, V. 1986. An overview of the hydrologic concerns related to wetlands in the United States. Canadian Journal of Botany 64: 364-374. Costanza, R., R. d‘Arge, R. Groot, S. Farber, M. Grasso, B. Hannon, K. Limburg, S. Naeem, R. O‘Neill, J. Paruelo, R. Raskin, P. Sutton and M. van den Belt. 1997. The value of the world‘s ecosystem services and natural capitol. Nature 387: 253-260. Dawson, T. 1993. Woodland water balance. TREE 8(4):120-121. Dillon Consulting Ltd., 2007. 2006 Dreamworks Wetland Long-term Monitoring and Management Report, Year 1. Dillon Consulting Ltd., 2008. 2007 Dreamworks Wetland Long-term Monitoring and Management Report, Year 2 of 3. Dillon Consulting Ltd., 2009. 2008 Dreamworks Wetland Long-term Monitoring and Management Report, Year 3 of 3.
Toronto and Region Conservation Authority, December 2011 Page 54
Echols, S. 2008. Split-flow theory: Stormwater design to emulate natural landscapes. Landscape and Urban Planning 85:205-214. Ehrenfeld, J. 2008. Exotic invasive species in urban wetlands: environmental correlates and implications for wetland management. Journal of Applied Ecology 45: 1160-1169. Ehrenfeld, J. 2000. Evaluating wetlands within an urban context. Ecological Engineering 15:253-265. Environment Canada. 2004. How much habitat is enough? 2nd ed. Minister of Public Works and Government Services Canada. Environment Canada. 2001. Priority Substances List Assessment Report: Road Salt. Ministry and Public Works and Government Services. Faulkner, S. 2004. Urbanization impacts on the structure and function of forested wetlands. Urban Ecosystems 7:89-106. Guntenspergen, G., and C. Dunn. 1998. Long term ecological sustainability of wetlands in urbanizing landscapes. Urban Ecosystems 2: 187-188. Hamer, A. and M. McDonnell. 2008. Amphibian ecology and conservation in the urbanizing world: A review. Biological Conservation 141: 2432-2449. Hansson, L., C. Bronmark, P. Nilsson and K. Abjornsson. 2005. Conflicting demands on wetland ecosystem services: nutrient retention, biodiversity or both? Freshwater Biology 50: 705-714. Harbor, J. 1994. A practical method for estimating the impact of land-use change on surface runoff, groundwater recharge and wetland hydrology. Journal of the American Planning Association 60(1):95-108. Hengstum, P., E. Reinhardt, J. Boyce and C. Clark. 2007. Changing sedimentation patterns due to historical land-use change in Frenchman‘s Bay, Pickering, Canada: evidence from high-resolution textural analysis. Journal of Paleolimnology Horner, R., S. Cooke, L. Reinelt, K. Ludwa, N. Chin and M. Valentine. 2001. Effects of watershed development on water quality and soils. In: Wetlands and Urbanization: Implications for the Future, A. Azous and R.Horner (eds.) New York: Lewis Publishers. Kentula, M., S. Gwin and S. Pierson. 2004. Tracking changes in wetlands with urbanization: Sixteen years of experience in Portland, Oregon, USA. Wetlands 24(4):734-743.
Toronto and Region Conservation Authority, December 2011 Page 55
Krause, S., J. Jacobs and A. Bronstert. 2007. Modelling the impacts of land use and drainage density on the water balance of a lowland floodplain landscape in northeast Germany. Ecological Modelling 200:475-492. Lee, H., W. Bakowsky, J. Riley, J. Bowles, M. Puddister, P. Uhlig and S. McMurry. 1998. Ecological Land Classification for Southern Ontario: First Approximation and its Application. Ontario: Ontario Ministry of Natural Resources. Lee, S., R. Dunn, R. Young, R. Connolly, P. Dale, R. Dehayr, C. Lemckert, S. McKinnon, B. Powell, P. Teasdale and D. Welsh. 2006. Impact of urbanization on coastal wetland structure and function. Austral Ecology 31: 149-163. Lougheed, V., M. McIntosh, C. Parker and R. Stevenson. 2008. Wetland degradation leads to homogenization of the biota at local and landscape scales. Freshwater Biology 53: 2402-2413. Ludwa, K. and K. Richter. 2001. Emergent macroinvertebrate communities in relation to watershed development. In: Wetlands and Urbanization: Implications for the Future, A. Azous and R.Horner (eds.) New York: Lewis Publishers. McClean, J. 2000. Wetter is not always better: Flood tolerance of woody species. The Practice of Watershed Protection ed. T. Schueler and H. Holland, article 35. McDonald M., J. Healey and P. Stevens. 2002. The effects of secondary forest clearance and subsequent land-use on erosion losses and soil properties in the Blue Mountains of Jamaica. Agriculture, Ecosystems and Environment 92:1-19. Mitsch, W. and J. Gosselink. 2007. Wetlands, 4th ed. New York: John Wiley & Sons. Nakamura, F., S. Kameyama and S. Mizugaki. 2004. Rapid shrinkage of Kushiro Mire, the largest mire in Japan, due to increased sedimentation associated with land-use development in the catchment. Catena 55:213-229. Nelson, E. and D. Booth. 2002. Sediment sources in an urbanizing mixed land use watershed. Journal of Hydrology 264:51-68. Owen, C. 1999. Hydrology and history: Land-use changes and ecological responses in an urban wetland. Wetlands Ecology and Management 6:209-219. Paul, M. and J. Meyer. 2001. Streams in the urban landscape. Annual Review of Ecology and Systematics 32: 333-365. Pillsbury, F. and J. Miller. 2008. Habitat and landscape characteristics underlying anuran community structure along an urban-rural gradient. Ecological Adaptations 18: 1107-1118.
Toronto and Region Conservation Authority, December 2011 Page 56
Reinelt, L., R. Horner, A. Azous. 1998. Impacts of urbanization on palustrine (depressional freshwater) wetlands—research and management in the Puget Sound region. Urban Ecosystems 2: 219-236. Reinelt L. and B. Taylor. 2001. Effects of watershed development on hydrology. In: Wetlands and Urbanization: Implications for the Future, A. Azous and R.Horner (eds.) New York: Lewis Publishers. Richter, K. and A. Azous. 2001. Bird communities in relation to watershed development. In: Wetlands and Urbanization: Implications for the Future, A. Azous and R.Horner (eds.) New York: Lewis Publishers. Rubbo, M. and J. Kiesecker. Amphibian breeding distribution in an urbanized landscape. Conservation Biology 19: 504-511. Schueler, T. 1987. Controlling Urban Runoff: a Practical Manual for Planning and Designing Urban Best Management Practices. Metropolitan Washington Council of Governments. Washington, D.C. Schueler, T. and H. Holland. (eds.) 2000. The impact of stormwater on Puget Sound wetlands. The Practice of Watershed Protection: Article 33. Centre for Watershed Protection. Simmons, M., X. Wu and S. Whisenant. 2007. Bottomland hardwood forest species responses to flooding regimes along an urbanization gradient. Ecological Engineering 29: 223-231. Skidds, D., F. Golet, P. Paton and J. Mitchell. 2007. Habitat correlates of reproductive effort in wood frogs and spotted salamanders in an urbanizing watershed. Journal of Herpetology 41: 439-450. Tang, Z., B. Engel, B. Pijanowski and K. Lim. 2005. Forecasting land use change and its environmental impact at a watershed scale. Journal of Environmental Management 76:35–45. Toronto and Region Conservation. 2003. A Watershed Plan for Duffins Creek and Carruthers Creek. ISBN 0-9732764-0-1. Toronto and Region Remedial Action Plan. 2009. Moving Forward. 2007 RAP Progress Report. Troy, A., and K. Bagstad. Ontario Ministry of Natural Resources. 2009. Estimating Ecosystem Services in Southern Ontario. Van Hengstum, P., E. Reinhardt, J. Boyce, and C. Clark. 2007. Changing sedimentation patterns due to historical land use change in Frenchman‘s Bay, Pickering, Canada: Evidence from high-resolution textural analysis. Journal of Paleolimnology 37: 603-618.
Toronto and Region Conservation Authority, December 2011 Page 57
Varga, S., D. Leadbeater, J. Webber, J. Kaiser, B. Crins, J. Kamstra, D. Banville, E. Ashley, G. Miller, C. Kingsley, C. Jacobsen, K. Mewa, L. Tebby, E. Mosley, and E. Zajc. 2000. Distribution and status of the vascular plants of the greater Toronto Area. Ontario Ministry of Natural Resources, Aurora District. Walsch, C., A. Roy, J. Feminella, P. Cottingham, P. Groffman and R. Morgan. 2005. The urban stream syndrome: current knowledge and the search for a cure. Journal of the North American Benthological Society 24: 706-723. Wang, J., T. Endreny and D. Nowak. 2008. Mechanistic simulation of tree effects in an urban water balance model. Journal of the American Water Resources Association 44(1):75-85. Wei, A. and P. Chow-Fraser. 2006. Synergistic impact of water level fluctuation and invasion of Glyceria and Typha in a freshwater marsh of Lake Ontario. Aquatic Biology 84: 63-69. Wei, A. and P. Chow-Fraser. 2005. Untangling the confounding effects of urbanization and high water level on the cover of emergent vegetation in Cootes Paradise Marsh, a degraded coastal wetland of Lake Ontario. Hydrobiologia 544: 1-9. Whitfield-Gibsons, J., C. Winne, D. Scott, J. Wilson, X. Glaudas, K. Andrews, B. Todd, L. Fedewa, L. Wilkinson, R. Tsaliagos, S. Harper, J. Greene, T. Tuberville, B. Metis, M. Dorcas, J. Nestor, C. Young, T. Akre, R. Reed, K. Buhlmann, J. Norman, D. Croshaw, C. Hagen, and B. Rothermel. 2006. Remarkable amphibian biomass and abundance in an isolated wetland: Implications for wetland conservation. Conservation Biology 20(5):1457-1465. Wright, T., J. Tomlinson, T. Schueler and K. Cappiella. Direct and indirect impacts of urbanization on wetland quality. 2006. Wetlands and Watersheds: Article 1. Maryland: Centre for Watershed Protection. Youngsug, K., B. Engel, K. Jae Lim, V. Larson and B. Duncan. 2002. Runoff impacts of land-use change in Indian River Lagoon watershed. Journal of Hydrologic Engineering 7(3):245-251. Zedler, J. 2000. Progress in wetland restoration ecology. Tree 15: 402-407.
Toronto and Region Conservation Authority, December 2011 Page 58
APPENDIX
Examples of the Impacts of Water Balance Problems on
Natural Features
TRCA is concerned with the impacts of urbanization on the hydrology of wetlands, watercourses and woodlands. We focussed our review above on wetlands because these are the features where the science was most advanced. As we have demonstrated above, there are major gaps in our understanding of these impacts for wetlands, as well as woodlands and watercourses. While there are not many scientific studies or monitoring reports that examine these hydrological effects, we have collected a series of anecdotal accounts of these impacts from Conservation Authority staff and municipal foresters from the Greater Toronto Area in order to document these experiences. These are presented as examples below, and provide evidence that without adequate consideration for maintenance of feature hydrology, these systems move to simpler, degraded, less diverse communities. There are oftentimes socio-economic impacts that result from these hydrological changes, including flooding and erosion problems as well. We present these examples below.
1.0 EFFECTS OF TOO LITTLE WATER
1.1 WINDWOOD PARK, CITY OF MISSISSAUGA
This woodland experienced substantial tree mortality when the upstream drainage area was diverted to a stormwater management facility. Urban development and recreational park uses now exist within the catchment. Drainage from the catchment flows towards the woodland, but is intercepted by two catchbasins: one immediately upstream of the woodland, and another located at the upstream end within the woodland itself. Historically, this drainage concentrated flow into a small watercourse that meandered through the woodland and supplied it with moisture. Woodland species include sugar maple (Acer saccharum), American beech (Fagus grandiflora), and red oak (Quercus rubrum), which have been in decline for the past 30 years since the development was first completed. Many of the larger trees, which are less resiliant to change, have suffered from canopy dieback, such as sugar maple, while others have become susceptible to secondary diseases such as birch bark disease. Tip-ups have also occurred in the riparian zone where the watercourse previously flowed. (Source: D. Fabris, personal communication).
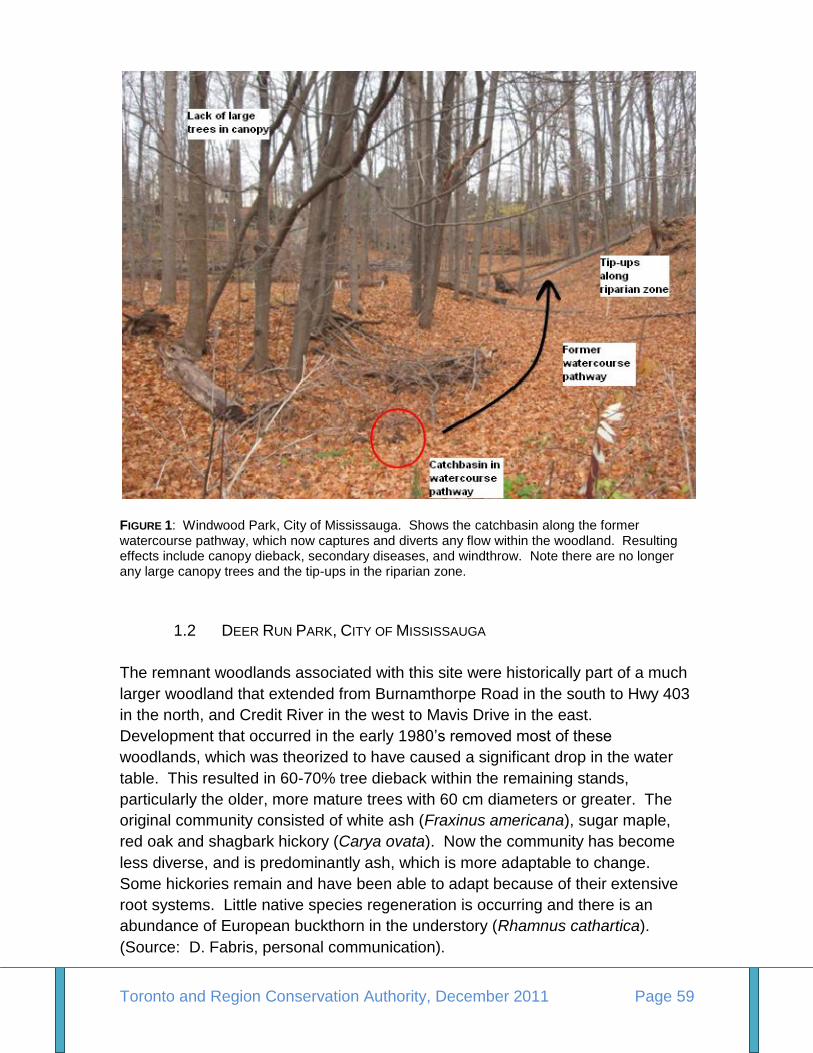
Toronto and Region Conservation Authority, December 2011 Page 59
FIGURE 1: Windwood Park, City of Mississauga. Shows the catchbasin along the former watercourse pathway, which now captures and diverts any flow within the woodland. Resulting effects include canopy dieback, secondary diseases, and windthrow. Note there are no longer any large canopy trees and the tip-ups in the riparian zone.
1.2 DEER RUN PARK, CITY OF MISSISSAUGA
The remnant woodlands associated with this site were historically part of a much
larger woodland that extended from Burnamthorpe Road in the south to Hwy 403
in the north, and Credit River in the west to Mavis Drive in the east.
Development that occurred in the early 1980‘s removed most of these
woodlands, which was theorized to have caused a significant drop in the water
table. This resulted in 60-70% tree dieback within the remaining stands,
particularly the older, more mature trees with 60 cm diameters or greater. The
original community consisted of white ash (Fraxinus americana), sugar maple,
red oak and shagbark hickory (Carya ovata). Now the community has become
less diverse, and is predominantly ash, which is more adaptable to change.
Some hickories remain and have been able to adapt because of their extensive
root systems. Little native species regeneration is occurring and there is an
abundance of European buckthorn in the understory (Rhamnus cathartica).
(Source: D. Fabris, personal communication).
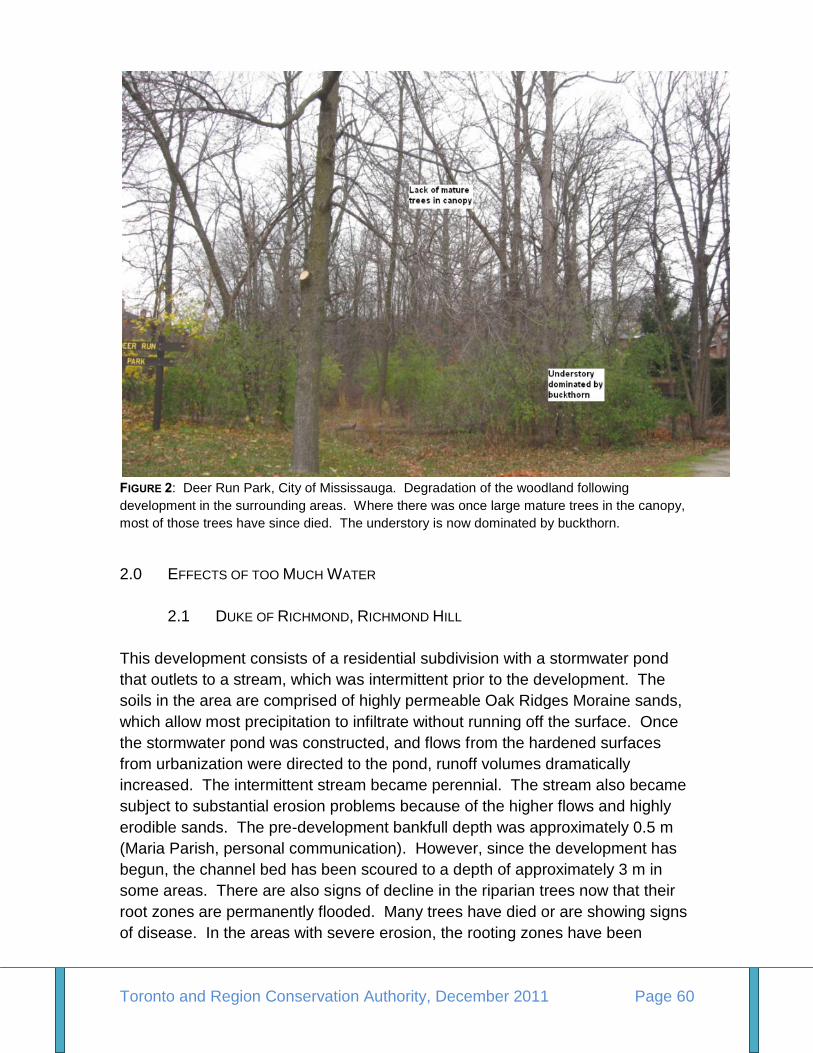
Toronto and Region Conservation Authority, December 2011 Page 60
FIGURE 2: Deer Run Park, City of Mississauga. Degradation of the woodland following
development in the surrounding areas. Where there was once large mature trees in the canopy,
most of those trees have since died. The understory is now dominated by buckthorn.
2.0 EFFECTS OF TOO MUCH WATER
2.1 DUKE OF RICHMOND, RICHMOND HILL
This development consists of a residential subdivision with a stormwater pond
that outlets to a stream, which was intermittent prior to the development. The
soils in the area are comprised of highly permeable Oak Ridges Moraine sands,
which allow most precipitation to infiltrate without running off the surface. Once
the stormwater pond was constructed, and flows from the hardened surfaces
from urbanization were directed to the pond, runoff volumes dramatically
increased. The intermittent stream became perennial. The stream also became
subject to substantial erosion problems because of the higher flows and highly
erodible sands. The pre-development bankfull depth was approximately 0.5 m
(Maria Parish, personal communication). However, since the development has
begun, the channel bed has been scoured to a depth of approximately 3 m in
some areas. There are also signs of decline in the riparian trees now that their
root zones are permanently flooded. Many trees have died or are showing signs
of disease. In the areas with severe erosion, the rooting zones have been
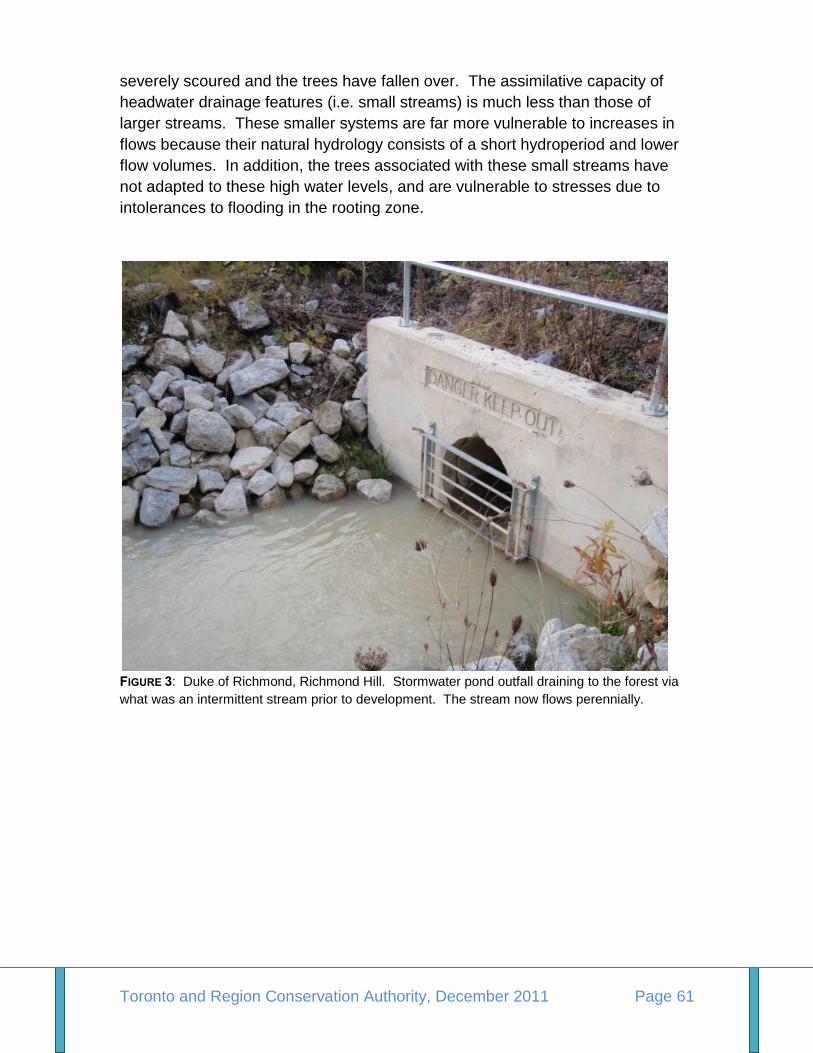
Toronto and Region Conservation Authority, December 2011 Page 61
severely scoured and the trees have fallen over. The assimilative capacity of
headwater drainage features (i.e. small streams) is much less than those of
larger streams. These smaller systems are far more vulnerable to increases in
flows because their natural hydrology consists of a short hydroperiod and lower
flow volumes. In addition, the trees associated with these small streams have
not adapted to these high water levels, and are vulnerable to stresses due to
intolerances to flooding in the rooting zone.
FIGURE 3: Duke of Richmond, Richmond Hill. Stormwater pond outfall draining to the forest via
what was an intermittent stream prior to development. The stream now flows perennially.
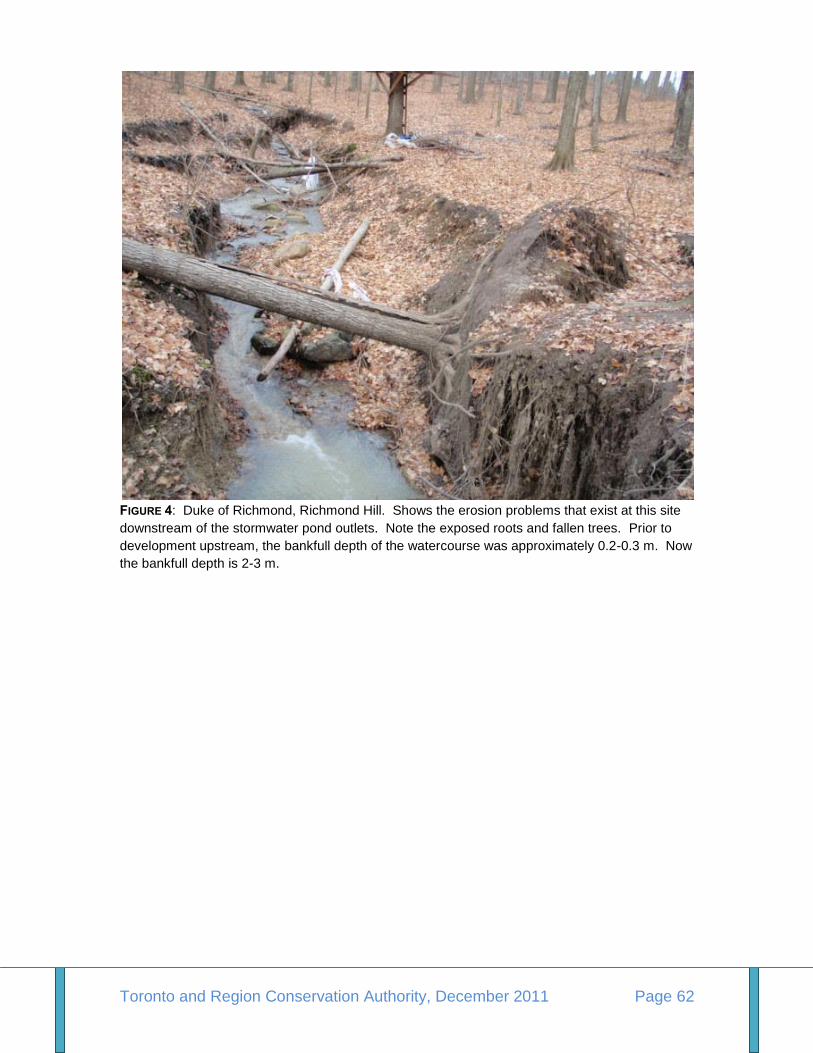
Toronto and Region Conservation Authority, December 2011 Page 62
FIGURE 4: Duke of Richmond, Richmond Hill. Shows the erosion problems that exist at this site
downstream of the stormwater pond outlets. Note the exposed roots and fallen trees. Prior to
development upstream, the bankfull depth of the watercourse was approximately 0.2-0.3 m. Now
the bankfull depth is 2-3 m.
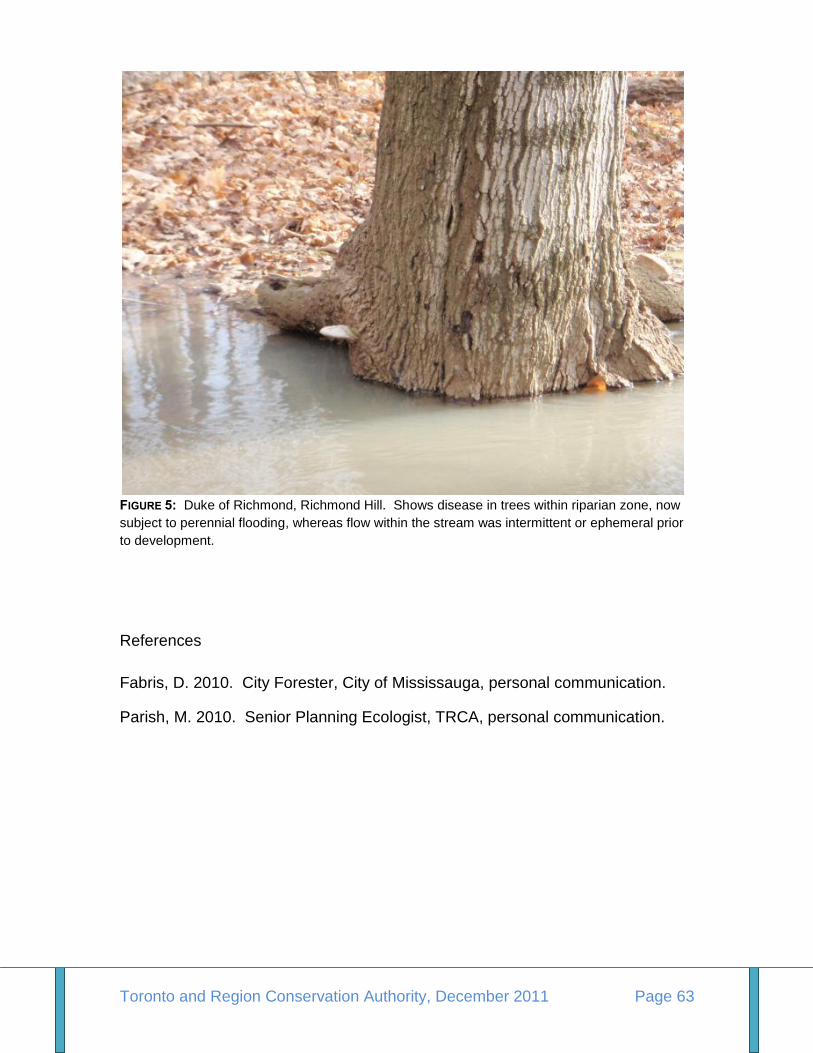
Toronto and Region Conservation Authority, December 2011 Page 63
FIGURE 5: Duke of Richmond, Richmond Hill. Shows disease in trees within riparian zone, now
subject to perennial flooding, whereas flow within the stream was intermittent or ephemeral prior
to development.
References
Fabris, D. 2010. City Forester, City of Mississauga, personal communication.
Parish, M. 2010. Senior Planning Ecologist, TRCA, personal communication.