Embed Size (px)
Citation preview

Feature Learning applied to the Estimation of Tensile Strength at Break in Polymeric Material Design
Cravero Fiorella1, Martínez M. Jimena2, Vazquez Gustavo E.3, Díaz Mónica F.1, Ponzoni Ignacio2,*
1Planta Piloto de Ingeniería Química, Universidad Nacional del Sur – CONICET. La Carrindanga 7000, Bahía Blanca, Argentina
2Instituto de Ciencias e Ingeniería de la Computación, Universidad Nacional del Sur – CONICET. San Andrés 800 – Campus Palihue, 8000, Bahía Blanca, Argentina
3Facultad de Ingeniería y Tecnologías, Universidad Católica del Uruguay. Av. 8 de Octubre 2738, Montevideo, Uruguay
Summary
Several feature extraction approaches for QSPR modelling in Cheminformatics are discussed in this paper. In particular, this work is focused on the use of these strategies for predicting mechanical properties, which are relevant for the design of polymeric materials. The methodology analysed in this study employs a feature learning method that uses a quantification process of 2D structural characterization of materials with the autoencoder method. Alternative QSPR models inferred for tensile strength at break (a well-known mechanical property of polymers) are presented. These alternative models are contrasted to QSPR models obtained by feature selection technique by using accuracy measures and a visual analytic tool. The results show evidence about the benefits of combining feature learning approaches with feature selection methods for the design of QSPR models.
1 Introduction
Important decisions about materials are taken in any engineering activity, especially when selection between specific materials affects requirements of performance and/or cost. In this regard, new synthetic polymers were developed to improve their utility and consequently satisfy the demanding market. As a result, the design of new materials is a growing field of research. The classic approach to achieve this objective has been empirical, but at present the ability to predict material properties previous synthesis has changed those experimental methods obtaining important reductions in time and cost. The increasing knowledge of relationships among the molecular structure of a material and its properties is the core step for modelling. However, when materials are complex, reaching these predictions becomes much difficult [1]. In particular, the prediction of mechanical properties, previous synthesis, plays a central role in material design, because these properties define the application profile of polymeric materials.
The predictive models can be obtained by cheminformatics methods, specifically QSPR (Quantitative Structure-Property Relationship) techniques. The QSPR models are required to identify the relationships among several molecular descriptors (which characterizes the structure and other features of chemical compounds) and a target property under study (related
* To whom correspondence should be addressed. Email: [email protected]
Journal of Integrative Bioinformatics, 13(2):286, 2016 http://journal.imbio.de/
doi:10.2390/biecoll-jib-2016-286 1
Cop
yrig
ht20
16T
heA
utho
r(s)
.Pub
lishe
dby
Jour
nalo
fInt
egra
tive
Bio
info
rmat
ics.
Thi
sar
ticle
islic
ense
dun
dera
Cre
ativ
eC
omm
ons
Attr
ibut
ion-
Non
Com
mer
cial
-NoD
eriv
s3.
0U
npor
ted
Lic
ense
(http
://cr
eativ
ecom
mon
s.or
g/lic
ense
s/by
-nc-
nd/3
.0/)
.

with a physicochemical or mechanical property of interest). This task can be addressed by using machine learning approaches. The development of intelligent systems for the design of QSPR models has been increasing significantly during last decades [2]. To treatment of this predictive modelling problem using machine learning involves tackling several computer science challenges. One of them consist into chose the most relevant molecular descriptors for the estimation of the property under study. This is a classical feature selection problem, where the featured variables are molecular descriptors and the target variable is a physicochemical or mechanical property (all of them quantitatively valued). In these applications, the usual number of candidate molecular descriptors to be evaluated for designing a QSPR model is huge. Around thousands of molecular descriptors are available for computation in Cheminformatic tools, like DRAGON [3]. Therefore, the automatic selection of an optimal set of molecular descriptors is a highly expensive task [4]. Furthermore, the computational effort is even harder when the feature selection method is executed for the inference of QSPR models in the design of polymeric materials. In this specific subdomain, the size and characteristics of these chemical compounds, usually huge macromolecules (4000-800000 g/mol), become difficult even the estimation of the most straightforward molecular descriptors [5].
Since these limitations, different approaches for dimensionality reduction and feature learning have emerged in the area of QSPR modelling to make simpler, or even avoid, the task of selecting molecular descriptors. One particular example of these techniques is based on the combination of the CODES and TSAR algorithms [6]. This strategy extracts a reduced set of new features, using neural networks for the feature learning procedure. These new features constitute a new space of variables, which has a low dimensionality, where variables represent information derived from the whole molecular structure of the compounds. In this way, the traditional computation of thousand molecular descriptors followed for the features selection step is not necessary.
In databases of chemical compounds related to pharmacological studies and other biological experiments, CODES-TSAR (C-T) strategy obtains QSAR models with high levels of accuracy [7]. Nevertheless, its performance has never been assessed in the inference of QSPR models for designing synthetic polymers. For this reason, the main objective of this work is to explore the advantages and drawbacks of this approach on the prediction of relevant mechanical properties for Materials Science. In this sense, we present here an extended version of the article discussed in the 10th International Conference on Practical Applications of Computational Biology & Bioinformatics (PACBB 2016) [8], where QSPR models obtained by CODES-TSAR are compared to QSAR models inferred by traditional QSPR design strategies using an integrative approach, which applies machine learning and visual analytics tools. Besides, some combinations among the models obtained by the different approaches are also studied, in order to evaluate the impact of hybridizing these alternative QSPR methodologies. More detailed information and discussions about the experiments are reported in this extended version. The next section presents the Methodology focusing on how the descriptors of the QSPR models are obtained. Then, in Experiments and Results, it is explained how models were built as well as the performance evaluation in the context of visual analytics, considering tensile strength at break as an example. Finally, conclusions are presented and an idea of future work is described.
Journal of Integrative Bioinformatics, 13(2):286, 2016 http://journal.imbio.de/
doi:10.2390/biecoll-jib-2016-286 2
Cop
yrig
ht20
16T
heA
utho
r(s)
.Pub
lishe
dby
Jour
nalo
fInt
egra
tive
Bio
info
rmat
ics.
Thi
sar
ticle
islic
ense
dun
dera
Cre
ativ
eC
omm
ons
Attr
ibut
ion-
Non
Com
mer
cial
-NoD
eriv
s3.
0U
npor
ted
Lic
ense
(http
://cr
eativ
ecom
mon
s.or
g/lic
ense
s/by
-nc-
nd/3
.0/)
.

2 Methodology
QSPR regression (or classification) models relate a set of structural and non-structural descriptors (represented with 𝑋) with a target property of interest (𝑌) [5]. Following this definition, a QSPR model can be mathematically represented as a function 𝑓(𝑋) that tries to predict 𝑌. In the chemical field, the values of 𝑋 (typically named descriptors) are computed for all compounds by using specific software tools like DRAGON [3], while 𝑌 values correspond to the experimental target of interest. By means of a training set, the function 𝑓 can be learned using available machine learning techniques. In order to assess the predictive power, the function 𝑓 is applied to the compounds not used in the training stage. In this way, 𝑓 can estimate the target value of unseen compounds. In Fig. 1 it is shown a description of the methodology carried out in this work.
Figure 1: Methodology and Experimental Design. The methodology has two main branches: feature selection on the left side and feature learning on the right side, both converge in an analysis through visual analytics in order to complete the study.
Journal of Integrative Bioinformatics, 13(2):286, 2016 http://journal.imbio.de/
doi:10.2390/biecoll-jib-2016-286 3
Cop
yrig
ht20
16T
heA
utho
r(s)
.Pub
lishe
dby
Jour
nalo
fInt
egra
tive
Bio
info
rmat
ics.
Thi
sar
ticle
islic
ense
dun
dera
Cre
ativ
eC
omm
ons
Attr
ibut
ion-
Non
Com
mer
cial
-NoD
eriv
s3.
0U
npor
ted
Lic
ense
(http
://cr
eativ
ecom
mon
s.or
g/lic
ense
s/by
-nc-
nd/3
.0/)
.

In order to construct the QSPR model, the best molecular descriptors need to be identified. A brute force approach is doing a combinatorial search of the best descriptors. However, the computational complexity of these tasks turns it prohibitive. To overcome this we propose the use of Delphos [9]. Delphos implements a multiobjective optimization method that explores the whole space of combinations of molecular descriptors looking for the best predictive subset, i.e. the best set of descriptors that provide accurate predictions of 𝑌 (Fig. 1 - Left). Delphos is based on the two-phase machine learning method. In the first phase, a wrapper method executes a coarse search following a heuristic method in order to be able to find an appropriate subset of variables in a reasonable time period. In the second phase, a thorough evaluation is applied using a neural network assemble, in order to determine which subsets of the coarse selection are the most relevant ones.
Although the general approach is to use classical molecular descriptors, feature learning methods provide a different QSPR modelling technique such as the combination of CODES and TSAR method [6]. This technique summarizes the information provided by a set of descriptors into a new -and small- set so the feature selection step is no longer required.
First, the process of QSPR model building starts describing all molecules of the database using its SMILES representation. SMILES (Simplified Molecular Input Line Entry System) is a typographical line notation for specifying chemical structure, which uses graph theory to represent a molecule. The nodes are atoms, and the edges are semi-rigid bonds [10]. Second, CODES tool is fed with the SMILES codes and as a result, a dynamic matrix is generated. This matrix has a variable number of rows as it is necessary for stabilization and as many columns as the number of atoms (excluded hydrogens). Third, TSAR tool transforms each matrix into the reduced set of descriptors, performing the dimensionality reduction. TSAR implements an autoencoder neural network [11]. This process is applied to each molecule of the database and the reduced descriptor table is obtained (Fig. 1- Right).
Finally, it is discussed, in the context of visual analytic, the models obtained by each branch of the methodology and the models that combine descriptors from both methods. This analysis is performed with VIDEAN [4], available online.
3 Experiments and Results
The polymer database employed in this work was previously developed by our research group [12]. This relates polymers with mechanical properties derived from tensile test. 66 polymers were extracted from it and represented by their SMILES codes. The database polymers are: linear, thermoplastic, amorphous, flame-retardant, thermally stable, hydrolytically stable, hydrolytic degradable, low toxic, and thermostable. Concerning international norms, the database meets the following ones: ASTM D638, ASTM D882-83, and DIN 53504.53A. Table 1 shows additional parameters considered to make the database: Mn (Number Average Molecular Weight), Mw (Weight Average Molecular Weight), Mw/Mn (Polydispersity Index), CHS (Cross Head Speed) and testing temperature besides tensile strength at break, which is the property selected for predicting in this study (target). In a tensile test, a polymeric sample is subjected to a controlled tension (constant CHS) until failure (breaking point) and the process is represented by a stress-strain curve. An example can be observed in Figure 2. From point A to B, the deformation is considered elastic and Young's Modulus is calculated in this zone. When the fracture occurs, at point E, the corresponding stress is known as tensile strength at break. Materials which have a low tensile strength at break are often referred as weak materials. The results from the test are commonly used to select a material for a specific application or quality control [1].
Journal of Integrative Bioinformatics, 13(2):286, 2016 http://journal.imbio.de/
doi:10.2390/biecoll-jib-2016-286 4
Cop
yrig
ht20
16T
heA
utho
r(s)
.Pub
lishe
dby
Jour
nalo
fInt
egra
tive
Bio
info
rmat
ics.
Thi
sar
ticle
islic
ense
dun
dera
Cre
ativ
eC
omm
ons
Attr
ibut
ion-
Non
Com
mer
cial
-NoD
eriv
s3.
0U
npor
ted
Lic
ense
(http
://cr
eativ
ecom
mon
s.or
g/lic
ense
s/by
-nc-
nd/3
.0/)
.
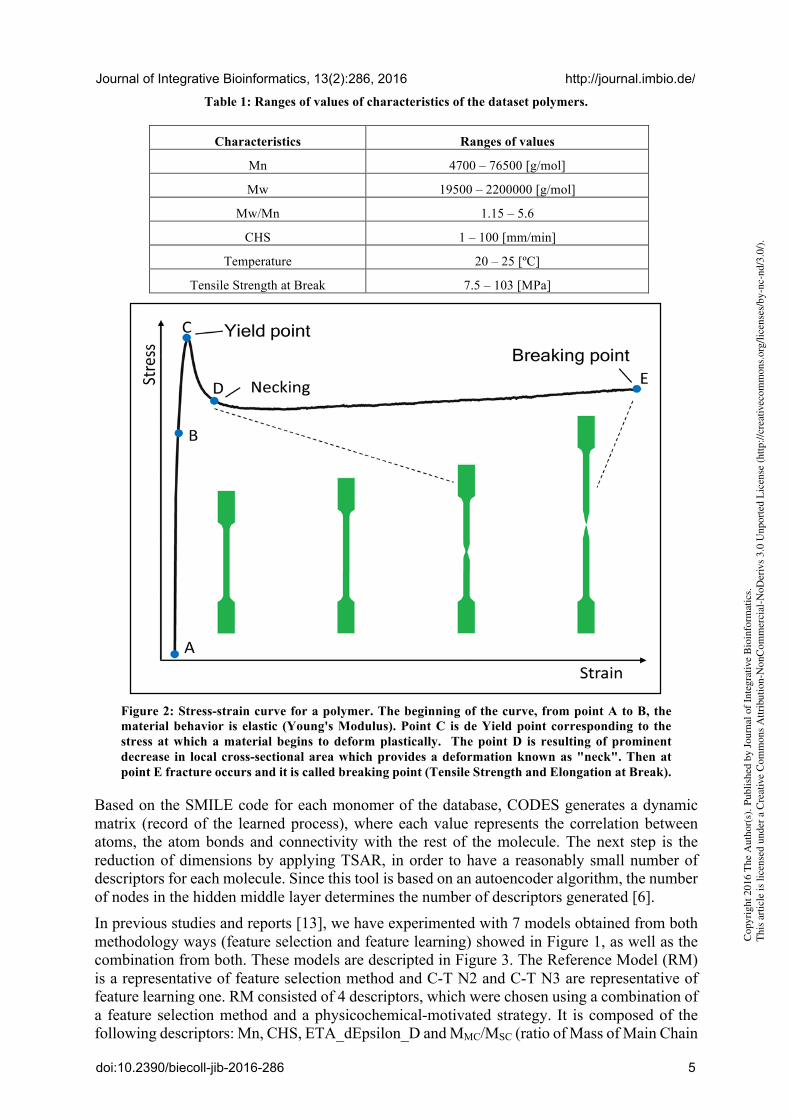
Table 1: Ranges of values of characteristics of the dataset polymers.
Characteristics Ranges of values
Mn 4700 – 76500 [g/mol]
Mw 19500 – 2200000 [g/mol]
Mw/Mn 1.15 – 5.6
CHS 1 – 100 [mm/min]
Temperature 20 – 25 [ºC]
Tensile Strength at Break 7.5 – 103 [MPa]
Figure 2: Stress-strain curve for a polymer. The beginning of the curve, from point A to B, the material behavior is elastic (Young's Modulus). Point C is de Yield point corresponding to the stress at which a material begins to deform plastically. The point D is resulting of prominent decrease in local cross-sectional area which provides a deformation known as "neck". Then at point E fracture occurs and it is called breaking point (Tensile Strength and Elongation at Break).
Based on the SMILE code for each monomer of the database, CODES generates a dynamic matrix (record of the learned process), where each value represents the correlation between atoms, the atom bonds and connectivity with the rest of the molecule. The next step is the reduction of dimensions by applying TSAR, in order to have a reasonably small number of descriptors for each molecule. Since this tool is based on an autoencoder algorithm, the number of nodes in the hidden middle layer determines the number of descriptors generated [6]. In previous studies and reports [13], we have experimented with 7 models obtained from both methodology ways (feature selection and feature learning) showed in Figure 1, as well as the combination from both. These models are descripted in Figure 3. The Reference Model (RM) is a representative of feature selection method and C-T N2 and C-T N3 are representative of feature learning one. RM consisted of 4 descriptors, which were chosen using a combination of a feature selection method and a physicochemical-motivated strategy. It is composed of the following descriptors: Mn, CHS, ETA_dEpsilon_D and MMC/MSC (ratio of Mass of Main Chain
Journal of Integrative Bioinformatics, 13(2):286, 2016 http://journal.imbio.de/
doi:10.2390/biecoll-jib-2016-286 5
Cop
yrig
ht20
16T
heA
utho
r(s)
.Pub
lishe
dby
Jour
nalo
fInt
egra
tive
Bio
info
rmat
ics.
Thi
sar
ticle
islic
ense
dun
dera
Cre
ativ
eC
omm
ons
Attr
ibut
ion-
Non
Com
mer
cial
-NoD
eriv
s3.
0U
npor
ted
Lic
ense
(http
://cr
eativ
ecom
mon
s.or
g/lic
ense
s/by
-nc-
nd/3
.0/)
.

by Mass of side chain). C-T N2 and C-T N3 were obtained with the CODES-TSAR methodology, with two and three neurons in the hidden layer, respectively. Molecular descriptor computed for the different models using DRAGON and CODES-TSAR are reported, together with the target property, in Table A1 and A2 in appendix.
Figure 3: Conformation of models and their descriptors. Descriptors can be seen in black ovals, on the left side corresponding to feature selection and at right feature learning. The reference model (RM) is marked by a box and name in purple. Codes-models are identified by Tsar boxes and green names, 2 neurons (C-T N2) in light green and 3 neurons (C-T N3) in dark green. Those models which are formed by the RM have violet box, and name the color that represents its other descriptors, light green for 2 neurons (C-N2) and dark green 3 neurons (C-N3). Enhanced models are those having the chosen descriptors, marked in yellow. These models are represented by yellow boxes and name in the color representing their other descriptors, likewise, light green for 2 neurons (E.-N2) and dark green 3 neurons (E.-N3).
On the other hand, the addition of RM with C-T N2 and C-T N3 were tested and we called them Combined Models. Namely, RM + C-T N2: Combined N2 (C.-N2) and RM + C-T N3: Combined N3 (C.-N3). In Figure 3 they are represented with a purple box and green letters. Another experiment included the summation of Mn y CHS plus CODES-TSAR Models, we called them Enhanced Models. In the Figure 3 they (E.-N2 and E.-N3) can be distinguished with a yellow box and green letters. We have picked out the CHS descriptor because it is a testing parameter that determines the value of the mechanical properties, and the Mn descriptor because it provides “macro” information about the molecules.
The performance of 7 models is descripted in Table 2. To assess them, it should be considered that high predictive accuracy in statistical terms, low cardinality model (minimum number of descriptors) and high interpretability, in general, define a robust predictor. Statistical evaluation was performed with WEKA [14], using decision trees with 10-fold cross validation and the
Journal of Integrative Bioinformatics, 13(2):286, 2016 http://journal.imbio.de/
doi:10.2390/biecoll-jib-2016-286 6
Cop
yrig
ht20
16T
heA
utho
r(s)
.Pub
lishe
dby
Jour
nalo
fInt
egra
tive
Bio
info
rmat
ics.
Thi
sar
ticle
islic
ense
dun
dera
Cre
ativ
eC
omm
ons
Attr
ibut
ion-
Non
Com
mer
cial
-NoD
eriv
s3.
0U
npor
ted
Lic
ense
(http
://cr
eativ
ecom
mon
s.or
g/lic
ense
s/by
-nc-
nd/3
.0/)
.

WEKA standard parameters. The validation metrics (R2) of most of the models have predictive precision above 0.7. The cardinality of Combined and Enhanced Models is equal to or greater than the cardinality of the RM. This fact is not so relevant because the comparison between them cannot be applied. The sets of descriptors of CODES-TSAR models can be thought as a single descriptor (characterized by more than one value), since they must not be interpreted or used separately. Put it in other way, the values generated by CODES-TSAR together represent a particular descriptor of the entire 2D structure. It is appreciated that the models derived from the exclusive use of descriptors created by CODES-TSAR does not reach the predictive performance of the RM. Nevertheless, there is evidence to conclude that the combination of the information provided by the CODES-TSAR models and classical methodologies, C.-N2 and C.-N3 models, improves the statistical accuracy of the RM without a significant increase in cardinality.
Table 2: Cardinality of models and performance of training and validation expressed as R2.
Models Cardinality Training Validation
CODES-TSAR N2 (C-T N2) (2) 0.7071 0.5788
CODES-TSAR N2 (C-T N3) (3) 0.7513 0.4385
Reference Model (RM) (4) 0.8840 0.8172
Enhanced N2 (E.-N2) (4) 0.7954 0.7527
Enhanced N3 (E.-N3) (5) 0.8734 0.5857
Combined N2 (C.-N2) (6) 0.9333 0.8488
Combined N3 (C.-N3) (7) 0.9253 0.8514
Respect to interpretability of models, it is needed to consider that modelling polymers is very complex because of size and unique behaviour of these huge molecules. However, visual analytical computational tools as VIDEAN [4], simplify this task. At this stage, VIDEAN was used to analyse the relationships and interactions between the descriptors of the different models. This analysis was performed through interactive visual exploration of data. VIDEAN offers different visual representations like scatter plots of property versus descriptors values (Fig. 4) and an undirected graph to represent the degree of pairwise mutual information among descriptors (Fig. 5). In Figure 4 we can see that the histograms for the model C-T N3 show the same type of behaviour for the three descriptors respect to the property. Their low performance (0.4385, Table 4) is precisely due to an undesirable behaviour of the descriptors in the model, because each one provides information in the same zones for the structure-property relationship. For C-T N2 the interpretation and conclusions are similar. Analyzing the model RM, it is possible to see that it has four descriptors with different behavior (Fig. 4), but with a lack of information at the right end of each chart; but it is a region in which the two models CODES-TSAR (C-T N2 and C-T N3) show values. From the previous analysis, it could be explained why Combined Models improve their performance (0.8488 and 0.8514, Table 4), that means all descriptors together (RM + C-T) are contributing information to different zones, completing the area of target.
In Figure 5 we can see edges in different tones of pink that represent degrees of mutual information, low degree with light pink and high one with dark pink. It is desirable descriptors with low mutual information to contribute non-redundant information to the model. Please note
Journal of Integrative Bioinformatics, 13(2):286, 2016 http://journal.imbio.de/
doi:10.2390/biecoll-jib-2016-286 7
Cop
yrig
ht20
16T
heA
utho
r(s)
.Pub
lishe
dby
Jour
nalo
fInt
egra
tive
Bio
info
rmat
ics.
Thi
sar
ticle
islic
ense
dun
dera
Cre
ativ
eC
omm
ons
Attr
ibut
ion-
Non
Com
mer
cial
-NoD
eriv
s3.
0U
npor
ted
Lic
ense
(http
://cr
eativ
ecom
mon
s.or
g/lic
ense
s/by
-nc-
nd/3
.0/)
.

that (Fig. 5), almost all the descriptors have a high degree of mutual information except Mn (all edges are light pink). It is coherent because Mn is a very significant descriptor for polymers since these materials have a molecular weight distribution rather than having a single molecular weight. Mn represents the number average molecular weight and provides macromolecular information to the model. When Mn was extracted from the model, its prediction power decayed.
Figure 4: Descriptors value vs Target Property: Scatterplots and Histograms for Combined models and RM. With red dots (scatterplot) it can be observed how the descriptor behaves with respect to the target property, also can be observed in yellow histograms.
Consequently, we can conclude that the exclusive use of CODES-TSAR method was not enough to model and predict tensile strength at break employing this database of polymers (See description at first part of section 3). Though, we can realize that the new descriptors learned by this feature extraction technique can contribute with valuable information to QSPR models that have been generated using the feature selection.
Journal of Integrative Bioinformatics, 13(2):286, 2016 http://journal.imbio.de/
doi:10.2390/biecoll-jib-2016-286 8
Cop
yrig
ht20
16T
heA
utho
r(s)
.Pub
lishe
dby
Jour
nalo
fInt
egra
tive
Bio
info
rmat
ics.
Thi
sar
ticle
islic
ense
dun
dera
Cre
ativ
eC
omm
ons
Attr
ibut
ion-
Non
Com
mer
cial
-NoD
eriv
s3.
0U
npor
ted
Lic
ense
(http
://cr
eativ
ecom
mon
s.or
g/lic
ense
s/by
-nc-
nd/3
.0/)
.
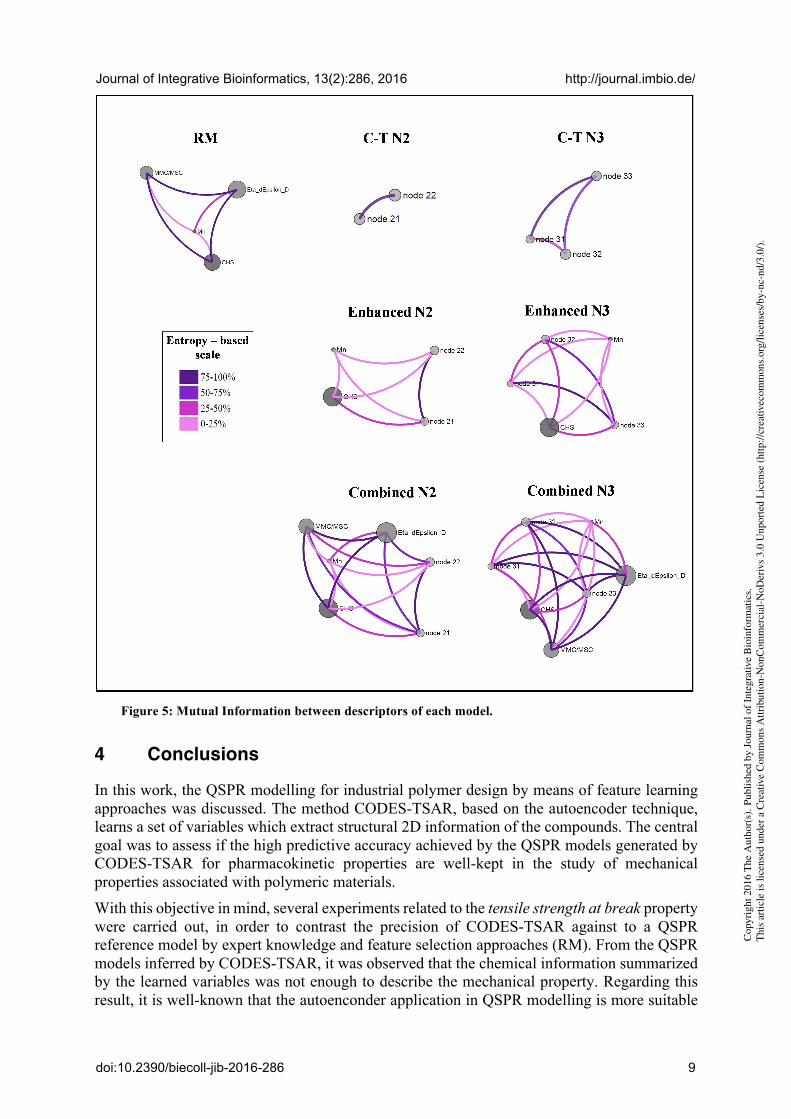
Figure 5: Mutual Information between descriptors of each model.
4 Conclusions
In this work, the QSPR modelling for industrial polymer design by means of feature learning approaches was discussed. The method CODES-TSAR, based on the autoencoder technique, learns a set of variables which extract structural 2D information of the compounds. The central goal was to assess if the high predictive accuracy achieved by the QSPR models generated by CODES-TSAR for pharmacokinetic properties are well-kept in the study of mechanical properties associated with polymeric materials. With this objective in mind, several experiments related to the tensile strength at break property were carried out, in order to contrast the precision of CODES-TSAR against to a QSPR reference model by expert knowledge and feature selection approaches (RM). From the QSPR models inferred by CODES-TSAR, it was observed that the chemical information summarized by the learned variables was not enough to describe the mechanical property. Regarding this result, it is well-known that the autoenconder application in QSPR modelling is more suitable
Journal of Integrative Bioinformatics, 13(2):286, 2016 http://journal.imbio.de/
doi:10.2390/biecoll-jib-2016-286 9
Cop
yrig
ht20
16T
heA
utho
r(s)
.Pub
lishe
dby
Jour
nalo
fInt
egra
tive
Bio
info
rmat
ics.
Thi
sar
ticle
islic
ense
dun
dera
Cre
ativ
eC
omm
ons
Attr
ibut
ion-
Non
Com
mer
cial
-NoD
eriv
s3.
0U
npor
ted
Lic
ense
(http
://cr
eativ
ecom
mon
s.or
g/lic
ense
s/by
-nc-
nd/3
.0/)
.

for groups of molecules that belong to the same chemical family [6], which is unusual in polymeric material databases. This yield to the proposal of enhance the CODES-TSAR QSPR models adding molecular descriptors linked to macromolecular information and also tensile test parameters, which play a central role in the material design experiments. Moreover, it was also tested the accuracies of QSPR models obtained by combining all the descriptors learned by CODES-TSAR with the entire RM. From all these experimental results, it was settled that the CODES-TSAR descriptors inferred by feature learning provide significant and complementary information to the RM. These conclusions were supported by the mutual information values observed in the descriptors pairwise analysis executed using VIDEAN. It is also important to mention that the improvement in the predictive accuracy is achieved without a significant increase in the number of molecular descriptors used in the QSPR model. In fact, the tuple of variables extracted by CODES-TSAR can be considered as a single descriptor.
As a future work, it is scheduled to test combined QSPR models for other mechanical properties related with polymeric material design, such as tensile modulus and elongation at break, jointly with the application of other machine learning techniques. Another interesting idea to explore in the future is the evaluation of this hybrid strategy, which combines feature learning and feature selection approaches, in the context of drug design applications. Taking into account that CODES-TSAR only captures structural 2D information of the compounds, the combination of these learned variables with 3D molecular descriptors obtained by feature selection could achieve QSAR models with high predictive performances.
Acknowledgements
This work has been funded by grants PIP 112-2012-0100471 and PIP 114-2011-0100362.
References
[1] D.W. Van Krevelen. Properties of Polymers, volume 4. Elsevier, 2009. [2] J.B.O. Mitchell. Machine learning methods in chemoinformatics. WIREs Comput Mol
Sci, 4, 468, 2014. [3] DRAGON, Version 5.5, Talete srl, Milan, Italy, 2007. [4] M.J. Martínez, I. Ponzoni, M.F. Díaz, G.E. Vázquez, A.J. Soto. Visual Analytics in
Cheminformatics: User-Supervised Descriptor Selection for QSAR Methods. Journal of Cheminformatics, 7 (39), 2015.
[5] T. Le, V. Chandana Epa, F.R. Burden, D.A. Winkler. Quantitative Structure–Property Relationship Modeling of Diverse Materials Properties. Chemical Reviews, 112, (5), 2889, 2012.
[6] I. Dorronsoro, A. Chana, M.A. Abasolo, A. Castro, C. Gil, M. Stud, A. Martinez. CODES/Neural Network Model: a Useful Tool for in Silico Prediction of Oral Absorption and Blood-Brain Barrier Permeability of Structurally Diverse Drugs, QSAR Comb. Sci., 23, 89, 2004.
[7] A. Guerra, J.A. Páez, N.E. Campillo. Artificial Neural Networks in ADMET Modeling: Prediction of Blood – Brain Barrier Permeation. QSAR Comb. Sci., 27, 586, 2008.
[8] F. Cravero, M.J. Martínez, G.E. Vazquez, M.F. Díaz, I. Ponzoni. Intelligent Systems for Predictive Modelling in Cheminformatics: QSPR Models for Material Design using Machine Learning and Visual Analytics Tools. Advances in Intelligent Systems and Computing, 477, 2016
[9] A.J. Soto, R.J. Cecchini, G.E. Vazquez, I. Ponzoni. Multi-Objective Feature Selection in QSAR/ QSPR using a Machine Learning Approach, QSAR Comb. Sci., 28, 1509, 2009.
Journal of Integrative Bioinformatics, 13(2):286, 2016 http://journal.imbio.de/
doi:10.2390/biecoll-jib-2016-286 10
Cop
yrig
ht20
16T
heA
utho
r(s)
.Pub
lishe
dby
Jour
nalo
fInt
egra
tive
Bio
info
rmat
ics.
Thi
sar
ticle
islic
ense
dun
dera
Cre
ativ
eC
omm
ons
Attr
ibut
ion-
Non
Com
mer
cial
-NoD
eriv
s3.
0U
npor
ted
Lic
ense
(http
://cr
eativ
ecom
mon
s.or
g/lic
ense
s/by
-nc-
nd/3
.0/)
.

[10] D. Weininger, A. Weininger, J.L. Weininger. SMILES 2. Algorithm for generation of unique SMILES notation. J. Chem. Inf. Comput. Sci., 1989, 29 (2), pp 97–101, 1989
[11] Y. Bengio. Learning Deep Architectures for AI, Foundations and Trends in Machine Learning, 2, 1, 2009.
[12] D. Palomba, F. Cravero, G.E. Vazquez, M.F. Diaz. Prediction of tensile strength at break for linear polymers applied to new materials development. In Proceeding of the International Congress of Metallurgy and Materials - Sam-Conamet, 2014.
[13] F. Cravero, G.E. Vazquez, M.F. Diaz, I. Ponzoni. Modelado QSPR de Propiedades Mecánicas de Materiales Poliméricos Empleando Técnicas de Reducción de Variables basadas en algoritmos de Aprendizaje Automático (in Spanish). CAIQ. In Proceeding of the Conference of Chemical Engineering. Buenos Aires, Argentina, 2015.
[14] M. Hall, E. Frank, G. Holmes, B. Pfahringer, P. Reutemann, I.H. Witten. The WEKA Data Mining Software: An Update. SIGKDD Explorations, 11, 1, 2009.
Journal of Integrative Bioinformatics, 13(2):286, 2016 http://journal.imbio.de/
doi:10.2390/biecoll-jib-2016-286 11
Cop
yrig
ht20
16T
heA
utho
r(s)
.Pub
lishe
dby
Jour
nalo
fInt
egra
tive
Bio
info
rmat
ics.
Thi
sar
ticle
islic
ense
dun
dera
Cre
ativ
eC
omm
ons
Attr
ibut
ion-
Non
Com
mer
cial
-NoD
eriv
s3.
0U
npor
ted
Lic
ense
(http
://cr
eativ
ecom
mon
s.or
g/lic
ense
s/by
-nc-
nd/3
.0/)
.

Appendix Table A1: Molecular descriptors computed by DRAGON for the RM.
# Polymer Tensile strength at break [MPa] Mn CHS ETA_dEpsilon_D MMC/MSC
1 38.82 146000 1,27 0 0,35
2 39.64 765000 1,27 0 0,35
3 40.5 231000 1,27 0 0,35
4 43 13500 5 0 0,35
5 44 13500 5 0 0,35
6 30 13500 5 0 0,35
7 80 41000 50 0,02406 7,15
8 72 33000 50 0,02406 7,15
9 70 42000 50 0,02339 7,13
10 71 44000 50 0,02169 8,15
11 83 41000 50 0,01871 6,87
12 71 44000 50 0,01961 8,98
13 81 41000 50 0,01968 6,92
14 73 38000 50 0,02023 3,65
15 51 65000 50 0,02702 6,15
16 61 55000 50 0,02406 7,15
17 50 64000 50 0,02406 7,15
18 50 58000 50 0,02339 7,13
19 53 61000 50 0,02169 8,15
20 60 71000 50 0,01871 6,87
21 66 81000 50 0,02023 3,65
22 62 69000 5 0,03372 2,10
23 18 190000 30,1 0 0,17
24 23 500000 30,1 0 0,17
25 16 190000 30,1 0 0,13
26 22 450000 30,1 0 0,15
27 21 470000 30,1 0 0,12
28 12 460000 30,1 0 0,11
29 19 750000 30,1 0 0,11
30 14 250000 30,1 0 0,11
31 18 34000 30,1 0 0,18
32 7.5 39000 30,1 0 0,13
33 76.53 21000 12,7 0,01618 2,24
34 82.74 44000 12,7 0,02047 9,39
35 30.7 68000 100 0,02948 1,80
Journal of Integrative Bioinformatics, 13(2):286, 2016 http://journal.imbio.de/
doi:10.2390/biecoll-jib-2016-286 12
Cop
yrig
ht20
16T
heA
utho
r(s)
.Pub
lishe
dby
Jour
nalo
fInt
egra
tive
Bio
info
rmat
ics.
Thi
sar
ticle
islic
ense
dun
dera
Cre
ativ
eC
omm
ons
Attr
ibut
ion-
Non
Com
mer
cial
-NoD
eriv
s3.
0U
npor
ted
Lic
ense
(http
://cr
eativ
ecom
mon
s.or
g/lic
ense
s/by
-nc-
nd/3
.0/)
.

36 47.4 53000 50 0,02539 0,64
37 67.5 11000 1 0,00989 1,73
38 99.1 9500 1 0,00989 1,73
39 90 64000 20 0,0074 2,19
40 85 42000 20 0,00693 2,35
41 96 37000 20 0,00703 2,76
42 98 43000 20 0,00658 3,44
43 79 50000 20 0,00584 2,47
44 58.5 8200 9 0,03118 2,48
45 57.2 6300 9 0,02698 2,59
46 49.4 4700 9 0,02586 2,53
47 90 30000 20 0,00568 2,29
48 79 17000 20 0,00592 2,55
49 91 57000 20 0,0068 2,55
50 96 25000 20 0,00638 3,15
51 92 42000 20 0,00568 2,32
52 83 33000 20 0,0074 3,21
53 98 46000 20 0,00691 4,09
54 102 39000 20 0,0061 2,77
55 89 54000 20 0,00638 3,24
56 83 41000 20 0,0061 2,77
57 58 154000 5 0,00865 1,19
58 54 61000 5 0,0084 1,18
59 44 74000 5 0,00887 0,83
60 94 31500 5 0,00816 1,08
61 38 31500 5 0,0085 0,78
62 80 16000 20 0,00638 3,05
63 83 33000 20 0,0068 2,48
64 102 63000 20 0,00808 2,71
65 16.9 41000 5 0,04416 2,22
66 20.8 43000 5 0,04416 2,22
Journal of Integrative Bioinformatics, 13(2):286, 2016 http://journal.imbio.de/
doi:10.2390/biecoll-jib-2016-286 13
Cop
yrig
ht20
16T
heA
utho
r(s)
.Pub
lishe
dby
Jour
nalo
fInt
egra
tive
Bio
info
rmat
ics.
Thi
sar
ticle
islic
ense
dun
dera
Cre
ativ
eC
omm
ons
Attr
ibut
ion-
Non
Com
mer
cial
-NoD
eriv
s3.
0U
npor
ted
Lic
ense
(http
://cr
eativ
ecom
mon
s.or
g/lic
ense
s/by
-nc-
nd/3
.0/)
.

Table A2: Molecular descriptors computed by CODES-TSAR for the C-T models.
# Polymer Tsar N3 Tsar N2
node 1 node 2 node 3 node 1 node 2
1 0.753745 0.820556 0.782008 0.800809 0.873296
2 0.954838 0.9469 0.887678 0.955257 0.929647
3 0.753745 0.820556 0.782008 0.819592 0.885244
4 0.753745 0.820556 0.782008 0.949465 0.967521
5 0.954838 0.9469 0.887678 0.800564 0.678873
6 0.970138 0.966281 0.857908 0.784712 0.695124
7 0.905254 0.00031 0.07454 0.924568 0.77728
8 0.039246 0.037205 0.991329 0.004391 0.779314
9 0.084745 0.000029 0.904698 0.997748 0.129842
10 0.995376 0.022916 0.311917 0.560131 0.0000037
11 0.917812 0.000431 0.09809 0.993016 0.170393
12 0.886386 0.041 0.008313 0.985206 0.145863
13 0.993693 0.331535 0.02099 0.000898 0.658192
14 0.024641 0.98513 0.242095 0.976703 0.133532
15 0.018269 0.016049 0.910829 0.969584 0.11494
16 0.700258 0.054774 0.000001 0.006297 0.864037
17 0.091105 0.000166 0.943813 0.000007 0.457509
18 0.008878 0.007576 0.84421 0.089302 0.988914
19 0.989003 0.086893 0.13976 0.466248 0.0000012
20 0.991608 0.216791 0.083532 0.985408 0.070276
21 0.978669 0.248306 0.009334 0.140637 0.983287
22 0.832953 0.008828 0.009919 0.759844 0.013684
23 0.802412 0.824827 0.783574 0.110789 0.995566
24 0.987946 0.866058 0.985858 0.96422 0.960704
25 0.963025 0.966944 0.970622 0.976483 0.981973
26 0.957462 0.963936 0.981931 0.998544 0.51179
27 0.952747 0.954494 0.964414 0.967368 0.981115
28 0.898621 0.434523 0.303064 0.525098 0.46046
29 0.310033 0.275702 0.942057 0.640107 0.44589
30 0.972364 0.973282 0.96768 0.987629 0.979419
31 0.946502 0.943581 0.934006 0.988423 0.958359
32 0.673623 0.708839 0.830096 0.610969 0.713247
33 0.965614 0.029194 0.01319 0.969001 0.99086
34 0.609592 0.037243 0.03794 0.000753 0.475376
35 0.017987 0.031356 0.950802 0.824192 0.996528
36 0.000057 0.953947 0.17425 0.358834 0.012768
Journal of Integrative Bioinformatics, 13(2):286, 2016 http://journal.imbio.de/
doi:10.2390/biecoll-jib-2016-286 14
Cop
yrig
ht20
16T
heA
utho
r(s)
.Pub
lishe
dby
Jour
nalo
fInt
egra
tive
Bio
info
rmat
ics.
Thi
sar
ticle
islic
ense
dun
dera
Cre
ativ
eC
omm
ons
Attr
ibut
ion-
Non
Com
mer
cial
-NoD
eriv
s3.
0U
npor
ted
Lic
ense
(http
://cr
eativ
ecom
mon
s.or
g/lic
ense
s/by
-nc-
nd/3
.0/)
.

37 0.889771 0.073394 0.001191 0.809646 0.000754
38 0.948097 0.104165 0.001457 0.003419 0.836936
39 0.002743 0.205383 0.981704 0.003185 0.833625
40 0.14766 0.951102 0.101403 0.702908 0.004285
41 0.991862 0.233953 0.078263 0.08205 0.912811
42 0.983387 0.269718 0.000125 0.688108 0.002846
43 0.002678 0.062926 0.952255 0.980843 0.133111
44 0.000133 0.06099 0.93673 0.882037 0.060925
45 0.081738 0.991407 0.214003 0.825477 0.030545
46 0.989587 0.223407 0.00137 0.086517 0.973462
47 0.038373 0.145242 0.912736 0.983698 0.116522
48 0.147181 0.918078 0.175781 0.933296 0.059676
49 0.992751 0.278038 0.059008 0.91491 0.101742
50 0.277233 0.053146 0.987737 0.122408 0.98003
51 0.000001 0.000016 0.322012 0.972483 0.115897
52 0.000656 0.005641 0.617429 0.999997 0.210174
53 0.301179 0.99212 0.002523 0.990799 0.149685
54 0.218517 0.043541 0.981925 0.006646 0.678342
55 0.28613 0.000555 0.987053 0.015717 0.796457
56 0.562355 0.134782 0.999911 0.490382 0.000024
57 0.019547 0.97754 0.025366 0.990619 0.066309
58 0.919308 0.000353 0.015782 0.927302 0.010914
59 0.000365 0.992809 0.250624 0.979065 0.09733
60 0.046404 0.984467 0.083057 0.98395 0.064206
61 0.08891 0.946161 0.000892 0.99213 0.142431
62 0.010496 0.316677 0.991722 0.141003 0.976993
63 0.058475 0.991264 0.27771 0.974653 0.111869
64 0.986898 0.056324 0.058217 0.561223 0.000421
65 0.023354 0.890937 0.026553 0.942242 0.008934
66 0.024006 0.860319 0.025356 0.01251 0.943572
Journal of Integrative Bioinformatics, 13(2):286, 2016 http://journal.imbio.de/
doi:10.2390/biecoll-jib-2016-286 15
Cop
yrig
ht20
16T
heA
utho
r(s)
.Pub
lishe
dby
Jour
nalo
fInt
egra
tive
Bio
info
rmat
ics.
Thi
sar
ticle
islic
ense
dun
dera
Cre
ativ
eC
omm
ons
Attr
ibut
ion-
Non
Com
mer
cial
-NoD
eriv
s3.
0U
npor
ted
Lic
ense
(http
://cr
eativ
ecom
mon
s.or
g/lic
ense
s/by
-nc-
nd/3
.0/)
.