Embed Size (px)
Citation preview
7/29/2019 Feature Selection in Gene Expression
http://slidepdf.com/reader/full/feature-selection-in-gene-expression 1/14
A Survey on Filter Techniques for FeatureSelection in Gene Expression
Microarray AnalysisCosmin Lazar, Jonatan Taminau, Stijn Meganck, David Steenhoff, Alain Coletta, Colin Molter,
Virginie de Schaetzen, Robin Duque, Hugues Bersini, and Ann Nowe
Abstract—A plenitude of feature selection (FS) methods is available in the literature, most of them rising as a need to analyze data of
very high dimension, usually hundreds or thousands of variables. Such data sets are now available in various application areas like
combinatorial chemistry, text mining, multivariate imaging, or bioinformatics. As a general accepted rule, these methods are grouped in
filters, wrappers, and embedded methods. More recently, a new group of methods has been added in the general framework of FS:
ensemble techniques. The focus in this survey is on filter feature selection methods for informative feature discovery in gene
expression microarray (GEM) analysis, which is also known as differentially expressed genes (DEGs ) discovery, gene prioritization, or
biomarker discovery. We present them in a unified framework, using standardized notations in order to reveal their technical details
and to highlight their common characteristics as well as their particularities.
Index Terms—Feature selection, information filters, gene ranking, biomarker discovery, gene prioritization, scoring functions,
statistical methods, gene expression data.
Ç
1 INTRODUCTION
GENE expression microarray (GEM) experiments aim toobtain valuable biological information by collecting
biological data from samples (e.g., tissues, cell lines).Recorded GEM data contain gene-wise information acrossall samples under investigation. In a single experiment,information about thousands of genes is measured andrecorded simultaneously. The samples under investigationcan be different from many perspectives (e.g., genotype,phenotype, or other biological or clinical relevant annota-tion). An important research topic in GEM data analysis isthe discovery of genes that are able to differentiate betweensamples originating from different populations or in moregeneral terms, genes which are relevant for a particulartarget annotation. These genes are called informative genes, biomarkers or differentially expressed genes (DEGs). Thediscovery of DEGs is valuable not only to physicians todiagnose patients but also to pharmaceutical companiesaiming to identify genes which can be targeted by drugs. Inthe last few years, a lot of effort has been put in thedevelopment of methodologies for DEGs discovery. The
problem is still challenging and new algorithms emerge asalternatives to the existing ones. The literature of FS forDEGs discovery is abundant. Despite the wide range of approaches proposed to solve this problem, many algo-rithms share common elements merely differing on detailsfrom each other. Our intention is to bring into light animportant family of methods (the filters) that are sometimesunfairly discarded to the benefit of more complicated FStechniques. We aim to provide a big picture over filtertechniques for DEGs discovery in a unified technicalframework in order to outline their common points as wellas their particularities.
The roadmap of this survey is as follows: in Section 2, theFS problem is described and filter methods are presented inthe framework of FS. Section 3 provides the big picture of filter methods in an extended taxonomy inspired from [1].Two big groups of filters are revealed here: ranking andspace search methods. They will be further described in
details as follows: Section 4 generally describes the rankingstrategy for FS focusing on two main points: the scoringfunctions used to assign relevance indices to genes and theproblem of statistical significance of the estimated scores,while Section 5 is dedicated to the space search strategy. InSection 6, we focus on the evaluation of FS results and wepresent several evaluation strategies, while in Section 7 weprovide the reader with some comments and recommenda-tions which could help in choosing the appropriatemethods or for comparison purposes. The last section isdedicated to authors’ concluding remarks.
2 PROBLEM STATEMENT
The problem can be stated as follows: let us consider aGEM study where biological data from a population of
1106 IEEE/ACM TRANSACTIONS ON COMPUTATIONAL BIOLOGY AND BIOINFORMATICS, VOL. 9, NO. 4, JULY/AUGUST 2012
. C. Lazar, J. Taminau, S. Meganck, D. Steenhoff, and A. Nowe are with AI lab, Computational Modeling Group, Department of Computer Science,Vrije Universiteit Brussel, Pleinlaan 2, Brussels 1050, Belgium.E-mail: {vlazar, jtaminau, smeganck, David.Steenhoff,ann.nowe}@vub.ac.be.
. A. Coletta, C. Molter, V. de Schaetzen, and R. Duque are with Universite Libre de Bruxelles, Building C, 5th floor, Room C5.329, 87 av. AdolpheBuyl, Brussels B-1050, Belgium. E-mail: {alaincoletta,colin.molter}@gmail.com, [email protected], [email protected].
. H. Bersini is with IRIDIA—Universite Libre de Bruxelles, CP 194/6-50,av. Franklin Roosevelt, Bruxelles 1050, Belgium. E-mail: [email protected].
Manuscript received 29 June 2011; revised 23 Jan. 2012; accepted 1 Feb. 2012; published online 13 Feb. 2012.For information on obtaining reprints of this article, please send e-mail to:[email protected], and reference IEEECS Log Number TCBB-2011-06-0163.Digital Object Identifier no. 10.1109/TCBB.2012.33.
1545-5963/12/$31.00 ß 2012 IEEE Published by the IEEE CS, CI, and EMB Societies & the ACM
7/29/2019 Feature Selection in Gene Expression
http://slidepdf.com/reader/full/feature-selection-in-gene-expression 2/14
samples are collected. The output of the study is recordedas a matrix (called gene expression data matrix) X mÂn ¼fxi;jg containing the expression of m features/genes acrossn samples, where xi;j is the expression level of gene i insample j and m ) n. Here we emphasize on the fact thatgene expression data matrix X is obtained through acomplex process where in the first instance raw, probe-leveldata are collected. Consequently, gene expression data arederived through a series of preprocessing steps including background correction, log-transformation, normalization,and summarization and further analysis is performed onthe preprocessed data. However, a discussion upon thesepreprocessing methods is beyond the scope of this paper.
Besides gene expression data, metainformation (typicallyclinical or biological annotations) is also collected duringmicroarray experiments. These annotations usually containinformation about the patients but also information abouttissue genotype or phenotype, type or time of treatment, etc.Hence, they map either to categorical or to continuousvariables. Typical applications on GEM data are disease
prediction, disease discovery [2], or reconstruction of generegulatory networks from gene expression data [3]. Solutions tothese problems demand for machine learning techniquessuch as supervised classification, clustering, and regression.The direct application of these methods on high-dimensionaldata is usually inefficient [4]. Therefore, it is desirable toselect a small subset of features/genes that is discriminativeamong the subgroups of samples denoted by a targetannotation. As mentioned in the introduction, these genesare called informative genes or differentially expressed genes.
As a generic definition, FS consists in identifying the setof features/genes whose expression levels are indicative of a particular target feature (clinical/biological annotation).In mathematical terms, this problem can be stated asfollows: let X mÂn ¼ fxi;jg be a matrix containing m genesand n samples originating from different groups denoted bya target annotation (e.g., different phenotypes), X mÂn ¼½X
mÂn1
1 X mÂn2
2 . . .X mÂn p
p where each matrix X mÂni
i containssamples from the same group and n1 þ n2 þ . . .n p ¼ n.Selecting the most informative genes consists in identifyingthe subset of genes across the entire population of samplesS kÂn 2 X mÂn, k ( m which is the most discriminative forthe outlined classes. This definition is only valid forclassification problems where the groups are clearlyidentified beforehand (e.g., disease prediction).
Different strategies have been proposed over the lastyears for feature/gene selection: filter, wrapper, embedded[1], and more recently ensemble techniques [5].
Filter techniques assess the discriminative power of features based only on intrinsic properties of the data. As ageneral rule, these methods estimate a relevance score and athreshold scheme is used to select the best-scoring features/genes. Filter techniques are not necessarily used to buildpredictors. As stated in [6], DEGs may also be goodcandidates for genes which can be targeted by drugs. Thisgroup of techniques is independent of any classificationscheme but under particular conditions they could give the
optimal setof features fora given classifier. Saeys et al.[1] alsostress on the practical advantages of these methods statingthat “even when the subset of features is not optimal, they may be preferable due to their computational and statistical scalability.”
Wrapper techniques select the most discriminant subsetof features by minimizing the prediction error of aparticular classifier. These methods are dependent on theclassifier being used and they are mainly criticized becauseof their huge computational demands. More than that, thereis no guarantee that the solution provided will be optimal if another classifier is used for prediction.
Embedded techniques represent a different class of methods in the sense that they still allow interactions with
the learning algorithm but the computational time issmaller than wrapper methods.Ensemble techniques represent a relatively new class of
methods for FS. They have been proposed to cope with theinstability issues observed in many techniques for FS whensmall perturbations in the training set occur. These methodsare based on different subsampling strategies. A particularFS method is run on a number of subsamples and theobtained features/genes are merged into a more stablesubset [7].
So far we briefly described the topic of FS but the rest of thepaper is entirely dedicated to filter methods for DEGsdiscovery in GEM analysis. Here we stress on the advantageof filters over wrappers or embedded methods which is theirindependence of classifiers. This particular characteristic of filters avoids all influenceof classifier’s bias in theFS process.
3 FILTER METHODS FOR FS: A PROPOSED
TAXONOMY
Building a taxonomy is not a trivial task and moreover, ataxonomy is not unique. Based on the literature reviewedfor this paper we propose a taxonomy of filter FS methodsfor informative genes discovery. As a general observation,two different filter strategies can be identified while
surveying the literature. According to the first strategy,one selects features/genes which are top ranked accordingto some relevance indices estimated with a predefinedscoring function. According to the second strategy, featuresare selected by optimizing a particular cost function whichis often defined as a tradeoff between the maximuminformativeness and minimum redundancy inside theselected subgroup of features/genes. In the following, wewill refer to methods built upon the first strategy as rankingmethods while those built upon the second strategy will bereferred to as space search methods.
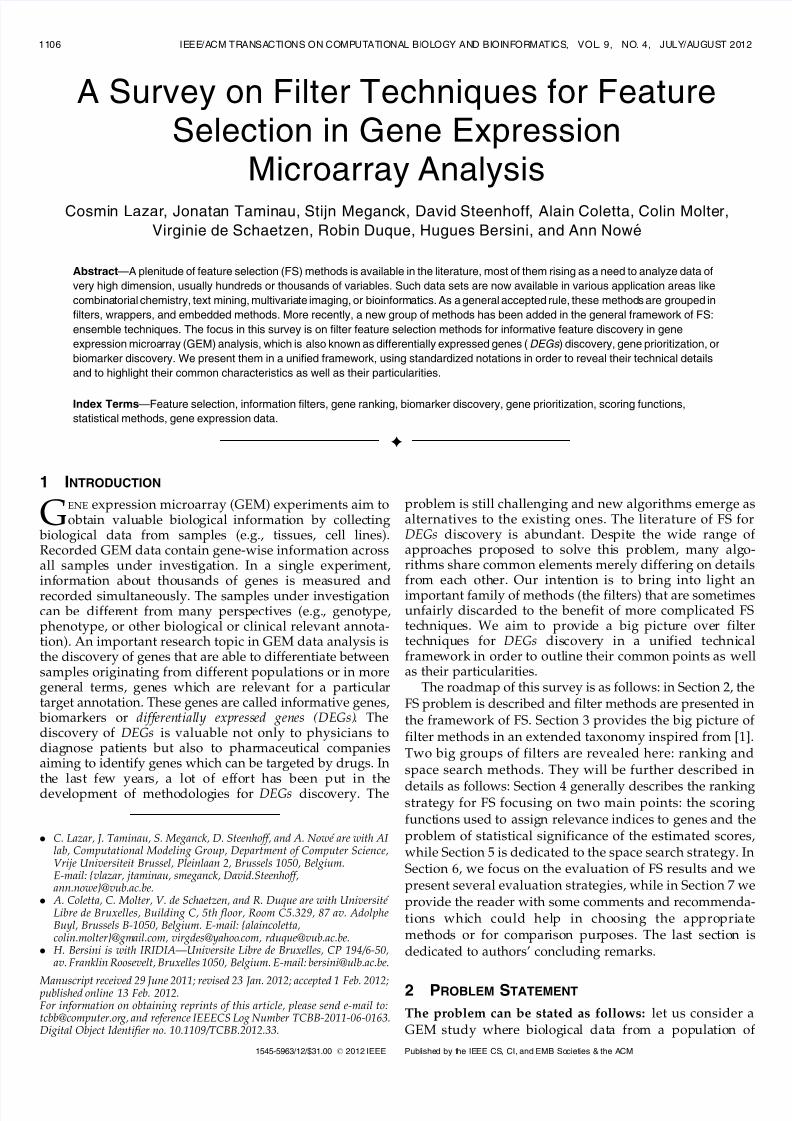
Our proposed taxonomy (Fig. 1) has many common
points with the one presented in [1]. The main differenceconsists in the fact that on the top level we grouped thefilter methods in ranking and space search methods,according to the strategy used to select features. On the
LAZAR ET AL.: A SURVEY ON FILTER TECHNIQUES FOR FEATURE SELECTION IN GENE EXPRESSION MICROARRAY ANALYSIS 1107
Fig. 1. Proposed taxonomy for filter FS methods.
7/29/2019 Feature Selection in Gene Expression
http://slidepdf.com/reader/full/feature-selection-in-gene-expression 3/14
level below, ranking methods are grouped in univariate and
bivariate while the space search methods are all multi-
variate. Subsequently, depending on the parametric as-
sumption used, the univariate methods are split into
parametric and nonparametric while bivariate methods can
be greedy or all-pair methods depending on the strategy used
for ranking. The next two sections are dedicated to a
synthetic description of the two main classes of filters:ranking and space search methods.
As the biggest part of the reviewed literature for thispaper focuses mainly on DEGs discovery for diseaseprediction, the methods designed for classification pro- blems will have a bigger weight compared with thosedesigned for regression, mainly applied to infer networksfrom gene expression data [8]. We’ll briefly point out thedistinction between these methods in Section 7.
4 FILTER METHODS—A RANKING APPROACH
Most filter methods consider the problem of FS as a rankingproblem. The solution is provided by selecting the top
scoring features/genes while the rest are discarded. Gen-
erally these methods follow a typical scenario described
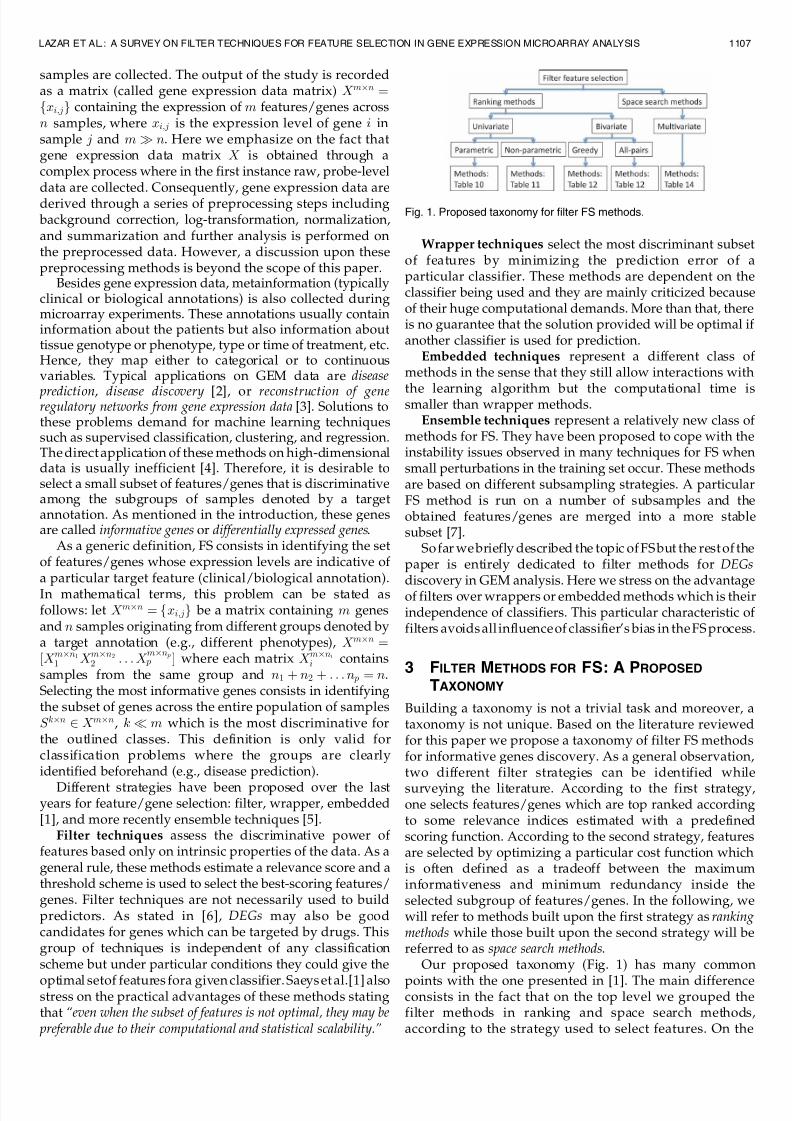
below and pictured in Fig. 2.
1. Use a scoring function S ðxÞ to quantify the differencein expression between different groups of samplesand rank features/genes in decreasing order of theestimated scores. It is supposed that a high score isindicative for a DEG.
2. Estimate the statistical significance (e.g., p-value,
confidence intervals) of the estimated scores.3. Select the top ranked features/genes which are statisti-cally significant as the most informative features/genes (alternatively one could be interested inselecting the top ranked features/genes only asopposed to the top ranked significant ones).
4. Validate the selected subset of genes (see Section 5).
In the above-mentioned generic algorithm one can identify
two aspects specific to this type of methods which play an
important role in identifying informative features/genes:
first, the choice of a scoring function to compute the
relevance indices (or scores) and second, the assignment of
statistical significance to computed scores. They will receivefurther consideration in order to be able to reveal the main
differences between different methods and therefore help-
ing to categorize them.
As an additional remark, the reader should note that
ranked lists of features/genes can also be obtained via
wrapper/embedded methods not only for filters, e.g., SVM
Recursive Feature Elimination (SVMRFE) [9] or Greedy
Least Square Regression [10].Here we also outline the fact that any combination of a
scoring function and a statistical significance test designed
to quantify the relevance of a feature/gene for a target
annotation can be transformed into a ranking method for
FS. Since all steps in the generic algorithm described above
are independent one from another, the users do have a lot of
freedom in the way they wish to perform the selection.
4.1 Scoring Functions—Assigning RelevanceIndices to Features
Scoring functions represent the core of ranking methods
and they are used to assign a relevance index to each
feature/gene. The relevance index actually quantifies the
difference in expression (or the informativeness) of a
particular feature/gene across the population of samples,
relative to a particular target annotation. Various scoring
functions are reviewed and categorized here. They cover a
wide range of the literature proposed for DEGs or
biomarkers discovery. The scoring functions are enumer-
ated and categorized according to their syntactic simila-
rities. A similar approach presenting a very comprehensive
survey on distance measures between probability density
functions has been employed in [11].Several groups of scoring functions for gene ranking
have been identified. In the first group, we gathered scoring
functions which estimate an average rank of genes across allsamples. Scoring functions from the second group quantify
the divergence (or the distance) between the distribution of
samples corresponding to different classes associated to a
target annotation per feature/gene as a function f ðx1; x2Þ.
The third group contains information theory-based scoring
functions while the fourth group measures the degree of
association between genes and a target annotation as a
function f ðx; cÞ where x and c described in Table 1. The last
group gathers a list of miscellaneous scoring functions
which cannot be included in the previous four.
The big majority of scoring functions presented here areusually defined to rank single genes but some of them can
be easily adapted for pairs or groups of genes. In this
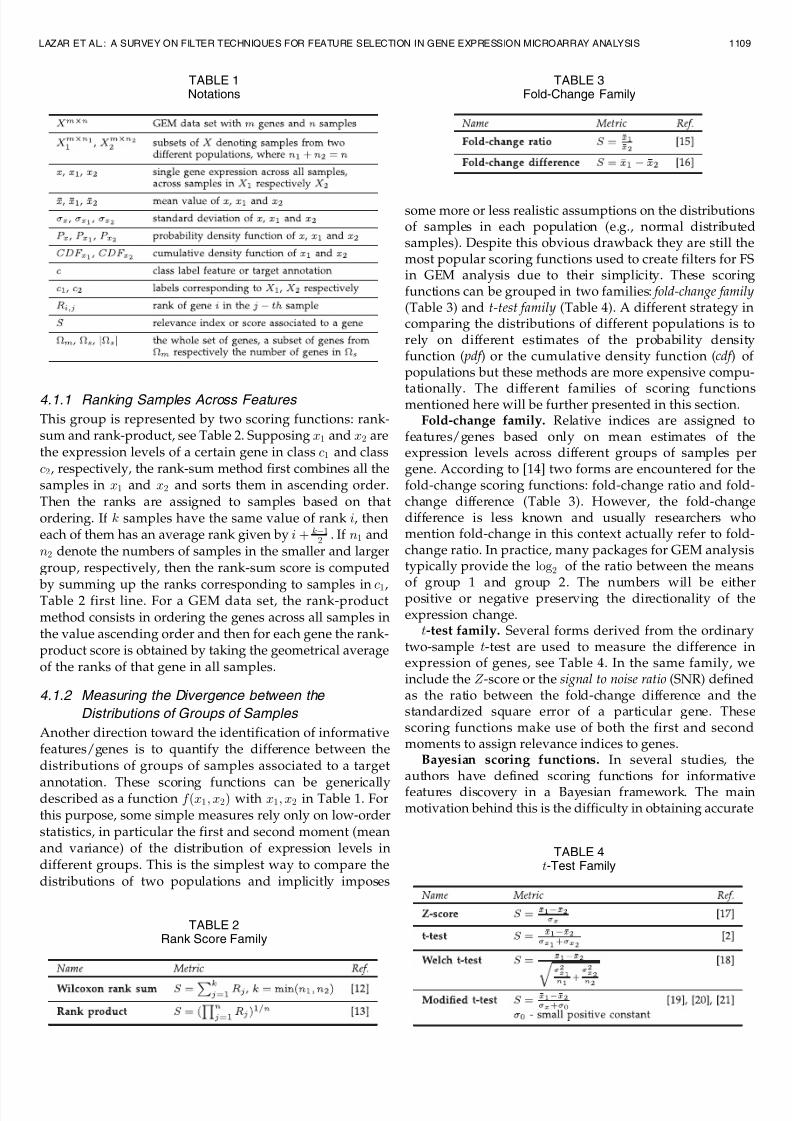
section, the notations in Table 1 will be used.
1108 IEEE/ACM TRANSACTIONS ON COMPUTATIONAL BIOLOGY AND BIOINFORMATICS, VOL. 9, NO. 4, JULY/AUGUST 2012
Fig. 2. Illustration of filter ranking methods. Main steps of univariate ranking methods for filter FS. A case study for GEM analysis.
7/29/2019 Feature Selection in Gene Expression
http://slidepdf.com/reader/full/feature-selection-in-gene-expression 4/14
4.1.1 Ranking Samples Across Features
This group is represented by two scoring functions: rank-sum and rank-product, see Table 2. Supposing x1 and x2 arethe expression levels of a certain gene in class c1 and classc2, respectively, the rank-sum method first combines all thesamples in x1 and x2 and sorts them in ascending order.Then the ranks are assigned to samples based on thatordering. If k samples have the same value of rank i, theneach of them has an average rank given by i þ kÀ1
2. If n1 and
n2 denote the numbers of samples in the smaller and largergroup, respectively, then the rank-sum score is computed
by summing up the ranks corresponding to samples in c1,Table 2 first line. For a GEM data set, the rank-productmethod consists in ordering the genes across all samples inthe value ascending order and then for each gene the rank-product score is obtained by taking the geometrical averageof the ranks of that gene in all samples.
4.1.2 Measuring the Divergence between the
Distributions of Groups of Samples
Another direction toward the identification of informativefeatures/genes is to quantify the difference between thedistributions of groups of samples associated to a target
annotation. These scoring functions can be genericallydescribed as a function f ðx1; x2Þ with x1; x2 in Table 1. Forthis purpose, some simple measures rely only on low-orderstatistics, in particular the first and second moment (meanand variance) of the distribution of expression levels indifferent groups. This is the simplest way to compare thedistributions of two populations and implicitly imposes
some more or less realistic assumptions on the distributionsof samples in each population (e.g., normal distributedsamples). Despite this obvious drawback they are still themost popular scoring functions used to create filters for FSin GEM analysis due to their simplicity. These scoringfunctions can be grouped in two families: fold-change family(Table 3) and t-test family (Table 4). A different strategy incomparing the distributions of different populations is torely on different estimates of the probability densityfunction ( pdf ) or the cumulative density function (cdf ) of populations but these methods are more expensive compu-
tationally. The different families of scoring functionsmentioned here will be further presented in this section.Fold-change family. Relative indices are assigned to
features/genes based only on mean estimates of theexpression levels across different groups of samples pergene. According to [14] two forms are encountered for thefold-change scoring functions: fold-change ratio and fold-change difference (Table 3). However, the fold-changedifference is less known and usually researchers whomention fold-change in this context actually refer to fold-change ratio. In practice, many packages for GEM analysistypically provide the log2 of the ratio between the means
of group 1 and group 2. The numbers will be eitherpositive or negative preserving the directionality of theexpression change.
t-test family. Several forms derived from the ordinarytwo-sample t-test are used to measure the difference inexpression of genes, see Table 4. In the same family, weinclude the Z -score or the signal to noise ratio (SNR) definedas the ratio between the fold-change difference and thestandardized square error of a particular gene. Thesescoring functions make use of both the first and secondmoments to assign relevance indices to genes.
Bayesian scoring functions. In several studies, theauthors have defined scoring functions for informativefeatures discovery in a Bayesian framework. The mainmotivation behind this is the difficulty in obtaining accurate
LAZAR ET AL.: A SURVEY ON FILTER TECHNIQUES FOR FEATURE SELECTION IN GENE EXPRESSION MICROARRAY ANALYSIS 1109
TABLE 2Rank Score Family
TABLE 3Fold-Change Family
TABLE 4t-Test Family
TABLE 1Notations
7/29/2019 Feature Selection in Gene Expression
http://slidepdf.com/reader/full/feature-selection-in-gene-expression 5/14
estimates of the standard deviation of individual genes
based on few measurements only. In order to cope with the
weak empirical estimation of variance across a single
feature/gene, several authors proposed more robust esti-
mations of the variance by adding genes with similar
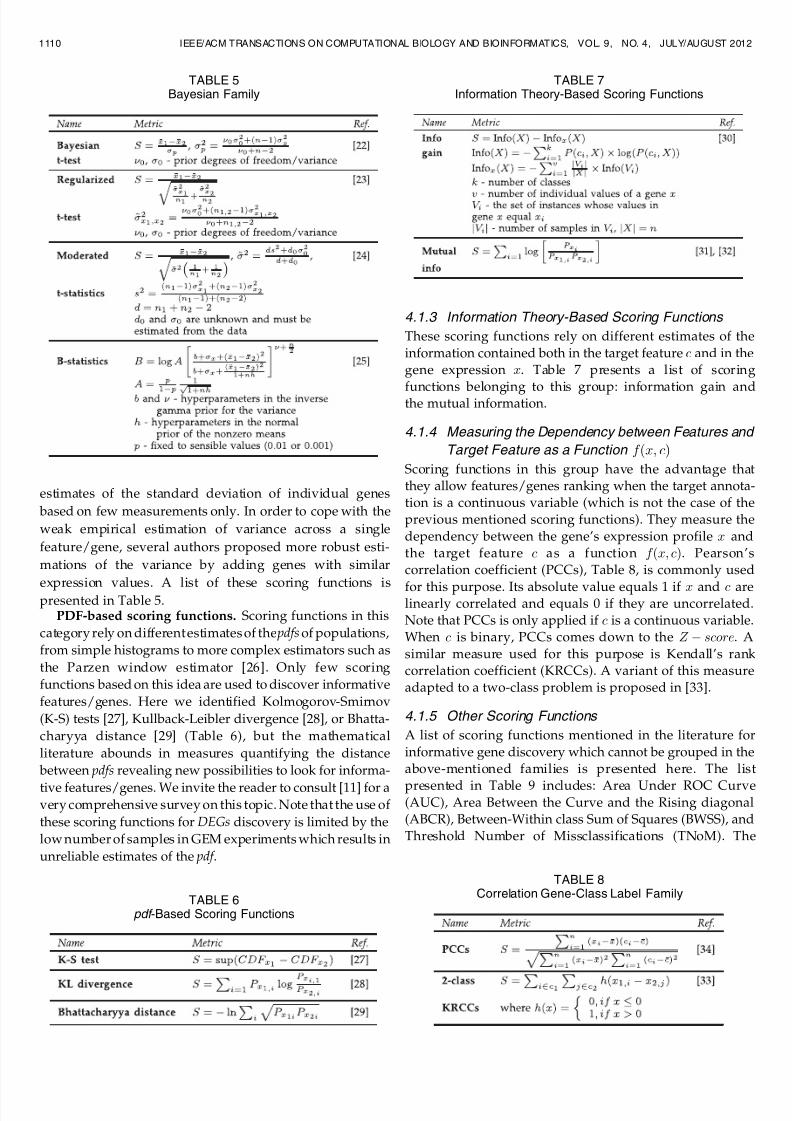
expression values. A list of these scoring functions ispresented in Table 5.PDF-based scoring functions. Scoring functions in this
category rely on different estimates of the pdfs of populations,
from simple histograms to more complex estimators such as
the Parzen window estimator [26]. Only few scoring
functions based on this idea are used to discover informative
features/genes. Here we identified Kolmogorov-Smirnov
(K-S) tests [27], Kullback-Leibler divergence [28], or Bhatta-
charyya distance [29] (Table 6), but the mathematical
literature abounds in measures quantifying the distance
between pdfs revealing new possibilities to look for informa-
tive features/genes. We invite the reader to consult [11] for avery comprehensive survey on this topic. Note that the use of
these scoring functions for DEGs discovery is limited by the
low number of samples in GEM experiments which results in
unreliable estimates of the pdf .
4.1.3 Information Theory-Based Scoring Functions
These scoring functions rely on different estimates of the
information contained both in the target feature c and in thegene expression x. Table 7 presents a list of scoring
functions belonging to this group: information gain andthe mutual information.
4.1.4 Measuring the Dependency between Features and
Target Feature as a Function f ðx; cÞ
Scoring functions in this group have the advantage thatthey allow features/genes ranking when the target annota-tion is a continuous variable (which is not the case of theprevious mentioned scoring functions). They measure the
dependency between the gene’s expression profile x andthe target feature c as a function f ðx; cÞ. Pearson’scorrelation coefficient (PCCs), Table 8, is commonly used
for this purpose. Its absolute value equals 1 if x and c arelinearly correlated and equals 0 if they are uncorrelated.Note that PCCs is only applied if c is a continuous variable.When c is binary, PCCs comes down to the Z À score. A
similar measure used for this purpose is Kendall’s rankcorrelation coefficient (KRCCs). A variant of this measureadapted to a two-class problem is proposed in [33].
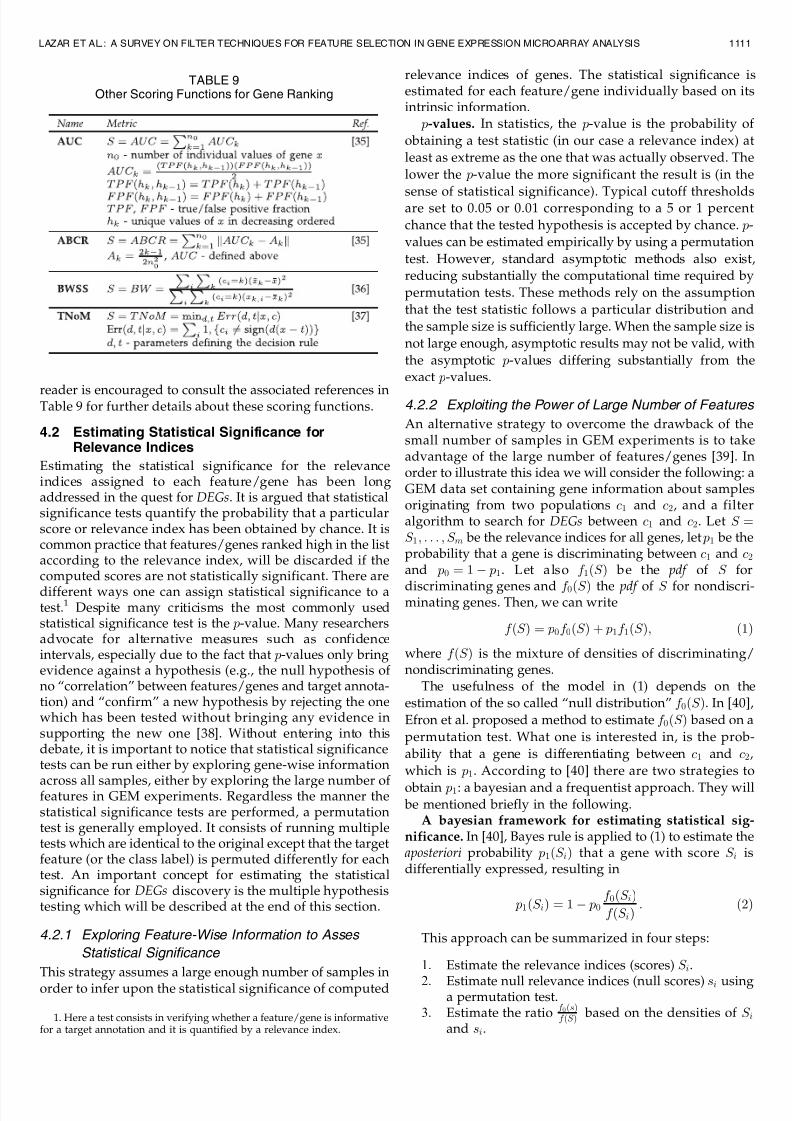
4.1.5 Other Scoring Functions
A list of scoring functions mentioned in the literature for
informative gene discovery which cannot be grouped in theabove-mentioned families is presented here. The list
presented in Table 9 includes: Area Under ROC Curve(AUC), Area Between the Curve and the Rising diagonal(ABCR), Between-Within class Sum of Squares (BWSS), andThreshold Number of Missclassifications (TNoM). The
1110 IEEE/ACM TRANSACTIONS ON COMPUTATIONAL BIOLOGY AND BIOINFORMATICS, VOL. 9, NO. 4, JULY/AUGUST 2012
TABLE 6pdf -Based Scoring Functions
TABLE 7Information Theory-Based Scoring Functions
TABLE 8Correlation Gene-Class Label Family
TABLE 5Bayesian Family
7/29/2019 Feature Selection in Gene Expression
http://slidepdf.com/reader/full/feature-selection-in-gene-expression 6/14
reader is encouraged to consult the associated references inTable 9 for further details about these scoring functions.
4.2 Estimating Statistical Significance forRelevance Indices
Estimating the statistical significance for the relevanceindices assigned to each feature/gene has been longaddressed in the quest for DEGs. It is argued that statisticalsignificance tests quantify the probability that a particularscore or relevance index has been obtained by chance. It iscommon practice that features/genes ranked high in the listaccording to the relevance index, will be discarded if thecomputed scores are not statistically significant. There are
different ways one can assign statistical significance to atest.1 Despite many criticisms the most commonly usedstatistical significance test is the p-value. Many researchersadvocate for alternative measures such as confidenceintervals, especially due to the fact that p-values only bringevidence against a hypothesis (e.g., the null hypothesis of no “correlation” between features/genes and target annota-tion) and “confirm” a new hypothesis by rejecting the onewhich has been tested without bringing any evidence insupporting the new one [38]. Without entering into thisdebate, it is important to notice that statistical significancetests can be run either by exploring gene-wise information
across all samples, either by exploring the large number of features in GEM experiments. Regardless the manner thestatistical significance tests are performed, a permutationtest is generally employed. It consists of running multipletests which are identical to the original except that the targetfeature (or the class label) is permuted differently for eachtest. An important concept for estimating the statisticalsignificance for DEGs discovery is the multiple hypothesistesting which will be described at the end of this section.
4.2.1 Exploring Feature-Wise Information to Asses
Statistical Significance
This strategy assumes a large enough number of samples inorder to infer upon the statistical significance of computed
relevance indices of genes. The statistical significance isestimated for each feature/gene individually based on itsintrinsic information.
p-values. In statistics, the p-value is the probability of
obtaining a test statistic (in our case a relevance index) at
least as extreme as the one that was actually observed. The
lower the p-value the more significant the result is (in the
sense of statistical significance). Typical cutoff thresholdsare set to 0.05 or 0.01 corresponding to a 5 or 1 percent
chance that the tested hypothesis is accepted by chance. p-
values can be estimated empirically by using a permutation
test. However, standard asymptotic methods also exist,reducing substantially the computational time required by
permutation tests. These methods rely on the assumption
that the test statistic follows a particular distribution and
the sample size is sufficiently large. When the sample size is
not large enough, asymptotic results may not be valid, with
the asymptotic p-values differing substantially from theexact p-values.
4.2.2 Exploiting the Power of Large Number of Features
An alternative strategy to overcome the drawback of thesmall number of samples in GEM experiments is to takeadvantage of the large number of features/genes [39]. Inorder to illustrate this idea we will consider the following: aGEM data set containing gene information about samplesoriginating from two populations c1 and c2, and a filteralgorithm to search for DEGs between c1 and c2. Let S ¼S 1; . . . ; S m be the relevance indices for all genes, let p1 be theprobability that a gene is discriminating between c1 and c2and p0 ¼ 1 À p1. Let also f 1ðS Þ be the pdf of S for
discriminating genes and f 0ðS Þ the pdf of S for nondiscri-minating genes. Then, we can write
f ðS Þ ¼ p0f 0ðS Þ þ p1f 1ðS Þ; ð1Þ
where f ðS Þ is the mixture of densities of discriminating/nondiscriminating genes.
The usefulness of the model in (1) depends on theestimation of the so called “null distribution” f 0ðS Þ. In [40],
Efron et al. proposed a method to estimate f 0ðS Þ based on a
permutation test. What one is interested in, is the prob-
ability that a gene is differentiating between c1 and c2,
which is p1. According to [40] there are two strategies to
obtain p1: a bayesian and a frequentist approach. They will be mentioned briefly in the following.
A bayesian framework for estimating statistical sig-nificance. In [40], Bayes rule is applied to (1) to estimate theaposteriori probability p1ðS iÞ that a gene with score S i isdifferentially expressed, resulting in
p1ðS iÞ ¼ 1 À p0f 0ðS iÞ
f ðS iÞ: ð2Þ
This approach can be summarized in four steps:
1. Estimate the relevance indices (scores) S i.
2. Estimate null relevance indices (null scores) si usinga permutation test.
3. Estimate the ratio f 0ðsÞf ðS Þ based on the densities of S i
and si.
LAZAR ET AL.: A SURVEY ON FILTER TECHNIQUES FOR FEATURE SELECTION IN GENE EXPRESSION MICROARRAY ANALYSIS 1111
TABLE 9Other Scoring Functions for Gene Ranking
1. Here a test consists in verifying whether a feature/gene is informativefor a target annotation and it is quantified by a relevance index.
7/29/2019 Feature Selection in Gene Expression
http://slidepdf.com/reader/full/feature-selection-in-gene-expression 7/14
4. Estimate the lower bound for p1 according to
p1 ! 1 À minS
f ðS Þ
f 0ðS Þ: ð3Þ
A frequentist framework. This approach relies on direct
estimates of f 0 and f and it can be summarized as follows:
1. Estimate the relevance indices (scores) S i.2. Estimate null relevance indices (null scores) si using
a permutation test.3. Expected null relevance indices are computed
according to
siðbÞ ¼1
B
XB
b¼1
siðbÞ; ð4Þ
where B is the total number of permutations.4. Plot points ðsi; S iÞ.5. For several threshold values t, estimate the number
of true and false positives (TP, respectively, FP).6. (Optional) Estimate the false discovery rate (FDR)
for increasing values of t.
4.2.3 Multiple Hypothesis Testing Approach
The study of Dudoit et al. [41] was the first work describing
the multiple hypothesis testing for GEM experiments in a
statistical framework. In the context of DEGs discovery,
multiple hypothesis testing is seen as simultaneously testing
for each gene the null hypothesis of no association between theexpression level and the responses or target features [41].
According to them, any test can result in two type of
errors: false positive or Type I errors and false negative or
Type II errors. Multiple hypothesis testing procedures aim
to provide statistically significant results by controlling the
incidence rate of these errors. In other words, provide a way
of setting appropriate thresholds in declaring a result
statistically significant. The most popular methods for
multiple hypothesis testing focus on controlling Type I
error rate. This is done by imposing a certain threshold for
the Type I error rate and then applying a method toproduce a list of rejected hypothesis until the error rate is
less than or equal with the specified threshold. Well-known
methods for multiple hypothesis testing are as follows.
p-value with Bonferroni correction is an improvedversion of the classical p-value and consists in increasingthe statistical threshold for declaring a gene significant bydividing the desired significance with the number of statistical tests performed [17].
False discovery rate (FDR) is a recent alternative forsignificance testing and has been proposed as an extensionof the concept of p-values [42]. The FDR is defined asF DR ¼ E ½F
G, where F is the number of false positive genesand G is the number of genes found as being significant. Inorder to overcome the situations where FDR is not defined(when G ¼ 0), Storey [43] proposed a modified version of the FDR called positive false discovery rate (pFDR) definedas pFDR ¼ E ½F
G jðG > 0Þ.A less accurate alternative to the FDR for significance
testing is the family-wise error rate (FWER) which isdefined as the probability of at least one truly insignificantfeature to be called significant.
q -value is an extension of FDR which has been proposedto answer the need of assigning a statistical significancescore to each gene in the same way that the p-value does[44]. The q -value is defined as being the minimum pFDR atwhich a test may be called significant. The reader should beaware that the q -value can be defined either in terms of theoriginal statistics or in terms of the p-values, see [43].
4.3 Ranking Methods for FS—Examples
In this section, we discuss and review ranking methods for
FS by extending the taxonomy presented in Fig. 1.
4.3.1 Univariate Methods
According to [1], univariate methods for FS can be eitherparametric or nonparametric. Here, we provide a brief description of both groups.
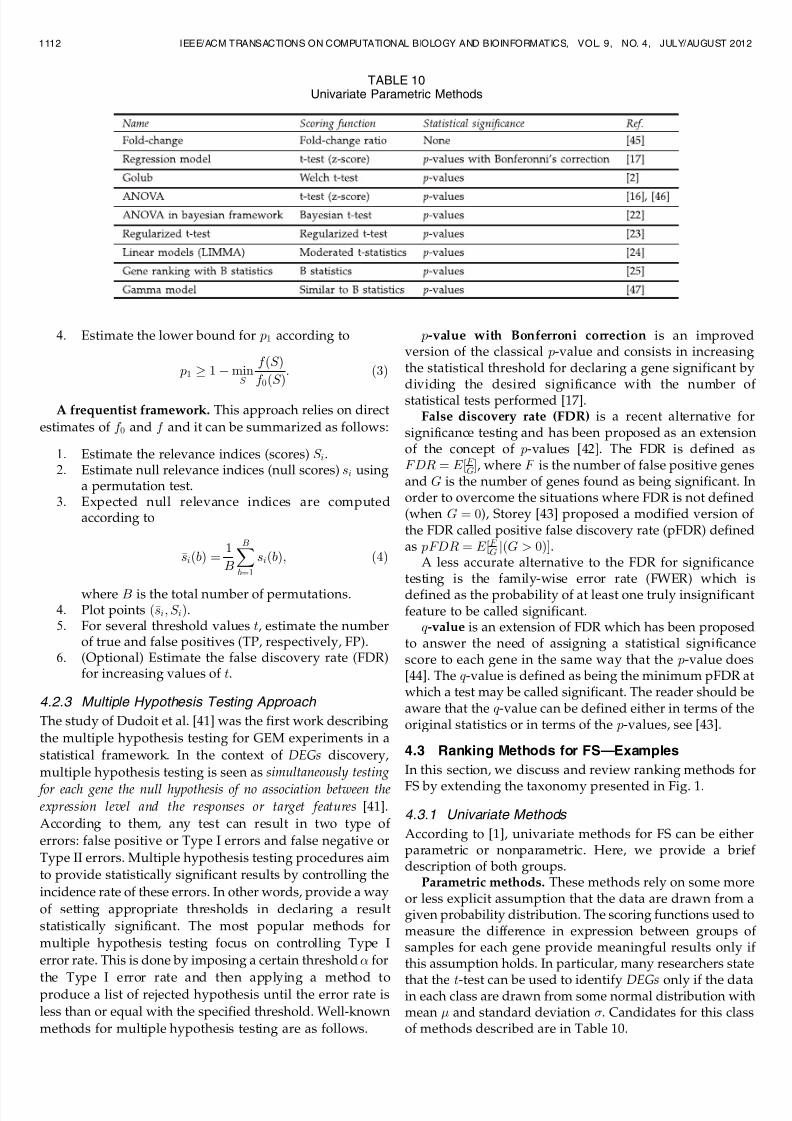
Parametric methods. These methods rely on some moreor less explicit assumption that the data are drawn from agiven probability distribution. The scoring functions used tomeasure the difference in expression between groups of samples for each gene provide meaningful results only if this assumption holds. In particular, many researchers state
that the t-test can be used to identify DEGs only if the datain each class are drawn from some normal distribution withmean and standard deviation . Candidates for this classof methods described are in Table 10.
1112 IEEE/ACM TRANSACTIONS ON COMPUTATIONAL BIOLOGY AND BIOINFORMATICS, VOL. 9, NO. 4, JULY/AUGUST 2012
TABLE 10Univariate Parametric Methods
7/29/2019 Feature Selection in Gene Expression
http://slidepdf.com/reader/full/feature-selection-in-gene-expression 8/14
Nonparametric methods. These methods assume bydefinition that the data are drawn from some unknowndistribution. The scoring functions used to quantify thedifference in expression between classes rely either on someestimates of the pdfs or on averaged ranks of genes or
samples. Obviously, these methods have a higher general-ization power but for most of them (especially those relyingon estimates of the pdfs), the computational cost is higher.
In [1], univariate nonparametric filter techniques are splitin two groups: pure model-free methods and methods based on random permutation associated to parametrictests. Pure model free methods use nonparametric scoringfunctions to assign a relevance index to each gene and thenthe statistical relevance of that index is estimated in terms of either p-value, FDR or q -value. Methods based on randompermutations associated with a parametric test takeadvantage on the large number of genes/features in order
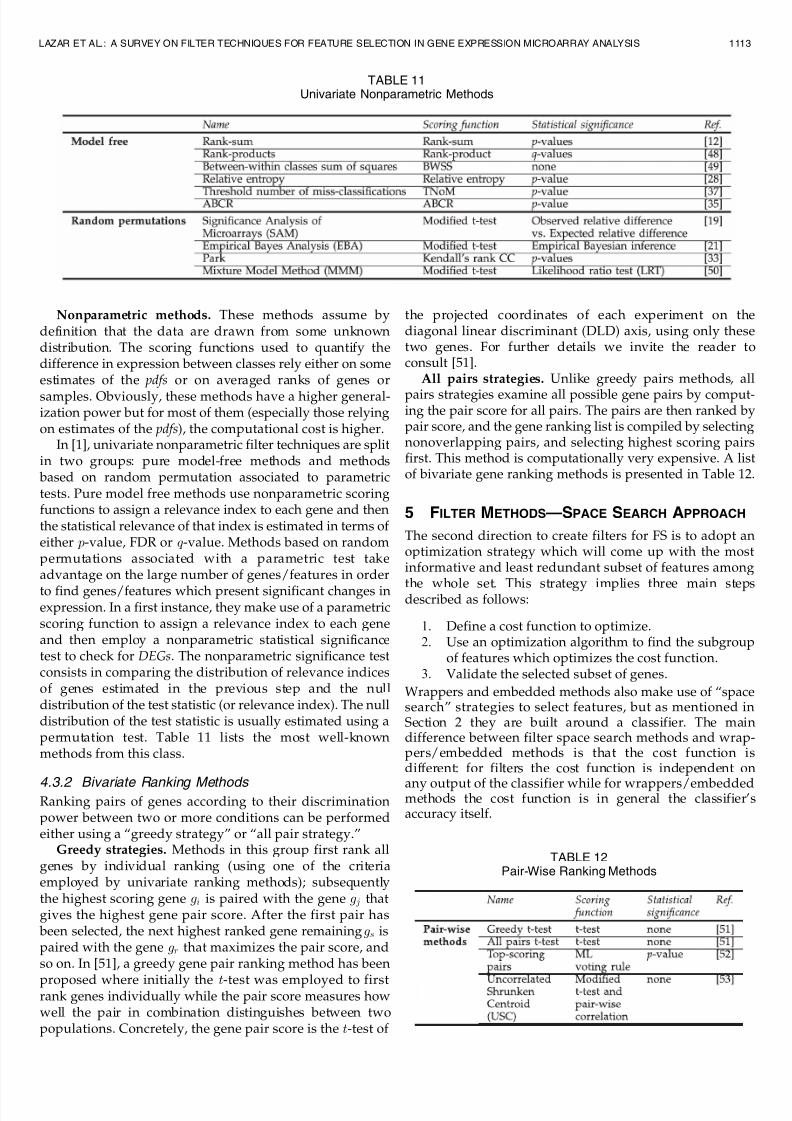
to find genes/features which present significant changes inexpression. In a first instance, they make use of a parametricscoring function to assign a relevance index to each geneand then employ a nonparametric statistical significancetest to check for DEGs. The nonparametric significance testconsists in comparing the distribution of relevance indicesof genes estimated in the previous step and the nulldistribution of the test statistic (or relevance index). The nulldistribution of the test statistic is usually estimated using apermutation test. Table 11 lists the most well-knownmethods from this class.
4.3.2 Bivariate Ranking Methods Ranking pairs of genes according to their discriminationpower between two or more conditions can be performedeither using a “greedy strategy” or “all pair strategy.”
Greedy strategies. Methods in this group first rank allgenes by individual ranking (using one of the criteriaemployed by univariate ranking methods); subsequentlythe highest scoring gene g i is paired with the gene g j thatgives the highest gene pair score. After the first pair has been selected, the next highest ranked gene remaining g s ispaired with the gene g r that maximizes the pair score, andso on. In [51], a greedy gene pair ranking method has been
proposed where initially the t-test was employed to firstrank genes individually while the pair score measures howwell the pair in combination distinguishes between twopopulations. Concretely, the gene pair score is the t-test of
the projected coordinates of each experiment on thediagonal linear discriminant (DLD) axis, using only thesetwo genes. For further details we invite the reader toconsult [51].
All pairs strategies. Unlike greedy pairs methods, all
pairs strategies examine all possible gene pairs by comput-ing the pair score for all pairs. The pairs are then ranked bypair score, and the gene ranking list is compiled by selectingnonoverlapping pairs, and selecting highest scoring pairsfirst. This method is computationally very expensive. A listof bivariate gene ranking methods is presented in Table 12.
5 FILTER METHODS—SPACE SEARCH APPROACH
The second direction to create filters for FS is to adopt anoptimization strategy which will come up with the mostinformative and least redundant subset of features among
the whole set. This strategy implies three main stepsdescribed as follows:
1. Define a cost function to optimize.2. Use an optimization algorithm to find the subgroup
of features which optimizes the cost function.3. Validate the selected subset of genes.
Wrappers and embedded methods also make use of “spacesearch” strategies to select features, but as mentioned inSection 2 they are built around a classifier. The maindifference between filter space search methods and wrap-pers/embedded methods is that the cost function isdifferent: for filters the cost function is independent on
any output of the classifier while for wrappers/embeddedmethods the cost function is in general the classifier’saccuracy itself.
LAZAR ET AL.: A SURVEY ON FILTER TECHNIQUES FOR FEATURE SELECTION IN GENE EXPRESSION MICROARRAY ANALYSIS 1113
TABLE 12Pair-Wise Ranking Methods
TABLE 11Univariate Nonparametric Methods
7/29/2019 Feature Selection in Gene Expression
http://slidepdf.com/reader/full/feature-selection-in-gene-expression 9/14
Methods using space search strategies are not asnumerous as the ranking methods and they are less popular,especially due to the optimization step which is oftencomputationally expensive. Following we will briefly referto Steps 1 and 2 in the generic algorithm mentioned above.
5.1 Objective Functions
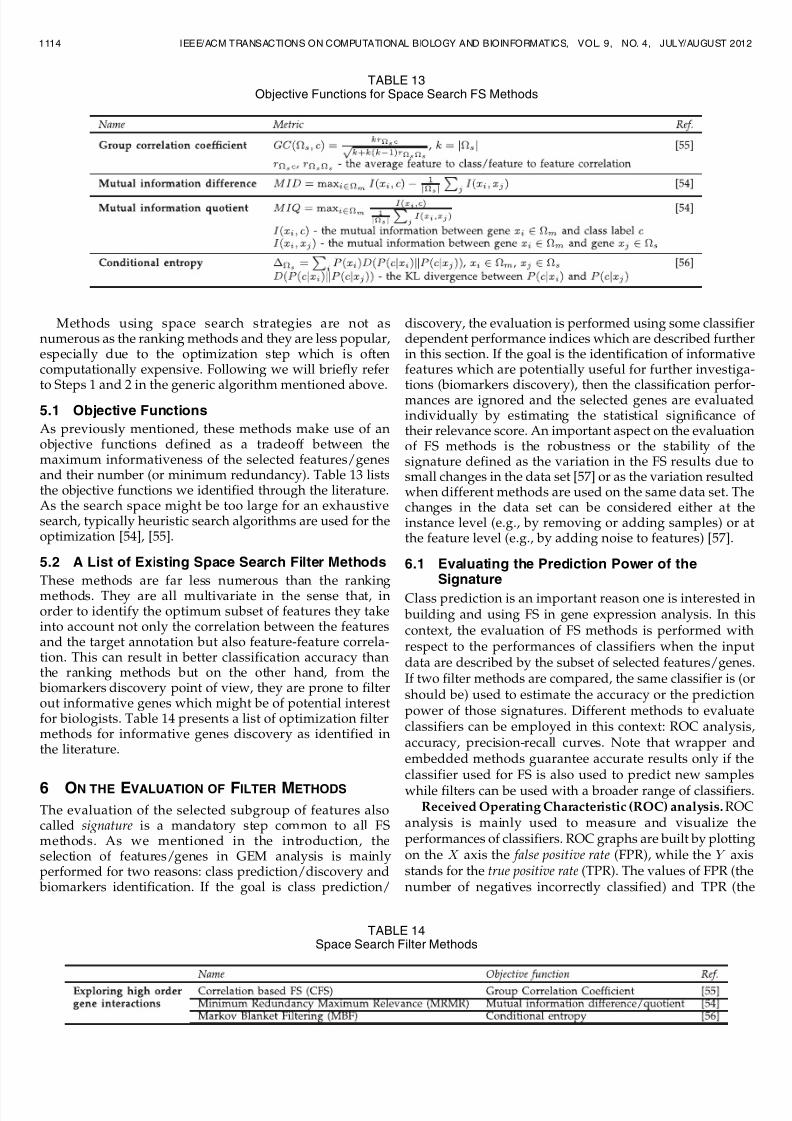
As previously mentioned, these methods make use of anobjective functions defined as a tradeoff between themaximum informativeness of the selected features/genesand their number (or minimum redundancy). Table 13 liststhe objective functions we identified through the literature.As the search space might be too large for an exhaustivesearch, typically heuristic search algorithms are used for theoptimization [54], [55].
5.2 A List of Existing Space Search Filter Methods
These methods are far less numerous than the rankingmethods. They are all multivariate in the sense that, inorder to identify the optimum subset of features they takeinto account not only the correlation between the featuresand the target annotation but also feature-feature correla-tion. This can result in better classification accuracy thanthe ranking methods but on the other hand, from the biomarkers discovery point of view, they are prone to filterout informative genes which might be of potential interestfor biologists. Table 14 presents a list of optimization filtermethods for informative genes discovery as identified inthe literature.
6 ON THE EVALUATION OF FILTER METHODS
The evaluation of the selected subgroup of features alsocalled signature is a mandatory step common to all FSmethods. As we mentioned in the introduction, theselection of features/genes in GEM analysis is mainlyperformed for two reasons: class prediction/discovery and biomarkers identification. If the goal is class prediction/
discovery, the evaluation is performed using some classifierdependent performance indices which are described furtherin this section. If the goal is the identification of informativefeatures which are potentially useful for further investiga-tions (biomarkers discovery), then the classification perfor-mances are ignored and the selected genes are evaluatedindividually by estimating the statistical significance of their relevance score. An important aspect on the evaluationof FS methods is the robustness or the stability of thesignature defined as the variation in the FS results due tosmall changes in the data set [57] or as the variation resultedwhen different methods are used on the same data set. Thechanges in the data set can be considered either at theinstance level (e.g., by removing or adding samples) or atthe feature level (e.g., by adding noise to features) [57].
6.1 Evaluating the Prediction Power of theSignature
Class prediction is an important reason one is interested in building and using FS in gene expression analysis. In thiscontext, the evaluation of FS methods is performed withrespect to the performances of classifiers when the inputdata are described by the subset of selected features/genes.If two filter methods are compared, the same classifier is (orshould be) used to estimate the accuracy or the predictionpower of those signatures. Different methods to evaluateclassifiers can be employed in this context: ROC analysis,accuracy, precision-recall curves. Note that wrapper andembedded methods guarantee accurate results only if theclassifier used for FS is also used to predict new sampleswhile filters can be used with a broader range of classifiers.
Received Operating Characteristic (ROC) analysis. ROCanalysis is mainly used to measure and visualize theperformances of classifiers. ROC graphs are built by plottingon the X axis the false positive rate (FPR), while the Y axisstands for the true positive rate (TPR). The values of FPR (thenumber of negatives incorrectly classified) and TPR (the
1114 IEEE/ACM TRANSACTIONS ON COMPUTATIONAL BIOLOGY AND BIOINFORMATICS, VOL. 9, NO. 4, JULY/AUGUST 2012
TABLE 14Space Search Filter Methods
TABLE 13Objective Functions for Space Search FS Methods

7/29/2019 Feature Selection in Gene Expression
http://slidepdf.com/reader/full/feature-selection-in-gene-expression 10/14
number of positives correctly classified) represent the outputof a classifier and they are defined by F P R ¼ NNIC
T NN and
T P R ¼ NPCC T NP
, where NNIC denotes the number of nega-tives incorrectly classified, NPCC the number of positivescorrectly classified while T NN and T NP denote the totalnumber of negatives and positives, respectively.
The terms sensitivity and specificity are often associated
with the ROC curves (sensitivity
¼T P R
andspecificity
¼1 À F P R). For more comprehensive texts on ROC analysis,we invite the reader to consult [58].
Note that Precision-Recall Curves (PRC) can be used as analternative to ROC curves for problems with unbalanceddata between classes [59]. PRC space is built by plotting onX axis the Recall which is the same as T P R, while Y axisstands for Precision which measures the fraction of samples classified as positive that are truly positive.
Prediction power or accuracy. In contrast to ROCanalysis, the prediction power or the accuracy is designedto quantify the performances of classifiers in a number. Theclassification accuracy is typically expressed in percentageas accuracy ¼ TNCC
T NS Â 100, where TNCC stands for the total
number of correctly classified samples while T NS denotesthe total number of samples. Alternatively one can use theerror rate which is defined by Errð%Þ ¼ 1 À accuracy.
If the samples are unbalanced between the differentclasses, the prediction power or the accuracy of a classifieris less informative. To overcome this drawback, balancedaccuracy defined as the mean value of sensitivity andspecificity should be used instead [60].
6.2 Classifier Independent Evaluation of theSignature
It is well known that two different classifiers may reportdifferent results for the same input data. In order to removeas much as possible the classifier’s influence on theevaluation process one solution is to evaluate the signaturewith respect to several classifiers, but this strategy demandsextra computational effort. One way to avoid this incon-venience is to use classifier independent measures. Thesemeasures take into account only the intrinsic content of theselected subset of features and the target feature.
Group correlation coefficient is a classifier independenttool used for the evaluation of FS methods [61]. It is actuallya tradeoff between the overall goodness of fit (computed as
the average correlation between the subset of features/genes and the class label) and its redundancy (defined asthe intracorrelation of the signature). The group correlationcoefficient is defined in Table 13.
6.3 Evaluating the Robustness of the Signature
A different evaluation strategy in the context of FS isrepresented by the robustness or stability tests. We stress onthe fact that stability tests are never used as a singleevaluation measure and they should always be combinedwith some predictive indices. Several studies conducted forDEGs discovery show that many FS methods are highlydependent on the training set of samples [62], [63] resulting
in lists of features which are unstable under variations inthe training population. In this context, evaluating therobustness of the list becomes mandatory in declaring it as being relevant with respect to a target feature.
According to [64], the variability of the list depends ontwo aspects: first is the use of different scoring functions toselect features/genes while the second one is due to the useof the same scoring function under slight variations in thedata set. Stability tests should be performed to check forvariability in the list originating from both sources.
As a common rule, stability tests compare two lists of afixed number of features/genes by quantifying the size of
the intersection between the two lists. A well-knownmethod is the percentage of overlapping genes (POG). Severalstudies make use of the POG index to evaluate thereproducibility of the results for FS methods [65], [66]. Itconsists in comparing the lists of the top k mostdiscriminating genes found by different methods andcomputing the percentage of genes found in all lists.Another example is Correspondence At the Top (CAT) [67]which is a visualization method that represents theproportion of overlap of the top p features/genes versus
p. One pitfall of these two methods is the fact that the list of features must be of equal size while in practice one might beinterested in comparing lists of different size. One methodable to cope with this drawback is the overlap scoredescribed in [68].
As previously mentioned, stability tests are used fortesting the variability of lists of features/genes both whileusing different scoring functions and while introducingperturbations in the data set. Stability tests under perturba-tions in the data set are generally performed via a subsam-pling-based strategy. A number of k subsamples of differentsize are drawn from the entire population of samples. FS isthen performed on each of the k subsamples and a measure of robustness (e.g., POG index) is computed. In [57], the overallstability is defined in general terms as the average over all
pair-wise comparisons between different signatures
Rtot ¼2Pk
i¼1
Pk j¼iþ1 Rðf i; f jÞ
kðk À 1Þ; ð5Þ
where f i is the outcome of the FS method applied tosubsample i and Rðf i; f jÞ is a similarity measure between f iand f j. For filter methods, this similarity measure could bethe Spearman rank correlation coefficient. For a moredetailed explanation on the stability tests for FS we invitethe reader to consult [64].
7 FINAL COMMENTS AND RECOMMENDATIONS
As we mentioned in the end of Section 3, most filtermethods presented in this survey are designed forsupervised classification problems. However, several meth-ods (those making use of scoring functions able to deal withcontinuous target annotations) can be used for regressionproblems as well, see Table 15.
From a practitioner point of view, the choice of a methodcould be a very difficult task without a solid experience inthe field. Here, we provide some basic guidelines whichhopefully will help the practitioner in choosing theappropriate method for his application. We focus on twotypes of recommendations: one concerning the choice of the
scoring function and one for the choice of the statisticalsignificance test (this is only valid for ranking methods). Inthe choice of the scoring function the following aspectsshould be considered: its complexity, the minimum number
LAZAR ET AL.: A SURVEY ON FILTER TECHNIQUES FOR FEATURE SELECTION IN GENE EXPRESSION MICROARRAY ANALYSIS 1115
7/29/2019 Feature Selection in Gene Expression
http://slidepdf.com/reader/full/feature-selection-in-gene-expression 11/14
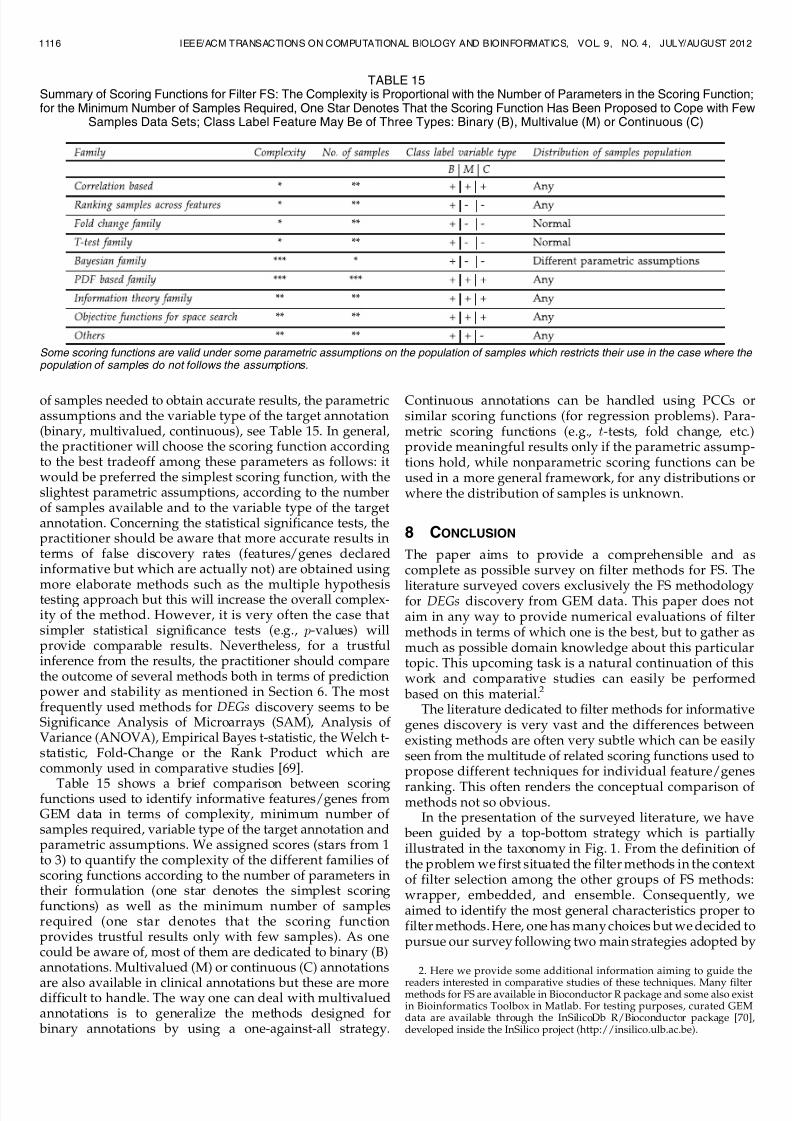
of samples needed to obtain accurate results, the parametricassumptions and the variable type of the target annotation(binary, multivalued, continuous), see Table 15. In general,the practitioner will choose the scoring function accordingto the best tradeoff among these parameters as follows: itwould be preferred the simplest scoring function, with theslightest parametric assumptions, according to the numberof samples available and to the variable type of the targetannotation. Concerning the statistical significance tests, thepractitioner should be aware that more accurate results interms of false discovery rates (features/genes declaredinformative but which are actually not) are obtained using
more elaborate methods such as the multiple hypothesistesting approach but this will increase the overall complex-ity of the method. However, it is very often the case thatsimpler statistical significance tests (e.g., p-values) willprovide comparable results. Nevertheless, for a trustfulinference from the results, the practitioner should comparethe outcome of several methods both in terms of predictionpower and stability as mentioned in Section 6. The mostfrequently used methods for DEGs discovery seems to beSignificance Analysis of Microarrays (SAM), Analysis of Variance (ANOVA), Empirical Bayes t-statistic, the Welch t-statistic, Fold-Change or the Rank Product which arecommonly used in comparative studies [69].
Table 15 shows a brief comparison between scoringfunctions used to identify informative features/genes fromGEM data in terms of complexity, minimum number of samples required, variable type of the target annotation andparametric assumptions. We assigned scores (stars from 1to 3) to quantify the complexity of the different families of scoring functions according to the number of parameters intheir formulation (one star denotes the simplest scoringfunctions) as well as the minimum number of samplesrequired (one star denotes that the scoring functionprovides trustful results only with few samples). As onecould be aware of, most of them are dedicated to binary (B)annotations. Multivalued (M) or continuous (C) annotations
are also available in clinical annotations but these are moredifficult to handle. The way one can deal with multivaluedannotations is to generalize the methods designed for binary annotations by using a one-against-all strategy.
Continuous annotations can be handled using PCCs orsimilar scoring functions (for regression problems). Para-metric scoring functions (e.g., t-tests, fold change, etc.)provide meaningful results only if the parametric assump-tions hold, while nonparametric scoring functions can beused in a more general framework, for any distributions orwhere the distribution of samples is unknown.
8 CONCLUSION
The paper aims to provide a comprehensible and ascomplete as possible survey on filter methods for FS. The
literature surveyed covers exclusively the FS methodologyfor DEGs discovery from GEM data. This paper does notaim in any way to provide numerical evaluations of filtermethods in terms of which one is the best, but to gather asmuch as possible domain knowledge about this particulartopic. This upcoming task is a natural continuation of thiswork and comparative studies can easily be performed based on this material.2
The literature dedicated to filter methods for informativegenes discovery is very vast and the differences betweenexisting methods are often very subtle which can be easilyseen from the multitude of related scoring functions used topropose different techniques for individual feature/genes
ranking. This often renders the conceptual comparison of methods not so obvious.
In the presentation of the surveyed literature, we have been guided by a top-bottom strategy which is partiallyillustrated in the taxonomy in Fig. 1. From the definition of the problem we first situated the filter methods in the contextof filter selection among the other groups of FS methods:wrapper, embedded, and ensemble. Consequently, weaimed to identify the most general characteristics proper tofilter methods. Here, one has many choices but we decided topursue our survey following two main strategies adopted by
1116 IEEE/ACM TRANSACTIONS ON COMPUTATIONAL BIOLOGY AND BIOINFORMATICS, VOL. 9, NO. 4, JULY/AUGUST 2012
TABLE 15Summary of Scoring Functions for Filter FS: The Complexity is Proportional with the Number of Parameters in the Scoring Function;for the Minimum Number of Samples Required, One Star Denotes That the Scoring Function Has Been Proposed to Cope with Few
Samples Data Sets; Class Label Feature May Be of Three Types: Binary (B), Multivalue (M) or Continuous (C)
Some scoring functions are valid under some parametric assumptions on the population of samples which restricts their use in the case where the population of samples do not follows the assumptions.
2. Here we provide some additional information aiming to guide the
readers interested in comparative studies of these techniques. Many filtermethods for FS are available in Bioconductor R package and some also existin Bioinformatics Toolbox in Matlab. For testing purposes, curated GEMdata are available through the InSilicoDb R/Bioconductor package [70],developed inside the InSilico project (http://insilico.ulb.ac.be).

7/29/2019 Feature Selection in Gene Expression
http://slidepdf.com/reader/full/feature-selection-in-gene-expression 12/14
researchers to develop filter methods for FS: ranking andspace search methods. Each one of these groups has beenfurther presented in a synthetic manner by reviewing its ownspecific aspects. For the ranking methods we reviewed andcategorized the scoring functions and we also presented themethods for estimating statistical significance while for thespace search methods we presented the most used optimiza-tion functions. We completed the top-bottom strategy byresuming the different filter methods for FS, mentioning foreach one of them the scoring function/statistical significancefor ranking methods, respectively, objective function forspace search methods.
In order to have a complete picture on the topic wementioned the most common validation techniques whichequally apply to all FS methods and in the end weformulated some guidelines aiming to help novel practi-tioners in choosing the appropriate method for theirapplications. We also provided a conceptual comparison between scoring functions for filters in Table 15.
ACKNOWLEDGMENTS
The authors would like to thank the Brussels Institute forResearch and Innovation (INNOVIRIS) who funded thisresearch and also the referees for their constructivecomments.
REFERENCES
[1] Y. Saeys, I. Inza, and P. Larranaga, “A Review of FeatureSelection Techniques in Bioinformatics,” Bioinformatics, vol. 23,no. 19, pp. 2507-2517, 2007.
[2] T.R. Golub et al., “Molecular Classification of Cancer: ClassDiscovery and Class Prediction by Gene Expression Monitoring,”Science, vol. 286, no. 5439, pp. 531-537, 1999.
[3] C.A. Penfold and D.L. Wild, “How to Infer Gene Networksfrom Expression Profiles, Revisited,” Interface Focus, vol. 1, no. 6,pp. 857-870, 2011.
[4] R.L. Somorjai, B. Dolenko, and R. Baumgartner, “Class Predic-tion and Discovery Using Gene Microarray and Proteomics MassSpectroscopy Data: Curses, Caveats, Cautions,” Bioinformatics,vol. 19, no. 12, pp. 1484-1491, 2003.
[5] P. Yang et al., “A Review of Ensemble Methods in Bioinfor-matics,” Current Bioinformatics, vol. 5, no. 4, pp. 296-308, 2010.
[6] I. Guyon, “An Introduction to Variable and Feature Selection,” J. Machine Learning Research, vol. 3, pp. 1157-1182, 2003.
[7] A.-C. Haury, P. Gestraud, and J.-P. Vert, “The Influence of FeatureSelection Methods on Accuracy, Stability and Interpretability of Molecular Signatures,” PLoS ONE, vol. 6, no. 12, p. e28210, 2011.
[8] M. Bansal et al., “How to Infer Gene Networks from ExpressionProfiles,” Moleculer Systems Biology, vol. 3, p. 78, 2007.[9] I. Guyon et al., “Gene Selection for Cancer Classification Using
Support Vector Machines,” Machine Learning, vol. 46, nos. 1-3,pp. 389-422, 2002.
[10] T. Zhang, “On the Consistency of Feature Selection Using GreedyLeast Squares Regression,” J. Machine Learning Research, vol. 10,pp. 555-568, 2009.
[11] S.-H. Cha, “Comprehensive Survey on Distance/Similarity Mea-sures Between Probability Density Functions,” Int’l J. Math. Modelsand Methods in Applied Sciences, vol. 1, no. 4, pp. 300-307, 2007.
[12] L. Deng et al., “A Rank Sum Test Method for Informative GeneDiscovery,” Proc. 10th ACM SIGKDD Int’l Conf. Knowldge Discoveryand Data Mining, pp. 410-419, 2004.
[13] R. Breitling et al., “Rank Products: A Simple, Yet Powerful, NewMethod to Detect Differentially Regulated Genes in Replicated
Microarray Experiments,” FEBS Letters, vol. 573, nos. 1-3, pp. 83-92, 2004.[14] D. Witten and R. Tibshirani, “A Comparison of Fold-Change and
the t-Statistic for Microarray Data Analysis,” technical report,Stanford Univ., 2007.
[15] H. Tao et al., “Functional Genomics: Expression Analysis of Escherichia Coli Growing on Minimal and Rich Media,”
J. Bacteriology, vol. 181, pp. 6425-6440, 1999.[16] M.K. Kerr, M. Martin, and G.A. Churchill, “Analysis of Variance
for Gene Expression Microarray Data,” J. Computational Biology,vol. 7, no. 6, pp. 819-837, 2000.
[17] J.G. Thomas et al., “An Efficient and Robust Statistical ModelingApproach to Discover Differentially Expressed Genes UsingGenomic Expression Profiles,” Genome Research, vol. 11, no. 7,pp. 1227-1236, 2001.
[18] S. Dudoit et al., “Statistical Methods for Identifying DifferentiallyExpressed Genes in Replicated cDNA Microarray Experiments,”Statistica Sinica, vol. 12, pp. 111-139, 2002.
[19] V.G. Tusher, R. Tibshirani, and G. Chu, “Significance Analysisof Microarrays Applied to the Ionizing Radiation Response,”Proc. Nat’l Academy of Sciences USA, vol. 98, no. 9, pp. 5116-5121, 2001.
[20] R. Tibshirani et al., “Diagnosis of Multiple Cancer Types byShrunken Centroids of Gene Expression,” Proc. Nat’l Academy of Sciences USA, vol. 99, no. 10, pp. 6567-6572, 2002.
[21] B. Efron et al., “Empirical Bayes Analysis of a MicroarrayExperiment,” J. Am. Statistical Assoc., vol. 96, no. 456, pp. 1151-1160, 2001.
[22] A.D. Long et al., “Improved Statistical Inference from DNAMicroarray Data Using Analysis of Variance and A Bayesian
Statistical Framework,” J. Biological Chemistry, vol. 276, no. 23,pp. 19937-19944, 2001.[23] P. Baldi and A.D. Long, “A Bayesian Framework for the Analysis
of Microarray Expression Data: Regularized t-Test and StatisticalInferences of Gene Changes,” Bioinformatics, vol. 17, no. 6, pp. 509-519, 2001.
[24] G.K. Smyth, “Linear Models and Empirical Bayes Methods forAssessing Differential Expression in Microarray Experiments,”Statistical Applications in Genetics and Moleculer Biology, vol. 3,no. 1, pp. 1-25, 2004.
[25] I. Lonnstedt and T. Speed, “Replicated Microarray Data,” StatisticaSinica, vol. 12, p. 31, 2001.
[26] E. Parzen, “On Estimation of a Probability Density Function andMode,” The Annals of Math. Statistics, vol. 33, no. 3, pp. 1065-1076,1962.
[27] A. Wilinski, S. Osowski, and K. Siwek, “Gene Selection for Cancer
Classification through Ensemble of Methods,” Proc. Ninth Int’lConf. Adaptive and Natural Computing Algorithms (ICANNGA ’09),pp. 507-516, 2009.
[28] X. Yan et al., “Detecting Differentially Expressed Genes byRelative Entropy,” J. Theoretical Biology, vol. 234, no. 3, pp. 395-402, 2005.
[29] J.-G. Zhang and H.-W. Deng, “Gene Selection for Classification of Microarray Data Based on the Bayes Error,” BMC Bioinformatics,vol. 8, no. 1, article 370, 2007.
[30] L.-Y. Chuang et al., “A Two-Stage Feature Selection Method forGene Expression Data,” OMICS: J. Integrative Biology, vol. 13,pp. 127-137, 2009.
[31] R. Steuer et al., “The Mutual Information: Detecting andEvaluating Dependencies Between Variables,” Bioinformatics,vol. 18, suppl. 2, pp. S23-S240, 2002.
[32] X. Liu, A. Krishnan, and A. Mondry, “An Entropy-Based GeneSelection Method for Cancer Classification Using MicroarrayData,” BMC Bioinformatics, vol. 6, article 76, 2005.
[33] B.M. Park PJ and M. Pagano, “A Nonparametric ScoringAlgorithm for Identifying Informative Genes from MicroarrayData,” Proc. Pacific Symp. Biocomputing, pp. 52-63, 2001.
[34] L.J. van ’t Veer et al., “Gene Expression Profiling Predicts ClinicalOutcome of Breast Cancer,” Nature, vol. 415, no. 6871, pp. 530-536,2002.
[35] S. Parodi, V. Pistoia, and M. Muselli, “Not Proper Roc Curves asNew Tool for the Analysis of Differentially Expressed Genes inMicroarray Experiments,” BMC Bioinformatics, vol. 9, no. 1,article 410, 2008.
[36] S. Dudoit, J. Fridlyand, and T.P. Speed, “Comparison of Discrimination Methods for the Classification of Tumors UsingGene Expression Data,” J. Am. Statistical Assoc., vol. 97, no. 457,
pp. 77-87, 2002.[37] A. Ben-Dor et al., “Tissue Classification with Gene ExpressionProfiles,” J. Computational Biology, vol. 7, pp. 559-583, 2000.
[38] J. Cohen, “The Earth is Round (p < .05),” Am. Psychologist, vol. 38,pp. 997-1003, 1994.
LAZAR ET AL.: A SURVEY ON FILTER TECHNIQUES FOR FEATURE SELECTION IN GENE EXPRESSION MICROARRAY ANALYSIS 1117
7/29/2019 Feature Selection in Gene Expression
http://slidepdf.com/reader/full/feature-selection-in-gene-expression 13/14
[39] W. Pan, J. Lin, and C.T. Le, “A Mixture Model Approach toDetecting Differentially Expressed Genes with Microarray Data,”Functional and Integrative Genomics, vol. 3, no. 3, pp. 117-124, 2003.
[40] B. Efron et al., “Microarrays and Their Use in a ComparativeExperiment,” technical report, Dept. of Statistics, Stanford Univ.,2000.
[41] S. Dudoit, J.P. Shaffer, and J.C. Boldrick, “Multiple HypothesisTesting in Microarray Experiments,” Statistical Science, vol. 18,no. 1, pp. 71-103, 2003.
[42] Y. Benjamini and Y. Hochberg, “Controlling the False DiscoveryRate: A Practical and Powerful Approach to Multiple Testing,”
J. Royal Statistical Soc. Series B (Methodological), vol. 57, no. 1,pp. 289-300, 1995.
[43] D. Storey, “The Positive False Discovery Rate: A BayesianInterpretation and the q-Value,” Annals of Statistics, vol. 31,pp. 2013-2035, 2003.
[44] J.D. Storey, “A Direct Approach to False Discovery Rates,” J. RoyalStatistics Soc.: Series B, vol. 64, no. 3, pp. 479-498, 2002.
[45] J. DeRisi, V. Iyer, and P. Brown, “Exploring the Metabolic andGenetic Control of Gene Expression on a Genomic Scale,” Science,vol. 278, no. 5338, pp. 680-686, 1997.
[46] S. Draghici et al., “Noise Sampling Method: An ANOVAApproach Allowing Robust Selection of Differentially RegulatedGenes Measured by DNA Microarrays,” Bioinformatics, vol. 19,no. 11, pp. 1348-1359, 2003.
[47] M.A. Newton et al., “On Differential Variability of ExpressionRatios: Improving Statistical Inference About Gene ExpressionChanges from Microarray Data,” J. Computational Biology, vol. 8,pp. 37-52, 2001.
[48] R. Breitling et al., “Rank Products: A Simple, Yet Powerful, NewMethod to Detect Differentially Regulated Genes in ReplicatedMicroarray Experiments,” FEBS Letters, vol. 573, nos. 1-3, pp. 83-92, 2004.
[49] S. Dudoit, J. Fridlyand, and T. Speed, “Comparison of Discrimination Methods for the Classification of Tumors UsingGene Expression Data,” J. Am. Statistical Assoc., vol. 97, no. 457,pp. 77-87, 2002.
[50] W. Pan, “On the Use of Permutation in and the Performance of aClass of Nonparametric Methods to Detect Differential GeneExpression,” Bioinformatics, vol. 19, no. 11, pp. 1333-13340, 2003.
[51] T. Bø and I. Jonassen, “New Feature Subset Selection Proceduresfor Classification of Expression Profiles,” Genome Biology, vol. 4,no. 4, pp. research0017.1-research0017.11, 2002.
[52] D. Geman et al., “Classifying Gene Expression Profiles fromPairwise mrna Comparisons,” Statistical Applications in Geneticsand Moleculer Biology, vol. 3, pp. 1-19, 2004.
[53] K. Yeung and R. Bumgarner, “Multiclass Classification of Microarray Data with Repeated Measurements: Application toCancer,” Genome Biology, vol. 4, no. 12, p. R83, 2003.
[54] C. Ding and H. Peng, “Minimum Redundancy Feature Selectionfrom Microarray Gene Expression Data,” J. Bioinformatics andComputational Biology, pp. 185-205, 2005.
[55] Y. Wang et al., “Gene Selection from Microarray Data for CancerClassification—A Machine Learning Approach,” ComputationalBiology and Chemistry, vol. 29, no. 1, pp. 37-46, 2005.
[56] E.P. Xing, M.I. Jordan, and R.M. Karp, “Feature Selection for
High-Dimensional Genomic Microarray Data,” Proc. 18th Int’lConf. Machine Learning (ICML ’01), pp. 601-608, 2001.
[57] Y. Saeys, T. Abeel, and Y. Peer, “Robust Feature Selection UsingEnsemble Feature Selection Techniques,” Proc. European Conf.
Machine Learning and Knowledge Discovery in Databases, pp. 313-325,2008.
[58] T. Fawcett, “Roc Graphs: Notes and Practical Considerations forResearchers,” technical report, 2004.
[59] J. Davis and M. Goadrich, “The Relationship Between Precision-Recall and ROC Curves,” Proc. 23rd Int’l Conf. Machine Learning,pp. 233-240, 2006.
[60] R. Powers, M. Goldszmidt, and I. Cohen, “Short Term Perfor-mance Forecasting in Enterprise Systems,” Proc. 11th ACMSIGKDD Int’l Conf. Knowledge Discovery in Data Mining (KDD’05), pp. 801-807, 2005.
[61] A. Ben-Dor and Z. Yakhini, “Clustering Gene ExpressionPatterns,” Proc. Third Ann. Int’l Conf. Computational MoleculerBiology (RECOMB ’99), pp. 33-42, 1999.
[62] L. Ein-Dor et al., “Outcome Signature Genes in Breast Cancer: IsThere a UniqueSet?” Bioinformatics, vol. 21, no. 2, pp. 171-178, 2005.
[63] S. Michiels, S. Koscielny, and C. Hill, “Prediction of CancerOutcome with Microarrays: A Multiple Random ValidationStrategy,” Lancet, vol. 365, no. 9458, pp. 488-492, 2005.
[64] A.-L. Boulesteix and M. Slawski, “Stability and Aggregation of Ranked Gene Lists,” Briefings in Bioinformatics, vol. 10, no. 5,pp. 556-568, 2009.
[65] K. Kadota, Y. Nakai, and K. Shimizu, “Ranking DifferentiallyExpressed Genes from Affymetrix Gene Expression Data: Meth-ods with Reproducibility, Sensitivity, and Specificity,” Algorithms
for Moleculer Biology, vol. 4, p. 7, 2009.
[66] M. Zhang et al., “Evaluating Reproducibility of DifferentialExpression Discoveries in Microarray Studies by ConsideringCorrelated Molecular Changes,” Bioinformatics, vol. 25, no. 13,pp. 1662-1668, 2009.
[67] R.A. Irizarry et al., “Multiple-Laboratory Comparison of Micro-array Platforms,” Nature Methods, vol. 2, no. 5, pp. 345-350, 2005.
[68] X. Yang et al., “Similarities of Ordered Gene Lists,” J. Bioinfor-matics and Computational Biology, vol. 4, no. 3, pp. 693-708, 2006.
[69] I. Jeffery, D. Higgins, and A. Culhane, “Comparison andEvaluation of Methods for Generating Differentially ExpressedGene Lists from Microarray Data,” BMC Bioinformatics, vol. 7,no. 1, article 359, 2006.
[70] J. Taminau et al., “inSilicoDb: An R/Bioconductor Package forAccessing Human Affymetrix Expert-Curated Data sets fromGEO,” Bioinformatics, vol. 27, pp. 3204-3205, 2011.
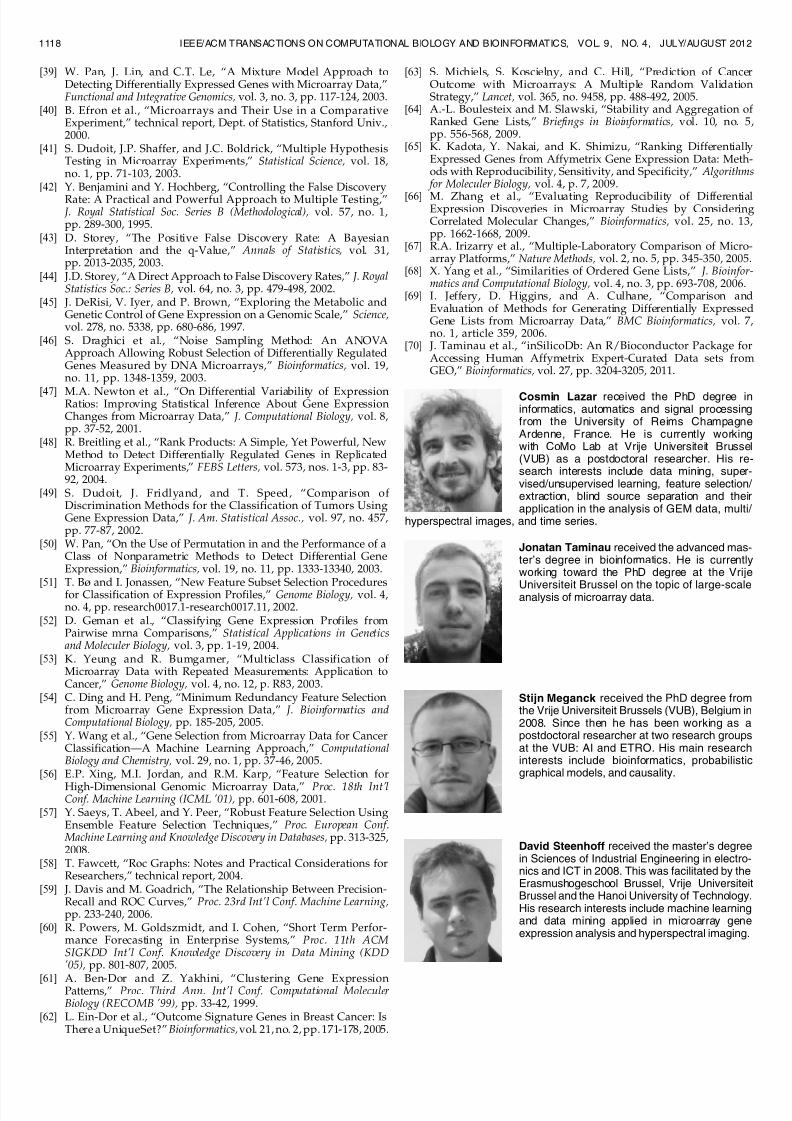
Cosmin Lazar received the PhD degree ininformatics, automatics and signal processingfrom the University of Reims ChampagneArdenne, France. He is currently workingwith CoMo Lab at Vrije Universiteit Brussel(VUB) as a postdoctoral researcher. His re-search interests include data mining, super-vised/unsupervised learning, feature selection/ extraction, blind source separation and theirapplication in the analysis of GEM data, multi/
hyperspectral images, and time series.
Jonatan Taminau received the advanced mas-ter’s degree in bioinformatics. He is currentlyworking toward the PhD degree at the Vrije
Universiteit Brussel on the topic of large-scaleanalysis of microarray data.
Stijn Meganck received the PhD degree fromthe Vrije Universiteit Brussels (VUB), Belgium in2008. Since then he has been working as apostdoctoral researcher at two research groupsat the VUB: AI and ETRO. His main researchinterests include bioinformatics, probabilisticgraphical models, and causality.
David Steenhoff received the master’s degreein Sciences of Industrial Engineering in electro-nics and ICT in 2008. This was facilitated by theErasmushogeschool Brussel, Vrije UniversiteitBrussel and the Hanoi University of Technology.His research interests include machine learningand data mining applied in microarray geneexpression analysis and hyperspectral imaging.
1118 IEEE/ACM TRANSACTIONS ON COMPUTATIONAL BIOLOGY AND BIOINFORMATICS, VOL. 9, NO. 4, JULY/AUGUST 2012
7/29/2019 Feature Selection in Gene Expression
http://slidepdf.com/reader/full/feature-selection-in-gene-expression 14/14
Alain Coletta received the graduate degreefrom the Universite Libre de Bruxelles andreceived the PhD degree from ManchesterUniversity, Faculty of Engineering ad PhysicalSciences, Advanced Interfaces Group.
Colin Molter received the PhD degree inartificial intelligence from the Universite Librede Bruxelles (ULB), Belgium in 2005. Afterreceiving the PhD degree, he started thepostdoctoral in computational neuroscience atthe RIKEN-Brain Science Institute first and theEcole Polytechnique Federale de Lausannenext. Recently, he became interested in geneticsand started working on the inSilico project inBruxelles.
Virginie de Schaetzen completed the medical
studies from Universite Catholique de Louvain-laNeuve. She did the dermatology residency in theHospital St Louis in Paris, the CHU of Montpel-lier, and the CHU of Liege in Belgium. Shestarted working as a biocurator for the IRIDIAproject in June 2010.
Robin Duque received the graduate degree in2008 as master in sciences of industrial en-gineering in electromechanics followed by amaster in management in 2009, both from VrijeUniversiteit Brussel (VUB). Currently he isworking as programming engineer/developer atIRIDIA laboratory, Universit Libre de Bruxelles(ULB).
Hugues Bersini received the MS degree in1983 and the PhD degree in engineering in 1989both from Universite Libre de Bruxelles (ULB).He is now heading the IRIDIA laboratory (the AIlaboratory of ULB) with Marco Dorigo. Since1992, he has been an assistant professor at ULBand has now become full professor, teachingcomputer science, programming, and AI. Overthe last 20 years, he has published about250 papers on his research work which covers
the domains of cognitive sciences, AI for process control, connection-ism, fuzzy control, lazy learning for modeling and control, reinforcementlearning, biological networks, the use of neural nets for medicalapplications, frustration in complex systems, chaos, computational
chemistry, object-oriented technologies, immune engineering, andepistemology.
Ann Nowe received the MS degree fromUniversiteit Gent, Belgium, in 1987, where shestudied mathematics with a minor in computerscience, and the PhD degree from Vrije Uni-versiteit Brussels (VUB), Belgium, in collabora-tion with Queen Mary and Westfield College,University of London, United Kingdom, in 1994.Currently, she is a full professor at the VUB andcohead of the Computational Modeling Lab. Herresearch interests include machine learning,
including multiagent reinforcement learning, and bioinformatics.
. For more information on this or any other computing topic,please visit our Digital Library at www.computer.org/publications/dlib.
LAZAR ET AL.: A SURVEY ON FILTER TECHNIQUES FOR FEATURE SELECTION IN GENE EXPRESSION MICROARRAY ANALYSIS 1119